hplc
DESCRIPTION
PharmacyTRANSCRIPT

HPLC seminar
1. IntroductionHigh Performance Liquid Chromatography (HPLC) is one mode of chromatography, the most widely used analytical technique. Chromatographic processes can be defined as separation techniques involving mass-transfer between stationary and mobile phases.
HPLC utilizes a liquid mobile phase to separate the components of a mixture. These components (or analytes) are first dissolved in a solvent, and then forced to flow through a chromatographic column under high pressure. In the column, the mixture is resolved into itscomponents. The amount of resolution is important, and is dependent upon the extent of interaction between the solute components and the stationary phase. The stationary phase is defined as the immobile packing material in the column. The interaction of the solute withmobile and stationary phases can be manipulated through different choices of both solvents and stationary phases. As a result, HPLC acquires a high degree of versatility not found in other chromatographic systems and has the ability to easily separate a wide variety of
chemical mixtures.

History of HPLCPrior to the 1970's, few reliable chromatographic methods were commercially available to the laboratory scientist. During the 1970's, most chemical separations were carried out using a variety of techniques including open-column chromatography, paper chromatography, and thin-layer chromatography. However, these chromatographic techniques were inadequate for quantification of compounds and did not achive sufficiently high resolution to distinguish between similar compounds. During this time, pressure liquid chromatography began to be used to decrease flowthrough time, thus reducing purification times of compounds being isolated by column chromatogaphy. However, flow rates were inconsistent, and the question of whether it was better to have constant flow rate or constant pressure was debated. (AnalyticalChem. vol 62, no. 19, Oct 1, 1990).
High pressure liquid chromatography was developed in the mid-1970's and quickly improved with the development of column packing materials and the additional convenience of on-line detectors. In the late 1970's, new methods including reverse phase liquid chromatography allowed for improved separation between very similar compounds.
By the 1980's HPLC was commonly used for the separation of chemical compounds. New techniques improved separation, identification, purification and quantification far above those obtained using previous techniques. Computers and automation added to the convenience of HPLC. Additional column types giving better reproducibility were introduced and such terms as micro-column, affinity columns, and Fast HPLC began to immerge.
The past decade has seen a vast undertaking in the development of micro-columns, and other specialized columns. The dimensions of the typical HPLC column are: XXX mm in length with an internal diameter between 3-5 mm. The usual diameter of micro-columns, or capillary columns, ranges from 3 µm to 200 µm. Fast HPLC utilizes a column that is shorter than the typical column. A Fast HPLC column is about 3 mm long and is packed with smaller particles.
Currently, one has the option of selecting from a lot of columns for the separation of compounds, as well as a variety of detectors to interface with the HPLC in order to obtain optimal analysis of the compound.
Although HPLC is widely considered to be a technique mainly for biotechnological, biomedical, and biochemical research as well as for the pharmaceutical industry,in actual fact these fields currently comprise only about 50% of HPLC users(Analytical Chem. vol 62, no.19, Oct 1, 1990). Currently HPLC is used in a variety of fields and industries including the cosmetics, energy, food, and environmental industries.

1. Introduction
H : HighP : Performance (Pressure)L : LiquidC : Chromatography
GC : Gas chromatographyTLC : Thin layer chromatographyIC : Ion chromatography
What is HPLC ?

What is HPLC used for ?1. Introduction
1. Separation of mixed components2. Qualitative analysis / Quantitative analysis3. Preparation of interest components
Separation analysis and/or preparationof interest components

B
A
CA
A
B
C
C
C SeparationC C C C
B B
A A A
Qualitative analysis What are components A, B and C ?
Quantitative analysis What is the concentration ofcomponents A, B and C ?
1. Introduction
Separation and Analysis

AB
C
Results obtained by HPLC
Chromatogram containing three peaksQualitative analysis (identification) andQuantitative analysis (determination)Can be performed using the information contained in the chromatogram
Chromatography : MethodChromatogram : ResultsChromatograph : Instrument
1. Introduction

AB
DEF
Mobile phase IN
Sample IN
columnbaseline
C
AB C D E
Chromatogram
Mobile phase IN
Chromatogram1. Introduction
Sample IN

AB
C
Identification
Component A elutes the same time as a caffeine peak.
Component A is identified as caffeine.
What is component A?
Caffeine
Sample
1. Introduction

Determination
Peak area (or height) is proportional to the concentration (or amount) of the component.
The concentration of component A(caffeine) is determined bycomparing the peak area with that of the standard caffeine peak.
What is the concentration of component A?
AB
C
Caffeine (1mg/ml)5ul injection (5ug)
1. Introduction

Separation MechanismSeparation is determined by column (packing material) and mobile phase (solvent).
A
B
C
time
Mobile phase elutes components.Packing materials retain components in the column.
CBA
Column
Packing material
↓ ↓ ↓ ↓
Mobile phase (solvent)
C > B > A
1. Introduction

Five modes in HPLC
LC mode Packing materials Mobile phase Interaction
Normal phase chromatography Silica gel n-Hexane/IPE Adsorption
Reversed phase chromatography Silica-C18(ODS) MeOH/Water Hydrophobic
Size exclusion chromatography Porous polymer THF Gel permeation
Ion exchange chromatography Ion exchange gel Buffer sol. Ion exchange
Affinity chromatography Packings with ligand Buffer sol. Affinity
1. Introduction

HPLC Basic Instrumentation
Mobile phase
Pump
Solvent DeliveryInjector
Sample Injection
Column
Separation
Detector
Data Processor
1. Introduction

HPLC Instrumentation1. Introduction
Pump
GradientElutionUnit
Injector
Autosampler
Columnoven
Column
Reagentpump
Detector
Dataprocessor
Fractioncollector
Drain
System Controller

The JASCO advanced technology team has again met the challenge and designed a new line of HPLC instruments, The LC-1500series more than satisfies in response to the growing demand for greatly expanded HPLC analyses in the fields of not only biochemistry, pharmaceutical and medical science, but also in the areas of among other organic and inorganic compounds, foods, agricultural sciences, polymeric and natural substances and pollution. The LC-1500 series comprises pumps, detectors,autosamplers, its own column oven and other units each having built-in intelligence and incorporating many features with much higher levels of operability and reliability in addition to multiple functions, higher performance and higher accuracy than before, making them the most advanced instruments available.
2. Parameters used in HPLC

2. Parameters used in HPLC
Parameters used in HPLC
Retention parametersColumn efficiency parametersPeak symmetry parametersCondition for Separation
Retention : When a component in a sample interacts with the stationary phase in the column and a delay in elution occurs.Column efficiency : Goodness of a column

2. Parameters used in HPLC
Retention parameters
tR : retention time (the time between the injection point and the maximum detector response for correspondent compound)
vR : retention volume (tR x eluent flow rate)
k’ : capacity factort0 : the time required for the component not retained by the column to pass through the column
tR
tR - t0
t0 k’ = tR - t0
t0

2. Parameters used in HPLC
The number of theoretical plates N is given by:
Column efficiency
4 method FWHM method
tR
5 method
W1/2W4 W5
h
h x 0.044
h x 0.5
N = 16 ( tR / W4 )2 N = 25 ( tR / W5 )2 N = 5.545 ( tR / W0.5)2
H = L / N L : Column lengthThe height of the theoretical plate H is given by:

2. Parameters used in HPLC
S : Symmetry factor ( T : Tailing factor )
Peak symmetry
fW0.05
h x 0.05 h
S = 1 : The peak is completely symmetric.S > 1 : TailingS < 1 : Leading
S = 2f
W0.05

2. Parameters used in HPLC
Degree of separation
tR1
tR2
k’1
k’2
W1 W2
Resolution :
Separation factor :
Rs = 2 x W1 + W2
tR2 - tR1
k’2=
k’1

2. Parameters used in HPLC
Condition for good separation
41 - 1
1 + k’2
k’2Rs = N
A larger Rs value means a better separation.
1 + k’2
k’2: Capacity term
increases the retention time
- 1: Selectivity term
increases the time interval between peaks
N : Column efficiency termproduce narrow peaks

2. Parameters used in HPLC
Parameters and selectivity
Longer retention time
Larger
Improved column efficiency

Review of Sections 1 and 2
What is Separation and Analysis ?
Qualitative and Quantitative analysis from chromatogram
HPLC Parameters
What is HPLC ?What is HPLC used for ?

Review of Sections 1 and 2
What is Separation and Analysis ?
Qualitative and Quantitative analysis from chromatogram
HPLC Parameters
What is HPLC ?What is HPLC used for ?
H : HighP : Performance (Pressure)L : LiquidC : Chromatography

Review of Sections 1 and 2
What is Separation and Analysis ?
Qualitative and Quantitative analysis from chromatogram
HPLC Parameters
What is HPLC ?What is HPLC used for ?
1. Separation of mixed components2. Qualitative analysis / Quantitative analysis3. Preparation of interest components

Review of Sections 1 and 2
Qualitative and Quantitative analysis from chromatogram
HPLC Parameters
What is HPLC ?What is HPLC used for ?
Qualitative analysis What are components A, B and C ?
Quantitative analysis What is the concentration ofcomponents A, B and C ?
What is Separation and Analysis ?

Review of Section 1 and 2
What is Separation and Analysis ?
HPLC Parameters
What is HPLC ?What is HPLC used for ?
Qualitative and Quantitative analysis from chromatogram
Qualitative analysis (identification) andquantitative analysis (determination)can be performed using the information Contained in the chromatogram.

Review of Sections 1 and 2
What is Separation and Analysis ?
Qualitative and Quantitative analysis from chromatogram
What is HPLC ?What is HPLC used for ?
HPLC Parameters
Retention parametersColumn efficiency parametersPeak symmetry parametersCondition for Separation

3. Separation modeColumn and mobile phase solvent

3. Separation mode
Sample and Analytical method
In which materials ?In what concentration ?Which sample ?With which technique ?
What is the sample ?Concentration of the interested componentContaminant
Characteristics of the sample- Structure- Molecular weight- pKa- Solubility
Analytical technique- Column- Mobile phase- Detector- Sample preparation

3. Separation mode
Sample information
Merck IndexGreat Chemical DictionaryGreat BioChemical DictionaryReports based on other measurement techniques

3. Separation mode
Method information
Society magazinesJournal of Chromatography.Analytical Chemist
ManufacturerJASCO Application data

3. Separation mode
HPLC separation mode
HPLC separation mode
Normal phase chromatography (NP)Reversed phase chromatography (RP)Size exclusion chromatography (SEC)Ion exchange chromatography (IEX)Affinity chromatography

3. Separation mode
Separation modes and features
Mode Stationary phase Mobile phase Interaction Feature
Normal phase Silica gel Organic solvent Adsorption Fat-solublechromatography (n-Hexane/IPE)
Reversed phase Silica-ODS MeOH/Water Hydrophobic Most widely usedchromatography (Silica-C18)
Size exclusion ChromatographyNon-aqueous (GPC) Porous Polymer Organic solvent (THF) Gel permeation Molecular weight distributionAqueous (GFC) Aqueous porous Polymer Buffer solution Gel permeation Protein Separation
Ion exchange Ion exchange gel Buffer solution Ion exchange Separation ofChromatography ionic substances
Affinity Packing with ligand Buffer solution Affinity Purification of Chromatography enzymes and proteins
GPC : Gel Permeation ChromatographyGFC : Gel Filtration Chromatography

200 250 300 350
3. Separation mode
Solvent used in HPLC and range of Application
Isoctane 0.1 0.01 1.389 99 0.47 197LCn-Hexane 0.1 0.01 1.372 69 0.30 190Cyclohexane -0.2 0.04 1.423 81 0.90 200Triethylamine 1.9 0.54 1.398 89 0.36i-Proryl ether 2.4 0.28 1.365 68 0.38 220*
Toluene 2.4 0.29 1.494 110 0.55 285Ethyl ether 2.8 0.38 1.350 35 0.24 218Benzene 2.7 0.32 1.498 80 0.60 280Methylene chloride 3.1 0.42 1.421 40 0.41 233n-Butanol 3.9 0.7 1.397 118 2.6 210n-Propanol 4.0 0.82 1.385 97 1.9 240Tetrahydrofuran 4.0 0.57 1.405 66 0.46 212*
Ethyl acetate 4.4 0.58 1.370 77 0.43 256i-Propanol 3.9 0.82 1.384 82 1.9 205Chloroform 4.1 0.40 1.443 61 0.53 245Methylethyl ketone 4.7 0.51 1.376 80 0.38 329Dioxane 4.8 0.56 1.420 101 1.2 215Acetone 5.1 0.56 1.356 56 0.30 330Ethanol 4.3 0.88 1.359 78 1.08 210Acetic acid 6.0 1.370 118 1.1Acetonitrile 5.8 0.65 1.341 82 0.34 190Dimethylformamide 6.4 1.428 153 0.80 268Dinethylsulfoxide 7.2 0.75 1.477 189 2.00 268Methanol 5.1 0.95 1.326 65 0.54 205Water 10.2 1.333 100 0.89
Solvent Polarity E0 R.I. b.p. Viscosity UV cut off UV transmittance

H C H
H
H
H H
O
3. Separation mode
Bonding electrons are not shared evenly.The end of the bond with electrons becomes partially negative.The end of the bondwithout electrons becomes partially positive.
Polar compoundsPolar compound
Polar compounds are soluble in polar solvents.Non-polar compounds are soluble in non-polar solvents.
Non-polar compound

3. Separation mode
Normal Phase Chromatography
Interaction : Adsorption
Packing materials : Polar ex. Silica gelSilica-NH2Silica-CNSilica-OH
Mobile phase : Non-polar ex. n-Hex/CH2CL2iso-Oct/IPAiso-Oct/AcOEt
Sample : Fat-solubleDifferent polarity

3. Separation mode
Normal Phase ChromatographyPacking materialThe most popular packing material is silica gel.It is believed that silanol radicals ( -Si-OH ) on the surface of silica gel act as the active site and the sample is separated.
SiSi
Si
OH
OH
OH
OHOH
OHthe surface of silica gel

3. Separation mode
Normal Phase Chromatography
InteractionH2N
O2N
H2N NO2
H2N
O2N
OH
OH
OH
OH
OH
OH
OH

3. Separation mode
Normal Phase ChromatographyMobile phase solvents
n-Hexane (n-Hex)
iso-Octane (iso-Oct)Chloroform (CHCl3)Dichloromethane (CH2Cl2)Ethylacetate (AcOEt)Isopropylalchol (IPA)
Tetrahydrofran (THF)
DioxaneAcetonitrile (CH3CN)
Ethanol (EtOH)
Methanol (MeOH)
AminesAcids
Polarity
High
Low

3. Separation mode
Normal Phase ChromatographyRetention behavior
n-Hex/AcOEt(60/40)
n-Hex/AcOEt(50/50)
n-Hex/AcOEt(30/70)
A B C
A
A
B
B
C
C
D
D
Polarity of Mobile phase
High
Low
< < <A B C D
Polarity of sample components

3. Separation mode
Reversed Phase Chromatography
Interaction : Hydrophobic
Packing materials : Non-polar ex. Silica-C18Silica-C8Polymer
Mobile phase : Polar ex. MeOH/H2OCH3CN/H2OMeOH/Buffer sol.
Sample : Having different length of carbon chain

3. Separation mode
Reversed Phase Chromatography
Si
Si
O-Si-CH2(CH2)16CH3
CH3
CH3
O-Si-CH2(CH2)16CH3
CH3
CH3
O-Si-CH2(CH2)16CH3
CH3
CH3
CH3
CH3
O-Si-CH3
SilicaSilica--C18 Packing materialsC18 Packing materialsCommonly used packing materials are hydrocarbons having 18 carbon atoms (called the Octadecyl radical) which are chemically bonded to silica gel (Silica-ODS).Since the surface of the Silica-ODS is covered with hydrocarbon, the polarity of the packing material itself is very low.

3. Separation mode
Reversed Phase ChromatographyHydrophobic InteractionHydrophobic Interaction
CH3 CH2COOCH3
CH3 CH2COOCH3
Silica-C18 (ODS)

3. Separation mode
Reversed Phase Chromatography
Mobile phase solventsMobile phase solvents
Main solvent : MeOH - H2OCH3CN - H2O
Sub solvent : EtOHIPATHFDMF
Additive : AcidSaltIon-pairing agent
Reversed Phase Chromatography

Reversed Phase Chromatography
Retention behavior in reversed phase HPLCRetention behavior in reversed phase HPLC
< < A B C
A
B
C
0 0 05 5 5 10 (min)
AAB
B
C
C
CH3CN/H2O(70/30) (60/40) (50/50)
: p-Hydroxy ethyl benzoateABC
: p-Hydroxy propyl benzoate
: p-Hydroxy butyl benzoate HighLow Polarity of Mobile phase
Carbon chain length of sample
Column : Finepak SIL C18
3.Separation mode

0 5 10 15 20 25 30 (min)
Reversed Phase Chromatography3.Separation mode
Length of packing materials carbon chainsLength of packing materials carbon chainsand retention timeand retention time
Finepak SIL C18
Finepak SIL C8
Finepak SIL C1: p-Hydroxy ethyl benzoateA
BC
: p-Hydroxy propyl benzoate
: p-Hydroxy butyl benzoate
Mobile phase:CH3CN/H2O(40/60)
A
B
C
A
BC
A
B
C

Reversed Phase and Normal Phase Chromatography3.Separation mode
Normal phase Reversed phase
Stationary phase High polarity Low polarity
Mobile phase Low polarity High polarity
Interaction Adsorption Hydrophobic
Elution order Low to High Short to Long(Polarity) (Length of Carbon chain)
Comparison of Reversed Phase and Normal PhaseComparison of Reversed Phase and Normal Phase

Reversed Phase and Normal Phase Chromatography3.Separation mode
Comparison of Comparison of Reversed Phase and Normal PhaseReversed Phase and Normal Phase
0 10 20 (min)0 10 (min)
Reversed Phase Chromatography
Finepak SIL C18
MeOH
Reversed Phase Chromatography
Finepak SIL C18
MeOH
Normal Phase Chromatography
Finepak SIL
n-Hexane/IPA(96/4)
Normal Phase Chromatography
Finepak SIL
n-Hexane/IPA(96/4)
VAVE
VD
VD
VA

Ion-exchange Chromatography3.Separation mode
IonIon--exchange Chromatographyexchange Chromatography
Interaction : Ion-exchange
Stationary phase: Anion exchange gelCation exchange gel
Mobile phase : Buffer solution
Sample : Ionic substances (Cations or Anions)

Ion-exchange Chromatography3.Separation mode
IonIon--exchange Gelexchange Gel
SO3-
Na+
Cation exchange gel
NR3+
Cl-
Anion exchange gel
SO3-
Na+
SO3-
Na+
SO3-
Na+
NR3+
Cl-
NR3+
Cl-
NR3+
Cl-

Ion-exchange Chromatography3.Separation mode
Mobile phase solvents used for IonMobile phase solvents used for Ion--exchange exchange
SO3 -
Na+
SO3 -
S +
S +
Na +
SO3 -
Na +
Buffer solutionSalt concentrationpH (Hydrogen ion concentration)Type of saltAdditive (Organic solvent)

Ion-exchange Chromatography3.Separation mode
Application data of IonApplication data of Ion--exchange chromatographyexchange chromatography
10.0 20.0 30.00 40.00 [m in]
0. 0E+00
2. 0E+04
4. 0E+04
6. 0E+04
8. 0E+04
1. 0E+05
1. 2E+05 uV POLY_003.CH1 5.
89
2 9.
49
3 13
.58
4 17
.79
5 21
.65
6 24
.65
7 26
.95
8 28
.83
9 30
.40
10 3
1.71
11 3
2.86
12 3
3.84
13 3
4.72
14 3
5.50
15 3
6.21
16 3
6.85
17 3
7.43
18 3
7.95
19 3
8.38
20 3
8.72
Separation of polyphosphoric acidColumn : Finepak GEL SA-121
(6.0mmI.D. x 100mmL)Mobile phase : A= 0.1M KCl + 1% EDTA-4Na
(pH 10.0 adjusted HCl)B= 1.0M KCl + 1% EDTA-4Na (pH 10.0 adjusted HCl) gradient
Reactor : 1.8MH2 SO4(1L), (NH4o7)6MO24-4H2O (5g),Sand of zinc metal(0.6g)
Detection : 830nm

Ion Chromatography3.Separation mode
Summary of Ion ChromatographySummary of Ion Chromatography
Purpose : Separation of inorganic ions, organic acids
Stationary phase: Anion exchange gelCation exchange gel
Mobile phase : Buffer solution
Detection : Conductivity detector

Ion Chromatography3.Separation mode
P
D
P
D
Suppressor and NonSuppressor and Non--suppressorsuppressor
Mobile phase Mobile phase
pump pump
injector injector
column column
suppressor
Conductivity detector
Conductivity detector

Ion Chromatography3.Separation mode
CationCation measurement datameasurement data
Na+
5.27
6ppm
K+
0.78
5ppm
Ca2
+12
.386
ppm
Mg2
+1.
829p
pm
0 5 10 15 20(min)
Sample : Tap waterColumn : Shodex IC YK-421Mobile phase : 5mM tartaric acid+2mM Gibicolin acidDetector : Conductivity detector (CD-5)

Ion Chromatography3.Separation mode
Anion measurement dataAnion measurement data
F-0.
111p
pm
SO42-
10.4
26pp
mCl-
6.02
9ppm
NO
3-6.
694p
pm
0 5 10 15 25(min)20
Sample : Tap waterColumn : Shodex IC I-524AMobile phase : 2mM phthalic acid+1.84mM tris
+300mM boric acid(pH4.0)Detector : Conductivity detector (CD-5)

Size Exclusion Chromatography (SEC)3.Separation mode
GPC and GFCGPC and GFC
Non-aqueous SEC : GPC (Gel Permeation Chromatography)Interaction : Gel permeationPacking : Cross-Linked porous PolystyreneMobile phase : Organic solvent (THF, CHCl3, DMF)Sample : Molecular weight distribution of polymer
Synthetic Oligomer separation
Aqueous SEC : GFC (Gel Filtration Chromatography)Interaction : Gel permeationPacking : Hydrophilic silica gel / Hydrophilic porous polymerMobile phase : Buffer solutionSample : Separation of Water-soluble polymers
(proteins, nucleic acid, sugar)oligomers

Size Exclusion Chromatography (SEC)3.Separation mode
SEC Separation mechanismSEC Separation mechanism
DD
D
C
C
C
B
B
A
A
A+B C D
Packing material
Small poreMobile phase

Size Exclusion Chromatography (SEC)3.Separation mode
Gel permeation chromatography and calibration curveGel permeation chromatography and calibration curve
5. 00 10. 00 15. 00 20. 00 25. 00 30. 00 35. 00[mi n]
0. 0E+00
2. 0E+04
4. 0E+04
6. 0E+04
8. 0E+04
1. 0E+05 uV RI
PS
-842
0KP
S-9
00K
PS
-110
K
PS
-18.
1KP
S-2
.98K
PS
-Olig
omer
Column : Shodex GPC KF-806Lx 2 ColumnMobile phase : THF

Size Exclusion Chromatography (SEC)3.Separation mode
Peak analysis of polymer Peak analysis of polymer to calculate molecular weight distributionto calculate molecular weight distribution
10.0 15.0 20.0 25.0 (min)Retention time
H1H2
H3
V1
V2 V3
no Vi Hi1 10.0 742 10.5 1563 11.0 318

Size Exclusion Chromatography (SEC)3.Separation mode
Molecular weight calculationMolecular weight calculation
N Vi Hi Mi Hi/Mi HiMi HiMi2
1 11.12 74 2094050 - - -
2 11.37 387 1734413 - - -
3 11.62 1539 1432619 - - -
- - - - - - -
- - - - - - -
- - - - - - -
hi mi Hi/Mi HiMi HiMi2
Mn = Hi/ Hi/Mi = 15.5×10⁴
Mw = HiMi/ Hi = 28.6×10⁴
Mz = HiMi2/ HiMi = 46.5×10⁴
D = Mw/Mn = 1.84

Size Exclusion Chromatography (SEC)3.Separation mode
Column selectionColumn selectionMolecular weight of the sample : Exclusion limit molecular weight
Ability to dissolve the sample : Applicable to packing materials
Molecular weight distribution : Range of calibration curve

Size Exclusion Chromatography (SEC)3.Separation mode
Column suited to the sample in terms of molecular weightColumn suited to the sample in terms of molecular weight
EPIKOTE1001
EPIKOTE828
15 20 25 min30 40 min
1 1
2 2
221
1
n=0 n=03-83
45
67
8
Shodex A-801×2 Shodex A-803×2
Eluent : THF Flow rate : 1.0ml/min

Size Exclusion Chromatography (SEC)3.Separation mode
Solvent and columnSolvent and column
Solvent Column
THF Finepak GEL 101FShodex KF series
CHCl3 Finepak GEL 101CShodex K series
DMF Shodex KD series
H2O, Buffer solution Shodex SB seriesShodex KS series

Size Exclusion Chromatography (SEC)3.Separation mode
Calibration curves for columnsCalibration curves for columns
Eluent : THF

Columns for exclusive use3.Separation mode
Columns for Exclusive useColumns for Exclusive use
Amino acids : Aapak (Cation exchange)
Organic acid : Shodex Ionpak KC-811(ion exclusion and partition & adsorption)
Sugar : Shodex Ionpak KS series (aqueous SEC)Shodex Sugar series (ligand exchange)Finepak SIL NH2-5 (Normal phase)Finepak GEL SA-121 (Strong anion exchange)
N-methyl carbamate : Carbamatepak (Reversed phase)

3.Separation modeColumns for exclusive use
Amino Acid AnalysisAmino Acid AnalysisA
spTh
r
Pro
Glu
Ser
Gly
Ala
Val
IleLe
uTy
r
Phe Ly
s His
NH
3
Arg
Met
Column : AApak Na II-HMobile phase : Sodium citrate buffer
Stepwise gradientDetection : OPA post label
Ex 345nm Em 445nmSample : Sake

3.Separation modeColumns for exclusive use
Organic Acid AnalysisOrganic Acid Analysis
citr
icpy
rvic
mal
ic
succ
inic la
ctic
acet
ic
pyro
glut
amic
Column : Shodex Ionpak KC811x2Mobile phase :Detection : BTB post label
UV 445nmSample : Sake

Ion suppression method & Ion-pair chromatography3.Separation mode
Ion suppression method & IonIon suppression method & Ion--pair chromatographypair chromatography
Separation method to analyze ionic compounds by reversed-phase chromatography
Ion suppression method : Acidic ion components
Ion pair chromatography : Basic ion components / Acidic ion components

Ion suppression method & Ion-pair chromatography3.Separation mode
Diagram of Ion suppression methodDiagram of Ion suppression method
: Sample
: Hydrogen ion
: Sample
A- + H+ HA
A-
H+
H+
H+
H+
H+
H+
H+H+
H+
HA
HA
HA
HA
A-H+
H+
H+
A-
A-
Silica-C18 Silica-C18
Add phosphoric acid

Ion suppression method & Ion-pair chromatography3.Separation mode
Chromatogram when Ion suppression method is usedChromatogram when Ion suppression method is used
Ben
zoic
aci
d
prop
yl
buty
l
0 5 10 (min) 0 5 10 (min)
p-H
ydro
xyet
hyl b
enzo
ate Finepak SIL C1
CH3CN/H2O(40/60)
Finepak SIL C1CH3CN/0.2% H3PO4
(40/60)

Ion suppression method & Ion-pair chromatography3.Separation mode
Diagram of IonDiagram of Ion--pair chromatographypair chromatography
+NR4
SO3- + NR4
SO3-
SO3-
SO3-
SO3-
SO3-
SO3-
SO3-
SO3- + NR4
SO3
- +NR4
+NR4
+NR4
+NR4
+NR4
Silica-C18
Silica-C18
Silica-C18Add Ion-pairreagent
SO3-
SO3-

Ion suppression method & Ion-pair chromatography3.Separation mode
Chromatogram when IonChromatogram when Ion--pair chromatography is usedpair chromatography is used
AA
B B
Without Ion-pair reagent With Ion-pair reagent
Typical ion reagentsAcidic ions : Tetra alkyl ammonium halideBasic ions : l-Alkyl sulfonate

Ion suppression method & Ion-pair chromatography3.Separation mode
IonIon--pair chromatographypair chromatography
Effects of basic additives- Stable pH- Longer retention time- Ion pair reagent effect

Ion suppression method & Ion-pair chromatography3.Separation mode
Method Sample Reversed phase
Ion suppression Weak acidic sample phosphoric acidacetic acidperchloric acidtrifluoroacetic acid
Ion pair Acidic sample Tetra alkyl ammonium halideBasic sample l-Alkykl surfonate
(acetic acid)(trifluoroacetic acid)
Addition of salt phosphatecitrate
Acid and basic sample for Reversed phase LCAcid and basic sample for Reversed phase LC

Review of Section 3
4 separation modesPolarity of packing material and solventChange of mobile phase and elutionIon suppression method and Ion pair methodSalt effect

4. Gradient elution method

4. Gradient elution method
For separation of a sample containing many componentsFor separation of a sample containing many components
0 10 20 255 15
Mob
ile p
hase
Time(min)
Gradient
Step wise
MeOH/Water(50/50)
MeOH(100)
0.01M
0.1M KH2PO4
0.5M

Advantage of gradient elution methodAdvantage of gradient elution method
A
A
A
B
B
B
**
Finepak SIL C18
MeOH/1% AcOH(40/60)
MeOH/1% AcOH(30/70)
MeOH/1% AcOH30/70→45/55Linear Gradient、16min
A : Chlorogenic acidB : Rutin* : Impurity
Isocratic elution method Gradient elution method
4. Gradient elution method

Precautions in gradient elution methodPrecautions in gradient elution method
- Can the gradient save time ?- Reproducibility- Baseline- Ghost peak- Salt
4. Gradient elution method

Effect of temperature on retention timeEffect of temperature on retention time
4. Gradient elution method
0 2 4 6 8 10 12 (min)
60*C
40 *C
20 *C
1
1
1
2
2
2
3
3
3
4
4
4
Finepak SIL C18
CH3CN/H2O(90/10)
Sample:
1. Benzene
2. Anthracene
3. Pyrene
4. Benz(a)pyrene

Review of Section 4
Gradient elution methodTemperature effect

5. Detector

5. HPLC detectorsHPLC detectorsHPLC detectors
UV-VIS(Absorption)
PDA (Absorption)
Differential refractometer(Refractive index)
Fluorometric (Florescence)
Electrochemical (ECD) (Oxidation -reduction)
Conductivity
Mass
Chiral (OR)
Circular dichroism (CD)

5. HPLC detectorsUV/UV/VisVis detectordetector
- Selective detection minimizing effects from other components
- High sensitivity detection at maximum absorption wavelength

5. HPLC detectorsImproved selectivityImproved selectivity
Traditional medicine
7.38
5
7.39
5
Wavelength=260nm Wavelength=340nm
berberine berberine
impurity impurity

0nm
5. HPLC detectorsImproved sensitivityImproved sensitivitySaccharin (SAC) and sorbin acid (SOR)
SAC
SAC
SOR
SOR
230nm3.
575
12.2
50
10-
20-
3.60
8
12.4
67
10-
20-
265nm
Wavelength programming Fixed wavelength at 265nm

5. HPLC detectorsUV spectrum measurementUV spectrum measurementto find wavelength effective for wavelength programmingto find wavelength effective for wavelength programming
210 250 300 350 Wavelength(nm)
1.0
0.5
0
Absorbance
Diazepam(DZP)
Nitrazepam(NZP)
Chronazepam(CZP)

5. HPLC detectorsWavelength programming and fixed wavelengthWavelength programming and fixed wavelength
Blood serumNZP : 420ng/mlCZP : 130ng/mlDZP : 440ng/ml
NZP N
ZP
CZP CZP
DZP
DZP
310nm 250nm
0 5 10 0 5 10
Wavelength programming Fixed wavelength

5. HPLC detectorsOptics of MultiOptics of Multi--wavelength detectorwavelength detector
D2 lamp
I2 lamp
Cell
Grating
Photodiode array
UV/Vis detector
lamp
Photodiode
Photo diode
Cell
Grating

5. HPLC detectorsMultiMulti--wavelength detectorwavelength detector3D chromatogram3D chromatogram

5. HPLC detectorsMultiMulti--wavelength detectorwavelength detectorContCont. data. data

5. HPLC detectorsFeatures of MultiFeatures of Multi--wavelength detectorwavelength detector
1. Spectrum collection at any time2. Library search 3. Purity check4. Quantitative analysis at 6 wavelengths

5. HPLC detectorsPrinciple of Fluorescence detectorPrinciple of Fluorescence detector
excitation
Mobile phase
emission
(S1)
(S2)
(S3)
(S0)Ground state
Excited state
Hν (fluorescence)

5. HPLC detectorsFeatures of Fluorescence detectorFeatures of Fluorescence detector
1. Selective detection2. Detection at any excitation or emission wavelength 3. High sensitivity

5. HPLC detectorsWavelength programming by Fluorescence detectorWavelength programming by Fluorescence detector
Fixed wavelengthEx=275nmEm=400nm
Fixed wavelengthEx=450nmEm=525nm
0 10 20 min 0 10 20 min 0 10 20 min
VB6
VB1
VB2
Phos
phat
e
VB2
VB6
VB2
Phos
phat
e
VB2
0 6.6 10.0 min
Ex 275 240 450Em 400 350 525 nm
Column : Finepak SIL C18SMobil phase : MeOH/Phosphate Buffer Gradient
Wavelength programming

5. HPLC detectorsSelectivity of Selectivity of UV detector and Fluorescence detectorUV detector and Fluorescence detector
UV detector
Fluorescence detector

5. HPLC detectorsPrinciple of RI detectionPrinciple of RI detection
i i
r0 r
light light
Solvent Sample and solvent
r0>r

5. HPLC detectorsUV detector and RI detectorUV detector and RI detector
UV detector
RI detector

5. HPLC detectorsConsiderations for IR detectionConsiderations for IR detection
1. Temperature change2. Replacement of solvent (reference cell and sample cell) 3. Unstable when solvent mixed4. Replacement of solvent inside column

5. HPLC detectorsDetectorsDetectors
UV Fluorescence RI
Sensitivity ng pg μg
Detection selective highly selective universalselectivity
Temperature small small largeInfluence
Gradient elution possible possible impossible
5. HPLC detectorsLabel methodLabel method
Samples absorb less UV/Vis light .Samples do not fluoresce.
↓Improved sensitivity and selectivity required
↓Label method

5. HPLC detectorsLabel methodLabel method
Pre-label method Post-label method
reagent
pump
injector
column
detector
reactor
injector
column
detector
(reaction)
reagentsample

5. HPLC detectorsLabel methodLabel methodPost-label method
Aminoacid 0PA Fluorescenceninhydrine Absorption in Visible range
Sugar guanidine Fluorescence
Organic acid brom thymol blue Absorption in Visible range
Catecholamine ethylenediamine FluorescenceTHI Fluorescence
Bile acid NAD FluorescenceHSD Fluorescence

5. HPLC detectorsPre and Post column Pre and Post column derivatizationderivatization methodmethod
Pre-column Post-column
LC system required Standard system Reaction systemis required
Reproducibility less than post-column good
Operation for all samples only reagents
Reagents wide range limited
Applicability spot routine

5. HPLC detectorsPrePre--column column derivatizationderivatization methodmethod
H
pH8.1、70℃、12min
Dabcyl-Cl Amino acid
Dabcyl - Amino acid
R
OH
O
H2N
N=N SO2 ClNCH3
CH3
+
N=N SO2NCH3
CH3
R
OH
O
N

5. HPLC detectorsSeparation ofSeparation of DabcylDabcyl -- Amino acidAmino acid
10
7
5.00 10.00 15.00 20.00 25.00 [min]2.0E+04
2.5E+04
3.0E+04
3.5E+04
4.0E+04 uV1.Asp 10.Met2.Glu 11.Ile3.Ser 12.Leu4.Thr 13.Phe5.Gly 14.Cystine6.Ala 15.Lys7.Arg 16.His8.Pro 17.Tyr9.Val
12
3
4
56
8
91112
13
14
15 16
17
DAB
S-O
H
NH
340pmol each
Wavelength : 465nm

5. HPLC detectorsPostPost--column column derivatizationderivatization methodmethod
orthophthalaldehyde(OPA)
Derivative compound
CHO
CHO
Amino acid2-mercapto ethanol
+ HS CH2 CH2 OH + NH2 C R
COOH
H
N C R
H
COOH
S CH2 CH2 OH

5. HPLC detectorsPost columnPost column derivatizationderivatization methodmethod
0 20 40 60 (min)
Cy
sS
O3H
As
p Th
rS
er
Gl
uP
ro
Gl
yA
la
Cy
sV
al
Me
t
Il
eL
eu
Ty
r
Ph
e
Hi
s
Tr
pLy
s Ar
g
Ex : 345nmEm : 455nm

Review of Section 5
DetectorsSelectivity and sensitivityPre-/Post- column derivatization methods

The JASCO advanced technology team has again met the challenge and designed a new line of HPLC instruments, The LC-1500series more than satisfies in response to the growing demand for greatly expanded HPLC analyses in the fields of not only biochemistry, pharmaceutical and medical science, but also in the areas of among other organic and inorganic compounds, foods, agricultural sciences, polymeric and natural substances and pollution. The LC-1500 series comprises pumps, detectors,autosamplers, its own column oven and other units each having built-in intelligence and incorporating many features with much higher levels of operability and reliability in addition to multiple functions, higher performance and higher accuracy than before, making them the most advanced instruments available.
6. Data processing

Data processing in HPLC6. Data processing
1. Qualitative analysis 2. Quantitative analysis3. Molecular weight distribution

Qualitative analysis6. Data processing
1. Retention time 2. Retention volume of the standard sample3. Sample components are collected after separation,
and subjected to spectrometric analysis such as IR, NMR and MS.

Identification from retention time6. Data processing
A
B
tR Standard sample
A B
Unknown sample

Standard addition method6. Data processing
Target peak
Standard addition

6. Data processing
Retention time of standard sample is different from unknown sample
Standard sample
Unknown sample
Unknown sample and
Standard sample
Standard addition method

6. Data processing
Identification using a different instruments after preparative analysis
Identification from retention time
Limitation:On flow UV spectrum
On flow emission spectrum
Multi-channel detector
Preparative analysisSpectrum measurement using a different instrument

Quantitative analysis6. Data processing
How much component A ?
A
AStandard sample (1mg/ml)
Unknown sample
Injection of 10μg
Injection of 10μg
The amount of a component can be calculated from the peak height and peak area of the chromatogram.

6. Data processing
Calibration methodExternal standard sample
Internal standard sample

6. Data processing
External standard sample
Concentration(μg/ml)
Thia
mira
l
Thia
mira
l
Peak
are
a
Finepak SIL C18T-5、 CH3CN/10mM KH2PO4 aq. (50:50)
UV 288nm
Thiamiral in serum

s
6. Data processing
Internal standard sample
concentration(μg/ml)
Anticonvulsants in serum
Finepak SIL C18T、 CH3CN/5mM KH2PO4 aq.
1:PB2:DPH3:CBZIS:Phenacetin
Concentration ratio
Peak
are
a
Standard sample Unknown sampleCalibration curve

6. Data processing
Guide for selecting the internal standard sample
No overlapping peaks
No Components included in unknown sample
Chemical and physical stability
High purity

6. Data processing
External standard and Internal standard samples
External standard Internal standardError injection volume volume to be added Correction of impossible possiblePre-treatment loss

6. Data processing
Caution when using an Integrator
large
True curve
error
One point calibration Integrator
largesmall

6. Data processing
Caution when using an Integrator
Two point calibration
largeerror largesmall
Integrator
True curve

6. Data processing
Baseline

6. Data processing
Considerations when performing quantitative analysis
Standard sample
Integrator
Micro syringe
Sample preparation
Concentration change of standard sample
Contamination

Review of Section 6
Identification1. Retention time2. Standard sample3. After preparative analysis, measure spectrum
using a different method
Quantitative analysis1. External standard sample2. Internal standard sample3. Items to consider when performing quantitative
analysis

The JASCO advanced technology team has again met the challenge and designed a new line of HPLC instruments, The LC-1500series more than satisfies in response to the growing demand for greatly expanded HPLC analyses in the fields of not only biochemistry, pharmaceutical and medical science, but also in the areas of among other organic and inorganic compounds, foods, agricultural sciences, polymeric and natural substances and pollution. The LC-1500 series comprises pumps, detectors,autosamplers, its own column oven and other units each having built-in intelligence and incorporating many features with much higher levels of operability and reliability in addition to multiple functions, higher performance and higher accuracy than before, making them the most advanced instruments available.
7. Sample preparation

7. Sample preparation
Sample preparationCause Problem Countermeasures
Sample is not liquid. not possible to inject extraction / dissolving
Concentration is too high. over load for column / out of detection range dilution
Concentration is too low. cannot detect concentration / derivative
Contains foreign particles clogged up centrifugation / filtration
Includes components which damage column solvent extraction /derivative
Includes interference for separation quantitation error solvent extraction /derivative
Solvent unsuitable deterioration of column pH adjustment
7. Sample preparation
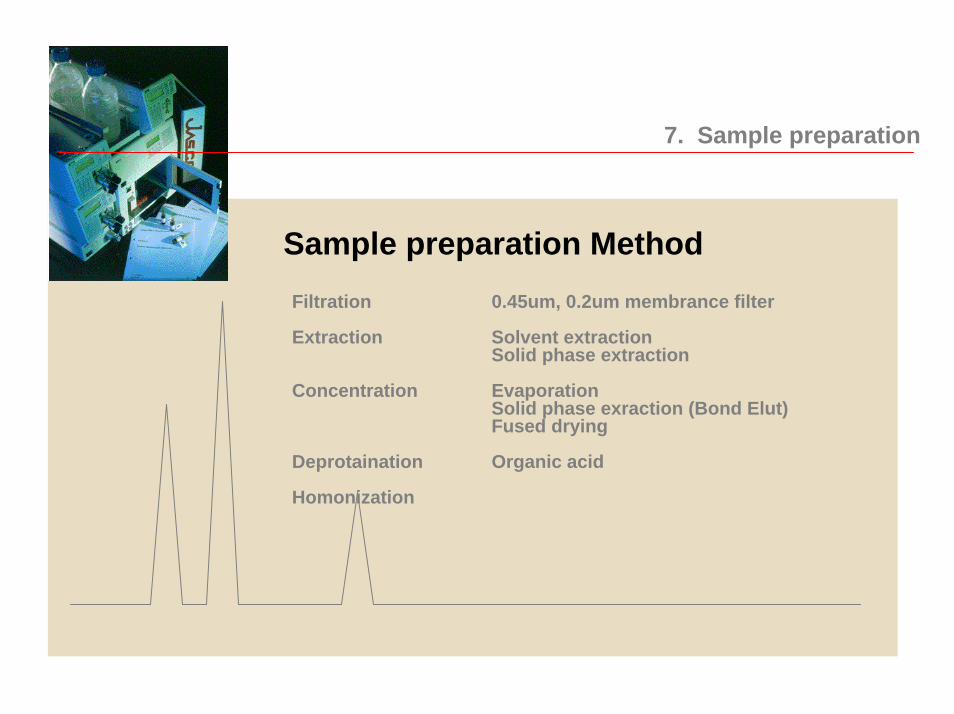
Sample preparation MethodFiltration 0.45um, 0.2um membrance filter
Extraction Solvent extractionSolid phase extraction
Concentration EvaporationSolid phase exraction (Bond Elut)Fused drying
Deprotaination Organic acid
Homonization

7. Sample preparationSolid phase extraction1. Activation
Wash with MeOH
Activate With H2O
Vacuum
2. Load sample
SampleContaminant
Wash with H2O orH2O/MeOH
Contaminant
3. Wash
MeOH or Eluting solvent
4. Elute target compound
Targetcompound

7. Sample preparationRemoving contaminants which have strong retention
Wash with MeOH
Activate with proper solvent
1. Activate
Vacuum
2. Load sample
Target sampleCompound which has strong retention
3. Elute a target compound
Using vacuum or pressure
Compound which has strong retention
Target sample

a
7. Sample preparationConcentration1. Activate
Wash with MeOH
Activate with H2O
Vacuum
pump
2. Load and concentrate target sample
( target sample)
Small amount ofTarget sample
3. Elute target sample
Elute with MeOH
Target compoundis concentrated.

7. Sample preparation
Considerations when preparing sampleRecovery rate
Contamination

Review of Section 7
1. The most appropriate preparation method depends on various factors including the sample(target compound), the amount of target compound in the sample, and the kinds of contaminant.
2. Consider such factors as the sample state, amount,running cost, running time, and handling.

The JASCO advanced technology team has again met the challenge and designed a new line of HPLC instruments, The LC-1500series more than satisfies in response to the growing demand for greatly expanded HPLC analyses in the fields of not only biochemistry, pharmaceutical and medical science, but also in the areas of among other organic and inorganic compounds, foods, agricultural sciences, polymeric and natural substances and pollution. The LC-1500 series comprises pumps, detectors,autosamplers, its own column oven and other units each having built-in intelligence and incorporating many features with much higher levels of operability and reliability in addition to multiple functions, higher performance and higher accuracy than before, making them the most advanced instruments available.
8. Procedure for developing analytical conditions

7. Sample preparation
Procedure for developing analytical conditions
Step one : clear analytical purpose, and research the target compound.(1) Molecular weight
Molecular structureFunctional group
(2) Solubility, stabilityUV, FP absorption
(3) Amount of concentration, contaminant(4) Application data
reference literature, magazines
Step two : Development analytical conditions(trial and error)(1) When attempting to develop analytical conditions,
use an appropriate concentration of standard solution(2) Check the detection limit and detection method(3) Prepare sample(4) Check contaminat and target compound peak separation

7. Sample preparation
Procedure for developing analytical conditions
Step three : Establish analytical condition for routine analysis(1) Linearity of calibration curve(2) Reproducibility of analysis(3) Check for contaminants that retain strongly in the column(4) Check for Correlation with other methods.
Step Four Routine quantitative analysis(1) Lifetime of column(2) Running cost(3) Develop analytical procedure (SOP)(4) Check HPLC and column performance.