hr m&a - acg
TRANSCRIPT
M&AHR

Insperity serves more than 100,000 businesses
with more than 2 million employees nationwide.
About Insperity®
Founded: April 1986
Headquarters: Houston, Texas
Locations: 60 U.S. offices
2015 Revenue: $2.6 billion
Corporate Employees: 2,400

Today’s Presenter
Rebecca Stewart
Certified Business Performance Advisor
Insperity®


• Identifying HR pitfalls prior to the M&A process
• Establishing HR scorecard and assigning
financial value to the HR process
• Identifying and incentivizing key employees to
lead the company through the M&A process
• Develop an effective communications strategy
5 areas the audit should evaluate

1. Record Keeping
2. Recruiting & Selection
3. Employee Development
4. Employee Relations
5. Compensation & Benefits

HR Scorecard

Mission Vision Values
Strategy
Strategic Objectives/Outcomes
Finance: Satisfied Shareholders
Customer: Delighted Customers
Internal Business Process: Efficient and Excellent Processes
HR Development (Learning & Growth): Highly motivated/productive employees
KPI
KPI
KPI


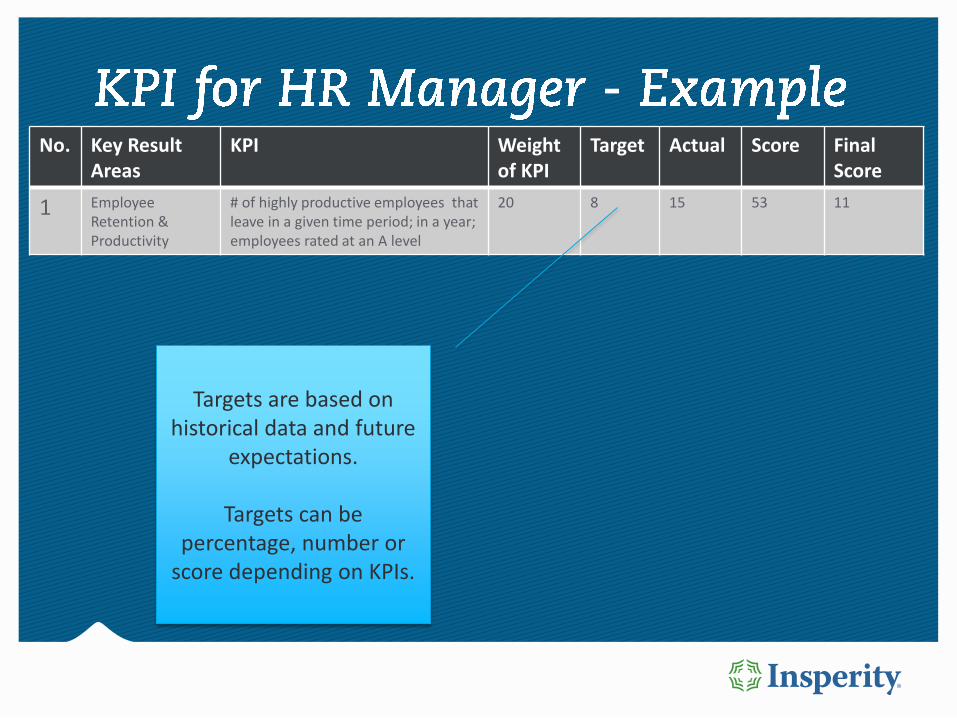
No. Key Result Areas
KPI Weight of KPI
Target Actual Score Final Score
1 Employee Retention & Productivity
# of highly productive employees that leave in a given time period; in a year; employees rated at an A level
20 8 15 53 11
Profit per employee 15 3.5M 2.1M 60 9
2 Recruitment Ave lead time to recruit employees 10 45 days 35 days 129 13
New hire failure rate for first 6months of hire
10 8% 21% 38 4
3 Career Mgmt and Employee Performance
% of trained employees below performance standards
8 25% 40% 62.5 5
Rate of internal job hires - trained employees promoted within the year
7 10% 6% 60 4.2
4 Training & Development
Training Hours per Employee/Year 15 15 15 100 15
% of trained employees that move up one tier of performance; C to B, B to A
15 25% 7% 28 4
65

No. Key Result Areas
KPI Weight of KPI
Target Actual Score Final Score
1 Employee Retention & Productivity
# of highly productive employees that leave in a given time period; in a year; employees rated at an A level
20 8 15 53 11
Key Result Areas are the main goals that the HR
Mgr need to accomplish.

No. Key Result Areas
KPI Weight of KPI
Target Actual Score Final Score
1 Employee Retention & Productivity
# of highly productive employees that leave in a given time period; in a year; employees rated at an A level
20 8 15 53 11
KPIs are measurable indicators used to evaluate
your performance level.
Every Key Result Area must have at least one KPI.
Total # of KPIs should be 8-10

No. Key Result Areas
KPI Weight of KPI
Target Actual Score Final Score
1 Employee Retention & Productivity
# of highly productive employees that leave in a given time period; in a year; employees rated at an A level
20 8 15 53 11
Weight of each KPI should be defined and based on
scaled of priority.
Should equal 100.
15
10
10
8
7
15
15
No. Key Result Areas
KPI Weight of KPI
Target Actual Score Final Score
1 Employee Retention & Productivity
# of highly productive employees that leave in a given time period; in a year; employees rated at an A level
20 8 15 53 11
Targets are based on historical data and future
expectations.
Targets can be percentage, number or
score depending on KPIs.
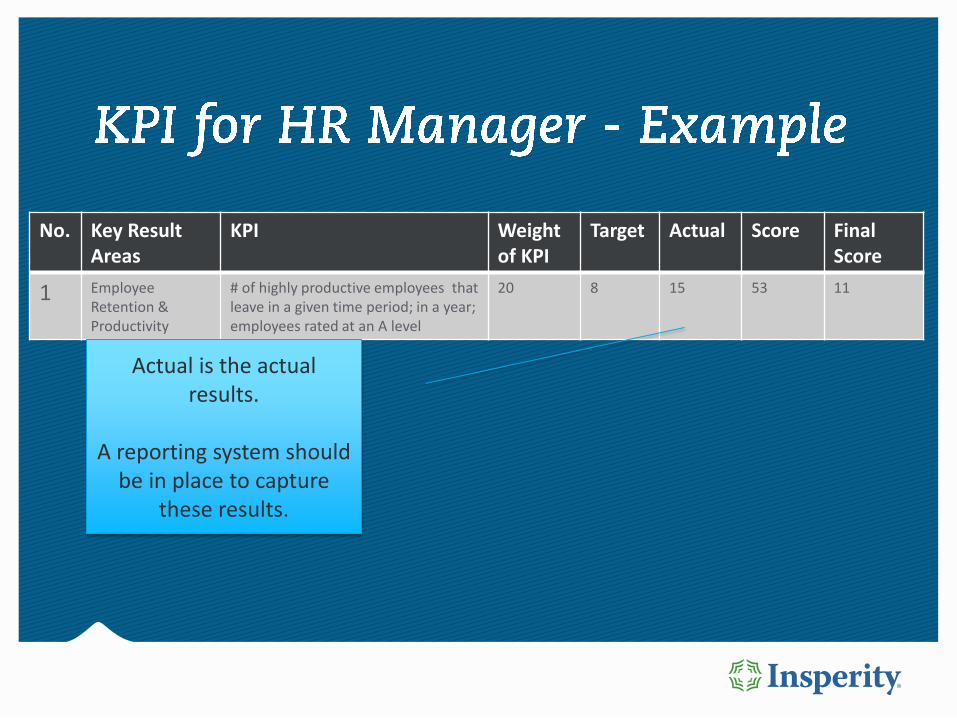
No. Key Result Areas
KPI Weight of KPI
Target Actual Score Final Score
1 Employee Retention & Productivity
# of highly productive employees that leave in a given time period; in a year; employees rated at an A level
20 8 15 53 11
Actual is the actual results.
A reporting system should be in place to capture
these results.
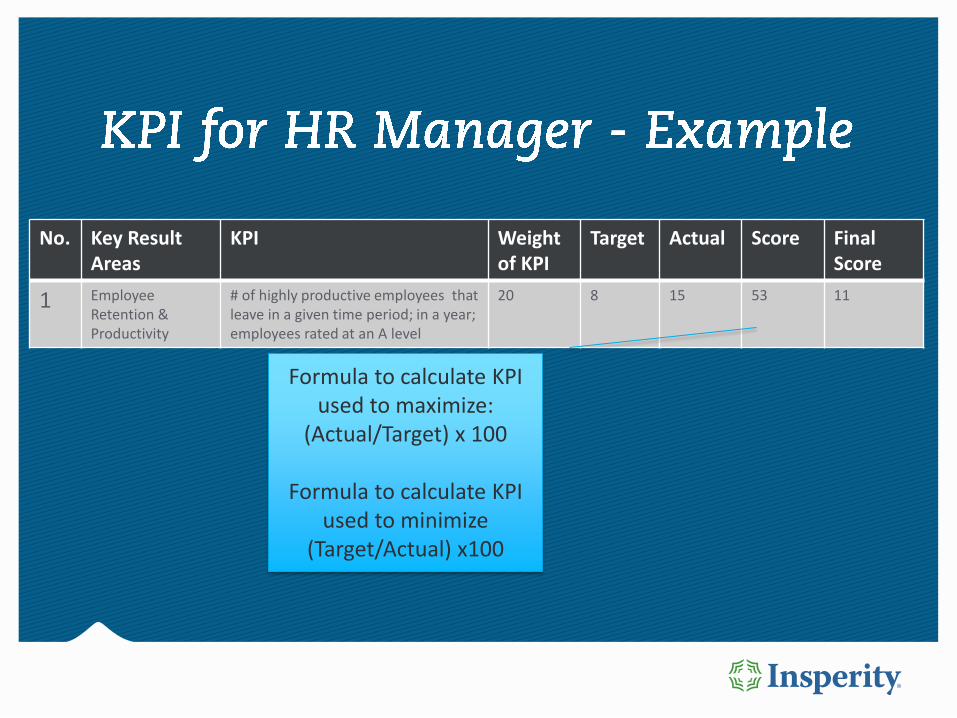
No. Key Result Areas
KPI Weight of KPI
Target Actual Score Final Score
1 Employee Retention & Productivity
# of highly productive employees that leave in a given time period; in a year; employees rated at an A level
20 8 15 53 11
Formula to calculate KPI used to maximize:
(Actual/Target) x 100
Formula to calculate KPI used to minimize
(Target/Actual) x100

No. Key Result Areas
KPI Weight of KPI
Target Actual Score Final Score
1 Employee Retention & Productivity
# of highly productive employees that leave in a given time period; in a year; employees rated at an A level
20 8 15 53 11
65
Formula for Final Score:(Score x Weight)/100
Final score used to determine bonus allocation, salary
increases, bonuses
9
13
4
5
4.2
15
4

No. Key Result Areas
KPI Weight of KPI
Target Actual Score Final Score
1 Employee Retention & Productivity
# of highly productive employees that leave in a given time period; in a year; employees rated at an A level
20 8 15 53 11
Profit per employee 15 3.5M 2.1M 60 9
2 Recruitment Ave lead time to recruit employees 10 45 days 35 days 129 13
New hire failure rate for first 6months of hire
10 8% 21% 38 4
3 Career Mgmt and Employee Performance
% of trained employees below performance standards
8 25% 40% 62.5 5
Rate of internal job hires - trained employees promoted within the year
7 10% 6% 60 4.2
4 Training & Development
Training Hours per Employee/Year 15 15 15 100 15
% of trained employees that move up one tier of performance; C to B, B to A
15 25% 7% 28 4
65


Low/HighHigh/High
Critical Employee
Low/ LowHigh/Low
Ideal
Low: Difficulty replacing the employee
High: Difficulty replacing the employee
Low: Likelihood of the employee leaving
High: Likelihood of the employee leaving


Questions?

Thank you for joining us
For more information, or to speak with an
Insperity® business performance advisor, visit
insperity.com/acg or call us at 866-814-6817.