(hr wallingford) - national infrastructure planning · 2016. 4. 19. · 19/08/11 2.0 tbe/gbs jmh...
TRANSCRIPT

Annex 8.3
Assessment of the Effects of a
Proposed Development on the
South Bank of the Humber
Estuary on Fine Sediments
(HR Wallingford)

ENVIRONMENTAL RESOURCES MANAGEMENT ABLE UK LTD.
X.X1

EX 6
603 Able Marine Energy Park 3D Mud
ModellingAssessment of the effects of a proposeddevelopment on the South Bank of theHumber Estuary on fine sediments
Report EX 6603Release 9.0December 2011

Assessment of the effects of a proposed development on the south bank of the Humber Estuary on fine sediments
EX 6603 ii R. 9.0
Document Information Project Able Marine Energy Park 3D Mud Modelling
Report title Assessment of the effects of a proposed development on the south bank of the Humber Estuary on fine sediments
Client Able UK Ltd Client Representative Richard Cram Project No. DDR4808 Report No. EX 6603 Project Manager Graham Siggers Project Director Dr John Harris
Document History
Date Release Prepared Approved Authorised Notes 28/07/11 1.0 TBE/GBS JMH MPD Draft for comment (Layout 1b) 19/08/11 2.0 TBE/GBS JMH MPD Able UK Ltd comments on draft addressed.
Revised layout (Layout 2) tested and results updated.
09/09/11 3.0 TBE/GBS JMH MPD Able UK Ltd comments on draft addressed (Layout 1b)
20/09/11 4.0 TBE/GBS JMH MPD Long term morphology predictions included (Layout 1b)
13/10/11 5.0 TBE/GBS JMH MPD Revised layout tested and results updated (Layout 4, 80m set back quay)
04/11/11 6.0 TBE/GBS MPD JMH Final 07/11/11 7.0 TBE/GBS MPD JMH Final (minor corrections and extra appendix) 14/11/11 8.0 TBE/GBS MPD JMH Final (modification of cover figure) 09/12/11 9.0 TBE/GBS MPD JMH Final (minor revision)
Prepared
Approved
Authorised
© Able UK Ltd HR Wallingford accepts no liability for the use by third parties of results or methods presented in this report. The Company also stresses that various sections of this report rely on data supplied by or drawn from third party sources. HR Wallingford accepts no liability for loss or damage suffered by the client or third parties as a result of errors or inaccuracies in such third party data.

Assessment of the effects of a proposed development on the south bank of the Humber Estuary on fine sediments
EX 6603 iii R. 9.0
Summary Able Marine Energy Park 3D Mud Modelling Assessment of the effects of a proposed development on the south bank of the Humber Estuary on fine sediments Report EX 6603 December 2011 This report describes the verification and application of a 3D mud transport model to assess the potential changes to the fine sediment regime and morphology as a result of the proposed Able Marine Energy Park. Changes to suspended sediment concentrations are modelled and changes to sedimentation in adjacent berths to the north and south is predicted. Estimated maintenance dredging requirements are provided, and initial changes to morphology are considered in the light of longer term changes observed northwest of HIT. Predictions of sedimentation and infill are subject to a high degree of uncertainty, some of the causes of which are discussed including the sparseness of available data. Values are presented in terms of a range of predictions. A longer term assessment of potential morphological changes to the intertidal area upriver of the AMEP is undertaken, as is an assessment of potential channel formation as a result of a proposed new drainage outfall at the downriver end of the development.

Assessment of the effects of a proposed development on the south bank of the Humber Estuary on fine sediments
EX 6603 iv R. 9.0
Contents continued

Assessment of the effects of a proposed development on the south bank of the Humber Estuary on fine sediments
EX 6603 v R. 9.0
Contents Title page i Document Information ii Summary iii Contents v
1. Introduction ...................................................................................................................... 1 1.1 Background.......................................................................................................... 1 1.2 Objective.............................................................................................................. 1 1.3 Report structure ................................................................................................... 2
2. Hydrodynamic modelling................................................................................................. 2 2.1 The flow model.................................................................................................... 2 2.2 Model setup ......................................................................................................... 2
2.2.1 Bathymetry............................................................................................. 2 2.2.2 Computational mesh............................................................................... 2 2.2.3 Boundary conditions .............................................................................. 3
2.3 Model validation.................................................................................................. 3 2.4 Modelled effects of the Able Marine Energy Park .............................................. 3
3. Fine sediment modelling .................................................................................................. 3 3.1 Modelling approach ............................................................................................. 3 3.2 Model parameterisation ....................................................................................... 4 3.3 Model verification ............................................................................................... 5
3.3.1 Measured data ........................................................................................ 5 3.3.2 Verification ............................................................................................ 5
3.4 Model runs ........................................................................................................... 6 3.5 Modelled effects of the Able Marine Energy Park (AMEP) ............................... 6
3.5.1 Predicted changes to sedimentation rates at existing berths................... 6 3.5.2 Predicted sedimentation rates along the intake-outfall lines .................. 7 3.5.3 Predicted longer term (months) sedimentation along intake-outfall
lines ........................................................................................................ 7 3.5.4 Modelled effect on suspended sediment concentrations at the
Centrica and E.ON cooling water intakes .............................................. 8
4. Desk assessment of potential channel formation at proposed surface water outfall ........ 9
5. Interpretation and assessment......................................................................................... 12 5.1 Sedimentation and maintenance dredging requirements ................................... 12 5.2 Longer term morphological change to the northwest of AMEP........................ 13 5.3 Suspended sediment concentrations at the Centrica and E.ON intakes............. 14 5.4 Potential channel formation at proposed surface water outfall.......................... 14
6. References ...................................................................................................................... 15
Tables Table 1 Comparison of annual predicted and observed deposition into adjacent berths
(tonnes dry solids)...................................................................................................... 6 Table 2 Model runs ................................................................................................................. 6 Table 3 Modelled Percentage Changes to Maintenance Dredging Requirements.................. 7 Table 4 Annual Infill Estimates (Dry Tonnes / Year, Existing Case)................................... 12

Assessment of the effects of a proposed development on the south bank of the Humber Estuary on fine sediments
EX 6603 vi R. 9.0
Contents continued Table 5 Annual Infill Estimates (Dry Tonnes / Year, Post-Development) ........................... 12 Table 6 Predicted changes to Annual Infill Estimates (Dry Tonnes / Year)......................... 12 Figures Figure 1 Model domain and computational mesh (baseline) Figure 2 Model bathymetry (baseline) Figure 3 Model domain and computational mesh (with AMEP scheme) Figure 4 Model bathymetry (with AMEP scheme) Figure 5 Zoomed-in view of computational mesh (with AMEP scheme) Figure 6 Model layout and bathymetry (with AMEP scheme) also showing locations of
E.ON and Centrica intakes and outfalls Figure 7 Comparison of modelled depth average flow speeds with JBA model and ADCP
measured flows speeds in proximity to the E.ON intake Figure 8 Comparison of modelled suspended sediment concentrations against
observations made at Grimsby (ABP, 2009) and Humber Sea Terminal (IECS, 2011b) – Model Run 43 Spring Tides
Figure 9 Comparison of modelled suspended sediment concentrations against observations made at Grimsby (ABP, 2009) and Humber Sea Terminal (IECS, 2011b) – Model Run 43 Neap Tides
Figure 10 Comparison of modelled suspended sediment concentrations against observations made at Grimsby (ABP, 2009) and Humber Sea Terminal (IECS, 2011b) – Model Run 53 Spring Tides
Figure 11 Comparison of modelled suspended sediment concentrations against observations made at Grimsby (ABP, 2009) and Humber Sea Terminal (IECS, 2011b) – Model Run 53 Neap Tides
Figure 12 Predicted increases in potential sedimentation and erosion after a modelled spring neap cycle (Run 43)
Figure 13 Predicted increases in potential sedimentation and erosion after a modelled spring neap cycle (Run 51)
Figure 14 Predicted increases in potential sedimentation and erosion after a modelled spring neap cycle (Run 52)
Figure 15 Predicted increases in potential sedimentation and erosion after a modelled spring neap cycle (Run 53)
Figure 16 Transects showing model predicted sedimentation along intake/outfall lines (Model Run 43)
Figure 17 Model layout and bathymetry with earlier arrangement of AMEP scheme (Layout 1b) used for the assessment of longer term changes to morphology
Figure 18 Long term morphological prediction (Iteration 1 – bed difference after elapsed time of six weeks) – Layout 1b (50m seaward quay face with suspended deck)
Figure 19 Long term morphological prediction (Iteration 2 – bed difference between six and twelve weeks elapsed time) - Layout 1b (50m seaward quay face with suspended deck)
Figure 20 Long term morphological prediction (Iteration 3 – bed difference between twelve and eighteen weeks elapsed time) - Layout 1b (50m seaward quay face with suspended deck)
Figure 21 Long term morphological prediction (Iteration 4 – bed difference between eighteen and twenty-four weeks elapsed time) - Layout 1b (50m seaward quay face with suspended deck)

Assessment of the effects of a proposed development on the south bank of the Humber Estuary on fine sediments
EX 6603 vii R. 9.0
Contents continued Figure 22 Initial (start of Iteration 1) and final predicted (end of Iteration 4) bathymetry for
Layout 1b (50m seaward quay face with suspended deck) Figure 23a Predicted longer term changes to morphology at intakes and outfalls (Layout 1b,
50m seaward quay face with suspended deck) Figure 23b Predicted longer term changes to morphology at points 30m seaward of intakes
and outfalls (Layout 1b, 50m seaward quay face with suspended deck) Figure 23c Predicted longer term changes to morphology at points 50m seaward of intakes
and outfalls (Layout 1b, 50m seaward quay face with suspended deck) Figure 24 Modelled changes to suspended sediment concentrations at the E.ON Intake –
Spring tides Figure 25 Modelled changes to suspended sediment concentrations at the E.ON Intake –
Neap tides Figure 26 Modelled changes to suspended sediment concentrations at the Centrica Intake –
Spring tides Figure 27 Modelled changes to suspended sediment concentrations at the Centrica Intake –
Neap tides Figure 28 Longer term potential morphological response along intake-outfall line
(Centrica) Figure 29 Longer term potential morphological response along intake-outfall line (E.ON) Appendix Appendix 1 Summary of model predictions of annual accretion Appendix 2 Drawings of the existing power station intakes and outfalls (provided by
E.ON and Centrica)
Contents continued

Assessment of the effects of a proposed development on the south bank of the Humber Estuary on fine sediments
EX 6603 viii R. 9.0

Assessment of the effects of a proposed development on the south bank of the Humber Estuary on fine sediments
EX 6603 1 R. 9.0
1. Introduction 1.1 BACKGROUND
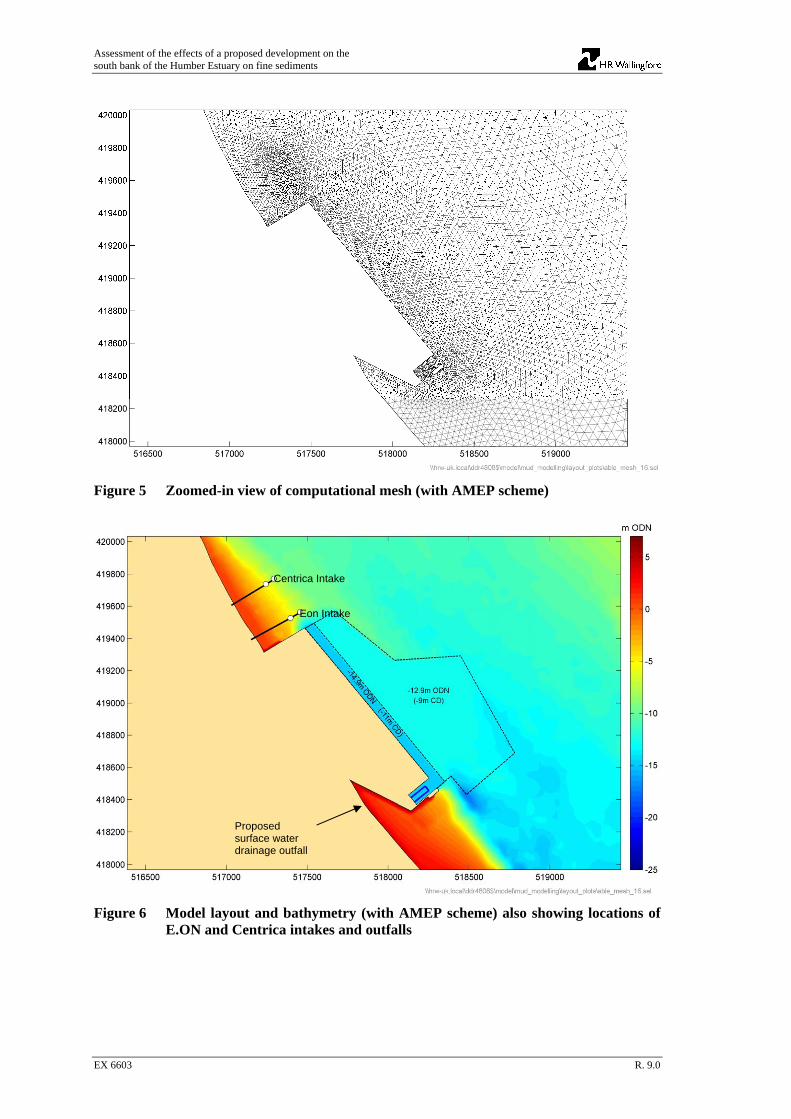
Able UK proposes to construct Able Marine Energy Park (AMEP) near Immingham on the southern bank of the Humber Estuary. The AMEP will be a facility for the construction of offshore wind turbines and other activities associated with sources of renewable marine energy. The AMEP will consist of a large reclamation approximately 1,300 m in length along the shore and extending 300 – 400 m out into the estuary. Immediately to the northwest of the reclamation there are two existing intake/outfall lines for two gas-fired power stations (Appendix 2). One plant is operated by Centrica and the other by E.ON. Further northwest is the Humber Sea Terminal. To the southeast of the proposed reclamation are existing berths at the South Killingholme Oil Jetty and Immingham Gas Terminal, and within a distance of approximately 600 m from the southeastern end of the proposed development an existing reclamation some 900 m in length and extending 300 m out into the estuary (the Humber International Terminal). Further towards the southeast lie the Immingham Bulk Terminal, Immingham Outer Harbour and approaches to the Immingham docks. Modelling assessments of the effects of the proposed scheme on hydrodynamics, coarse sediments and geomorphology have already been completed (JBA, 2011a, 2011b), together with an assessment of the potential effects of the proposed development on the temperature of cooling water at the neighbouring intakes (HR Wallingford 2011a,b). As a consequence of the results of the hydrodynamic and sediment modelling undertaken to date, a revised layout was developed by Able UK Ltd. to mitigate some of the potential effects. This revised layout has been the subject of testing in this report. Figure 6 shows the proposed development and existing intake/outfall lines, highlighting the reclamation, quay-line, dredged pockets and turning areas, and proposed site of a new drainage outfall that must be relocated as a consequence of the development of the AMEP.
1.2 OBJECTIVE
The sub-tidal bed of this part of the Humber Estuary consists of muddy sands, slightly gravelly muddy sands, and sandy muds. Along the intertidal areas local to the proposed development the bed consists mostly of sandy mud with mud on the upper intertidal areas (IECS, 2011a). The objective of this assessment is to investigate the likely effects of the proposed scheme on mud transport, using the fine sediment (mud) transport model Delwaq-3D. The conclusions of this work supplement the hydrodynamic and sediment assessment work already completed by JBA (2011a and b). These reports together inform the Environmental Statement (ES) chapter entitled, “Hydrodynamic and Sedimentary Regime”. Of particular concern are the likely effects of the scheme on suspended sediments and morphology along the intake/outfall lines and sedimentation onto designated intertidal areas and into the existing adjacent downstream berths. In addition to the fine sediment modelling, a desk assessment of potential channel formation at a proposed new surface water drainage outfall has been undertaken.

Assessment of the effects of a proposed development on the south bank of the Humber Estuary on fine sediments
EX 6603 2 R. 9.0
1.3 REPORT STRUCTURE
This report comprises a further four chapters. Chapter 2 describes the 3D hydrodynamic modelling and shows validation against observations and inter-comparison with the (JBA) hydrodynamic model used for the hydrodynamic assessment of effects. Chapter 3 describes the 3D sediment transport modelling showing model validation and results for the different scenarios simulated for the proposed scheme, together with a longer term assessment of morphological change to the northwest of the AMEP. Chapter 4 provides a brief assessment of potential channel formation at the proposed surface water outfall location. Chapter 5 provides an interpretative assessment of the modelling supported by desk based assessments to give guidance on the likely effects of the proposed scheme on suspended sediment concentrations, maintenance dredging requirements, suspended sediment and morphological changes near to the proposed intake/outfall lines, and the potential additional effect of a new surface water drainage outfall on the intertidal morphology to the south of the proposed scheme.
2. Hydrodynamic modelling 2.1 THE FLOW MODEL
HR Wallingford’s model used the TELEMAC system, which was developed by EDF-LNHE, Paris and is now under the directorship of a consortium of organisations including EDF-LNHE, HR Wallingford, Sogreah-Artelia, BAW and CETMEF. A team drawn from these organisations carries out developments to the software together with contributions from many universities and other organisations. In a TELEMAC model, the area to be studied is represented using a mesh of triangular elements of variable size. Very small elements can be used in the vicinity of a proposed development, for example, while larger elements can be used further away. The model calculates water level and profiles of velocity at each node in the mesh and stores these at intervals through the simulation. The 3D model was used for this assessment and had five horizontal planes through the depth.
2.2 MODEL SETUP
2.2.1 Bathymetry The model was set up using bathymetry information supplied by JBA (JBA, 2011a). The bathymetry data contains both estuary-wide bathymetry supported by a project-specific boat survey and LiDAR data for local intertidal areas. More information can be found in JBA (2011a).
2.2.2 Computational mesh The model coverage, resolution and bathymetry are shown in Figures 1 to 6, for existing and proposed layouts. The model domain extends from the Humber Bridge (at the landward limit of the model) to Spurn Head (at the seaward limit). The mesh resolution

Assessment of the effects of a proposed development on the south bank of the Humber Estuary on fine sediments
EX 6603 3 R. 9.0
ranges from 10 m close to the proposed development (5 m in the proposed dock), increasing to 50 m mid-channel, 100-150 m in most other locations in the model domain, and approximately 500-600 m at the boundary near Spurn Head.
2.2.3 Boundary conditions Boundary conditions were supplied by JBA (JBA, 2011a). These were applied as prescribed water levels at both the upriver and sea boundaries and the model was run to simulate a full spring-neap cycle following a 2 day model “spin-up” time.
2.3 MODEL VALIDATION
The model was validated through comparison against both measured data (at a location in the proximity of the E.ON intake) and against modelled flow speeds and water levels simulated using the JBA model (JBA, 2011a). Figure 7 shows that the HR Wallingford TELEMAC model predicted depth-averaged flow speeds are in very good agreement with both the JBA flow model and with the measured ADCP data. As a result the model was considered to be sufficiently well validated to provide simulated hydrodynamics for the mud transport modelling.
2.4 MODELLED EFFECTS OF THE ABLE MARINE ENERGY PARK
The proposed scheme was included in the hydrodynamic model, including the reclamation, proposed dredged pockets and turning area. A suspended deck was included in the dock at the southeastern end of the quay. This was represented in the model through the use of a drag function related to the number and density of proposed piles supporting the deck.
3. Fine sediment modelling 3.1 MODELLING APPROACH
Given the predicted changes to flows presented in JBA (2011a), it is expected that changes to concentrations and patterns of deposition and erosion will occur. In areas of reduced current strength one may expect to see increased deposition but this will be influenced by sediment supply, which may also change as a result of the changes to water movements. Hence, the potential changes are too complex to simply assess from an analysis of changes to the flow regime, and so application of a suitable mud transport model is required. A 3D mud transport model (Delwaq) was set up to link to the hydrodynamic model outputs and: • establish the baseline conditions in terms of suspended sediment concentrations
and patterns of existing deposition at the existing downstream marine terminals; • assess and predict the impact of the marine works on suspended sediment
concentrations and deposition and erosion patterns, particularly on designated intertidal areas and at the existing upriver intakes and outfalls; and
• predict mud infill in the new dredged areas of the AMEP and at the existing downstream marine terminals.

Assessment of the effects of a proposed development on the south bank of the Humber Estuary on fine sediments
EX 6603 4 R. 9.0
Delwaq (3D), developed by WL Delft Hydraulics, simulates the entrainment, advection and settling of fine sediment due to the combined effects of currents and waves. The model has been developed under a project by WL Delft Hydraulics and EDF-LNHE to directly couple with the TELEMAC system which forms the basis of the modelling suite on this project. Verification of Delwaq was carried out against a limited amount of available data. The model was then used to explore the natural variability in the background concentration fields, by simulating a range of conditions covering representative tide and wave conditions. The verified Delwaq (3D) model was then also run with the proposed AMEP development in place. The model was run for a spring-neap cycle, and likely rates of deposition onto the intertidal areas and into the dredged areas were determined.
3.2 MODEL PARAMETERISATION
A brief description of some key assumptions in the mud transport model is provided below: Settling velocity – The settling velocity was calculated using an empirical formula derived by Manning (2008) which has been validated against a large number of measurements from estuaries in North West Europe. This formula accounts for the influence of both concentration and turbulence on settling velocity. For concentrations above 2 g/l the settling velocity was reduced to account for the “hindered settling” effect. Deposition/Erosion – The net deposition/erosion was calculated using the approach of Winterwerp and van Kesterern (2004) which assumes that deposition and erosion occur simultaneously with net deposition or net erosion occurring depending on whether the rate of erosion or the rate of deposition is largest. The Krone equation was used to calculate deposition (with a probability of settling equal to 1) while erosion was calculated using the equation attributed to Partheniades. 2 layer bed model – The model was run with a two layer representation of the bed. The top layer, representing more readily eroded sediment, was given an erosion threshold of 0.4 N/m2, while the bottom layer, representing less readily eroded sediment was given a higher, but spatially varying, erosion threshold. Bed roughness – Bed roughness in the model used a Nikuradse-type friction with a roughness length of 0.006 m. Turbulence – Turbulence was represented in the model using a mixing-length formulation. The effect of damping of turbulence was represented by the Munk and Anderson (1948) equations. This allows the 3D model to more accurately represent the near-bed suspended sediment concentrations, which can be influenced by large vertical density gradients. Initial concentrations – the initial distribution of suspended sediment concentrations was derived by running the model for a spring-neap cycle and using the distribution at the end of this initialisation simulation as the basis for further simulations.

Assessment of the effects of a proposed development on the south bank of the Humber Estuary on fine sediments
EX 6603 5 R. 9.0
3.3 MODEL VERIFICATION
3.3.1 Measured data Availability of good quality suspended sediment concentrations data was limited for this study. The model was verified through comparison against the following datasets/reports: 1. IECS survey undertaken at the Humber Sea Terminal (IECS, 2010b) 2. ABPmer Report on Grimsby Ro-Ro development (ABP, 2009) 3. Humber Maintenance Dredging Baseline Document (ABP, 2008).
3.3.2 Verification Suspended Sediment Concentrations Figures 8 and 9 show comparison of the model predictions against measured suspended sediment concentration data. Overall, the model comparisons with the limited data are good and the model was considered appropriate for use in assessing the effects of the proposed development. One issue is that although the model predicted flood tide concentrations agreed well with both the ABPmer model predictions at Grimsby and the surveyed data at Grimsby, it did not agree with the large peak concentrations that occurred on the flood tide 2.5 hours before high water, captured within the IECS dataset. The HR Wallingford model and the ABP model-and-data all predict higher concentrations on the ebb tide than the flood tide so the reason for this difference in the IECS dataset is not fully understood. Because of this uncertainty and the general sparseness of data, an additional model run was undertaken to produce higher concentrations in the model. This was achieved by changing some of the parameters in the model relating to the erosion and deposition thresholds. Comparison of modelled concentrations against observations for this sensitivity test is shown in Figures 10 and 11 for spring and neap tides. In addition, sensitivity runs including the effect of NW and SE waves were undertaken (see Section 3.4). Model predicted infill into adjacent berths (baseline) A further aspect of verification was to compare model predicted deposition into adjacent berths with known information on existing maintenance dredging requirements. A particularly useful source of information is the Humber Maintenance Dredging Baseline Document (ABP, 2008). A comparison of model predicted infill, scaled up to give annual values in dry tonnes, with values reported in (ABP, 2008) is provided in Table 1 below. Values quoted in (ABP, 2008) are in wet tonnes. To convert wet tonnes to dry tonnes, wet and dry densities of 1,300 kgm-3 and 500 kgm-3 were assumed.

Assessment of the effects of a proposed development on the south bank of the Humber Estuary on fine sediments
EX 6603 6 R. 9.0
Table 1 Comparison of annual predicted and observed deposition into adjacent berths (tonnes dry solids)
Modelled Observed1 Humber Sea Terminal 537,000 192,000 South Killingholme Oil Jetty 139,000 Immingham Gas Terminal 85,000 Humber International Terminal 763,000 Immingham Bulk Terminal 1,348,000 492,000
Based upon the two locations where direct comparisons could be made (for Immingham Bulk Terminal the observed value is for 2007), the model predicted infill is 2-3 times higher than quoted values. Reasons for this difference will include (amongst others) deficiencies in a simple linear scaling of the spring-neap cycle simulated, the absence of extreme (storm) tide conditions and wave effects, the motion of ships into and out of the berths and berth occupancy, assumptions on densities, frequency (and precise locations) of maintenance dredging, and natural variability in suspended sediment concentrations in the Humber Estuary. Considering only the last item reveals year on year differences in maintenance dredging requirements of a similar order to that seen above. Given the level of uncertainty in modelled infill predictions, the predicted future changes to maintenance dredging requirements are presented as a range. It should be noted that this is good practice in sediment transport modelling and that a model predicted infill rate within a factor of 2-5 of the observed figures is not unreasonable.
3.4 MODEL RUNS
For baseline and with-scheme layouts the model was run for the conditions in Table 2. Model run 43 represents the verification run described above. The other three model runs represent sensitivity tests to waves and a high concentration run. Table 2 Model runs
Model Run Scenario 43 Spring-Neap Cycle (verified model run, no waves)
51 Sensitivity test (waves): Spring-Neap Cycle (waves generated by a 14ms-1 wind from 350° blowing for 24hrs towards the end of the simulation
52 Spring-Neap Cycle (waves generated by a 14ms-1 wind from 120° blowing for 24hrs towards the end of the simulation
53 High Concentrations
3.5 MODELLED EFFECTS OF THE ABLE MARINE ENERGY PARK (AMEP)
3.5.1 Predicted changes to sedimentation rates at existing berths Table 3 summarises the predicted changes to maintenance dredging requirements calculated on the basis of the model results. The model results are presented in Appendix 1. With the exception of one location for the high suspended sediments sensitivity test, the results indicate no predicted increases in maintenance dredging requirements at other berths as a consequence of the proposed scheme.
1 The figures reported in ABP(2008) are wet tonnes. To convert to dry tonnes, wet and dry densities of 1,300 kgm-3 and 500 kgm-3 have been assumed. The dry mass presented here assumes all of the deposited sediment is muddy. If substantial amounts of sand are present the dry mass of sediment currently dredged will be higher than that presented. This will not change the conclusions of the report.

Assessment of the effects of a proposed development on the south bank of the Humber Estuary on fine sediments
EX 6603 7 R. 9.0
Table 3 Modelled Percentage Changes to Maintenance Dredging Requirements
Verified model
(Run 43)
With waves from NW (Run 51)
With waves from SE (Run 52)
With higher SSC
(Run 53) Humber Sea Terminal -5% -5% -5% -11% South Killingholme Oil Jetty -40% -43% -45% -9% Immingham Gas Terminal -5% -9% -9% 18% Humber International Terminal -7% -8% -9% -7% Immingham Bulk Terminal -6% -6% -5% -6%
Figures 12 to 15 show the spatial distribution of the predicted increases in sedimentation for the different model runs. It can be seen that increased deposition is predicted in the berth pocket (and dock) along the front of the proposed quay, and for around 1 km upriver and downriver (landward of the quay face line). Seaward of the quay face line, increased potential for erosion is predicted on to the northwest and southeast of the scheme.
3.5.2 Predicted sedimentation rates along the intake-outfall lines Figure 16 shows predicted sedimentation along the intake-outfall lines for the model simulation with no waves (run 43). After a single spring-neap cycle, no sedimentation is predicted over the intake or outfall locations. Inshore of the outfalls, however, approximately 0.5m (assuming a dry density of 500 kgm-3) is deposited onto the E.ON transect, with 0.3-0.4m deposition being predicted on the Centrica transect. Over time and unmanaged, the intertidal profile would change. Potential longer term morphological changes are assessed in Section 3.5.3 below.
3.5.3 Predicted longer term (months) sedimentation along intake-outfall lines To gain an insight into the potential longer term development of the intertidal profile along the intake-outfall lines, the model was run for an extended duration, updating the model bathymetry before each re-running of both the 3D flow and mud transport models. This work was done for an earlier layout arrangement (Layout 1b) with the quay face located 50m seawards of the present layout (Layout 4). In addition, Layout 1b contained a chamfered shape towards the northwest end, and included a suspended deck extending for about 200m (total quay length was unchanged at 1,300m). Figure 17 shows the earlier layout arrangement (Layout 1b). Four iterations of the flow and mud transport models were undertaken. Before each subsequent iteration of the flow and sediment models, the model bathymetry was updated based on the results of the last run. Accommodating for some consolidation of materials over time, the linear scaling of results for each iteration translated into a time period of approximately six weeks. That is, after four iterations of the models, the predictions are broadly representative of deposition after an elapsed time of 24 weeks. It should be noted that including morphodynamic updating in sediment modelling introduces many uncertainties. The main objective here was to use the model to understand how the morphology might develop further in this region in response to Layout 1b, and particularly to understand at what point the morphology might reach some sort of equilibrium (and what that might be). The work is supported by a desk based assessment of changes to intertidal upriver of the HIT, discussed in Section 5.

Assessment of the effects of a proposed development on the south bank of the Humber Estuary on fine sediments
EX 6603 8 R. 9.0
Figures 18-21 show the projected deposition for each iteration (0-6 weeks, 6-12 weeks, 12 – 18 weeks, and 18 – 24 weeks) for Layout 1b. The Figures clearly show a slowing down in the predicted amount of deposition with time. Figure 22 shows a comparison of the initial and final bathymetry at this location. Figure 23a shows the predicted longer term deposition at the sites of the E.ON and Centrica intakes and outfalls. To infer longer term changes for a 50m setback layout, data was extracted from the model at 4 points located 50m seawards of the intakes and outfalls. The predicted deposition at the intakes and outfalls is sensitive to the cross-shore location of the quay and this method, although a simplification, allows one to gain information from the longer term modelling undertaken for Layout 1b and infer changes at the intakes and outfalls as a consequence of Layout 4. This assessment, in combination with the desk assessment undertaken into changes observed northwest of the Humber International Terminal, gives an indication of the possible longer term changes to morphology that will be experienced to the northwest of the AMEP. Figure 23b and Figure23c shows the longer term morphology changes extracted from points 30m and 50m seaward of the intake and outfall locations respectively. The 50m result (Figure 23c) indicates that significant infill is likely to occur at the outfalls, and particularly at the E.ON outfall. With the quay wall set further back with respect to the intake and outfall locations, the changes in morphology take longer to occur and hence by the end of the duration of the modelled evolution the infill rate at the 50m location has not yet started to reduce. However, it can be expected that the longer term changes will be similar to those of the 30m results (Figure 23b) which show a slow down after approximately 3.5m of mud infill has occurred. Overall, the inferred longer term morphology changes show little risk of sedimentation at the intakes, but a risk of significant sedimentation at the outfalls. It should be emphasised that this is inferred results from a different layout (Layout 1b) model run, and that a single (i.e., short term) spring-neap cycle run for the present arrangement of the AMEP (Layout 4) shows no sedimentation at the outfalls after that duration. Further discussion as well as a desk assessment of changes to the northwest of the HIT is presented in Chapter 5.
3.5.4 Modelled effect on suspended sediment concentrations at the Centrica and E.ON cooling water intakes This section considers how the existing background suspended sediment concentrations at the Centrica and E.ON intakes will change as a result of the proposed scheme. The existing intakes are sited at a bed level of approximately -7.5 m ODN and are approximately 2 m above the existing riverbed. The predicted changes to suspended sediment concentrations at the two intakes are shown in Figures 24 to 27. Generally the results show a 0 to 4% reduction in peak suspended sediment concentrations on the ebb tide and a 13 to 15% reduction in peak suspended sediment concentrations on the flood tide (spring tides) with much smaller changes in neap tides. The greater modelled reductions on the flood tide are probably related to the deposition that is predicted in the AMEP dredged berth pocket and surrounding areas which acts to reduce the upstream supply on the flood tide.

Assessment of the effects of a proposed development on the south bank of the Humber Estuary on fine sediments
EX 6603 9 R. 9.0
The action of waves causes a slight increase to both baseline and with-scheme concentrations at the intakes but with the same relative difference (with lower concentrations post-scheme). However, there is a risk of periodic increases in suspended sediment concentrations relating to the action of waves on more longer term (i.e. longer than a single spring-neap cycle) accumulations of sediments deposited in this region. This matter is discussed in Section 5.
4. Desk assessment of potential channel formation at proposed surface water outfall In addition to the 3D fine sediment modelling described above, a desk assessment was undertaken to assess potential channel formation (over the intertidal areas) from a proposed new drainage outfall over the intertidal mudflat to the southeast of the AMEP. The assessment was undertaken to consider only the potential impacts of scour and channel formation on the intertidal, in addition to any direct losses through the excavation required to form an initial drainage channel for a surface water drainage outfall with an invert level of 0.0m OD. This is done to inform the Environmental Statement as to the potential area of intertidal habitat that could be disturbed. This assessment points to the risk of infill of the drainage channel and potential blockage to this outfall if not maintained, but makes no assessment of these issues. It is, as such, a conservative assessment with respect to scour. It is considered likely that maintenance will be required to prevent the outfall becoming buried. The surface water runoff from the development will be collected in the network of drains behind the shoreline embankment and removed to the estuary through the pumping station proposed within the Killingholme Marshes improvement works. The pump station will discharge through concrete culverts onto the intertidal mudflat and will replace an existing single flapped outfall pipe which currently discharges onto the mudflat. Based on aerial imagery the existing flapped outfall pipe discharge does not appear to make a persistent channel on the surface of the mudflat. The outfall is tide locked and hence will only discharge when water level is high enough and tide level is low enough to allow gravity drainage. The discharge from that outfall is not known but it is understood that the magnitude of discharge from the new pumping station outfall will be significantly larger than the existing outfall and more persistent as it is pumped and hence not tide locked. The pumping station is proposed with six pump bays (Hannah Reed drawing C-204032/600, P1) and culverts running under the embankment and existing slope with rock and bitumen revetment. During low runoff events, in order to be conservative with respect to this assessment of channel formation, it has been assumed the water will be discharged through one or two of these culverts, increasing to all pumps being used at the highest expected runoff periods.

Assessment of the effects of a proposed development on the south bank of the Humber Estuary on fine sediments
EX 6603 10 R. 9.0
The estimated pumping station discharges have been provided by Hannah Reed as follows: Return Period (years) Flow (cumecs) 1:1 4.6 1:5 7.5 1:30 11.3 1:50 12.2 1:100 12.8 For purposes of estimating the potential impact of discharge on the mudflat it has been assumed the six pumps (of 2.5 cumecs each) will be capable of discharging the 1:100 year flow with some additional capacity. For the total potential impact it is necessary to include discharge from all six pumps but assessment of a single pump and culvert can be used to determine the local scour response. The invert of the culvert at 0.0 m ODN will require excavation of the fronting intertidal to create an initial drainage channel. This assessment examines the subsequent potential channel formation, based on information on pumped flow discharges given above. A potentially significant factor to note is that with the culvert invert at 0.0m OD, some 2-2.5m below present day intertidal levels, there is a risk of infill of the drainage channel and potential blockage to the outfall, unless regular maintenance is undertaken, or unless the frequency and magnitude of discharges is sufficient to maintain the drainage channel. The invert of the culvert at 0.0m ODN means the receiving condition for the pumped discharge will vary depending on the phase of the tide. During periods when the tide level is below invert the discharge will pass along the culvert and directly onto the mudflat, or into the shallow water if the tide level is only just below invert level. The energy of the flow will create scour on the mudflat in front of the culvert apron. It is assumed the flow depth at the end of the culvert can be approximated by a calculation of critical depth hc:
31
2
=
g
qhc
Where q is the flow discharge per unit width (m2/s) and g is the acceleration due to gravity (taken as 9.81 m/s2). For one pump discharging at full capacity along one culvert the critical depth at the end of the culvert is estimated to be 0.45 m. This depth is taken as the depth of flow passing from the culvert to the mudflat. The cross-section averaged speed at this location is estimated at somewhere above 2 m/s which will be capable of eroding the fine sediment of the mudflat surface. The scour associated with this flow has been estimated using CIRIA (2002, Section 4.3.7 on Circular and square culverts producing 3-D jets). The equation by Ruff et al (1982) is:
45.0
507.2
=
gD
QDYS

Assessment of the effects of a proposed development on the south bank of the Humber Estuary on fine sediments
EX 6603 11 R. 9.0
Where Ys is the depth of scour of sediment below invert level and, following the CIRIA recommended approach, D is the cross-section diameter of a circular culvert equivalent to the area of the square culvert. The discharge Q is the total discharge from the 2.4 m wide square culvert. The scour depth for 2.5 cumec flow is predicted as 1.7 m. A cutoff wall will be required projecting below the end of the culvert to prevent undermining by scour. To establish the impact of this scouring on the mudflat the length of scour hole is about 7Ys or about 12 m and the width of a single scour hole is 5Ys or about 8.5 m. On the occasion that all six pumps are discharging to accommodate the 1:100 year flow the scour holes will coalesce. Therefore the total width of the impacted area is estimated from the combined total width of the six outfall channels (17 m) plus half the width of scour at the two outer culverts at the edges. This yields a total scour width of 25.5 m and scour length of 12 m. Whilst the scour potential during periods of tidal immersion will be reduced, due to the drowned nature of the culverts, the maximum scour development of the mudflat is expected to be controlled by discharge at lower water levels. During periods with low tide level, beyond the scoured area the flow will proceed through gravity drainage to pass across the surface of the mudflat following the line of steepest slope. The location of the outfall is close to the south-west face of the AMEP quay storage and in front of the rock revetment that is placed in front of the quay wall. This means the solid structure is likely to intercept the passage of flow across the mudflat and it may then follow a path along the toe of the AMEP revetment. If the flow was unconstrained the regime channels could be estimated from the work of Blench on regime channels (Farraday and Charlton, 1983). The mean channel width B is estimated from:
5.025.050
5.014 −= SFDQB This equation is based on sand bed channels with inclusion of a cohesive bank factor (Fs = 0.3), which is appropriate for the mudflat environment at the AMEP site. Calculations of channel width are made using the total discharge from the pumping station for the range of return periods provided by Hannah Reed. The grain size D50 for the bed sediment is assumed to be silt with diameter of 20 microns. Whilst this is outside the expected limits of applicability of the equation it appears to give reasonable results in the present application for muddy sediments. The mean flow depth y in the channel of width B is estimated from:
17.050
67.038.0 −= Dqy The results for predicted channel dimensions in an unconstrained sediment bed are therefore: Return Period (years) Flow (cumecs) Mean width (m) Mean depth (m) 1:1 4.6 3.7 2.8 1:5 7.5 4.7 3.3 1:30 11.3 5.7 3.8 1:50 12.2 6.0 3.9 1:100 12.8 6.1 3.9 From this assessment a number of further considerations arise. These are discussed in Section 5 below.

Assessment of the effects of a proposed development on the south bank of the Humber Estuary on fine sediments
EX 6603 12 R. 9.0
5. Interpretation and assessment The proposed development has been modelled using a verified 3D mud transport model, and the following conclusions are made regarding the effects on fine sediments (muds).
5.1 SEDIMENTATION AND MAINTENANCE DREDGING REQUIREMENTS
Modelled baseline and post-scheme maintenance dredging requirements are presented in Section 3.5.1. By interpreting both the model predictions and observed information Tables 4 to 6 provide a range of estimates for predicted changes to maintenance dredging requirements at the AMEP and adjacent berths. For this layout, no increases in maintenance dredging requirements were predicted at neighbouring berths. Table 4 Annual Infill Estimates (Dry Tonnes / Year, Existing Case)
Lower
Estimate Upper
Estimate Humber Sea Terminal 215,000 537,000 AMEP Berthing Pocket 0 0 AMEP Dock 0 0 Region inshore of Centrica and E.ON Intake/Outfall Lines 0 0 South Killingholme Oil Jetty 56,000 139,000 Immingham Gas Terminal 34,000 85,000 Humber International Terminal 305,000 763,000 Immingham Bulk Terminal 539,000 1,348,000
Table 5 Annual Infill Estimates (Dry Tonnes / Year, Post-Development)
Lower
Estimate Upper
Estimate Humber Sea Terminal 204,000 511,000 AMEP Berthing Pocket 234,000 585,000 AMEP Dock 17,000 42,000 Region inshore of Centrica and E.ON Intake/Outfall Lines 94,000 234,000 South Killingholme Oil Jetty 31,000 77,000 Immingham Gas Terminal 31,000 77,000 Humber International Terminal 279,000 697,000 Immingham Bulk Terminal 510,000 1,274,000
Table 6 Predicted changes to Annual Infill Estimates (Dry Tonnes / Year)
Lower
Estimate Upper
Estimate Humber Sea Terminal -10,000 -25,000 AMEP Berthing Pocket 234,000 585,000 AMEP Dock 17,000 42,000 Region inshore of Centrica and E.ON Intake/Outfall Lines 94,000 234,000 South Killingholme Oil Jetty -18,000 -46,000 Immingham Gas Terminal -2,000 -4,000 Humber International Terminal -19,000 -48,000 Immingham Bulk Terminal -30,000 -74,000

Assessment of the effects of a proposed development on the south bank of the Humber Estuary on fine sediments
EX 6603 13 R. 9.0
Lower estimates were derived by dividing the lowest modelled infill rates (from Model runs 43, 51, and 52) by 2.5. This then gives estimates in accordance with the two data points (observed requirements) at Humber Sea Terminal and Immingham Bulk Terminal (see Table 1). Upper estimates were derived by taking the maximum of Model runs 43, 51 and 52. Model Run 53 is considered to be an extreme sensitivity test and has, therefore, not been included. It should be emphasised that the numbers above provide a likely range of potential future maintenance dredging requirements. In reality the actual figures will be dependent on many factors, meteorological, operational, and other, and so these remain only estimates with considerable uncertainty attached and/or annual variation. In terms of the spatial distribution of predicted increases in sedimentation, Figures 12 to 15 show that the broad patterns remain similar for each of the conditions tested.
5.2 LONGER TERM MORPHOLOGICAL CHANGE TO THE NORTHWEST OF AMEP
Section 3.5.2 showed how after a spring-neap cycle with no waves, approximately 0.3-0.5 m deposition was predicted to occur inshore of the outfalls, with little effect extending (after a spring-neap cycle) to the outfalls or intakes. Examining a longer term morphological simulation for Layout 1b (50m seaward quay face), suggests little risk of sedimentation at the intakes, but a risk of sedimentation at the outfall locations. In this section, expert geomorphological assessment techniques are applied to predict how the morphology in the vicinity of the outfalls will respond further over time and whether there are any potential adverse effects from this evolution. Unlike many development scenarios, it is fortunate that in this case further along the shoreline towards the Estuary mouth historical precedent provides useful insight as to how the intertidal area upriver is likely to respond to the proposed scheme in the absence of human intervention. The potential longer term development of the intertidal northwest of the proposed development is informed by considering the changes to intertidal profiles observed north of the Humber International Terminal (HIT). Figures 28 and 29 show the changes to intertidal profiles that were observed (based on interpretation of Admiralty Chart data) between the 1980 Admiralty Chart (surveyed 1974) which pre-dates HIT and the present-day chart surveyed which post-dates the development. Along the equivalent profile (in terms of distances upriver of HIT) to the E.ON and Centrica transects (in terms of distances upriver of the Able scheme), the morphological change appears to be an accumulation of about 1.5 m in the vertical. It is not known whether the post-HIT morphology had fully stabilised by the time of the post-HIT Admiralty Chart but nonetheless this gives an indication of the potential longer term response without intervention which is likely to affect an area of up to approximately 12 ha to the northwest of the AMEP and which may over the longer term cause sedimentation at the outfall locations. This result gives an indication of the longer term development of morphology upriver of the AMEP. The modelling for Layout 1b indicated a new equilibrium level may be reached at the outfalls after about 1 year.

Assessment of the effects of a proposed development on the south bank of the Humber Estuary on fine sediments
EX 6603 14 R. 9.0
5.3 SUSPENDED SEDIMENT CONCENTRATIONS AT THE CENTRICA AND E.ON INTAKES
The model predicts little change to concentrations during neap tides and potential reductions during spring tides. With the formation of the accumulations of sediment that are predicted to occur upriver of the proposed development, the risk of increased suspended sediment concentrations at the intakes is possible through re-suspension of the newly deposited sediments by waves and gravity flows offshore. This risk would become larger if the deposition was allowed to build up over time.
5.4 POTENTIAL CHANNEL FORMATION AT PROPOSED SURFACE WATER OUTFALL
From the results of the desk assessment present in Section 4, a number of further considerations arise. Firstly, there is a risk of channel infill and culvert blockage which may require a maintenance programme to be proposed. Secondly, the impact of the excavation required and the subsequent impact of the outfall discharge scour and channel formation on the rock revetment and quay wall will need to be considered. Thirdly, the impact of the surface outfall in producing scour and channel formation in the mudflat will vary depending on the balance between discharge from the pumping station, infill of the excavated channel when submerged by the tide, and natural variations in mudflat level. During periods of low pumped discharge and high tides sedimentation will take place to infill the scoured channel. In terms of the effects on the intertidal flats, it is expected that approximately 1 hectare of existing intertidal may be affected by the drainage channel.

Assessment of the effects of a proposed development on the south bank of the Humber Estuary on fine sediments
EX 6603 15 R. 9.0
6. References ABP, (2008). Humber Estuary Services. Humber Maintenance Dredging Baseline Document. August 2008. ABP Immingham and Grimsby, (2009). Grimsby RO-RO Berth Environmental Statement. ABPmer Report R.1506. Blench, T., (1969). Mobile Bed Fluviology, University of Alberta Press, Edmonton. CIRIA, (2002). Manual on scour at bridges and other hydraulic structures. C551, London. Farraday, R.V. and Charlton, F.G., (1983). Hydraulic factors in bridge design. Hydraulics Research Station Ltd, Wallingford. HR Wallingford, (2011a). Assessment of proposed reclamation impact on recirculation at Centrica intake/outfall. Report EX6502. HR Wallingford, (2011b). Assessment of proposed reclamation impact on recirculation at EON intake/outfall. Report EX6503. Institute of Estuarine and Coastal Studies, (2011a). South Humber Channel Marine Studies: Water & Sediment Quality. September 2010. Institute of Estuarine and Coastal Studies, (2011b). South Humber Channel Marine Studies: Bathymetry & Hydrography Survey Report. October 2010. Jeremy Benn Associates, (2011a). Able Marine Energy Park. Estuary Modelling Studies Report V4. May 2011. Jeremy Benn Associates, (2011b). Review of the Geomorphological Dynamics of the Humber Estuary V4. May 2011. Manning, A.J., (2008) The development of algorithms to parametrise the mass settling flux of flocculated estuarine sediments. In: Kusada T, Yamanishi H, Spearman J and Gailani J (eds) Sediment and ecohydraulics: INTERCOH 2005, Elsevier, Amsterdam, pp 193-2010. Munk, W., and Anderson, E. R., (1948). Notes on a theory of the thermocline. J. Mar. Res. 7: 276-295. Ruff, J.F., Abt, S.R., Mendoza, C., Shaik, A. and Kloberdanz, R., (1982). Scour at culvert outlets in mixed bed materials. Report FHWA/RD-82/011, Colorado State University (Fort Collins). Winterwerp, J.C., and van Kesteren, W.G.M., (2004) Introduction to the physics of cohesive sediment in the marine environment, Developments in Sedimentology, 56, Elsevier, Amsterdam, 2004.

Assessment of the effects of a proposed development on the south bank of the Humber Estuary on fine sediments
EX 6603 16 R. 9.0

Assessment of the effects of a proposed development on the south bank of the Humber Estuary on fine sediments
EX 6603 R. 9.0
Figures

Assessment of the effects of a proposed development on the south bank of the Humber Estuary on fine sediments
EX 6603 R. 9.0
Figure 1 Model domain and computational mesh (baseline)
Figure 2 Model bathymetry (baseline)

Assessment of the effects of a proposed development on the south bank of the Humber Estuary on fine sediments
EX 6603 R. 9.0
Figure 3 Model domain and computational mesh (with AMEP scheme)
Figure 4 Model bathymetry (with AMEP scheme)
Assessment of the effects of a proposed development on the south bank of the Humber Estuary on fine sediments
EX 6603 R. 9.0
Figure 5 Zoomed-in view of computational mesh (with AMEP scheme)
Figure 6 Model layout and bathymetry (with AMEP scheme) also showing locations of E.ON and Centrica intakes and outfalls
Proposed surface water drainage outfall
Eon Intake
Centrica Intake

Assessment of the effects of a proposed development on the south bank of the Humber Estuary on fine sediments
EX 6603 R. 9.0
0
0.2
0.4
0.6
0.8
1
1.2
1.4
1.6
1.8
2
22/05/2010 00:00 22/05/2010 12:00 23/05/2010 00:00 23/05/2010 12:00 24/05/2010 00:00 24/05/2010 12:00 25/05/2010 00:00 25/05/2010 12:00 26/05/2010 00:00
-4
-3
-2
-1
0
1
2
3
4
HR Wallingford model at ADCP1 JBA model at ADCP1 ADCP1 flow speeds ADCP1 tide levels
Figure 7 Comparison of modelled depth average flow speeds with JBA model and ADCP measured flows speeds in proximity to the E.ON intake
0
200
400
600
800
1000
1200
1400
1600
1800
1250000 1270000 1290000 1310000 1330000 1350000 1370000
Model time /s
SS
C m
g/l
-4
-3
-2
-1
0
1
2
3
4
Tid
e L
ev
el
at
Imm
ing
ha
m (
m O
D)
IECS SSC (surface)
Grimsby Obs SSC (min)
Model Run 43 - Immingham (surface)
Model Run 43 - Grimsby (surface)
Model Run 43 - Grimsby (near bed)
Tide level (m OD)
Figure 8 Comparison of modelled suspended sediment concentrations against observations made at Grimsby (ABP, 2009) and Humber Sea Terminal (IECS, 2011b) – Model Run 43 Spring Tides

Assessment of the effects of a proposed development on the south bank of the Humber Estuary on fine sediments
EX 6603 R. 9.0
0
200
400
600
800
1000
1200
1400
1600
1800
580000 590000 600000 610000 620000 630000 640000 650000 660000 670000 680000
model time /s
Ob
s S
SC
mg
/l
-4
-3
-2
-1
0
1
2
3
4
Tid
e le
vel
at I
mm
ing
ham
(m
OD
)
IECS SSC (surface)
Grimsby Obs SSC (min)
Model Run 43 - Immingham (surface)
Model Run 43 - Grimsby (surface)
Tide level (m OD)
Figure 9 Comparison of modelled suspended sediment concentrations against observations made at Grimsby (ABP, 2009) and Humber Sea Terminal (IECS, 2011b) – Model Run 43 Neap Tides
0
200
400
600
800
1000
1200
1400
1600
1800
1250000 1270000 1290000 1310000 1330000 1350000 1370000
Model time /s
SS
C m
g/l
-4
-3
-2
-1
0
1
2
3
4
Tid
e L
evel
at
Imm
ing
ham
(m
OD
)
IECS SSC (surface)
Grimsby Obs SSC (min)
Model Run 43 - Immingham (surface)
Model Run 43 - Grimsby (surface)
Model Run 43 - Grimsby (near bed)
Tide level (m OD)
Figure 10 Comparison of modelled suspended sediment concentrations against observations made at Grimsby (ABP, 2009) and Humber Sea Terminal (IECS, 2011b) – Model Run 53 Spring Tides

Assessment of the effects of a proposed development on the south bank of the Humber Estuary on fine sediments
EX 6603 R. 9.0
0
200
400
600
800
1000
1200
1400
1600
1800
580000 590000 600000 610000 620000 630000 640000 650000 660000 670000 680000
model time /s
Ob
s S
SC
mg
/l
-4
-3
-2
-1
0
1
2
3
4
Tid
e l
ev
el
at
Imm
ing
ha
m (
m O
D)
IECS SSC (surface)
Grimsby Obs SSC (min)
Model Run 43 - Immingham (surface)
Model Run 43 - Grimsby (surface)
Tide level (m OD)
Figure 11 Comparison of modelled suspended sediment concentrations against observations made at Grimsby (ABP, 2009) and Humber Sea Terminal (IECS, 2011b) – Model Run 53 Neap Tides

Assessment of the effects of a proposed development on the south bank of the Humber Estuary on fine sediments
EX 6603 R. 9.0
Figure 12 Predicted increases in potential sedimentation and erosion after a modelled spring neap cycle (Run 43)

Assessment of the effects of a proposed development on the south bank of the Humber Estuary on fine sediments
EX 6603 R. 9.0
Figure 13 Predicted increases in potential sedimentation and erosion after a modelled spring neap cycle (Run 51)

Assessment of the effects of a proposed development on the south bank of the Humber Estuary on fine sediments
EX 6603 R. 9.0
Figure 14 Predicted increases in potential sedimentation and erosion after a modelled spring neap cycle (Run 52)

Assessment of the effects of a proposed development on the south bank of the Humber Estuary on fine sediments
EX 6603 R. 9.0
Figure 15 Predicted increases in potential sedimentation and erosion after a modelled spring neap cycle (Run 53)

Assessm
ent of the effects of a proposed development on the
south bank of the Hum
ber Estuary on fine sedim
ents
EX
6603
R. 9.0
-10
-8
-6
-4
-2
0
2
0 50 100 150 200 250 300 350 400
Distance (m)
Ele
vat
ion
(m
OD
)
Centrica transect - Initial
Centrica transect - AMEP
E.ON transect - Initial
E.ON transect - AMEP
Figure 16 Transects showing model predicted sedimentation along intake/outfall lines (Model Run 43)

Assessment of the effects of a proposed development on the south bank of the Humber Estuary on fine sediments
EX 6603 R. 9.0
Figure 17 Model layout and bathymetry with earlier arrangement of AMEP scheme (Layout 1b) used for the assessment of longer term changes to morphology

Assessment of the effects of a proposed development on the south bank of the Humber Estuary on fine sediments
EX 6603 R. 9.0
Figure 18 Long term morphological prediction (Iteration 1 – bed difference after elapsed time of six weeks) – Layout 1b (50m seaward quay face with suspended deck)

Assessment of the effects of a proposed development on the south bank of the Humber Estuary on fine sediments
EX 6603 R. 9.0
Figure 19 Long term morphological prediction (Iteration 2 – bed difference between six and twelve weeks elapsed time) - Layout 1b (50m seaward quay face with suspended deck)

Assessment of the effects of a proposed development on the south bank of the Humber Estuary on fine sediments
EX 6603 R. 9.0
Figure 20 Long term morphological prediction (Iteration 3 – bed difference between twelve and eighteen weeks elapsed time) - Layout 1b (50m seaward quay face with suspended deck)

Assessment of the effects of a proposed development on the south bank of the Humber Estuary on fine sediments
EX 6603 R. 9.0
Figure 21 Long term morphological prediction (Iteration 4 – bed difference between eighteen and twenty-four weeks elapsed time) - Layout 1b (50m seaward quay face with suspended deck)

Assessment of the effects of a proposed development on the south bank of the Humber Estuary on fine sediments
EX 6603 R. 9.0
Figure 22 Initial (start of Iteration 1) and final predicted (end of Iteration 4) bathymetry for Layout 1b (50m seaward quay face with suspended deck)

Assessment of the effects of a proposed development on the south bank of the Humber Estuary on fine sediments
EX 6603 R. 9.0
-9
-8
-7
-6
-5
-4
-3
-2
-1
0
0 5 10 15 20 25
Time (weeks)
Be
d le
ve
l (m
OD
)
E.ON Outfall
Centrica Outfall
E.On lntake
Centrica Intake
Figure 23a Predicted longer term changes to morphology at intakes and outfalls (Layout 1b, 50m seaward quay face with suspended deck)
-9
-8
-7
-6
-5
-4
-3
-2
-1
0
0 5 10 15 20 25
Time (weeks)
Be
d le
ve
l (m
OD
)
E.ON Outfall
Centrica Outfall
E.On lntake
Centrica Intake
Figure 23b Predicted longer term changes to morphology at points 30m seaward of intakes and outfalls (Layout 1b, 50m seaward quay face with suspended deck)

Assessment of the effects of a proposed development on the south bank of the Humber Estuary on fine sediments
EX 6603 R. 9.0
-9
-8
-7
-6
-5
-4
-3
-2
-1
0
0 5 10 15 20 25
Time (weeks)
Be
d le
ve
l (m
OD
)
E.ON Outfall
Centrica Outfall
E.On lntake
Centrica Intake
Figure 23c Predicted longer term changes to morphology at points 50m seaward of intakes and outfalls (Layout 1b, 50m seaward quay face with suspended deck)

EX
6603
R. 9.0
Assessm
ent of the effects of a proposed development on the
south bank of the Hum
ber Estuary on fine sedim
ents
0
200
400
600
800
1000
1200
1400
1600
1800
1250000 1270000 1290000 1310000 1330000 1350000 1370000
Time (s)
Su
spen
ded
Sed
imen
t C
on
cen
trat
ion
s (m
g/l
)
-4
-3
-2
-1
0
1
2
3
4
Tid
e l
eve
l (m
OD
)
Baseline (Run 43)
AMEP (Run 43b)
Tide level (mOD)
Figure 24 Modelled changes to suspended sediment concentrations at the E.ON Intake – Spring tides

EX
6603
R. 9.0
Assessm
ent of the effects of a proposed development on the
south bank of the Hum
ber Estuary on fine sedim
ents
0
200
400
600
800
1000
1200
1400
1600
1800
580000 590000 600000 610000 620000 630000 640000 650000 660000 670000 680000
Time (s)
Su
spen
ded
Sed
imen
t C
on
cen
trat
ion
s (m
g/l
)
-4
-3
-2
-1
0
1
2
3
4
Tid
e l
ev
el (
m O
D)
Baseline (Run 43)
AMEP (Run 43b)
Tide level (mOD)
Figure 25 Modelled changes to suspended sediment concentrations at the E.ON Intake – Neap tides

EX
6603
R. 9.0
Assessm
ent of the effects of a proposed development on the
south bank of the Hum
ber Estuary on fine sedim
ents
0
200
400
600
800
1000
1200
1400
1600
1800
1250000 1270000 1290000 1310000 1330000 1350000 1370000
Time (s)
Su
spen
ded
Sed
imen
t C
on
cen
trat
ion
s (m
g/l
)
-4
-3
-2
-1
0
1
2
3
4
Tid
e l
eve
l (m
OD
)
Baseline (Run 43)
AMEP (Run 43)
Tide level (mOD)
Figure 26 Modelled changes to suspended sediment concentrations at the Centrica Intake – Spring tides

EX
6603
R. 9.0
Assessm
ent of the effects of a proposed development on the
south bank of the Hum
ber Estuary on fine sedim
ents
0
200
400
600
800
1000
1200
1400
1600
1800
580000 590000 600000 610000 620000 630000 640000 650000 660000 670000 680000
Time (s)
Su
spen
ded
Sed
imen
t C
on
cen
trat
ion
s (m
g/l
)
-4
-3
-2
-1
0
1
2
3
4
Tid
e le
vel
(m O
D)
Baseline (Run 43)
AMEP (Run 43)
Tide level (mOD)
Figure 27 Modelled changes to suspended sediment concentrations at the Centrica Intake – Neap tides

Assessment of the effects of a proposed development on the south bank of the Humber Estuary on fine sediments
EX 6603 R. 9.0
Longer term morphological change along an intertidal profile located at the same relative distance as the Centrica Intertidal Profile is located upstream of AMEP
-15
-14
-13
-12
-11
-10
-9
-8
-7
-6
-5
-4
-3
-2
-1
0
1
2
3
4
5
0 50 100 150 200 250 300 350 400 450 500
Distance offshore (m)
Be
d e
leva
tio
n (
m O
D)
Profile Along the Centrica Intake/Outfall Line
Equidistant Profile from HIT - post-HIT development
Equidistant Profile from HIT - pre-HIT development
Figure 28 Longer term potential morphological response along intake-outfall line (Centrica)
Longer term morphological change along an intertidal profile located at the same relative distance as the E.ON Intertidal Profile is located upstream of AMEP
-15
-14
-13
-12
-11
-10
-9
-8
-7
-6
-5
-4
-3
-2
-1
0
1
2
3
4
5
0 50 100 150 200 250 300 350 400 450 500
Distance offshore (m)
Bed
ele
vat
ion
(m
OD
)
Profile Along the E.ON Intake/Outfall Line
Equidistant Profile from HIT - post-HIT development
Equidistant Profile from HIT - pre-HIT development
Figure 29 Longer term potential morphological response along intake-outfall line (E.ON)

Assessment of the effects of a proposed development on the south bank of the Humber Estuary on fine sediments
EX 6603 R. 9.0

Assessment of the effects of a proposed development on the south bank of the Humber Estuary on fine sediments
EX 6603 R. 9.0
Appendices

Assessment of the effects of a proposed development on the south bank of the Humber Estuary on fine sediments
EX 6603 R. 9.0

Assessment of the effects of a proposed development on the south bank of the Humber Estuary on fine sediments
EX 6603 R. 9.0
Appendix 1 Summary of model predictions of annual accretion
Tables A1 to A3 show model predicted annual baseline and with-scheme sedimentation estimates. These have been derived by extracting model predicted sedimentation over a spring-neap cycle and linearly extrapolating up to annual values. Table A1 Modelled Annual Infill Estimates (Dry Tonnes / Year, Existing Case)
Run 43 Run 51 Run 52 Run 53 Obs2 Humber Sea Terminal 510,000 521,000 537,000 537,000 192,000 AMEP Berthing Pocket 0 0 0 0
AMEP Dock 0 0 0 0 Region inshore of Centrica and E.ON
Intake/Outfall Lines 0 0 0 0
South Killingholme Oil Jetty 115,000 129,000 139,000 100,000 Immingham Gas Terminal 77,000 82,000 85,000 73,000 Humber International Terminal 718,000 744,000 763,000 788,000 Immingham Bulk Terminal 1,284,000 1,316,000 1,348,000 1,905,000 492,000
Table A2 Modelled Annual Infill Estimates (Dry Tonnes / Year, Post-Development) Run 43 Run 51 Run 52 Run 53
Humber Sea Terminal 485,000 496,000 511,000 479,000
AMEP Berthing Pocket 545,000 564,000 585,000 792,000
AMEP Dock 39,000 40,000 42,000 64,000 Region inshore of Centrica and E.ON Intake/Outfall Lines 232,000 215,000 234,000 345,000
South Killingholme Oil Jetty 69,000 74,000 77,000 91,000
Immingham Gas Terminal 73,000 75,000 77,000 86,000
Humber International Terminal 670,000 684,000 697,000 729,000
Immingham Bulk Terminal 1,210,000 1,241,000 1,274,000 1,793,000 Table A3 Modelled Changes to Maintenance Dredging Requirements
(Dry Tonnes/ Year) Run 43 Run 51 Run 52 Run 53
Humber Sea Terminal -25,000 -25,000 -26,000 -58,000
AMEP Berthing Pocket 545,000 564,000 585,000 792,000
AMEP Dock 39,000 40,000 42,000 64,000 Region inshore of Centrica and E.ON Intake/Outfall Lines 232,000 215,000 234,000 345,000
South Killingholme Oil Jetty -46,000 -55,000 -62,000 -9,000
Immingham Gas Terminal -4,000 -7,000 -8,000 13,000
Humber International Terminal -48,000 -60,000 -66,000 -59,000
Immingham Bulk Terminal -74,000 -75,000 -74,000 -112,000
2 The figures reported in ABP(2006) are wet tonnes. To convert to dry tonnes, wet and dry densities of 1,300 kgm-3 and 500 kgm-3 have been assumed.

Assessment of the effects of a proposed development on the south bank of the Humber Estuary on fine sediments
EX 6603 R. 9.0

Assessment of the effects of a proposed development on the south bank of the Humber Estuary on fine sediments
EX 6603 R. 9.0
Appendix 2 Drawings of the existing power station intakes and outfalls (provided by E.ON and Centrica)

Assessment of the effects of a proposed development on the south bank of the Humber Estuary on fine sediments
EX 6603 R. 9.0