hrem autotuning user guide.pdf - ifm
TRANSCRIPT

DigitalMicrographHREM AutotuningUser’s Guide
Gatan, Inc.
5933 Coronado LanePleasanton, CA 94588Tel (925) 463-0200FAX (925) 463-0204
September 1999
Revision 1

Part number: 700.22026

-umes i-
tes ng.
-
er
Preface
About this Guide
This HREM Autotuning User’s Guide is written to provide procedure for the installation of the plug-in, instruction to the functions within the HREM Autotuning program, and some general tips on troubleshooting. This Guide assthe user is familiar with image acquisition and manipulation within DigitalMcrograph and only addresses those features specific to the HREM menu.
Preview of this Guide
The HREM Autotuning User’s Guide includes the following chapters:
Chapter 1, “Introduction,” summarizes the features of the software and nothe hardware and software requirements necessary to run HREM Autotuni
Chapter 2, “Diffractogram Analysis,” describes the automated diffractogramanalysis routine that is used throughout the autotuning process.
Chapter 3, “Assisted Tuning,” provides instruction for the semi-manual tun-ing procedure that precedes the automated autotuning process.
Chapter 4, “Calibrations,” describes how to calibrate the necessary micro-scope control parameters and how to load/save calibrations.
Chapter 5, “Autotuning Setup,” describes parameters that govern the autotuning process and HREM Autotuning’s interaction with the camera. Theseparameters should be set prior to running HREM Autotuning.
Chapter 6, “Autotuning,” describes the fully-automated autotuning proce-dures.
Chapter 7, “Troubleshooting,” helps you to understand and resolve a numbof problems that may occur when running HREM Autotuning.
HREM Autotuning User’s Guide Rev 1 i

ii
with any on
n
ited
Disclaimer
Gatan, Inc., makes no express or implied representations or warrantiesrespect to the contents or use of this manual, and specifically disclaimsimplied warranties of merchantability or fitness for a particular purpose.Gatan, Inc., further reserves the right to revise this manual and to makechanges to its contents at any time, without obligation to notify any persor entity of such revisions or changes.
Copyright and Trademarks
© 1999. All rights reserved.
DigitalMicrograph® is a registered trademark of Gatan. Inc., registered ithe United States.
MultiScan® is a registered trademark of Gatan. Inc., registered in the UnStates.
HREM Autotuning User’s Guide Rev 1

ail. tact
Support
Contacting Gatan Technical Support
Gatan, Inc., provides free technical support via voice, Fax, and electronic mTo reach Gatan technical support, call or Fax the facility nearest you or conby electronic mail:
• Gatan, USA (West Coast)
Tel: (925) 463 0200Fax: (925) 463 0204
• Gatan, USA (East Coast)
Tel (724) 776 5260Fax: (724) 776 3360
• Gatan, Germany
Tel: 089 352 374Fax: 089 359 1642
• Gatan, UK
Tel: 01536 743150Fax: 01536 743154
• Gatan, Japan
Tel: 0424 38 7230Fax: 0424 38 7228
• Gatan, France
Tel: 33 (0) 1 30 59 59 29Fax: 33 (0) 1 30 59 59 39
• Gatan, Singapore
Tel: 65 235 0995Fax: 65 235 8869
• Gatan Online
http://[email protected]@gatan.com
HREM Autotuning User’s Guide Rev 1 iii

iv HREM Autotuning User’s Guide Rev 1
HREM Autotuning U
Table of Contents
Preface i
Support iii
Table of Contents v
List of Figures vii
1 Introduction 1-1
1.1 HREM Autotuning Summary 1-1
1.2 Requirements 1-2
1.2.1 Microscope Requirements 1-2
1.2.2 Computer Requirements 1-2
1.3 Software Installation 1-3
1.3.1 EMControl Setup 1-3
2 Diffractogram Analysis 2-1
2.1 Key Microscope Parameters 2-3
2.2 Reduced FFT 2-5
3 Assisted Tuning 3-1
3.1 Assisted Tuning 3-1
4 Calibrations 4-1
4.1 Calibration Functions 4-1
4.2 Performing a Calibration 4-2
4.2.1 Rough Calibration 4-2
4.2.2 Focus 4-3
4.2.3 Stigmators 4-3
ser’s Guide Rev 1 v

4.2.4 Tilt 4-4
4.3 Changing a Calibration 4-5
4.4 Save and Load 4-6
5 Autotuning Setup 5-1
5.1 Introduced Tilt 5-2
5.2 Adjustment Defocus 5-2
5.3 Fitting Procedure 5-3
5.4 Camera Group 5-4
6 Autotuning 6-1
6.1 Auto Focus 6-1
6.2 Auto Stigmation 6-2
6.3 Auto Align 6-3
6.3.1 Autoalignment Process 6-4
6.4 Complete Autotuning 6-5
6.5 Tilt Tableau 6-6
7 Troubleshooting 7-1
Index I-1
vi HREM Autotuning User’s Guide Rev 1

HREM Autotuning U
List of Figures
Figure 1-1 Microscope Control Setup. 1-4
Figure 2-1 Sample diffractograms. 2-2
Figure 2-2 Microscope Info dialog. 2-3
Figure 3-1 HREM menu. 3-1
Figure 3-2 Autotuning Setup dialog. 3-2
Figure 3-3 Illumination Alignment Setup dialog. 3-4
Figure 4-1 Calibrate menu. 4-1
Figure 4-2 Microscope Calibrate dialog. 4-5
Figure 5-1 Autotuning Setup dialog. 5-1
Figure 5-2 Defocus Range dialog. 5-3
Figure 6-1 Focus Setup dialog. 6-2
Figure 6-2 Coma-free alignment (Tilt Tableaux). 6-6
ser’s Guide Rev 1 vii

viii HREM Autotuning User’s Guide Rev 1

HREM Autotuning U
1 Introduction
t-ma-yzes ch sary
sin-to-
ive, a-
ual
nd i-M
sted
ran-
l,”
HREM Autotuning (henceforth, referred to as HREM) performs three adjusments that are critical for obtaining interpretable high-resolution images: cofree axis alignment, stigmation, and focus. The software automatically analdiffractograms of an amorphous material and determines the extent by whithe pertinent imaging parameters should be changed to perform the necescorrections.1,2 The autotuning procedure only works in the high-resolution regime; low-magnification autotuning is not supported.
Full autofocus and autostigmation can be performed from the analysis of agle diffractogram. Coma-free autoalignment requires a series of four diffracgrams taken with different beam tilts to provide the computer with the necessary information for the procedure. If any of the four images is defectautoalignment cannot be expected to operate correctly. Beginning users ofHREM should, therefore, first gain experience with autofocus and autostigmtion prior to running autoalignment.
1.1 HREM Autotuning Summary
A typical tuning session at the microscope would consist of a period of mantuning, assisted by HREM, followed by HREM calibration and autotuning.
1. Assisted tuning.
Users first manually tune the microscope using the Assisted Focusing aAssisted Stigmation functions, and occasionally (if the illumination is serously misaligned) the Assisted Alignment function to the point where HREcan take over and perform the fine tuning automatically. The goal of assi
1. O.L. Krivanek and G.Y. Fan, “Complete HREM autotuning using automated diffractogram analysis,”Proc. 50th EMSA Meeting, Eds G.W. Bailey, J. Bentley, and J.A. Small, San Francisco Press, San Fcisco, 1992, Part 1, p. 96-97, and O.L. Krivanek, US patent application.
2. O.L. Krivanek and G.Y. Fan, “Application of Slow Scan CCD Cameras to On-line Microscope ControProc. 11th Pfefferkorn Meeting, Scanning Microscopy Supplement 6 (1994), 105-114.
ser’s Guide Rev 1 1-1

Requirements
the s
to-his
r
tics
a
l gs.
atan ents
tuning is to be able to generate diffraction rings that can be analyzed bysoftware. Please note that HREM only works effectively in the underfocurange of defocus.
2. Calibration.
Once you can produce rings in diffractograms, you can have HREM aumatically calibrate certain elements of the microscope control system. Tis crucial if the autotuning process is to work.
3. Autotuning.
HREM can now automatically either align or stigmate the microscope, oset its defocus to a particular value.
4. Diffractogram Analysis.
At any time, you can now check the defocus and astigmatism of the opusing the ANALYZE DIFFRACTOGRAM menu option.
In this Guide, you will learn to carry out each of these processes to achievecarefully tuned system.
1.2 Requirements
1.2.1 Microscope Requirements
• Microscope must have an external control link (typically an RS232 seriaport) that allows changes of defocus, stigmators, and beam tilt coil settin
• Gatan CCD Camera system consisting of a CCD Camera, Controller, GPCI DMA interface card, and pertinent plug-ins (see Software Requirembelow).
1.2.2 Computer Requirements
HREM can run under both Windows and the MacOS.
Hardware Requirements
• Pentium processor or PowerPC/G3 computers.
• 64+ MB of RAM.
Software Requirements
• Windows 95/98/NT 4.0 or MacOS 8.0 or later.
• DigitalMicrograph® version 3.4 or later.
1-2 HREM Autotuning User’s Guide Rev 1
Software Installation
re are
es/
-
-
ope
• Camera Plug-In 1.3.1 or later.
• EMControl 1.0.8 or later.
• HREM Autotuning 2.6 or later.
• Microscope Plug-In 1.1.0 or later.
1.3 Software Installation
There are procedures you need to complete prior to installing HREM.
Check list
- Be sure the Gatan CCD Camera and the necessary interface card/softwaproperly installed.
- Be sure you have installed DigitalMicrograph.
- See that the EMControl Plug-In is placed in the DigitalMicrograph PackagPlug-Ins folder.
HREM Installation
Drag the HREM Autotuning Plug-In and the HREM Library file into the DigitalMicrograph Packages folder (MacOS) or the Plug-In folder (Windows).
Refer to the Installation Instructions provided if necessary.
Launch DigitalMicrograph.
When properly installed, HREM will appear in the main menu of DigitalMicro-graph.
1.3.1 EMControl Setup
With EMControl installed, the link between the microscope and DigitalMicrograph is established. EMControl can interface with microscopes from the majority of electron-microscope manufacturers.
To correctly link your specific microscope, you need to select your microscfrom the Microscope Control Setup dialog.
To select microscope type
1. Choose SETUP from the MICROSCOPE menu.
This will bring up the Microscope Control Setup dialog.
HREM Autotuning User’s Guide Rev 1 1-3

Software Installation
has
m
r n-
Figure 1-1 Microscope Control Setup.
2. Input your microscope information.
3. Click OK to initialize.
A status statement will appear in the Results window indicating the link been successful.
If the link failed, you can click on the Test button for EMControl to perfora test of the link or refer to the Troubleshooting section for resolution.
Type Select Philip Basic
Port Select the serial port, Modem (COM 1 in Windows) or Printe(COM 2 in Windows), you have designated for the RS232 conector cable, which interfaces with the microscope.
Speed Default of 9600.
Data Bits Default of 8.
Parity None
Stop Bits Default of 2
1-4 HREM Autotuning User’s Guide Rev 1

HREM Autotuning U
2 Diffractogram Analysis
ach al-defo-
s are lues in
ed the a-d
d
ng EM
m Fran-
HREM is based on an automated diffractogram analysis routine1 that divides each experimental diffractogram into 32 angular segments and compares esegment with theoretical diffractograms computed for a range of defocus vues. However, only half (16) of the total segments are used for computing cus values as diffractograms are centrosymmetric and the other half is redundant.
Defocus
The theoretical diffractogram with the best fit for a corresponding segment determines the defocus value for that segment. The sixteen defocus valuefitted to the variation expected when defocus and astigmatism are the onlyimaging defects present. The average absolute deviation of the defocus vaof the sectors from the “fitted” defocus values is displayed as Fitting Error (nm) in the Results window.
Astigmatism
The astigmatism direction corresponding to the largest overfocus is displayby a line superimposed on the experimental diffractogram.The positions offirst two diffractogram rings, corresponding to the fitted defocus and astigmtism values, are shown superimposed on the diffractogram as rings of roundots. You can use these to evaluate the fit. Ιf the fitted rings do not coincide withthe experimental ones, the fit was not a good one and the fitted defocus anastigmatism values are likely to be in error.
Sample diffractograms
Below are three experimental diffractograms that were analyzed with varyidegrees of success. The diffractograms were recorded at 120 kV using a Twith a LaB6 filament.
1. G.Y. Fan and O.L. Krivanek, “Computer-Controlled HREM Alignment Using Automated DiffractograAnalysis,” Proc. 12th Int. Congress on Electron Microsc., Eds L.D. Peachey and D.B. Williams, Sancisco Press, San Francisco, 1990, 1, 532-533.
ser’s Guide Rev 1 2-1

s
rror ype eat o that
Figure 2-1 Sample diffractograms.
The first diffractogram has a very good fit. Any autotuning run that producesuch a fit should be very accurate.
The second diffractogram (borderline) has an acceptable fit, but the fitting eis much larger, mostly because the diffractogram is highly astigmatic. This tof fit still gives acceptable results, but the accuracy is poor. It is best to repthe whole autotuning procedure after the astigmatism has been corrected sa better fit can be achieved.
Good fit; fitting error = 1.43 nm
Borderline fit; fitting error = 10.2 nm
Bad fit:fitting error = 25 nm
2-2 HREM Autotuning User’s Guide Rev 1
Key Microscope Parameters
e s”
ct
a
s.
ti-
have
In the last case (bad), the astigmatism is large enough to produce a MaltesCross type of diffractogram and the fit fails completely. The theoretical “ringshow no correspondence to the actual diffractogram intensity distribution, which results in a very high fitting error. With a fit of this type, you can expecompletely spurious results.
2.1 Key Microscope Parameters
Users need to supply the following microscope parameters prior to runningdiffractogram analysis:
• The spherical aberration coefficient, Cs, of the microscope objective len
• The beam energy of the microscope.
There is no need to fill in the Indicated Magnification field as this is automacally read from the microscope every time an image is acquired.
To input microscope parameters
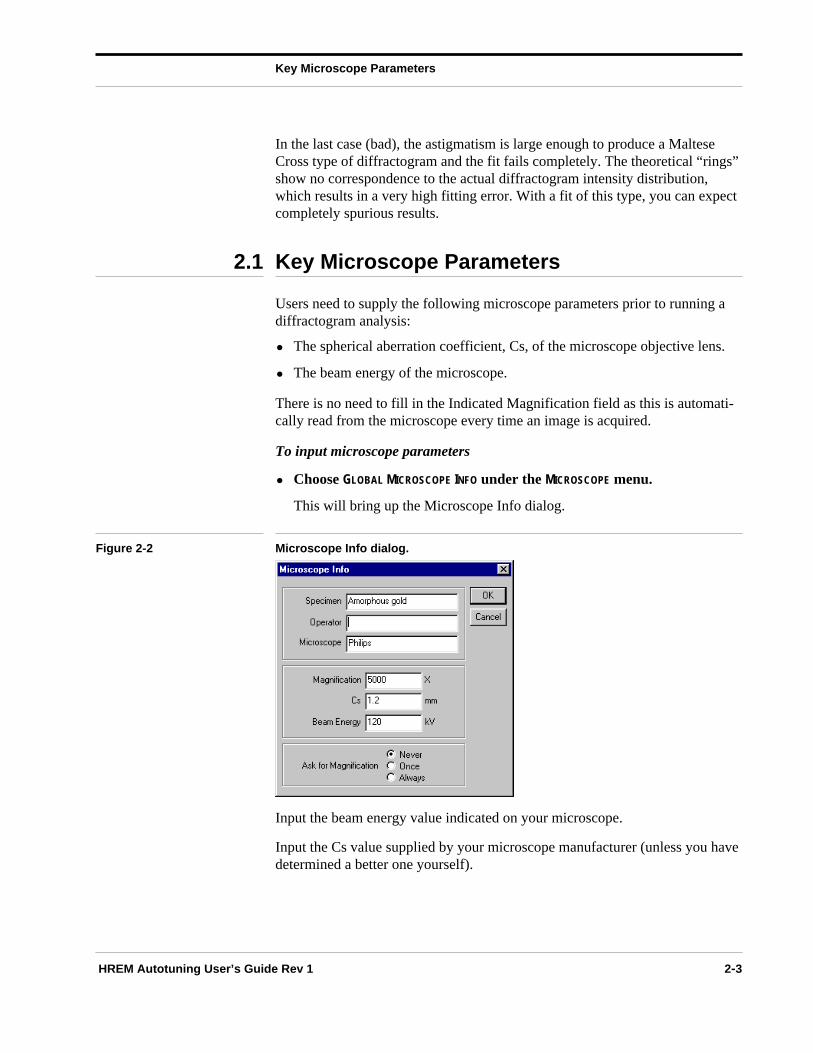
• Choose GLOBAL MICROSCOPE INFO under the MICROSCOPE menu.
This will bring up the Microscope Info dialog.
Figure 2-2 Microscope Info dialog.
Input the beam energy value indicated on your microscope.
Input the Cs value supplied by your microscope manufacturer (unless you determined a better one yourself).
HREM Autotuning User’s Guide Rev 1 2-3
Key Microscope Parameters
yed r ence a-
: (1) e to
e of
ful if
ely on lity ne
fol-
tage en
Magnification Calibration
The actual magnification at the CCD camera is not the same as that displaby your microscope. You need to perform a magnification calibration of youmicroscope to determine the actual magnification and set up the correspondbetween the indicated and the actual magnifications. Refer to the “Magnifiction Correction” section in the MSC Family Software User’s Guide.
The discrepancies between indicated and true magnification arise becausethe camera is not located at the photographic-film position; (2) the nominalmagnification values displayed by the microscope are typically only accurat±10%.
Errors in the defocus and astigmatism values are proportional to the squarthe magnification calibration error. If this is moderate in size (~2− 10% say), then the diffractogram analysis is likely to succeed and the fitted rings will probably resemble the experimental ones. HREM is unlikely to be successold calibration values determined at an incorrect magnification are used.
The successful outcome of the autoalignment procedure also depends largthe accuracy of the magnification calibration, which affects directly the quaof the diffractograms. Correct magnification calibration is essential and is oof the first things you need to check if the autotuning starts to go awry.
Caution
Microscope magnification is likely to change whenever you do either of thelowing:
• Vary the Z distance of the specimen appreciably, resulting in a change of the objective lens current when you refocus.
The magnification percentage change will be roughly the same as the percentage change of the objective lens current.
• Vary the accelerating voltage without changing any lens currents.
The magnification percentage change will be roughly one half of the percentage change of the accelerating voltage.
For accurate results, make sure that you don’t change the accelerating voland keep the specimen height constant. If you are going to vary the specimheight, at least monitor the objective lens current to know by how much themagnification changes in the process.
2-4 HREM Autotuning User’s Guide Rev 1

Reduced FFT
ld com-pre-
f .
ain
2.2 Reduced FFT
The USE REDUCED FFT option will create faster and smaller diffractograms for analysis.
USE REDUCED FFT specifies that only the central part of the diffractogram shoube computed. This is done by reducing the size of the image by 2x prior to puting the fast Fourier transform (FFT). The result is a diffractogram that is cisely equal to the central 25% of a full-size diffractogram.
USE REDUCED FFT is useful in the common situation where all the interesting information in a diffractogram is contained within its central half and a lot otime would be needlessly wasted if a full-size diffractogram were computed
If Binning is available on your camera, select Binning by a factor of 2 to obta FFT similar to one resulting from the USE REDUCED FFT option, but in less time and with less noise.
HREM Autotuning User’s Guide Rev 1 2-5

Reduced FFT
2-6 HREM Autotuning User’s Guide Rev 1

HREM Autotuning U
3 Assisted Tuning
’s
ent o a
When the HREM Autotuning and Camera plug-ins are in DigitalMicrographPackages/Plug-Ins folder and the camera is switched on, HREM will appear in DigitalMicrograph’s menu bar.
Figure 3-1 HREM menu.
3.1 Assisted Tuning
HREM provides options to assist you with the focus, stigmation, and alignmof your microscope. The goal of assisted tuning is to tune the microscope tpoint where fine tuning by HREM can take place.
ser’s Guide Rev 1 3-1

Assisted Tuning
-
run. not
of the
the
tings
Assisted Focusing
Selecting ASSISTED FOCUSING prompts the camera repeatedly to acquire a “live image” (using the currently specified acquisition time) and display the corresponding computed diffractogram as the user manually focuses.
Press the Up and Down arrow keys to vary the acquisition time during the Varying the acquisition time must be carried out on the frontmost image andits FFT.
Stop the process (by pressing the Space bar) and you can evaluate the fit diffractogram and then resume Assisted Tuning until an acceptable fit is obtained. Stopping the process using the Space bar must be carried out onfrontmost image.
Recommended image settings
The size of the image and the computed diffractogram depends on the setspecified in the Autotuning Setup dialog and on whether or not USE REDUCED FFT is selected.
To choose an image size
• Choose AUTOTUNING SETUP under the HREM menu.
This will bring up the Autotuning Setup dialog.
Figure 3-2 Autotuning Setup dialog.
3-2 HREM Autotuning User’s Guide Rev 1

Assisted Tuning
r a
or
ge the r
tilt
Specify the desired CCD area under the Camera group.
Choose a Binning factor to determine the final image size.
For greatest speed:
• Use 256 x 256 pixel images with 128 x 128 diffractograms (With USE REDUCED FFT).
For greatest visual impact:
• Use 512 x 512 images and diffractograms.
For most applications:
• Use 512 x 512 images with 256 x 256 diffractograms.
• Or 256 x 256 images and diffractograms.
Recommended settings are shown in bold in the table below.
Assisted Stigmation
ASSISTED STIGMATION works much like ASSISTED FOCUSING, except every second dif-fractogram is shown rotated by 90°. This rotation helps you decide whethediffractogram is round (no astigmatism) or elliptical (astigmatism present).
You must manually adjust the microscope controls to correct the stigmationfocus in this mode.
Assisted Alignment
ASSISTED ALIGNMENT is similar to ASSISTED STIGMATION, but the beam is tilted by a plus and minus amount from image to image. The computer is able to chanthe microscope tilt via remote control of the microscope made possible by EMControl Plug-In. Consult the Troubleshooting section in this Guide if youcomputer and microscope are having communication problems.
The goal of ASSISTED ALIGNMENT is to make the “+” and “-” diffractograms look the same by varying the illumination direction using the microscope beam-
Table 3-1 Recommended image sizes settings.
ActualMagnification
AcquisitionSize
SetupBinning Image Size
FFTFull
SizeReduced
100,000 - 300,000
256 x 256 1 256 x 256 256 x 256 -
400,000 - 700,000
512 x 512 1024 x 1024
2 256 x 256512 x 512
256 x 256512 x 512
128 x 128
800,000 and above
1024 x 1024 4 256 x 256 256 x 256 128 x 128
HREM Autotuning User’s Guide Rev 1 3-3
Assisted Tuning
ion
-t
hat d ion
lt
controls. When the two diffractograms look the same, the central “0” directof the beam will be aligned with the true optic axis, which is typically a few mrads different from the current or the voltage center of the microscope.
Before you use ASSISTED ALIGNMENT, make sure that the pivot point of your microscope tilt coils has been correctly set such that the illumination spot will nodeviate when the beam is tilted.
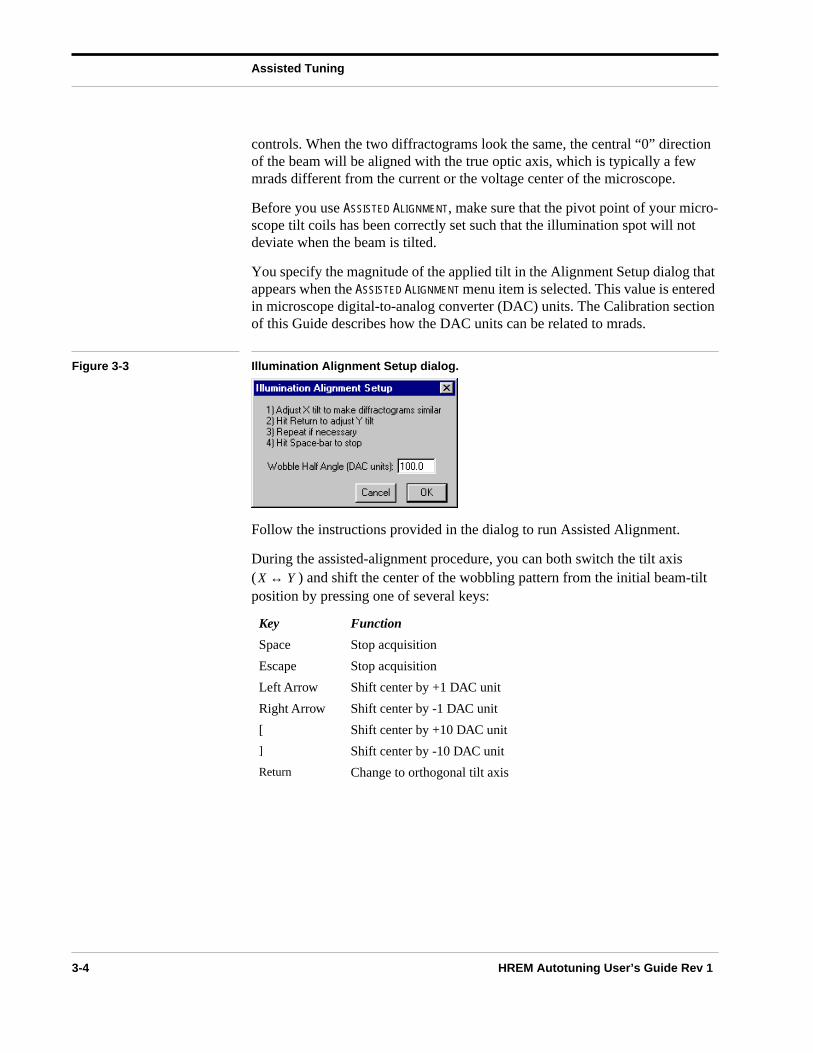
You specify the magnitude of the applied tilt in the Alignment Setup dialog tappears when the ASSISTED ALIGNMENT menu item is selected. This value is enterein microscope digital-to-analog converter (DAC) units. The Calibration sectof this Guide describes how the DAC units can be related to mrads.
Figure 3-3 Illumination Alignment Setup dialog.
Follow the instructions provided in the dialog to run Assisted Alignment.
During the assisted-alignment procedure, you can both switch the tilt axis ( ) and shift the center of the wobbling pattern from the initial beam-tiposition by pressing one of several keys:
Key Function
Space Stop acquisition
Escape Stop acquisition
Left Arrow Shift center by +1 DAC unit
Right Arrow Shift center by -1 DAC unit
[ Shift center by +10 DAC unit
] Shift center by -10 DAC unit
Return Change to orthogonal tilt axis
X Y↔
3-4 HREM Autotuning User’s Guide Rev 1
HREM Autotuning U
4 Calibrations
ons
t
The first step in the automated autotuning procedure is to perform calibratiof certain microscope control parameters.
4.1 Calibration Functions
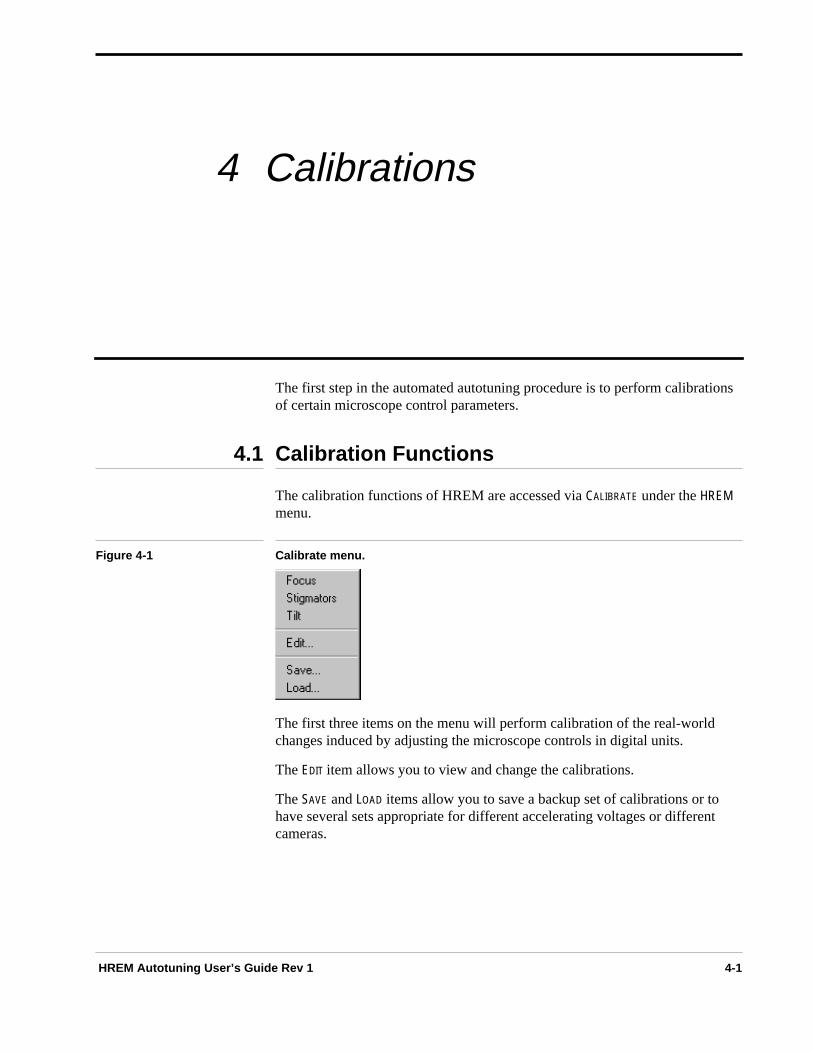
The calibration functions of HREM are accessed via CALIBRATE under the HREM menu.
Figure 4-1 Calibrate menu.
The first three items on the menu will perform calibration of the real-world changes induced by adjusting the microscope controls in digital units.
The EDIT item allows you to view and change the calibrations.
The SAVE and LOAD items allow you to save a backup set of calibrations or to have several sets appropriate for different accelerating voltages or differencameras.
ser’s Guide Rev 1 4-1

Performing a Calibration
t in the se,
focus e o that
kx
e or is
re is d cal-e
Cali-n ct is edure
4.2 Performing a Calibration
Prior to running a new calibration:
1. Ensure that you can acquire and analyze an acceptable diffractogram using one of the assisted tuning commands.
2. Check that you are at underfocus.
Make sure the diffractogram ring diameters get smaller when the currenthe objective lens of the microscope is decreased (typically by rotating objective lens focus knob counterclockwise). If the ring diameters increayou are at overfocus and you need to go to the other side of Gaussian (minimum contrast). To make this change, adjust the defocus so that thrings become so large that they disappear, and then change it further sthe rings reappear with the correct defocus sign.
3. Use a magnification at which the diffractograms can be analyzed.
In order for HREM to run optimally, the largest ring in the diffractogram should extend no more than 50–70% of the distance to the edge of the image. This typically requires a magnification of approximately 200–300at the CCD if 1x Binning (or USE REDUCED FFT) is used, and 400–800 kx if 2xor 4x Binning is used. Use of Binning increases the effective pixel size.
4. After a change of microscope magnification, verify that the images are still correctly calibrated.
Use the ROI Line tool and measure a known distance on either an imagits FFT. Verify its calibrated length (as displayed in the Control window)as expected.
4.2.1 Rough Calibration
When running a calibration, an indispensable part of the calibration proceduestimating the amount by which to change each parameter. If there is an olibration available in the Microscope Calibrations dialog (See Figure 4-2), thprogram uses the old value as a starting point.
If the parameter has never been calibrated (value of “0” in the Microscope brations dialog), the program adopts a “cautious” approach and proceeds iincremental one-count DAC steps to calculate the resultant effect. If the effetoo small to be measured accurately, the increment is doubled and the procis repeated until a significant change is produced.
4-2 HREM Autotuning User’s Guide Rev 1

Performing a Calibration
by a
lens,
ital-
ility ay
s e ter-
at as a
d
4.2.2 Focus
The Focus calibration determines the focus change in nanometers inducedsingle digital-count change in the objective-lens current.
To calibrate focus
• Choose FOCUS under CALIBRATE in the HREM menu.
To perform the focus calibration, HREM:
- Performs a rough calibration.
- Acquires an image and determines its defocus.
- Then changes the defocus by changing the current in the objective and acquires and analyzes another image.
- Computes the focus calibration as the change in defocus (nm) per digcount change in the defocus.
- Displays the calibration in the Results window.
4.2.3 Stigmators
The X and Y stigmators are calibrated independently to allow for the possibof a difference in the strength of the coils and for the possibility that they mnot be orthogonal.
The effect of the stigmators is directional and the autotuning algorithm takethis into account by describing the effect using vectors in the complex plan(see reference in Ch. 1). The stigmator calibration procedure consists of demining the “real” and “imaginary” components (r and i) of these vectors.
After a successful calibration, the X and Y vectors should be approximately90° to each other and have similar magnitudes. This property can be usedcheck of the quality of the calibration.
To calibrate the stigmators
• Choose STIGMATORS under CALIBRATE in the HREM menu.
To perform the stigmator calibrations, HREM:
- Performs a rough calibration.
- Acquires an image and analyzes it to determine its astigmatism.
- Changes the X stigmator by a number of DAC units and acquires ananalyzes a second image.
HREM Autotuning User’s Guide Rev 1 4-3

Performing a Calibration
r
ibra-
he
the eds
oint the
eral stig-
on
sm.
ess -169. c-
88),
- Calculates the X-stigmator calibration as the astigmatism change peDAC unit change in the stigmator-coil current.
- The Y-stigmator is then calibrated in the same way. The resulting caltions are written to the Results window.
4.2.4 Tilt
The purpose of the Tilt calibration is to ensure that the tilt change used in tautoalignment procedure, specified in the Autotuning Setup dialog, can beentered in mrad rather than DAC units.
The autoalignment procedure automatically accounts for the orientation of beam-tilt coils. This means that only the strength of the X and Y tilt coils neto be calibrated and the tilt calibrations are, therefore, scalars.
Before running this calibration, make sure the microscope beam-tilt pivot pis set to coincide with the sample—no beam shift should result when tiltingbeam —and that the microscope is roughly aligned to its voltage center.
The autoalignment is not sensitive to errors in the tilt calibration of up to sevtens of percent, which makes this calibration less critical than the focus andmator calibrations.
To calibrate tilt
• Choose TILT under CALIBRATE in the HREM menu.
To perform the tilt calibrations, HREM:
- Performs a rough calibration.
- Acquires and analyzes an image.
- Tilts the beam by ±tilt (mrad) in x to determine the x calibration.
- Tilts the beam by ±tilt (mrad) in y to determine the y calibration.
- Tilts the beam ±tilt / in x, y simultaneously to determine the directiof the y tilt with respect to the x tilt.1, 2
Using this technique, the tilt-calibration algorithm can give good resultseven if the illumination is misaligned and there is strong 3-fold astigmati
1. O.L. Krivanek, “EM Contrast Transfer Functions for Tilted Illumination Imaging,” Proc. 9th Int. Congron Electron Microscopy., Ed. J.M. Sturgess, Microscopical Society of Canada, Toronto, 1978, 1, 168
2. O.L. Krivanek, “Practical high-resolution electron microscopy.” in: High-Resolution Transmission Eletron Microscopy, eds. P.R. Buseck, J.M. Cowley and L. Eyring (Oxford University Press, Oxford, 19519-567.
2
4-4 HREM Autotuning User’s Guide Rev 1

Changing a Calibration
an tch fits.
lues runs the -
o . If uble-
ose the
Pointers for tilt calibration
If the illumination is substantially misaligned, the tilt-calibration procedure clead to “Maltese Cross” diffractograms and spurious results. Therefore, wathe procedure carefully and make sure that all the diffractograms have goodIf a bad fit occurs, press the Space bar to terminate the procedure.
The tilt-calibration procedure becomes more robust at larger underfocus vaand smaller introduced tilts. It becomes most accurate at an underfocus ofaround 2.5x Scherzer defocus and tilt angles of 3–5 mrad. If the procedureinto trouble, decrease the magnitude of the introduced tilt by about 30% (inAutotuning Setup dialog) and try running it again. If Maltese Cross diffractograms occur even then, try making the Adjustment defocus more negative.
An excellent way to make sure that any calibration value is dependable is tsimply run the calibration of each new parameter a few times in successionthe values are not reproducible to within 10% in separate runs, consult Troshooting at the end of this Guide.
4.3 Changing a Calibration
The Edit option allows you to view and edit your calibrations.
To edit calibrations
• Choose EDIT under CALIBRATE in the HREM menu.
This will bring up the Microscope Calibration dialog.
Figure 4-2 Microscope Calibrate dialog.
The calibrations for focus and tilt are independent of magnification while thfor stigmation will change if the image is rotated (which may happen when magnification is changed).
HREM Autotuning User’s Guide Rev 1 4-5
Save and Load
f ee
ly.
e this ntal by
-
ion. u exit
HREM creates an internal table of the stigmator calibrations as a function omagnification. When you bring up the Microscope Calibrations dialog, you sthe calibration values for defocus, tilt, and the stigmators. A label appears beside the latter to show you the indicated magnification to which they app
If any of the parameter fields in the Calibrations dialog shows only zeros, thsoftware takes it to mean that the calibration has never been performed. Incase, a rough calibration is performed to determine the size of the incremecalibrating steps. You can force the software to do a rough calibration first typing in zeros in the appropriate fields in the dialog box.
4.4 Save and Load
The SAVE and LOAD options allow you to save and load backup sets of calibrations appropriate for different accelerating voltages or different cameras.
DigitalMicrograph “remembers” the calibration values from session to sessAny new values obtained during a current session are saved at the time yoDigitalMicrograph or when you choose the SAVE option. Take care to store yourfavorite set of calibrations in a safe place.
4-6 HREM Autotuning User’s Guide Rev 1

HREM Autotuning U
5 Autotuning Setup
ers ment ted era
The calibration and autotuning functions of HREM require several parametto be set before you proceed. These relate to the tilt introduced in the alignprocedure, the procedure used in analyzing the diffractograms, the automadetermination of the defocus during the diffractogram analysis, and the camparameters, which determine the ultimate size of the diffractograms. Theseparameters are all set in the Autotuning Setup dialog box.
Figure 5-1 Autotuning Setup dialog.
ser’s Guide Rev 1 5-1
Introduced Tilt
tion ated
e
r-es if nd
e plied
tion
tun-
nd it
e-ed , rou-ed ctive tion
h of
5.1 Introduced Tilt
The Introduced Tilt group contains the parameters of Magnitude and Direcfor the tilt introduced to cause a change in the astigmatism during the automalignment procedure. This tilt change is used to calculate the position of thcoma-free axis of the system.
Initially, try a small tilt magnitude of 1–2 mrad. Match this with a large undefocus of around times the Scherzer value. These are appropriate valuthe alignment is poor. Additional discussion of the introduced tilt can be fouin Section 6.3.
Enter an initial tilt direction; additional tilts are at 180°, 90°, and 270° to thefirst. Being able to vary the direction of the tilts is useful for verifying that thdetermined coma-free direction does not depend on the direction of the aptilt.
5.2 Adjustment Defocus
The Adjustment Defocus group of items concerns the automatic determinaof the defocus during the autostigmation and autoalignment procedures.
Defocus
The value of Defocus specified here will be used in the calibration and autoing procedures for the tilt and stigmation.
The optimal value of Defocus is one that produces the best diffractograms adepends on the beam voltage and the Cs of your microscope.
In HREM, we adopt the convention whereby a negative defocus value corrsponds to an underfocus condition (weakened objective lens). Underfocusdiffractograms extend to higher spatial frequencies than overfocused oneswhich makes the analysis more accurate. However, the automatic analysistine may sometimes confuses overfocused diffractograms with underfocusones. It is therefore best to consistently stay in the underfocus regime (objelens focus knob rotated counter-clockwise from the minimum contrast posion most microscopes).
A Defocus value of about 3x Scherzer is a good starting point.
Verify Defocus
Selection of this option will insert an extra step into the autostigmation andautoalignment procedures whereby a diffractogram is recorded prior to eac
13
5-2 HREM Autotuning User’s Guide Rev 1

Fitting Procedure
focus
sure om
utine.
rac-ore
range. will
of dif-
the procedures. The extra diffractogram is used to measure the current debefore setting it to the value specified in the Defocus field.
If you want the autotuning to be more robust, make sure Verify Defocus is selected and the value in the Defocus field produces good diffractograms.
If you want the autotuning to be faster, deselect Verify Defocus. But, make you have an optimal Defocus value that will give you good diffractograms frwhich to run the analyses.
Set Limits
Clicking on the Set Limits button brings up a dialog that allows you to set arange of defocus values for use by the automated diffractogram analysis ro
Figure 5-2 Defocus Range dialog.
Initially, select a range that corresponds to the defocus values you use in ptice, plus a safety margin. Then fine tune the range after you have gained mexperience with the autotuning routine.
Suitable default values to use are:
- 0 to -600 nm at 100 kV
- 0 to -400 nm at 200 kV
- 0 to -300 nm at 300 and 400 kV.
The step size should be such that there are approximately 400 steps in the A smaller step size may slightly increase the precision of the analysis, but itsignificantly slow it down.
5.3 Fitting Procedure
The Fitting Procedure group contains parameters that govern the analysis fractograms.
HREM Autotuning User’s Guide Rev 1 5-3

Camera Group
n-
ed.
ur-ure.
en
for
r in p dia-
a ont ROI ains rea
Compute 3-Fold Astigmatism
When selected, the 3-fold astigmatism will be measured during the autoaligment procedure and its value written to the Results window.
Warning Limit
If during a calibration/autotuning procedure, the diffractogram fitting error exceeds the threshold limit set in this field, then a warning dialog is display
If the last-displayed diffractogram fit looks good, click OK to continue the crent procedure. If the fit looks questionable, click Cancel to abort the proced
Start with a Warning Limit of 10 nm. If the warning consistently comes up evwhen the diffractograms have been fitted well, increase the limit.
If incorrect diffractogram fits pass by undetected, decrease the limit.
5.4 Camera Group
The Camera group contains controls for Exposure, CCD area, and BinningHREM acquisitions.
In HREM, the final image size at the CCD is controlled by the Binning factothis group. These values are independent of those set in the Camera Setulog and are used only by the HREM package.
If the active (frontmost) image was acquired with the camera and contains square region of interest (ROI), then the Camera setup is taken from this frimage. The binning and exposure are read directly from the image and theis taken to be the region of the CCD selected. In this way, if an image contcrystalline and amorphous regions of the specimen, you can select a sub-acontaining only amorphous material for your calibration and/or tuning.
5-4 HREM Autotuning User’s Guide Rev 1

HREM Autotuning U
6 Autotuning
ntrol re the t of ed
t the s tem-
thly, an ake
hing ere
ire.
Each automated tuning procedure requires that the relevant microscope cobe calibrated before tuning can proceed. If you start an autotuning proceduand the calibration has not been done, then HREM will begin by calibratingrelevant control. If you either explicitly calibrate an adjustment or load a secalibrations from file before proceeding, then no calibration will be performautomatically.
Before running a tuning procedure, it is a good idea to check that AssistedFocusing produces underfocused diffractograms with at least two rings, thamagnification of the image is calibrated, and that the microscope kV and Chave been correctly specified. You can check for underfocus by decreasingporarily the objective lens current. If the lens is underfocused, diffractogramrings will become smaller.
As an additional reassurance that diffractogram analysis will proceed smooyou may want to try analyzing a diffractogram of a high-resolution image ofamorphous material whose magnification has been calibrated. To do this, msure the diffractogram is the frontmost image. Then choose ANALYZE DIFFRACTO-
GRAM on the HREM menu.
As tuning proceeds, you can monitor the progress of the algorithm by watcthe Results window. Intermediate steps in the procedure are summarized hand the communication between the computer and microscope is listed.
6.1 Auto Focus
HREM can automatically set the microscope defocus to any value you des
ser’s Guide Rev 1 6-1
Auto Stigmation
fer ase
ed
uto-r.
it e om
ill g at
ig-
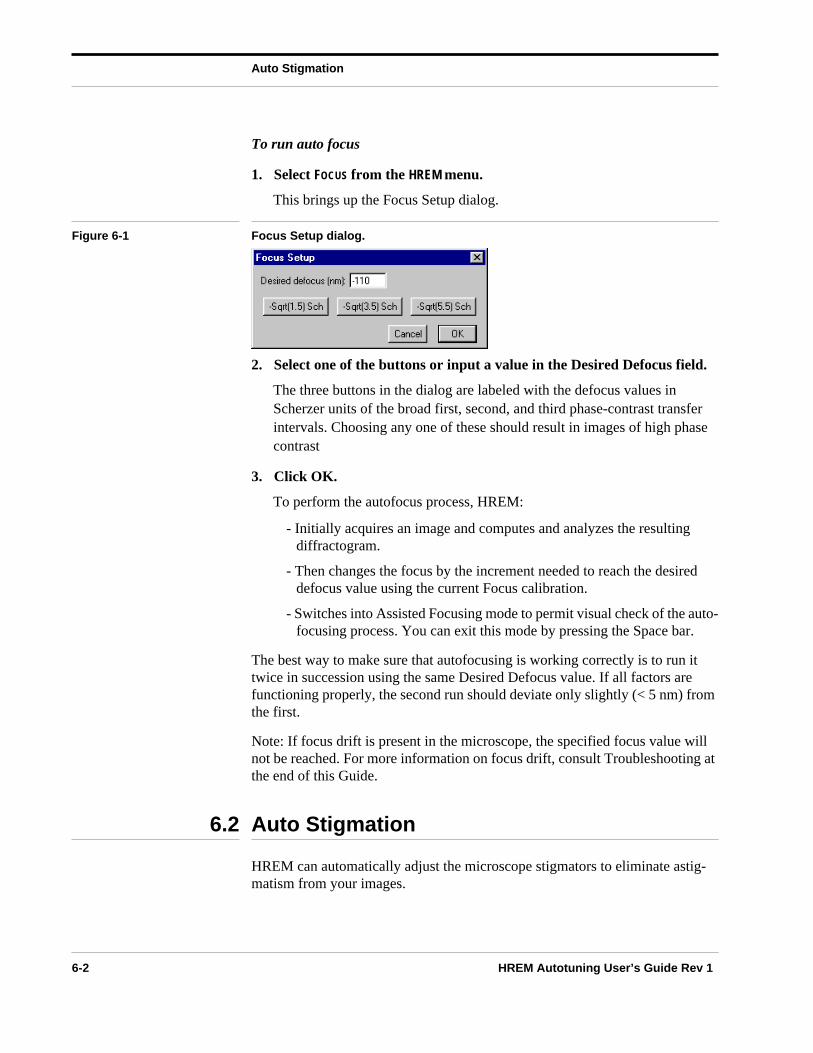
To run auto focus
1. Select FOCUS from the HREM menu.
This brings up the Focus Setup dialog.
Figure 6-1 Focus Setup dialog.
2. Select one of the buttons or input a value in the Desired Defocus field.
The three buttons in the dialog are labeled with the defocus values in Scherzer units of the broad first, second, and third phase-contrast transintervals. Choosing any one of these should result in images of high phcontrast
3. Click OK.
To perform the autofocus process, HREM:
- Initially acquires an image and computes and analyzes the resultingdiffractogram.
- Then changes the focus by the increment needed to reach the desirdefocus value using the current Focus calibration.
- Switches into Assisted Focusing mode to permit visual check of the afocusing process. You can exit this mode by pressing the Space ba
The best way to make sure that autofocusing is working correctly is to run twice in succession using the same Desired Defocus value. If all factors arfunctioning properly, the second run should deviate only slightly (< 5 nm) frthe first.
Note: If focus drift is present in the microscope, the specified focus value wnot be reached. For more information on focus drift, consult Troubleshootinthe end of this Guide.
6.2 Auto Stigmation
HREM can automatically adjust the microscope stigmators to eliminate astmatism from your images.
6-2 HREM Autotuning User’s Guide Rev 1

Auto Align
the
to the e
ons.
n .
the
be fine
h-
n-
e
s
ess -169. c-88),
To correct for astigmatism
• Select STIGMATE from the HREM menu.
If Verify Defocus is set in the Autotuning Setup dialog (see Figure 5-1), auto-stigmation procedure will progress as follows:
- HREM takes an image; calculates the defocus; changes the defocus Adjustment value; takes another image; analyzes it and stigmates thmicroscope as needed using the current stigmator X and Y calibrati
- HREM then resets the focus back to the original value and enters Assisted- Focusing mode to allow for a visual check of the stigmatioprocess. You can exit Assisted Focusing by pressing the Space bar
If Verify Defocus is off, HREM simply records a diffractogram without changing anything; analyzes it; sets astigmatism to zero; and goes intoAssisted-Focusing mode.
6.3 Auto Align
A small misalignment of the illumination direction and the optic axis of the objective lens can cause an apparent defocus and astigmatism, which cancorrected without correcting the misalignment and still result in apparently diffractograms.
The misalignment, however, induces coma, which generates artifacts in higresolution images. The illumination direction must be aligned with the opticaxis of the objective lens in order to produce coma-free images. HREM canautomatically align the beam with the optic axis of the objective lens.
To align the beam
• Select ALIGN from the HREM menu.
If Verify Defocus is selected in the Autotuning Setup dialog, the autoaligment procedure will progress as follows:
- HREM records an image; analyzes it; and changes the defocus to thuser-specified Adjustment value.
- Next, it decreases the focus by (-2Cs t2) to counteract the increase in apparent defocus1, 2 that comes from tilting the beam by |t| and record
1. O.L. Krivanek, “EM Contrast Transfer Functions for Tilted Illumination Imaging,” Proc. 9th Int. Congron Electron Microscopy., Ed. J.M. Sturgess, Microscopical Society of Canada, Toronto, 1978, 1, 168
2. O.L. Krivanek, “Practical high-resolution electron microscopy.” in: High-Resolution Transmission Eletron Microscopy, Eds. P.R. Buseck, J.M. Cowley and L. Eyring (Oxford University Press, Oxford, 19519-567.
HREM Autotuning User’s Guide Rev 1 6-3

Auto Align
the
t to
of
eater, re
best ound
-s the
mined
[3] by vari-bled ”
5,
s 972-
and analyzes the diffractograms for the +t and -t beam tilts, first in the direction specified by the Tilt Direction, then at right angles to it.
- HREM enters Assisted-Focusing mode to allow for a visual check of alignment process.
If Verify Defocus is off in the Autotuning Setup dialog, the autoalignmenprocedure goes straight to the beam-tilt correction procedure and then Assisted-Focusing mode for visual monitoring.
Tilt Magnitude
The magnitude of the introduced tilt t is determined by the Magnitude field the Introduced Tilt group of items of the Autotuning Setup dialog. Its value should be large enough to produce a change in astigmatism of 20 nm or grbut not so large that the diffractograms from the tilted illumination images ano longer analyzed accurately.
When the alignment is a long way off, as may happen when starting up, it isto use a small tilt value of the order of 1–2 mrad and a large underfocus (ar
Scherzer). This will make the procedure more robust. Then you can progress on to a higher tilt value and smaller defocus (3 to 5 mrad and toScherzer), which make the procedure less robust, but more sensitive.
Tilt Direction
The direction of the first tilt can be entered in the Direction field of the Introduced Tilt group of items of the Autotuning Setup dialog. The additional tiltare at 180°, 90°, and 270° to the first tilt. Being able to vary the direction oftilts is useful for verifying that the determined coma-free direction does notdepend on the direction of the applied tilt.
6.3.1 Autoalignment Process
The autoalignment uses a 4-tilt procedure that aligns the illumination to thecoma-free axis even in the presence of substantial three-fold astigmatism.3 There are two ways to use the values of the defocus and astigmatism deterfor the four tilts to find the coma-free center.4 The first way is to examine the tilt-induced astigmatism variation (TIA) and to use Formula 17 (in referenceof this chapter) to find the coma-free axis. This is the default method used Gatan autoalignment. The second way is to examine the tilt-induced focusation (TIF) and to use formula (20) in reference [3]. This option can be enaby setting the global tag “HREM Autotuning:Setup: Auto Alignment Method
3. O.L. Krivanek, “Three-fold Astigmatism in High-Resolution Electron Microscopy”, Ultramicroscopy 51994, 419-433.
4. O.L. Krivanek and M.L. Leber, “Three-Fold Astigmatism: An Important TEM Aberration,” Proceeding51st MSA meeting, Eds G.W. Bailey and C.L. Rider, San Francisco Press, San Francisco, 1993, p. 973.
135 7
6-4 HREM Autotuning User’s Guide Rev 1

Complete Autotuning
y frac-s
r to
ould -ee
re the
out-very
to
t y
rise cro-t be
the ible
nder-
ress
n
Pro-, 1993,
to “TIF.” Refer to the DigitalMicrograph User’s Guide for information on set-ting the tags.
The TIA method is not upset by focus instabilities, such as those caused bsmall high tension (HT) jumps. On the other hand, this method requires diftograms of slightly better quality than TIF. TIA is best suited to microscopewith field-emission gun operating at any voltage, and microscopes with LaB6 filament operating at 300 kV and higher, at which good HT stability is hardeattain. On LaB6 microscopes operating at 100-200 kV, the TIF method may give better results. If you compare the two methods experimentally, you shfind that both methods give considerably better precision than manual alignment and that both lead to coma-free alignment with sufficient accuracy. (Sreference [3] for the accuracy requirements.)
Three-fold astigmatism
The data used to align the illumination direction can also be used to measu3-fold astigmatism. Checking the Compute 3-Fold Astigmatism box in the Autotuning Setup dialog enables this option. The Align procedure will then put the value of the 3-fold astigmatism it measured to the Results window etime the procedure is run.
Three-fold astigmatism is an electron-optics aberration whose importance high-resolution electron microscopy has come to be appreciated only very recently.3, 5, 6, 7 In general terms, 3-fold astigmatism of less than 1 µm is nolikely to have any measurable effect on high-resolution images taken on anmicroscope. Three-fold astigmatism of 2 µm or greater, however, may giveto “star of Mercedes” artifacts in images taken with ultra low Cs electron miscopes, especially those operating at 100-200 kV. The aberration also mustaken into account in any holographic reconstruction aiming to improve themicroscope resolution towards 1 Å.
6.4 Complete Autotuning
Changing the beam tilt changes the apparent astigmatism and defocus. Onother hand, if the astigmatism and defocus are poorly adjusted, it is impossto correct the beam tilt.
Complete autotuning is, therefore, done most efficiently if the defocus and astigmatism are roughly adjusted first (set defocus to about Scherzer u
5. O.L. Krivanek and M.L. Leber, “Autotuning for 1-Å Resolution,” Proceedings 13th International Congon Electron Microscopy, 1994, 157-158.
6. O.L. Krivanek and P.E. Mooney, “Applications of Slow-Scan CCD Cameras In Transmission ElectroMicroscopy,” Ultramicroscopy 49 (1993) 95-108, p. 95-108.
7. P.E. Mooney, W.J. deRuijter, and O.L. Krivanek, “MTF Restoration with Slow-Scan CCD Cameras.”,ceedings 51st MSA meeting, Eds G.W. Bailey and C.L. Rider, San Francisco Press, San Franciscop. 262-263.
9–
HREM Autotuning User’s Guide Rev 1 6-5

Tilt Tableau
and lly
is. In e to-ina-
n
focus), then the beam tilt is corrected, and finally the astigmatism is nulled defocus set to the desired value. Repeating any part of the procedure usuagives a good idea of the error involved.
6.5 Tilt Tableau
The autoalignment procedure aligns the beam direction to the coma-free axorder to verify that the illumination direction is parallel to the optic axis of thobjective lens, you can create a Tilt Tableau. This shows an array of diffracgrams with small tilts applied to the beam between each image. If the illumtion is aligned, then the diffractograms show inversion or 2-fold symmetry about the (0,0) tilt diffractogram (Fig A). If the illumination is not aligned, theno such symmetry will be seen (Fig. B).
Figure 6-2 Coma-free alignment (Tilt Tableaux).
Fig. A
Fig. B
6-6 HREM Autotuning User’s Guide Rev 1

Tilt Tableau
of
non-
leau
is
To create a tilt tableau
• Choose MAKE TILT TABLEAU from the HREM menu.
This will bring up a prompt for you to set the delay between acquisition frames. Enter a value that gives the microscope time to adjust the tilt between frames, (0 is a good default; some microscopes may require azero value).
If you press the Alt/Option key as the menu option is selected, you will be prompted for both the tilt-angle step between frames and the size of the tabin images in X or Y.
The diffractograms may show a 3-fold symmetry about the (0,0) image. Thindicates the presence of 3-fold astigmatism in the microscope optics.
HREM Autotuning User’s Guide Rev 1 6-7

Tilt Tableau
6-8 HREM Autotuning User’s Guide Rev 1

HREM Autotuning U
7 Troubleshooting
re- the
-
n
lder.
-
This chapter contains a list of problems [each followed by the solution(s)] fquently encountered by users. It is recommended that you browse throughlist so you can learn to utilize HREM more efficiently.
• Incomplete software installation.
You may get one or both of the following prompts when you launch DigitalMicrograph.
- Check to see you have the EMControl Plug-In in the Packages/Plug-Ifolder.
- Check to see you have the Camera Plug-In in the Packages/Plug-In fo
• Microscope does not respond.
There could be several possibilities.
- Check that the computer is connected to the microscope.
- Check that the Microscope Type in the EM Control Setup dialog corresponds to your particular microscope (see Section 1.3.1).
ser’s Guide Rev 1 7-1

rate
ur
pe
ro-
he lty o-
cali-
tion n.
ing ween the f the d
you D
ocus
- Make sure Remote Control is enabled on the microscope and the baudis set to the correct value.
- You can also try increasing the Time Out and Retry parameters on yomicroscope if they can be changed.
The following table provides configuration parameters for various microscomanufactures.
If you are still unable to establish reliable communication, contact your micscope service engineer.
• The microscope baud rate is too slow.
- Microscope communication over the RS232 serial line is handled at thighest baud rate possible, but some microscopes may have a difficukeeping up with this rate. If this appears to be the case with your micrscope, go to EMControl Setup dialog and select a slower baud rate.
• Image dimensions not calibrated.
You will be prompted if the dimensions of the image/FFT have not been brated.
- Make sure the images are calibrated either by entering the magnificawhen the image is acquired or by calibrating them after the acquisitio
• Microscope magnification is too high.
The autotuning algorithm performs best when the largest diffractogram rrecorded at a defocus of around Scherzer has a diameter that is bet50–70% the size of the image. At very high microscope magnifications, diffractograms become smaller than this optimal size and the accuracy oprocedure suffers. A good way around this problem is to either do binneacquisition of the camera images, or to select USE REDUCED FFT.
If these options are not possible (e.g., on a 384 x 576 pixel CCD where cannot get a 256 x 256 diffractogram with 2x binning), use a smaller CCmagnification (of the order of 200k - 300 kx) to stigmate and align the microscope, and then increase the magnification and readjust only the f(and possibly the stigmators) at the high magnification.
Manufacturer Remote Configuration Max. Baud Rate
Hitachi Remote is always enabled 1200
JEOL Enter EXT 1 on the microscope key-board. Note space before the 1.
4800 or 9600
Philips Remote Control must be enabled on Parameter page #5
9600
Topcon Remote is always enabled 9600
Zeiss Remote is always enabled 9600
5
7-2 HREM Autotuning User’s Guide Rev 1

tilt nt to
x) n
lace e
n
the fac--
er X- ly he -d, li-
es ong, e e.
• Pivot points not set prior to the autoalignment.
It the illumination shifts at the same time as it tilts, then even a medium may cause the beam to shift off camera. This will cause the autoalignmefail.
To check that the pivot points are correctly set:
1.Lower the viewing screen; go to a low magnification (around 10,000where the illumination is seen as a bright spot approximately 1 cm idiameter.
2.Activate Assisted Alignment. Make sure the spot stays in the same pwhen the computer switches the beam tilt from one orientation to thother (when you press Return on the keyboard).
Note that selecting a larger spot size and defocusing the illuminatiomakes this adjustment easier and less critical.
• Beam tilt value set too high when running autoalignment.
The apparent astigmatism produced by tilting the beam is proportional tobeam tilt squared. Doubling the beam tilt increases the astigmatism by ator of 4. Be careful when selecting the starting tilt value for the autoalignment procedure, particularly since too large an astigmatism change mayproduce a Maltese Cross type diffractogram, which the software will notanalyze correctly.
• Wrong polarity of the Y-tilt calibration.
The autoalignment algorithm needs to know the Y tilt polarity, i.e., wheththe Y-tilt direction appears counterclockwise or clockwise relative to thetilt as seen by the camera (whose image may be inverted relative to theimage on the viewing screen). The tilt-calibration procedure automaticaldetermines the polarity and puts a minus sign in front of the number in tY-tilt field of the Calibration dialog box if the Y-tilt is clockwise from the Xtilt on your microscope. Should the polarity ever be accidentally switcheautoalignment will not function properly. You will need to redo the tilt cabration before HREM can align the microscope.
• Recalibrating from an incorrect starting calibration.
Using incorrect starting-calibration values will result in inappropriate valubeing sent to the microscope. It the starting calibration appears to be wrenter zeros in the appropriate fields of the Calibrations dialog to force thcalibration to start “from scratch” as described in Section 4.2 of this Guid
HREM Autotuning User’s Guide Rev 1 7-3

am -
hest
nd
tage ro-
ge to
at -
fit-
us is ni-
• The defocus range is set too high.
The cross correlation between a segment of an experimental diffractogrtaken at -200 nm defocus and the array of theoretical diffractograms computed for various defocus values is shown in the figure below.
The defocus value assigned to the segment is the one that gives the higcross-correlation coefficient.
It is important to restrict the defocus range to cover only the region aroupeak A and avoid the false maxima, peaks B and C.
The width of the optimal defocus range depends on the accelerating vol(kV), the Cs, and the quality of the diffractograms. The following table pvides some typical values for the parameters.
Avoiding False peaks
The false peak at C can be avoided by simply restricting the defocus rannegative values.
The peak at B is less predictable. However, if the fitted rings are much smaller than the actual ones, then try narrowing the defocus range.
Also, decrease the defocus range when you are repeatedly prompted thyour defocus value is out of range, but your diffractograms contain largediameter rings corresponding to defocus values that should be properlyted.
On the other hand, if the out-of-range prompts persist when the underfoclarge (smaller rings), but disappear when the defocus is closer to the mi
kVCs
(mm)Defocus Range
(nm)
100 1 -600 to 0
200 0.5 -400 to 0
400 1 -300 to 0
Optimum fitting range
-500 nm 0
Theoretical Defocus (nm)
Cro
ss-C
orre
latio
n C
oeffi
cien
t
7-4 HREM Autotuning User’s Guide Rev 1

ams y e
est
cus
est he se
ise
lear e so
er all
ion.
on-to-
is in
mum-contrast position (larger rings), then it is possible that the defocus range is not large enough.
One indication that peak B may be a problem is when you see diffractogrthat produce out-of-range prompts, but which look similar to successfullfitted diffractograms with defocus values nowhere near the low end of thfitting range.
• The defocus range is set too low.
You will be prompted if the diffractogram analysis routine finds that the bfit for a defocus value is too close to the edge of the defocus range.
- Increase the defocus range so that the fitted value is within the newrange. However, first read the question on specifying too large a deforange (above).
• The fitting step is too small.
The value of the defocus fitting step should be about one half of the lowfitting error that the diffractogram analysis routine produces. Reducing tstep beyond this value will not improve the accuracy any, but will increathe analysis time.
• The fitting step is too large.
The fitting step should be no larger than the smallest fitting error. Otherwthe accuracy of the diffractogram analysis will suffer.
• Specimen drift occurs during the autoalignment.
If diffractograms are cut off in just one direction and the images make it cthat the specimen is drifting in this direction, decrease the acquisition timthat the drift has less effect on the diffractograms.
• The condenser aperture is too large or the illumination spot is too small.
Diffractogram-based autotuning works best with coherent illumination ovlarge areas of the sample. This can be readily accomplished by using smC2 apertures, large illumination spot sizes, and defocusing the illuminat
• Trying to do autoalignment with poor diffractograms.
Parameters such as specimen thickness, illumination, type of filament, cdenser aperture sizes, etc., all can greatly affect the quality of the diffracgrams.
Specimen
Good-quality diffractograms can be obtained if the amorphous specimen<10 nm thick. Make sure the specimen has had enough time to stabilize
HREM Autotuning User’s Guide Rev 1 7-5

the
at
s-
hor
by 4
racy
d
.
tion
is-
nce se
, but
position and that specimen drift and vibration are minimized. Make surespecimen is not contaminated.
Illumination
Coherent illumination is important as is minimizing the statistical noise inthe image. The illumination should be very coherent. You should aim forleast the following statistics in the image:
- ~ 500–1000 counts per pixel with a YAG scintillator.
- ~2000–5000 counts per pixel at 100 or 200 kV with a powdered-phophor scintillator.
- ~1000–2000 counts per pixel at 300 or 400 kV for powdered phospscintillator.
These numbers apply to 14-bit digitizing cameras and should be divided for 12-bit digitizing cameras.
Illumination sources
Any measure that improves the diffractogram quality increases the accuand robustness of the autotuning procedure. Use a LaB6 filament instead of a tungsten one. Field-emission guns give the best diffractogram quality anthe most accurate autotuning results.
Experiment to see what microscope conditions give the best diffractogramsSome techniques you can try include:
• Different condenser apertures sizes and different degrees of illuminadefocus.
Smaller apertures and/or more defocused illumination mean better coherence that results in more rings in the diffractograms. This alsolowers illumination intensity, which increases the importance of stattical noise.
• Different illumination spot sizes.
Larger spot sizes give better diffractograms and minimize the importaof contamination. They may, however, cause thermal drift and increaradiation damage to your sample.
• Different filament emission currents.
Larger current gives more intensity, which decreases the shot noisealso results in more energy spread, which limits the highest spatial frequency that the diffractogram can reach.
• Different acquisition times.
7-6 HREM Autotuning User’s Guide Rev 1

ams o be e
s
hich
f in ccu-
en o re
ter-
a -
lysis e,
res to
ame ing
dure
s-
Longer times decrease the effects of statistical noise in the diffractogrand permit more defocus and, therefore, more coherent illumination tused. Shorter acquisition times allow acceptable diffractograms to bobtained even when specimen drift is a problem.
• Different specimen thicknesses, different specimens, i.e., amorphougermanium or tungsten.
Thicker and heavier specimens result in higher scattering intensity, wmay be important especially at higher voltages. However, since eachexperimental diffractogram is obtained by integrating over a range odefocus values corresponding to the distribution of atom heights withthe sample, specimens thicker of approximately 10 nm will make an arate determination of defocus impossible.
• Different magnifications.
At lower magnifications, one can sample a larger area of the specimand obtain diffractograms with larger rings that are easier to analyzeprecisely. But too low a magnification will push the ring diameters toclose to the edges of the diffractogram window (the Nyquist limit) whetheir intensity will be weakened by the finite contrast-transfer characistics of the camera.
• Different areas of the specimen.
If contamination or radiation damage is a problem, simply moving topreviously unirradiated part of the specimen should produce diffractograms of markedly improved quality.
• Focus drift.
Since the high-resolution autotuning procedures are based on the anaof diffractograms, focus drift, caused by instabilities in the high voltagcan degrade the performance of the autotuning or cause the procedufail depending on the amount of focus drift present.
The drift rate can be measured by recording two images under the sfocus condition with a known time delay between them and then workout their defocus by selecting ANALYZE DIFFRACTOGRAM under the HREM menu. If the drift rate is greater than 1 nm/sec, the autotuning proceis unlikely to work.
Consult your microscope service engineer if you observe a high focudrift rate.
HREM Autotuning User’s Guide Rev 1 7-7

7-8 HREM Autotuning User’s Guide Rev 1
HREM Autotuning User’s Gu
Index
AAssisted
Alignment 3-3Focus3-2Stigmation3-3
Astigmatism2-13-fold 5-4, 6-5Direction 2-1
AutotuningRobustness5-3
CCalibration
Edit 4-5Magnification 2-4Save, load4-6Stigmators4-3Tilt 4-4
pointers 4-5
DDefocus2-1
Gatan sign convention5-2Limits 5-3Range
too high 7-4too low 7-5
Sherzer6-2Step size5-3
too large 7-5too small 7-5
Verify 5-2Diffractogram analysis routine2-1Diffractograms
Analysis 1-1
Fitting error 5-4Fitting procedure5-3Limit 5-4Maltese Cross type2-3Sample2-1Underfocused5-2
EEM Control Setup1-3
FFitting 5-3
HHREM Autotuning
Auto Alignment 6-3Auto Focus6-1Corrections
coma-free alignment 1-1Exposure5-4Functionalities
analysis 1-2assisted tuning 1-1automated tuning 1-2calibration 1-2
Software installation1-3
IImage
Dimension calibration7-2
MMicroscope
Baud rate7-2Condenser aperture7-5
ide Rev 1 I-1

I-2
Configuration7-2Illumination 7-6Illumination sources7-6Magnification
too high 7-2Parameters2-3Serial communication7-2
PPivot point 3-4, 7-3
RReduced FFTs2-5Requirements
Computer1-2hardware 1-2software 1-2
SSpecimen drift7-5
TTilt
Direction 6-4Introduced5-2Magnitude3-4, 6-4Tableau6-6
HREM Autotuning User’s Guide Rev 1