hrt-18-035: infrastructure initiatives to apply connected ...infrastructure initiatives to apply...
TRANSCRIPT

Infrastructure Initiatives to Apply Connected- and Automated-Vehicle Technology to Roadway Departures PUBLICATION NO. FHWA-HRT-18-035 SEPTEMBER 2018
Research, Development, and TechnologyTurner-Fairbank Highway Research Center6300 Georgetown PikeMcLean, VA 22101-2296
U.S. Department of Transportation
Federal Highway Administration

FOREWORD
The overall goal of the Federal Highway Administration’s (FHWA’s) Roadway Departure
(RwD) Program is to improve the safety of the Nation’s highways through the reduction of RwD
crashes. RwDs continue to account for more than half of U.S. roadway fatalities annually and
nearly 40 percent of serious injuries, making such crashes a significant safety concern.
Connected vehicles and automated vehicles are complementary technologies with the potential to
improve safety. The purpose of this research is to explore the role of highway infrastructure in
enabling these technologies to reduce the number and severity of RwD crashes. This report
identifies initiatives for FHWA and its State partners to consider and investigates how
infrastructure may need to be adjusted to accommodate these technologies. This report includes a
literature review on RwD crashes and conventional countermeasures. A series of Web meetings
with interested stakeholders examined the gap between the state of the art of these technologies
and their ultimate effective deployments. This document is intended for traffic engineers,
highway designers and planners, and other transportation professionals to acquaint themselves
with potential infrastructure changes that could accommodate these emerging vehicle
technologies.
James S. Pol, P.E., PMP
Acting Director, Office of Safety
Research and Development
Notice
This document is disseminated under the sponsorship of the U.S. Department of Transportation
(USDOT) in the interest of information exchange. The U.S. Government assumes no liability for
the use of the information contained in this document.
The U.S. Government does not endorse products or manufacturers. Trademarks or
manufacturers’ names appear in this report only because they are considered essential to the
objective of the document.
Quality Assurance Statement
The Federal Highway Administration (FHWA) provides high quality information to serve
Government, industry, and the public in a manner that promotes public understanding. Standards
and policies are used to ensure and maximize the quality, objectivity, utility, and integrity of its
information. FHWA periodically reviews quality issues and adjusts its programs and processes to
ensure continuous quality improvement.

TECHNICAL REPORT DOCUMENTATION PAGE
1. Report No.
FHWA-HRT-18-035
2. Government Accession No.
3. Recipient's Catalog No.
4. Title and Subtitle
Infrastructure Initiatives to Apply Connected- and Automated-Vehicle
Technology to Roadway Departures
5. Report Date
September 2018
6. Performing Organization Code
7. Author(s)
Doug Pape (ORCID: 0000-0002-1557-5881) and Filmon Habtemichael
(ORCID: 0000-0002-8837-0959)
8. Performing Organization
Report No.
100091970-5
9. Performing Organization Name and Address
Battelle
505 King Avenue
Columbus, OH 43201
10. Work Unit No. (TRAIS)
11. Contract or Grant No.
DTFH6116-D-00038
Order No. 0001
12. Sponsoring Agency Name and Address
U.S. Department of Transportation
Federal Highway Administration
Turner-Fairbank Highway Research Center
Office of Safety Research and Development
6300 Georgetown Pike
McLean, VA 22101
13. Type of Report and Period
Covered
Final Report; September 2016–
November 2017
14. Sponsoring Agency Code
HRDS-10
15. Supplementary Notes
This report was reviewed by the Federal Highway Administration Government Task Manager Abdul Zineddin
(HRDS-10).
16. Abstract
The Federal Highway Administration (FHWA) is investigating how emerging connected-vehicle (CV) and
automated-vehicle (AV) technologies can address roadway-departure (RwD) crashes. The objective of this project
was to develop a framework for FHWA regarding how the infrastructure components need to change to
accommodate CV and AV technologies to help reduce the frequency and severity of RwD crashes. The project
produced a list of initiatives that FHWA may use to support the deployments of CV and AV technologies in ways
that will address RwD crashes. The initiatives were developed from a literature review and consultation with
technology developers, vehicle manufacturers, State and local departments of transportation, infrastructure
officials, and other stakeholders.
17. Key Words
Roadway departure, connected vehicles, automated
vehicles
18. Distribution Statement
No restrictions. This document is available to the
public though the National Technical Information
Service, Springfield, VA 22161.
http://www.ntis.gov
19. Security Classif. (of this report)
Unclassified
20. Security Classif. (of this page)
Unclassified
21. No. of
Pages
100
22. Price
Form DOT F 1700.7 (8-72) Reproduction of completed page authorized.

ii
SI* (MODERN METRIC) CONVERSION FACTORS APPROXIMATE CONVERSIONS TO SI UNITS
Symbol When You Know Multiply By To Find Symbol
LENGTH in inches 25.4 millimeters mm ft feet 0.305 meters m yd yards 0.914 meters m mi miles 1.61 kilometers km
AREA in
2square inches 645.2 square millimeters mm
2
ft2
square feet 0.093 square meters m2
yd2
square yard 0.836 square meters m2
ac acres 0.405 hectares ha mi
2square miles 2.59 square kilometers km
2
VOLUME fl oz fluid ounces 29.57 milliliters mL gal gallons 3.785 liters L ft
3 cubic feet 0.028 cubic meters m
3
yd3
cubic yards 0.765 cubic meters m3
NOTE: volumes greater than 1000 L shall be shown in m3
MASS oz ounces 28.35 grams glb pounds 0.454 kilograms kgT short tons (2000 lb) 0.907 megagrams (or "metric ton") Mg (or "t")
TEMPERATURE (exact degrees) oF Fahrenheit 5 (F-32)/9 Celsius
oC
or (F-32)/1.8
ILLUMINATION fc foot-candles 10.76 lux lx fl foot-Lamberts 3.426 candela/m
2 cd/m
2
FORCE and PRESSURE or STRESS lbf poundforce 4.45 newtons N lbf/in
2poundforce per square inch 6.89 kilopascals kPa
APPROXIMATE CONVERSIONS FROM SI UNITS
Symbol When You Know Multiply By To Find Symbol
LENGTHmm millimeters 0.039 inches in m meters 3.28 feet ft m meters 1.09 yards yd km kilometers 0.621 miles mi
AREA mm
2 square millimeters 0.0016 square inches in
2
m2 square meters 10.764 square feet ft
2
m2 square meters 1.195 square yards yd
2
ha hectares 2.47 acres ac km
2 square kilometers 0.386 square miles mi
2
VOLUME mL milliliters 0.034 fluid ounces fl oz
L liters 0.264 gallons gal m
3 cubic meters 35.314 cubic feet ft
3
m3
cubic meters 1.307 cubic yards yd3
MASS g grams 0.035 ounces ozkg kilograms 2.202 pounds lbMg (or "t") megagrams (or "metric ton") 1.103 short tons (2000 lb) T
TEMPERATURE (exact degrees) oC Celsius 1.8C+32 Fahrenheit
oF
ILLUMINATION lx lux 0.0929 foot-candles fc cd/m
2candela/m
20.2919 foot-Lamberts fl
FORCE and PRESSURE or STRESS N newtons 0.225 poundforce lbf kPa kilopascals 0.145 poundforce per square inch lbf/in
2
*SI is the symbol for th International System of Units. Appropriate rounding should be made to comply with Section 4 of ASTM E380. e
(Revised March 2003)
iii
TABLE OF CONTENTS
EXECUTIVE SUMMARY .......................................................................................................... 1
CHAPTER 1. INTRODUCTION ................................................................................................ 3 BACKGROUND ....................................................................................................................... 3 DEFINITIONS .......................................................................................................................... 4 PROJECT SCOPE ................................................................................................................... 5 OVERVIEW OF THE RESEARCH IMPLEMENTATION PLAN ................................... 5
CHAPTER 2. LITERATURE REVIEW .................................................................................... 9 CONTEXT ................................................................................................................................. 9
RwD-Crash Statistics .............................................................................................................. 9 Factors Contributing to RwD Crashes .................................................................................. 10 Goals of the FHWA RwD Team ........................................................................................... 11
EXISTING COUNTERMEASURES .................................................................................... 12 Conventional RwD Countermeasures ................................................................................... 12 Addressing RwD Through AVs ............................................................................................ 15 Addressing RwD Through CVs ............................................................................................ 23
TECHNOLOGY TRENDS TO WATCH ............................................................................. 26 Understanding Lane-Keeping Behaviors of Drivers ............................................................. 26 RwD-Crash Risk Index ......................................................................................................... 28
Road-Information Inventory ................................................................................................. 29 Addressing RwD Through Enhanced Infrastructure ............................................................. 32
EFFORTS OF STATES AND INFRASTRUCTURE STAKEHOLDERS ON CV
AND AV TECHNOLOGIES ........................................................................................... 34 Efforts of States on CV and AV Technologies ..................................................................... 34 Efforts of Infrastructure Stakeholders ................................................................................... 36
CHAPTER 3. NEEDS ASSESSMENT ..................................................................................... 37 DISCUSSION POINTS AND LESSONS LEARNED ......................................................... 37
Standards ............................................................................................................................... 37 Infrastructure Differences for CVs and AVs ........................................................................ 39
Signage, Roadside, and Friction Information ....................................................................... 40 Sparse, Rural Areas ............................................................................................................... 40 Staff Training ........................................................................................................................ 40 Collaboration ......................................................................................................................... 41
IDENTIFIED GAPS ............................................................................................................... 41 A Gap Common to States and Manufacturers ...................................................................... 41 Gaps as Perceived by Transportation Departments .............................................................. 42 Gaps as Perceived by Vehicle Manufacturers....................................................................... 42
CHAPTER 4. RESEARCH IMPLEMENTATION PLAN ..................................................... 45
INITIATIVE 1. EFFECTIVENESS ESTIMATES OF CURRENT DRIVER
ASSISTANCE ................................................................................................................... 45
Background ........................................................................................................................... 45 Objective ............................................................................................................................... 46 Potential Benefits .................................................................................................................. 46

iv
Relationships to the Existing Body of Knowledge ............................................................... 46 Tasks ................................................................................................................................... 46
INITIATIVE 2. CHARACTERIZATION OF LANE-KEEPING PRACTICES ............. 47 Background ........................................................................................................................... 47 Objective ............................................................................................................................... 47 Potential Benefits .................................................................................................................. 47 Relationship to the Existing Body of Knowledge ................................................................. 48 Tasks ................................................................................................................................... 48 Follow-On and Implementation Activities ........................................................................... 48
INITIATIVE 3. SIMULATIONS TO ESTIMATE THE BENEFITS OF CV
COUNTERMEASURES FOR RWDS ............................................................................ 49 Background ........................................................................................................................... 49 Objective ............................................................................................................................... 49 Potential Benefits .................................................................................................................. 49 Relationships to the Existing Body of Knowledge ............................................................... 49 Tasks ................................................................................................................................... 49 Follow-On and Implementation Activities ........................................................................... 50
INITIATIVE 4. CURVE-WARNING CHALLENGE ........................................................ 50 Background ........................................................................................................................... 50 Objective ............................................................................................................................... 51
Potential Benefits .................................................................................................................. 51 Relationships to the Existing Body of Knowledge ............................................................... 51 Tasks ................................................................................................................................... 51
INITIATIVE 5. EXTENSIONS TO THE CSW APPLICATION ..................................... 52 Background ........................................................................................................................... 52 Objective ............................................................................................................................... 52 Potential Benefits .................................................................................................................. 52 Relationship to the Existing Body of Knowledge ................................................................. 52 Tasks ................................................................................................................................... 53
INITIATIVE 6. INPUT FROM STATE AND LOCAL TRANSPORTATION
DEPARTMENTS AND OTHER STAKEHOLDERS................................................... 53
Background ........................................................................................................................... 53 Objective ............................................................................................................................... 54 Potential Benefits .................................................................................................................. 54 Relationships to the Existing Body of Knowledge ............................................................... 54 Tasks ................................................................................................................................... 54 Follow-On and Implementation Activities ........................................................................... 55
INITIATIVE 7. V2I TECHNOLOGY–AWARENESS TRAINING FOR STATE
AGENCIES ........................................................................................................................ 55 Background ........................................................................................................................... 55 Objective ............................................................................................................................... 56
Potential Benefits .................................................................................................................. 56 Relationships to the Existing Body of Knowledge ............................................................... 56 Tasks ................................................................................................................................... 56 Follow-On and Implementation Activities ........................................................................... 57

v
INITIATIVE 8. SOFTWARE AID TO DESIGN FOR ACCOMMODATING
CVS AND AVS .................................................................................................................. 57 Background ........................................................................................................................... 57 Objective ............................................................................................................................... 57 Potential Benefits .................................................................................................................. 58 Relationships to the Existing Body of Knowledge ............................................................... 58 Tasks ................................................................................................................................... 58 Follow-On and Implementation Activities ........................................................................... 58
INITIATIVE 9. TIGHTER MARKING AND SIGN REQUIREMENTS IN THE
MUTCD ............................................................................................................................. 58
Background ........................................................................................................................... 58 Objective ............................................................................................................................... 59 Potential Benefits .................................................................................................................. 59 Relationships to the Existing Body of Knowledge ............................................................... 59 Tasks ................................................................................................................................... 59 Follow-On and Implementation Activities ........................................................................... 60
INITIATIVE 10. SYNTHESIS OF MACHINE-READABLE SIGN
TECHNOLOGY ............................................................................................................... 60 Background ........................................................................................................................... 60 Objective ............................................................................................................................... 61
Potential Benefits .................................................................................................................. 61 Relationships to the Existing Body of Knowledge ............................................................... 61 Tasks ................................................................................................................................... 61 Follow-On and Implementation Activities ........................................................................... 62
INITIATIVE 11. IDENTIFICATION OF HIGH-RISK LOCATIONS USING CV
DATA ................................................................................................................................. 62 Background ........................................................................................................................... 62 Objective ............................................................................................................................... 62 Potential Benefits .................................................................................................................. 63 Relationships to the Existing Body of Knowledge ............................................................... 63 Tasks ................................................................................................................................... 63
Follow-On and Implementation Activities ........................................................................... 64 EXISTING AND SMALLER EFFORTS ............................................................................. 64
Road Weather Information to AVs ....................................................................................... 64 Standards and Business Model for Maintaining and Delivering Roadway Geometry ......... 64 Standard for Pavement-Marking Removal ........................................................................... 65 Recovery Guidance for Errant Vehicles ............................................................................... 65 RwD-Safety Risk Index for Road Segments......................................................................... 65
Reconsidered Geometric Design for AVs ............................................................................. 66 New IHSDM Module for CV and AV Technology .............................................................. 66
CHAPTER 5. CONCLUSIONS ................................................................................................. 67
LITERATURE REVIEW ...................................................................................................... 67 GAP ANALYSIS ..................................................................................................................... 68 RESEARCH IMPLEMENTATION PLAN ......................................................................... 68

vi
APPENDIX. WEB MEETING PARTICIPANTS ................................................................... 71 WEB MEETING 1 .................................................................................................................. 71 WEB MEETING 2 .................................................................................................................. 71 WEB MEETING 3 .................................................................................................................. 71
REFERENCES ............................................................................................................................ 73

vii
LIST OF FIGURES
Figure 1. Graphic. SAE automation levels range from 0 (no automation) to 5 (full
automation) .............................................................................................................................4
Figure 2. Graphic. Recommended research topics are a diverse yet cohesive approach to
improving RwD safety ...........................................................................................................6
Figure 3. Pie chart. Proportion of RwD fatalities by most harmful event of the crash..................10
Figure 4. Pie chart. Most causes of passenger-car unintentional lane departures are driver
actions or inactions ...............................................................................................................11
Figure 5. Photo. Arrow signs and chevrons can be used separately or in combination.................14
Figure 6. Photos. Pavement treatments to improve RwD safety ...................................................15
Figure 7. Photo. High-resolution, 3D map for use by AVs in Mcity .............................................31
Figure 8. Photo. Ohio DOT van precisely tracks its position relative to the roadway as it
gathers data on pavement conditions ...................................................................................32
LIST OF TABLES
Table 1. Range of approaches the initiatives cover .......................................................................70
Table 2. Meeting participants represented diverse perspectives ....................................................71

viii
LIST OF ABBREVIATIONS AND SYMBOLS
3D three-dimensional
AASHTO American Association of State Highway and Transportation Officials
ADS automated driving system
AV automated vehicle
BSM Basic Safety Message
Caltrans California Department of Transportation
CSW Curve Speed Warning
CV connected vehicle
DSRC dedicated short-range communication
FARS Fatality Analysis Reporting System
FCW Forward Collision Warning
FHWA Federal Highway Administration
GAO Government Accountability Office
GIS geographic information system
GPS Global Positioning System
HFST high-friction surface treatment
HLDI Highway Loss Data Institute
IHSDM Interactive Highway Safety Design Model
ITS Intelligent Transportation Systems
LDW lane-departure warning
LED light emitting diode
LiDAR Light Detection and Ranging
LKA lane-keeping assist
MDOT Michigan Department of Transportation
MUTCD Manual on Uniform Traffic Control Devices
NCHRP National Cooperative Highway Research Program
NDS Naturalistic Driving Study
NHTSA National Highway Traffic Safety Administration
ODOT Oregon Department of Transportation
Ohio DOT Ohio Department of Transportation
RFID radio-frequency identification

ix
RSU roadside unit
RwD roadway departure
RWIS Road Weather Information System
SAE SAE International
SHRP2 second Strategic Highway Research Program
SPaT Signal Phase and Timing
TIM Traveler Information Message
TMC traffic management center
USDOT United States Department of Transportation
V2I vehicle to infrastructure
V2V vehicle to vehicle
V2X vehicle to other (e.g., pedestrian)
VDOT Virginia Department of Transportation
VTTI Virginia Tech Transportation Institute
WTP willingness to pay


1
EXECUTIVE SUMMARY
The Roadway Departure (RwD) Team at the Federal Highway Administration (FHWA) is tasked
with preventing and mitigating RwD crashes—those “in which a vehicle crosses an edge line, a
center line, or leaves the traveled way.”(1) Recognizing that connected-vehicle (CV) and
automated-vehicle (AV) technologies have the potential to enhance highway safety, the RwD
Team is considering how these technologies can be included with the existing diverse set of
RwD countermeasures. The purpose of this research is to understand how the infrastructure may
need to be adjusted to accommodate these technologies.
CVs send and receive brief messages through dedicated short-range communication. Messages
can be transmitted vehicle to vehicle (V2V) or vehicle to infrastructure (V2I). The messages
enable various applications to enhance safety, mobility, and other goals. AVs have driving
automation features that are responsible for lane keeping in at least some circumstances. An AV
may receive a portion of its information through CV technology. CVs and AVs will interact with
the infrastructure differently than conventional vehicles have since the earliest days of motorized
transportation.
Research published in the past 3 years was examined. Applications of CV technology include
warnings about curve speed, spot weather, and lane drops. Current AV systems typically use
machine vision, and their performance is limited by lighting and weather conditions. Early
driver-assistance systems are often deactivated by drivers due to false warnings and the systems’
failures to adapt to individual drivers’ habits. A vehicle’s measurement of its position within the
lane can be improved by several means: better lane markings, machine vision, and
communication between those who place lane markings and those who engineer vision systems
to detect them. Other approaches being researched include radar, improvements in satellite
navigation, and detailed precision maps of the roadway.
Three Web meetings gathered input from industry, State departments of transportation, and the
research community. A significant gap facing AV deployment is the lack of standardization.
Pavement-marking patterns and advisory speeds can vary between and within States. V2I
connectivity requires equipment on vehicles and infrastructure, posing a “chicken and egg”
problem in which the two must be deployed together in a compatible fashion to be effective.
Collaboration and frequent communication between infrastructure officials and developers of
CVs and AVs are necessary.
FHWA is now considering research initiatives to fill the gaps identified by the research presented
in this report. Some of the initiatives would assess the effectiveness of existing and future
systems. Others would develop the Curve Speed Warning application to prevent vehicles from
running off the roadway. Another set of initiatives would aid State and local agencies in
preparing their infrastructure for CV and AV technologies. Others would improve the ability of
AVs to recognize infrastructure cues. Low-priority and long-term items are included as well.
By promoting programs like those outlined here, the RwD Team at FHWA will further its goal
of improving RwD safety and accelerating the deployment of CVs and AVs.


3
CHAPTER 1. INTRODUCTION
The Federal Highway Administration’s (FHWA’s) Safety Program features a roadway-departure
(RwD) roadmap of activities to guide the portfolio of RwD-related research. FHWA’s RwD
Program focused on how connected-vehicle (CV) and automated-vehicle (AV) technologies can
be considered alongside the diverse set of safety countermeasures developed to prevent and
mitigate RwD crashes.
This project produced a framework in which FHWA can consider adjustments to the RwD
roadmap. The framework includes recommendations on how the RwD Program can support the
CV and vehicle-to-infrastructure (V2I) programs and how the RwD Program’s focus may need
to be adjusted to address these changes in the vehicles and infrastructure. This report describes
activities that FHWA may undertake to prioritize RwD research activities for CV and AV safety
issues. FHWA’s RwD Team will use this information to support the CV and V2I programs and
to adjust the RwD Program’s focus to address these anticipated changes in the vehicles and
infrastructure. The scope of this project is limited to light vehicles.
This document is organized into five chapters. Following this introductory chapter, chapter 2 is
the literature review, which focuses on synthesizing information on the capability of CV and AV
technologies to address RwD crashes. The review documents existing practices and knowledge
on the topic from academic research, government studies, and national and international agency
reports that were published after 2012 and are applicable to light vehicles. Chapter 3 presents the
needs assessment, which addresses the gap between the state of the art of these technologies and
their ultimate effective deployment. The needs assessment was conducted by organizing three
Web meetings with CV and AV researchers and developers, vehicle manufacturers, State and
local transportation departments and infrastructure officials. Chapter 4 discusses implementation
of the research plan. It is a list of projects or initiatives that FHWA can consider as it endeavors
to reduce the frequency and severity of RwD crashes through CV and AV technologies. The
initiatives were identified through the findings of the literature review and the needs assessment.
Finally, chapter 5 summarizes the overall findings of the project and presents concluding
remarks.
BACKGROUND
CV and AV technologies have the potential to enhance highway safety by providing drivers with
precise vehicle control and restoring appropriate driver attention to traffic and roadway
conditions. CV technologies use dedicated short-range communication (DSRC) messages,
vehicle-to-vehicle (V2V) communication, and V2I communication to provide drivers with timely
safety information and warnings. AVs assist the driver or take full control of the driving task
depending on the degree of their automation. Various levels of AVs have been defined—from
the lowest level with simple cruise control, all the way up to vehicles with full driving
automation. Such technologies can have a tremendous effect on the reduction of RwD crashes.
As the vehicle fleet transitions to include a greater percentage of these CV and AV technologies,
it is important to understand how the infrastructure and safety countermeasures must adjust to
these changes (e.g., rumble strips will become less important, while additional system striping
may be needed). This project explores new and emerging technologies to determine which have

4
the most potential benefits in reducing RwD crashes, how the RwD Program can support the CV
and AV programs, and how the RwD Program’s focus may need to readjust to address these
changes in the vehicles and infrastructure.
DEFINITIONS
An RwD is a “crash in which a vehicle crosses an edge line, a center line, or leaves the traveled
way.”(1) As opposed to intentional lane-changing, merging, and diverging maneuvers, RwD
refers to the unintentional departure or drift from a traveled lane.
CVs use wireless communication technologies to exchange mobility and safety information with
other vehicles on the road (V2V), roadside infrastructure (V2I), and other features (vehicle to
other (V2X), as in vehicle to pedestrian). The concept of CV technology is supported by DSRC.
Using DSRC, equipped vehicles broadcast and receive mobility and safety messages (e.g., basic
state information (location, speed, and acceleration), traffic signal status, and spot weather
conditions).
The National Highway Traffic Safety Administration’s (NHTSA’s) Automated Driving Systems
2.0: A Vision for Safety adopted the SAE International (SAE) definitions for levels of
automation.(2) The SAE definitions divide vehicles into levels based on “who does what,
when.”(3) A Vision for Safety, on page 4, summarizes the SAE Levels as shown in figure 1.(2)
Source: NHTSA.
Figure 1. Graphic. SAE automation levels range from 0 (no automation) to 5 (full
automation).(2)
A Vision for Safety focuses on vehicles that incorporate SAE Automation Levels 3 through 5, or
those with automated driving systems (ADSs). Page 2 reads, “ADSs may include systems for
which there is no human driver or for which the human driver can give control to the ADS and
would not be expected to perform any driving-related tasks for a period of time.”(2)

5
A vehicle that receives messages from the infrastructure and has a human driver fully in control
is a CV, not an AV. A vehicle operating at Level 1 or higher without any V2I or V2V
communication is an AV, not a CV. A vehicle operating at Level 1 or higher that receives
information about other vehicles or about the infrastructure via DSRC is both a CV and an AV; it
is connected and automated.
PROJECT SCOPE
This project dealt with RwD crashes, specifically countermeasures that used CV or AV
technology. It focused on FHWA, its partners at State and local transportation departments, and
the highway infrastructure owned and operated by State and local entities. The study was limited
to light vehicles, but some of its findings applied to heavy vehicles as well.
This study generated 11 initiatives for consideration. Most of the initiatives and their
implementation plans focus on how FHWA’s RwD Program can benefit from the technical
aspects of CV and AV technologies and how the infrastructure and standard practices of highway
engineering can be modified to accommodate these technologies. Other initiatives focus on
preparing State and local transportation department staffs to acquire the necessary skills to
embrace these emerging technologies.
All the initiatives are either unique to RwDs or focus on an RwD element of a larger effort. The
tasks focus on manageably sized initiatives that can produce results in the near term. Most of the
items on this list can be accomplished in 1 to 2 years. The initiatives span a breadth of technical,
outreach, and economic content. They address CVs, AVs, and AVs with CV support.
OVERVIEW OF THE RESEARCH IMPLEMENTATION PLAN
The 11 major initiatives and 7 supplemental ideas recommended in chapter 4 complement one
another and fall in a loose sequence. Figure 2 graphically shows the relationships between them.
The regions with solid outlines represent the 11 major initiatives. The regions with dotted
outlines represent the supplemental ideas that may come later or support the major initiatives.
The colors indicate how the initiatives can be grouped. Regions that touch each other show
relationships between initiatives.

6
Source: FHWA.
LKA = lane-keeping assist; LDW = lane-departure warning; CSW = Curve Speed Warning; MUTCD =
Manual on Uniform Traffic Control Devices;(4) IHDSM = Interactive Highway Safety Design Model.
Figure 2. Graphic. Recommended research topics are a diverse yet cohesive approach to
improving RwD safety.
One of the criteria for selecting the 11 main initiatives was that they could begin in the near term,
and most of them could. Figure 2 is arranged so that short-term projects appear at the top and
long-term projects appear at the bottom.
Initiatives 1, 2, and 3 (the green regions) would analyze existing data to produce a basic
understanding of driver performance and RwD countermeasure systems. The top two (initiatives
1 and 2) characterize the current status of driver lane-keeping practices under naturalistic
conditions and the effectiveness of existing RwD countermeasures, respectively. These two
initiatives would lead to simulations of existing and new countermeasure systems to predict their
effectiveness. The simulations would benefit from input from the Curve Warning Challenge, and
they would guide extensions to the Curve Speed Warning (CSW) application. Initiatives 4 and 5
(yellow) aim to enhance the CV CSW application. One would encourage States to deploy the
application at a curve, and the other would enhance the application’s capability in the long term.
Initiatives 6, 7, and 8 (blue) call for communication with State agencies, seeking their input as
key stakeholders and providing resources for them. Initiatives 9 and 10 (purple) are for
improving the process of getting infrastructure information to a vehicle by means other than CV
technology.

7
The lower levels in the graphic are long-term benefits for highway departments. They include
ways to predict the RwD safety of geometric designs from simulations and passing vehicles,
which could lead to new guidance for geometric designs and associated pavement markings and
eventually a new Interactive Highway Safety Design Model (IHSDM) module to build a road
suited for CVs and AVs.


9
CHAPTER 2. LITERATURE REVIEW
The literature review and technology scan evaluated technologies for their maturity and
suitability to support RwD-related applications. Attention was given to emerging technologies in
the fields of vehicle automation, CVs, and AVs with a specific focus on RwD crashes and their
severity. Because this is a highly researched field, the literature review was limited mostly to
post-2012 publications applicable to light vehicles. Relevant studies in naturalistic driving
settings, pilot projects, and simulations were reviewed. The discussion centers on RwD crashes
and how they could be reduced with emerging technologies.
CONTEXT
This chapter begins with an overview of RwD crashes, discusses the issue’s criticality, and
summarizes FHWA’s strategy for preventing or reducing such crashes. RwD-crash statistics are
presented, followed by a discussion of factors that cause RwD crashes. The discussion then
proceeds to remedies that use CVs, AVs, and other enhanced infrastructure technologies and
their implications for RwD-crash prevention and mitigation. Finally, the efforts of State
transportation departments and other infrastructure stakeholders to promote CV and AV
technologies are evaluated.
RwD-Crash Statistics
Roadway crashes are an epidemic considering the number of fatalities and injuries suffered as a
result of surface transportation.(5) An international study on high-income countries that analyzed
the social costs of these crashes showed that these costs range from 0.5 to 6.0 percent of their
gross domestic product with an average of 2.7 percent.(6)
There were 37,461 crash fatalities on U.S. roadways during 2016.(7) FHWA’s study of the
Fatality Analysis Reporting System (FARS) database showed that RwD crashes accounted for
more than half (53 percent) of all highway fatalities in 2016 (i.e., out of 37,461 deaths,
approximately 19,676 were attributed to RwD crashes). Between 2014 and 2016, an average of
17,002 fatal RwD crashes occurred annually.
Figure 3 shows the breakdown of the RwD fatalities by the most harmful event of the crash
based on an FHWA study of data in the FARS database from 2013 to 2015. Rollovers and head-
on crashes each account for 26 percent of total RwD-crash fatalities. Impacts with roadside trees
are responsible for 19 percent of RwD fatalities. Given these statistics, FHWA’s RwD strategic
plan provides a primary focus on addressing rollovers, head-on crashes, and roadside tree crashes
and a secondary focus on signs, poles, signals, fixed objects, barriers, and roadside topography.(8)

10
Source: FHWA.
Figure 3. Pie chart. Proportion of RwD fatalities by most harmful event of the crash.
It is important to make the distinction between crashes caused by intentional and unintentional
lane departures. “Intentional lane departure” refers to the deliberate departure from a traveled
lane due to a lane change. On the other hand, “unintentional departure” refers to the drifting of a
vehicle from its traveled lane or road without a deliberate action by the driver. Citing prior U.S.
Department of Transportation (USDOT) studies, Lee et al. reported that crashes that occurred
when a driver was in the process of maneuvering the vehicle laterally from one lane into another
accounted for 4 to 10 percent of all crashes and 0.5 to 1.5 percent of all motor vehicle fatalities.(9)
These crash and fatality statistics are relatively small compared to the number of crashes and
fatalities due to unintentional lane departures.
Factors Contributing to RwD Crashes
RwD crashes are caused by a variety of factors. A recent study by Cicchino and Zuby on factors
leading to unintentional lane departures showed that the most common are loss of control, lane
drift, avoiding another crash, speed too fast for curves, vehicle failure, and adverse road or
weather conditions.(10) Figure 4 shows the breakdown of crashes resulting from unintentional
lane departures according to that study. The least common reasons are mechanical failure and
road weather conditions. The driver, by action or inaction, is responsible for the majority of RwD
crashes. This presents CV and AV technologies with an opportunity to improve highway safety
by assisting the human with the driving task.

11
Source: FHWA.
Figure 4. Pie chart. Most causes of passenger-car unintentional lane departures are driver
actions or inactions.
Another study focused on identifying factors that contribute to RwD crashes using the United
States Road Assessment Program dataset and road geometric features. This study found that the
main contributing factors to RwD crashes were roadside severity, horizontal curvature, and
shoulder width.(11) “Roadside severity” refers to the nature of and distance to the nearest roadside
object that could injure vehicle occupants fatally or seriously.
Hallmark et al. provided a comprehensive review of factors that contribute to the occurrence and
severity of RwD crashes.(12) These factors included flaws in geometric design of roads such as
narrow lanes, narrow or absent shoulders, and substandard curves; driving too fast for
conditions; attempting to avoid vehicles, debris, or animals; weather conditions that adversely
affect road visibility and friction; distracted driving; impairment due to fatigue, sleep, or drugs;
and others. The authors grouped these factors into four categories: roadway, environmental,
vehicle, and driver.
Departing the traveled lane or road while negotiating a curve is another major factor of crashes.
Torbic et al. reported that the crash rate for horizontal curves is approximately 3 times that of
tangent sections, and about 76 percent of curve-related crashes were single-vehicle RwD
crashes.(13) Hallmark et al. reviewed the literature and developed a toolbox of countermeasures
for RwD crashes on horizontal curves.(14) The report highlighted that 25 to 50 percent of severe
RwD crashes in Minnesota occurred on curves, though curves account for only 10 percent of the
highway miles.
Goals of the FHWA RwD Team
In an attempt to reduce the occurrence of RwD crashes, the FHWA RwD Team developed a
strategic plan to provide a common vision for research, policy, and implementation.(8) The plan

12
describes the significance of RwD crashes, outlines the nature of the problem, and provides
potential countermeasures. The vision of the strategic plan is to “pursue a proactive approach
that will lead Toward Zero Deaths and serious injuries involving roadway departure events.”
FHWA seeks to accomplish this vision by deploying countermeasures that decrease the risk of
RwD and promoting data-driven applications for safety treatments. The overall goal of the
strategic plan is to reduce RwD fatalities by a minimum of 500 annually and reach the target of
fewer than 8,500 RwD fatalities annually (a 50-percent reduction of the current rate) by 2030.
The goal of the FHWA’s RwD Team is to actively develop and implement strategies for
reducing RwD crashes and their severity. The RwD Team prioritizes its efforts with the
following three objectives:(8)
• Keep vehicles on the roadway and in their appropriate directional lane.
• Reduce the potential for crashes when vehicles do leave the roadway or cross into
opposing traffic lanes.
• Minimize the severity of crashes that do occur.
FHWA provided technical support to the Toward Zero Deaths initiative, through which a number
of national transportation associations have produced a national strategy on highway safety.(15)
EXISTING COUNTERMEASURES
The countermeasures are systematically organized into current RwD countermeasures and the
emerging technologies for reducing RwD crashes and their severity. The effectiveness and
maturity of these technologies are presented, and their implications for RwD are discussed. The
articles presented in this section are reviewed considering the advantages and limitations of
existing technologies. In addition, this section presents how an FHWA initiative that includes a
partnership with States and municipalities can help overcome limitations of emerging
technologies.
Conventional RwD Countermeasures
This section lists conventional solutions and then proceeds to describe the literature on CV and
AV technologies. CV and AV technologies may mimic, complement, or extend the capabilities
of conventional approaches. For example, installing warning signs has been proven to have a
significant effect on the reduction of curve-related crashes. Guardrails (longitudinal barriers) can
reduce the severity of RwD crashes.
Several conventional countermeasures for RwD crashes have been identified by the American
Association of State Highway and Transportation Officials (AASHTO).(16) Similarly, a team
with a mission of scanning successful conventional engineering solutions to RwD crashes across
several States identified the following countermeasures:(17)
• Shoulder rumble strips.
• Center line rumble strips.
• Edge line rumble strips.

13
• Safety EdgeSM.
• Paved shoulder widening.
• Edge line pavement markings.
• Pavement markings at curves.
• Additional signage, especially at horizontal curves.
• Dynamic signage (e.g., speed feedback).
• Cable median barriers.
• Removal of frequently hit objects.
There are typically three approaches to consider in reducing RwD crashes. The following
approaches may be implemented alone or in combination:(18,19)
• Systemic approach considers the application of countermeasures that support crash
reduction over a wide road network or number of sites that share a high risk factor for
RwD crashes based on factors such as lane width, speed, traffic volume, road friction,
horizontal curvature, and traffic control devices. Such an approach typically considers
the application of conventional treatments to all segments of roadway or entire routes
that share a specific risk factor.
• Spot approach focuses on reducing RwD crashes at a specified spot that has a high
number of RwD crashes. Such treatment approaches account for locations that may
not be addressed through the systemic approach (e.g., deteriorated pavement surface
and poor geometric design such as sharp horizontal curves). Such locations require
special treatments involving moderate- to higher-cost improvements (e.g., pavement
rehabilitation and application of high-friction surface treatments (HFSTs)).
• Comprehensive approach intends to counteract those RwD crashes that cannot be
addressed by systemic and spot approaches. This approach focuses on the concept of
the four Es of safety: Engineering, Enforcement, Education, and Emergency medical
services. In addition to infrastructure improvements, this approach attempts to
promote safe driving behavior by addressing human factors issues such as speeding,
impaired driving, distracted driving, seatbelt use, and enforcement.
Recently, the American Traffic Safety Services Association and Jalayer et al. provided an
overview of safety countermeasures for RwD crashes based upon a comprehensive literature
review and input from State and local agencies.(20,21) The objective of their work was to provide
transportation practitioners with an understanding of the infrastructure-based, conventional
RwD-crash countermeasures’ effectiveness. The RwD safety countermeasures were classified
into three categories: signs, pavement safety, and roadway design. Jalayer and Zhou reviewed
conventional sign and pavement treatments to improve RwD safety.(22)
Signs
Signs inform drivers of horizontal curves and advisable speeds. Sign-based RwD
countermeasures include chevrons, dynamic curve-warning systems, and advanced curve
warning and advisory speed signs, as shown in figure 5. Installation of advisory speed signs and
oversized chevrons at curves was found to yield greater benefits compared to sites without

14
advisory speed signs.(23) Veneziano and Knapp provided guidelines for effective use of signs for
horizontal road alignment and related warnings.(24)
Source: FHWA.
Figure 5. Photo. Arrow signs and chevrons can be used separately or in combination.(25)
Pavement Safety
Pavement-safety countermeasures focus on treatments to the pavement surface that increase
friction between the tire and pavement surface, enhance visibility, and improve quality and depth
of edge dropoffs so that a vehicle is stable and easily recoverable after encountering a dropoff.
Pavement-based RwD countermeasures include HFSTs, raised pavement markers, edge line
pavement markings, center line and shoulder rumble strips (figure 6-A), and the Safety EdgeSM
(figure 6-B).

15
Source: FHWA.
Source: FHWA.
A. Shoulder and center line rumble strips
alert drivers to a drift.(26)
B. Safety EdgeSM aids drivers in
returning to pavement.(27)
Figure 6. Photos. Pavement treatments to improve RwD safety.
Roadway Design
Roadway-design countermeasures focus on designing better and more forgiving roadways,
which include cable barriers, guardrails, shoulder widening, breakaway supports for signs and
lighting, and improvements to the clear zones. The results of the study by Jalayer et al. identified
pavement safety (i.e., rumble strips, etc.) as the most effective countermeasure for reducing total
RwD-crash frequency and severity.(21)
Addressing RwD Through AVs
Although the conventional RwD countermeasures have been effective, the frequency and
severity of RwD crashes can be further reduced by taking advantage of emerging AV
technology. Most of the automated features in the current vehicle fleet are at Levels 1 and 2.(28)
Functions at Levels 3 through 5 are almost all currently in the research and development stage.
Rau et al. developed a methodology to determine the target crash population that could be
addressed by different levels of automation.(29) Their work was focused on identifying the target
crash populations for each function and level of vehicle automation, estimating the overlaps of
the target crashes among the different functions of vehicle automation, and accounting for
incremental target crashes between the lowest and highest automation levels. The authors did so
by mapping the functions of the automation to two comprehensive crash databases, the General
Estimates System and FARS, by correlating the automation levels with key crash characteristics
like crash locations, precrash scenarios, driving conditions, travel speeds, and driver conditions.
Their results suggested that all levels and functions of vehicle automation have the potential to
counteract RwD crashes on high-speed roads in all driving conditions. They also found that
vehicle automation can address driver errors, such as recognition errors, decision errors, and
erratic actions, that contribute to RwD crashes.
Predecessors to Automated Lane Keeping
Systems that warn the driver of a situation or that momentarily intervene are not automated; they
are Level 0 in the SAE definitions. Even so, these systems, like automated systems, need to
obtain information, particularly a vehicle’s location in a lane. Because these Level-0 systems are

16
more widely deployed, they are a source of real-world experience in the needs of automated
lane-keeping systems.
Lane-departure warning (LDW) is a driver-assistance system that provides warning to a driver
whose vehicle is in danger of departing its lane. Lane-keeping assist (LKA) applies a momentary
corrective torque to the steering wheel or differential braking to bring the vehicle back to its lane
when it begins to depart.(30)
Driver actions and inactions contribute to a significant proportion of RwD crashes.(10) Therefore,
driver-assistance systems that assist in reducing the demand of the driving task might greatly
reduce crashes and mitigate their severity.
Lane-Departure Systems
Kusano et al. examined the potential of LDW systems to reduce occupant injury levels in single-
vehicle crashes in the United States.(31) Their study was based on reconstruction of crashes and a
comparison of the crash outcomes under two scenarios (i.e., as it occurred and as if the vehicles
were equipped with LDW systems). The study found that the system could potentially prevent
about 30 percent of all RwD crashes caused by a vehicle drifting out of its traveled lane. This is
equivalent to a 25-percent reduction in seriously injured drivers. The study recommended
modification of highway systems by expanding shoulders and regularly painting lane markings
so that the benefits of the system are maximized.
Reports on field operational tests of LDW systems highlighted that the use of LDW systems has
long-term benefits such as positively affecting the lane-keeping behaviors of drivers.(32,33) The
studies reported that these systems resulted in improved lane keeping, fewer lane departures, and
increased turn-signal use by drivers.
Cades et al. studied the performance of drivers with and without LDW systems.(34) Human
subjects were asked to perform mental math as a distraction to their driving on a closed course.
LDW systems did not affect the variation in the study’s vehicle-control metrics. The study
suggested that LDW systems may not fully compensate for the effects of a secondary task on
vehicle control.
A system that expanded lateral driver-assistance systems, like LKA, was discussed by Lattke
et al.(35) Their road departure–protection system did not depend on lane markings only but rather
considered roadside curbs, guardrails, barrels, dividers, and road-surface edges (the transition
from road surface to grass or gravel) to estimate the road alignment. The system detected the
road course and lane markings and then detected possible lane departure or RwD. If departure
was detected, the system monitored driver intentions, and if the departure was unintentional, then
the kinematic and dynamic controls were applied to avoid the departure. In case the vehicle
could not be brought back onto the road within the system’s operational constraints, the system
attempted to align the vehicle with the roadway so that the severity of the RwD was minimized.
A recent study by Cicchino and Zuby reported that 34 percent of drivers who were involved in a
crash because they drifted from their lanes were sleeping or otherwise incapacitated.(10) The
authors concluded that systems that provide only transient corrective actions to counteract lane
drifting may not necessarily prevent crashes when drivers are sleep impaired and thus could be

17
exposed to other higher-risk crashes when they try to regain control. The authors concluded that
LKA systems may need to be combined with other in-vehicle driver-monitoring systems to
identify incapacitated drivers and safely remove them from the road.
Estimated Benefits of Lane-Departure Systems
New vehicles are increasingly adopting advanced driver-assistance systems, such as lane-
departure systems, that have the potential to decrease the likelihood of crashes and their severity
by addressing human error and distracted driving.(36,37) Kockelman and Li estimated the safety
benefits of advanced driver-assistance systems in terms of the savings due to crash avoidance
and moderation of crash severities.(38) They valued the annual economic cost savings from
driver-assistance systems that are relevant to RwD crashes to be in the range of $6.6 to
$12 billion.
Lane-departure systems have the potential to prevent or mitigate 483,000 crashes per year,
including 87,000 nonfatal injury crashes and 10,345 fatal crashes.(39) This represents about
8 percent of all crashes and 30 percent of all road fatalities in the Unites States. Such systems
were found to be the most relevant technological intervention in reducing the most fatal
crashes.(39,36) Similar statistics have also been reported by Jermakian.(40) Harper et al. estimated
LDW systems to have an upper benefit of about $42 billion as the technologies become more
effective and widespread.(36) Lateral driver-assistance systems (i.e., lane-departure and lane-
change assistants) have the potential to decrease the number of crashes in the European Union by
14,000, assuming a 7-percent penetration rate in 2020.(41)
Gordon et al. suggested that LDW systems have a potential to reduce 47 percent of all lane
departure–related crashes, which corresponds to a reduction of about 85,000 crashes annually.(42)
Another study by Kusano and Gabler, which had the objective of estimating the expected
number of crashes and injuries that could be prevented assuming all vehicles were equipped with
lane-departure systems, found that 11 to 23 percent of RwD crashes and 13 to 22 percent of
driver fatalities could have been prevented.(43)
The systems that prevent lane departure in Level-2 vehicle automation appear to significantly
contribute to the reduction of RwD and other crashes. Analysis of mileage and crash data of two
car models in the years 2014 through 2016 revealed that the crash rate of those models dropped
by almost 40 percent after a steering-assistance system was installed. The system used
information from forward-looking cameras, radar sensors, and ultrasonic sensors to detect lane
markings and vehicles ahead to keep the car in its lane via an automated lane-centering steering
control.(44)
A simulation study by Katzourakis et al. examined two systems’ effectiveness in avoiding RwD
crashes in emergency scenarios. The simpler system had haptic feedback and steering torque
such that the human and the machine carried out the maneuver cooperatively. The second
system, which corrected the front-wheel angle, overriding the steering-wheel input provided by
the human, proved more effective in preventing RwDs.(45)
Another simulation study by Scanlon et al. attempted to evaluate the effectiveness of LDW and
LKA systems in preventing RwD crashes, assuming all vehicles in RwD crashes in the U.S. fleet
were equipped with either system.(46) The study found that LDW systems can reduce RwD-crash

18
frequency by 26.1 percent and serious injuries by 20.7 percent. LKA systems were predicted to
reduce the frequency of RwD crashes by 32.7 percent for the lowest four levels of intervention
and by 51.0 percent for the highest level. The reduction in seriously injured drivers ranged from
26.1 to 45.9 percent. The baseline case had neither LDW nor LKA systems.
Effectiveness of Lane-Departure Systems
Though many studies have shown that lane-departure systems are beneficial, their practical
effectiveness is not as great as their expected benefits. The most important reason for the lower
effectiveness of such systems is the difficulty of correctly detecting lane markings. Lane
markings must be identified in a noisy environment. The markings can be obscured by parked
and moving vehicles or shadows from utility poles, trees, buildings, vehicles, and other objects.
Also, sharp curves, irregular lane shapes, and merging lanes; writing and other markings on the
road; unusual pavement materials; and poor lighting can make markings difficult to recognize.
The markings themselves may be of poor quality. A recent review of lane-detection technologies
suggested that more work needs to be done on developing better algorithms for detection of lane
markings on straight and curved roads so that the algorithms are robust enough under different
weather conditions.(47)
Kusano and Gabler evaluated the relevance of the LDW confirmation test to real-world RwD
crashes.(48) The study was based on supplemental crash reconstructions of 890 RwD crashes from
the National Automotive Sampling System. The results found that the system’s confirmation test
captures many of the conditions observed in real-world RwDs (e.g., the median speed of the
vehicle at the time of the lane-departure crash was about 49 miles per hour, which is close to the
45 miles per hour specified in the test). However, there were some aspects of real-world RwDs
not included in the test (e.g., the confirmation test is performed in daylight, while nearly half of
all RwD crashes occur in the dark), and the confirmation test is only performed on straight road
segments, while more than half of real-world departures occur on curves. In addition, the lateral
departure speed specified in the confirmation test is 1.1 miles per hour, whereas the mean lateral
departure speed of the real-world crashes was 9.5 miles per hour. The authors suggested that the
design of future performance tests should be more representative of the real-world crashes.
The Highway Loss Data Institute (HLDI) analyzed insurance claim frequency of vehicles
equipped with driver-assistance systems and found LDW systems to be ineffective at reducing
the number of collisions.(49) The authors surmised that drivers are tempted to tune out the
warning or completely turn off the system because they are getting too many false alarms. HLDI
suggested that LKA systems that actively keep a vehicle in its lane without depending on the
driver’s response may be more effective than a mere warning. A similar study that was based on
regression analysis of insurance claim data for vehicles equipped with advanced driver-
assistance systems found that LDW systems were associated with increases in the number of
damage and first-party injury claims.(37) Its analysis showed higher claims for two models
equipped with LDW systems and an insignificant claim reduction for a third model. It suggested
that the expected benefits of LDW systems may be overrated in the literature.
Driver Acceptance of Lane-Departure Systems
Partly because lane-detection systems suffer from many false alarms, driver acceptance of the
systems is poor.

19
A recent study on activation rates (i.e., whether turned on or off) of LDW and Forward Collision
Warning (FCW) systems at one manufacturer’s dealership service centers revealed that the
activation rate for FCW systems was much higher than that of LDW systems.(50) Of the 265
vehicles observed to have both systems, only 33 percent had the LDW system turned on, while
all except one had the FCW system turned on.
A similar study revealed the experience of drivers of another make with FCW and LKA
systems.(51) In this study, 88 percent of drivers drove with the FCW system turned on, while only
13 percent of the drivers turned on the LKA systems. Likewise, 46 percent of the respondents
indicated that they sometimes used the LKA system, 29 percent of the respondents indicated they
rarely used the system, and 12 percent never used it at all. Such low use of LKA systems could
be due to LKA systems being turned off by default. In all, 71 percent of the drivers who owned
vehicles with LKA systems before indicated they are less likely to have LKA systems activated
again.
A study by Eichelberger and McCartt on the experience of drivers of a model with crash-
avoidance systems reported that 59 percent of drivers left the LDW system activated, whereas
more than 80 percent left the FCW system activated.(52) This higher percentage of drivers leaving
LDW systems activated could be because this system is on by default.
The high rate of false alarms adversely affects acceptance of LKA systems.(53) In their study,
27 percent of survey respondents thought they received a false alarm from the LKA system on at
least one occasion when they did not drift out of their lane. This happened in situations when
there were old markings or stains on the road (43 percent); pavement markings other than lane
markings, such as crosswalks (32 percent); exits, splits, and merges (29 percent); missing or
unclear lane markings (14 percent); heavy rain or snow (11 percent); driving on curves
(11 percent); shadows or brightness contrast (7 percent); and work zones (4 percent). On the
other hand, 25 percent of drivers who used LKA reported that the system should have provided a
warning but did not. This happened in situations when there were missing or unclear lane
markings, inclement weather, and low-speed travels. The most frequent complaints about the
LKA system were that it does not work consistently (21 percent) and is too sensitive (7 percent).
Despite these complaints, drivers perceive that lane-departure systems are useful. Drivers who
used such systems reported that the systems have prevented them from crashing into a vehicle in
another lane (4 percent) or running off the road (34 percent).(51) Recent studies by Navarro et al.
on the effect of false warnings on full or partial lane-departure events revealed that even less
reliable LDW assistance can be beneficial.(53,54) Imperfect LDW systems (i.e., systems with
many false warnings and missed warnings) are able to significantly improve driving performance
in terms of lane-keeping compared to no LDW systems at all. However, full lane-departure and
highly unreliable warnings reduced assistance efficiency, and drivers tended not to trust the
system.
Lane-Marking Recognition
While lane-detection and -tracking techniques have been used in LKA systems, little attention
has been given to the development of lane marking–recognition systems and incorporating them
with LKA systems. Lane marking–recognition systems acknowledge the color (white and
yellow), shape (solid and dashed), and type (center, edge, lane, channelizing, merge, diverge,

20
single, double, work zone, and permanent lines) of lane markings so that LKA systems fully
understand the information that lane markings are intended to provide.
Sensors for lane-departure applications can be passive or active.(50) A video camera with a
machine-vision system is a passive sensor. It responds to light from other sources. Passive
sensors are useful for lane and vehicle detection, but their functionality depends on illumination
conditions and is affected by high variation in the shape of vehicles and cluttered environments.
On the other hand, active sensors transmit energy and respond to its reflection from surrounding
objects. Radar and Light Detection and Ranging (LiDAR) are active sensors. Both are useful for
vehicle distance and speed estimation and are functional in more conditions.
To decrease the false-positive rate of lane departures, lane marking–detection methods that used
the direction of travel of the vehicle to enhance an initial lane-marking detection were proposed
by Sao and Rajkamar.(55) The notion of this approach is that truly detected lane markings should
be oriented to the direction of the travel; otherwise, lane detections are deemed false positives.
This approach demonstrated a decrease of false positives by almost 90 percent. Similarly, to
address the challenges of variation in lane structure, noise, and complex illumination, Nan et al.
proposed a lane-detection algorithm that incorporates prior spatial–temporal knowledge of the
lane markings and their appearances.(56) Their results indicated that this approach had a precision
close to 100 percent. Such methods have the potential to decrease the processing time for lane
detection. Huang et al. proposed lane-marking detection based on adaptive threshold
segmentation with prior knowledge of the level of clutter on the road surface and the special
geometrical features of lane markings, which provided a more accurate extracting of lane
characteristics.(57) Incorporating prior information on the road geometry and lane-marking
features can improve both the processing time and accuracy of LKA systems. Joo et al. have
discussed lane-departure detection based on geographic information systems (GISs) and
enhanced Global Positioning Systems (GPSs), which are called Differential GPSs and have a
location accuracy of inches.(58)
The consequences of lane departures vary depending on the type of lane marking that was
crossed. For example, the severity of crashes caused by departing a yellow, double, solid line
that marks different travel directions is higher than the severity of crashes caused by departing a
white, single, broken line. Accounting for such information in LKA systems would greatly
benefit their performance. A study by de Paula and Jung focused on the real-time detection and
recognition of lane markings by using onboard vehicular cameras in a fully automatic manner
and using feature extraction and classification techniques.(59) Similarly, Rodríguez-Garavito et al.
applied computer vision to recognize and classify lane markings.(60) A recent study by Lu aimed
at incorporating the lane-detection and -tracking systems into lane marking–recognition systems
for ADS applications.(61) The experimental work was conducted on highways and urban roads in
Ottawa, Canada, and the system had an average accuracy of 95.9 percent for detecting lanes and
93.1 percent for recognizing lane markings. Recently, Hoang et al. developed a lane-detection
system that can discriminate between dashed and solid lane markings using visible-light camera
sensors.(62) Their system was tested with the Caltech open database, and the results outperformed
the conventional methods of lane detection.(63)

21
A related area of research that is getting considerable attention is the detection and recognition of
road signs painted on the pavement surface (e.g., arrows, turn-only lane signs, speed limits).(64,65)
Incorporating such systems with LKA can be beneficial, particularly in urban-area driving.
To understand the effect of pavement-marking characteristics on the performance of machine-
vision systems used in AVs, Davies has been conducting a study on suitability of width, color,
and retroreflectivity of pavement markings under dry and wet conditions.(66) Though the study is
ongoing, the preliminary findings indicate that the suitable range of machine vision is 30 to
40 feet, higher levels of retroreflectivity increase detection rates by the machine vision, white
pavement markings are relatively easier to detect compared with yellow markings, wider
pavement markings (6 inches wide) are detected better than narrow markings (4 inches wide),
and wetness severely reduces the detection of lane markings by machine vision.
Several researchers have worked on improving the methodology used for detecting lane
markings in LKA systems (i.e., enhancing the speed and accuracy of the system). For example,
Bhujbal and Narote developed an LDW system based on the Hough transform and Euclidian
distance.(67) Xu et al. developed an algorithm for lane detection and tracking using vanishing
points and particle filters.(68) Mammeri et al. examined various algorithms and outlined their
advantages and disadvantages.(69) Kalaki and Safabakhsh applied lane-matching mechanisms to
detect current and adjacent lanes to facilitate obstacle avoidance for ADSs.(70) Yang et al.
developed a lane-detection algorithm based on classification of the geometrical features of lanes,
which can overcome the problem of lane detection under uneven lighting conditions.(71)
Kawamura et al. developed a lane-support system using radio-frequency identification (RFID)
tags that contain lane information buried under the road surface.(72) Davis and Donath developed
a sensor platform that is useful for producing high-accuracy maps (with position accuracy of less
than 4 inches) of lane markings, which can enhance the effectiveness of LKA systems.(73)
Additionally, Siegel suggested encoding lane information by adding fluorescent pigments to
roadway lane-marking paints so that a vehicle equipped with light transmitters and receivers
would able to detect the lane markings.(74)
An experimental study that assessed drivers’ detection of roadside targets compared the
effectiveness of adaptive and fixed headlights and fixed halogen headlights.(75) The benefits of
adaptive headlights were greatest with low-reflectance targets placed on the insides of curves.
The study unexpectedly found that adaptive headlights better detect targets of low reflectance
than those of higher reflectance. This indicates a need for more research on the best placement
and reflectivity of signs and pavement markings to accommodate adaptive headlights of
manually driven vehicles or AVs.
ADSs Relevant to RwD Crashes
ADSs are emerging vehicle technologies that take full control of the driving task under certain
conditions. Vehicles with these systems are expected to have superior safety benefits though they
are faced with some engineering, legal, and institutional challenges.
22
Challenges of ADSs
A finding from a 3,400-mile study of a vehicle equipped with ADS was that inconsistency in
lane markings between States poses significant problems to AVs. The difference between white
and yellow markings challenged the ADS.(76)
To support the navigation sensors of ADSs, it would be ideal if such vehicles were provided with
information regarding the static characteristics of the infrastructure through which they are being
driven (e.g., number of lanes, lane width, degree of curvature, gradient of the road, shoulder
width, pavement type, and others). For example, Benine-Neto et al. and Gao et al. discussed an
optimization algorithm that determines a safe approach speed for curves to avoid RwD crashes
based on the combination of expected road alignment, shoulder and lane width, surface friction,
and vehicle dynamic features that can be used for navigation by ADSs.(77,78) Such an algorithm
could be supported by providing it with archived information on static features of the
infrastructure (e.g., radius of curvature as well as the number and width of lanes). Edelman et al.
explored how a vehicle can estimate the friction between its tires and the pavement.(79)
Some aspects of ADSs remain not fully addressed (e.g., liability issues, security concerns, and
privacy standards). In addition, the moral implications of machine decisionmaking in the event
of unavoidable crashes are also a concern. Machine ethics and its applications to AVs are
discussed by researchers who claim such cars need to replicate (or possibly exceed) the human
decisionmaking process.(80,81)
Benefits of ADSs
Several researchers, government agencies, consulting firms, and other private enterprises
conducted studies with the objective of predicting the successful deployment and market-
penetration rates of vehicles with ADSs. Such vehicles are expected to significantly reduce the
frequency of crashes. Considering that 40 percent of fatal crashes involve alcohol, distraction,
drugs, or fatigue, Fagnant and Kockelman observed a potential for ADSs to reduce crash
frequency by at least 40 percent. If other crash causes are considered (e.g., speeding, aggressive
driving, overcompensation, inexperience, slow reaction times, inattention, and various other
driver errors or limitations), the potential for crash reduction can be more than 40 percent.
Fagnant and Kockelman predicted vehicles with ADSs to be 50 percent safer than vehicles
without at the stage of 10-percent market-penetration rate and 90 percent safer at a 90-percent
market-penetration rate.(82)
The safety advantage of ADSs relies on two main components: shorter perception–reaction time
and longer sight distance. West highlighted that the onboard computer in such vehicles takes
only 0.2 second to detect an object on the road, while human drivers take an average of
1.2 second.(83) Similarly, the LiDAR laser beams and cameras in these vehicles have a safe sight
distance (safe visibility range) of 650 feet, compared to only 150 feet for human drivers.
Bansal and Kockelman forecasted the long-term adoption rate of CV and AV technologies in the
United States based on survey data on willingness to pay (WTP) for these technologies and the
assumptions of 5 and 10 percent annual drops in technology prices and of 0, 5, and 10 percent
annual increments in Americans’ WTP.(84) Their study also revealed that more than half the
respondents were not willing to pay anything to add high levels of driving-automation

23
technologies, and the average WTP of all respondents and of those with nonzero WTP were
found to be $5,551 and $14,589, respectively. Their long-term fleet-evolution estimate was that
Level-4 automation is likely to be adopted by 43 percent of the vehicle fleet in 2045. The authors
suggested that, as the public learns more about the benefits of such vehicles, the perception of the
cost of the technologies may change.
Fagnant and Kockelman predicted that the social effects of ADSs in the form of crash savings,
travel-time reductions, fuel efficiencies, and parking benefits are likely on the order of $2,000
per year per vehicle.(82) If comprehensive crash costs are accounted for, the benefits could
increase to $3,000 to $5,000 per year. Assuming only 10-percent market penetration, the annual
U.S. economic benefit from ADSs could be around $25 billion. When including broader benefits
and high penetration rates, such vehicles may save the U.S. economy roughly $430 billion
annually.
A study by Blanco et al. compared the crash rates of an AV in on-road tests with crash databases,
drawn from police-reported crash data and crash data from the second Strategic Highway
Research Program (SHRP2) Naturalistic Driving Study (NDS).(85) The overall crash rate of the
self-driving car operating in automated mode was found to be 3.2 per million miles, while the
national crash rate was 4.2 per million miles after applying controls for unreported crashes and
crash-severity levels. The results suggested that ADSs have the potential to promote safety of the
roads. However, the authors were not able to draw firm conclusions about relative effect on
injury and fatality crashes since such vehicles are not driven enough miles to make or be
involved in a crash with a serious injury or fatality.
Considering that crashes are rare events and that vehicles with ADSs have been introduced only
recently and are driven far fewer miles than conventional vehicles, quantifying the safety
benefits of ADSs unequivocally would be difficult. Kalra and Paddock conducted a study that
aimed to determine how many miles of driving it would take to evaluate the safety of ADSs
reliably and make statistical comparisons with the performance of human drivers without any
ambiguity.(86) Their results suggested that demonstrating the safety of such vehicles would take
tens or even hundreds of millions of miles of driving. A hypothetical fleet of 100 vehicles with
ADSs being driven 24 hours per day and 7 days per week at an average speed of 25 miles per
hour would require years to accumulate this many miles. Their finding implied that ADSs’ safety
performance could not be practically evaluated based on real-world testing but should focus on
methods like accelerated testing, virtual testing and simulations, mathematical modeling and
analysis, scenario and behavior testing, and extensive tests on hardware and software systems.
Addressing RwD Through CVs
CVs use wireless DSRC to exchange mobility and safety information with other vehicles on the
road (V2V), with roadside infrastructure (V2I), and other features (V2X). This exchange of
information is expected to provide significant benefits in safety, efficiency, mobility,
infrastructure, and fuel consumption.(28)
Equipped vehicles broadcast their information (e.g., location, speed, and acceleration)
10 times per second in a format known as the Basic Safety Message (BSM). CV technology
provides a platform for critical safety and mobility messages to be tailored for an individual

24
vehicle. Some of the CV safety applications are in forward-collision avoidance, blind-spot
detection, lane departure, electronic brake lights, and intersection conflict avoidance. NHTSA
indicated that CV technology could address up to 80 percent of the crash scenarios involving
nonimpaired drivers.(87) Richard et al. provided some guidelines on the design of safety warnings
for V2V and V2I applications.(88)
Bansal and Kockelman forecasted the long-term adoption rate of CVs based on WTP.(84) The
average WTP for adding connectivity to a vehicle was found to be $110. Their fleet evolution
estimate was that 60 to 80 percent of U.S. vehicles will have CV technology in the year 2045,
assuming NHTSA issues no regulation mandating the technology.
In the context of RwD crashes, CV technology can be beneficial to warn drivers of traffic and
roadway conditions that can give rise to RwD crashes. For example, CV technology can be used
to warn of upcoming curves, lane drops or closures, merge situations, spot weather conditions,
speed reductions around work zones, and the presence of debris on roadways. Chang et al.
discussed the benefits of CV applications in greater detail.(89) Altan et al. also discussed the
application of CV technology for integrated warning systems for lane drifts, lane changes, and
blind spots.(90)
The effectiveness of V2V connectivity might not be as good as V2I on low-density roads
because the transmission range of DSRC-based messages might be negatively affected due to
network fragmentation. In addition, the communication range may be shortened due to foliage
and building effects. Considering that RwD crashes commonly occur on low-density, rural
highways and at specific road locations, like curves and lane drops, V2I can be advantageous
over V2V. The study by Shagdar and Muhlethaler demonstrated how DSRC-based V2V and V2I
connections can be used to support vehicle merge control.(91) The result of their study indicated
that, for the merge-warning application, V2I-based communication is preferred over the V2V-
based systems due to its ability to reliably provide information at consistent time intervals.
Speed-Management Applications
Speed management using CV technology involves advanced vehicle-control algorithms that
adjust the approach speed of vehicles based on real-time traffic and infrastructure information.
In the context of RwD crashes, speed-management applications of vehicles using V2V and V2I
technologies can be used for warnings related to curves, lane drops, work zones, and spot
weather. In such applications, CVs are warned of the downstream traffic and infrastructure
statuses and are advised to maintain a suitable speed to avoid RwD crashes.
CSW Applications
The CSW application of V2I technology is intended to reduce RwD crashes by alerting drivers if
their approach speed is expected to cause loss of vehicle stability in the curve. Stephens et al.
wrote a concept of operations for the application.(92) An ongoing project at the University of
Minnesota is developing a warning system for lane departures and curve speeds that can be
integrated in an onboard, V2I unit that uses ordinary GPS receiver technology and commonly
available mapping data.(93)

25
Dahmani et al. developed a methodology for warning of curve departure by integrating vehicle
dynamics with an estimated curvature of the roadway.(94) The system works based on inputs from
a fuzzy observer that estimates the road curvature and compares the estimate with the curvature
of the vehicle’s trajectory. In addition, input from steering dynamics is considered. The
difference between the estimated road curvature and vehicle-trajectory curvature is used as an
indicator of the risk of RwD crashes; if the risk is found to be greater than a given threshold, an
alarm is triggered.
Precrash scenarios that are addressed by the CSW application lead to 169,000 crashes and
5,000 fatal crashes annually, which have a total estimated cost of $29,080 million.(89,95)
These applications require a road inventory with the locations and degrees of the curves and
current information on the surface conditions or, at least, the weather.
Applications for Temporary Speed Restrictions
The speed of traffic may be temporarily reduced by factors such as work zones, adverse weather,
traffic queues, and incidents. The application of CV technology for warning drivers of upcoming
reduced-speed areas has been demonstrated by many researchers. For example, Timcho et al.
showed the use of V2I technology for weather-warning and reduced-speed-zone-warning
applications.(96) Drivers are warned of the upcoming adverse spot weather conditions and are
advised to reduce their speed through V2I messages. A similar application of CV technology
provides drivers with pertinent lane and speed guidance to navigate safely through an incident
area or work zone.(97) Stephens et al. demonstrated that CV technology can be effectively used to
recommend an optimal speed for harmonizing with other traffic.(98)
Road Weather–Performance Management
CV applications in development provide for two-way communication of weather and surface
conditions between vehicles and infrastructure.(99) The Motorist Advisory Warnings based on
Pikalert® data were used by the road weather–performance management application to provide
drivers with assessments on visibility, road conditions, and road precipitation. Information on
road and weather conditions is taken from connected snowplows or other agency fleet vehicles.
The data are processed and then pushed to travelers as in-vehicle advisories and alerts in near
real time as well as through Web-based user interfaces (computers, tablets, and smartphones).
The mobile application keeps drivers abreast of changing road-weather conditions. Hill
developed a concept of operations for how vehicle connectivity can be used to warn of adverse
road-weather conditions.(100)
Lane-Level Localization Using CVs
Applying CV technology to prevent RwD crashes requires lane-level localization of vehicles
(e.g., applications for lane-encroachment warning and merge warning due to lane drops). DSRC-
based positioning systems satisfy the need for accuracy, availability, continuity, and low cost, all
of which can be useful for collision avoidance, LDWs, and AVs’ lateral or longitudinal control.
Alam et al. conducted a study on the use of the DSRC carrier frequency offset for the
instantaneous lane-level positioning of CVs.(101) The system is based on V2I technology, through
which two roadside beacons broadcast their positions and the geometry of the roadway lanes and

26
a CV uses the data contained in these signals and odometer-based speed to estimate its
instantaneous position along the road and the lane. The accuracy of the proposed system
increases with the speed of vehicles, with the probability of false alarms and missed detections
being almost zero. Such systems can be used for guiding traffic on highways, lane-level
management of traffic, and LKA applications. Liu et al. also demonstrated the use of roadside
units (RSUs) as fixed-position references to improve positioning accuracy.(102)
Similar studies by Ansari and Wang developed a V2V and V2I DSRC-based vehicle-positioning
platform that enhances vehicle position for the use of critical transportation safety applications
that require accurate position of vehicles (e.g., LKA applications).(103,104) Wang et al. developed a
DSRC-based methodology for vehicular positioning using a distributed multiple-model Kalman
filter.(105) The vehicle-location error in their system was 35 to 72 percent less than that of the
standalone GPS method, depending on different traffic intensities and the CV penetration rates.
Identification of High-Risk Locations Using CVs
Crash-prone locations have traditionally been identified by the high incidence of crashes over a
period of years. Smith et al. demonstrated the use of data from CVs for crash-prone locations
using the near-crash events in which drivers took last-second and extreme evasive actions (such
as swerving or skidding) to avoid imminent crashes.(65) Such evasive maneuvers, extracted from
data logs of CVs, along with the GPS location can be used as a surrogate for crashes in general
and for RwD crashes in particular due to poor infrastructure design (e.g., sharp curves, low
friction, poor visibility, lane drops, and others). Transportation agencies can then use such data
for identifying hot spots and implementing corrective actions without waiting for significant
numbers of crashes to occur.
A similar application of CVs identifies roadway spots with temporary hazards by reporting
vehicles with their hazard lights turned on and low-friction spots to other vehicles and road-
maintenance agencies.(106) Traffic-management agencies can use the real-time information to
optimize traffic lights, vary speed limits, and reroute traffic.
TECHNOLOGY TRENDS TO WATCH
A few topics do not fall into the category of conventional RwD countermeasures or the emerging
technologies of CV and AV. Lessons from these topics have the potential to advance the
effectiveness of the conventional RwD countermeasures and support emerging CV and AV
technologies.
Understanding Lane-Keeping Behaviors of Drivers
Drivers’ lane-keeping behaviors are directly relevant to the occurrence of RwD crashes.
Therefore, understanding how drivers maintain their lanes and what factors lead them to deviate
from their traveled lanes is critical for designing RwD countermeasures. Studies on lane-keeping
behaviors of drivers that used naturalistic driving data are worth exploring because they shed
light on the actual behaviors of drivers and on how they interact with lane markings on straight
road segments and horizontal curves.

27
Johnson et al. conducted a study on lane-keeping behaviors of drivers using data from the
100-car NDS.(107) The objectives of the study were to understand the distribution of the lane-
keeping position during normal driving, derive a relationship between the lateral velocity and
lateral distance of lane boundaries, and examine correlations of lane-keeping position with lane
width and radius of curvature of the roadway. Their findings indicated that drivers have higher
lateral velocities and deviate further from the lane center as the width of the lane gets narrower
and road curves are sharper. In addition, as drivers approach the lane boundary, their lateral
velocities tend to decrease. The authors indicated that this could be the cause of premature
warnings in LDW systems that lead to driver annoyance. The result of the study suggested that,
to improve the timing and driver acceptance of lane-departure systems, the system should be able
to learn and be calibrated based on individual driving behavior rather than using information
from an entire driving population. Similarly, the normal lane-keeping behaviors of drivers may
vary from country to country based on the lane-width and road-curvature standards of the
countries, and thus, lane-departure systems may need to be calibrated accordingly.
To address the interaction between driver behavior, roadway environment, and the likelihood of
lane departure at rural horizontal curves, researchers conducted several studies with the
objectives of determining what environmental, roadway, driver, and vehicle factors influence
whether a vehicle departs its lane and what factors influence the outcome of the lane departure at
curves.(12) Hallmark et al. conducted a study that used the SHRP2 NDS and Roadway
Information Datasets.(108) The results of the study suggested that the simple presence of curve-
warning signs does not mitigate RwD crashes. Right-side lane departure is 6.8 times more likely
on the inside of a curve than the outside of a curve. Males are up to four times more likely to
have left-side lane encroachment than females. Guardrails may provide feedback to the driver
about the sharpness of the curve, delineating the curve more clearly. Raised pavement markers
decreased the probability of exceeding the posted speed limits, resulting in better speed selection
and decreased risk of an encroachment. The study also found that driver age and upstream
approach speed have significant effects on speed within the curves. This implies that
countermeasures for RwD crashes at curves should address speed management, not only at a
curve, but also upstream of the roadway before entering a curve.
A similar study by Oneyear et al. found that initial lane position, distraction, shoulder width, and
curve delineation affect the likelihood of lane departure on two-lane, rural curves.(109) The results
indicated that the lane position within the curve was correlated with the lane position upstream of
the curve; drivers who glanced down were found to drift about 1 foot from the center of the lane
toward the inside of the curve; in left-hand curves, large paved shoulders were associated with
drivers drifting toward the outside of the lane more than small paved shoulders; and lower
visibility delineation was correlated with drivers driving more toward the center of the two-lane
roadway on left-hand curves.
One shortcoming of advisory speed signs is that they cannot consider variability in the driver’s
actions, vehicle dynamics, and road characteristics. An infrastructure-based dynamic curve–
speed warning was developed by Rey et al. for light vehicles based on probabilistic RwD-risk
assessment, which considered the variability in approach speed, lateral speed, lateral
acceleration, and lateral position.(110) Data were collected using low-cost sensors for measuring
speed 150 feet before the curve entrance as well as sensors for measuring speed and lateral
position at the curve entrance. The methodology triggers an alarm in the case of potential RwD
28
due to loss of vehicle control given the longitudinal and lateral speed and vehicle acceleration
while negotiating a curve. The study found that lateral position and speed at the curve entrance
have a significant influence on the RwD risk. Their study was tested on multiple two-lane, rural
curves in France.
A recent study by Ghasemzadeh and Ahmed analyzed the complex effects of weather, speed
limit, and traffic conditions on drivers’ lane-keeping behaviors.(111) The study found the standard
deviation of lane position in heavy rain conditions was 3.8 times more than during clear weather.
In addition, the standard deviation of lane position when traveling on low-speed roads (speed
limit less than 55 miles per hour) was found to be 15 times more than that of high-speed roads.
The lane position’s standard deviation was found to decrease as traffic density increased (i.e., the
standard deviation of lane position was 4.8 times more in free-flow conditions than in congested
traffic conditions).
RwD-Crash Risk Index
Several models have been developed with the objective of predicting the frequency and severity
of crashes on highways per the Highway Safety Manual and safety performance functions.(112)
Such models function based on the relationship between crash histories, volumes of traffic, speed
limits, and key infrastructure features. For example, Brimley et al. developed a methodology for
calibrating the models used for estimating the crash frequency and severity in the Highway
Safety Manual.(113) In a similar fashion, RwD-crash risk indices could be developed to identify
the key infrastructure features related to RwD crashes and also provide an RwD risk score for
highway segments; this information could be coupled with navigation and LDW systems to
enhance these systems’ performance.
Similarly, Miaou developed a model for predicting RwD-crash frequency and severity on rural,
two-lane, two-way roads and rural, multilane highways.(114) In order to develop a roadway crash-
risk model that is independent of crash-history data, Leur and Sayed and Leur and Hill developed
a methodology for presenting a road-safety risk index to quantifiably assess safety
performance.(115,116) The index was the product of the exposure to unsafe situations (i.e., the
number of vehicles), the probability of the occurrence of unsafe events (i.e., the chance of a
vehicle being in a crash), and the consequences of the unsafe events (i.e., the severity of a crash).
This safety-evaluation technique potentially identifies roadway segments that experience low
crash frequency but high crash severity.
Rosolino et al. developed a road-safety performance index that estimated the risk derived from
infrastructure features, namely crash history, intersection or on–off ramp densities, pavement
anomalies, horizontal and vertical curves, and roadside and safety barrier deficiencies.(117) The
risk associated with the specific traveled road segment is given to drivers based on their driving
speed. The system uses multiplatform mobile applications and GPSs to deliver the warning.
More recently, Jalayer and Zhou conducted a study on estimating the safety risk of roadside
features by treating clear zone width and side-slope as two continuous variables rather than as
discrete binary variables.(22) The study quantitatively evaluates the practical benefits of clear
zone widths and side slopes. It enables road-safety audits and road-segment risk evaluations for
prioritizing infrastructure treatments. A similar study by Carrigan and Ray described a

29
methodology for predicting the severity risk of RwD crashes based on the combination of crash-
based and encroachment-based approaches with the objective of improving highway safety.(118)
The authors claim that their methodology was suitable for developing jurisdiction-specific
models.
It is evident that the severity of an RwD event strongly depends on the characteristics of the
infrastructure’s static features where the departure occurred. Developing a map that contains the
information regarding the degree of hazards on and near the road (e.g., road geometry, presence
or absence of guardrails and ditches, and the nearby terrain) can significantly increase the
effectiveness of LKA systems. Arora et al. conducted a study on improving a current lane-
departure system by integrating it with a preprocessed map that contains relative severity levels
of anticipated RwD events based on the characteristics of the static near-road hazards.(119) Their
work built on the severity index developed in the Roadside Safety Analysis Program as an
indicator for the risk of the RwD severity.(120) They accounted for barrier types, locations of trees
and utility poles, pavement-edge dropoffs, outside-edge foreslopes or backslopes, and median
widths and slopes. These indices are preprocessed and mapped. Given the RwD-hazard map and
indices, road segments are then categorized as low risk, medium risk, or high risk for an RwD
event. Based on the anticipated severity of RwD events, the type and intensity of the warnings
and compensations applied by LKA systems can be adjusted to make them responsive to
anticipated risks. The preprocessed hazard map and indices eliminate the need for expensive
onboard sensors for detecting the permanent objects on or near the road.
Road-Information Inventory
Road-information inventory is the process of identifying objects on the road or in its proximity.
Such objects include the road surface itself, signs, road markings, guardrails, curbs, poles, trees,
and structures near the road. Information (e.g., the types, positions, and conditions of objects)
stored in a GIS in the form of various map layers can be easily retrieved for many uses.
Advanced road-information inventory can be stored in high-resolution, three-dimensional (3D)
maps. In the context of RwD crashes, an inventory can be useful for many purposes (e.g.,
providing navigation during adverse weather conditions and deriving an RwD-crash index),
which smart vehicles can further utilize to drive more cautiously at high-risk segments and try to
minimize the outcomes of RwD crashes if they occur.
Previously, the process of compiling a road inventory required a substantial amount of manual
work to collect data from field measurements and postprocess the data, making it time
consuming and expensive. Motivated by the need for an economic solution with improved
capabilities, many researchers attempted to develop a system for an automatic or semiautomatic
road inventory, using remote sensing technology for detecting and extracting road surfaces and
objects. The process includes feature extraction from images and data fusion. Though automatic
road inventory is appealing, some traffic signs could be heavily obstructed, making automatic
detection difficult.
Automatic road inventory is conducted with image-based and laser-based mobile mapping
systems. Recently, more attention has been given to laser-based mobile mapping since the
performance of image-based mapping systems is limited by illumination, lighting and weather

30
conditions, and shadows cast by buildings and trees. These systems suffer from distortions. One
type of laser-based mobile mapping applies LiDAR.(121)
LiDAR can rapidly collect enormous volumes of highly dense, irregularly distributed, accurately
georeferenced data in the form of 3D point clouds. Landa and Prochazka worked on developing a
semiautomatic road inventory–registry process, using LiDAR for traffic signs, road markings,
and general pole-shaped objects (e.g., street lights and trees). The successful detection rate of
signs was 93 percent.(122) A similar study by Sairam et al. developed a mobile mapping system
for 3D road-asset inventory.(123) A recent study by Zhang applied LiDAR for rapid inspection of
pavement markings.(124) Gargoum et al. have successfully used LiDAR point-cloud images for
automatic extraction of highway signs along with their conditions, coordinates, and elevations
with a high precision and success rate, ranging from 93 to 100 percent.(125) Guan et al. reviewed
literature on LiDAR and its application for road-information inventory. Their detailed review
demonstrated that mobile LiDAR technology has a great potential for automatic road
information–inventory registry through accurate 3D geospatial information on roadways,
including road markings, signs, road surfaces, pole-like objects, and structures such as manholes,
sewers, culverts, and tunnels.(121)
To improve the capability of ADSs in adverse weather conditions (e.g., snow and rain),
researchers developed a solution based on road-information inventory, which is a high-
resolution, 3D, digital map that includes detailed data about road markings, signs, geography,
topography, and landmarks.(126) The effectiveness of high-resolution, 3D, digital maps has been
demonstrated in a simulated urban environment known as Mcity through the University of
Michigan’s Mobility Transformation Center. The team demonstrated the ability of its ADSs to
navigate effectively in snowy and other poor weather conditions.
High-resolution, 3D maps have been created for locations in Silicon Valley, Michigan, France,
Germany, and Japan; these maps have also been made available to ADS developers.(127) LiDAR-
equipped fleets of cars and advanced processing technologies are used to create these high-
resolution maps. These high-resolution, 3D maps must be regularly updated to capture the
changes in the conditions of the road and its environment (e.g., new road additions and detours
due to work zones). These maps can be updated in real time so that a vehicle can react to road
changes in a timely manner. High-resolution maps have been developed for Mcity in Michigan;
parts of Route 101 and Interstate 280 in San Francisco, CA; part of Autobahn A9 in Munich,
Germany; and a freeway stretch on Francilienne (N104) between A6 and A10 in France. Figure 7
presents a high-definition 3D map created for Mcity.

31
Image © HERE Technologies; used with permission.
Figure 7. Photo. High-resolution, 3D map for use by AVs in Mcity.(127)
Similar to the LiDAR-based, high-resolution, digital maps, Du and Tan developed an effective
image-based road-information inventory using stereo 3D reconstruction to estimate vehicle
localization.(128) Based on image sequences taken under different conditions, the experiment’s
results showed that the proposed system can identify lane markings with an accuracy of
98.6 percent. Considering that correct lane-marking detection supports AV navigation, such
high-resolution, digital maps of road-information inventory are crucial for supporting AV
navigation under clear and adverse weather conditions.
Public and private vehicles drive the roads gathering information on the infrastructure for various
purposes, ranging from mapping features, to recording sign messages, to assessing conditions.
The Ohio Department of Transportation (Ohio DOT) uses the van in figure 8 to collect data on
roughness, pavement distress, rutting, and surface macrotexture.(129)

32
Source: Derek Troyer, Ohio DOT.
Figure 8. Photo. Ohio DOT van precisely tracks its position relative to the roadway as it
gathers data on pavement conditions.
Addressing RwD Through Enhanced Infrastructure
Simple and futuristic developments in lighting and pavement might affect RwD crashes. CVs or
AVs could benefit from adaptations of these innovations.
Enhanced Lane Markings
To make lane markings more visible to the human eye and machine-vision techniques, many
researchers have developed variations of lane markings. Such markings could be beneficial to
rural roads, where the frequency of RwD crashes is relatively high.
Light emitting diode (LED) raised pavement markers are solar-powered, illuminated markers
that provide better visibility of roadway edge lines and center lines during nighttime driving and
poor weather conditions.(130) These markers are similar to standard retroreflectors but contain
small LEDs and sensors that can automatically turn on the LEDs when ambient light is below a
specified threshold. Such LED markers can be set to flash to warn drivers when their speed is
excessive. One LED raised pavement marker costs approximately $50, including material and
installation. A similar technology is the flush-mounted, snow-plowable LED pavement
marker.(131) Such markers provide over 30 seconds of reaction time, whereas conventional
retroreflective road studs provide 3.2 seconds at 62 miles per hour.
Lane markings that glow in the dark are being introduced in the Netherlands on N329 in Oss.(132)
Their objective, as part of the Smart Highway project, is to increase visibility and safety. The
paint used for the lane marking contains photo-luminizing powder, which releases a green glow
in the dark for up to 8 hours after being charged during the day. However, such lane markings
were found to be sensitive to moisture, and their effectiveness declined drastically during
rainfall.
33
Like the glowing lane markings, dynamic paint has been proposed in the Netherlands.(133) The
temperature-sensitive paint contains thermochromatic pigments that become visible when the
surface is unusually cold.
Given the limitations of vision-based systems, radar-based systems could be advantageous for
their high range, high resolution, and functionality in more weather conditions. A recent study by
Clarke et al. investigated the possibility of using a vehicle-mounted, synthetic aperture radar to
detect radar scatters embedded in the road infrastructure.(134) Preliminary simulation results
indicated the technique can fully resolve both clutter and radar reflectors.
Smart Roadway Lighting
The relationship between safety and roadway lighting is strong. Standard street lighting provides
constant illuminance regardless of roadway conditions or real-time roadway usage. Smart
roadway lighting provides adequate levels and quality of lighting in response to where and when
it is needed and adjusts to current weather conditions. Its uniformity of lighting and controlled
glare benefit visual perception. Gibbons et al. analyzed the relationship between levels and
quality of lighting and crash rates and provided guidelines for adaptive roadway lighting
design.(135) Foote and Woods developed LED-based smart roadway lighting with
communications and lighting network–management software.(136) The Rhode Island Department
of Transportation installed LED-based roadway lighting on the Sakonnet River Bridge. This
lighting can adjust its color and brightness as needed.(137)
The Virginia Tech Transportation Institute (VTTI) developed and implemented on-demand
lighting—an adaptive, overhead roadway lighting that uses CV technology, which is suitable for
roadways with little traffic at night and higher crash rates.(138) The system uses DSRC, CV
infrastructure, centralized wireless lighting controls, and LED luminaires. The concept is that a
CV sends its location, speed, and route to a central traffic management center (TMC) through
DSRC. Based on this information, the TMC will be able to identify which luminaires are
required to be lit in front of the vehicle. Participants in the pilot project felt that the system
provided a safe driving environment and did not find the on-demand lighting distracting.
However, VTTI did not consider what level and quality of lighting to use.
The concept of interactive lights was proposed in the Netherlands.(139) The idea is that sensors
detect the motion of vehicles, light their ways, and then gradually turn off to reduce energy
consumption. In addition, the interactive lights can change color to give feedback on the speed of
vehicles.
Navvab et al. examined dynamic lighting conditions in automobiles due to roadway and in-
vehicle lighting conditions in terms of illuminance, luminance, and spectral outputs of several
roadway-lighting systems as well as the drivers’ gaze direction and pupil dilation under mesopic
conditions with application in Smart Cities and Intelligent Transportation Systems (ITS). Such
lighting enhances visibility.(140) In general, smart roadway lighting can benefit rural and low-
volume roads.

34
Specialized Pavement Surfaces
The concept of smart pavement surfaces is to communicate with smart vehicles.(141) Preliminary
projects in the United States and the European Union attempt to make the road infrastructure
more suitable to CVs and AVs.
One such surface is tempered safety glass with the ability to harness energy from the Sun.(142)
The panels are said to support the weight of a commercial vehicle and have a traction equivalent
to asphalt. LEDs replace the traditional painted markings, providing better nighttime visibility.
Permanently embedded microprocessors with fixed longitude and latitude offer exact vehicle
location. The Missouri Department of Transportation has a 200-mile pilot project on Interstate 70
and the historic Route 66.(143)
Another concept consists of interlocking, precast concrete slabs embedded with digital sensors
that provide wireless connectivity to vehicles.(144) The pavement includes a digitizer layer that
can identify vehicle tire position, weight, and speed. The pavement can precisely locate a crash
on the road and can recognize if a vehicle departs the roadway and call for help. Demonstration
projects are planned in Missouri and Colorado.(145)
The Forum of European Highway Research Laboratories has initiated the Forever Open Road
Programme.(146) It is designed for adaptability (i.e., to respond to changes in road users’
demands), automation (i.e., to be fully integrated with intelligent communication technology
applications between road users, vehicles, and traffic management), and resilience (i.e., to be
able to maintain functionality under extreme weather conditions). This concept is expected to
provide support to CVs and AVs. The “5th Generation Road” (Route 5ème Génération) and the
“Roads in the 21st Century” (Straße im 21. Jahrhundert) are other similar concepts being
developed in France and Germany, respectively.(147,148)
EFFORTS OF STATES AND INFRASTRUCTURE STAKEHOLDERS ON CV AND AV
TECHNOLOGIES
States and local transportation agencies as well as other infrastructure stakeholders need to be
ready to accommodate changes. This section briefly discusses how States and other
infrastructure stakeholders are preparing for the arrival of CV and AV technologies.
Efforts of States on CV and AV Technologies
Many States have embraced CV and AV technologies and have developed pilot programs;
permitted ADS tests on their public roads; or planned programs, projects, and deployments for
CV and AV technologies. As of August 2016, seven States and the District of Columbia have
enacted ADS legislation and are actively anticipating changes.(149) A few of the States that
showed interest in CVs and AVs are California, Michigan, Virginia, Nevada, Florida,
Washington, and Louisiana.(85,150) California, Michigan, and Virginia have been involved in the
CV and AV arena for a while.
A report by the U.S. Government Accountability Office (GAO) provided a variety of
information and guidance for State and local agencies interested in implementing V2I
technology, including a description of benefits, various State and local scenarios for deployments

35
of V2I technology, underlying infrastructure and communication needs, timelines and activities
for deployment, estimated costs and workforce requirements, and challenges that need to be
addressed.(151)
The deployment of ADSs is at an early stage in the United States. Though this is a great
achievement by itself, it may be unfavorable for wider deployment due to inconsistencies across
States on deployment policies. A national framework for wider adoption of CVs and AVs would
accelerate their deployments.(123,149)
California
California, in collaboration with its academic and research organization partners, has been one of
the leading States to develop and deploy CV and AV applications. The California Department of
Transportation (Caltrans) plans to address its challenges of safety, mobility, environment, and
agency efficiency of its growing population through deployment of emerging transportation
technologies. Recently, Caltrans proposed the One California program for deployment initiatives
of CV and AV technology.(152,153)
Michigan
The Michigan Department of Transportation (MDOT) along with the University of Michigan and
industry partners hosted the USDOT Safety Pilot Model Deployment for CVs. MDOT has
initiated and completed numerous CV and AV projects, has integrated mobile-observation and
vehicle-based data-collection systems, and is planning on the United States’ largest deployment
of CV and highway technologies.(154) In addition, MDOT has recently formed a collaborative
initiative for CVs and AVs called the Smart Belt Coalition.(155)
Texas
Texas has shown interest in CV and AV technologies and assessed the implications of CV and
AV deployments for the State’s local government agencies.(156,157) Considering that the Texas
Department of Transportation is responsible for the Nation’s most extensive State-level road
network, its interest in CVs and AVs can have significant benefits. The State has initiated
projects that developed different scenarios for CV and AV penetration rates. For example, Kim
et al. discussed the potential benefits of these technologies in Texas and their implications on
travel behavior, safety, congestion, and leisure during travel.(158) The result of their study
indicated that the largest benefit for Texas would come from crash savings, which is equivalent
to 57 percent of the total expected benefits at a high market-penetration rate of 90 percent.
Virginia
The Virginia Department of Transportation (VDOT) has been active in the field of CV and AV
technologies along with its main partners, VTTI and the University of Virginia. It has planned,
executed, and evaluated many CV and AV applications. Recent initiatives by Virginia include
the Connected Vehicle Pooled Fund Study, which is expected to prepare the State’s local
transportation agencies for the deployment of CV technologies in Virginia.(159) In addition, the
State has initiated programs like Virginia Automated Corridors and Virginia Connected
Corridors, which seek to address the safety and mobility challenges of the State’s highways
through CV and AV technologies and integrate the applications with the operations of VDOT.

36
Oregon
Recently, the Oregon Department of Transportation (ODOT) conducted a study on preparing the
State for CVs, AVs, and other cooperative applications.(160) The study resulted in a roadmap that
contains 94 recommended actions under 12 categories in the arena of CV and AV technologies.
Efforts of Infrastructure Stakeholders
A National Cooperative Highway Research Program (NCHRP) report for AASHTO outlined an
infrastructure-research roadmap on the research and planning needs for CVs and AVs at the State
and local transportation agency levels.(16) The report identified a number of CV and AV projects
that address infrastructure design and operations, institutional and policy issues, planning issues,
and modal applications. (See the appendix for a list of the projects and brief descriptions.)
Carlson and Poorsartep discussed how infrastructure stakeholders should adapt to accommodate
advances in the field of transportation.(161) The authors highlighted that many of the vehicle
technologies (e.g., machine vision) are designed with little consultation with infrastructure
experts. To accelerate the safety and mobility benefits of the emerging technologies, they
suggested an improved collaboration between infrastructure officials, research organizations, and
automotive industries to devise a common understanding of how the physical infrastructure may
be modified to better accommodate vehicle technologies.
37
CHAPTER 3. NEEDS ASSESSMENT
The previous chapter, Literature Review, discusses the safety issues of RwD crashes and the
capabilities CV and AV technologies offer. This chapter assesses the needs of CVs and AVs so
that the gaps between the states of these technologies and their effective deployments are
identified. The needs were assessed based on three stakeholder-engagement Web meetings that
promoted discussion and experience sharing. The Web meetings are described in the appendix.
CV and AV technologies that counteract RwD crashes have multiple stakeholders. These include
CV- and AV-technology researchers and developers, vehicle manufacturers, State and local
transportation departments, and infrastructure officials. As evidenced in the literature review,
many CV and AV technologies and their applications are designed and developed with minimal
consultation with State transportation departments or infrastructure officials. To accelerate the
safety benefits of CV and AV technologies, improving communication and collaboration among
these stakeholders is important. This communication would lay down a common understanding
of how the physical infrastructure may be modified to better accommodate the emerging
transportation and vehicle technologies. The needs assessment will explore the possibilities of
CV and AV technologies in reducing RwD crashes, how FHWA’s RwD Program can support
CV and AV deployment, and how the Program’s focus may need to adjust to address these
changes in the vehicle and infrastructure technologies. Assessing the needs of CV and AV
technologies can effectively clarify problems and identify appropriate interventions to be
implemented by FHWA and other infrastructure entities. The assessment supported the
development of the research implementation plan, which is discussed in chapter 4.
DISCUSSION POINTS AND LESSONS LEARNED
For systematic presentation of the main discussion points and findings from the needs
assessment, the subject matter addressed in the three Web meetings are combined and
summarized by topic in the following sections.
Standards
New standards are needed to cover new developments; in some cases, more precise standards of
current systems are needed.
Signage and Lane Markings
Observations related to signage and lane markings included the following:
• Well-maintained lane marking can be the most effective short-term solution to the
challenges of AVs.
• The Manual on Uniform Traffic Control Devices (MUTCD) contains standards,
guidance, and options, all of which might be subject to interpretation. Tighter
standardization within and between States would make manufacturers’ jobs easier as
this would increase the probability of the lane markings being recognized by AVs’
machine-vision systems.(4)

38
• A supplemental notice of proposed amendments that proposes a revised set of
standards to be incorporated in the MUTCD, including the federally required
minimum levels of retroreflectivity for pavement markings, was brought to the
attention of the participants during the second meeting. Website links were distributed
to participants after the call.(162)
• White stripes on new concrete can be difficult to see for both humans and machines.
Though it is not required by the MUTCD, some States supplement the white stripes
with black paint, which AV manufacturers have found useful. The trouble is that
there are at least 13 different ways the black paint is applied.(4)
• As with lane markings, styles of signs can vary. AV manufacturers must deal with
this variety. For example, advisory speeds for curves have different margins across
the country.
• Machine-readable signs are being developed through different, incompatible
approaches. Treatments that would be invisible to a human, such as infrared markings
and RFID tags, have been proposed. Quick-response codes and bar codes have also
been proposed.
• Road-sign and -marking standards (e.g., the MUTCD) are based on human factors.
The MUTCD or a supplement can account for machine-vision systems and support
the perception and intelligence algorithms they use.(4)
Mapping
New electronic mapping technology offers advantages to travelers and transportation agencies.
Findings include the following:
• Public and private entities are making maps for various purposes. Among other
reasons, State and local agencies need maps to do the following:
o Maintain inventories for asset management.
o Design improvements based on maps of existing conditions.
o Evaluate sites visually before visiting.
• Sometimes States and manufacturers buy mapped information from private sources.
Private funding has its advantages but comes with unanswered questions of
ownership and responsibility for maintenance.
• Given that there is no mapping standard, there may be differences in the ways the
maps are produced and the information they contain.
• Navigation needs much more precision than an asset inventory. The condition of the
road and roadside can change hour by hour, so a map or inventory must be refreshed
almost continuously.

39
DSRC, V2I Applications, and Messages
Uncertainties for V2I communication are many and include the following:
• More than one State is already investing in V2I equipment such as signal controllers.
They need assurance that their systems will be compatible with the standards that will
be implemented. The systems must be interoperable with the DSRC equipment on all
vehicles.
• Some States are considering deploying RSUs to support V2I communication.
However, States face questions with uncertain answers: Who will develop the
applications for V2I? How do they ensure that V2I applications function the same in
all States? What features will vary and require that the applications differ by State?
• The messages sent and received through V2I communication are still under review.
For example, the contents of a Traveler Information Message (TIM) and the MAP
message, which contain information about road geometry to aid navigation of CVs
and AVs, are being reviewed by the SAE committee, which welcomes more
participation by transportation departments and other infrastructure stakeholders.
Infrastructure Differences for CVs and AVs
CVs and AVs will require different infrastructure than conventional vehicles. Examples include
the following:
• The design requirements of infrastructure components, such as signs, markings, and
medians, would be different for CVs or AVs. Human drivers are in control of CVs, so
conventional signs would still be necessary. Virtual signs, through V2I
communication, would supplement information available to both types of vehicles.
Better pavement markings would benefit both human and machine vision.
• Manufacturers said that State transportation departments do not need to do anything
differently to accommodate AVs, but the departments should do a better job of what
they currently do (e.g., uniform lane marking and signs within and between States).
• Redundancy of information is valuable for many reasons: machine vision is reaching
its limits, signs can be obscured by weather or other vehicles, and pavement markings
fade. One manufacturer preferred DSRC; another, also desiring a broadcast, was
technology neutral. Broadcast information with real-time updates for work zones and
traffic incidents was preferred over maps.
• Providing the absolute location of infrastructure components is not necessary, but
relative location is. For example, if a vehicle obtains information about the number of
lanes and their width, then it can be positioned within its lane relative to a road edge
or guardrail.
40
• Participants believe that CV and AV capabilities are complementary and that both
will be part of the long-term solution. Automakers are perceived to be investing more
in AV technology than in CV technology.
• Work zones that have bright lights in unconventional arrangements can be difficult
for AVs to interpret. Virginia Tech recently finished a study on lighting needs for
humans and recommended a follow-on for machine vision.
Signage, Roadside, and Friction Information
V2I offers the opportunity to deliver valuable information to vehicles in new ways, including the
following:
• Broadcasting sign information in a TIM or encoding it in a MAP is possible. DSRC is
probably less expensive than maintaining actual signs. Adding RFID tags to current
signs is not expensive. Replacing signs for those with machine-readable fonts would
be tremendously expensive.
• If geocoded information on roadside conditions and roadway inventory were
available, AV manufacturers would use it for crashworthiness.
• Real-time surface information, including road-surface friction, is very difficult to
estimate. AV manufacturers would readily use the information if they had it.
Sparse, Rural Areas
Sparse, rural areas present different challenges than urban areas. Such challenges are as follows:
• Providing electrical power to remote RSUs is a problem. Solar energy is not always
the answer.
• The Wyoming Connected Vehicle Pilot Deployment Program is using traveling
vehicles to carry information to other vehicles. That works on an interstate but not on
a less-traveled road. In rural areas, V2I can be more effective than V2V
communication.
• The optimum density of RSUs to support V2I applications in rural areas is not
known. There is a trade-off between the crash-reduction benefits from V2I
applications and deployment costs.
Staff Training
Issues regarding training new staff are the following:
• Transportation departments do not always know what new skills their employees and
contractors need to learn.

41
• Education and outreach will be especially important to smaller county and local
agencies that do not have staff dedicated to keeping up with CV and AV
technologies.
• State-level decisionmakers need to be kept aware of developments in CV and AV
technologies. Executives need to be shown that CV technology is cost-effective in
reducing crashes before they invest in wide-scale deployment.
Collaboration
FHWA and other stakeholders will need to collaborate in the following new ways:
• All participants agreed that vehicle manufacturers, FHWA, and State transportation
departments should work more closely on common interests.
• Manufacturers are working with NHTSA, which is doing much to advance V2V
technology. FHWA could play a similar role in promoting research, standards, and
outreach for V2I technology.
• Wide deployment of V2I systems requires that both transportation departments install
RSUs and manufacturers develop applications on vehicles to use the information.
This is like the “chicken and egg” metaphor as it is unclear whether transportation
departments should first install RSUs or manufacturers should first develop and
perfect V2I applications.
• Infrastructure agencies can play a key role in facilitating the deployments of CV and
AV technologies (e.g., AASHTO’s Signal Phase and Timing (SPaT) challenge was a
step toward successful deployment of V2I applications for signalized intersections).
Efforts could also be applied to other V2I applications relevant to RwD crashes (e.g.,
curve-warning applications).
IDENTIFIED GAPS
Transportation agencies maintain the infrastructure, and manufacturers produce vehicles that
drive on it; both have roles in deploying CV and AV technology. A major gap seen from both
perspectives is the need for collaboration so that their respective products can operate together.
The two stakeholder groups, having complementary roles in highway safety, face different sets
of challenges in realizing the benefits of CVs and AVs in reducing RwD crashes.
A Gap Common to States and Manufacturers
State and manufacturer representatives alike recognized the need for better collaboration.
Collaboration. Infrastructure officials, vehicle manufacturers, and State and local transportation
departments need to work jointly toward common goals and objectives. Doing so will require
frequent and open communication among stakeholders. Vehicle manufacturers have worked
more closely with NHTSA on V2V and AV technology than they have with FHWA. To advance
V2I technology, FHWA and vehicle manufacturers can increase their collaboration and benefit

42
from the increased levels of commitment, integrated objectives, clearly defined roles and
responsibilities, shared understandings, and common assumptions. Frequent and continual
collaboration would provide a means to answer the stakeholders’ questions. This would reduce
uncertainty, which can possibly reduce costs as miscommunication and work duplication are
avoided.
Gaps as Perceived by Transportation Departments
Representatives of State transportation departments brought several needs to the attention of
FHWA.
Justification for the Investment. Executives and decisionmakers at State and local levels need to
be shown the safety, mobility, and environmental benefits of CV and AV technologies. They
need to justify the initial, operating, and maintenance costs. Participants observed that the
challenge for justifying investment in these technologies is that many of the benefits are
demonstrated through experimental, small-scale, or short-term pilot programs. Decisionmakers
would like to see benefits demonstrated in large-scale and long-term deployments. These large-
scale demonstrations in real-world scenarios can be time-consuming and resource-intensive
tasks.
Assurance of Future Compatibility. Some State transportations departments are installing
equipment that supports V2I communication and others are considering installing it soon.
However, States are concerned whether the equipment will be compatible with future V2I
communication standards. Another compatibility issue is whether V2I equipment and
applications will work across different States. This poses a critical challenge to States’
investments in the technologies and their wider deployment. The gap is, as emphasized by one
participant, the lack of standardization of V2I equipment and applications. Guidance is also
needed on how to install the equipment and what density will support current and future efforts.
Funding and Guidance. Though some State transportation departments are willing to deploy and
support advanced vehicle technologies, they lack the funding needed for the equipment and
training their staffs on how to install, operate, and maintain the equipment. Participants
highlighted that this challenge can be greater for local and small county agencies that lack
resources and staff dedicated to monitoring developments in CV and AV technologies. State
transportation departments need guidance to answer the questions or reservations they have at all
levels of their organizations.
Gaps as Perceived by Vehicle Manufacturers
Vehicle manufacturers noted several actions that could be taken by the FHWA and its State and
local partners to facilitate the deployments of CVs and AVs.
Clearly Visible Lane Lines. Foreseeable AVs rely primarily on edge lines for navigation.
Therefore, readily detectable and unambiguously interpretable lines are paramount. Gaps
preventing further expansion (or proper operation) of AVs are lines that are difficult to detect in
certain circumstances or ambiguous. Pavement seams or linear patches, in some cases, run nearly
parallel to travel direction but do not demarcate the lane. Temporary lines for work zones may
not be recognized as such, or former lane lines that have been milled may be misinterpreted as

43
current. These challenges need to be addressed by transportation agencies responsible for the
markings, automakers, or collaboration between the two. The MUTCD presents two challenges.
The impossibility of anticipating every roadway situation has led the MUTCD to include
standards, guidance, and options.(4) The flexibility of the guidance and options presents a host of
markings to automakers. Furthermore, a long deliberation time (one participant observed that the
rulemaking on visibility maintenance began more than 2 decades ago) will delay deployment of
AVs that rely solely on longitudinal markings. A participant remarked that machine vision is
nearing its capability limit. Much of the burden for improvement, then, will fall on the agencies
responsible for the markings. Because pavement markings alone cannot convey full information
in all geometries and weather conditions, there is a need for a second source of information—
redundancy.
Redundancy. In this context, redundancy means that a second set of information is available to
AVs in addition to the existing pavement markings and signs. A static map or inventory of road
features is one way to provide a redundant source. However, participants observed that maps
quickly go out of date (one even said the situation can change by the hour), so broadcasting
current information is necessary. There is more than one way to do this. DSRC is a commonly
cited medium. Road geometry and other information can be in the TIM or MAP message. There
is some expectation that fifth-generation (also known as “5G”) cellular communication
technology will have adequate latency for V2V safety messages. Cellular technology has the
advantages that capital investment will be borne by private industry rather than State
transportation departments and that the Federal Communications Commission will maintain the
spectrum availability. It has the disadvantages that it is not yet available and that it may not be
able to incorporate existing DSRC equipment.
Additional Data. Successful use of CV and AV technologies for improving safety requires
availability of dynamic data relevant to weather conditions, visibility, and surface friction. Some
of the data are difficult to collect from in-vehicle sensors. Others that can be collected by in-
vehicle sensors are only local. Some participants from vehicle manufacturers highlighted that, if
they could obtain up-to-date data about the infrastructure and environment downstream of traffic,
they would incorporate these data into their safety applications. However, there was no
consensus on how such data would be collected and shared.
Consistency. The characteristics of lane markings and traffic signs are not uniform in all
locations (e.g., in urban areas, in rural areas, and across States). One participant mentioned that
various road-sign designs and styles serve the same purpose (e.g., traffic-control signs around
work zones and advisory speed signs for curves that have different margins across the country).
Participants agreed that, though the MUTCD provides standards and guidance, many of its
aspects are left to the subjective discretion of engineers and operators.(4) Lack of maintenance
funds can further induce inconsistencies in signs and lane markings due to replacement costs.
This would make navigation for AVs more difficult. At the same time, AVs should be designed
to handle the existing inconsistencies in their worst-case scenarios to be considered a safe and
reliable mode of transportation.
In conclusion, most of the findings from the current needs assessment are consistent with the
findings of the literature review. These conclusions provide a solid ground for the following
chapter, Research Implementation Plan.

45
CHAPTER 4. RESEARCH IMPLEMENTATION PLAN
The safety issues of RwD crashes, the benefits of CV and AV technologies, and the gaps
between current infrastructure capabilities and the deployments of these technologies are
established in previous chapters. The objective of this chapter is to present a list of projects and
activities that FHWA can consider to reduce the frequency and severity of RwD crashes through
CV and AV technologies. Implementing the research topics will lead to appropriate interventions
to be carried out by FHWA and other infrastructure officials.
The research-implementation plan addresses how the physical infrastructure may be modified to
better accommodate emerging transportation and vehicle technologies, what activities FHWA’s
RwD Program can promote to support CV and AV deployments, and how the Program’s focus
may need to adjust to address these changes in the vehicles and infrastructure technologies.
Eleven initiatives, spanning a breadth of technical, outreach, and economic content, are fully
developed, and their details are discussed in this chapter. All initiatives are unique to RwDs or
focus on an RwD element of a larger effort. Each initiative is described in the format of an
NCHRP research statement.(163) General background information on the initiative is first
presented. This is followed by the specific objectives and the potential benefits the initiative
provides. The initiative’s relationship to the existing body of knowledge is discussed by referring
to research that has been recently published or is currently underway. A possible research
approach is outlined by task.
The initiatives are grouped according to the ideas they address, as in figure 2. Following the fully
developed initiatives, existing and smaller efforts are listed.
The following criteria were considered to identify the research initiatives:
• Each initiative is specific to RwDs or provides the RwD portions of a larger effort.
• Initiatives were designed to be completed in 1 to 2 years. Most will have a tangible
benefit after that time. Many will lay the groundwork for follow-on or are
contributions to long-term efforts.
• The initiatives focus on the role of the infrastructure or the perspective of State and
local transportation departments.
INITIATIVE 1. EFFECTIVENESS ESTIMATES OF CURRENT DRIVER ASSISTANCE
Background
Onboard electronic systems to assist drivers in lane keeping have been on the market for more
than a decade. They take two forms. LDW systems are an electronic version of longitudinal
rumble strips. They sense when a vehicle is at risk of an inadvertent lane departure and alert the
driver. LKA systems are more sophisticated. They aid the driver in steering the vehicle. Some
apply a steering torque as the vehicle nears the edge of the lane but no torque when the vehicle is
aligned with the lane; they give the driver the feeling of being in a lane with the cross-section of
46
a bathtub. Other LKA systems provide a continuous steering torque to keep the vehicle centered
in the lane, which is Level-1 automation by the SAE definitions, which have been adopted by
USDOT.(3)
Although several auto manufacturers’ systems have their unique distinctives, they have
accumulated enough exposure so that statistics can be analyzed to estimate their effectiveness.
These systems can be enhanced by CV technology, and they are, in some ways, precursors to
CVs and AVs. Lessons from their initial years of deployment will provide valuable insights
regarding the implications of CV and AV technologies for preventing RwDs.
Objective
The objective is to estimate the crash reduction enabled by current LDW and LKA systems. A
secondary objective is to document other lessons learned from the deployments of these systems
that may be useful in applying CV and AV technologies to prevent and mitigate RwDs.
Potential Benefits
This work will help both current and future technologies prevent RwDs. Benefit estimates for
these systems will enable comparisons of onboard, electronic systems with other approaches, old
and new, for avoiding RwDs. Insights into how these systems perform and their shortcomings
can reveal how infrastructure can better support their operations.
Relationships to the Existing Body of Knowledge
Many researchers have studied lane-departure systems from various perspectives. A simulation-
based study by Scanlon et al. attempted to evaluate the effectiveness of LDW and LKA systems
in preventing RwD crashes, assuming varying levels of compensation.(46) Kockelman and Li
estimated the safety benefits of advanced driver-assistance systems in terms of the savings due to
crash avoidance and moderation of crash severities.(38) NHTSA analyzed the mileage and crash
data of passenger vehicles in the years 2014 through 2016 with and without a steering-assistance
system.(44)
Tasks
This initiative comprises three tasks, each with associated activities.
Task 1. Develop a Research Plan
• Review prior studies in estimating the benefits of vehicle-based lane-departure
countermeasures.
• List and categorize LDW and LKA systems that are on the market.
• Develop a data-sampling and -analysis plan that will build on existing knowledge and
estimate the effectiveness of representative countermeasures.

47
Task 2. Develop Driver Models
• Obtain and analyze crash data for vehicles equipped with various implementations of
LDW and LKA systems along with suitable control vehicles.
• Estimate the ratio of crashes in vehicles equipped with the countermeasures to those
without. Present the results in a form that can support a benefit–cost ratio estimate.
• Note and describe instances in which real-world performance was less than predicted.
Task 3. Write Recommendations for Future Vehicle-Based Countermeasures
• Compile the lessons that can be learned from the initial rollout of previous
countermeasures.
• Describe the principles of countermeasures that were the most effective in avoiding
RwDs.
• Describe how these lessons and principles can be applied to countermeasures that take
advantage of CV and AV technologies.
INITIATIVE 2. CHARACTERIZATION OF LANE-KEEPING PRACTICES
Background
Human drivers do not follow a perfectly straight line but move slightly back and forth within a
lane. A person’s lane position is affected by their level of vigilance as well as by the wind, play
in the steering mechanism, cross slope on the road, and other factors. LDW-system
manufacturers have made, at least implicitly, assumptions about normal lane-keeping practices,
but drivers have been known to disable those systems. The aversion to the warnings is
presumably because drivers’ personal practices fail to match manufacturers’ expectations; that is,
the alarms are too frequent, and drivers find them a nuisance.
When lane drift is excessive, it becomes a departure. The vehicle can encounter another vehicle,
a fixed object, or an unrecoverable slope, and the departure becomes a crash. Knowing which
lane-position features indicate an impending crash would be valuable.
Objective
The objective of this research is to develop a better quantitative understanding of drivers’ lane-
keeping behaviors in naturalistic driving.
Potential Benefits
Modifying LDW and LKA algorithms so they warn only when a danger is truly present would
enhance their acceptance by drivers. Knowledge of normal and precrash lane-keeping behavior
will enable more realistic vehicle simulations, which could be used for benefit estimates and
other purposes.

48
Relationship to the Existing Body of Knowledge
Ghasemzadeh and Ahmed used SHRP2 data to analyze the complex effects of weather, speed
limits, and traffic conditions on drivers’ lane-keeping behaviors.(111) Pape et al. used quantitative
lane-keeping behaviors to develop a driver model.(164)
Although Sayer et al. found that an LDW system can have a beneficial training effect in pilot
deployments, Reagan and McCartt and other studies have documented that vehicle owners tend
to disable LDW systems, apparently due to nuisance alarms.(33,50)
Hallmark et al. found that the frequency of lane encroachments and RwD crashes occurring on
left and right curves differ significantly.(108) Understanding the differences in how drivers
negotiate curves in opposite directions can lead to improvements in both onboard and
infrastructure-based departure countermeasures.
Tasks
This initiative would involve two tasks.
Task 1. Review Available Resources
• Compile available sources of lane-keeping behaviors.
• Summarize findings of prior studies on lane-keeping behaviors.
• List existing driver-steering models, and assess each for its suitability to produce
naturalistic behavior.
Task 2. Develop a Model for Generating Naturalistic Paths
• Determine which characteristics should affect the model (including, for example, driver
demographics, driver condition, roadway classification, road curvature, surrounding
traffic, and weather).
• Determine which properties of the path the model should produce (including, for
example, mean lane position, variance of lane position, and peak excursion from the lane
center).
• Select an appropriate form of the model, develop it, and then demonstrate the fidelity of
its paths.
Follow-On and Implementation Activities
This model can be used to improve the effectiveness of LDW systems. When driver responses to
warnings are incorporated in the model, its simulations can be used to evaluate in-vehicle or CV
lane-departure warnings. These evaluations would support system development and contribute to
estimating benefits.

49
An extension to the model would be to include speed selection and deceleration practices, which
would aid in evaluating curve-warning algorithms.
INITIATIVE 3. SIMULATIONS TO ESTIMATE THE BENEFITS OF CV
COUNTERMEASURES FOR RwDs
Background
State and local transportation departments will have new installation and maintenance
responsibilities to accommodate CV deployment. Expenses will include installing, powering,
maintaining communication equipment (such as RSUs), as well as providing the RSUs with
current information and handling the information they produce. Those responsible for State
transportation budgets need to justify these costs by documenting the expected benefits from
improved safety and mobility and the decreased departmental operating costs. There is a role for
researchers who study RwD crashes to provide benefit estimates to the larger effort of
infrastructure management. Existing data and tools can estimate benefits through simulations.
Objective
The objective is to demonstrate and document the economic justifications of CV deployment
from the perspective of State transportation departments. This will include unambiguous and
quantitative estimates of the benefits and costs of CV deployments.
Potential Benefits
This work will support the larger effort to develop an economic analysis from a State or local
perspective to justify CV deployment. It will also guide further research in developing specific
applications.
Relationships to the Existing Body of Knowledge
A recent GAO report observed that, although CV deployment benefits and costs have been
estimated through simulations and a small number of pilot studies, the actual benefits and costs
of large-scale implementation remain largely unknown.(151) Chang et al. provided quantitative
information on crash reductions expected from CV deployment.(89) Kockelman et al. provided
the safety and operational benefits of CV and AV deployments in monetary units for various
penetration rates.(165) More specifically to RwD, Ghasemzadeh and Ahmed used SHRP2 data to
analyze the complex effects of weather, speed limits, and traffic conditions on drivers’ lane-
keeping behaviors.(111) Cicchino and Zuby quantified the causes of lane drifts.(10) Pape et al. used
quantitative lane-keeping behaviors to develop a driver model and then combined the driver
model with models of RwD countermeasures to estimate their benefits.(164)
Tasks
This initiative would involve four tasks.
Task 1. Develop a Research Plan
• Survey the factors leading to RwDs.

50
• Survey present and forthcoming CV-related countermeasures for RwDs.
• Associate countermeasures with departure precursors and then develop a plan for
estimating the countermeasures’ effectiveness.
Task 2. Develop Driver Models
• Use naturalistic driving data to develop models of human lane-keeping behavior in
normal and near-crash circumstances.
• Develop models of human responses to current and proposed countermeasures.
Task 3. Simulate Development and Prevention of RwDs
• Combine the driver model with a model of a vehicle and a countermeasure.
• Simulate cases of impending departure to estimate the countermeasures’ effectiveness.
Task 4. Integrate the Results
• Use crash and traffic statistics to estimate the number of RwDs that are preventable in
representative circumstances.
• Report the countermeasures’ effectiveness in a way that can be incorporated in a
benefit–cost analysis.
Follow-On and Implementation Activities
The results of this effort will contribute to the RwD portion of benefit–cost estimates for CV and
AV infrastructure modifications. Going forward, the model can be used to evaluate candidate
designs of vehicles, infrastructure, and their interactions.
INITIATIVE 4. CURVE-WARNING CHALLENGE
Background
To facilitate V2I-technology deployment, AASHTO issued the SPaT challenge to State and local
transportation-infrastructure owners and operators to incorporate SPaT broadcasts in at least one
coordinated corridor in all States by 2020. In the same way, a curve-warning challenge can be
the successor to AASHTO’s SPaT challenge. This initiative would encourage States to identify
ramps and curves with high counts of RwDs (or rollovers for heavier vehicles) and complement
existing advisory signs with CV technology. A TIM for curve warning already exists and is
being deployed, thus requiring minimal technical development. The challenge would be to
standardize advisory speeds. The AASHTO Green Book allows considerable latitude in advisory
speeds.(166) Differences vary according to agency practice or even regional driving culture. More
advanced demonstration projects would include information, perhaps from a Road Weather
Information System (RWIS) or prior stability control activations, on the weather and road
surface conditions.

51
Prime candidates for early deployment are locations with a history of RwD incidents, tight
curves at the bottom of a hill, and curvatures that are difficult to see.
Objective
The objective is to encourage State and local transportation agencies to start deploying V2I-
communication equipment. An additional objective is to counteract RwD crashes at horizontal
curves using V2I applications.
Potential Benefits
The initiative will be a step toward deploying V2I applications. The short-term benefit is that
State and local transportation agencies will acquire valuable experiences and lessons about
DSRC-based V2I communication and identify sites suitable for curve-warning applications.
Another long-run benefit is that larger V2I curve warning–application deployments will have
significant safety benefits.
Relationships to the Existing Body of Knowledge
Stephens et al. developed the concept of operations for the CSW application.(92) Pilot
deployments include various versions of the application. Many aspects of AASHTO’s SPaT
challenge and lessons learned from the program can also be used to support this initiative.
Tasks
This initiative would involve three tasks.
Task 1. Literature Review
Conduct a comprehensive review of literature on DSRC-based curve warning. This will provide
an understanding of this V2I application’s current development stage. Any missing links or
knowledge gaps will be identified, and appropriate remedies can be implemented.
Task 2. Identify the Requirements of the V2I Curve-Warning Application and Provide
Guidance
This task will solidify the application’s technical requirements and provide guidance to State and
local transportation agencies to ensure that they accomplish their objectives. This will include
completing the communication standard and assistance on site selection, ensuring DSRC
equipment acquisition and compatibility, and developing reference materials. The task may also
include training State and local transportation department staffs on how to install and maintain
the equipment and collect and analyze the application-generated data.
Task 3. Outreach to Transportation Agencies and Supervision
Meet with existing stakeholders and State and local transportation departments to establish
consensus on the curve-warning challenge. Provide a followup or supervision for the challenge.
52
INITIATIVE 5. EXTENSIONS TO THE CSW APPLICATION
Background
The V2I CSW safety application alerts vehicles if they are approaching a curve too fast. Some
current implementations treat the application as an electronic version of the advisory speed sign.
It alerts a driver, who may have missed the advisory sign or has not realized that the vehicle
speed is higher than the posted advisory.
This feature can be expanded to benefit both CVs and AVs. The AASHTO Green Book allows
considerable discretion in establishing an advisory speed.(166) Transmitting the curve’s geometric
information along with current surface conditions would allow approaching vehicles to make
more pertinent speed choices.
Information necessary to select a maximum safe speed for a curve comes from three sources. The
first source is fixed information about the infrastructure: the curvature and superelevation.
Second is current information about the surface. Information on weather or road weather can
come from existing sources available to transportation departments. Currently available products
infer surface conditions from humidity and temperature measurements. A possible application
extension would include information that the HFST is known to have deteriorated and has yet to
be restored. Reports of loss-of-control messages can also be included. Information from the
infrastructure can be packaged in the RSU and transmitted to the vehicle. The third source of
information is on the vehicle itself, such as cornering ability (or roll threshold for a heavy
vehicle), and the tire-tread condition and holding ability (i.e., for futuristic systems). This is
sufficient information for speed selection in an AV. The more meaningful advisory speed would
prove beneficial despite the complications of the CV’s driver’s skill and preference.
Within a few years, nearly all light vehicles will have automatic emergency braking. This
function is designed to detect fixed objects in a vehicle’s path and automatically apply the
brakes. Conceivably, the enhanced application on a vehicle with no other automation could
engage the brakes when it approaches a curve at an excessive speed.
Objective
The objective is to take full advantage of the CSW application, benefitting both CVs and AVs as
they approach a curve.
Potential Benefits
The enhanced message will remove the inconsistency and uncertainty AVs face as they interpret
existing advisory speed signs. The additional contents on road surface conditions will benefit
human CV drivers.
Relationship to the Existing Body of Knowledge
A concept of operations for CSW applications developed for the ITS Joint Program Office
envisioned transmitting geometry and current road-weather information.(92) Some early
implementations have been simpler, transmitting only a fixed advisory speed or an advisory

53
accounting for geometry and traffic.(167) This initiative would lead to transmitting more
information and extend the use to AVs.(168)
Tasks
This initiative would involve three tasks.
Task 1. Document the Opportunities Offered From an Enhanced CSW Application
• List the functions that the application can perform.
• Consult with stakeholders, including AV manufacturers and standards committees, to
develop a concept of operations and identify any changes to standards needed for initial
testing.
Task 2. Develop an Application to Demonstrate
• Select an appropriate subset of features.
• Write and test code to be implemented in an RSU.
• Demonstrate the features with vehicles in a controlled environment.
Task 3. Test the Enhanced Application in a Deployment
• Identify a CV program through which the application can be demonstrated with real
traffic. This would most likely be an existing or previously planned deployment.
Preferably, both CVs and AVs would participate.
• Collect data on the application’s performance and its effect on RwDs.
• Recommend further action, which might include revised standards or continued
research.
INITIATIVE 6. INPUT FROM STATE AND LOCAL TRANSPORTATION
DEPARTMENTS AND OTHER STAKEHOLDERS
Background
A working relationship among all stakeholders—Federal agencies, State and local transportation
departments, research organizations, vehicle manufacturers, and others—is crucial to CV and
AV success. Therefore, promoting understanding and coordination facilitates increased
interaction between vehicle manufacturers and infrastructure officials. Ideas include encouraging
AASHTO to send delegates to SAE committees, supporting State and local agency staffs to
attend vehicle manufacturers’ CV and AV demonstrations and vice versa, and delivering
workshops and webinars dedicated to sharing experiences between public and private agencies.
Issues can be identified and addressed collaboratively. Better communication can also lead to a
common understanding of the technologies, and what they can do and what they cannot do.

54
This is a broad topic with many activities already underway. Topics of interest to the RwD Team
would include support for better virtual rumble strips, advance notice of lane closures,
availability of road weather information, and implementation of the CSW application.
Objective
The primary objective of this initiative is to cultivate a platform for better communication among
stakeholders to facilitate a strategic roadmap for planning and implementing actions in CV and
AV technologies. A secondary objective is to clearly identify CV- and AV-technology
requirements from the infrastructure officials’ and vehicle manufacturers’ points of view and to
work toward achieving them.
Potential Benefits
Developing a strong relationship among State transportation departments, infrastructure officials,
the private sector, and other stakeholders is important for mutual benefits to these organizations
as well as efficient and successful CV- and AV-technology deployment. Better communication
allows experiences to be shared and the priorities, challenges, and opportunities of CVs and AVs
to be identified, as perceived by all interested parties. This also has the potential to create
educational and outreach opportunities for the staff.
Relationships to the Existing Body of Knowledge
A survey-based study by Zmud et al. that developed a strategic CV and AV roadmap for
transportation agencies outlined how local agencies plan to include these technologies, but also
revealed that they are not sure how to incorporate them in their current and future transportation
planning activities.(157) Carlson and Poorsartep suggested improved collaboration among
infrastructure officials, research organizations, and automotive industries to devise a common
understanding of how the physical infrastructure may be modified to better accommodate CV
and AV technologies.(161) Shladover and Gettman observed that the vehicle industry has yet to
fully align with the agencies that own and operate the roadway infrastructure with respect to CV
and AV technology despite the obvious synergies between them.(169) Their recommendation 2.4
deals with the technical aspects of DSRC communication and its associated institutional issues;
this initiative recommends communication on broader topics.
Some State agencies are actively engaged in advancing CV and AV initiatives. This
recommended effort facilitates engagement among other States and smaller agencies that are not
early adopters.
Tasks
This initiative would involve three tasks.

55
Task 1. Identify the Stakeholders and Develop Customized Communication and Engagement
Approaches
Stakeholder interests and concerns are varied and, therefore, require a customized approach to
communication and engagement. This task will identify any gaps in the relationships and
communication among stakeholders.
Task 2. Define Each Stakeholder’s Roles, Responsibilities, and Engagement Level
Up front planning for each stakeholder’s roles and responsibilities allows the organization to
understand how it fits into the overall CV and AV picture. Outlining the benefits an organization
will gain from participating in communication will lead to better commitment and ensure
successful CV and AV deployments.
Task 3. Conduct Outreach Meetings
Meetings can be a combination of online and in-person events. Ideally, they will be advertised
and held in forums familiar to the target audience (such as Every Day Counts, AASHTO, and
regional organizations).
Follow-On and Implementation Activities
This initiative will continue, and the training content will evolve as deployment progresses.
INITIATIVE 7. V2I TECHNOLOGY–AWARENESS TRAINING FOR STATE
AGENCIES
Background
The expanding deployment of CVs and, to a lesser extent, AVs will lead to new staff roles and
responsibilities at State transportation departments. To accommodate future needs, some State
and local agencies are working to involve their staff in CV and AV technologies. However,
many agencies do not have the resources to devote staff to keeping up to date on these
technologies. Some are only beginning to learn about new developments. Transportation
departments need support to make decisions such as which V2I services to provide and where
RSUs should be located. Therefore, developing a guidebook to cover the basics of DSRC and the
infrastructure’s role in providing services is important. It would explain how agencies can get
help from State transportation departments or find FHWA resources to plan and deploy CV
infrastructure. Further in the future, training modules for technicians who install and maintain
CV equipment will aid local agencies that are responsible for deploying communication
equipment in the infrastructure. If the guidebook is online with the Federal-Aid Highway
Program Policy and Guidance Center, it can be updated as technology advances. Early education,
engagement, and outreach to these agencies will ready their staff to contribute to the actual
deployments of these technologies and be part of the overall process.
Overviews of CV principles will enable agencies to deploy V2I systems; certain components will
be specific to RwD. A pertinent training module might demonstrate how to select locations to
protect with the CSW application and how to construct a TIM for a location.
56
Objective
The objective is to educate and train the staff of small county and local agencies on CV
technology. This will determine how the roles and responsibilities of transportation staff will
change as CVs become widely deployed. It will result in identifying which skills are lacking and
how these skills could be introduced to an agency. The initiative would promote awareness and
participation in small county and local agency staff for CV technology in general and V2I
technology in particular so that would be better prepared to deploy communication equipment
and operate the system.
Potential Benefits
As part of the overall professional development benefits, this initiative will increase local
agencies’ staff capacity to adapt to emerging technologies. This will improve the effectiveness
and efficiency of wider V2I-application deployments. This initiative will have multiple
implications, like increased opportunity for innovation and strategic planning and increased
capacity to meet CV methods and operational needs. Trained staff will monitor industry changes
and increase their contribution to the overall business processes at local agencies by being
proactively prepared for these emerging technologies.
Relationships to the Existing Body of Knowledge
A recent survey-based study by Bertini et al. examined the perception and preparedness of the
ODOT staff for CV and AV technologies.(170,171) The study revealed that most respondents knew
about these technologies and were in favor of their application. However, many (up to 34 percent
of respondents) had concerns about training, education, and outreach to ODOT’s personnel.
Tasks
This initiative would involve three tasks.
Task 1. Identify Who Needs What Skill Sets
Local agencies will need staff that know how CV technology works and how functions can be
integrated with daily traffic operations and management. The roles of transportation engineers,
planners, and operators will change from routine design, construction, and maintenance to new
technology-driven operations. The need for enhanced information technology, wireless
communication, and data management will rise. As local agency staff transition from passive to
active roles, they must gain a clear understanding of the skills required to complete their duties.
This task will identify the new skills that traffic engineers, operations staff, and field technicians
must master.
Task 2. Identify How and When These Courses Will Be Delivered
Outline the frequency of the courses to achieve short-, medium-, and long-term improvements. In
addition, delineate the courses’ appropriate development (scope and content) and delivery
method, such as direct staff training through various methods like online resources or workshops
or “training the trainer.”

57
Task 3. Develop Suitable Courses
Having identified what skill sets are lacking, develop structured courses that complement the
skill needs of State and local transportation department staff. Each course should consist of
practical applications and be designed with specific objectives and learning outcomes that can be
used by individuals in State and local agencies.
Follow-On and Implementation Activities
This initiative will continue, and the training content will evolve as deployment progresses.
INITIATIVE 8. SOFTWARE AID TO DESIGN FOR ACCOMMODATING CVs AND
AVs
Background
Highway designers will have to apply new principles when designing for CVs. AVs may impose
requirements on designs as well. A software aid can serve many functions in preparing and
evaluating a highway design to support CVs and AVs.
The tool’s evaluations of CV features will potentially apply to equipment, DSRC transmission,
and messages. The tool will determine whether planned RSUs are in the right locations.
Consideration will be given to ensuring that line-of-sight transmission paths are not blocked and
that information can be received by vehicles before it will be needed. In addition to evaluating
geometry, the tool will evaluate the software that generates V2I messages to ensure they adhere
to standards and are consistent with best practices in supporting traffic. The tool will check TIMs
and MAP messages for compliance with highway design plans. More specific features are likely
to come from early stakeholder meetings.
Levels of road readiness for AVs are being considered the infrastructure counterpart to SAE’s
vehicle-automation Levels. This aid will assess those Levels in existing roads using as-built
drawings for proposed construction and reconstruction projects.
Many diverse stakeholders need to be consulted at several stages. The FHWA geometric-design
staff, representatives of users at State transportation departments and private engineering firms,
early transportation department CV-technology adopters, vehicle manufacturers, equipment
suppliers, and domain experts in the relevant fields (e.g., DSRC transmission and machine
vision) are all crucial to the project’s success. Preferably, there would be more than one
organization representing each viewpoint. Some meetings must gather all stakeholders in the
same room.
Objective
This initiative will result in a new software tool so that highway designers can evaluate a
design’s ability to support CVs and AVs. The first phase will advance the work to a software
requirements document.

58
Potential Benefits
This initiative will be a significant step in moving highway support of CVs and AVs from pilot
studies to operation.
Relationships to the Existing Body of Knowledge
NCHRP has a pending project to develop a uniform classification system to help agencies assess
the degree of readiness of their roadways to accommodate CVs and AVs.(172) Johnson, in a report
for the Royal Automobile Club Foundation for Motoring Ltd. discussed a number of ways to
prepare roads for AVs.(173) Part of the recommended work will involve incorporating the findings
of these and similar studies in the tool.
Tasks
The preparatory phase will comprise two tasks.
Task 1. Establish a List of Desired Features
• Enlist stakeholders representing the necessary disciplines and perspectives.
• Develop a list of design attributes that the aid will evaluate.
• Identify technical criteria for evaluating a design according to each of the attributes.
• Sketch possible user interfaces for the module.
Task 2. Prepare to Write the Tool
• Draft a concept of operations.
• Draft a software requirements document and interface documents.
Follow-On and Implementation Activities
The software tool will be developed in a subsequent phase. At first, the tool can be tested against
an existing CV deployment at a pilot site. The next step is to demonstrate it in a construction or
reconstruction project, or at least in a new RSU deployment effort. As the practice of CVs and
AVs matures, the software tool can eventually become a new module for the IHSDM.
INITIATIVE 9. TIGHTER MARKING AND SIGN REQUIREMENTS IN THE MUTCD
Background
The MUTCD includes standards, guidance, and options for pavement markings and signs.
However, the MUTCD can never fully anticipate all geometries and alignments. There are
instances in which the MUTCD is open to subjective interpretation by traffic engineers, resulting
in inconsistent applications of pavement markings and signs. These inconsistencies can confuse
an AV’s machine vision. This initiative will gather cases from AV manufacturers about
longitudinal pavement markings and sign images that were ambiguous or impossible to interpret.
It will also gather information from State and local transportation-department cases in which the
MUTCD did not apply directly and gave inadequate instruction.(4)

59
Human factors, machine vision principles, MAP message standards, and highway engineering
practicalities can be applied to developing new wording that resolves potential issues. The result
can lead to a revision to the MUTCD, which would provide supplemental guidance for
unconventional geometries or perhaps change requirements.(4)
The initial project will make recommendations on which situations to include in the MUTCD
and which require research to find the best solution. Some variations will inevitably be left for
the AV manufacturers to navigate.(4)
Objective
Tighter standardization will lead to consistent application of longitudinal marking and signs
within and across States. Developing longitudinal-pavement-marking requirements that are more
broadly applicable will lead to consistent, reliable, and higher quality markings and signs, all of
which perform the way they are intended. This is beneficial both to human drivers and AV
machine-vision systems, increasing the probability of the markings being recognized and
correctly interpreted and at the same time supporting safe navigation.
Potential Benefits
This work is part of the larger effort to reduce the number of instances in which an AV is unable
to determine its proper path. This effort will expand the operating domain of AVs and reduce the
number of RwD crashes resulting from misinterpreted markings.
Relationships to the Existing Body of Knowledge
Several studies have confirmed that the main challenge of AVs is longitudinal pavement
markings that are inconsistently applied and inadequately maintained. For example, a finding
from the 3,400 miles of automated driving covered by an experimental AV revealed that lane
marking inconsistency between States posed significant problems.(76) Two recent studies
examined how the width, color, and retroreflectivity of pavement markings affect their suitability
for machine vision under dry and wet conditions.(66,161) A current research project is assessing
how elements of physical highway infrastructure and traffic control devices in particular can be
designed, enhanced, and applied to meet the needs of both the human driver and the machine
driver.(174) The European Road Assessment Programme and Huggins et al. discussed the effect of
inconsistent lane markings and road signs on safe AV navigation.(175,176) In the absence of
adequate applied markings, some researchers, Lattke et al. among them, have shown that a
vehicle can track another longitudinal feature parallel to the lane.(35) AV manufacturers have said
that a V2I message that locates the lane with respect to recognizable fixed objects would prove
useful.
Tasks
This initiative would involve three tasks.

60
Task 1. Identify Inconsistent Longitudinal-Pavement-Marking and Road-Sign Applications
• Discuss what situations give rise to these inconsistencies.
• Document the reasons and rationales for these inconsistencies.
• Assemble a list of the extra, State-created markings and signs. For example, some States
use varieties of black and white stripes to enhance contrast on light-colored concrete.
• Compile a list of features subject to misinterpretation by AVs as pavement markings
(such as sealing lines and ghost stripes—latent visible features after a stripe has been
removed).
Task 2. Develop Guidelines That Close the Gap Between the MUTCD Standards and State
Practices
• Provide solutions to the problematic situations that give rise to inconsistent pavement
marking and sign applications.
• Identify how to update the MUTCD so that it considers AVs.(4)
Task 3. Identify Secondary Sources of Information
• Identify sources of redundant information that can be useful in situations in which
pavement markings and signs designed strictly according to the MUTCD’s rules fail to
convey full geometry information.(4)
Follow-On and Implementation Activities
The first year’s effort should be able to identify many inconsistencies in pavement marking and
recommend trial solutions to a few of them. Some ambiguities may be resolved by consensus.
Selecting the best contrasting pavement marking, among other issues, will require a research
program carefully designed to estimate crash modification factors and select the best approach.
INITIATIVE 10. SYNTHESIS OF MACHINE-READABLE SIGN TECHNOLOGY
Background
Road signs instruct drivers how to navigate easily, drive safely, and observe laws. Some existing
machine-vision systems are able to identify and interpret signs and can display the signs on the
instrument panel. However, signs can be obscured by traffic, weather, or vegetation, or they can
be damaged. Information on road signs can be communicated to vehicles electronically.
Available technologies include the TIM communicated to CVs, an RFID tag affixed to a sign or
other object, and cellular messaging. Each technology has its own relative advantages in terms of
deployment, maintenance cost, ability to reach many vehicles, ease of changing the message,
susceptibility to loss, and other factors. Information from these supplemental sources can be
displayed on the instrument panel to the human driver or made available to AVs’ decisionmaking
algorithms.

61
Machine-readable sign technology must be assessed so that highway designers and vehicle
manufacturers can select an approach that meets their joint needs.
Objective
The objective is to list available products and mature technologies that can communicate
information from road signs to CVs and AVs.
Potential Benefits
A redundant source of road-sign information will benefit all drivers. Human drivers with
vehicles that have displays will not be subject to obscured or missing signs. AVs will perform
more reliably in their operating domain when road-sign information is delivered directly in
machine-readable form. This synthesis will aid in the cooperation of highway operators and
vehicle manufacturers to establish a common approach.
Relationships to the Existing Body of Knowledge
An NCHRP project nearing completion studies the requirements for pavement markings so that
AVs can use them.(172) This project will be a similar effort for signs. A topic being considered for
NCHRP will examine the physical highway’s future infrastructure—specifically traffic control
devices—with respect to AVs.(177)
The MUTCD has standards for human-readable signs.(4) SAE J2735 has standards for contents of
CV messages, which might contain some conventional road-sign information.(178) Although
writing them is beyond the scope of this initial effort, standards for machine-readable signs will
eventually be necessary.
Tasks
This initiative would involve two tasks.
Task 1. Literature and Product Review
• Identify products marketed to communicate road-sign information to vehicles.
• Identify other potentially applicable products and technologies.
Task 2. Assessment
• Develop a list of criteria for evaluating the technologies that encompasses the needs
of all stakeholders.
• Rate the products and potential products.
• Recommend continued evaluation of the products.
• Outline the standard needs of machine-readable sign technology.

62
Follow-On and Implementation Activities
This task requires a balance of conflicting needs. As conventional signs have been standardized
for decades, machine-readable signs must be sufficiently standardized so that vehicles can
interpret them as they travel across jurisdictions. On the other hand, overly restrictive decisions
could stifle innovation. A necessary step in the future will be to convene stakeholders from State
transportation departments and other highway operating agencies, vehicle manufacturers, and
technology vendors, to develop a path forward that provides both flexibility for technology
enhancements and certainty to vehicle manufacturers.
INITIATIVE 11. IDENTIFICATION OF HIGH-RISK LOCATIONS USING CV DATA
Background
Crash-prone locations have traditionally been identified by the high incidence of crashes over a
period of years. BSMs are broadcast by vehicles equipped with CV devices. BSMs contain a
vehicle’s location, speed, brake-application status, and other information. A series of BSMs from
a single vehicle can be analyzed to indicate when a driver needed to make sudden maneuvers or
when a driver nearly lost control. These incidents can be used as surrogates for crashes in general
and RwD crashes in particular.
Records of near-crash incidents can call State transportation departments’ attention to
unexpectedly sharp curves, instances of low friction, poor visibility, and other needs.
Transportation agencies can use the data to quickly identify locations needing corrective action,
unlike current methods, which require waiting for numerous crashes to occur. These crash
precursors can prove more valuable in selecting appropriate remediation because, unlike mere
crash counts, they suggest the crash’s cause.
A State transportation department can scan information from aggregated BSMs for indications of
RwD-crash precursors. The time, location, and nature of precursors are recorded. When the
density of precursors reaches a certain threshold, officials are alerted to the possibility that a
location is susceptible to a certain kind of RwD. Officials examine the data, collect further
information as necessary, and implement countermeasures. For example, if many dynamic
stability-control activations are recorded on rainy days, the inadequate drainage or deterioration
of the HFST may be discovered, and the transportation department may decide to groove the
pavement. Many hard-braking events might indicate inadequate warning of a curve.
In a practical deployment, BSMs would be analyzed by an RSU because summary data are easier
to send to the back office than a large volume of raw BSMs. At the research stage, individual
BSMs may be necessary.
Objective
The objective is to develop a means to identify locations or conditions that are susceptible to
RwDs, using information from vehicles’ BSMs.

63
Potential Benefits
The initial phase will indicate which contents of the BSM or combinations of contents are related
to RwDs. Subsequent phases will include pilot deployments to confirm the relationship between
algorithms and departures in prospective studies while refining the algorithms.
When fully implemented, State transportation departments will be able to identify locations with
unusually large numbers of precursors to RwDs. They will be able to use the detailed
information to select suitable countermeasures.
Relationships to the Existing Body of Knowledge
Smith et al. tested candidate algorithms with existing data.(65) Most of the crashes they analyzed
were forward collisions, including some RwDs. Algorithms specific to RwDs need to be
developed and tested.
A recent GAO report on CV benefits reported an effort in Japan, in which 160 locations of
sudden braking were identified using data from vehicles.(151) Officials investigated the cause, and
remedial steps (such as trimming trees to improve visibility) decreased injury crashes by
20 percent.
An NCHRP project currently under consideration will examine how agencies manage the data
expected from CV applications, which can support transportation operations.(179) The results of
that project will support the analysis of CV data for many purposes, including the one
recommended here.
Tasks
The first phase will be to refine the concept of operations in preparation for a pilot study:
• Identify precursors to RwD crashes. Consider references in the literature review in
chapter 2 and consult other sources.
• Relate the precursors to BSM contents. Develop candidate algorithms for detecting
precursors that are related to a location’s crash risk. Different algorithms will likely
be necessary for different precursors. An integrated algorithm may be needed to relate
to overall RwD risk.
• Test and refine the algorithms. Data may be available from previous naturalistic
driving studies. Alternatively, data can be generated by a Monte Carlo simulation of
vehicles navigating roadway segments while various combinations of roadway,
weather, and driver deficiencies are modeled. Estimate the sensitivity of the
algorithms for identifying high-risk locations and conditions.
• Outline a pilot study. Design a prospective study to collect BSMs from vehicles in
naturalistic driving. Collecting BSMs before and after an event may be desirable. The
study will have enough vehicles and duration so the algorithms can be quantitatively

64
evaluated. The outline will include criteria for selecting locations and expected
results.
Follow-On and Implementation Activities
Planning will be followed by a pilot study in which BSMs are collected to test algorithms. The
study would be more efficient if joined with an existing CV effort (such as those being planned
in Tampa, FL; New York, NY; Wyoming; and Columbus, OH). The pilot study will further
refine the algorithms and write lessons learned to aid in establishing a system at a State
transportation department. The duration of the pilot study will be decided in the first phase; at
least a year is likely necessary.
The ultimate users of the system will be State transportation departments responsible for
identifying and mitigating hazards on their highways. Researchers developing the algorithms and
implementing the systems will need to consult with State transportation department
representatives at milestones during this project to ensure that the product will be consistent with
their deployment of V2I equipment and that the data are presented in a useful form. Closer
coordination with State transportation departments will be needed when remediation actions are
considered.
EXISTING AND SMALLER EFFORTS
This section describes other activities for the RwD Team to monitor as they proceed or
encourage development in the future.
Road Weather Information to AVs
Slippery surfaces contribute to RwDs. Localized road weather information from CVs is made
available to State transportation departments to support treatment decisions and manage traffic
flow.(99,180,181) Road users presently employ this information only to support travel decisions. As
manufacturers make more use of localized weather information for travel decisions or for
controlling vehicles, State transportation departments will have a role in supplying the
information. Among the sources of road weather information are RWISs’ sensors reading
pavement temperature and humidity, State transportation department vehicles (usually
snowplows), and V2I messages from CVs. AV manufacturers may want different combinations
of snow cover, surface temperature, relative humidity, estimated friction, or a temporary speed
limit.
Standards and Business Model for Maintaining and Delivering Roadway Geometry
V2I standards have two messages for delivering geometric information—MAP and TIM.
Elaborate 3D maps are commercially available. Inherent map shortcomings are that they need to
be updated continuously, and a conventional GPS signal is inadequate for lane-level navigation.
A policy question is whether a State transportation department has a responsibility to provide a
minimal level of detail. A technology question is about the best reference, which is a fixed
roadside object the vehicles can sense (such as a bridge abutment, a benchmark placed in the
pavement, or a station to broadcast a correction signal). AV navigation would benefit from

65
collecting, maintaining, updating, and communicating roadway attribute information (maps)
seamlessly and in a uniform manner.
Farrell et al. observed that distribution of such feature maps is still in its infancy. To date, such
distribution has not been implemented and tested over large regions (i.e., States, countries).
Various CV testbeds, on increasing scales, have been implemented.(182) As these demonstrations
have progressed, recommended changes (e.g., large-sized messages to allow accurate
descriptions of large intersections, and additional features) to SAE J2735 have been one of the
demonstration outcomes.(178)
Given the need for the maps to be updateable, interesting questions arise:
• How will the need for local map updates be detected or communicated to the map
manager?
• How will local map updates be integrated into the map database efficiently while
maintaining spatial continuity?
• How can data integrity be assured if map updates are obtained from different sources?
As with many previous initiatives, the distinction between AV navigation and RwD avoidance
may be blurry, but FHWA and its State partners clearly have an interest in working with industry
to answer these questions. Data for mapping is a part of an anticipated NCHRP project.(177)
Standard for Pavement-Marking Removal
Standards address the texture, color, retroreflectivity, and other features of pavement markings.
However, there is no standard for longitudinal-marking removal or treatment after scraping. It is
important to ensure that unneeded markings and their residues are completely removed when
adjustments to lane use or assignment are made. Often, particularly in work zones, ghost stripes,
or an appearance of the former stripes, are still visible after markings are ground off. Ghost
stripes can lead to confusion for drivers and the machine vision of AVs. Therefore, research on
treatments needed during or after lane-marking removal to suppress ghost stripes is imperative.
Recovery Guidance for Errant Vehicles
A more futuristic project would be to guide errant vehicles back to their lanes or, at least, away
from roadside hazards. At least one step has been taken toward that goal.(35) Avoiding rollovers
on slopes and avoiding unexpected roadside features (such as recently disabled vehicles and their
occupants) are among many considerations.
RwD-Safety Risk Index for Road Segments
A comprehensive RwD-safety risk index would quantify the exposure, probability, and
consequence of expected RwD crashes as a function of location. The index could be based on
presence or absence of guardrails, shoulder widths, presence or absence of utility poles,
manholes, ditches, and other roadway hazards. The objective is to develop a technique to support
RwD safety analyses by examining the features of road segment and scoring their corresponding

66
risk indices. The risk index would be communicated to vehicles by incorporating it with the
navigation systems or transmitting it via V2I communication. The index can be used to adjust the
threshold for issuing a warning to road users (e.g., drivers may receive high-intensity warnings
when approaching a road segment with a relatively high RwD-safety risk index—assuming a
high safety index represents a high probability and severity of RwD crashes).
Reconsidered Geometric Design for AVs
Shladover and Gettman developed a broad plan of CV and AV research for AASHTO.(169) Two
of their recommendations on RwDs should be noted in this report. Their recommendation 2.4,
that State transportation departments and vehicle manufacturers cooperate on technical DSRC
standards, was referenced in initiative 6 on communication between vehicle manufacturers and
transportation agencies. Their recommendation 2.7, to reconsider roadway geometric design
concepts for AV operations, is to address the transformative effect AVs will eventually have on
infrastructure. Any such changes need to make full use of knowledge about RwD-avoidance
principles.
New IHSDM Module for CV and AV Technology
When CV and AV technologies have matured to the stage that infrastructure standards for
supporting them are settled, references to them will appear in the Highway Safety Manual, and a
dedicated module for the IHSDM can be considered.(112)

67
CHAPTER 5. CONCLUSIONS
The literature review and the Web meetings heightened understanding of CV and AV technology
to prevent and mitigate RwD crashes. The gaps between current and desired capabilities became
clear. The RwD Team can consider promoting the items in the research implementation plan to
fill those gaps and enhance its mission.
LITERATURE REVIEW
The literature search produced an abundance of information on how CV and AV technology can
be used to improve RwD safety and the development needs of these technologies. The results of
the literature search concerning the effectiveness of the emerging technologies for counteracting
RwD crashes can be summarized as follows:
• CVs. Vehicle connectivity (V2V and V2I technologies) can be useful for many
applications that directly reduce RwD crashes and their severities. CV technology is
being successfully demonstrated in research projects. Some applications of CV
technology are speed management, lane-level localization of vehicles, curve warnings,
spot weather warnings, and lane drop warnings. CVs can be effective for counteracting
RwD crashes by providing critical safety messages regarding downstream weather, road
friction, road alignment, and other infrastructure-related information. Another innovative
use of such technology is for identification of hot spots without waiting for significant
numbers of crashes to occur.
• Vehicle automation. The effectiveness of driver-assistance systems (such as LDW and
low-level vehicle-automation systems like LKA systems) has been found to be less than
initially predicted. Due to excessive false warnings, drivers tend to deactivate the
systems. Low-level driver-assistance systems and low-level vehicle-automation systems
typically rely primarily on machine vision, and their performance is limited by lighting
and weather conditions. Many current LKA systems also fail to adapt to individual
drivers’ habits. Considering that driver errors are contributing factors to a significant
proportion of crashes, vehicles with high levels of driving automation are a promising
technology for improving road safety by eliminating driver error. AVs are challenged by
inconsistencies in existing infrastructure. In addition, existing road signs and lane
markings were not developed for automated use. These shortcomings present
opportunities for modification of the existing infrastructure. High-resolution, 3D, digital
maps of roadways and nearby features are promising technologies that can help AVs
recognize their lanes and efficiently navigate in roads where lane markings are faded or
covered with snow. Smart infrastructure attempts to reengineer the existing roadways by
adding a digital component. Smart lane markings and smart roadway lights dynamically
improve visibility of lanes and roadways during nighttime driving and adverse weather
conditions.

68
GAP ANALYSIS
A total of 27 participants from diverse stakeholder perspectives attended 3 Web meetings.
Participants included technology developers, research and development organizations, vehicle
manufacturers, State and local transportation department and transportation official
representatives.
The findings from the needs assessment include the following:
• The biggest challenge AV technologies face is a lack of standardization. Lane-marking
patterns differ between States and within States. Curves in different States with identical
geometry can have advisory speeds more than 10 miles per hour different. V2I message
contents are in the development stage.
• The needs of CV and AV technologies differ, though there are some common needs. As
AVs mature, they will require information available through CVs or other sources.
• Redundancy of information is always beneficial. Sensors on a vehicle cannot acquire all
the information necessary in every circumstance. Information about the static
components of the infrastructure (e.g., signage and roadside inventory) can be used in
combination with information obtained from AV sensors and messages from V2V and
V2I applications.
• Technical issues need to be addressed for V2I applications to be effective in rural areas.
Power for RSUs is a question, and an economic way of deploying RSUs with sufficient
density for seamless communication coverage is needed.
• V2I connectivity requires that transportation departments install RSUs and develop
applications on vehicles to use the information. This is the “chicken and egg” metaphor
in which it is unclear whether transportation departments should first install RSUs or
manufacturers should first develop and perfect their V2I applications.
• Collaboration and frequent communication between infrastructure officials and
developers of CV and AV technologies is necessary for a common understanding of the
challenges and capabilities.
These findings were consistent with the findings of the literature review. Together, they provided
a strong foundation to develop a comprehensive list of initiatives for the research implementation
plan. Initiatives were outlined to address the RwD components of each gap.
RESEARCH IMPLEMENTATION PLAN
This report identifies some steps that FHWA can take to prepare for a future when CVs and AVs
are more common. Through these initiatives, FHWA’s partners at State transportation
departments can prepare themselves and the infrastructure that they operate to realize the safety
benefits CVs and AVs offer. The report recommends technology advancements so the
infrastructure can better support CV and AV operations. It recommends outreach activities, so
the staff at State and local transportation departments understand their role in deploying and

69
maintaining their assets that support CVs and AVs. The projects cover topics, ranging from
outreach and education to State and local transportation departments’ staffs to technical issues
concerning the capabilities of CV and AV technologies for reducing the frequency and severity
of RwD crashes.
FHWA and the RwD Team’s continued contribution to the broad programs sponsored by other
Government agencies, academia, and industry will improve the likelihood of achieving
successful implementation of CV and AV capabilities. Taken together, these efforts will improve
the infrastructure’s transition from the current norm of human drivers with conventional traffic
control devices to a future where CVs and AVs are common.
CV and AV are emerging technologies, and their applications will not be perfected instantly.
Rather, they will require continual research and development. For these technologies to have a
beneficial effect, they will require communication-standard implementations and some
infrastructure-component modifications. The benefits of CV and AV applications will not be
specific to RwD crashes only; benefits will always overlap with other safety concerns (e.g., rear-
end and lane-change crashes), mobility, environment, and others. Table 1 shows the research
activities and their focus areas.
As shown in table 1, the recommended initiatives cover diverse topics concerning RwD crashes
and CV- and AV-technology development. Overall, the initiatives cover technical issues
concerning CVs and AVs, communication standards development, State and local transportation
agency engagement and outreach, support to be provided by infrastructure officials, adjustments
to be made to traffic engineering manuals (such as the MUTCD), and economic benefit–cost
analyses of the emerging technologies.(4)
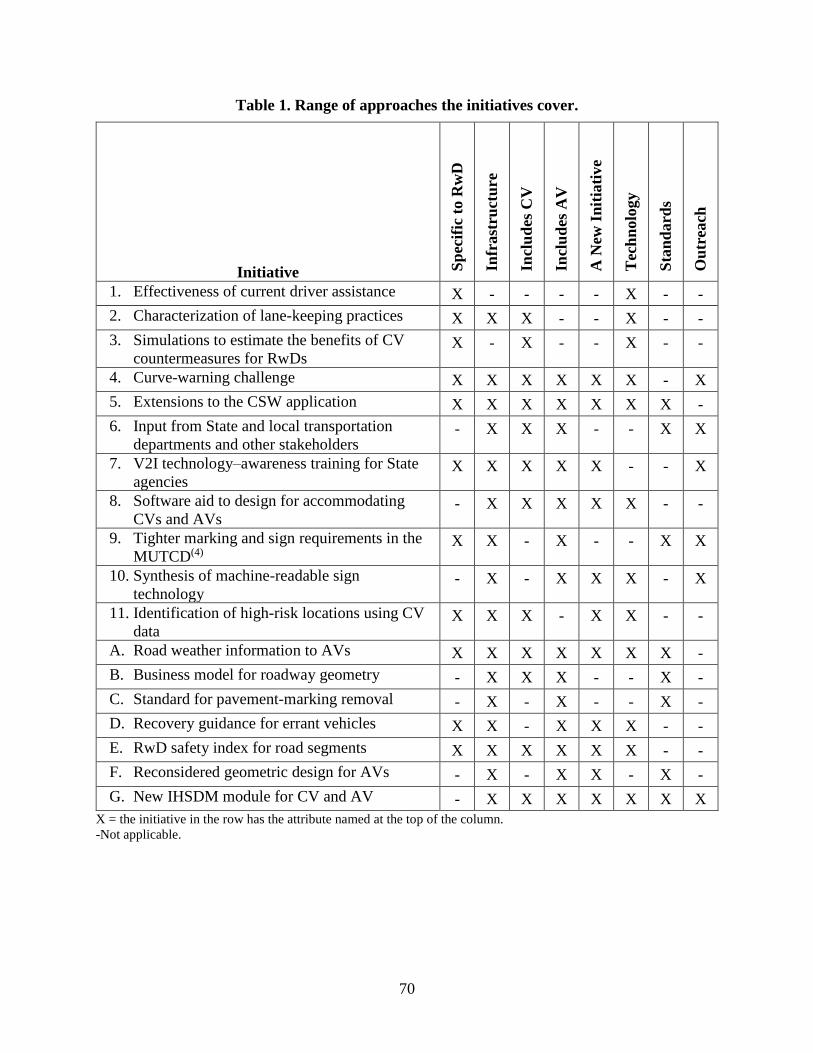
70
Table 1. Range of approaches the initiatives cover.
Initiative Sp
ecif
ic t
o R
wD
Infr
ast
ruct
ure
Incl
ud
es C
V
Incl
ud
es A
V
A N
ew I
nit
iati
ve
Tec
hn
olo
gy
Sta
nd
ard
s
Ou
trea
ch
1. Effectiveness of current driver assistance X - - - - X - -
2. Characterization of lane-keeping practices X X X - - X - -
3. Simulations to estimate the benefits of CV
countermeasures for RwDs X - X - - X - -
4. Curve-warning challenge X X X X X X - X
5. Extensions to the CSW application X X X X X X X -
6. Input from State and local transportation
departments and other stakeholders - X X X - - X X
7. V2I technology–awareness training for State
agencies X X X X X - - X
8. Software aid to design for accommodating
CVs and AVs - X X X X X - -
9. Tighter marking and sign requirements in the
MUTCD(4) X X - X - - X X
10. Synthesis of machine-readable sign
technology - X - X X X - X
11. Identification of high-risk locations using CV
data X X X - X X - -
A. Road weather information to AVs X X X X X X X -
B. Business model for roadway geometry - X X X - - X -
C. Standard for pavement-marking removal - X - X - - X -
D. Recovery guidance for errant vehicles X X - X X X - -
E. RwD safety index for road segments X X X X X X - -
F. Reconsidered geometric design for AVs - X - X X - X -
G. New IHSDM module for CV and AV - X X X X X X X
X = the initiative in the row has the attribute named at the top of the column.
-Not applicable.
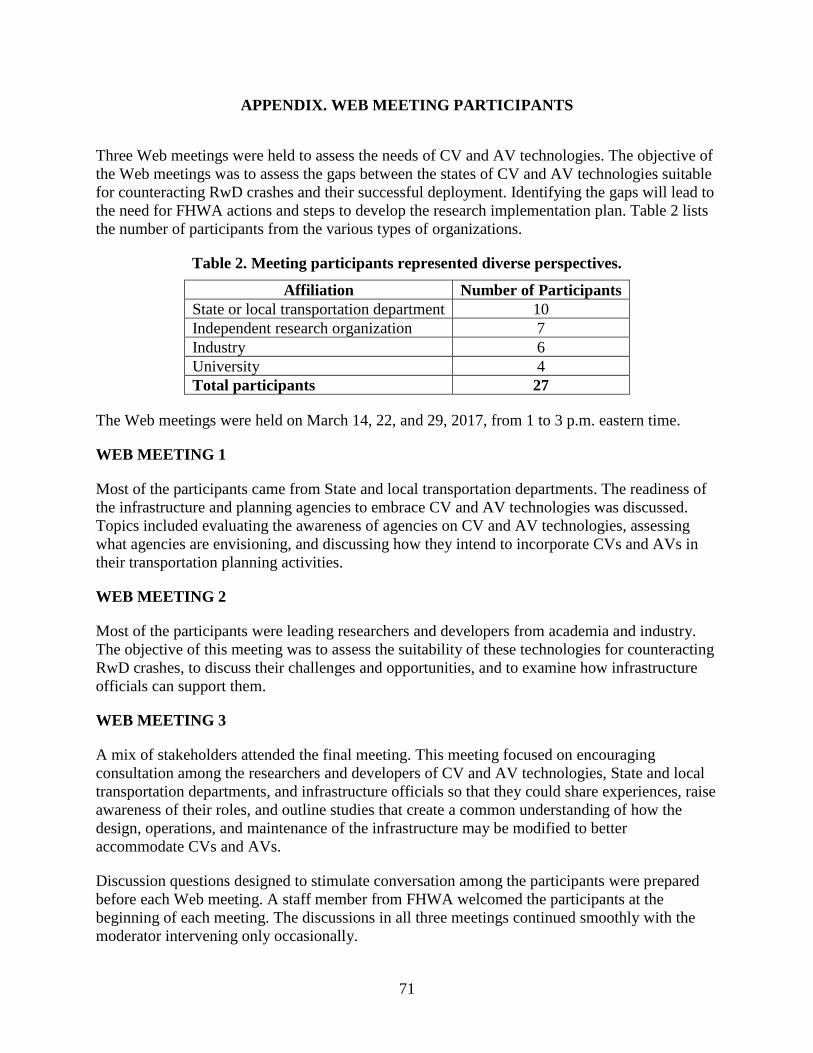
71
APPENDIX. WEB MEETING PARTICIPANTS
Three Web meetings were held to assess the needs of CV and AV technologies. The objective of
the Web meetings was to assess the gaps between the states of CV and AV technologies suitable
for counteracting RwD crashes and their successful deployment. Identifying the gaps will lead to
the need for FHWA actions and steps to develop the research implementation plan. Table 2 lists
the number of participants from the various types of organizations.
Table 2. Meeting participants represented diverse perspectives.
Affiliation Number of Participants
State or local transportation department 10
Independent research organization 7
Industry 6
University 4
Total participants 27
The Web meetings were held on March 14, 22, and 29, 2017, from 1 to 3 p.m. eastern time.
WEB MEETING 1
Most of the participants came from State and local transportation departments. The readiness of
the infrastructure and planning agencies to embrace CV and AV technologies was discussed.
Topics included evaluating the awareness of agencies on CV and AV technologies, assessing
what agencies are envisioning, and discussing how they intend to incorporate CVs and AVs in
their transportation planning activities.
WEB MEETING 2
Most of the participants were leading researchers and developers from academia and industry.
The objective of this meeting was to assess the suitability of these technologies for counteracting
RwD crashes, to discuss their challenges and opportunities, and to examine how infrastructure
officials can support them.
WEB MEETING 3
A mix of stakeholders attended the final meeting. This meeting focused on encouraging
consultation among the researchers and developers of CV and AV technologies, State and local
transportation departments, and infrastructure officials so that they could share experiences, raise
awareness of their roles, and outline studies that create a common understanding of how the
design, operations, and maintenance of the infrastructure may be modified to better
accommodate CVs and AVs.
Discussion questions designed to stimulate conversation among the participants were prepared
before each Web meeting. A staff member from FHWA welcomed the participants at the
beginning of each meeting. The discussions in all three meetings continued smoothly with the
moderator intervening only occasionally.


73
REFERENCES
1. FHWA. (2014). Revised Data Definitions for FHWA Safety Focus Areas. Memorandum from
Michael S. Griffith to the Safety Field. Available online:
https://safety.fhwa.dot.gov/fas/docs/focus_area_data_mem.pdf, last accessed April 16, 2018.
2. NHTSA. (2017). Automated Driving Systems 2.0: A Vision for Safety. Available online:
https://www.nhtsa.gov/sites/nhtsa.dot.gov/files/documents/13069a-
ads2.0_090617_v9a_tag.pdf, last accessed April 16, 2018.
3. SAE. (2016). Taxonomy and Definitions for Terms Related to Driving Automation Systems
for On-Road Motor Vehicles, SAE Standard J3016_201609, SAE International, Warrendale,
PA. Available online: http://standards.sae.org/j3016_201609/, last accessed April 16, 2018.
4. FHWA. (2010). Manual on Uniform Traffic Control Devices, Revision 2, Federal Highway
Administration, Washington, DC. Available online: https://mutcd.fhwa.dot.gov/, last
accessed April 16, 2018.
5. WHO. (2016). Road traffic injuries. World Health Organization, Geneva, Switzerland.
Available online: http://www.who.int/mediacentre/factsheets/fs358/en/, last accessed April
16, 2018.
6. Wijnen, W. and Stipdonk, H. (2016). “Social costs of road crashes: An international
analysis.” Accident Analysis & Prevention, 94, pp. 97–106, Elsevier, Amsterdam,
Netherlands.
7. NHTSA. (2017). 2016 Fatal Motor Vehicle Crashes: Overview. Traffic Safety Facts, Report
No. DOT HS 812 456, U.S. Department of Transportation, Washington, DC. Available
online: https://crashstats.nhtsa.dot.gov/Api/Public/ViewPublication/812456, last accessed
April 16, 2018.
8. FHWA. (2013). FHWA Roadway Departure (RwD) Strategic Plan. Federal Highway
Administration, Washington, DC. Available online:
http://safety.fhwa.dot.gov/roadway_dept/docs/rwd_strategic_plan_version2013.pdf, last
accessed April 16, 2018.
9. Lee, S.E., Olsen, E.C., and Wierwille, W.W. (2004). A comprehensive examination of
naturalistic lane-changes, Report No. DOT HS 809 702, U.S. Department of Transportation,
Washington, DC.
10. Cicchino, J.B. and Zuby, D.S. (2017). “Prevalence of driver physical factors leading to
unintentional lane departure crashes.” Traffic Injury Prevention, 18(5), pp. 481–487, Taylor
and Francis, London, England, UK.
11. Jalayer, M. and Zhou, H. (2017). Exploratory Analysis of Run-off-Road Crash Patterns.
Presented at the Transportation Research Board 96th Annual Meeting, Transportation
Research Board, Washington, DC.

74
12. Hallmark, S., Hsu, Y.Y., Boyle, L., Carriquiry, A., Tian, Y., and Mudgal, A. (2011).
Evaluation of Data Needs, Crash Surrogates, and Analysis Methods to Address Lane
Departure Research Questions Using Naturalistic Driving Study Data, SHRP2 Report S2-
S01E-RW-1, Transportation Research Board, Washington, DC.
13. Torbic, D.J., Harwood, D.W., Gilmore, D.K., Pfefer, R., Neuman, T.R., Slack, K.L., and
Hardy, K.K. (2004). Guidance for implementation of the AASHTO strategic highway safety
plan. Volume 7: A guide for reducing collisions on horizontal curves, Project G17-18 (3)
FY'00, Transportation Research Board, Washington, DC.
14. Hallmark, S.L., Hawkins, N.R., and Smadi, O.G. (2013). Toolbox of Countermeasures for
Rural Two-Lane Curves. Center for Transportation Research and Education, Iowa State
University, Ames, IA. Available online:
http://lib.dr.iastate.edu/cgi/viewcontent.cgi?article=1113&context=intrans_reports, last
accessed April 16, 2018.
15. TZD. (2014). Toward Zero Deaths: A National Strategy for Highway Safety. Available
online: http://www.towardzerodeaths.org/wp-
content/uploads/TZD_Strategy_12_1_2014.pdf, last accessed April 16, 2018.
16. AASHTO. (2008). Driving Down Lane Departure Crashes: A National Priority. American
Association of State Highway and Transportation Officials, Washington, DC.
17. Nelson, M., Miller, J.P., Zisman, I., Isackson, C., Helms, D., Albin, R.B., and Focke, D.
(2011). Best Practices In Lane-Departure Avoidance and Traffic Calming, Report No.
NCHRP Project20-68A, Transportation Research Board, Washington, DC.
18. FHWA. (2016). Local and Rural Road Safety Briefing Sheets: Roadway Departure Crashes,
Report No. FHWA-SA-14-092, Federal Highway Administration, Washington, DC.
Available online: http://safety.fhwa.dot.gov/local_rural/training/fhwasa14092/road_dep.pdf,
last accessed April 16, 2018.
19. Golembiewski, G.A. and Chandler, B. (2011). Roadway Departure Safety: A Manual for
Local Rural Road Owners, Report No. FHWA-SA-11-09, Federal Highway Administration,
Washington, DC.
20. ATSSA. (2015). Preventing Vehicle Departures from Roadways. American Traffic Safety
Services Association, Fredericksburg, VA. Available online:
http://www.cpcsigns.com/library/resource/Booklet_2015VehicleDeparture_Web.pdf, last
accessed April 16, 2018.
21. Jalayer, M., Zhou, H., and Satterfield, C.M. (2016). Overview of Safety Countermeasures for
Roadway Departure Crashes, Report No. 16-4039, Presented at the Transportation Research
Board 95th Annual Meeting, Transportation Research Board, Washington, DC.
22. Jalayer, M. and Zhou, H. (2016). “Evaluating the safety risk of roadside features for rural
two-lane roads using reliability analysis.” Accident Analysis & Prevention, 93, pp. 101–112,
Elsevier, Amsterdam, Netherlands.
75
23. Lyon, C., Persaud, B., and Eccles, K. (2017). Safety Evaluation of Two Curve Warning
Treatments: in Lane Curve Warning Pavement Markings and Oversized Chevron Signs.
Presented at the Transportation Research Board 96th Annual Meeting, Transportation
Research Board, Washington, DC.
24. Veneziano, D. and Knapp, K. (2016). Sign Effectiveness Guide, IHRB Project TR-686, Iowa
Local Technical Assistance Program, Iowa State University, Ames, IA. Available online:
http://www.intrans.iastate.edu/research/documents/research-
reports/sign_effectiveness_guide_w_cvr.pdf, last accessed April 16, 2018.
25. Satterfield, C., McGee, H.W., and Hanscom, F.R. (2009). “Low-Cost Safety Improvements
for Horizontal Curves.” Public Roads, 72(5), Report No. FHWA-HRT-09-003, Federal
Highway Administration, Washington, DC. Available online:
https://www.fhwa.dot.gov/publications/publicroads/09mar/05.cfm, last accessed April 16,
2018.
26. FHWA. (2017). State of the Practice for Shoulder and Center Line Rumble Strip
Implementation on Non-Freeway Facilities, Report No. FHWA-HRT-17-026, Federal
Highway Administration, Washington, DC. Available online:
https://www.fhwa.dot.gov/publications/research/safety/17026/17026.pdf, last accessed April
16, 2018.
27. FHWA. (2010). The Safety Edge, Report No. FHWA -SA-10-034, Federal Highway
Administration, Washington, DC. Available online:
https://safety.fhwa.dot.gov/roadway_dept/pavement/safedge/brochure/, last accessed April
16, 2018.
28. Bock, D., Kettles, D., and Harrison, J. (2016). Automated, Autonomous and Connected
Vehicle Technology Assessment, Report No. FSEC-CR-2020-16, Florida Solar Energy
Center, Cocoa, FL.
29. Rau, P., Yanagisawa, M., and Najm, W.G. (2015). Target Crash Population of Automated
Vehicles, Report No. 15-0430, 24th International Technical Conference on the Enhanced
Safety of Vehicles, National Highway Traffic Safety Administration, Gothenburg, Sweden.
30. Blower, D. (2014). Assessment of the effectiveness of advanced collision avoidance
technologies, Report No. UMTRI-2014-3, University of Michigan Transportation Research
Institute, Ann Arbor, MI. Availble online:
https://deepblue.lib.umich.edu/handle/2027.42/102534, last accessed April 16, 2018.
31. Kusano, K., Gorman, T.I., Sherony, R., and Gabler, H.C. (2014). “Potential occupant injury
reduction in the U.S. vehicle fleet for lane departure warning–equipped vehicles in single-
vehicle crashes.” Traffic injury prevention, 15(sup1), pp. S157–S164, Taylor and Francis,
London, England, UK.
32. LeBlanc, D., Sayer, J., Winkler, C., Ervin, R., Bogard, S., Devonshire, J., Mefford, M., et al.
(2006). Road Departure Crash Warning System Field Operational Test: Methodology and

76
Results. Volume 2: Appendices, Report No. UMTRI-2006-9-2, University of Michigan
Transportation Research Institute, Ann Arbor, MI.
33. Sayer, J., LeBlanc, D., Bogard, S., Funkhouser, D., Bao, S., Buonarosa, M.L., and
Blankespoor, A. (2011). Integrated Vehicle-Based Safety Systems: Field Operational Test
Final Program Report, Report No. DOT HS 811 482, U.S. Department of Transportation,
Washington, DC.
34. Cades, D.M., Crump, C., Lester, B.D., and Young, D. (2017). “Driver Distraction and
Advanced Vehicle Assistive Systems (ADAS): Investigating Effects on Driver Behavior.”
Advances in Human Aspects of Transportation, pp. 1,015–1,022, Springer International
Publishing, New York, NY.
35. Lattke, B., Eckert, A., Feifel, H., Fröhlich, D., McClain, J., Adireddy, G., Janda, F. and
Fuchs, E. (2015). Road Departure Protection - A Means for Increasing Driving Safety
Beyond Road Limits, Report No. 15-0212, 24th International Technical Conference on the
Enhanced Safety of Vehicles, National Highway Traffic Safety Administration, Gothenburg,
Sweden.
36. Harper, C.D., Hendrickson, C.T., and Samaras, C. (2016). “Cost and benefit estimates of
partially-automated vehicle collision avoidance technologies.” Accident Analysis &
Prevention, 95, pp. 104–115, Elsevier, Amsterdam, Netherlands.
37. Moore, M. and Zuby, D. (2013). Collision avoidance features: initial results. 23rd
International Conference on the Enhanced Safety of Vehicles, National Highway Traffic
Safety Administration, Seoul, Republic of Korea.
38. Kockelman, K.M. and Li, T. (2016). Valuing the Safety Benefits of Connected and
Automated Vehicle Technologies, Report No. 16-1468, Transportation Research Board 95th
Annual Meeting, Transportation Research Board, Washington, DC.
39. Farmer, C.M. (2008). Crash avoidance potential of five vehicle technologies. Insurance
Institute for Highway Safety, Arlington, VA. Available online:
http://www.iihs.org/frontend/iihs/documents/masterfiledocs.ashx?id=1826, last accessed
April 16, 2018.
40. Jermakian, J.S. (2011). “Crash avoidance potential of four passenger vehicle technologies.”
Accident Analysis & Prevention, 43(3), pp. 732–740, Elsevier, Amsterdam, Netherlands.
41. i2010 Intelligent Car Initiative. (2009). i2010: Intelligent Car. Office for Official
Publications of the European Communities, Belgium, Germany. Available online:
http://www.lu.lv/materiali/biblioteka/es/pilnieteksti/transports/i2010.%20Intelligent%20car.p
df, last accessed April 16, 2018.
42. Gordon, T., Sardar, H., Blower, D., Ljung Aust, M., Bareket, Z., Barnes, M., Blankespoor,
A., et al. (2010). Advanced crash avoidance technologies (ACAT) program–Final report of
the Volvo-Ford-UMTRI project: safety impact methodology for lane departure warning–

77
Method development and estimation of benefits, Report No. DOT HS 811 405, U.S.
Department of Transportation, Washington, DC.
43. Kusano, K.D. and Gabler, H.C. (2015). “Comparison of expected crash and injury reduction
from production forward collision and lane departure warning systems.” Traffic Injury
Prevention, 16(sup2), pp. S109–S114, Taylor and Francis, London, England, UK.
44. NHTSA. (2017). NHTSA Investigation of Tesla’s Automatic Vehicle Control Systems,
Investigation: PE 16-007, U.S. Department of Transportation, Washington, DC. Available
online: https://static.nhtsa.gov/odi/inv/2016/INCLA-PE16007-7876.PDF, last accessed July
27, 2018.
45. Katzourakis, D.I., de Winter, J., Alirezaei, M., Corno, M., and Happee, R. (2014). “Road-
departure prevention in an emergency obstacle avoidance situation.” IEEE Transactions on
Systems, Man, and Cybernetics: Systems, 44(5), pp. 621–629, Institute of Electrical and
Electronics Engineers, Piscataway, NJ.
46. Scanlon, J.M., Kusano, K.D., Sherony, R., and Gabler, H.C. (2015). Potential Safety Benefits
of Lane Departure Warning and Prevention Systems in the US Vehicle Fleet, Report No. 15-
0080, 24th International Technical Conference on the Enhanced Safety of Vehicles, National
Highway Traffic Safety Administration, Gothenburg, Sweden.
47. Kaur, G. and Kumar, D. (2015). “Lane Detection Techniques: A Review.” International
Journal of Computer Applications, 112(10), pp. 4–8, Foundation of Computer Science, New
York, NY.
48. Kusano, K.D. and Gabler, H.C. (2012). “Field relevance of the new car assessment program
lane departure warning confirmation test.” SAE International Journal of Passenger Cars-
Mechanical Systems, 5(2012-01-0284), pp. 253–264, SAE International, Warrendale, PA.
49. HLDI. (2012). “Crash avoidance features reduce crashes, insurance claims study shows;
autonomous braking and adaptive headlights yield biggest benefits.” (website). Insurance
Institute for Highway Safety; Highway Loss Data Institute, Arlington, VA. Available online:
http://www.iihs.org/iihs/news/desktopnews/crash-avoidance-features-reduce-crashes-
insurance-claims-study-shows-autonomous-braking-and-adaptive-headlights-yield-biggest-
benefits, last accessed April 16, 2018.
50. Reagan, I.J. and McCartt, A.T. (2016). “Observed activation status of lane departure warning
and forward collision warning of Honda vehicles at dealership service centers.” Traffic Injury
Prevention, 17(8), pp. 827–832, Taylor and Francis, London, England, UK.
51. Eichelberger, A.H. and McCartt, A.T. (2014). “Toyota Drivers’ Experiences with Dynamic
Radar Cruise Control, the Pre-Collision System, and Lane-Keeping Assist.” Journal of Safety
Research, 56, pp. 67–73, Elsevier, Amsterdam, Netherlands.
52. Eichelberger, A.H. and McCartt, A.T. (2014). “Volvo drivers’ experiences with advanced
crash avoidance and related technologies.” Traffic Injury Prevention, 15(2), pp. 187–195,
Taylor and Francis, London, England, UK.

78
53. Navarro, J., Deniel, J., Yousfi, E., Jallais, C., Bueno, M., and Fort, A. (2017). “Influence of
lane departure warnings onset and reliability on car drivers’ behaviors.” Applied
Ergonomics, 59, pp. 123–131, Elsevier, Amsterdam, Netherlands.
54. Navarro, J., Yousfi, E., Deniel, J., Jallais, C., Bueno, M., and Fort, A. (2016). “The impact of
false warnings on partial and full lane departure warnings effectiveness and acceptance in car
driving.” Ergonomics, pp. 1–12, Taylor and Francis, London, England, UK.
55. Sao, Y.W. and Rajkamar, R.R. (2014). Utilizing instantaneous driving direction for
enhancing lane-marking detection. 2014 IEEE Intelligent Vehicles Symposium Proceedings,
pp. 170–175, Institute of Electrical and Electronics Engineers, Dearborn, MI.
56. Nan, Z., Wei, P., Xu, L., and Zheng, N. (2016). “Efficient Lane Boundary Detection with
Spatial-Temporal Knowledge Filtering.” Sensors, 16(8), p. 1,276, MDPI AG, Basel,
Switzerland. Available online: http://www.mdpi.com/1424-8220/16/8/1276/htm, last
accessed April 16, 2018.
57. Huang, J., Liang, H., Wang, Z., Mei, T., and Song, Y. (2013). Robust lane marking detection
under different road conditions. IEEE International Conference on Robotics and
Biomimetics, pp. 1,753–1,758, Institute of Electrical and Electronics Engineers, Shenzhen,
China.
58. Joo, D.N., Moon, S.C., Kim, M.W., Lee, S.G., and Tan, B.Q. (2014). A study about curve
extraction and lane departure determination of linear curved road. 14th International
Conference on Control, Automation and Systems, pp. 720–725, Institute of Electrical and
Electronics Engineers, Seoul, Republic of Korea.
59. de Paula, M.B. and Jung, C.R. (2013). Real-time detection and classification of road lane
markings. 2013 XXVI Conference on Graphics, Patterns and Images, pp. 83–90, Institute of
Electrical and Electronics Engineers, Arequipa, Peru.
60. Rodríguez-Garavito, C.H., Ponz, A., García, F., de la Escalera, A., and Armingol, J.M.
(2015). Computer Vision Applied to Road Lines Recognition Using Machine Learning. ICIT
2015 Seventh International Conference on Information Technology, Amman, Jordan.
61. Lu, G. (2015). A Lane Detection, Tracking and Recognition System for Smart Vehicles.
Doctoral dissertation, University of Ottawa, Ottawa, Canada. Available online:
https://www.ruor.uottawa.ca/bitstream/10393/32077/1/Lu_Guangqian_2015_thesis.pdf, last
accessed April 16, 2018.
62. Hoang, T.M., Hong, H.G., Vokhidov, H., and Park, K.R. (2016). “Road lane detection by
discriminating dashed and solid road lanes using a visible light camera sensor.” Sensors,
16(8), p. 1,313, MDPI AG, Basel, Switzerland.
63. Caltech Library. (no date). “Caltech DATA.” (database) Caltech, Pasadena, CA. Available
online: https://data.caltech.edu/, last accessed April 16, 2018.

79
64. Ding, D., Yoo, J., Jekyo, J., Jin, S., and Kwon, S. (2015). “Efficient Road-Sign Detection
Based on Machine Learning.” Bulletin of Networking, Computing, Systems, and
Software, 4(1), pp. 15–17, BNCSS, Hiroshima, Japan.
65. Smith, B., Kluger, R., and Park, H. (2015). Infrastructure Safety Assessment in a Connected
Vehicle Environment. Virginia Tech Transportation Institute, Blacksburg, VA; University of
Virginia Center for Transportation Studies, Charlottesville, VA; and Morgan State
University, Baltimore, MD. Available online:
https://vtechworks.lib.vt.edu/bitstream/handle/10919/72251/InfrastructureSafetyAssessment.
pdf?sequence=1&isAllowed=y, last accessed April 16, 2018.
66. Davies, C. (2017). Effects of Pavement Marking Characteristics on Machine Vision
Technology. Presented at the Transportation Research Board 96th Annual Meeting,
Transportation Research Board, Washington, DC.
67. Bhujbal, P.N. and Narote, S.P. (2015). Lane departure warning system based on Hough
transform and Euclidean distance. 2015 Third International Conference on Image
Information Processing, pp. 370–373, Institute of Electrical and Electronics Engineers,
Solan, India.
68. Xu, M., Xie, M., and Zhang, D. (2015). A Robust Lane Detection and Tracking Based on
Vanishing Point and Particle Filter. Proceedings of the Third International Conference on
Communications, Signal Processing, and Systems, pp. 677–685, Springer International
Publishing, New York, NY.
69. Mammeri, A., Lu, G., and Boukerche, A. (2015). Design of lane keeping assist system for
autonomous vehicles. 2015 Seventh International Conference on New Technologies,
Mobility and Security, pp. 1–5, Institute of Electrical and Electronics Engineers, Paris,
France.
70. Kalaki, A. and Safabakhsh, R. (2014). Current and adjacent lanes detection for an
autonomous vehicle to facilitate obstacle avoidance using a monocular camera. 2014 Iranian
Conference on Intelligent Systems, pp. 1–6, Institute of Electrical and Electronics Engineers,
Bam, Iran.
71. Yang, J., Li, Z., and Li, L. (2012). Lane detection based on classification of lane geometrical
model. 11th International Conference on Signal Processing, Vol. 2, pp. 842–846, Institute of
Electrical and Electronics Engineers, Bangalore, Karnataka, India.
72. Kawamura, T., Kashiwa, T., Taguchi, K., and Kishimoto, Y. (2014). Intelligent driving lane
with RF-ID for vehicle navigation system. 2014 International Conference on Connected
Vehicles and Expo, pp. 869–870, Vienna, Austria.
73. Davis, B. and Donath, M. (2016). “Development of a Sensor Platform for High-Accuracy
Mapping of Roadway Lane Markings.” Transportation Research Record: Journal of the
Transportation Research Board, 2551, pp. 45–51, Transportation Research Board,
Washington, DC.

80
74. Siegel, M. (2001). Fluorescent paint for roadway lane-markers. Instrumentation and
Measurement Technology Conference, Proceedings of the 18th International Electrical and
Electronics Engineers, Vol. 3, pp. 2,055–2,060, Institute of Electrical and Electronics
Engineers, Budapest, Hungary.
75. Reagan, I.J., Brumbelow, M., and Frischmann, T. (2015). “On-road experiment to assess
drivers’ detection of roadside targets as a function of headlight system, target placement, and
target reflectance.” Accident Analysis & Prevention, 76, pp. 74–82, Elsevier, Amsterdam,
Netherlands.
76. Delphi. (2016). Testimony by Glen De Vos of Delphi. Senate Commerce, Science and
Transportation Committee Hearing, Dublin, Ireland. Available online:
https://www.commerce.senate.gov/public/_cache/files/86053bb6-58d8-4072-a033-
03f36766d0c3/0EEB8D39E9E224E1A35D274D5325C181.2016-march-15---delphi-de-vos-
testimony-final.pdf, last accessed April 16, 2018.
77. Benine-Neto, A., Scalzi, S., Mammar, S., Netto, M., and Lusetti, B. (2014). “Model
reference-based vehicle lateral control for lane departure avoidance.” International Journal
of Vehicle Autonomous Systems, 12(3), pp. 284–306, Inderscience Publishers, Olney, Bucks,
UK.
78. Gao, Y., Gordon, T., Lidberg, M., and Klomp, M. (2016). “An autonomous safety system for
road departure prevention based on combined path and sideslip control.” The Dynamics of
Vehicles on Roads and Tracks: Proceedings of the 24th Symposium of the International
Association for Vehicle System Dynamics (IAVSD 2015), Graz, Austria, 17–21 August
2015, pp. 281–286, CRC Press, Taylor and Francis Group, London, England, UK.
79. Edelmann, J., Gobbi, M., Mastinu, G., Ploechl, M., and Previaati, G. (2015). Friction
Estimation at Tire-Ground Contact, SAE Paper No. 2015-01-1594, SAE International,
Warrendale, PA.
80. Goodall, N. (2014). “Ethical decision making during automated vehicle crashes.”
Transportation Research Record: Journal of the Transportation Research Board, 2424, pp.
58–65, Transportation Research Board, Washington, DC.
81. Lin, P. (2016). “Why ethics matters for autonomous cars.” Autonomous Driving, pp. 69–85,
Springer Berlin–Heidelberg, Berlin, Germany.
82. Fagnant, D. and Kockelman, K. (2015). “Preparing a nation for autonomous vehicles:
opportunities, barriers and policy recommendations.” Transportation Research Part A:
Policy and Practice, 77, pp. 167–181, Elsevier, Amsterdam, Netherlands.
83. West, D.M. (2016). “Moving forward: Self-driving vehicles in China, Europe, Japan, Korea,
and the United States.” Center for Technology Innovation at Brookings, September, The
Brookings Institution, Washington, DC. Available online: https://www.brookings.edu/wp-
content/uploads/2016/09/driverless-cars-3-ed.pdf, last accessed April 16, 2018.

81
84. Bansal, P. and Kockelman, K.M. (2016). Forecasting Americans’ Long-Term Adoption of
Connected and Autonomous Vehicle Technologies. Transportation Research Board 95th
Annual Meeting, Paper No. 16-1871, Transportation Research Board, Washington, DC.
85. Blanco, M., Atwood, J., Russell, S., Trimble, T., McClafferty, J., and Perez, M. (2016).
Automated Vehicle Crash Rate Comparison Using Naturalistic Data. Virginia Tech
Transportation Institute, Blacksburg, VA.
86. Kalra, N. and Paddock, S.M. (2016). “Driving to safety: How many miles of driving would it
take to demonstrate autonomous vehicle reliability?” Transportation Research Part A: Policy
and Practice, 94, pp. 182–193, Elsevier, Amsterdam, Netherlands.
87. NHTSA. (2014). Fact Sheet: Improving Safety and Mobility Through Vehicle-to-Vehicle
Communication Technology, 10575-013114-v5, U.S. Department of Transportation, National
Highway Traffic Safety Administration, Washington, DC. Available online:
https://www.nhtsa.gov/staticfiles/safercar/connected/V2V_fact_sheet-02032014.pdf, last
accessed April 16, 2018.
88. Richard, C.M., Morgan, J.F., Bacon, L.P., Graving, J.S., Divekar, G., and Lichty, M.G.
(2015). Multiple sources of safety information from v2v and v2i: Redundancy, decision
making, and trust—safety message design report, Report No. FHWA-HRT-15-007, Federal
Highway Administration, Washington, DC.
89. Chang, J., Hatcher, G., Hicks, D., Schneeberger, J., Staples, B., Sundarajan, S., Vasudevan,
M., Wang, P., and Wunderlich, K. (2015). Estimated Benefits of Connected Vehicle
Applications: Dynamic Mobility Applications, AERIS, V2I Safety, and Road Weather
Management Applications, Report No. FHWA-JPO-15-255, Federal Highway
Administration, Washington, DC.
90. Altan, O.D., Lam, A., Brewer, J., and Swanson, E.D. (2012). Communications Based
Integrated Lane Change, Lane Drift and Blind Spot Warning System. 19th ITS World
Congress, Vienna, Austria.
91. Shagdar, O. and Muhlethaler, P. (2013). “Study on merging control supported by IEEE
802.11 p systems for highway environments.” Wireless Days (WD), 2013 IFIP, pp. 1–4,
IEEE, Valencia, Spain.
92. Stephens, D., Timcho, T., Young, E., Klein, R., and Schroeder, J. (2012). Accelerated
Vehicle-to-Infrastructure (V2I) Safety Applications Concept of Operations Document, Report
No. FHWA-JPO-13-058, Federal Highway Administration, Washington, DC. Available
online: https://rosap.ntl.bts.gov/view/dot/26496/dot_26496_DS1.pdf?, last accessed April 16,
2018.
93. Hayee. (2016). Development and Demonstration of a Cost Effective In-Vehicle Lane
Departure and Advanced Curve Speed Warning System. University of Minnesota,
Minneapolis, MN. Available online:
http://www.cts.umn.edu/Research/projectdetail.html?id=2017002, last accessed April 16,
2018.

82
94. Dahmani, H., Chadli, M., Rabhi, A., and El Hajjaji, A. (2015). “Vehicle dynamics and road
curvature estimation for lane departure warning system using robust fuzzy observers:
experimental validation.” Vehicle System Dynamics, 53(8), pp. 1,135–1,149, Taylor and
Francis, London, England, UK.
95. Eccles, K., Gross, F., Liu, M., and Council, F. (2012). Crash Data Analyses for Vehicle-To-
Infrastructure Communications for Safety Applications, Report No. FHWA-HRT-11-040,
Federal Highway Administration, Washington, DC.
96. Timcho, T., Young, E., Klein, R., Schroeder, J., and Stephens, D. (2013). Vehicle-to-
Infrastructure (V2I) Safety Applications System Requirements Document Final, Report No.
FHWA-JPO-13-061, Federal Highway Administration, Washington, DC. Available online:
https://rosap.ntl.bts.gov/view/dot/26495/Prin, last accessed April 16, 2018.
97. R.E.S.C.U.M.E. (2014). Prototype Development and Demonstration for Response,
Emergency Staging, Communications, Uniform Management, and Evacuation
(R.E.S.C.U.M.E.). Prototype System Architecture, ITS JPO, USDOT, Washington, DC.
Available online: https://rosap.ntl.bts.gov/view/dot/3524, last accessed April 16, 2018.
98. Stephens, D., Timcho, T., Smith, T., Balke, K., Charara, H., and Sunkari, S. (2015).
Technical Report on Prototype Intelligent Network Flow Optimization (INFLO) Dynamic
Speed Harmonization and Queue Warning, Report No. FHWA-JPO-15-213, Federal
Highway Administration, Washington, DC.
99. Neumeister, D. and Venner, M. (2016). Prototype Road Weather Performance Management
Tool Project Report, Report No. FHWA-JPO-17-486, Federal Highway Administration,
Washington, DC. Available online: https://rosap.ntl.bts.gov/view/dot/32020, last accessed
April 16, 2018.
100. Hill, C.J. (2013). Concept of Operations for Road Weather Connected Vehicle
Applications, Report No. FHWA-JPO-13-047, Federal Highway Administration,
Washington, DC.
101. Alam, N., Balaei, A.T., and Dempster, A.G. (2012). “An Instantaneous Lane-Level
Positioning Using DSRC Carrier Frequency Offset.” IEEE Transactions on Intelligent
Transportation Systems, 13(4), pp. 1,566–1,575, Institute of Electrical and Electronics
Engineers, Piscataway, NJ.
102. Liu, J., Wan, J., Wang, Q., Li, D., Qiao, Y. and Cai, H. (2015). “A Novel Energy-Saving
One-Sided Synchronous Two-Way Ranging Algorithm for Vehicular Positioning.” Mobile
Networks and Applications, 20(5), pp. 661–672, Springer International Publishing, New
York, NY.
103. Ansari, K. (2014). Development of an inter-vehicle communications & positioning platform
for transport safety applications. Doctoral dissertation, Queensland University of
Technology, Brisbane City, Queensland, Australia. Available online:
http://eprints.qut.edu.au/72657/1/Keyvan_Ansari_Thesis.pdf, last accessed April 16, 2018.

83
104. Wang, D. (2015). Cooperative V2X Relative Navigation using Tight-Integration of DGPS
and V2X UWB Range and Simulated Bearing. Doctoral dissertation, University of Calgary,
Calgary, Alberta, Canada. Available online,
http://theses.ucalgary.ca/bitstream/11023/2109/2/ucalgary_2015_wang_da.pdf, last accessed
April 16, 2018.
105. Wang, Y., Duan, X., Tian, D., Chen, M., and Zhang, X. (2016). “A DSRC-Based Vehicular
Positioning Enhancement Using a Distributed Multiple-Model Kalman Filter.” IEEE
Access, 4, pp. 8,338–8,350, Institute of Electrical and Electronics Engineers, Piscataway, NJ.
106. Shar, G. (2015). Volvo road test tests roads, shares road friction with cloud. Available
online: http://www.autoconnectedcar.com/2015/02/volvo-road-test-tests-roads-shares-road-
friction-with-cloud/, last accessed April 16, 2018.
107. Johnson, T., Sherony, R., and Gabler, H.C. (2016). Driver lane keeping behavior in normal
driving using 100-car naturalistic driving study data. 2016 IEEE Intelligent Vehicles
Symposium (IV), pp. 227–232, Institute of Electrical and Electronics Engineers, Gothenburg,
Sweden.
108. Hallmark, S.L., Tyner, S., Oneyear, N., Carney, C., and McGehee, D. (2015). “Evaluation of
driving behavior on rural 2-lane curves using the SHRP 2 naturalistic driving study
data.” Journal of Safety Research, 54, pp. 17–21, Elsevier, Amsterdam, Netherlands.
109. Oneyear, N., Hallmark, S., Tyner, S., McGehee, D., and Carney, C. (2015). Development of a
Conceptual Model of Curve Driving for Isolated Rural Two Lane Curves Using SHRP2
Naturalistic Driving Data 2. Presented at the 5th International Symposium on Highway
Geometric Design, Vancouver, British Columbia, Canada.
110. Rey, G., Clair, D., Fogli, M., and Bernardin, F. (2014). “Infrastructure based approach for
roadway departure risk assessment.” Transportation Research Part C: Emerging
Technologies, 48, pp. 109–119, Elsevier, Amsterdam, Netherlands.
111. Ghasemzadeh, A. and Ahmed, M. (2017). Driver’s Lane Keeping Ability in Inclement
Weather Conditions: Preliminary Investigation using the SHRP2 Naturalistic Driving Study
Data. Presented at the Transportation Research Board 96th Annual Meeting, Transportation
Research Board, Washington, DC.
112. AASHTO. (2014). Highway Safety Manual. American Association of State Highway and
Transportation Officials, Washington, DC. Available online:
http://www.highwaysafetymanual.org/Pages/hsm_parts.aspx#partb, last accessed April 16,
2018.
113. Brimley, B., Saito, M., and Schultz, G. (2012). “Calibration of Highway Safety Manual
Safety performance function: development of new models for rural two-lane two-way
highways.” Transportation Research Record: Journal of the Transportation Research Board,
2279, pp. 82–89, Transportation Research Board, Washington, DC.

84
114. Miaou, S.P. (2013). “Some Limitations of the Models in the Highway Safety Manual to
Predict Run-off-Road Crashes.” Transportation Research Record: Journal of the
Transportation Research Board, 2377, pp. 38–48, Transportation Research Board,
Washington, DC.
115. Leur, P.D. and Sayed, T. (2002). “Development of a road safety risk index.” Transportation
Research Record: Journal of the Transportation Research Board, 1784, pp. 33–42,
Transportation Research Board, Washington, DC.
116. Leur, P. and Hill, D. (2015). “Quantification of Road Safety Risk at Locations Without
Collisions to Justify Road Safety Investments.” Transportation Research Record: Journal of
the Transportation Research Board, 2513, pp. 21–29, Transportation Research Board,
Washington, DC.
117. Rosolino, V., Teresa, I., Vittorio, A., Carmine, F.D., Antonio, T., Daniele, R., and Claudio,
Z. (2014). “Road safety performance assessment: a new road network Risk Index for info
mobility.” Procedia-Social and Behavioral Sciences, 111, pp. 624–633, Elsevier,
Amsterdam, Netherlands.
118. Carrigan, C. and Ray, M. (2017). A New Approach to Run-Off-Road Crash Prediction.
Presented at the Transportation Research Board 96th Annual Meeting, Transportation
Research Board, Washington DC.
119. Arora, P., Corbin, D., and Brennan, S.N. (2016). Variable-sensitivity road departure warning
system based on static, mapped, near-road threats. 2016 IEEE Intelligent Vehicles
Symposium (IV), pp. 1,217–1,223, Institute of Electrical and Electronics Engineers,
Piscataway, NJ.
120. Mak, K.K. and Sicking, D. (2003). Roadside safety analysis program (RSAP): engineer’s
manual, NCHRP Report No. 492, Transportation Research Board, Washington, DC.
121. Guan, H., Li, J., Cao, S., and Yu, Y. (2016). “Use of mobile LiDAR in road information
inventory: A review.” International Journal of Image and Data Fusion, 7(3) pp. 219–242,
Taylor and Francis, London, England, UK.
122. Landa, J. and Prochazka, D. (2014). “Automatic road inventory using LiDAR.” Procedia
Economics and Finance, 12, pp. 363–370, Elsevier, Amsterdam, Netherlands.
123. Sairam, N., Nagarajan, S., and Ornitz, S. (2016). “Development of Mobile Mapping System
for 3D Road Asset Inventory.” Sensors, 16(3), p. 367, MDPI AG, Basel, Switzerland.
124. Zhang, H. (2016). Rapid inspection of pavement markings using mobile laser scanning point
clouds. Master’s thesis, University of Waterloo, Waterloo, Ontario, Canada. Available
online: https://uwspace.uwaterloo.ca/bitstream/handle/10012/10343/Zhang_Haocheng.pdf,
last accessed April 16, 2018.

85
125. Gargoum, S., El-Basyouny, K., Sabbagh, J., and Froese, K. (2017). Automated Highway Sign
Extraction Using LiDAR Data. Presented at the Transportation Research Board 96th Annual
Meeting, Transportation Research Board, Washington, DC.
126. Gareffa, P. (2016). “Ford, Google Self-Driving Cars Tackle Challenges of Snow and Rain.”
Edmunds, Santa Monica, CA. Available online: https://www.edmunds.com/car-news/ford-
google-self-driving-cars-tackle-challenges-of-snow-and-rain.html, last accessed April 16,
2018.
127. Kent, L. (2016). “HERE introduces HD maps for highly automated vehicle testing.” HERE,
Amsterdam, Netherlands. Available online: http://360.here.com/2015/07/20/here-introduces-
hd-maps-for-highly-automated-vehicle-testing/, last accessed April 16, 2018.
128. Du, X. and Tan, K.K. (2016). “Comprehensive and practical vision system for self-driving
vehicle lane-level localization.” IEEE Transactions on Image Processing, 25(5), pp. 2,075–
2,088, Institute of Electrical and Electronics Engineers, Piscataway, NJ.
129. Gigliotti, D. and Scurry, K. (2016). “What drives highway safety improvements?” Public
Roads, 80(3), Report No. FHWA-HRT-17-001, Federal Highway Administration,
Washington, DC. Available online:
http://www.fhwa.dot.gov/publications/publicroads/16novdec/06.cfm, last accessed April 16,
2018.
130. FHWA. (2009). LED Raised Pavement Markers, Report No. FHWA-SA-09-007, Federal
Highway Administration, Washington, DC. Available online:
http://safety.fhwa.dot.gov/intersection/conventional/unsignalized/tech_sum/fhwasa09007/fh
wasa09007.pdf, last accessed April 16, 2018.
131. US Reflector. (n.d.). Snow Plowable Solar Markers, US Reflector, Worcester, MA.
Available online: http://www.usreflector.com/PDF%20files/LED-
Lights/Snowplowable%20Markers%20LED%20new.pdf, last accessed April 16, 2018.
132. Robarts, S. (2014). “First highway with glow-in-the-dark markings opens in the
Netherlands.” New Atlas, Melbourne, Australia. Available online: http://newatlas.com/smart-
highway-glowing-lines/34363/, last accessed April 16, 2018.
133. Studio Roosegaarde. (2016). Smart Highways, Studio Roosegaarde, Rotterdam, Netherlands.
Available online:
https://www.studioroosegaarde.net/uploads/files/2014/10/18/199/Factsheet%20Smart%20Hi
ghway%20-%20Daan%20Roosegaarde.pdf, last accessed April 16, 2018.
134. Clarke, D., Andre, D., and Zhang, F. (2016). Synthetic Aperture Radar for Lane Boundary
Detection in Driver Assistance Systems. 2016 IEEE International Conference on Multisensor
Fusion and Integration for Intelligent Systems (MFI), Institute of Electrical and Electronics
Engineers, Baden-Baden, Germany. Available online:
https://mediatum.ub.tum.de/doc/1430210/730073.pdf, last accessed April 16, 2018.

86
135. Gibbons, R., Guo, F., Medina, A., Terry, T., Du, J., Lutkevich, P., and Li, Q. (2014). Design
criteria for adaptive roadway lighting, Report No. FHWA-HRT-14-051, Federal Highway
Administration, Washington, DC.
136. Foote, J. and Woods, E. (2012). Smart Street Lighting: LEDs, Communications Equipment,
and Network Management Software for Public Outdoor Lighting: Market Analysis and
Forecasts. Pike Research, part of Navigant Energy Practice, Boulder, CO. Available online:
https://www.navigantresearch.com/research/smart-street-lighting, last accessed April 16,
2018.
137. Gibbons, R., Cheung, J., and Lutkevich, P. (2015). The Future of Roadway Lighting, Report
No. FHWA-HRT-16-001, Federal Highway Administration, Washington, DC.
138. Gibbons, R., Palmer, M., and Jahangiri, A. (2016). Connected Vehicle Applications for
Adaptive Overhead Lighting (On-demand Lighting). Virginia Tech Transportation Institute,
Connected Vehicle/Infrastructure University Transportation Center, Blacksburg, VA.
Available online:
https://vtechworks.lib.vt.edu/bitstream/handle/10919/72846/Gibbons_Connected-Vehicle-
Applications-for-Adaptive-Overhead-Lighting.pdf?sequence=1, last accessed April 16, 2018.
139. Tideman, M., Van Der Voort, M.C., Van Arem, B., and Tillema, F. (2007). A review of
lateral driver support systems. 2007 Intelligent Transportation Systems Conference, pp. 992–
999, Institute of Electrical and Electronics Engineers, Seattle, WA.
140. Navvab, M., Bisegna, F., and Gugliermetti, F. (2015). Dynamic roadways and in-vehicle
lighting conditions for determining mesopic adaptation luminance. 2015 IEEE 15th
International Conference on Environment and Electrical Engineering, pp. 2,005–2,010,
Institute of Electrical and Electronics Engineers, Rome, Italy.
141. Blau, J. (2015). “Smart Cars Need Smart Roads.” Research-Technology Management, 58(5),
p. 4, Taylor and Francis, London, England, UK. Available online:
https://www.questia.com/library/journal/1G1-428875311/smart-cars-need-smart-roads, last
accessed April 16, 2018.
142. Solar Roadways. (2016). “Solar Roadways.” (website). Solar Roadways, Sandpoint, ID.
Available online: http://solarroadways.com/, last accessed April 16, 2018.
143. GovTech. (2015). “Missouri Announces Nation's First Smart Roadway.” FutureStructure,
GovTech, e.REPUBLIC, Folsom, CA. Available online:
http://www.govtech.com/fs/Missouri-Announces-Nations-First-Smart-Roadway.html, last
accessed April 16, 2018.
144. Integrated Roadways. (2016). “Smart Pavement by Integrated Roads.” (website). Available
online: http://integratedroadways.com/, last accessed April 16, 2018.
145. Burch, B. (2016). “Smart road startup Integrated Roadways launching IoT test lab with
MoDOT.” Startland, Kansas City, KS. Available online:

87
http://www.startlandnews.com/2016/12/smart-pavement-maker-integrated-roadways-
launching-iot-test-lab-modot/, last accessed April 16, 2018.
146. Forever Open Road. (2018). THE ADAPTABLE ROAD: A Roadmap for Research 2018
Update An Element Of The Forever Open Road Programme, Brussels, Belgium. Available
online: http://www.fehrl.org/ajax/DownloadHandlerFM.php/downloadFile?id=13045, last
accessed April 16, 2018.
147. Hautière, N. (2014). “What will the 5th generation Road (R5G) be like?” Science and
society, The French institute of science and technology for transport, development and
networks, Paris, France. Available online: http://www.ifsttar.fr/en/online-resources/science-
and-society/infrastructure/science-topics/what-will-the-5th-generation-road-r5g-be-like/, last
accessed April 16, 2018.
148. BASt. (2013). Roads in the 21st Century – Innovative Road Construction in Germany,
German Federal Highway Research Institute (BASt). Available online:
http://www.bast.de/EN/Publications/Media/S-roads-21st-
century.pdf?__blob=publicationFile&v=1, last accessed April 16, 2018.
149. Council of State Governments. (2016). State Laws on Autonomous Vehicles, Council of State
Governments, Transportation Policy. Available online:
http://knowledgecenter.csg.org/kc/system/files/CR_automomous.pdf, last accessed April 16,
2018.
150. Wilmot, C. and Greensword, M. (2016). Investigation into Legislative Action Needed to
Accommodate the Future Safe Operation of Autonomous Vehicles in the State of Louisiana,
Report No. 571, Louisiana Transportation Research Center, Baton Rouge, LA.
151. GAO. (2015). Intelligent Transportation Systems: Vehicle-to-Infrastructure Technologies
Expected to Offer Benefits, but Deployment Challenges Exist, Report No. GAO-15-775, U.S.
Government Accountability Office, Washington, DC. Available online:
http://www.gao.gov/assets/680/672548.pdf, last accessed April 16, 2018.
152. California DMV. (2015). One California proposal, Vol. 1, State of California Department of
Motor Vehicles, Sacramento, CA. Available online:
http://www.dot.ca.gov/research/operations/one_california/docs/DR1_OneCalifornia_Vol_I_P
art_I.pdf, last accessed April 16, 2018.
153. Caltrans. (2016). “Driverless Testing of Autonomous Vehicles.” (website) Sacramento, CA.
Available online: https://www.dmv.ca.gov/portal/dmv/detail/vr/autonomous/auto, last
accessed April 16, 2018.
154. MDOT. (2014). “MDOT partners with GM, Ford and the University of Michigan on
country's largest deployment of connected vehicle and highway technologies.” Michigan
Department of Transportation, Lansing, MI. Available online:
http://www.michigan.gov/mdot/0,4616,7-151-9620_11057-336809--,00.html, last accessed
April 16, 2018.

88
155. MDOT. (2017). “MDOT forms ‘Smart Belt Coalition’ to collaborate on connected/automated
vehicle initiatives.” Michigan Department of Transportation, Lansing, MI. Available online:
http://www.michigan.gov/mdot/0,4616,7-151--402603--,00.html, last accessed April 16,
2018.
156. Kockelman, K., Loftus-Otway, L., Stewart, D., Nichols, A., Wagner, W., Li, J., Boyles, S.,
Levin, M., and Liu, J. (2016). Best Practices Guidebook for Preparing Texas for Connected
and Automated Vehicles, TxDOT Project 0-6849, Texas Department of Transportation,
Austin, TX. Available online: http://library.ctr.utexas.edu/ctr-publications/0-6849-p1.pdf, last
accessed April 16, 2018.
157. Zmud, J., Tooley, M., Baker, T., and Wager, J. (2015). Paths of AV/CV Deployment:
Strategic Roadmap for State and Local Transportation Agencies, Texas A&M Transportation
Institute, College Station, TX. Available online:
https://static.tti.tamu.edu/tti.tamu.edu/documents/161504-1.pdf, last accessed April 16, 2018.
158. Kim, B., Pourrahmani, E., and Fagnant, D. (2017). Potential Benefits and Cost of Connected
And Automated Vehicles: A Texas Case Study. Presented at the Transportation Research
Board 96th Annual Meeting, Transportation Research Board, Washington, DC.
159. Gustafson, D.H. (2016). Connected and Automated Vehicle Program Plan, Virginia
Department of Transportation, Richmond, VA. Available online:
http://www.virginiadot.org/projects/resources/2016PlanningProgramming/6_VDOT's_Conne
cted_Vehicle_Program_Plan.pdf, last accessed April 16, 2018.
160. Bertini, R.L. and Wang, H. (2016). Connected Vehicle Application Roadmap for Oregon as
Part of Preparing a Possible Oregon Road Map for Connected Vehicle/Cooperative Systems
Deployment Scenarios, Report No. FHWA-OR-RD-16-12, Federal Highway Administration,
Washington, DC.
161. Carlson, P. and Poorsartep, M. (2017). Enhancing the Roadway Physical Infrastructure for
Advanced Vehicle Technologies: a case study in pavement markings for machine vision and
a roadmap toward a better understanding. Presented at the Transportation Research Board
96th Annual Meeting, Transportation Research Board, Washington, DC.
162. FHWA. (2017). “National Standards for Traffic Control Devices; the Manual on Uniform
Traffic Control Devices for Streets and Highways; Maintaining Pavement Marking
Retroreflectivity.” Federal Register, 82(2), GPO, Washington, DC. Available online:
https://www.regulations.gov/contentStreamer?documentId=FHWA-2009-0139-
0124&contentType=pdf, last accessed April 16, 2018.
163. National Academies of Sciences, Engineering, and Medicine. (2008). “Appendix A: How to
Write an Effective Research Statement.” Funding Sources for Transportation Research:
Competitive Programs, National Academies of Sciences, Engineering, and Medicine,
Washington, DC. Available online:
http://www.trb.org/ResearchFunding/AppendixAWritingaResearchStatement.aspx, last
accessed April 16, 2018.

89
164. Pape, D.B., Hadden, J.A., McMillan, N.J., Narendran, K., Everson, J.H., and Pomerleau,
D.A. (1999). Performance considerations for run-off-road countermeasure systems for cars
and trucks, Report No. 1999-01-0820, SAE Technical Paper, SAE International, Warrendale,
PA.
165. Kockelman, K., Avery, P., Bansal, P., Boyles, S.D., Bujanovic, P., Choudhary, T., Clements,
L., et al. (2016). Implications of Connected and Automated Vehicles on the Safety and
Operations of Roadway Networks: A Final Report, Report No. FHWA/TX-16/0-6849-1,
Texas Department of Transportation, Austin, TX. Available online:
http://library.ctr.utexas.edu/ctr-publications/0-6849-1.pdf, last accessed April 16, 2018.
166. AASHTO. (2017). A Policy on Geometric Design of Highways and Streets, Sixth Edition,
American Association of State Highway and Transportation Officials, Washington, DC.
167. Waggoner, J., Frey, B., Novosad, S., Johnson, S., Blue, V., Miller, D., and Bahler, D. (2016).
Connected Vehicle Pilot Deployment Program Phase 1, Concept of Operations (ConOps) –
Tampa (THEA), Report No. FHWA-JPO-16-311, Federal Highway Administration,
Washington, DC. Available online: https://ntl.bts.gov/lib/57000/57000/57032/FHWA-JPO-
16-311.pdf, last accessed April 16, 2018
168. Galgano, S., Talas, M., Benevelli, D., Rausch, R., Sim, S., Opie, K., Jensen, M., and Stanley,
C. (2016). Connected Vehicle Pilot Deployment Program Phase 1: Concept of Operations
(ConOps)—New York City, Report No. FHWA-JPO-16-299, Federal Highway
Administration, Washington, DC. Available online: https://rosap.ntl.bts.gov/view/dot/30881,
last accessed April 16, 2018.
169. Shladover, S. and Gettman, D. (2015). Connected/Automated Vehicle Research Roadmap for
AASHTO, Report No. NCHRP 20-24(98), Deliverable 2—Research Roadmap,
Transportation Research Board, Washington, DC. Available online:
http://onlinepubs.trb.org/onlinepubs/nchrp/docs/NCHRP20-
24(98)_RoadmapTopics_Final.pdf, last accessed April 16, 2018.
170. Bertini, R. Wang, H., Vogt, R., Wahid, M., Rios, E., and Carstens, K. (2016). Assessment of
Oregon Department of Transportation (ODOT) Connected Vehicle Position Through
Internal Survey, Task 1: Preparing a Possible Oregon Road Map for Connected
Vehicle/Cooperative Systems Deployment Scenarios, Task 1 Report No. SPR 764, Oregon
Department of Transportation, Salem, OR. Available online:
http://digital.osl.state.or.us/islandora/object/osl%3A8054/datastream/OBJ/download/Assessm
ent_of_Oregon_Department_of_Transportation__ODOT__connected_vehicle_position_thro
ugh_internal_survey.pdf, last accessed April 16, 2018.
171. Center for Transportation Studies. (2016). “Connected Vehicle Pooled Fund Study –
Research.” (website). Center for Transportation Studies, University of Virginia,
Charlottesville, VA. Available online: http://www.cts.virginia.edu/cvpfs_research/, last
accessed April 16, 2018.

90
172. National Academies of Sciences, Engineering, and Medicine. (in press). Connected Road
Classification System (CRCS) Development, Project No. NCHRP 20-24(112), NCHRP,
Washington, DC.
173. Johnson, C. (2017). Readiness of the road network for connected and autonomous vehicles.
RAC Foundation, London, England, UK. Available online:
http://www.racfoundation.org/assets/rac_foundation/content/downloadables/CAS_Readiness
_of_the_road_network_April_2017.pdf, last accessed April 16, 2018.
174. NCHRP. (in press). Road Markings for Machine Vision, Project No. NCHRP 20-102(06),
NCHRP, Washington, DC.
175. EuroRAP. (2011). Roads that Cars Can Read: A Consultation Paper. European Road
Assessment Programme and Euro NCAP, Basingstoke, England, UK. Available online:
http://www.eurorap.org/wp-content/uploads/2015/04/20110629-Roads-That-Cars-Can-Read-
June-2011.pdf, last accessed April 16, 2018.
176. Huggins, R., Topp, R., Gray, L., Piper, L., Jensen, B., Isaac, L., Polley, S., Benjamin, S., and
Somers, A. (2017). Assessment of key road operator actions to support automated vehicles,
Research No. AP-R543-17, Section 4.4.4, Austroads, Sydney, New South Wales, Australia.
177. NCHRP. (in press). Data Management Strategies for CV/AV Applications for Operations,
Project No. NCHRP 20-102(14), NCHRP, Washington, DC.
178. SAE. (2016). Dedicated Short Range Communications (DSRC) Message Set Dictionary.
Standard J2735_2016, SAE International, Warrendale, PA. Available online:
http://standards.sae.org/j2735_201603/, last accessed April 16, 2018.
179. NCHRP. (2017). Understanding the Impacts of the Physical Highway Infrastructure Caused
by the Increased Prevalence of Advanced Vehicle Technologies, Report No. NCHRP 20-
102(15), Transportation Research Board, Washington, DC. Available online:
http://apps.trb.org/cmsfeed/TRBNetProjectDisplay.asp?ProjectID=4377, last accessed April
16, 2018.
180. USDOT. (2017). Connected vehicle applications: road weather management, Report No.
FHWA-17-JPO-429, Federal Highway Administration, Washington, DC. Available online:
https://www.its.dot.gov/factsheets/pdf/JPO-17-429_RW_management.pdf, last accessed
April 16, 2018.
181. USDOT. (2017). Utilizing vehicle data for road weather management (Pikalert 5.0), Report
No. FHWA-JPO-17-513, Federal Highway Administration, Washington, DC. Available
online: https://rosap.ntl.bts.gov/view/dot/34176, last accessed April 16, 2018.
182. Farrell, J.A., Todd, M., and Barth, M. (2016). Best Practices for Surveying and Mapping
Roadways and Intersections for Connected Vehicle Applications. Connected Vehicle Pooled
Fund Study, Center for Transportation Studies, University of Virginia, Blacksburg, VA.
Available online: http://escholarship.org/uc/item/4f88m75k.pdf, last accessed April 16, 2018.


HRDS-10/09-18(WEB)E