*hrvflhqwl¿f auroral spectral estimation with open …
TRANSCRIPT
GID3, 753–823, 2013
Wide band color CCDspectral estimation
B. J. Jackel et al.
Title Page
Abstract Introduction
Conclusions References
Tables Figures
J I
J I
Back Close
Full Screen / Esc
Printer-friendly Version
Interactive Discussion
Discussion
Paper
|D
iscussionP
aper|
Discussion
Paper
|D
iscussionP
aper|
Geosci. Instrum. Method. Data Syst. Discuss., 3, 753–823, 2013www.geosci-instrum-method-data-syst-discuss.net/3/753/2013/doi:10.5194/gid-3-753-2013© Author(s) 2013. CC Attribution 3.0 License.
GeoscientificInstrumentation
Methods andData Systems
Open A
ccess
Discussions
This discussion paper is/has been under review for the journal Geoscientific Instrumentation,Methods and Data Systems (GI). Please refer to the corresponding final paper in GI if available.
Auroral spectral estimation withwide-band color mosaic CCDsB. J. Jackel1, C. Unick1, M. T. Syrjäsuo2, N. Partamies3, J. A. Wild4,E. E. Woodfield5, I. McWhirter6, E. Kendall7, and E. Spanswick1
1Physics and Astronomy Department, University of Calgary, Calgary, Canada2School of Electrical Engineering, Aalto University, Aalto, Finland3Finnish Meteorological Institute, Helsinki, Finland4Department of Physics, Lancaster University, Lancaster, UK5British Antarctic Survey, Cambridge, UK6Department of Physics and Astronomy, University College London, London, UK7SRI International, Menlo Park, California, USA
Received: 3 November 2013 – Accepted: 25 November 2013 – Published: 23 December 2013
Correspondence to: B. J. Jackel ([email protected])
Published by Copernicus Publications on behalf of the European Geosciences Union.
753
GID3, 753–823, 2013
Wide band color CCDspectral estimation
B. J. Jackel et al.
Title Page
Abstract Introduction
Conclusions References
Tables Figures
J I
J I
Back Close
Full Screen / Esc
Printer-friendly Version
Interactive Discussion
Discussion
Paper
|D
iscussionP
aper|
Discussion
Paper
|D
iscussionP
aper|
Abstract
Color mosaic CCDs use a matrix of different wide-band micro-filters in order to pro-duce images with several (often three) color channels. These devices are increasinglyemployed in auroral studies to provide time sequences of two dimensional luminositymaps, but the color information is typically only used for qualitative analysis. In this5
study we use Backus–Gilbert linear inversion techniques to obtain quantitative mea-sures of effective spectral resolution for multi-channel color mosaic CCDs. These tech-niques also allow us to explore the possibility of further improvements by modifying orcombining multiple detectors. We consider two spectrally calibrated commercial colorCCDs (Sony ICX285AQ and ICX429AKL) in order to determine effective wavelength10
resolution of each device individually, together, and with additional filters. From theseresults we develop methods to enhance the utility of existing data sets, and proposeways to improve the next generation of low-cost color auroral imaging systems.
1 Introduction
Visible aurora is produced when energetic charges from outer space collisionally excite15
atmospheric atoms and molecules. These charges tend to move along magnetic fieldlines connecting the upper atmosphere to more distant regions of the magnetosphereor solar wind. Consequently, observing the spatial distribution and temporal variationof aurora can provide important information about geospace topology and dynamics.
Additional details about source population energy distributions may be obtained if20
optical observations are spectroscopically resolved. Emitted photon wavelengths canhave a complicated dependence on atmospheric composition and density, but certaincombinations of emissions may be used to make useful inferences about the precipi-tation energy (Rees and Luckey, 1974; Strickland et al., 1989). A list of the most com-monly studied auroral emissions is included in Table 1, and will be referred to through-25
out this study.
754
GID3, 753–823, 2013
Wide band color CCDspectral estimation
B. J. Jackel et al.
Title Page
Abstract Introduction
Conclusions References
Tables Figures
J I
J I
Back Close
Full Screen / Esc
Printer-friendly Version
Interactive Discussion
Discussion
Paper
|D
iscussionP
aper|
Discussion
Paper
|D
iscussionP
aper|
An example synthetic auroral spectrum is shown in Fig. 1. This was produced bysimulating the effects of a monoenergetic 1 keV electron beam incident on a realisticatmospheric model (Strickland et al., 1999). The results are highly dependent on inci-dent energy, with higher energies penetrating to lower altitudes and exciting differentatmospheric constituents than at higher altitudes. Real precipitation distributions are5
often quasi-Maxwellian, but the characteristic and total energies can vary considerablyas a function of time and location. In Sect. 2.3 we show one example of drastic varia-tions in broad-band auroral intensity over 1 h; similar changes can occur on time-scalesof a few seconds or less.
In addition to the possibility of rapid changes in auroral spectral features, there are of-10
ten also significant “background” contributions such as stars or cloud-scattered moon-light. The background spectrum is typically more of a continuum, so that useful esti-mates can be obtained from measurements adjacent to auroral emission lines. Errorsin background subtraction can be a major concern when attempting spectroscopy withfaint auroral emissions.15
The disparate requirements of spatially resolved rapid low-light spectroscopy overa wide field of view cannot be achieved with any single instrument. Many auroral ob-servatories use several different devices with complementary capabilities to acquiremultiple data streams which may be combined to quantify auroral structure as a func-tion of space, time, and wavelength.20
One widely used class of auroral instruments is referred to as wide-field or all-skyimagers (ASIs). These devices use “fish-eye” optics to simultaneously observe most orall of the visible sky. Early versions used photographic plates or film to record images;modern systems use digital array detectors such as charge-coupled devices (CCDs).These detectors typically have a very broad spectral response which includes the en-25
tire range of visible wavelengths and may extend well into the infra-red. The resulting“white-light” images include contributions from a wide range of photon wavelengths andare useful for rapid observations or detection of faint aurora.
755
GID3, 753–823, 2013
Wide band color CCDspectral estimation
B. J. Jackel et al.
Title Page
Abstract Introduction
Conclusions References
Tables Figures
J I
J I
Back Close
Full Screen / Esc
Printer-friendly Version
Interactive Discussion
Discussion
Paper
|D
iscussionP
aper|
Discussion
Paper
|D
iscussionP
aper|
ASIs can be used for quantitative spectroscopy by adding a narrow-band (i.e. 1–2 nm) interference filter to isolate specific emission features. This drastically reducestotal photon flux reaching the detector, requiring the use of expensive image intensifieror electron multiplier technology to achieve acceptable levels of signal-to-noise (SNR)even with longer integration times. A “filter-wheel” (typically with 4–8 filters) can be5
used to cycle between different passbands in order to observe multiple auroral emis-sions and appropriate background channels. However, a sequence of long-durationexposures through multiple filters inevitably results in a lack of simultaneity that can behighly problematic when observing aurora that varies rapidly in time. One partial work-around involves the use of two or more identical cameras which can measure different10
emissions at the same time (Steele and Cogger, 1996; Dahlgren et al., 2008). Thisapproach requires careful calibration to quantify any differences in camera response,but the primary disadvantage is the doubling in cost of an already expensive system.
Consumer-grade color cameras have become ubiquitous in recent years. Most ofthese devices use CCDs with a wide-band micro-filter mosaic overlay. Each individual15
image pixel receives light from a different portion of the optical spectrum (e.g. red,green, or blue); results from neighboring pixels with different filters are interpolated toestimate color (e.g. red, green, and blue) at each pixel location. This process involvessimultaneous exposure of all pixels, so temporal offsets between color channels is nota problem. Filter rejection will reduce the response relative to a comparable white-light20
system, but count rates are still high enough that expensive amplification technologyis not essential. While early versions of this class of detectors were clearly inferior toscientific grade CCDs, recent products provide high quantum efficiency, low noise, andgood uniformity.
Color mosaic all-sky imaging systems are increasingly widely used for auroral ob-25
servations (e.g. Toyomasu et al., 2008). However, most results are typically only usedin a qualitative fashion as summary data products or for public outreach purposes. Itis undoubtedly useful to have visually appealing images that faithfully reflect the ap-
756
GID3, 753–823, 2013
Wide band color CCDspectral estimation
B. J. Jackel et al.
Title Page
Abstract Introduction
Conclusions References
Tables Figures
J I
J I
Back Close
Full Screen / Esc
Printer-friendly Version
Interactive Discussion
Discussion
Paper
|D
iscussionP
aper|
Discussion
Paper
|D
iscussionP
aper|
pearance of aurora as seen by the human eye. It would be beneficial if wide-band colorimage data could also be used more quantitatively for scientific applications.
To the best of our knowledge, the auroral science literature on this topic is quitelimited. Partamies et al. (2007) presented a comparison of wide-band color mosaic im-ager and narrow-band photometer observations, Sigernes et al. (2008, 2009) provide5
absolute spectral calibration of several different DSLR cameras, and Partamies et al.(2012) apply tomography to color mosaic images.
More generally, RGB cameras have been used in combination with multiple colorfilters to estimate daylight and florescent spectra (Nieves et al., 2005, 2007). However,these studies have focused on spectra that are dominated by broad features and it is10
not clear how their techniques would perform for multiple discrete features such as aretypically found in the aurora. More importantly, they do not consider issues regardingnon-simultaneous multi-channel measurements of time varying sources.
Low cost auroral imaging
Photographic plates and film were the sole method of recording auroral luminosity for15
more than a century of observations. The introduction of electronic image sensors,such as CCDs, was a revolutionary development that greatly facilitated data acquisitionand analysis. However, early CCDs were extremely expensive. Prices for cutting-edge“scientific-grade” devices remained very high for several decades, and even today itis easy to pay many thousands of dollars for a single high quality CCD. Equally ex-20
pensive cooling and electronics are required to achieve maximum performance of thecostly CCD in a camera. Such an expensive camera naturally deserves the purchaseof the best possible all-sky optics, which are inevitably accompanied by custom ordersfor several large-aperture narrow-band interference filters. As a result, the total costof a complete state-of-the art auroral imaging system can easily be on the order of25
100 000 USD.While the performance of high end CCDs continues to improve, it is important to
recognize that low-cost mass-produced devices are now at a level which would have757
GID3, 753–823, 2013
Wide band color CCDspectral estimation
B. J. Jackel et al.
Title Page
Abstract Introduction
Conclusions References
Tables Figures
J I
J I
Back Close
Full Screen / Esc
Printer-friendly Version
Interactive Discussion
Discussion
Paper
|D
iscussionP
aper|
Discussion
Paper
|D
iscussionP
aper|
been called “scientific-grade” only a few years ago. The proliferation of cameras inconsumer electronics means that $100 will purchase a high-quantum efficiency low-noise mega-pixel sensor, and prices are falling fast. While very capable, a cheaperCCD only merits similarly inexpensive cooling, electronics, and optics. Consequently,a few thousand dollars is currently sufficient to produce an extremely useful all-sky5
auroral imaging system.Significantly lower costs could be reached in return for modest reductions in perfor-
mance, but at this level ancillary expenses are often more important. Auroral observa-tions usually involve extended operation in polar regions and costly travel to field siteswith limited infrastructure. It is not generally worth allocating the engineering resources10
to save a thousand dollars on instrumentation if operating expenses are several timesgreater.
To the best of our knowledge, the first large-scale deployment of low-cost auroralimaging systems was as part of the THEMIS ground-based observatory (Donovanet al., 2006; Harris et al., 2008). This project operates “white-light” all-sky imagers at15
20 remote field sites in northern Canada and Alaska. Cameras were purchased froma vendor (Starlight-Xpress) who primarily serves the amateur astronomy community.Their camera systems combine thermoelectric cooling and image readout electronicsin a convenient package with USB interface. Software drivers are provided for Windowsand Linux operating systems. THEMIS GBO systems use single-channel Starlight-20
Xpress MX716 (now re-branded as “Lodestar”) cameras with additional all-sky optics.The Sony ICX249AL CCD in these systems has a very broad spectral response span-ning the entire visible range of wavelengths, so an additional “hot mirror” filter wasadded to reject infrared. For nearly a decade, these systems have gathered 1 s expo-sures at a 3 s cadence whenever solar zenith angle is greater than 102◦. They have25
proven to be extremely reliable, collecting over 350 million images stored in a lossless(gzipped PGM) format.
Many different Starlight-Xpress systems share the same common software interface,so experience with low-cost white-light cameras for THEMIS could be easily extended
758
GID3, 753–823, 2013
Wide band color CCDspectral estimation
B. J. Jackel et al.
Title Page
Abstract Introduction
Conclusions References
Tables Figures
J I
J I
Back Close
Full Screen / Esc
Printer-friendly Version
Interactive Discussion
Discussion
Paper
|D
iscussionP
aper|
Discussion
Paper
|D
iscussionP
aper|
to color mosaic systems. In this study we focus on two different color cameras providedby Starlight-Xpress: the MX7-C (now “Lodestar-C”) using the ICX429AKL CCD witha 4-channel color matrix discussed in Sect. 2.2 and the SXV-H9C with a higher spatialresolution ICX285AQ 3-channel Bayer matrix color CCDs discussed in Sect. 2.1. Ofcourse, there are many other available camera models and manufacturers, but these5
two provide excellent examples of available color mosaics. They have also been usedextensively for applications in auroral science at many locations by several differentprojects. A summary of locations is given in Table 2, with further details provided belowto emphasize the “organic” project evolution facilitated by low-cost devices. Instrumentacquisition by groups with different sources of funding may proceed incrementally and10
deployment plans can be primarily constrained by the availability of existing facilities atremote field sites. The resulting intermittent time-lines for color auroral imaging givenbelow are in striking contrast to the centralized planning and execution involved ina project like THEMIS.
Researchers at the University of Calgary first developed a prototype system combin-15
ing THEMIS all-sky optics with an MX7C color camera in 2002. The resulting “Rainbow”systems were field tested in Canada during 2003 and at Svalbard for an optical cam-paign in early 2004 (Partamies et al., 2007). Rainbow system deployment at 8 locationsin northern Canada began in 2006 as part of the NORSTAR multi-spectral imaging(MSI) initiative. Sites at Fort Smith (FSMI), Fort Simpson (FSIM), Gillam (GILL), Pinawa20
(PINA), and Rabbit Lake (RABB) were operated by the Canadian Space Agency (CSA)Canadian Geospace Monitor (CGSM) program; Resolute Bay (RESU) was funded bythe US NSF, Saskatoon (SASK) by the University of Saskatchewan, and Yellowknife(YKNF) by CSA. The Canadian network of Rainbow ASIs operates with 5 s exposuresat a 6 s cadence in order to maximize sensitivity while facilitating comparison with the25
3 s THEMIS cadence as illustrated in Sect. 2.3. More than 35 million high resolution“fast” mode (see Sect. 2.2) images are stored using losslessly compressed PGM files.
Four more Rainbow systems have deployed as part of the Miracle project (Pulkkinenet al., 1998). The first instrument was installed at Nyrölä (NYR) in 2005, followed by two
759

GID3, 753–823, 2013
Wide band color CCDspectral estimation
B. J. Jackel et al.
Title Page
Abstract Introduction
Conclusions References
Tables Figures
J I
J I
Back Close
Full Screen / Esc
Printer-friendly Version
Interactive Discussion
Discussion
Paper
|D
iscussionP
aper|
Discussion
Paper
|D
iscussionP
aper|
in 1997 at Kevo (KEV) and Muonio (MUO), then another system at Helsinki (HEL) in2009. From September 2007 the cameras at KEV and MUO were operated in a modethat provided alternating even and odd frames (see Fig. A2b in Appendix A). After 2009all four systems operated in “fast” mode with images stored in lossy JPEG format.
Another three Rainbow systems have at been operated by Lancaster University5
at Ðykkvibær in south-eastern Iceland (PYKK), at Mánarbakki on the Tjörnes penin-sula in north-eastern Iceland (TJRN), and at Húsareyn near Tórshavn in the FaroeIsles (HSRN). The PYKK imager is co-located with the CUTLASS Iceland SuperDARNradar operated by the University if Leicester and shares accommodation and infras-tructure with the radar hardware, with the imager mounted in an optical dome installed10
in the roof of the radar control building. Both the TJRN and HSRN rainbow imagersare installed in enclosures adapted from industrial modular equipment housings. Eachweatherproof and thermally-insulated enclosure is mounted on a concrete foundationand is fitted with a bespoke roof that includes a 300 mm diameter optical dome withpower and internet routed from nearby buildings. The control computer, power sup-15
plies and a dome-heating fan are housed inside the enclosure.Finally, SRI operates a single Rainbow at Sondrestrom (SND).The H9C camera was first used in Canada for the Dense Array Imaging System
(DAISY, see Partamies et al., 2008). This project consisted of three imagers, eachwith different optics, all providing fields of view smaller than the typical all-sky config-20
uration. The large number of pixels provided by the ICX285AQ was essential for fullyresolving small spatial scales during several campaigns. More recently, a single H9Csystem has been continuously deployed in Yellowknife (YKNF) as part of the CanadianSpace Agency (CSA) AuroraMax project which provides publicly available real-timehigh-resolution all-sky color auroral images.25
The University College London (UCL) Atmospheric Physics Laboratory also operatetheir own set of color all-sky camera systems for auroral studies; these were devel-oped completely independently of the Rainbow project. Active systems include twoH9Cs at Sodankylä (SOD) and Longyearbyen, Svalbard (KHO) and an MX7C at Es-
760
GID3, 753–823, 2013
Wide band color CCDspectral estimation
B. J. Jackel et al.
Title Page
Abstract Introduction
Conclusions References
Tables Figures
J I
J I
Back Close
Full Screen / Esc
Printer-friendly Version
Interactive Discussion
Discussion
Paper
|D
iscussionP
aper|
Discussion
Paper
|D
iscussionP
aper|
range, Kiruna (KEOPS). These are used primarily as support for the UCL Fabry-PerotInterferometers located all three stations and the Scanning Doppler Imager (SCANDI)at KHO. These instruments measure winds and temperatures by observing Dopplershifts and emission line profiles of the 630 nm and 557.7 nm oxygen emissions. It is es-sential to have accurate information with regard to cloud cover and auroral structure, so5
the emphasis has been on qualitative rather than quantitative camera data. For exam-ple, contrast stretching is used to enhance auroral features and also the unsharp masktechnique used to emphasise auroral structure and increase the visibility of stars. Thecameras are operated continuously during the hours of darkness, controlled by an al-manac program. Longer exposures than those used for the Rainbow project (typically10
20 s) are used, with an interval of 2 min between images. Compared to the imagesfrom the previous generation of monochrome all-sky cameras used for this purpose,the improvement in the ability to differentiate between cloud and aurora is dramatic.
2 Color cameras
In this study we examine the spectral response of two very different color mosaic CCDs15
that have been used for auroral imaging. Some basic parameters of these devicesare listed in Table 3. Both detectors use an “interline” architecture in which a singleshift moves the contents of each pixel into adjacent masked readout columns. Thistechnique effectively eliminates image smearing during readout and is sometimes re-ferred to as an electronic shutter. Both cameras provide 16 bit data, although effective20
dynamic range is slightly reduced by a device dependent constant DC offset that isusually on the order of 1000 data numbers.
Both types of cameras have recently been calibrated in a darkroom facility at theUniversity of Calgary. The primary light source was an incandescent tungsten filamentlamp driven by a constant current source. Lamp light was passed through an Acton25
Research model SP-500i single grating monochromator with a 1200 linemm−1 gratingand 50 micron slit spacings with a 0.65 nm wavelength resolution. A Newport model
761
GID3, 753–823, 2013
Wide band color CCDspectral estimation
B. J. Jackel et al.
Title Page
Abstract Introduction
Conclusions References
Tables Figures
J I
J I
Back Close
Full Screen / Esc
Printer-friendly Version
Interactive Discussion
Discussion
Paper
|D
iscussionP
aper|
Discussion
Paper
|D
iscussionP
aper|
918D-SL-OD1 photodiode with absolute spectral response traceable to NIST standardswas used to correct for intensity variations in wavelength due to the source blackbodyand monochromator grating characteristics.
Two pinholes of approximately 3 mm diameter separated by about 60 cm were usedto create a collimated beam. This was directly incident on the CCD (with the lens5
removed from the camera). Image exposures of 400 ms were acquired for wavelengthsranging from 300 nm to 1000 nm at 1 nm intervals. Some variation in actual exposuretime was expected due to the use of a non “hard” real-time operating system; actualjitter was typically less than 1 ms with rare exceptions on the order of ±10 ms (∼ 2%).Immediately following the CCD measurements, the Newport photodiode was inserted10
in front of the camera and the wavelength scan was repeated.An example portion of a single calibration frame is shown in Fig. 2. A very small-scale
grid pattern is produced by the Bayer matrix response to monochromatic light. Thecoarse grid is a moiré artifact that depends on the figure display size and resolution.Isolated circular patterns correspond to dust on the CCD window.15
Background (“dark”) levels were estimated from image corners. The observed countstatistics were consistent with a shifted Gaussian, which was modelled with a constantbias term added to a Poisson distribution. Results for each device were constant overmultiple calibration scans. The ICX285AQ CCD used for this study had a DC bias ofroughly 3560 counts and a Poisson mean of 30 counts for a 400 ms exposure. The20
ICX429AKL unit had a bias of roughly 1565 counts and a Poisson mean of 25 countsin 400 ms. Our experience with other similar systems is that each device has a uniqueinvariant bias, usually in the range of 1000–4000 data numbers.
Pixels were grouped according to color channel by indexing on a 2×2 sub grid(see Figs. 4 and 6). Any saturated values were excluded from subsequent analysis.25
Total counts were summed in each channel, background corrected, and normalizedusing the calibration photodiode measurement. Figure 3 shows an example of the un-normalized spectral response for each color channel of the Sony ICX285AQ CCD (seenext section) along with the corresponding reference diode power level.
762
GID3, 753–823, 2013
Wide band color CCDspectral estimation
B. J. Jackel et al.
Title Page
Abstract Introduction
Conclusions References
Tables Figures
J I
J I
Back Close
Full Screen / Esc
Printer-friendly Version
Interactive Discussion
Discussion
Paper
|D
iscussionP
aper|
Discussion
Paper
|D
iscussionP
aper|
Very similar calibration configurations were used for all of the results presented here,but there is no guarantee of absolute consistency. This means that, in contrast toSigernes et al. (2008, 2009), our results cannot be used for absolute sensitivity (i.e.counts/Rayleigh) comparisons between different cameras. They do, however, providesimultaneous self-consistent results for all color channels on each CCD.5
2.1 Sony ICX285HQ
The SXV-H9C camera uses a Sony ICX285AQ CCD with 3-color Red/Green/Blue(RGB) microfilters arranged in a standard Bayer matrix pattern (shown in Fig. 4). Threecolor values at each pixel location can be easily determined by interpolation from neigh-boring pixels (e.g. Gunturk et al., 2005), with Bayer de-mosaicing support built into10
many image processing software packages. The density of green pixels is twice that ofred and blue; this configuration can be advantageous for observing aurora which areoften dominated in visible wavelengths by 557.7 nm atomic oxygen “green-line” emis-sions. Filter passbands (Fig. 4) are similar to the three different types of color sensitivecones in the human eye. One notable difference is the significant sensitivity in the near15
infra-red (NIR) with essentially identical response in all three channels for wavelengthsgreater than 800 nm. The standard read-out mode uses a progressive scan, so a singleframe can contain all active pixels.
2.2 Sony ICX429AKL
The MX7C camera has a Sony ICX429AKL CCD with 4-color20
Cyan/Yellow/Green/Magenta (CYGM) channels. The microfilter mosaic layout onthe CCD is shown in Fig. 5, but typical operating modes produce a slightly different re-sult. Complications arise from the fact that the ICX429AKL readout mode is interlaced(Appendix A), so that all pixels cannot be read out simultaneously. Figure 6a showsthe native (“raw”) color mosaic along with the output for frames containing only even25
763

GID3, 753–823, 2013
Wide band color CCDspectral estimation
B. J. Jackel et al.
Title Page
Abstract Introduction
Conclusions References
Tables Figures
J I
J I
Back Close
Full Screen / Esc
Printer-friendly Version
Interactive Discussion
Discussion
Paper
|D
iscussionP
aper|
Discussion
Paper
|D
iscussionP
aper|
and odd lines (Fig. 6c and d). Response curves in Fig. 5 were produced by combiningresults from even and odd frames.
Separate exposures and readout mean that the even and odd frames will not corre-spond to exactly the same time interval. Differences on the order of a few seconds maybe unimportant for a stable laboratory calibration, but can be a real concern under field5
conditions when observing highly dynamic aurora.Fortunately, the MX7C camera software does support a “fast” readout mode which
sums over adjacent rows (i.e. 1+2, 3+4, . . . ) and returns the result as a single half-height frame with an effective color mosaic as shown in Fig. 6b. Data acquired in this“fast” mode was used to produce the response curves shown in Fig. 7.10
2.2.1 Linear independence
ICX429AKL “fast” mode data are produced by binning adjacent rows of “raw” pixels.This transformation can be expressed as a matrix multiplication which converts fromraw (i.e. cyan and green) to binned (i.e. cyan+green) color channels.
0 1 1 01 0 0 10 1 0 11 0 1 0
CyYeGrMg
=
Gr+YeMg+CyMg+YeGr+Cy
(1)15
This equation naturally suggests the possibility of reversing the process in order to ob-tain the four underlying raw channels from four fast channels. Unfortunately, the 4×4transformation matrix is singular (zero determinant) and cannot be inverted, meaningthat the row binning process is irreversible. One goal of this paper is to better under-20
stand how this loss of information impacts spectral resolution.
764
GID3, 753–823, 2013
Wide band color CCDspectral estimation
B. J. Jackel et al.
Title Page
Abstract Introduction
Conclusions References
Tables Figures
J I
J I
Back Close
Full Screen / Esc
Printer-friendly Version
Interactive Discussion
Discussion
Paper
|D
iscussionP
aper|
Discussion
Paper
|D
iscussionP
aper|
2.3 THEMIS/Rainbow sensitivity comparison
The THEMIS all-sky imager network uses Starlight Xpress model MX7 (now“Lodestar”) cameras with Sony ICX429AL CCD detectors. These are monochrome de-vices that are identical to the ICX429AKL CCD, except without the microfilter mosaic.Consequently, every pixel in the ICX429AL has an identical very broad (“white light”)5
spectral response. This is ideal for maximizing the photon count rate under low-lightconditions, but data can not be used to distinguish between different emission wave-lengths. Like the MX7C, the MX7 is also an interline system with driver software thatcan either read alternate rows or the sum of row pairs (“fast” mode). The THEMIS op-tics project an all-sky image onto a 512×512 pixel sub-region of the CCD that is read10
in fast mode with column pairs subsequently binned to produce a 256×256 array ofapproximately square super-pixels. Images are acquired at a 3 s cadence with 1 s ex-posures; this 33 % duty cycle reflects a combination of constraints in the camera, serialcommunications (USB 1.1), and a relatively low-power system computer.
The MX7C based “Rainbow” systems currently operated by the Calgary and Lan-15
caster groups use all-sky optics that are essentially identical to those in the THEMISsystem, and both systems use CCDs with identical dimensions and pixel density. Rain-bow systems operate at a slower 6 s cadence with longer 5 s exposures designed tocompensate for anticipated losses due to the color mosaic micro-filters. Stored im-age frames consist of 512×256 rectangular superpixels with 4 “fast” color channels20
as described previously. During post-processing these multi-channel images can bebinned by column pairs to produce 256×256 superpixels with the same geometry asTHEMIS. Each superpixel is composed of 4 device level (“raw”) pixels with the samechannel combination in every case: Cy+Gr+Ye+Mg. The result is a monochromeimage with a very wide spectral response that is an average of the four mosaic color25
passbands.A monochrome Rainbow image is convenient for certain kinds of analysis that do not
require spectral information (e.g. star tracking). It can also be used for a comparison of
765
GID3, 753–823, 2013
Wide band color CCDspectral estimation
B. J. Jackel et al.
Title Page
Abstract Introduction
Conclusions References
Tables Figures
J I
J I
Back Close
Full Screen / Esc
Printer-friendly Version
Interactive Discussion
Discussion
Paper
|D
iscussionP
aper|
Discussion
Paper
|D
iscussionP
aper|
the relative sensitivity of the two systems. For several years (2009–2013) a Rainbowsystem has been operating near Fort Smith in northern Canada at a field site that isonly a few kilometres from a THEMIS system. Both cameras are looking towards localzenith, but are oriented along slightly different azimuths. A pixel-by-pixel comparisonwould require precise determination of both camera orientations followed by careful5
mapping into a common coordinate system.For this study we shall consider only frame average count rates, which are a robust
measure of whole system response that are not sensitive to orientation errors or mi-nor inhomogeneities in CCD response. Count rates from the two different cameras areusually very highly correlated, as illustrated by an hour of auroral data shown in Fig. 8.10
The relatively high (87 %) Rainbow to THEMIS count rate ratio is presumably due to 3of 4 color channels having transmission maxima near the brightest auroral green-line(557.7 nm) emissions. Although the Rainbow systems do have a lower cadence thanTHEMIS (6 vs. 3 s) they have a much higher (250 %) effective duty cycle (5 vs. 1 s expo-sures). As currently operated, a Rainbow camera can produce white-light images with15
more than twice the number of counts from THEMIS over the same interval. This couldimprove the ability to detect faint structures, albeit at the cost of temporal resolution.
Color imagers can also provide information about auroral spectra that is not acces-sible to white-light cameras. For example, Rainbow to THEMIS count rate ratios variedby approximately 10 % over the interval shown in Fig. 8 with the higher ratios tending to20
correspond to higher count rates. This is consistent with an increase in characteristicprecipitation energy causing a change in the relative intensity of different auroral emis-sions. A quantitative analysis is beyond the scope of this paper, and will be the focusof a subsequent study.
2.4 Infra-red rejection25
Dark-room results were obtained using the simplest possible configuration: light froma calibration source directly incident on the thermal glass window in front of each CCD.For field operations there are usually several additional optical elements. Most of these
766
GID3, 753–823, 2013
Wide band color CCDspectral estimation
B. J. Jackel et al.
Title Page
Abstract Introduction
Conclusions References
Tables Figures
J I
J I
Back Close
Full Screen / Esc
Printer-friendly Version
Interactive Discussion
Discussion
Paper
|D
iscussionP
aper|
Discussion
Paper
|D
iscussionP
aper|
are part of the “fish-eye” lens system required to image a hemispherical (“all-sky”) fieldof view and project it onto the CCD. While there can be significant losses due to reflec-tions between multiple glass surfaces, the overall transmission for these componentsshould be nearly uniform across the visible spectrum.
The THEMIS and Rainbow systems also have an additional filter (Fig. 9) to reject5
near infra-red (NIR) photons above 750 nm. This “hot mirror” was included to reducethe effects of chromatic aberration over a wide range of wavelengths. Limiting the in-put light to visible wavelengths was intended to reduce undesirable image blurring.One drawback of this particular filter is the substantial (50 %) attenuation at shorterwavelengths, which is unfortunate considering the importance of blue (e.g. 391.4 and10
427.8 nm) auroral emissions. It could also be argued that NIR auroral features area sufficiently important source of information to outweigh the deficits of slightly lesswell focused images. One of the original motivations for this study was a comparisonof THEMIS spectral response with and without the hot mirror, and the possibility ofdifferencing data from two different cameras to estimate the NIR contribution.15
Given that NIR blocking filters have been used in many of the systems considered inthis study, we will include their effect in most of the analysis that follows. This is doneusing modified CCD response functions produced by multiplying calibrated sensitivityfor each device (shown in Figs. 4, 5, and 7) by the hot mirror transmission curve inFig. 9. We did also repeat the analysis without NIR blocking and found some interesting20
differences that are explored further in Sect. 3.3.
3 Spectral estimation
An ideal color camera would generate images that are perceived by the human eye tobe indistinguishable from the source. Practically speaking, this usually means acquiringa rectangular array of Nx ×Ny pixels, each of which has a red/green/blue (RGB) triplet25
of color intensities. When properly displayed, viewing the image frame should producethe same retinal response as when observing the original scene. The field of color
767
GID3, 753–823, 2013
Wide band color CCDspectral estimation
B. J. Jackel et al.
Title Page
Abstract Introduction
Conclusions References
Tables Figures
J I
J I
Back Close
Full Screen / Esc
Printer-friendly Version
Interactive Discussion
Discussion
Paper
|D
iscussionP
aper|
Discussion
Paper
|D
iscussionP
aper|
studies is quite complex and requires an understanding of topics including basic optics,biology, and human perception. In this study we deliberately chose to work only withvery simple models of color. Our primary focus is the exploration of possibilities fordealing with color CCDs as multi-spectral detectors.
To start, consider an ideal linear detector with three different channels. The channel5
spectral passbands are chosen to exactly match the wavelength sensitivity of the threedifferent types of cones ck = [c1,c2,c3] ≈ [R,G,B] in the human eye. Measurementsfrom this detector mk = [m1,m2,m3] should be identical to the cone response. TheBayer matrix CCD in Sect. 2.1 is a good approximation to this ideal detector, with threemeasurement channels that correspond to the primary colors10
[m1,m2,m3] ≈ [c1,c2,c3] (2)
Differences between real and ideal detectors can be modelled by some kind of trans-formation to convert from measurements to true-color. In general, there can be morethan three measurement channels, and a different functional form may be needed for15
each color
ci = fi (m1,m2, . . . ,mj ) (3)
Many transformations can be usefully expressed as linear combinations of measure-ments mj from Nm measurement channels; multiplying by weighting coefficients di j to20
get Nc color channel estimates ci
ci =∑j
di j mj (4)
which can be written more compactly as a matrix multiplication
c = D m (5)25
For an ideal 3-channel Bayer RGB mosaic the weights D might be a 3×3 identity matrix,with a CYGM mosaic requiring a more complicated 3×4 matrix.
768
GID3, 753–823, 2013
Wide band color CCDspectral estimation
B. J. Jackel et al.
Title Page
Abstract Introduction
Conclusions References
Tables Figures
J I
J I
Back Close
Full Screen / Esc
Printer-friendly Version
Interactive Discussion
Discussion
Paper
|D
iscussionP
aper|
Discussion
Paper
|D
iscussionP
aper|
In auroral physics, color is really only important as a measure of spectral featurescorresponding to interesting atomic and molecular emissions. From this perspective,a more useful activity would be to somehow combine multi-channel observations inorder to estimate spectral intensity s(λ) at specific wavelengths of interest, i.e.
s(λ) =∑n
dn(λ) mn (6)5
We can not reasonably expect to recover high-resolution spectra from a small numberof wide-band observations. It is, however, useful to explore the merits of this approachto dealing with color mosaic CCD data.
In general, a spectrum s(λ) is observed using a linear device with Nm different mea-10
surement channels. Each channel may have a different spectral response given by“kernel” Ki (λ) = K (λi ,λ), where λi is some characteristic (i.e. peak or average) wave-length corresponding to each channel. The result will be Nm measurements m(λi ), eachwith some noise contribution n(λi ).
m(λi ) =∫K (λi ,λ
′)s(λ′)dλ′ +n(λi ) (7)15
In an ideal instrument the measurement kernels should be extremely narrow (i.e. Diracdelta functions) and the noise negligible (n ≈ 0), so the observations would be an ac-curate measure of the original source spectrum.
m(λi ) =∫δ(λi − λ′)s(λ′)dλ′ +n(λi ) ≈ s(λi ) (8)20
For wide-band color CCDs the kernels are definitely not delta functions and Poissonnoise is unavoidable.
Fortunately, this general class of problems arises in many different applications andhas been addressed in detail by numerous authors (e.g. Rodgers, 1976, 1990; Menke,25
1989; Aster et al., 2005; Tarantola, 2005). Methods for solving these problems are769
GID3, 753–823, 2013
Wide band color CCDspectral estimation
B. J. Jackel et al.
Title Page
Abstract Introduction
Conclusions References
Tables Figures
J I
J I
Back Close
Full Screen / Esc
Printer-friendly Version
Interactive Discussion
Discussion
Paper
|D
iscussionP
aper|
Discussion
Paper
|D
iscussionP
aper|
variously referred to as linear inversion or retrieval or estimation; the shared goal is toinfer useful results from a limited number of non-ideal observations in the presence ofnoise.
One effective procedure is to first discretize the integral in Eq. (7) and replace it witha finite sum5
m(λi ) ≈∑j
qj K (λi ,λj ) s(λj )∆λ+n(λi ) (9)
where qj are quadrature weights (i.e. trapezoidal rule, Simpson’s rule). This leads toa matrix representation
m = Ks+n (10)10
which is not solvable in general because K may not be a square matrix and thus cannotbe directly inverted. A solution can, in principle, be obtained by applying the pseudo-inverse[KTK
]−1KTm = Dm (11)15
= DKs+Dn
= As+e = s (12)
where rows of the matrix D in Eq. (11) are called “contribution functions” (also referredto as inverse response kernels) that indicate what combination of observations should20
be used to estimate the spectrum at a given wavelength.Rearranging terms shows that the recovered spectral estimate s consists of two
parts (Eq. 12). The first term is a synthetic measurement of the true spectrum asviewed through a set of “averaging” or “windowing” functions A(λi ,λ) constructed froma combination of the contribution functions and the measurement kernels. Ideally, the25
averaging functions A would be extremely narrow and A would be an identity matrix.770
GID3, 753–823, 2013
Wide band color CCDspectral estimation
B. J. Jackel et al.
Title Page
Abstract Introduction
Conclusions References
Tables Figures
J I
J I
Back Close
Full Screen / Esc
Printer-friendly Version
Interactive Discussion
Discussion
Paper
|D
iscussionP
aper|
Discussion
Paper
|D
iscussionP
aper|
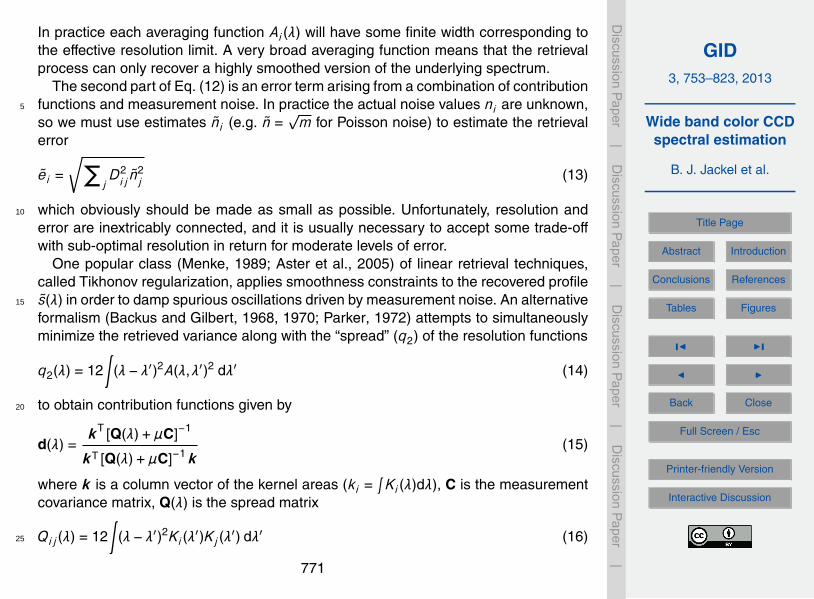
In practice each averaging function Ai (λ) will have some finite width corresponding tothe effective resolution limit. A very broad averaging function means that the retrievalprocess can only recover a highly smoothed version of the underlying spectrum.
The second part of Eq. (12) is an error term arising from a combination of contributionfunctions and measurement noise. In practice the actual noise values ni are unknown,5
so we must use estimates ni (e.g. n =√m for Poisson noise) to estimate the retrieval
error
ei =√∑
jD2i j n
2j (13)
which obviously should be made as small as possible. Unfortunately, resolution and10
error are inextricably connected, and it is usually necessary to accept some trade-offwith sub-optimal resolution in return for moderate levels of error.
One popular class (Menke, 1989; Aster et al., 2005) of linear retrieval techniques,called Tikhonov regularization, applies smoothness constraints to the recovered profiles(λ) in order to damp spurious oscillations driven by measurement noise. An alternative15
formalism (Backus and Gilbert, 1968, 1970; Parker, 1972) attempts to simultaneouslyminimize the retrieved variance along with the “spread” (q2) of the resolution functions
q2(λ) = 12∫
(λ− λ′)2A(λ,λ′)2 dλ′ (14)
to obtain contribution functions given by20
d(λ) =k
T [Q(λ)+µC]−1
kT [Q(λ)+µC]−1k(15)
where k is a column vector of the kernel areas (ki =∫Ki (λ)dλ), C is the measurement
covariance matrix, Q(λ) is the spread matrix
Qi j (λ) = 12∫
(λ− λ′)2Ki (λ′)Kj (λ
′) dλ′ (16)25
771
GID3, 753–823, 2013
Wide band color CCDspectral estimation
B. J. Jackel et al.
Title Page
Abstract Introduction
Conclusions References
Tables Figures
J I
J I
Back Close
Full Screen / Esc
Printer-friendly Version
Interactive Discussion
Discussion
Paper
|D
iscussionP
aper|
Discussion
Paper
|D
iscussionP
aper|
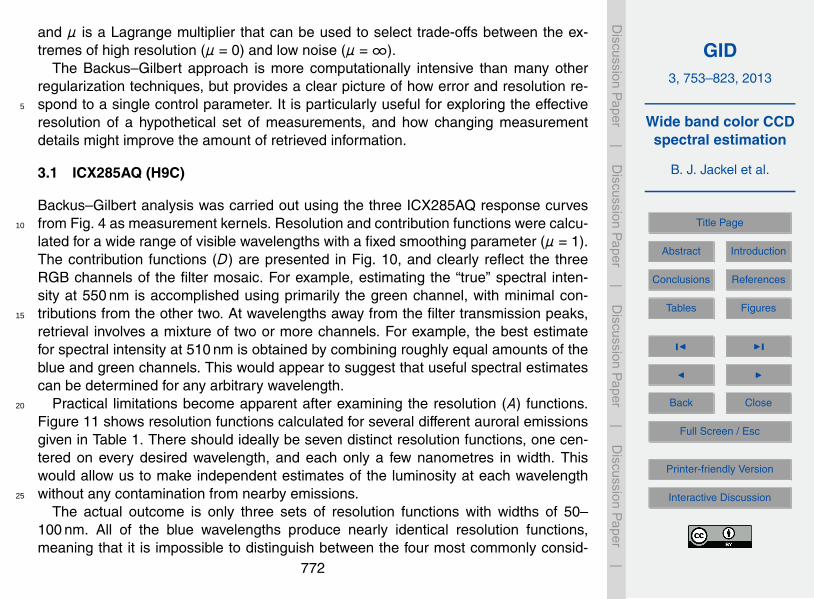
and µ is a Lagrange multiplier that can be used to select trade-offs between the ex-tremes of high resolution (µ = 0) and low noise (µ =∞).
The Backus–Gilbert approach is more computationally intensive than many otherregularization techniques, but provides a clear picture of how error and resolution re-spond to a single control parameter. It is particularly useful for exploring the effective5
resolution of a hypothetical set of measurements, and how changing measurementdetails might improve the amount of retrieved information.
3.1 ICX285AQ (H9C)
Backus–Gilbert analysis was carried out using the three ICX285AQ response curvesfrom Fig. 4 as measurement kernels. Resolution and contribution functions were calcu-10
lated for a wide range of visible wavelengths with a fixed smoothing parameter (µ = 1).The contribution functions (D) are presented in Fig. 10, and clearly reflect the threeRGB channels of the filter mosaic. For example, estimating the “true” spectral inten-sity at 550 nm is accomplished using primarily the green channel, with minimal con-tributions from the other two. At wavelengths away from the filter transmission peaks,15
retrieval involves a mixture of two or more channels. For example, the best estimatefor spectral intensity at 510 nm is obtained by combining roughly equal amounts of theblue and green channels. This would appear to suggest that useful spectral estimatescan be determined for any arbitrary wavelength.
Practical limitations become apparent after examining the resolution (A) functions.20
Figure 11 shows resolution functions calculated for several different auroral emissionsgiven in Table 1. There should ideally be seven distinct resolution functions, one cen-tered on every desired wavelength, and each only a few nanometres in width. Thiswould allow us to make independent estimates of the luminosity at each wavelengthwithout any contamination from nearby emissions.25
The actual outcome is only three sets of resolution functions with widths of 50–100 nm. All of the blue wavelengths produce nearly identical resolution functions,meaning that it is impossible to distinguish between the four most commonly consid-
772
GID3, 753–823, 2013
Wide band color CCDspectral estimation
B. J. Jackel et al.
Title Page
Abstract Introduction
Conclusions References
Tables Figures
J I
J I
Back Close
Full Screen / Esc
Printer-friendly Version
Interactive Discussion
Discussion
Paper
|D
iscussionP
aper|
Discussion
Paper
|D
iscussionP
aper|
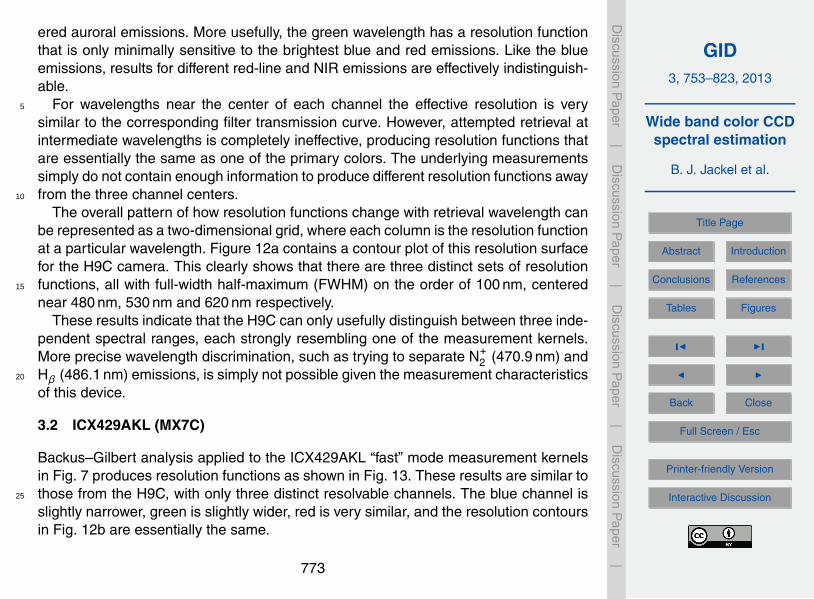
ered auroral emissions. More usefully, the green wavelength has a resolution functionthat is only minimally sensitive to the brightest blue and red emissions. Like the blueemissions, results for different red-line and NIR emissions are effectively indistinguish-able.
For wavelengths near the center of each channel the effective resolution is very5
similar to the corresponding filter transmission curve. However, attempted retrieval atintermediate wavelengths is completely ineffective, producing resolution functions thatare essentially the same as one of the primary colors. The underlying measurementssimply do not contain enough information to produce different resolution functions awayfrom the three channel centers.10
The overall pattern of how resolution functions change with retrieval wavelength canbe represented as a two-dimensional grid, where each column is the resolution functionat a particular wavelength. Figure 12a contains a contour plot of this resolution surfacefor the H9C camera. This clearly shows that there are three distinct sets of resolutionfunctions, all with full-width half-maximum (FWHM) on the order of 100 nm, centered15
near 480 nm, 530 nm and 620 nm respectively.These results indicate that the H9C can only usefully distinguish between three inde-
pendent spectral ranges, each strongly resembling one of the measurement kernels.More precise wavelength discrimination, such as trying to separate N+
2 (470.9 nm) andHβ (486.1 nm) emissions, is simply not possible given the measurement characteristics20
of this device.
3.2 ICX429AKL (MX7C)
Backus–Gilbert analysis applied to the ICX429AKL “fast” mode measurement kernelsin Fig. 7 produces resolution functions as shown in Fig. 13. These results are similar tothose from the H9C, with only three distinct resolvable channels. The blue channel is25
slightly narrower, green is slightly wider, red is very similar, and the resolution contoursin Fig. 12b are essentially the same.
773

GID3, 753–823, 2013
Wide band color CCDspectral estimation
B. J. Jackel et al.
Title Page
Abstract Introduction
Conclusions References
Tables Figures
J I
J I
Back Close
Full Screen / Esc
Printer-friendly Version
Interactive Discussion
Discussion
Paper
|D
iscussionP
aper|
Discussion
Paper
|D
iscussionP
aper|
Analysis of the “raw” mode kernels from Fig. 5 produces resolution functions asshown in Fig. 14. While there are still only three distinct resolution functions, theblue channel is significantly narrower than for the “fast” mode. Resolution contoursin Fig. 12c are also substantially improved. Access to data from all four native colorchannels on the ICX429AKL is clearly beneficial, albeit only incrementally better than5
“fast” mode or 3-channel ICX285AQ observations.As mentioned previously, Backus–Gilbert analysis involves a tunable parameter µ
which controls the trade-off between resolution and error. For cases with many differentmeasurement kernels this can be used to make significant changes in the retrievalresults. For the case of a 3- or 4-channel color camera the µ parameter has very little10
effect, as it is simply not possible to construct very different combinations of kernels.A typical example is given in Fig. 15 showing spread vs. noise for a wide range of µ.The trade-off curve has the characteristic shape, but both spread and noise vary onlyover an extremely small range. This is true even for much smaller or larger values of µ.Consequently, in this study we restrict our analysis to a nominal value of µ = 1.15
3.3 Infra-red rejection
As mentioned in Sect. 2.4, many auroral imagers are operated with a “hot mirror” to re-ject infra-red wavelengths. Consequently, most analysis in this study has been carriedout assuming the presence of such a filter.
For completeness we have also studied the effects of including the entire 300–20
1000 nm wavelength range covered by our calibration. These results are shown inFig. 16 and exhibit significant differences from those obtained using only the visiblespectrum. The reason for this is that Backus–Gilbert analysis attempts to minimizewindow function amplitude by combining different measurement kernels. However, asshown previously, all CCD channels have very similar response curves above 750 nm.25
The result for a H9C system are clearly sub-optimal, with all cases containing signif-icant NIR contributions. MX7C fast mode results are similarly degraded. Interestingly,
774
GID3, 753–823, 2013
Wide band color CCDspectral estimation
B. J. Jackel et al.
Title Page
Abstract Introduction
Conclusions References
Tables Figures
J I
J I
Back Close
Full Screen / Esc
Printer-friendly Version
Interactive Discussion
Discussion
Paper
|D
iscussionP
aper|
Discussion
Paper
|D
iscussionP
aper|
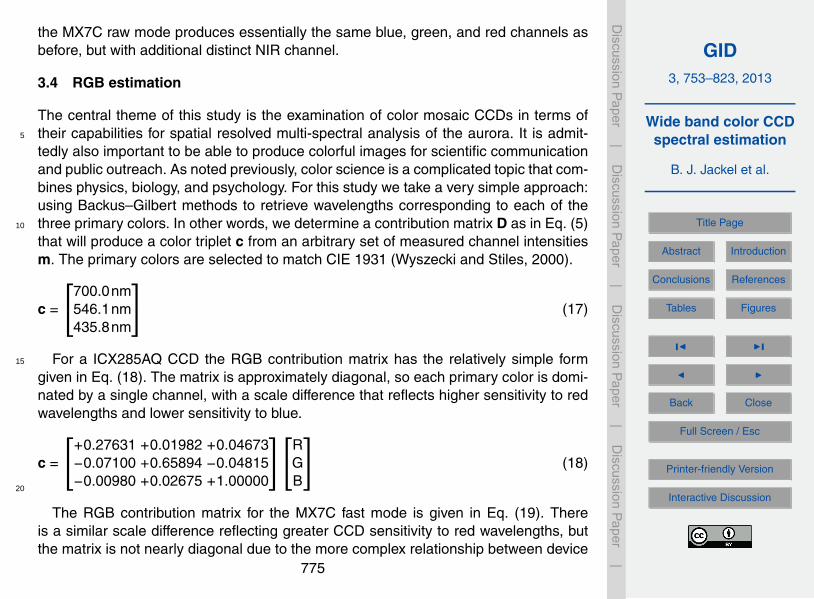
the MX7C raw mode produces essentially the same blue, green, and red channels asbefore, but with additional distinct NIR channel.
3.4 RGB estimation
The central theme of this study is the examination of color mosaic CCDs in terms oftheir capabilities for spatial resolved multi-spectral analysis of the aurora. It is admit-5
tedly also important to be able to produce colorful images for scientific communicationand public outreach. As noted previously, color science is a complicated topic that com-bines physics, biology, and psychology. For this study we take a very simple approach:using Backus–Gilbert methods to retrieve wavelengths corresponding to each of thethree primary colors. In other words, we determine a contribution matrix D as in Eq. (5)10
that will produce a color triplet c from an arbitrary set of measured channel intensitiesm. The primary colors are selected to match CIE 1931 (Wyszecki and Stiles, 2000).
c =
700.0nm546.1nm435.8nm
(17)
For a ICX285AQ CCD the RGB contribution matrix has the relatively simple form15
given in Eq. (18). The matrix is approximately diagonal, so each primary color is domi-nated by a single channel, with a scale difference that reflects higher sensitivity to redwavelengths and lower sensitivity to blue.
c =
+0.27631 +0.01982 +0.04673−0.07100 +0.65894 −0.04815−0.00980 +0.02675 +1.00000
RGB
(18)
20
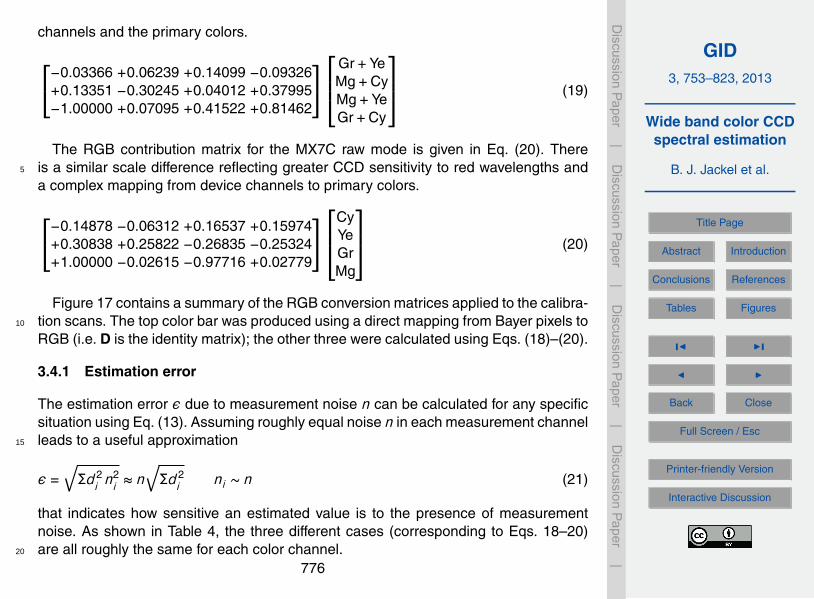
The RGB contribution matrix for the MX7C fast mode is given in Eq. (19). Thereis a similar scale difference reflecting greater CCD sensitivity to red wavelengths, butthe matrix is not nearly diagonal due to the more complex relationship between device
775
GID3, 753–823, 2013
Wide band color CCDspectral estimation
B. J. Jackel et al.
Title Page
Abstract Introduction
Conclusions References
Tables Figures
J I
J I
Back Close
Full Screen / Esc
Printer-friendly Version
Interactive Discussion
Discussion
Paper
|D
iscussionP
aper|
Discussion
Paper
|D
iscussionP
aper|
channels and the primary colors.
−0.03366 +0.06239 +0.14099 −0.09326+0.13351 −0.30245 +0.04012 +0.37995−1.00000 +0.07095 +0.41522 +0.81462
Gr+YeMg+CyMg+YeGr+Cy
(19)
The RGB contribution matrix for the MX7C raw mode is given in Eq. (20). Thereis a similar scale difference reflecting greater CCD sensitivity to red wavelengths and5
a complex mapping from device channels to primary colors.
−0.14878 −0.06312 +0.16537 +0.15974+0.30838 +0.25822 −0.26835 −0.25324+1.00000 −0.02615 −0.97716 +0.02779
CyYeGrMg
(20)
Figure 17 contains a summary of the RGB conversion matrices applied to the calibra-tion scans. The top color bar was produced using a direct mapping from Bayer pixels to10
RGB (i.e. D is the identity matrix); the other three were calculated using Eqs. (18)–(20).
3.4.1 Estimation error
The estimation error ε due to measurement noise n can be calculated for any specificsituation using Eq. (13). Assuming roughly equal noise n in each measurement channelleads to a useful approximation15
ε =√Σd2
i n2i ≈ n
√Σd2
i ni ∼ n (21)
that indicates how sensitive an estimated value is to the presence of measurementnoise. As shown in Table 4, the three different cases (corresponding to Eqs. 18–20)are all roughly the same for each color channel.20
776

GID3, 753–823, 2013
Wide band color CCDspectral estimation
B. J. Jackel et al.
Title Page
Abstract Introduction
Conclusions References
Tables Figures
J I
J I
Back Close
Full Screen / Esc
Printer-friendly Version
Interactive Discussion
Discussion
Paper
|D
iscussionP
aper|
Discussion
Paper
|D
iscussionP
aper|
3.5 Combinations and modifications
It would be very useful to have a single camera with more than 3 or 4 spectral chan-nels, such as might be produced by a large CCD with a 3×3 mosaic of 9 differentcolor channels. Until such a device becomes available it will be necessary to explorealternatives which are based on combinations and modifications of existing technology.5
An obvious first step would be to combine the two different CCDs considered inthis study. While both are effectively 3-channel devices, there are enough differencesbetween the filter response profiles to suggest that such a combination would be worth-while. This turns out to be the case, as can be seen from results of a H9C/MX7C (fastmode) Backus–Gilbert analysis shown in Fig. 18a. Using 7 different filters provides at10
least four distinct spectral bands, with resolution on the order of 50 nm.Further improvements could presumably be achieved with the addition of some differ-
ent color channels. However, virtually all available commercial CCDs use either RGBor CYGM color mosaics. One exception is the Sony ICX456 with a RGBE (merald)mosaic, but the standard output appears to have only 3 RGB channels. Even if direct15
access to the sensor were possible, it would only provide a single additional channel,and thus only marginally enhance spectral resolution.
There are also very significant challenges associated with merging images from twoor more different types of cameras. It may be difficult to synchronize exposure andreadout times. Precise calibration is required to correct for different sensitivities. Pixel20
size and density differences will complicate the process of spectral retrieval at commonlocations.
It would be easier to combine data from two or more identical cameras, althoughfor effective spectral retrieval it would of course be necessary to have different pass-bands for each system. An ideal configuration might be to simply shift one set of filter25
responses by some ∆λ chosen to maximize effective resolution. However, this is not anoption for wide-band color mosaic filters, unlike narrow-band interference filters whichcan be tilted to produce minor shifts to longer wavelengths.
777

GID3, 753–823, 2013
Wide band color CCDspectral estimation
B. J. Jackel et al.
Title Page
Abstract Introduction
Conclusions References
Tables Figures
J I
J I
Back Close
Full Screen / Esc
Printer-friendly Version
Interactive Discussion
Discussion
Paper
|D
iscussionP
aper|
Discussion
Paper
|D
iscussionP
aper|
The combination of a broad-band CCD and a narrow-band transmission filter(Fig. 19a) is commonly used in auroral studies to isolate specific emission lines. Thesemeasurements can be further improved by taking additional measurements at nearbywavelengths to estimate and remove “background” light levels. Equivalently, spectralintensity at a single wavelength could be determined by taking the difference between5
unfiltered broad-band signal levels and those obtained using a narrow-band rejection(“notch”) filter (Fig. 19b).
Measuring brightness at several different wavelengths with a single wide-band CCD(Fig. 19c) will require the use of multiple filters or a single tunable filter (López-Alvarezet al., 2008; Sigernes et al., 2012; Goenka et al., 2013). In either case, the mea-10
surement process will involve a sequence of observations that are intrinsically non-simultaneous. This may be a significant problem for sources, such as the aurora, thatare often highly dynamic over short time scales. The obvious solution would be to si-multaneously operate two or more systems with identical CCDs and different filters.Successful examples of this approach include the all-sky Polar Camera (“PoCa” Steele15
and Cogger, 1996) using two cameras each with a 5 channel filter wheel and the Au-roral Structure and Kinetics narrow field imager (“ASK” Dahlgren et al., 2008) usingthree cameras each with a single filter. However, truly simultaneous operation of multi-ple CCDs is complicated, produces large amounts of data, and becomes increasinglydifficult for a large number of different wavelengths.20
A perhaps less obvious approach takes advantage of the fact that a single com-plex filter can have a different effect on each channel of a color camera. For example,consider a single RGB CCD system which has an single filter with three narrow pass-bands at 427.8 nm, 557.7 nm, and 630.0 nm (Fig. 19d). This device can provide trulysimultaneous images at three different wavelengths, albeit with lower sensitivity and25
spatial resolution than a single channel system.Next, consider two identical RGB CCDs, one with a single multi-notch filter that re-
jects three different narrow pass-bands. One system measures signal plus backgroundin three wide-band channels, while the other system will effectively measure three wide-
778
GID3, 753–823, 2013
Wide band color CCDspectral estimation
B. J. Jackel et al.
Title Page
Abstract Introduction
Conclusions References
Tables Figures
J I
J I
Back Close
Full Screen / Esc
Printer-friendly Version
Interactive Discussion
Discussion
Paper
|D
iscussionP
aper|
Discussion
Paper
|D
iscussionP
aper|
band background channels with minimal signal contributions. The difference betweenimages from these two systems will thus contain three channel differences, each ofwhich can be used to infer the background corrected signal intensity at a different notchwavelength.
One related design strategy might be to select transmission or rejection wavelengths5
appropriate for a given camera response and auroral features of interest. This would re-quire custom multi-feature narrow-band filters, which can be relatively expensive com-pared to the cost of a single color camera. For this study we start by considering a stockmulti-notch filter (Semrock NF01-405/488/561/635) with a spectral transmission profileas shown in Fig. 20. A hypothetical two camera (both MX7C fast mode) system with10
one multi-notch filter was subjected to Backus–Gilbert analysis, with results as shownin Fig. 18b. As expected, very good spectral resolution (< 40 nm) can be obtained atthree notch wavelengths, and moderate resolution (> 50 nm) in several other ranges.For comparison, a similar analysis was carried out using a hypothetical combinationof two MX7C cameras and a different filter with multiple passbands (Semrock FF01-15
440/521/607/694). Results shown in Fig. 18c indicate a similar enhancement in reso-lution, albeit at a different set of wavelengths.
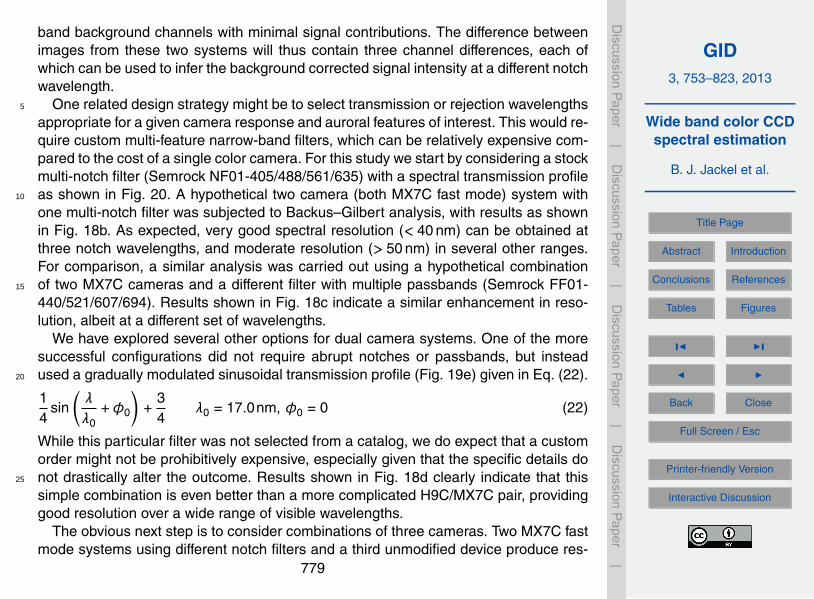
We have explored several other options for dual camera systems. One of the moresuccessful configurations did not require abrupt notches or passbands, but insteadused a gradually modulated sinusoidal transmission profile (Fig. 19e) given in Eq. (22).20
14
sin(λλ0
+φ0
)+
34
λ0 = 17.0nm, φ0 = 0 (22)
While this particular filter was not selected from a catalog, we do expect that a customorder might not be prohibitively expensive, especially given that the specific details donot drastically alter the outcome. Results shown in Fig. 18d clearly indicate that this25
simple combination is even better than a more complicated H9C/MX7C pair, providinggood resolution over a wide range of visible wavelengths.
The obvious next step is to consider combinations of three cameras. Two MX7C fastmode systems using different notch filters and a third unmodified device produce res-
779
GID3, 753–823, 2013
Wide band color CCDspectral estimation
B. J. Jackel et al.
Title Page
Abstract Introduction
Conclusions References
Tables Figures
J I
J I
Back Close
Full Screen / Esc
Printer-friendly Version
Interactive Discussion
Discussion
Paper
|D
iscussionP
aper|
Discussion
Paper
|D
iscussionP
aper|
olution functions as shown in Fig. 21a. This configuration is only slightly better thaneither notch filter separately, although it is possible that a custom configuration couldbe significantly better. For comparison we analyzed a 3 camera system with simplewavelength shifts of ∆λ = ±9 nm and obtained results shown in Fig. 21b. This purely hy-pothetical combination provides excellent resolution over a wide range of visible wave-5
lengths. Very good results (Fig. 21c) were also produced by a physically achievablecombination of two sinusoids with different periods and phase offsets (λ1 = 17.0 nm,φ1 = −π/4, λ2 = 21.0 nm, φ2 = +π/4). This provides spectral estimation with 50 nm orbetter resolution over most of the visible spectrum.
3.5.1 Quantitative comparison10
Contour plots of the window functions, such as those shown in Fig. 21, provide a use-ful picture of the spectral resolution for a hypothetical system of filters and detectors.However, they are less well suited for quantitative comparison of two or more differentsystems. For that, we consider certain key Backus–Gilbert parameters as a function ofwavelength. Two useful parameters have already been introduced: spectral resolution15
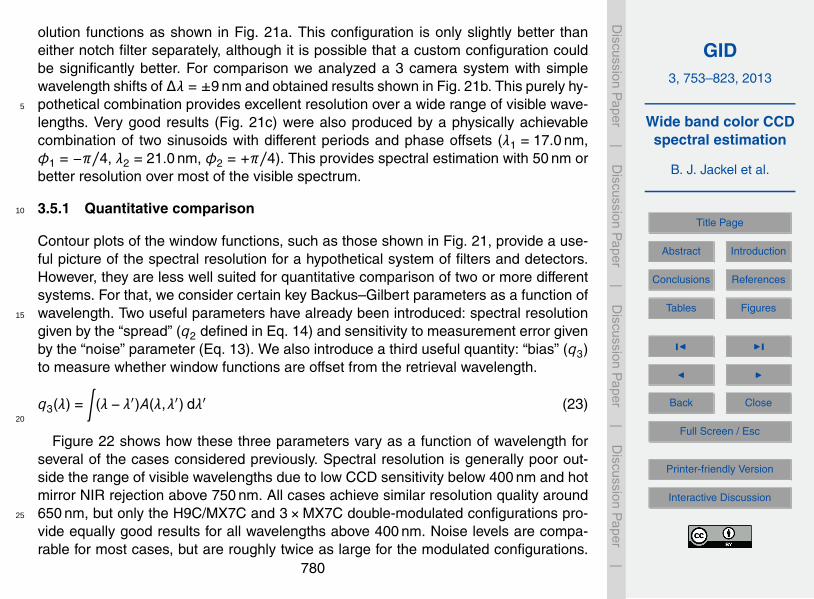
given by the “spread” (q2 defined in Eq. 14) and sensitivity to measurement error givenby the “noise” parameter (Eq. 13). We also introduce a third useful quantity: “bias” (q3)to measure whether window functions are offset from the retrieval wavelength.
q3(λ) =∫
(λ− λ′)A(λ,λ′) dλ′ (23)20
Figure 22 shows how these three parameters vary as a function of wavelength forseveral of the cases considered previously. Spectral resolution is generally poor out-side the range of visible wavelengths due to low CCD sensitivity below 400 nm and hotmirror NIR rejection above 750 nm. All cases achieve similar resolution quality around650 nm, but only the H9C/MX7C and 3×MX7C double-modulated configurations pro-25
vide equally good results for all wavelengths above 400 nm. Noise levels are compa-rable for most cases, but are roughly twice as large for the modulated configurations.
780
GID3, 753–823, 2013
Wide band color CCDspectral estimation
B. J. Jackel et al.
Title Page
Abstract Introduction
Conclusions References
Tables Figures
J I
J I
Back Close
Full Screen / Esc
Printer-friendly Version
Interactive Discussion
Discussion
Paper
|D
iscussionP
aper|
Discussion
Paper
|D
iscussionP
aper|
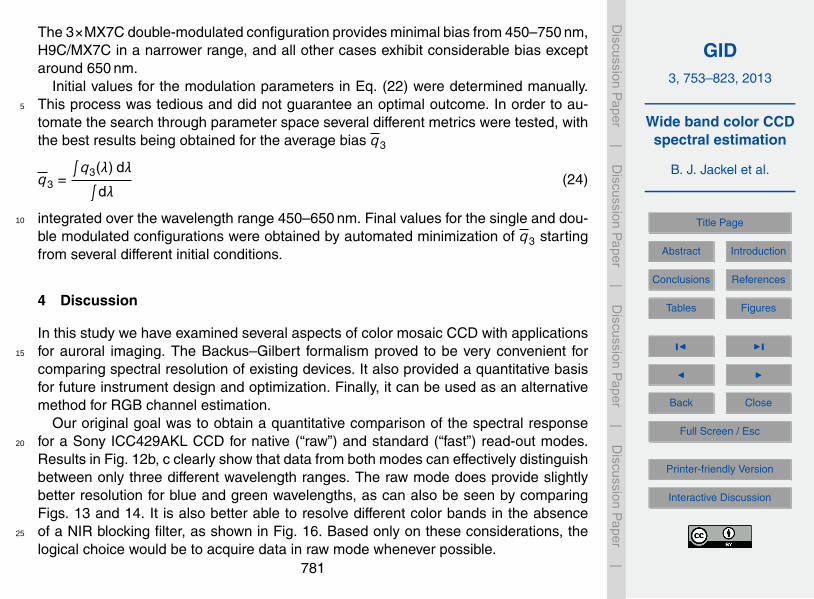
The 3×MX7C double-modulated configuration provides minimal bias from 450–750 nm,H9C/MX7C in a narrower range, and all other cases exhibit considerable bias exceptaround 650 nm.
Initial values for the modulation parameters in Eq. (22) were determined manually.This process was tedious and did not guarantee an optimal outcome. In order to au-5
tomate the search through parameter space several different metrics were tested, withthe best results being obtained for the average bias q3
q3 =
∫q3(λ) dλ∫
dλ(24)
integrated over the wavelength range 450–650 nm. Final values for the single and dou-10
ble modulated configurations were obtained by automated minimization of q3 startingfrom several different initial conditions.
4 Discussion
In this study we have examined several aspects of color mosaic CCD with applicationsfor auroral imaging. The Backus–Gilbert formalism proved to be very convenient for15
comparing spectral resolution of existing devices. It also provided a quantitative basisfor future instrument design and optimization. Finally, it can be used as an alternativemethod for RGB channel estimation.
Our original goal was to obtain a quantitative comparison of the spectral responsefor a Sony ICC429AKL CCD for native (“raw”) and standard (“fast”) read-out modes.20
Results in Fig. 12b, c clearly show that data from both modes can effectively distinguishbetween only three different wavelength ranges. The raw mode does provide slightlybetter resolution for blue and green wavelengths, as can also be seen by comparingFigs. 13 and 14. It is also better able to resolve different color bands in the absenceof a NIR blocking filter, as shown in Fig. 16. Based only on these considerations, the25
logical choice would be to acquire data in raw mode whenever possible.781
GID3, 753–823, 2013
Wide band color CCDspectral estimation
B. J. Jackel et al.
Title Page
Abstract Introduction
Conclusions References
Tables Figures
J I
J I
Back Close
Full Screen / Esc
Printer-friendly Version
Interactive Discussion
Discussion
Paper
|D
iscussionP
aper|
Discussion
Paper
|D
iscussionP
aper|
As a practical counter argument, the existing MC7C camera configuration does notappear to support direct readout of the full CCD. An fairly good approximation (“pseudo-progressive”, see Appendix A) may be possible, but provides color channels that arenot exactly simultaneous. The importance of this effect will depend on the ratio of expo-sure to read-out time, and could be an issue for rapid auroral variations. A pseudo-raw5
image frame data stream would also be double the size of fast mode frames, requir-ing increased operational and financial resources (e.g. storage, telemetry, processing).Still, exploring the feasibility of alternate read-out modes does seem to be worthwhile.
Results shown in Fig. 12a and b indicate that the H9C spectral resolution is com-parable to the MX7C fast-mode. Although the ICX285AQ and ICX429AKL CCDs use10
very different color filter passbands, Backus–Gilbert analysis shows that both deviceswill produce essentially the same information. This result is not surprising, as bothCCDs were presumably designed to achieve the same goal: distinguishing betweenthree primary colors.
While the effective spectral response of the two CCDs are very similar, they are not15
identical. This means that combining data from two different cameras could theoreti-cally provide better wavelength resolution than either device separately. Analysis showsthat an ideal MX7C/H9C combination (Fig. 18a) would be able to distinguish betweenat least 4 different spectral bands. This significant spectral improvement over a single3 channel system would also be accompanied by an increase in total count rate due to20
the effective doubling of optical and detector area.In practice, combining data from two different types of cameras is not a simple pro-
cess. Even starting with identical front-end all-sky lenses, different transfer optics wouldbe required to match the image field-of-view to CCDs of different size. Further differ-ences in pixel size, density, and color mosaic pattern must also be accounted for in or-25
der to merge results. Finally, the two cameras must either be identically oriented (whichcan be difficult to ensure over long durations at remote field sites) or images must becarefully corrected for alignment differences. These issues are not insurmountable, but
782
GID3, 753–823, 2013
Wide band color CCDspectral estimation
B. J. Jackel et al.
Title Page
Abstract Introduction
Conclusions References
Tables Figures
J I
J I
Back Close
Full Screen / Esc
Printer-friendly Version
Interactive Discussion
Discussion
Paper
|D
iscussionP
aper|
Discussion
Paper
|D
iscussionP
aper|
it is not obvious whether the necessary effort is justified by the enhanced spectral res-olution.
Merging data is simpler for cameras with identical CCDs and optics, although thiswill only produce enhanced spectral resolution if the devices have different responsefunctions. This can be achieved with simple color filters, as shown by Valero et al.5
(2007) who used sequential observations through different acrylic filters (e.g. magneta,orange, green, and blue) to improve the spectral resolution of an RGB camera system.Effective observations of rapidly varying processes, such as the aurora, would requiresimultaneous measurements using several cameras in order to achieve the same re-sults. In this study we have explored the effects of more complex (i.e. multi-notch) filters10
that modify each RGB channel independently. Our results indicate that these can pro-vide better spectral resolution than a single simple color filter, so that fewer cameraswould be required to achieve the desired resolution.
We have also shown that the spectral response of a system consisting of threecolor CCDs with two modulated filters could be significantly better than a double- or15
single-camera system. Since this approach is essentially a spectral decomposition us-ing quasi-orthogonal functions, it is tempting to expect that arbitrarily good spectralresolution could be obtained with a sufficiently large number of cameras with differentfilters. In practice, high-order “spectral synthesis” would be very sensitive to measure-ment noise, and critically dependent on precise determination of the different mea-20
surement kernels. Multiple wide-band color mosaic camera systems will never be func-tionally equivalent to a single narrow-band device, but they can provide significantlymore information than can be obtained with a single color imager, which is in turn moreversatile than a white-light device.
The issues that must be considered for field operation of a multiple camera system25
can be usefully assigned to three different groups. The first set of requirements areessentially identical to those for a single imager i.e. heated building with observingdome, electrical power, and network link. The second set consists of issues that scalelinearly with number of cameras N i.e. two cameras will cost twice as much, occupy
783
GID3, 753–823, 2013
Wide band color CCDspectral estimation
B. J. Jackel et al.
Title Page
Abstract Introduction
Conclusions References
Tables Figures
J I
J I
Back Close
Full Screen / Esc
Printer-friendly Version
Interactive Discussion
Discussion
Paper
|D
iscussionP
aper|
Discussion
Paper
|D
iscussionP
aper|
twice the space under the dome, and produce double the volume of data compared toa single camera. The third set consists of issues unique to a spectral synthesis system,such as orientation, timing, and calibration. It is obviously important that all camerasshare a common field of view, but it is relatively easy to achieve this to within 1◦ byusing a single mounting frame, and more precise alignment can be produced in soft-5
ware using star frames. Millisecond timing accuracy is usually possible with availablecomputers and operating systems, so exposures on the order of one second can beconsidered to be effectively simultaneous for all but the most dynamic aurora. Calibra-tion is likely to be the most difficult issue, as synthesis depends critically on accurateknowledge of the measurement kernels.10
The relative response of different channels on a single CCD can easily be determinedwith a single wavelength scan, but absolute photometry is essential in order to combinedata from different instruments. This requires a more complex calibration procedurethan used in this study, but is certainly feasible for experienced personnel with a well-equipped dark-room (e.g. Sigernes et al., 2009). Ongoing monitoring of photometric15
stability could be carried out using stellar sources, and periodic tests carried out witha field calibration source. This level of effort is rarely justified for a single inexpensivecamera, but is not unusual for a high-end multi-channel narrow-band system, and couldeasily be applied to a spectral synthesis system.
The Backus–Gilbert formalism provides an extremely convenient way to analyze the20
general problem of spectral estimation from a limited set of noisy wide-band measure-ments. However, it may be useful to consider modifications or alternate (i.e. non-linear)approaches. This suggestion is motivated by the poor results we obtained when con-sidering the entire spectrum (i.e. no hot mirror). Both the H9C and MX7C-fast modewindow functions were highly distorted by the influence of similar NIR sensitivity across25
all channels. Of course, this behavior is an inevitable response of the analysis algorithmto partially non-orthogonal kernels, and reflects a fundamental lack of information rela-tive to the MX7C-raw mode. Still, it might be interesting to explore the effects of alteringthe definition of “spread” (Eq. 14) to reduce weighting for out-of-band contributions.
784
GID3, 753–823, 2013
Wide band color CCDspectral estimation
B. J. Jackel et al.
Title Page
Abstract Introduction
Conclusions References
Tables Figures
J I
J I
Back Close
Full Screen / Esc
Printer-friendly Version
Interactive Discussion
Discussion
Paper
|D
iscussionP
aper|
Discussion
Paper
|D
iscussionP
aper|
It may also be productive to define the problem more broadly, not just in terms ofcolor channel observations produced by spectral luminosity s(λ), but considering theunderlying cause: precipitating electrons and ions with a range of energies incident ona realistic atmosphere with parameters pk .
cj = F [s(λ)] = G[ne(v),ni(v); p1, . . . ,pk ] (25)5
It is of course unreasonable to expect that a few wide-band color channels will besufficient to invert G and precisely determine the plasma distribution functions n(v).However, a physically appropriate parametrization may result in a tractable problemthat could be used to retrieve valuable information about precipitation characteristics.10
In a follow-up study we intend to model wide-band response to monoenergetic pre-cipitation and explore the potential for quantitative inversion of color mosaic imagerdata.
5 Conclusions
Low-cost color mosaic imagers can effectively resolve 3 relatively wide-band channels15
that are well suited for auroral studies. A color imager has the capability to provide moreinformation than a single channel white-light system, albeit with reductions in sensitivityand resolution that are relatively minor given existing technology. Although spectralresolution is markedly inferior to cameras using narrow-band interference filters, a colormosaic system can provide truly simultaneous acquisition of multiple channels, which20
may be important for observing dynamic aurora. Consumer grade systems can beobtained with shorter lead times, require lower levels of funding, and are typically easierto operate. Multiple low-cost devices can also be operated at numerous locations tostudy spatial scales that are inaccessible to a single camera.
Combinations of inexpensive color imagers and structured multi-band filters may25
be used to achieve significantly improved spectral resolution. Practical application ofthis spectral synthesis approach will depend critically on the availability of appropriate
785
GID3, 753–823, 2013
Wide band color CCDspectral estimation
B. J. Jackel et al.
Title Page
Abstract Introduction
Conclusions References
Tables Figures
J I
J I
Back Close
Full Screen / Esc
Printer-friendly Version
Interactive Discussion
Discussion
Paper
|D
iscussionP
aper|
Discussion
Paper
|D
iscussionP
aper|
filters, and the accuracy of filter and CCD calibration. Further work is also necessaryto determine the scientific benefits of increased resolution.
Color imagers are increasingly widely used in auroral studies, with more than a dozensystems currently in operation. Although their application thus far has been primarilyqualitative, they have significant potential for quantitative spectral analysis. While they5
are unlikely to replace narrow band systems for auroral spectroscopy, color mosaiccameras have an important role to play in advancing our understanding of ionosphericand magnetospheric processes.
Appendix A
Interline interlaced CCD10
The Sony ICX429AKL CCD has a standard rectangular array of photosensitive pixels,arranged as in Fig. A1. An additional matrix of wide-band filters provides the abilityto produce color images. This CCD is a interline-transfer device with opaque storageregisters located between pixel columns. During readout the pixel array contents areshifted very rapidly into the vertical registers, followed by the slower standard sequence15
of vertical and horizontal clocking. An interline system is sometimes referred to as hav-ing an “electronic shutter”, as it essentially eliminates image smearing during readout.
The ICX429AKL uses an interlaced readout, meaning that an interline shift can beapplied to even or odd rows separately. Either case produces an image frame that hashalf the vertical resolution of the native (“raw”) CCD. The full resolution can be acquired20
by reading the even and odd frames successively, but the two frames will correspondto different time intervals. An alternative “fast” mode readout applies an interline shift toboth the even and odd rows, but vertical pairs of pixels are combined in a single verticalregister, so colors are mixed and vertical resolution is irreversibly halved. In return thismode provides a simultaneous exposure of all image pixels that is not susceptible to25
time variations in brightness or spectral content.
786

GID3, 753–823, 2013
Wide band color CCDspectral estimation
B. J. Jackel et al.
Title Page
Abstract Introduction
Conclusions References
Tables Figures
J I
J I
Back Close
Full Screen / Esc
Printer-friendly Version
Interactive Discussion
Discussion
Paper
|D
iscussionP
aper|
Discussion
Paper
|D
iscussionP
aper|
It is useful to compare the different readout options in quantitative terms. One ob-vious metric is duty cycle: the maximum fraction of time that can be spent acquiringphotons, with higher duty cycle allowing higher sensitivity. For time varying sources wealso care about simultaneity: the amount of overlap between even and odd frames.
The “fast” mode (Fig. A2a) exposes both even and odd rows simultaneously for5
an interval T , combining and reading them out over a time t. Effective duty cycle ofη = T/(T +t) could approach 100 % for T � t. Sensitivity results presented in this studywere obtained using the non-overlapping sequence shown in Fig. A2b with a maxi-mum duty cycle η = T/(2T + t) less than 50 %. Low duty cycle and complete lack ofsimultaneity are not issues for stable calibration, but can be significant concerns for10
auroral observations. The timing sequence in Fig. A2c provides a maximal duty cy-cle η = T/(T + t) but with an overlap β = (T − t)/2T of less than 50 %. The best-case“pseudo-progressive” exposure sequence in Fig. A2d maximises duty cycle and over-lap β = (T − t)/T .
The nearly optimal timing sequence in Fig. A2d would produce nearly simultaneous15
even and odd frames that are shifted by the relatively short readout time t. Using theelectronic shutter capability it may be possible to (1) start exposing the entire CCD,(2) wait for an interval t then clear and resume exposing the odd frame, (3) finishexposing the even frame and read it out, (4) finish exposing the odd frame and read itout. This timing sequence would require precise timing control to ensure that even and20
odd frames were consistently exposed for equal amounts of time.
Appendix B
Sony ICX429AKL YUV/RGB
The color processing method outlined in the ICX429AKL CCD data sheet (Sony, 2003)uses data from the “fast” readout mode to construct a YUV (luma/chroma) signal. The25
data sheet does not indicate the specific conversion process from YUV to RGB, so for
787

GID3, 753–823, 2013
Wide band color CCDspectral estimation
B. J. Jackel et al.
Title Page
Abstract Introduction
Conclusions References
Tables Figures
J I
J I
Back Close
Full Screen / Esc
Printer-friendly Version
Interactive Discussion
Discussion
Paper
|D
iscussionP
aper|
Discussion
Paper
|D
iscussionP
aper|
simplicity we will use definitions from (International Telecommunication Union, 2011,BT601) Sect. 2.5
Y ≡ +0.299R+0.587G+0.114B [0.0, 1.0] (B1a)
U ≡ B− Y = −0.299R−0.587G+0.886B [∓0.886] (B1b)
V ≡ R − Y = +0.701R−0.587G−0.114B [∓0.701] (B1c)5
where by convention RGB values are scaled to be in the range 0 to 1, producing YUVvalues between the ranges shown in Eq. (B1). The corresponding inverse transforma-tion from YUV to RGB is given by
R = +1.0Y +0.0U +1.0V [0.0, 1.0] (B2a)10
G = +1.0Y −0.194U −0.509V [0.0, 1.0] (B2b)
B = +1.0Y +1.0U +0.0V [0.0, 1.0] (B2c)
In general it is necessary to consider gamma corrected quantities (R′, G′, B′, Y′), butfor this particular case we simplify matters by using γ = 1.15
At this point it is convenient to introduce “starred” (e.g. Y ∗) notation to representquantities that are in the pixel count range [0,Nmax]. Summing horizontally adjacentpixels from ICX429AKL fast mode data will provide estimates of the brightness (lumi-nance) Y ∗
Y ∗ = (Gr+Cy)∗ + (Mg+Ye)∗ ∼ 2B∗ +3G∗ +2R∗ (B3)20
while subtracting horizontally adjacent pixels will provide estimates of the color differ-ence (chrominance) channels U ∗ and V ∗
U ∗ = (Mg+Cy)∗ − (Gr+Ye)∗ ∼ 2B∗ −G∗ (B4)
V ∗ = (Mg+Ye)∗ − (Gr+Cy)∗ ∼ 2R∗ −G∗ (B5)25
788
GID3, 753–823, 2013
Wide band color CCDspectral estimation
B. J. Jackel et al.
Title Page
Abstract Introduction
Conclusions References
Tables Figures
J I
J I
Back Close
Full Screen / Esc
Printer-friendly Version
Interactive Discussion
Discussion
Paper
|D
iscussionP
aper|
Discussion
Paper
|D
iscussionP
aper|
with different equations applied to the even and odd rows. A 2×2 pixel block of fastmode data will be sufficient to determine both U ∗ and V ∗, along with two independentluminance estimates Y ∗
1 and Y ∗2 .
Y1Y2UV
∗
=
12
12 0 0
0 0 12
12
+1 −1 0 00 0 +1 −1
Gr+YeMg+CyMg+YeGr+Cy
∗
(B6)
5
De-mosaicing considerations are neglected in this study, so we assume equality ofthe luminance estimates
Y ∗ =12
(Y ∗1 + Y ∗
2 ) ≈ Y ∗1 ≈ Y ∗
2 (B7)
which can be conveniently expressed in matrix notation10 YUV
∗
=
12
12 0 0
0 0 1 00 0 0 1
Y1Y2UV
∗
(B8)
Using fast-mode response curves from Fig. 7 produces YUV spectral calibration resultsshown in Fig. A3a. These can be used to rescale pixel count-based Y ∗U ∗V ∗ values ontothe normalized ranges for YUV given in Eq. (B1)15 YUV
=
s1 0 00 s2 00 0 s3
=
Y ∗
U ∗
V ∗
(B9)
with empirically determined scaling factors of Fig. A3
(s1,s2,s3) ≈ 1Nmax
(1
1.3,
0.8860.45
,0.7010.45
)(B10)
20
789
GID3, 753–823, 2013
Wide band color CCDspectral estimation
B. J. Jackel et al.
Title Page
Abstract Introduction
Conclusions References
Tables Figures
J I
J I
Back Close
Full Screen / Esc
Printer-friendly Version
Interactive Discussion
Discussion
Paper
|D
iscussionP
aper|
Discussion
Paper
|D
iscussionP
aper|
to get a direct mapping from fast-mode pixel counts to R∗G∗B∗ (scaled from 0 to Nmax)as shown in Fig. A3b.
RGB
∗
=
+0.1923 +0.1923 +1.7501 −1.3655−0.1897 +0.5743 −0.6006 +0.9852+2.1612 −1.7766 +0.1923 +0.1923
Gr+YeMg+CyMg+YeGr+Cy
∗
(B11)
Acknowledgements. Operational support for the Canadian Rainbow network was provided5
by the Canadian Space Agency. Linux kernel camera driver software was written by DavidSchmenk. AURIC auroral spectra were provided by Scott Evans at Computational Physics In-corporated.
References
Aster, R. C., Borchers, B., and Thurber, C. H.: Parameter Estimation and Inverse Problems,10
Elsevier, Burlington, MA, USA, 2005. 769, 771Backus, G. and Gilbert, F.: The resolving power of gross Earth data, Geophys. J. Roy. Astr. S.,
16, 169–205, doi:10.1111/j.1365-246X.1968.tb00216.x, 1968. 771Backus, G. and Gilbert, F.: Uniqueness in the inversion of inaccurate gross Earth data, Philos.
T. R. Soc. S. A, 266, 123–192, 1970. 77115
Dahlgren, H., Ivchenko, N., Sullivan, J., Lanchester, B. S., Marklund, G., and Whiter, D.: Mor-phology and dynamics of aurora at fine scale: first results from the ASK instrument, Ann.Geophys., 26, 1041–1048, doi:10.5194/angeo-26-1041-2008, 2008. 756, 778
Donovan, E. F., Mende, S., Jackel, B. J., Frey, H., Syrjäsuo, M., Voronkov, I. O., Trondsen, T.,Peticolas, L., Angelopoulos, V., Harris, S., Greffen, M., and Connors, M.: The THEMIS all-20
sky imaging array – system design and initial results from the prototype imager, J. Atmos.Sol.-Terr. Phy., 68, 1472–1487, doi:10.1016/j.jastp.2005.03.027, 2006. 758
Goenka, C., Semeter, J., Noto, J., Dahlgren, H., Marshall, R., Baumgardner, J., Riccobono, J.,and Migliozzi, M.: Tunable filters for multispectral imaging of aeronomical features, Adv.Space Res., 52, 1366–1377, doi:10.1016/j.asr.2013.06.014, 2013. 77825
790
GID3, 753–823, 2013
Wide band color CCDspectral estimation
B. J. Jackel et al.
Title Page
Abstract Introduction
Conclusions References
Tables Figures
J I
J I
Back Close
Full Screen / Esc
Printer-friendly Version
Interactive Discussion
Discussion
Paper
|D
iscussionP
aper|
Discussion
Paper
|D
iscussionP
aper|
Gunturk, B., Glotzbach, J., Altunbasak, Y., Schafer, R., and Mersereau, R.: De-mosaicking: color filter array interpolation, IEEE Signal Proc. Mag., 22, 44–54,doi:10.1109/MSP.2005.1407714, 2005. 763
Harris, S. E., Mende, S. B., Angelopoulos, V., Rachelson, W., Donovan, E. F., Jackel, B. J.,Greffen, M., Russell, C. T., Pierce, D. R., Dearborn, D. J., Rowe, K. M., and Con-5
nors, M.: THEMIS ground based observatory system design, Space Sci. Rev., 141, 213–233,doi:10.1007/s11214-007-9294-z, 2008. 758
International Telecommunication Union: Studio encoding parameters of digital television forstandard 4 : 3 and wide-screen 16 : 9 aspect ratios (ITU-R B T.601-7), Tech. rep., Interna-tional Telecommunication Union, Geneva, 2011. 78810
López-Alvarez, M. A., Hernández-Andrés, J., and Romero, J.: Developing an optimumcomputer-designed multispectral system comprising a monochrome CCD camera anda liquid-crystal tunable filter, Appl. Optics, 47, 4381–4390, 2008. 778
Menke, W.: Geophysical Data Analysis: Discrete Inverse Theory, revised Edn., Academic Press,London, UK, 1989. 769, 77115
Nieves, J. L., Valero, E. M., Nascimento, S. M. C., Hernández-Andrés, J., and Romero, J.:Multispectral synthesis of daylight using a commercial digital CCD camera, Appl. Optics, 44,5696–5703, 2005. 757
Nieves, J. L., Valero, E. M., Hernández-Andrés, J., and Romero, J.: Recovering fluorescentspectra with an RGB digital camera and color filters using different matrix factorizations,20
Appl. Optics, 46, 4144–4154, 2007. 757Parker, R. L.: Inverse theory with grossly inadequate data, Geophys. J. Int., 29, 123–138,
doi:10.1111/j.1365-246X.1972.tb02203.x, 1972. 771Partamies, N., Syrjäsuo, M., and Donovan, E. F.: Using colour in auroral imaging, Can. J. Phys.,
85, 101–109, doi:10.1139/p06-090, 2007. 757, 75925
Partamies, N., Syrjäsuo, M., Donovan, E. F., and Knudsen, D. J.: Dense Array Imaging SYs-tem prototype observations of missing auroral scale sizes, Proceedings of the 33rd AnnualMeeting on Atmospheric Studies by Optical Methods, IRF Sci. Rep, 292, 95–101, 2008. 760
Partamies, N., Sangalli, L., Donovan, E., Connors, M., and Charrois, D.: Tomography-like ap-proach for analysing colour auroral images, Geophysica, 48, 81–90, 2012. 75730
Pulkkinen, T. I., Janhunen, P., Viljanen, A., Pellinen, R. J., Kauristie, K., Opgenoorth, H. J.,Wallman, S., Eglitis, P., Amm, O., Nielsen, E., and Thomas, C.: Observations of substorm
791

GID3, 753–823, 2013
Wide band color CCDspectral estimation
B. J. Jackel et al.
Title Page
Abstract Introduction
Conclusions References
Tables Figures
J I
J I
Back Close
Full Screen / Esc
Printer-friendly Version
Interactive Discussion
Discussion
Paper
|D
iscussionP
aper|
Discussion
Paper
|D
iscussionP
aper|
electrodynamics using the miracle network, in: Proceedings of the International Conferenceon Substorms – 4, 238, 111–114, 1998. 759
Rees, M. H. and Luckey, D.: Auroral electron energy derived from ratio of spec-troscopic emissions, 1. model computations, J. Geophys. Res., 79, 5181–5186,doi:10.1029/JA079i034p05181, 1974. 7545
Rodgers, C. D.: Retrieval of atmospheric temperature and composition from remote measure-ments of thermal radiation, Rev. Geophys., 14, 609–624, 1976. 769
Rodgers, C. D.: Characterization and error analysis of profiles retrieved from remote soundingmeasurements, J. Geophys. Res., 95, 5587–5595, doi:10.1029/JD095iD05p05587, 1990.76910
Sigernes, F., Holmes, J. M., Dyrland, M., Lorentzen, D. A., Svenøe, T., Heia, K., Aso, T.,Chernouss, S., and Deehr, C. S.: Sensitivity calibration of digital colour cameras for auro-ral imaging, Opt. Express, 16, 15623–15632, 2008. 757, 763
Sigernes, F., Dyrland, M., Peters, N., Lorentzen, D. A., Svenøe, T., Heia, K., Chernouss, S.,Deehr, C. S., and Kosch, M.: The absolute sensitivity of digital colour cameras, Opt. Express,15
17, 20211–20220, doi:10.1364/OE.17.020211, 2009. 757, 763, 784Sigernes, F., Ivanov, Y., Chernouss, S., Trondsen, T., Roldugin, A., Fedorenko, Y., Kozelov, B.,
Kirillov, A., Kornilov, I., Safargaleev, V., Holmen, S., Dyrland, M., Lorentzen, D., and Bad-deley, L.: Hyperspectral all-sky imaging of auroras, Opt. Express, 20, 27650–27660, 2012.77820
Sony: ICX429AKL color CCD, 2003. 787Steele, D. P. and Cogger, L. L.: Polar patches and the “tongue of ionization”, Radio Sci., 31,
667–677, doi:10.1029/96RS00369, 1996. 756, 778Strickland, D. J., Meier, R. R., Hecht, J. H., and Christensen, A. B.: Deducing composition
and incident electron spectra from ground-based auroral optical measurements: theory and25
model results, J. Geophys. Res., 94, 13527–13539, doi:10.1029/JA094iA10p13527, 1989.754
Strickland, D., Bishop, J., Evans, J., Majeed, T., Shen, P. M., Cox, R. J., Link, R., and Huff-man, R. E.: Atmospheric Ultraviolet Radiance Integrated Code (AURIC): theory, softwarearchitecture, inputs, and selected results, J. Quant. Spectrosc. Ra., 62, 689–742, 1999. 75530
Tarantola, A.: Inverse Problem Theory and Methods for Model Parameter Estima-tion, vol. 130, Society for Industrial and Applied Mathematics, Philadelphia, avail-
792
GID3, 753–823, 2013
Wide band color CCDspectral estimation
B. J. Jackel et al.
Title Page
Abstract Introduction
Conclusions References
Tables Figures
J I
J I
Back Close
Full Screen / Esc
Printer-friendly Version
Interactive Discussion
Discussion
Paper
|D
iscussionP
aper|
Discussion
Paper
|D
iscussionP
aper|
able at: http://www.ipgp.fr/~tarantola/Files/Professional/Teaching/Diverse/Complements_2/Lessons/Lessons_1-3.pdf (last access: 7 December 2013), 2005. 769
Toyomasu, S., Futaana, Y., Yamauchi, M., and Turiststation, A.: Low cost webcast system ofreal-time all-sky auroral images and MPEG archiving in Kiruna, in: Proceedings of 33rd An-nual European Meeting on Atmospheric Studies by Optical Methods, Kiruna, 292, 75–84,5
available at: http://www.irf.se/publications/proc33AM_files/toyomasu-etal.pdf (last access: 7December 2013), 2008. 756
Valero, E. M., Nieves, J. L., Nascimento, S. M. C., Amano, K., and Foster, D. H.: Recoveringspectral data from natural scenes with an RGB digital camera and colored filters, Color Res.Appl., 32, 352–360, doi:10.1002/col.20339, 2007. 78310
Wyszecki, G. and Stiles, W. S.: Color science: concepts and methods, quantitative data andformulae, 2nd Edn., Wiley-Interscience, New York, 2000. 775
793
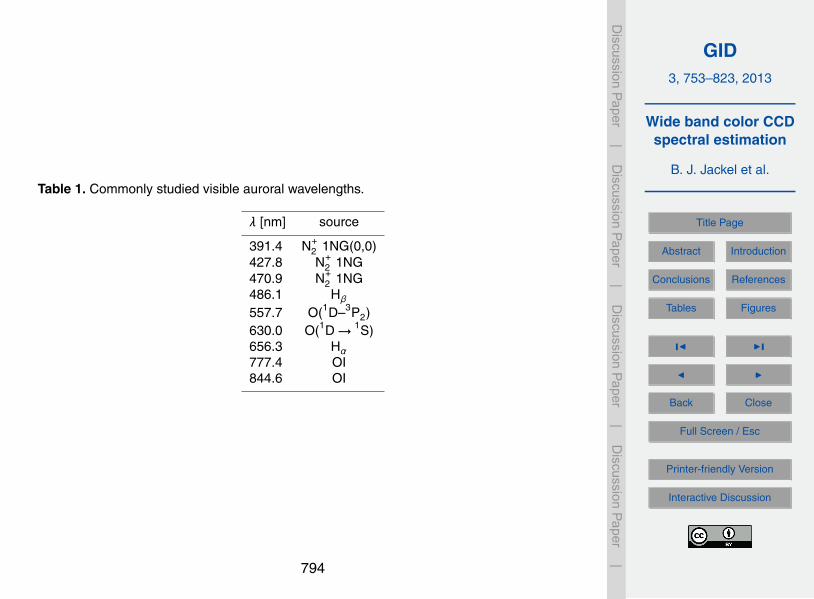
GID3, 753–823, 2013
Wide band color CCDspectral estimation
B. J. Jackel et al.
Title Page
Abstract Introduction
Conclusions References
Tables Figures
J I
J I
Back Close
Full Screen / Esc
Printer-friendly Version
Interactive Discussion
Discussion
Paper
|D
iscussionP
aper|
Discussion
Paper
|D
iscussionP
aper|
Table 1. Commonly studied visible auroral wavelengths.
λ [nm] source
391.4 N+2 1NG(0,0)
427.8 N+2 1NG
470.9 N+2 1NG
486.1 Hβ
557.7 O(1D–3P2)630.0 O(1D → 1S)656.3 Hα777.4 OI844.6 OI
794
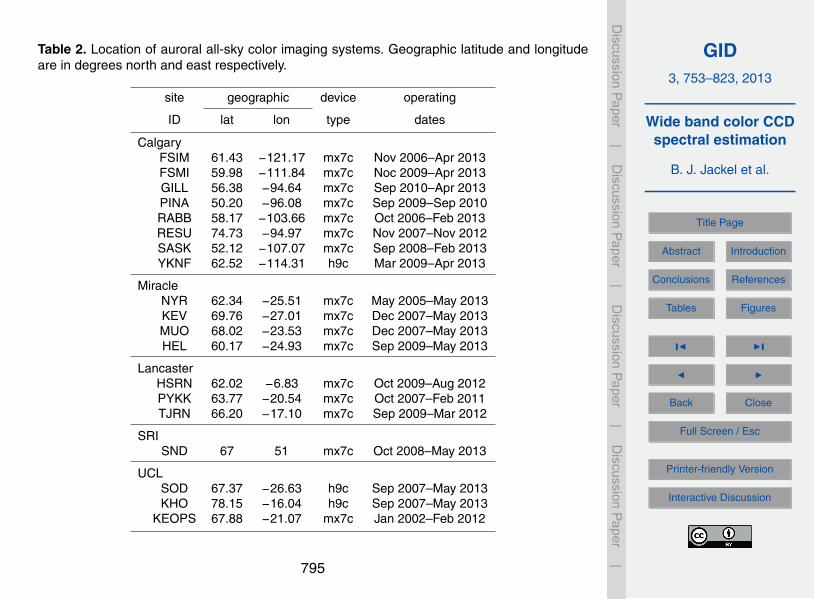
GID3, 753–823, 2013
Wide band color CCDspectral estimation
B. J. Jackel et al.
Title Page
Abstract Introduction
Conclusions References
Tables Figures
J I
J I
Back Close
Full Screen / Esc
Printer-friendly Version
Interactive Discussion
Discussion
Paper
|D
iscussionP
aper|
Discussion
Paper
|D
iscussionP
aper|
Table 2. Location of auroral all-sky color imaging systems. Geographic latitude and longitudeare in degrees north and east respectively.
site geographic device operating
ID lat lon type dates
CalgaryFSIM 61.43 −121.17 mx7c Nov 2006–Apr 2013FSMI 59.98 −111.84 mx7c Noc 2009–Apr 2013GILL 56.38 −94.64 mx7c Sep 2010–Apr 2013PINA 50.20 −96.08 mx7c Sep 2009–Sep 2010RABB 58.17 −103.66 mx7c Oct 2006–Feb 2013RESU 74.73 −94.97 mx7c Nov 2007–Nov 2012SASK 52.12 −107.07 mx7c Sep 2008–Feb 2013YKNF 62.52 −114.31 h9c Mar 2009–Apr 2013
MiracleNYR 62.34 −25.51 mx7c May 2005–May 2013KEV 69.76 −27.01 mx7c Dec 2007–May 2013MUO 68.02 −23.53 mx7c Dec 2007–May 2013HEL 60.17 −24.93 mx7c Sep 2009–May 2013
LancasterHSRN 62.02 −6.83 mx7c Oct 2009–Aug 2012PYKK 63.77 −20.54 mx7c Oct 2007–Feb 2011TJRN 66.20 −17.10 mx7c Sep 2009–Mar 2012
SRISND 67 51 mx7c Oct 2008–May 2013
UCLSOD 67.37 −26.63 h9c Sep 2007–May 2013KHO 78.15 −16.04 h9c Sep 2007–May 2013
KEOPS 67.88 −21.07 mx7c Jan 2002–Feb 2012
795
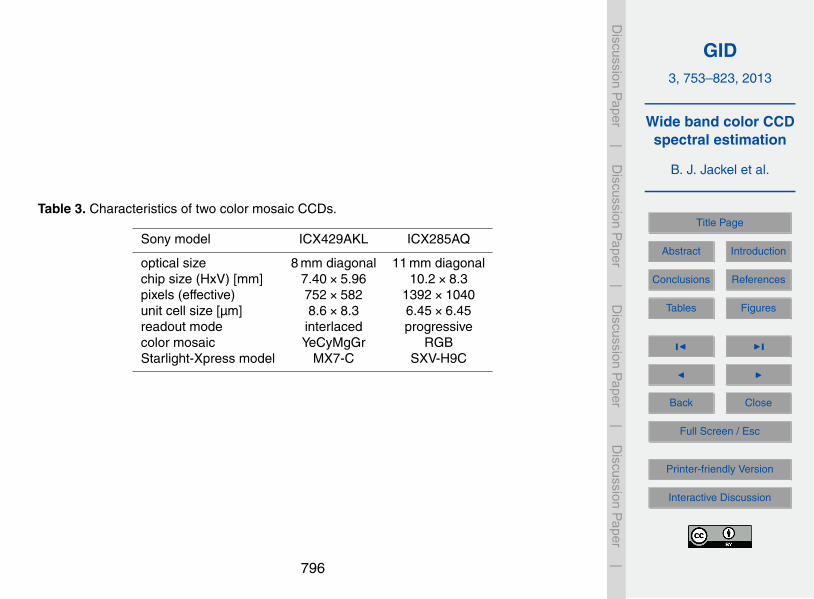
GID3, 753–823, 2013
Wide band color CCDspectral estimation
B. J. Jackel et al.
Title Page
Abstract Introduction
Conclusions References
Tables Figures
J I
J I
Back Close
Full Screen / Esc
Printer-friendly Version
Interactive Discussion
Discussion
Paper
|D
iscussionP
aper|
Discussion
Paper
|D
iscussionP
aper|
Table 3. Characteristics of two color mosaic CCDs.
Sony model ICX429AKL ICX285AQ
optical size 8 mm diagonal 11 mm diagonalchip size (HxV) [mm] 7.40×5.96 10.2×8.3pixels (effective) 752×582 1392×1040unit cell size [µm] 8.6×8.3 6.45×6.45readout mode interlaced progressivecolor mosaic YeCyMgGr RGBStarlight-Xpress model MX7-C SXV-H9C
796

GID3, 753–823, 2013
Wide band color CCDspectral estimation
B. J. Jackel et al.
Title Page
Abstract Introduction
Conclusions References
Tables Figures
J I
J I
Back Close
Full Screen / Esc
Printer-friendly Version
Interactive Discussion
Discussion
Paper
|D
iscussionP
aper|
Discussion
Paper
|D
iscussionP
aper|
Table 4. Noise sensitivity as indicated by the RMS value of coefficients in D matrix rows.
R G B
H9C 0.2809 0.6645 1.0000fast 0.1833 0.5052 1.3568raw 0.2810 0.5458 1.3978
797
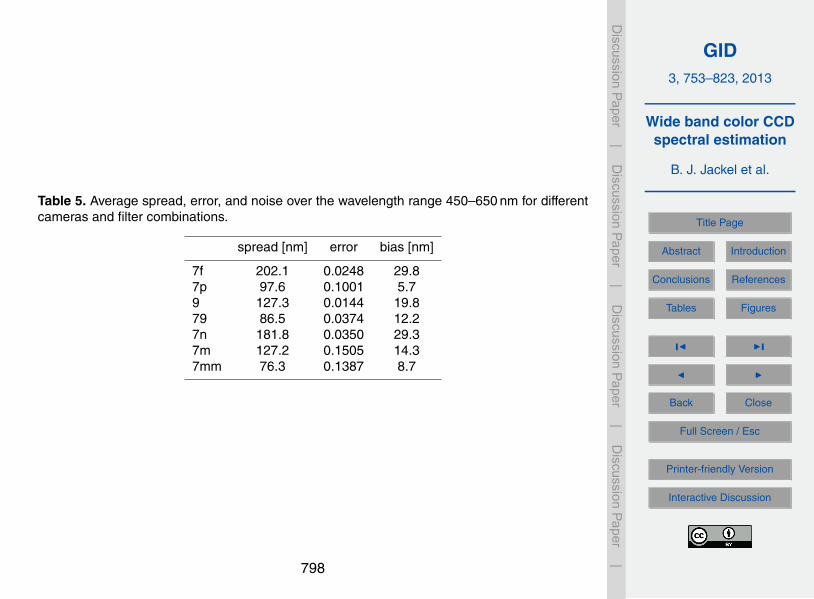
GID3, 753–823, 2013
Wide band color CCDspectral estimation
B. J. Jackel et al.
Title Page
Abstract Introduction
Conclusions References
Tables Figures
J I
J I
Back Close
Full Screen / Esc
Printer-friendly Version
Interactive Discussion
Discussion
Paper
|D
iscussionP
aper|
Discussion
Paper
|D
iscussionP
aper|
Table 5. Average spread, error, and noise over the wavelength range 450–650 nm for differentcameras and filter combinations.
spread [nm] error bias [nm]
7f 202.1 0.0248 29.87p 97.6 0.1001 5.79 127.3 0.0144 19.879 86.5 0.0374 12.27n 181.8 0.0350 29.37m 127.2 0.1505 14.37mm 76.3 0.1387 8.7
798
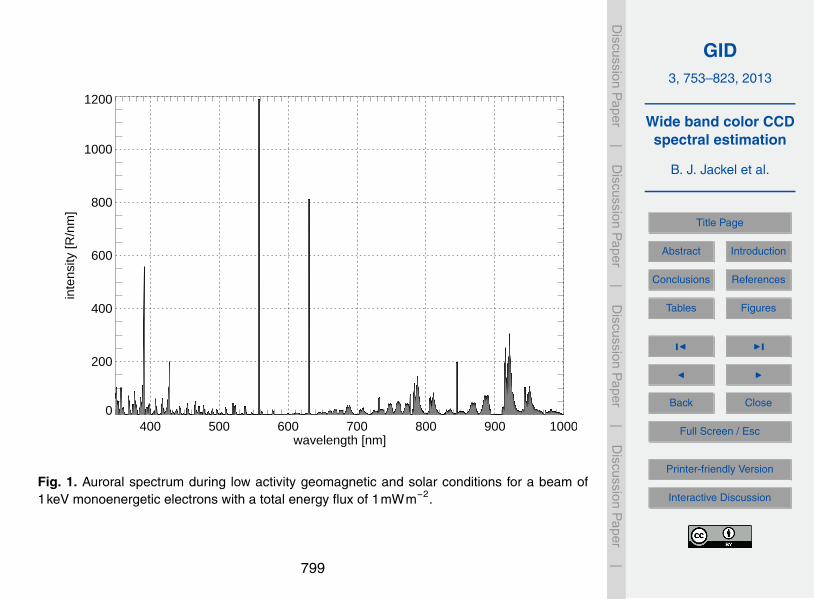
GID3, 753–823, 2013
Wide band color CCDspectral estimation
B. J. Jackel et al.
Title Page
Abstract Introduction
Conclusions References
Tables Figures
J I
J I
Back Close
Full Screen / Esc
Printer-friendly Version
Interactive Discussion
Discussion
Paper
|D
iscussionP
aper|
Discussion
Paper
|D
iscussionP
aper|
400 500 600 700 800 900 1000wavelength [nm]
0
200
400
600
800
1000
1200
inte
nsity
[R/n
m]
Tue
Jul
16
12:5
0:48
201
3c:
\Use
rs\b
jack
el\D
ropb
ox\w
ork\
imag
er\r
ainb
ow\fi
g\au
rora
l_sp
ectr
um.e
ps
Fig. 1. Auroral spectrum during low activity geomagnetic and solar conditions for a beam of1keV monoenergetic electrons with a total energy flux of 1mWm−2.
799
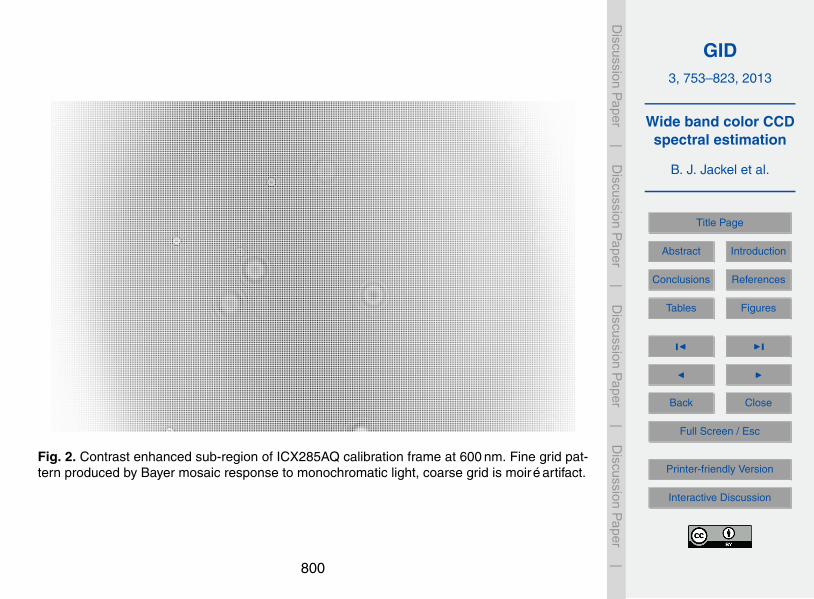
GID3, 753–823, 2013
Wide band color CCDspectral estimation
B. J. Jackel et al.
Title Page
Abstract Introduction
Conclusions References
Tables Figures
J I
J I
Back Close
Full Screen / Esc
Printer-friendly Version
Interactive Discussion
Discussion
Paper
|D
iscussionP
aper|
Discussion
Paper
|D
iscussionP
aper|
Fig. 2. Contrast enhanced sub-region of ICX285AQ calibration frame at 600 nm. Fine grid pat-tern produced by Bayer mosaic response to monochromatic light, coarse grid is moiré artifact.
800
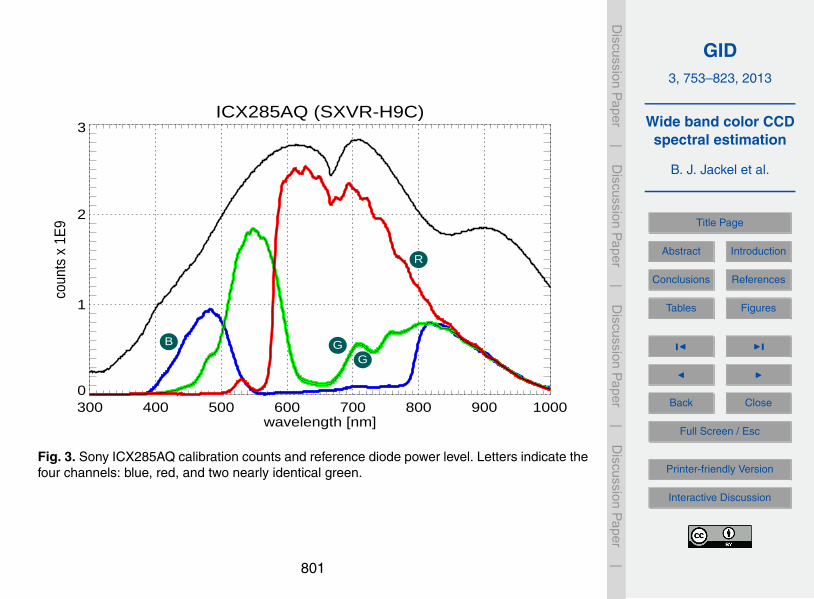
GID3, 753–823, 2013
Wide band color CCDspectral estimation
B. J. Jackel et al.
Title Page
Abstract Introduction
Conclusions References
Tables Figures
J I
J I
Back Close
Full Screen / Esc
Printer-friendly Version
Interactive Discussion
Discussion
Paper
|D
iscussionP
aper|
Discussion
Paper
|D
iscussionP
aper|
ICX285AQ (SXVR-H9C)
300 400 500 600 700 800 900 1000wavelength [nm]
0
1
2
3
coun
ts x
1E
9
B
GG
R
Fig. 3. Sony ICX285AQ calibration counts and reference diode power level. Letters indicate thefour channels: blue, red, and two nearly identical green.
801
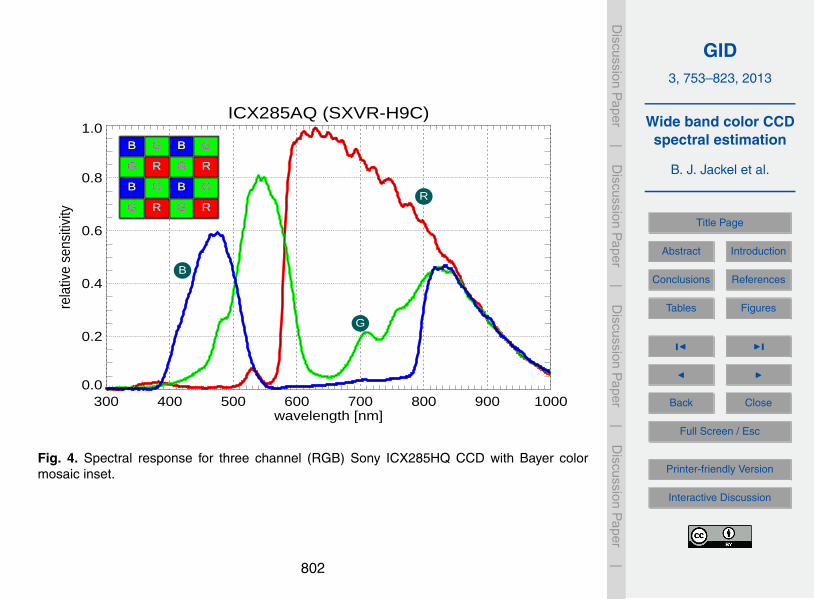
GID3, 753–823, 2013
Wide band color CCDspectral estimation
B. J. Jackel et al.
Title Page
Abstract Introduction
Conclusions References
Tables Figures
J I
J I
Back Close
Full Screen / Esc
Printer-friendly Version
Interactive Discussion
Discussion
Paper
|D
iscussionP
aper|
Discussion
Paper
|D
iscussionP
aper|
ICX285AQ (SXVR-H9C)
300 400 500 600 700 800 900 1000wavelength [nm]
0.0
0.2
0.4
0.6
0.8
1.0
rela
tive
sens
itivi
ty
R
G
B
BB
GG
BB
GG
GG
RR
GG
RR
BB
GG
BB
GG
GG
RR
GG
RR
Fig. 4. Spectral response for three channel (RGB) Sony ICX285HQ CCD with Bayer colormosaic inset.
802

GID3, 753–823, 2013
Wide band color CCDspectral estimation
B. J. Jackel et al.
Title Page
Abstract Introduction
Conclusions References
Tables Figures
J I
J I
Back Close
Full Screen / Esc
Printer-friendly Version
Interactive Discussion
Discussion
Paper
|D
iscussionP
aper|
Discussion
Paper
|D
iscussionP
aper|
ICX429AKL (MX7C) "raw"
300 400 500 600 700 800 900 1000wavelength [nm]
0.0
0.2
0.4
0.6
0.8
1.0
rela
tive
sens
itivi
ty
Cy
Ye
Gr
Mg
GrGr
YeYe
MgMg
YeYe
MgMg
CyCy
GrGr
CyCy
GrGr
YeYe
MgMg
YeYe
MgMg
CyCy
GrGr
CyCy
Fig. 5. Spectral response of four channel (CYGM) Sony ICX429AKL CCD in “raw” mode withcolor mosaic inset.
803
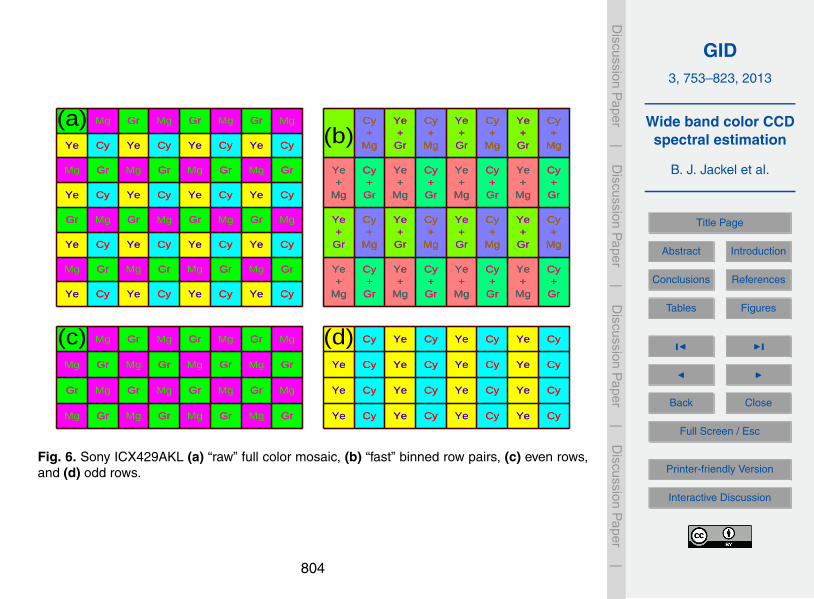
GID3, 753–823, 2013
Wide band color CCDspectral estimation
B. J. Jackel et al.
Title Page
Abstract Introduction
Conclusions References
Tables Figures
J I
J I
Back Close
Full Screen / Esc
Printer-friendly Version
Interactive Discussion
Discussion
Paper
|D
iscussionP
aper|
Discussion
Paper
|D
iscussionP
aper|
(a)YeYe
MgMg
YeYe
GrGr
YeYe
MgMg
YeYe
MgMg
CyCy
GrGr
CyCy
MgMg
CyCy
GrGr
CyCy
GrGr
YeYe
MgMg
YeYe
GrGr
YeYe
MgMg
YeYe
MgMg
CyCy
GrGr
CyCy
MgMg
CyCy
GrGr
CyCy
GrGr
YeYe
MgMg
YeYe
GrGr
YeYe
MgMg
YeYe
MgMg
CyCy
GrGr
CyCy
MgMg
CyCy
GrGr
CyCy
GrGr
YeYe
MgMg
YeYe
GrGr
YeYe
MgMg
YeYe
MgMg
CyCy
GrGr
CyCy
MgMg
CyCy
GrGr
CyCy
(b)
MgMg++
YeYe
GrGr++
YeYe
MgMg++
YeYe
MgMg++
CyCy
GrGr++
CyCy
MgMg++
CyCy
GrGr++
CyCy
GrGr++
YeYe
MgMg++
YeYe
GrGr++
YeYe
MgMg++
YeYe
MgMg++
CyCy
GrGr++
CyCy
MgMg++
CyCy
GrGr++
CyCy
GrGr++
YeYe
MgMg++
YeYe
GrGr++
YeYe
MgMg++
YeYe
MgMg++
CyCy
GrGr++
CyCy
MgMg++
CyCy
GrGr++
CyCy
GrGr++
YeYe
MgMg++
YeYe
GrGr++
YeYe
MgMg++
YeYe
MgMg++
CyCy
GrGr++
CyCy
MgMg++
CyCy
GrGr++
CyCy
(c)MgMg
GrGr
MgMg
MgMg
GrGr
MgMg
GrGr
GrGr
MgMg
GrGr
MgMg
MgMg
GrGr
MgMg
GrGr
GrGr
MgMg
GrGr
MgMg
MgMg
GrGr
MgMg
GrGr
GrGr
MgMg
GrGr
MgMg
MgMg
GrGr
MgMg
GrGr
(d)YeYe
YeYe
YeYe
CyCy
CyCy
CyCy
CyCy
YeYe
YeYe
YeYe
YeYe
CyCy
CyCy
CyCy
CyCy
YeYe
YeYe
YeYe
YeYe
CyCy
CyCy
CyCy
CyCy
YeYe
YeYe
YeYe
YeYe
CyCy
CyCy
CyCy
CyCy
Fig. 6. Sony ICX429AKL (a) “raw” full color mosaic, (b) “fast” binned row pairs, (c) even rows,and (d) odd rows.
804
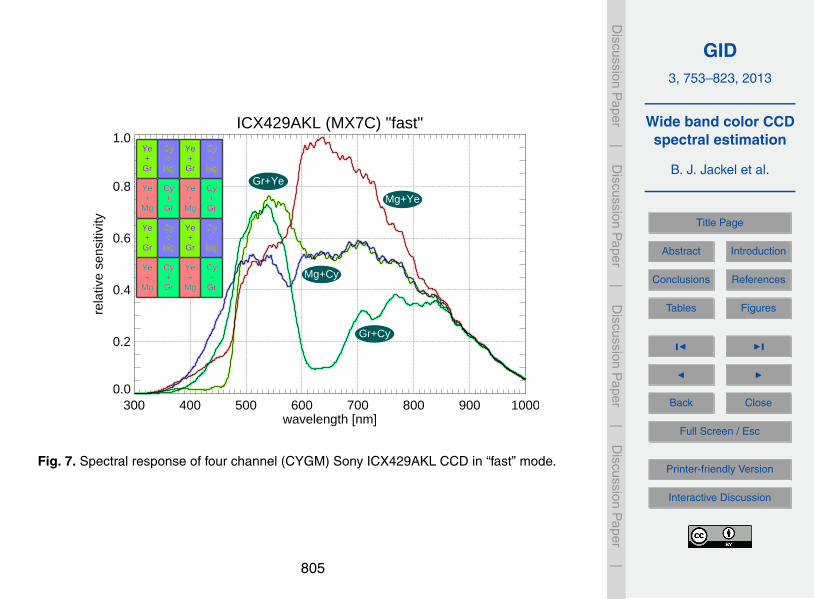
GID3, 753–823, 2013
Wide band color CCDspectral estimation
B. J. Jackel et al.
Title Page
Abstract Introduction
Conclusions References
Tables Figures
J I
J I
Back Close
Full Screen / Esc
Printer-friendly Version
Interactive Discussion
Discussion
Paper
|D
iscussionP
aper|
Discussion
Paper
|D
iscussionP
aper|
ICX429AKL (MX7C) "fast"
300 400 500 600 700 800 900 1000wavelength [nm]
0.0
0.2
0.4
0.6
0.8
1.0
rela
tive
sens
itivi
ty
Gr+Ye
Mg+Cy
Mg+Ye
Gr+Cy
GrGr++
YeYe
MgMg++
YeYe
GrGr++
YeYe
MgMg++
YeYe
MgMg++
CyCy
GrGr++
CyCy
MgMg++
CyCy
GrGr++
CyCy
GrGr++
YeYe
MgMg++
YeYe
GrGr++
YeYe
MgMg++
YeYe
MgMg++
CyCy
GrGr++
CyCy
MgMg++
CyCy
GrGr++
CyCy
Fig. 7. Spectral response of four channel (CYGM) Sony ICX429AKL CCD in “fast” mode.
805
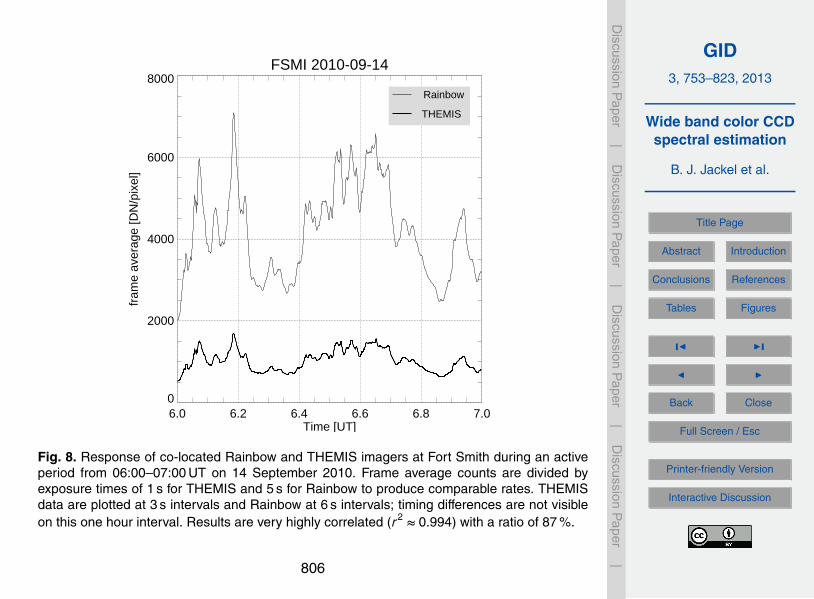
GID3, 753–823, 2013
Wide band color CCDspectral estimation
B. J. Jackel et al.
Title Page
Abstract Introduction
Conclusions References
Tables Figures
J I
J I
Back Close
Full Screen / Esc
Printer-friendly Version
Interactive Discussion
Discussion
Paper
|D
iscussionP
aper|
Discussion
Paper
|D
iscussionP
aper|
FSMI 2010-09-14
6.0 6.2 6.4 6.6 6.8 7.0Time [UT]
0
2000
4000
6000
8000
fram
e av
erag
e [D
N/p
ixel
]
Rainbow
THEMIS
Fig. 8. Response of co-located Rainbow and THEMIS imagers at Fort Smith during an activeperiod from 06:00–07:00 UT on 14 September 2010. Frame average counts are divided byexposure times of 1 s for THEMIS and 5 s for Rainbow to produce comparable rates. THEMISdata are plotted at 3 s intervals and Rainbow at 6 s intervals; timing differences are not visibleon this one hour interval. Results are very highly correlated (r2 ≈ 0.994) with a ratio of 87 %.
806
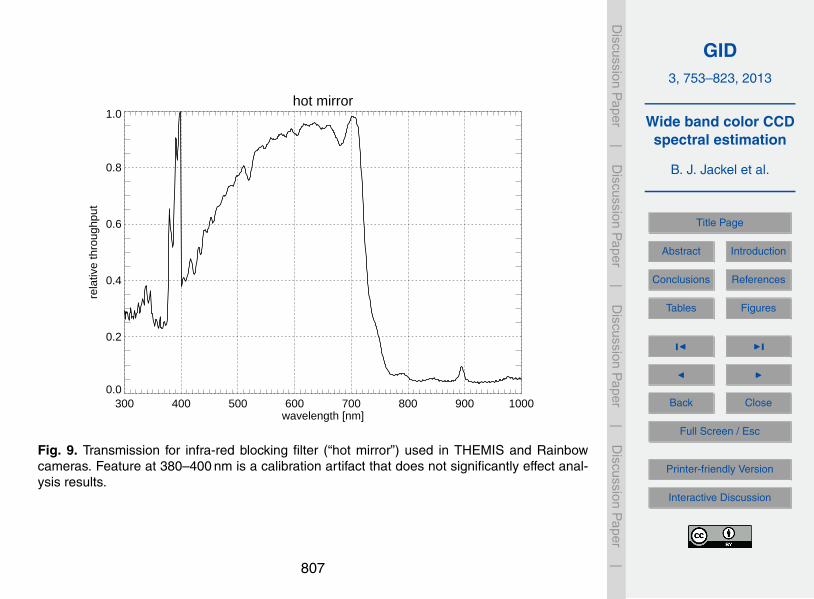
GID3, 753–823, 2013
Wide band color CCDspectral estimation
B. J. Jackel et al.
Title Page
Abstract Introduction
Conclusions References
Tables Figures
J I
J I
Back Close
Full Screen / Esc
Printer-friendly Version
Interactive Discussion
Discussion
Paper
|D
iscussionP
aper|
Discussion
Paper
|D
iscussionP
aper|
hot mirror
300 400 500 600 700 800 900 1000wavelength [nm]
0.0
0.2
0.4
0.6
0.8
1.0
rela
tive
thro
ughp
ut
Fig. 9. Transmission for infra-red blocking filter (“hot mirror”) used in THEMIS and Rainbowcameras. Feature at 380–400 nm is a calibration artifact that does not significantly effect anal-ysis results.
807
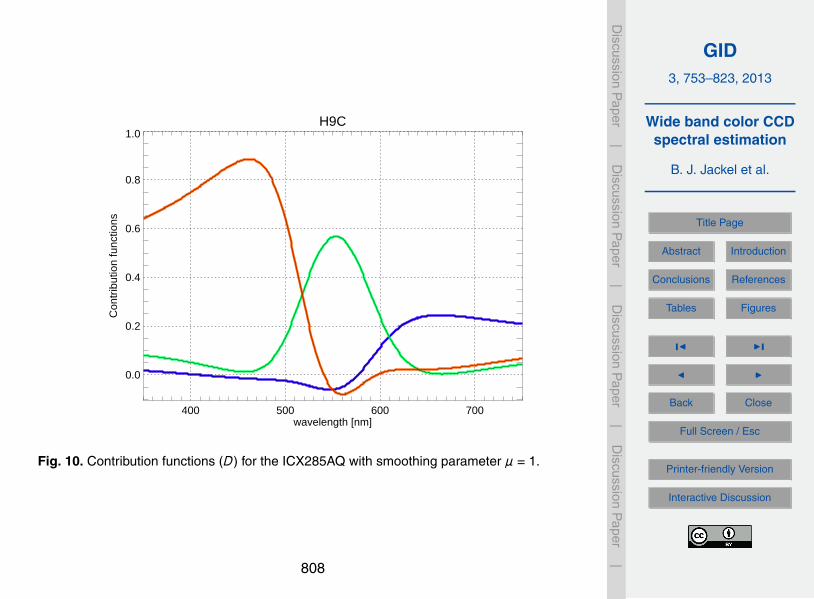
GID3, 753–823, 2013
Wide band color CCDspectral estimation
B. J. Jackel et al.
Title Page
Abstract Introduction
Conclusions References
Tables Figures
J I
J I
Back Close
Full Screen / Esc
Printer-friendly Version
Interactive Discussion
Discussion
Paper
|D
iscussionP
aper|
Discussion
Paper
|D
iscussionP
aper|
H9C
400 500 600 700wavelength [nm]
0.0
0.2
0.4
0.6
0.8
1.0
Con
trib
utio
n fu
nctio
ns
Fig. 10. Contribution functions (D) for the ICX285AQ with smoothing parameter µ = 1.
808

GID3, 753–823, 2013
Wide band color CCDspectral estimation
B. J. Jackel et al.
Title Page
Abstract Introduction
Conclusions References
Tables Figures
J I
J I
Back Close
Full Screen / Esc
Printer-friendly Version
Interactive Discussion
Discussion
Paper
|D
iscussionP
aper|
Discussion
Paper
|D
iscussionP
aper|
H9C (hot mirror)
300 400 500 600 700 800 900 1000wavelength (nm)
0.0
0.2
0.4
0.6
0.8
1.0
Res
olut
ion
func
tions
Fig. 11. Resolution/window functions (A) for ICX285AQ with smoothing parameter µ = 1 andretrieved wavelengths of 391.4 nm (dark blue), 427.8 nm (blue), 470.9 nm (light blue), 486.1 nm(cyan), 557.7 nm (green), 630.0 nm (orange), and 777.7 nm (red).
809
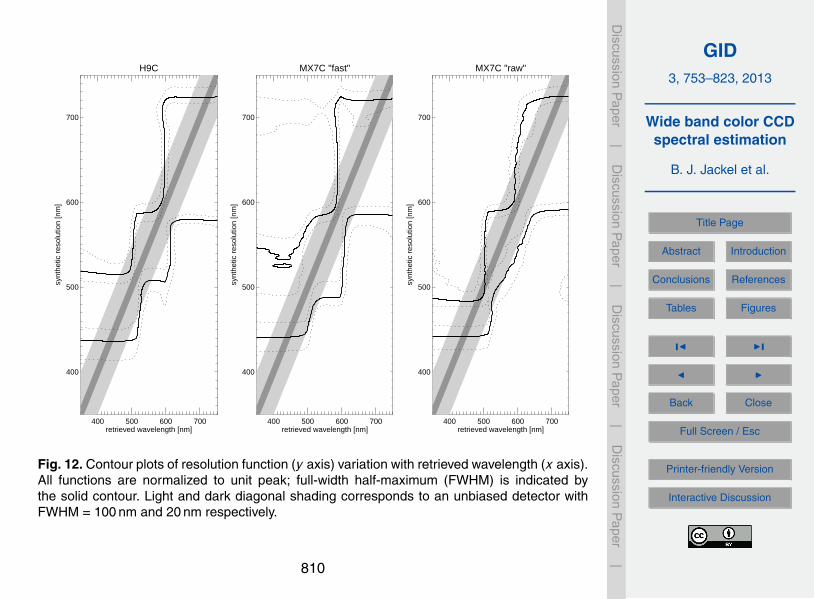
GID3, 753–823, 2013
Wide band color CCDspectral estimation
B. J. Jackel et al.
Title Page
Abstract Introduction
Conclusions References
Tables Figures
J I
J I
Back Close
Full Screen / Esc
Printer-friendly Version
Interactive Discussion
Discussion
Paper
|D
iscussionP
aper|
Discussion
Paper
|D
iscussionP
aper|
H9C
400 500 600 700retrieved wavelength [nm]
400
500
600
700
synt
hetic
res
olut
ion
[nm
]
MX7C "fast"
400 500 600 700retrieved wavelength [nm]
400
500
600
700
synt
hetic
res
olut
ion
[nm
]
MX7C "raw"
400 500 600 700retrieved wavelength [nm]
400
500
600
700
synt
hetic
res
olut
ion
[nm
]
Fig. 12. Contour plots of resolution function (y axis) variation with retrieved wavelength (x axis).All functions are normalized to unit peak; full-width half-maximum (FWHM) is indicated bythe solid contour. Light and dark diagonal shading corresponds to an unbiased detector withFWHM = 100 nm and 20 nm respectively.
810
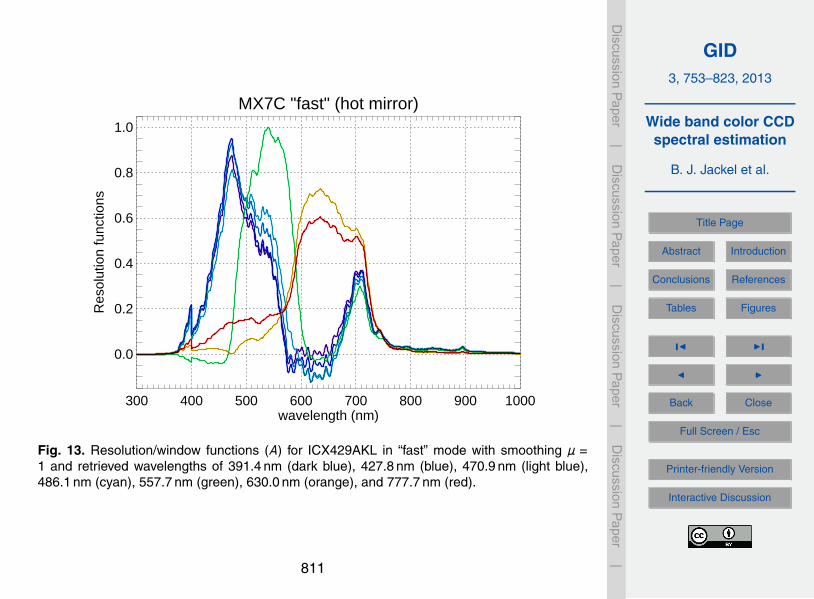
GID3, 753–823, 2013
Wide band color CCDspectral estimation
B. J. Jackel et al.
Title Page
Abstract Introduction
Conclusions References
Tables Figures
J I
J I
Back Close
Full Screen / Esc
Printer-friendly Version
Interactive Discussion
Discussion
Paper
|D
iscussionP
aper|
Discussion
Paper
|D
iscussionP
aper|
MX7C "fast" (hot mirror)
300 400 500 600 700 800 900 1000wavelength (nm)
0.0
0.2
0.4
0.6
0.8
1.0
Res
olut
ion
func
tions
Fig. 13. Resolution/window functions (A) for ICX429AKL in “fast” mode with smoothing µ =1 and retrieved wavelengths of 391.4 nm (dark blue), 427.8 nm (blue), 470.9 nm (light blue),486.1 nm (cyan), 557.7 nm (green), 630.0 nm (orange), and 777.7 nm (red).
811
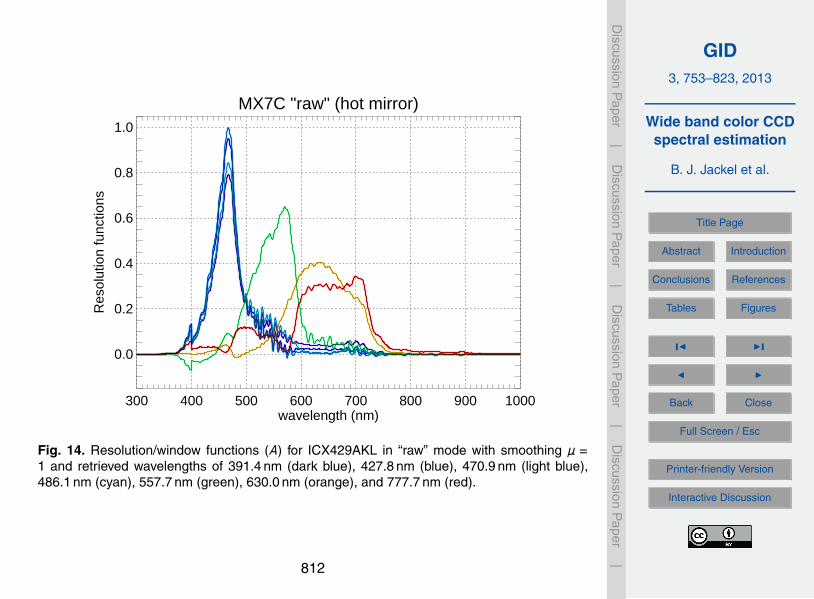
GID3, 753–823, 2013
Wide band color CCDspectral estimation
B. J. Jackel et al.
Title Page
Abstract Introduction
Conclusions References
Tables Figures
J I
J I
Back Close
Full Screen / Esc
Printer-friendly Version
Interactive Discussion
Discussion
Paper
|D
iscussionP
aper|
Discussion
Paper
|D
iscussionP
aper|
MX7C "raw" (hot mirror)
300 400 500 600 700 800 900 1000wavelength (nm)
0.0
0.2
0.4
0.6
0.8
1.0
Res
olut
ion
func
tions
Fig. 14. Resolution/window functions (A) for ICX429AKL in “raw” mode with smoothing µ =1 and retrieved wavelengths of 391.4 nm (dark blue), 427.8 nm (blue), 470.9 nm (light blue),486.1 nm (cyan), 557.7 nm (green), 630.0 nm (orange), and 777.7 nm (red).
812

GID3, 753–823, 2013
Wide band color CCDspectral estimation
B. J. Jackel et al.
Title Page
Abstract Introduction
Conclusions References
Tables Figures
J I
J I
Back Close
Full Screen / Esc
Printer-friendly Version
Interactive Discussion
Discussion
Paper
|D
iscussionP
aper|
Discussion
Paper
|D
iscussionP
aper|
MX7C "raw" 470.9nm
47.0 47.2 47.4 47.6 47.8 48.0spread [nm]
0.184
0.186
0.188
0.190
0.192
0.194no
ise
1
10
20
30
40
420 440 460 480
Fig. 15. Backus–Gilbert trade-off curve with inverse relationship between resolution functionspread and retrieval error. Results were obtained using MX7C “raw” kernels with a retrievalwavelength of 470.9 nm and µ ranging from 1 to 40. Inset shows nearly indistinguishable reso-lution functions for µ = 1 and µ = 40.
813
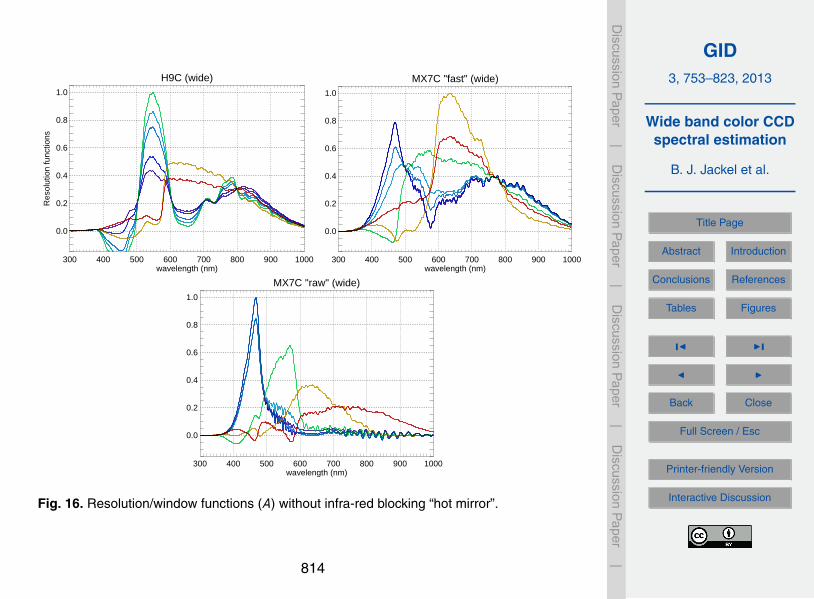
GID3, 753–823, 2013
Wide band color CCDspectral estimation
B. J. Jackel et al.
Title Page
Abstract Introduction
Conclusions References
Tables Figures
J I
J I
Back Close
Full Screen / Esc
Printer-friendly Version
Interactive Discussion
Discussion
Paper
|D
iscussionP
aper|
Discussion
Paper
|D
iscussionP
aper|
H9C (wide)
300 400 500 600 700 800 900 1000wavelength (nm)
0.0
0.2
0.4
0.6
0.8
1.0
Res
olut
ion
func
tions
MX7C "fast" (wide)
300 400 500 600 700 800 900 1000wavelength (nm)
0.0
0.2
0.4
0.6
0.8
1.0
Res
olut
ion
func
tions
MX7C "raw" (wide)
300 400 500 600 700 800 900 1000wavelength (nm)
0.0
0.2
0.4
0.6
0.8
1.0
Res
olut
ion
func
tions
Fig. 16. Resolution/window functions (A) without infra-red blocking “hot mirror”.
814
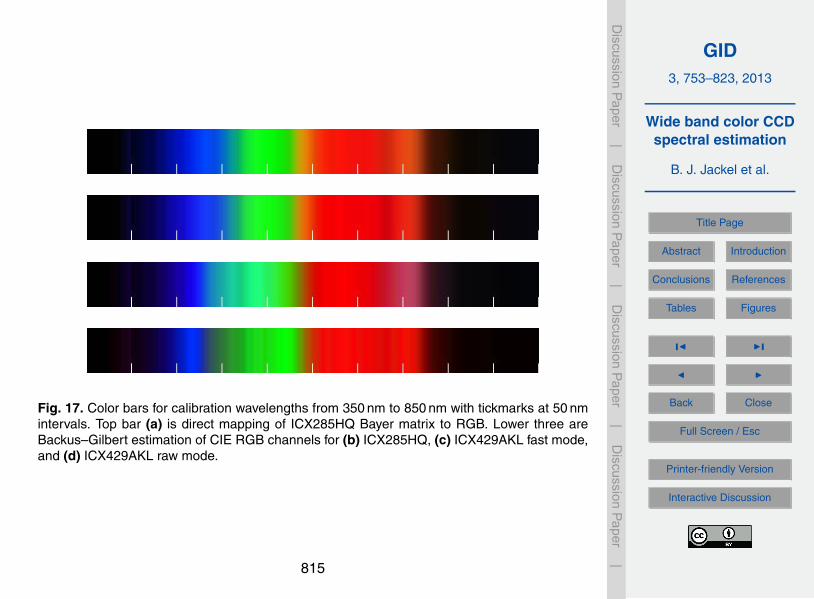
GID3, 753–823, 2013
Wide band color CCDspectral estimation
B. J. Jackel et al.
Title Page
Abstract Introduction
Conclusions References
Tables Figures
J I
J I
Back Close
Full Screen / Esc
Printer-friendly Version
Interactive Discussion
Discussion
Paper
|D
iscussionP
aper|
Discussion
Paper
|D
iscussionP
aper|
Fig. 17. Color bars for calibration wavelengths from 350 nm to 850 nm with tickmarks at 50 nmintervals. Top bar (a) is direct mapping of ICX285HQ Bayer matrix to RGB. Lower three areBackus–Gilbert estimation of CIE RGB channels for (b) ICX285HQ, (c) ICX429AKL fast mode,and (d) ICX429AKL raw mode.
815
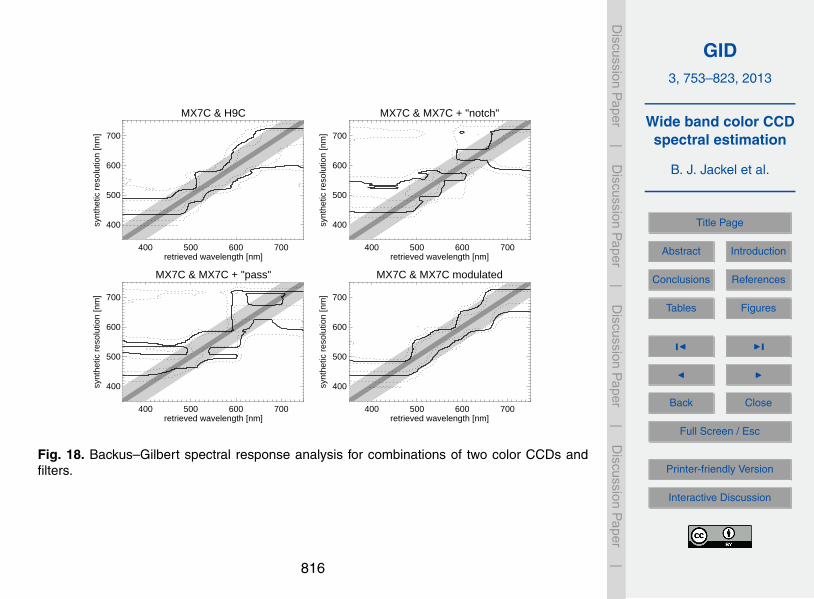
GID3, 753–823, 2013
Wide band color CCDspectral estimation
B. J. Jackel et al.
Title Page
Abstract Introduction
Conclusions References
Tables Figures
J I
J I
Back Close
Full Screen / Esc
Printer-friendly Version
Interactive Discussion
Discussion
Paper
|D
iscussionP
aper|
Discussion
Paper
|D
iscussionP
aper|
MX7C & H9C
400 500 600 700retrieved wavelength [nm]
400
500
600
700
synt
hetic
res
olut
ion
[nm
]
MX7C & MX7C + "notch"
400 500 600 700retrieved wavelength [nm]
400
500
600
700
synt
hetic
res
olut
ion
[nm
]
MX7C & MX7C + "pass"
400 500 600 700retrieved wavelength [nm]
400
500
600
700
synt
hetic
res
olut
ion
[nm
]
MX7C & MX7C modulated
400 500 600 700retrieved wavelength [nm]
400
500
600
700
synt
hetic
res
olut
ion
[nm
]
Fig. 18. Backus–Gilbert spectral response analysis for combinations of two color CCDs andfilters.
816

GID3, 753–823, 2013
Wide band color CCDspectral estimation
B. J. Jackel et al.
Title Page
Abstract Introduction
Conclusions References
Tables Figures
J I
J I
Back Close
Full Screen / Esc
Printer-friendly Version
Interactive Discussion
Discussion
Paper
|D
iscussionP
aper|
Discussion
Paper
|D
iscussionP
aper|
(a)
(b)
(c)
(d)
(e)
Fig. 19. (a) Broad-band CCD and narrow-band transmission filter, (b) broad-band CCD andnarrow-band rejection (“notch”) filter, (c) broad-band CCD and 3 different narrow pass-bandtransmission filters, (d) 3 channel wide-band color CCD and a single transmission filter with 3narrow pass-bands, (d) 3 channel wide-band color CCD and a single modulated transmissionfilter.
817

GID3, 753–823, 2013
Wide band color CCDspectral estimation
B. J. Jackel et al.
Title Page
Abstract Introduction
Conclusions References
Tables Figures
J I
J I
Back Close
Full Screen / Esc
Printer-friendly Version
Interactive Discussion
Discussion
Paper
|D
iscussionP
aper|
Discussion
Paper
|D
iscussionP
aper|
Semrock NF01-405_488_561_635
400 600 800 1000 1200wavelength [nm]
10-6
10-5
10-4
10-3
10-2
10-1
100
tran
smis
sion
400 500 600 7000.00.2
0.4
0.6
0.81.0
Fig. 20. Spectral transmission for a Semrock NF01-405/488/561/635 multi-notch filter with re-jection bands near 405 nm, 488 nm, 561 nm, and 635 nm. Vertical dashed lines correspond tosome typical auroral emission wavelengths.
818
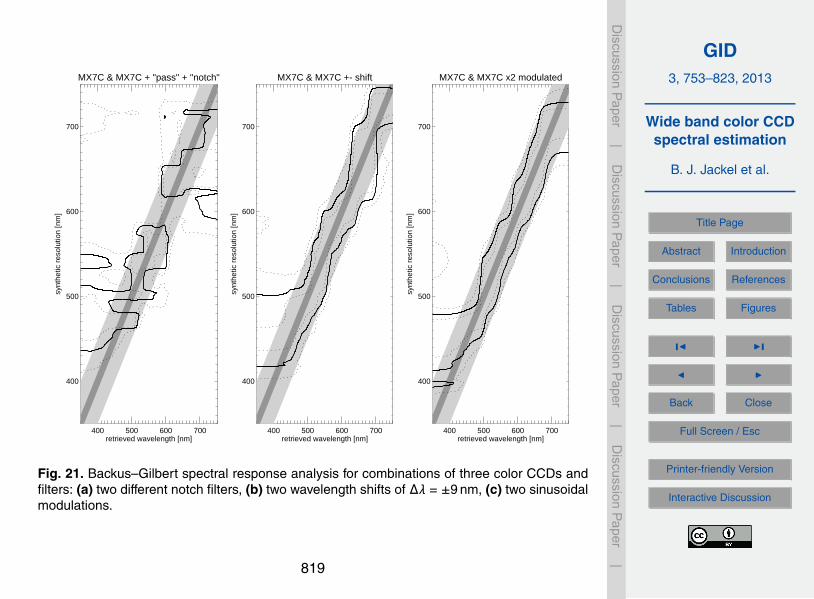
GID3, 753–823, 2013
Wide band color CCDspectral estimation
B. J. Jackel et al.
Title Page
Abstract Introduction
Conclusions References
Tables Figures
J I
J I
Back Close
Full Screen / Esc
Printer-friendly Version
Interactive Discussion
Discussion
Paper
|D
iscussionP
aper|
Discussion
Paper
|D
iscussionP
aper|
MX7C & MX7C + "pass" + "notch"
400 500 600 700retrieved wavelength [nm]
400
500
600
700
synt
hetic
res
olut
ion
[nm
]
MX7C & MX7C +- shift
400 500 600 700retrieved wavelength [nm]
400
500
600
700
synt
hetic
res
olut
ion
[nm
]
MX7C & MX7C x2 modulated
400 500 600 700retrieved wavelength [nm]
400
500
600
700
synt
hetic
res
olut
ion
[nm
]
Fig. 21. Backus–Gilbert spectral response analysis for combinations of three color CCDs andfilters: (a) two different notch filters, (b) two wavelength shifts of ∆λ = ±9 nm, (c) two sinusoidalmodulations.
819
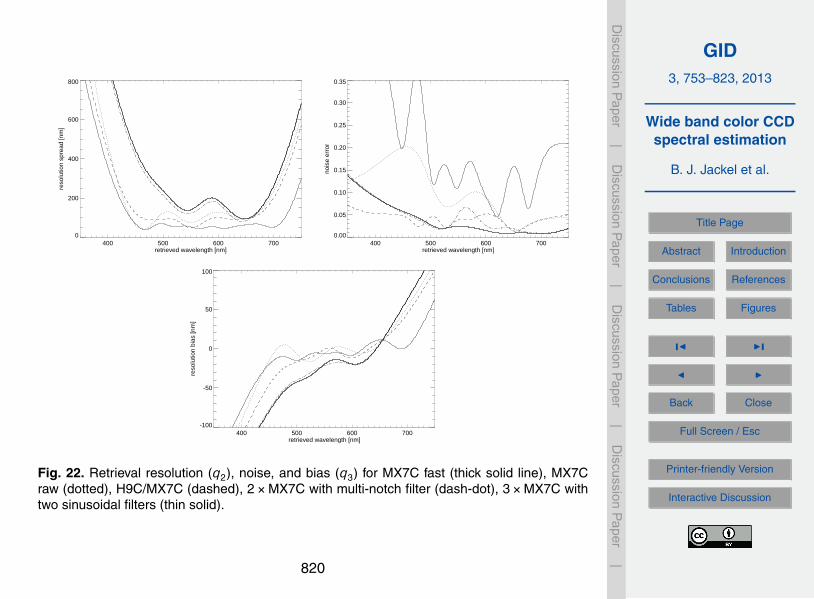
GID3, 753–823, 2013
Wide band color CCDspectral estimation
B. J. Jackel et al.
Title Page
Abstract Introduction
Conclusions References
Tables Figures
J I
J I
Back Close
Full Screen / Esc
Printer-friendly Version
Interactive Discussion
Discussion
Paper
|D
iscussionP
aper|
Discussion
Paper
|D
iscussionP
aper|
400 500 600 700retrieved wavelength [nm]
0
200
400
600
800
reso
lutio
n sp
read
[nm
]
400 500 600 700retrieved wavelength [nm]
0.00
0.05
0.10
0.15
0.20
0.25
0.30
0.35
nois
e er
ror
400 500 600 700retrieved wavelength [nm]
-100
-50
0
50
100
reso
lutio
n bi
as [n
m]
Fig. 22. Retrieval resolution (q2), noise, and bias (q3) for MX7C fast (thick solid line), MX7Craw (dotted), H9C/MX7C (dashed), 2×MX7C with multi-notch filter (dash-dot), 3×MX7C withtwo sinusoidal filters (thin solid).
820
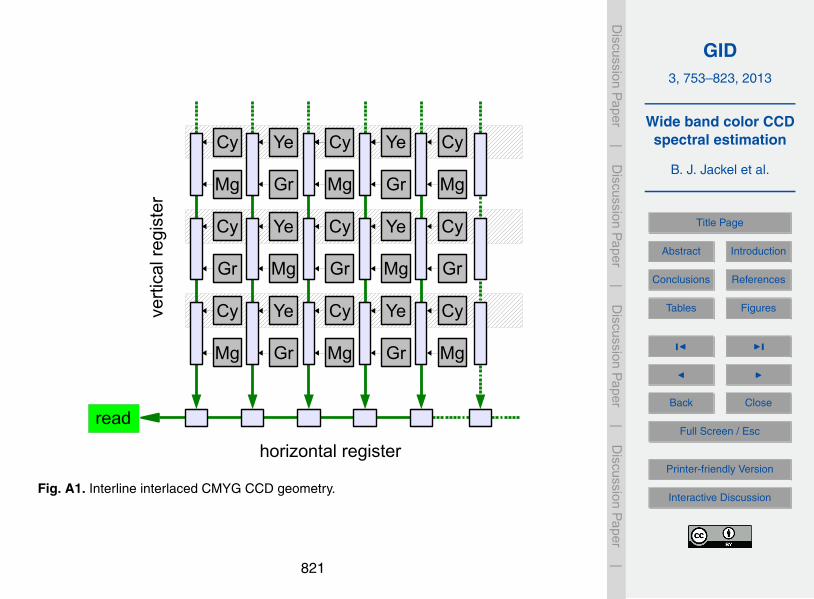
GID3, 753–823, 2013
Wide band color CCDspectral estimation
B. J. Jackel et al.
Title Page
Abstract Introduction
Conclusions References
Tables Figures
J I
J I
Back Close
Full Screen / Esc
Printer-friendly Version
Interactive Discussion
Discussion
Paper
|D
iscussionP
aper|
Discussion
Paper
|D
iscussionP
aper|
Cy
Gr
Mg
Cy
Cy
Mg
Ye
Mg
Gr
Ye
Ye
Gr
Cy
Gr
Mg
Cy
Cy
Mg
Ye
Mg
Gr
Ye
Ye
Gr
Cy
Gr
Mg
Cy
Cy
Mg
read
Brian's simple model of 3 commands
Clear: erase electrons from photo sensorStore: shift electrons from photo sensor to vertical registerRead: shift electrons down vertical registers into horizontal registers, then shift horizontally into readout
Then assume that for an interlaced device1) Clear and store commands can be applied separately to even & odd lines2) Read always shifts two vertical steps for each horizontal sweep ie. always bin 2 rows, no way(?) to read each row individually.3) Read is “blocking”, in that no other action can take place during read-out (but photo sensors can keep collecting photons)
vert
ical
reg
iste
r
horizontal register
Interline interlacedhttp://www.adept.net.au/news/newsletter/200810-oct/sensors.shtml
Fig. A1. Interline interlaced CMYG CCD geometry.
821
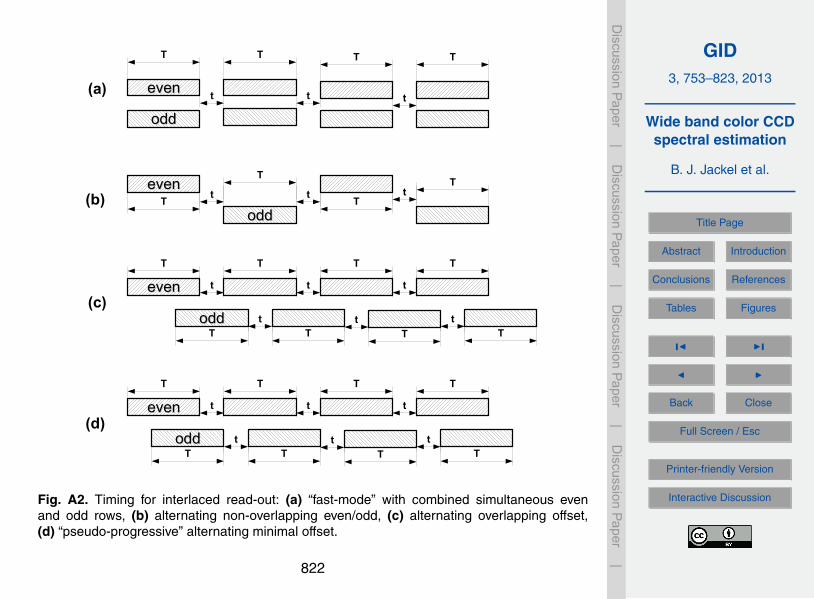
GID3, 753–823, 2013
Wide band color CCDspectral estimation
B. J. Jackel et al.
Title Page
Abstract Introduction
Conclusions References
Tables Figures
J I
J I
Back Close
Full Screen / Esc
Printer-friendly Version
Interactive Discussion
Discussion
Paper
|D
iscussionP
aper|
Discussion
Paper
|D
iscussionP
aper|
eveneven
oddoddT
T
t tT
Tt
eveneven
oddodd
T
t
T
t
T
t
T
(a)
(b)
eveneven
oddodd
t
T T
T T
t
t
T T
t
T
t
(c)
T
t
eveneven
oddodd
t
T T
T T
t
t
T T
t
T
t
(d)
T
t
(a) “fast” mode: clear even & odd, wait for exposure time T, store even & odd, read out for time t, repeat. Maximum duty cycle = T/(T+t) unless could also be exposing during readout, in which case duty cycle is approximately 100%
(b) worst-case “raw” mode: clear even, wait T, store even, read t, clear odd, wait T, store odd, read t, repeat. Max duty cycle = T/(2T+t) (<50%) and completely non-simultaneous.
(c) simple “raw” mode: max duty cycle = T/(T+t), overlap=(T-t)/2T (<50%)
d) optimal “raw” mode: max duty cycle = T/(T+t), overlap=(T-t)/T
Fig. A2. Timing for interlaced read-out: (a) “fast-mode” with combined simultaneous evenand odd rows, (b) alternating non-overlapping even/odd, (c) alternating overlapping offset,(d) “pseudo-progressive” alternating minimal offset.
822
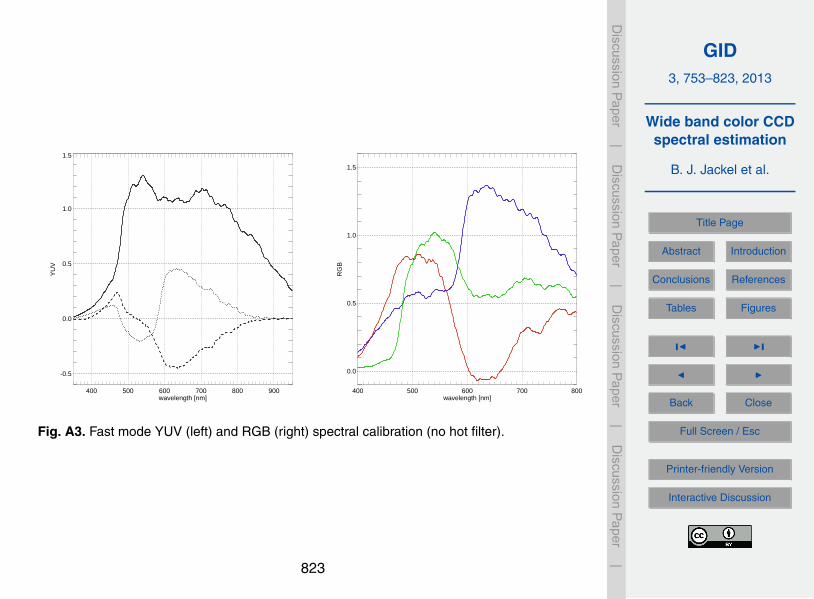
GID3, 753–823, 2013
Wide band color CCDspectral estimation
B. J. Jackel et al.
Title Page
Abstract Introduction
Conclusions References
Tables Figures
J I
J I
Back Close
Full Screen / Esc
Printer-friendly Version
Interactive Discussion
Discussion
Paper
|D
iscussionP
aper|
Discussion
Paper
|D
iscussionP
aper|
400 500 600 700 800 900wavelength [nm]
-0.5
0.0
0.5
1.0
1.5
YU
V
400 500 600 700 800wavelength [nm]
0.0
0.5
1.0
1.5
RG
B
Fig. A3. Fast mode YUV (left) and RGB (right) spectral calibration (no hot filter).
823