hs algebra ii semester 2 module 3: exponential and ... algebra...12/19/2014 page 1 of 50 hs algebra...
TRANSCRIPT

HIGLEY UNIFIED SCHOOL DISTRICT INSTRUCTIONAL ALIGNMENT
12/19/2014 Page 1 of 50
HS Algebra II Semester 2
Module 3: Exponential and Logarithmic Functions (45 days) Topic A: Real Numbers (6 Instructional Days)
In Topic A, students prepare to generalize what they know about various function families by examining the behavior of exponential functions. One goal of the module is to show that the domain of the exponential function, 𝑓(𝑥) = 𝑏𝑥, where 𝑏 is a positive number not equal to 1, is all real numbers.
Big Idea:
Essential Questions:
How can the properties of exponents help us to rewrite expressions?
Why are the properties of exponents useful when working with large or small numbers?
Vocabulary Properties of exponents, leading digit, scientific notation, order of magnitude, n
th root of a number, principal n
th root of a number, Euler’s number, e, average
rate of change
Assessment Galileo: Module 3 Pre-assessment of Foundation Skills; Topic A Assessment
Standard Common Core Standards Explanations & Examples Comments
N.RN.A.1
A. Extend the properties of exponents to rational exponents Explain how the definition of the meaning of rational exponents follows from extending the properties of integer exponents to those values, allowing for a notation for radicals in terms of rational exponents. For example, we define 5
1/3 to be the cube root of 5 because
we want (51/3
)3 = 5
(1/3)3 to hold, so (5
1/3)
3 must equal 5.
Students may explain orally or in written format.
Eureka Math Module 3 Lesson 3,4,5

12/19/2014 Page 2 of 50
12/19/2014 Page 3 of 50
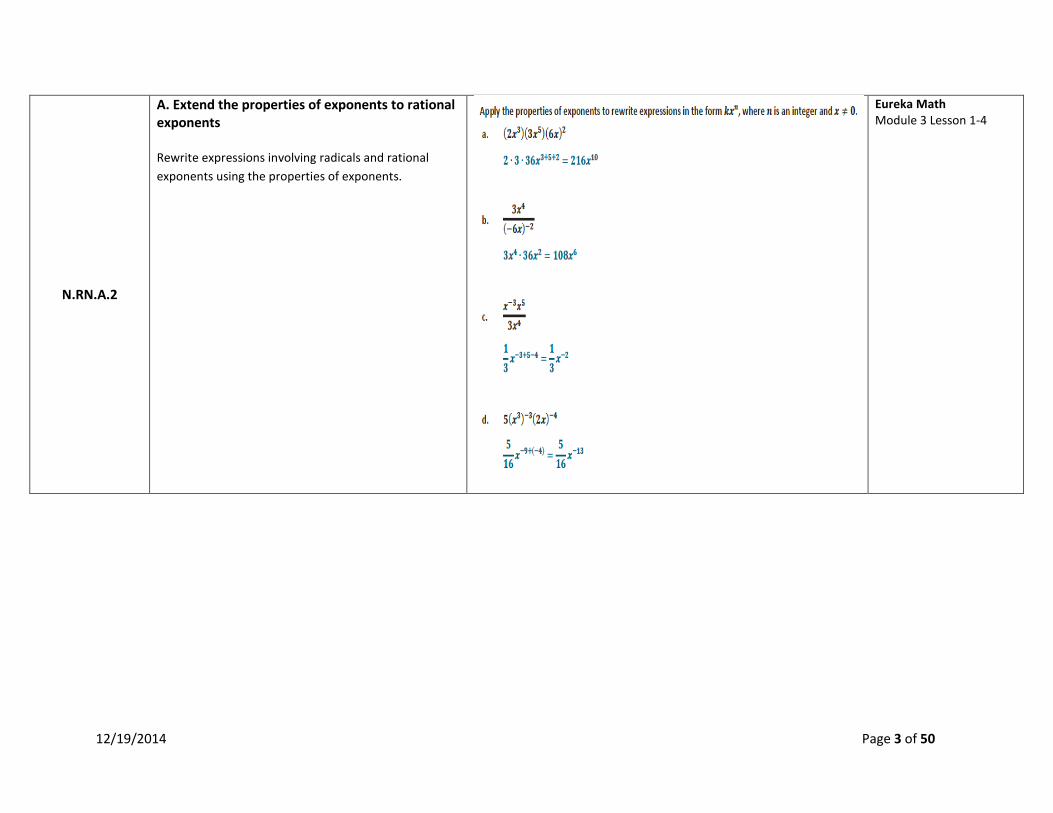
N.RN.A.2
A. Extend the properties of exponents to rational exponents Rewrite expressions involving radicals and rational
exponents using the properties of exponents.
Eureka Math Module 3 Lesson 1-4

12/19/2014 Page 4 of 50
N.Q.A.2
A. Reason qualitatively and units to solve
problems
Define appropriate quantities for the purpose of descriptive modeling.
This standard will be assessed in Algebra II by ensuring that some modeling tasks (involving Algebra II content or securely held content from previous grades and courses) require the student to create a quantity of interest in the situation being described.
Eureka Math Module 3 Lesson 2
12/19/2014 Page 5 of 50
F.IF.B.6 B. Interpret functions that arise in applications in terms of context
Calculate and interpret the average rate of change of a function (presented symbolically or as a table) over a specified interval. Estimate the rate of change from a graph.
The average rate of change of a function y = f(x) over an interval [a,b] is
𝑥
𝑓(𝑏) 𝑓( )
𝑏 . In addition to finding average rates of change from
functions given symbolically, graphically, or in a table, Students may collect data from experiments or simulations (ex. falling ball, velocity of a car, etc.) and find average rates of change for the function modeling the situation.
Eureka Math Module 3 Lesson 6
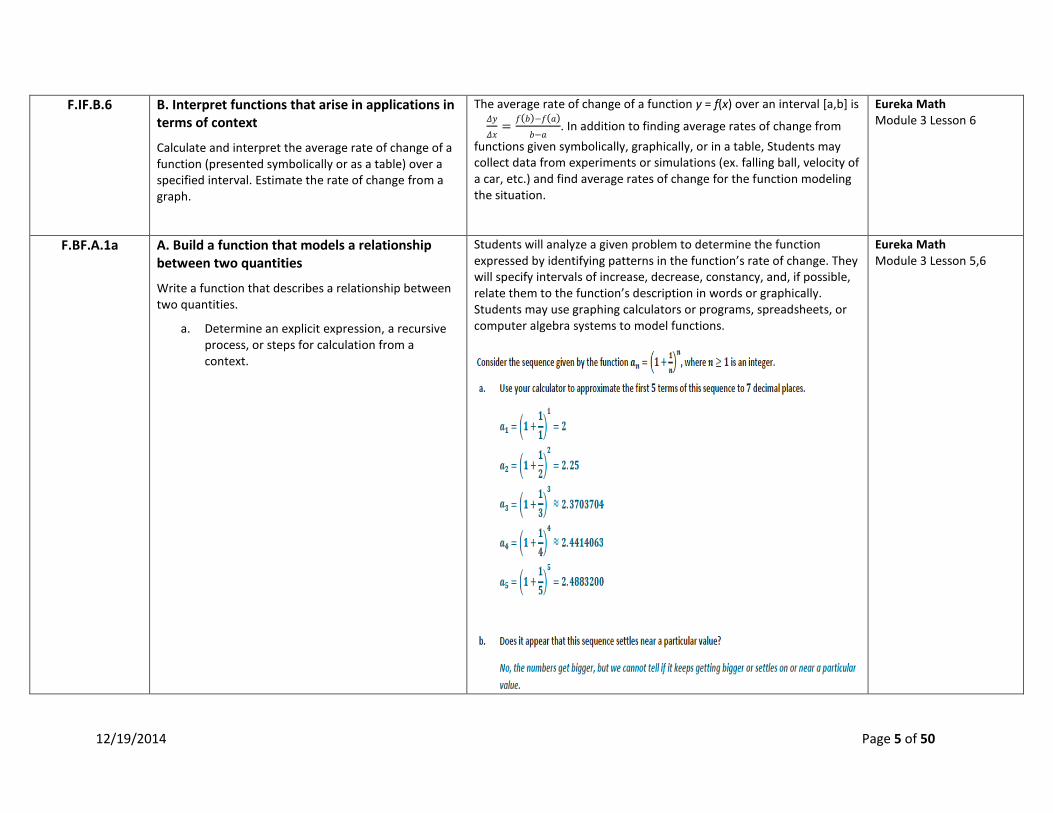
F.BF.A.1a A. Build a function that models a relationship between two quantities
Write a function that describes a relationship between two quantities.
a. Determine an explicit expression, a recursive process, or steps for calculation from a context.
Students will analyze a given problem to determine the function expressed by identifying patterns in the function’s rate of change. They will specify intervals of increase, decrease, constancy, and, if possible, relate them to the function’s description in words or graphically. Students may use graphing calculators or programs, spreadsheets, or computer algebra systems to model functions.
Eureka Math Module 3 Lesson 5,6

12/19/2014 Page 6 of 50
F.LE.A.2 A. Construct and compare linear, quadratic, and exponential models and solve problems
Construct linear and exponential functions, including arithmetic and geometric sequences, given a graph, a description of a relationship, or two input-output pairs (include reading these from a table).
Students may use graphing calculators or programs, spreadsheets, or computer algebra systems to construct linear and exponential functions.
Eureka Math Module 3 Lesson 1
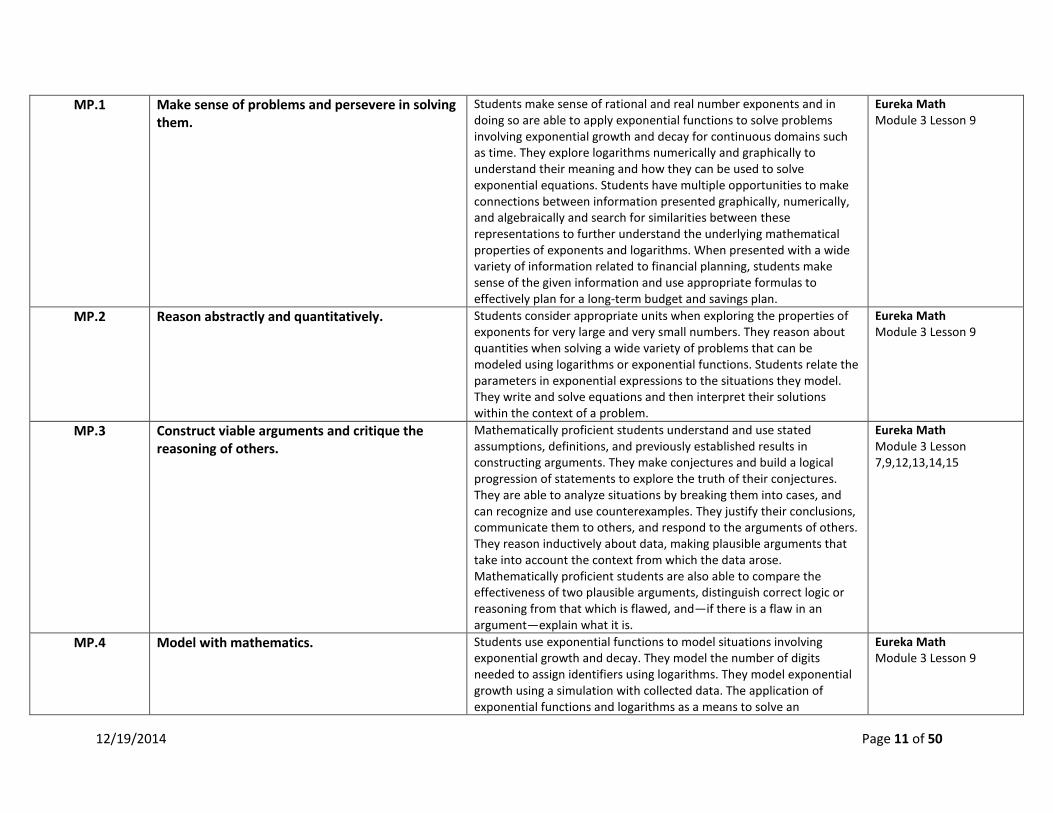
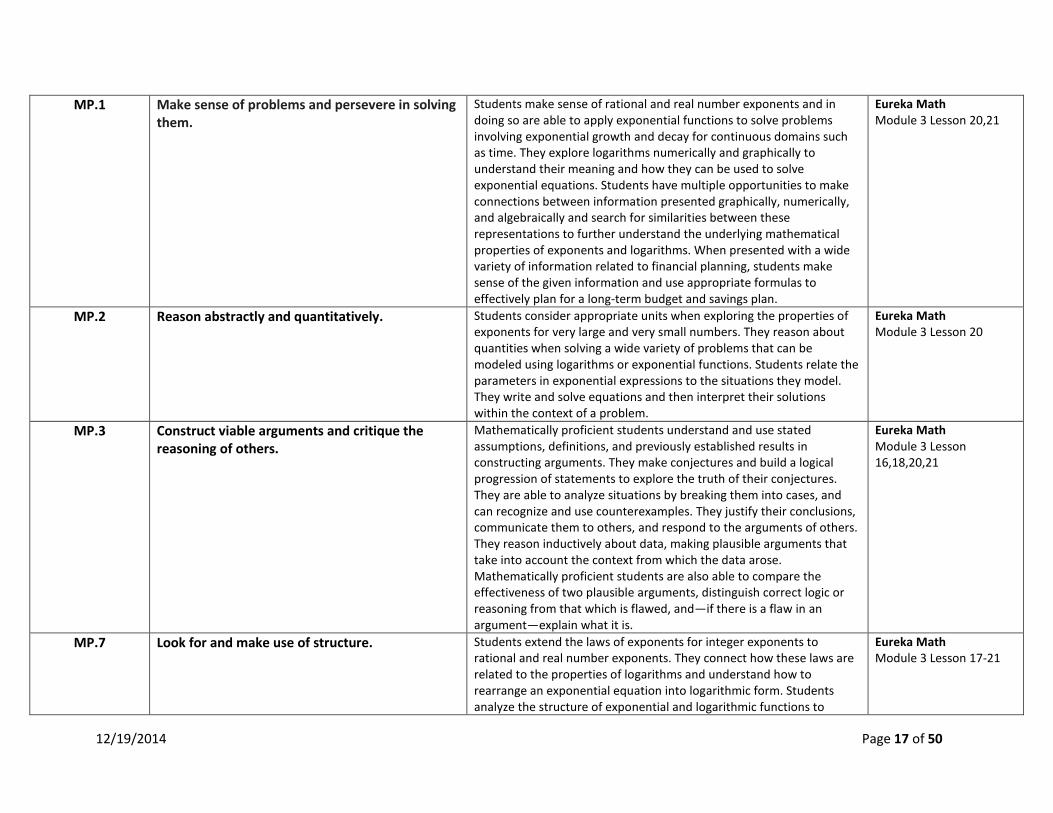
MP.1 Make sense of problems and persevere in solving them.
Students make sense of rational and real number exponents and in doing so are able to apply exponential functions to solve problems involving exponential growth and decay for continuous domains such as time. They explore logarithms numerically and graphically to understand their meaning and how they can be used to solve exponential equations. Students have multiple opportunities to make connections between information presented graphically, numerically, and algebraically and search for similarities between these representations to further understand the underlying mathematical properties of exponents and logarithms. When presented with a wide
Eureka Math Module 3 Lesson 1

12/19/2014 Page 7 of 50
variety of information related to financial planning, students make sense of the given information and use appropriate formulas to effectively plan for a long-term budget and savings plan.
MP.3 Construct viable arguments and critique the reasoning of others.
Mathematically proficient students understand and use stated assumptions, definitions, and previously established results in constructing arguments. They make conjectures and build a logical progression of statements to explore the truth of their conjectures. They are able to analyze situations by breaking them into cases, and can recognize and use counterexamples. They justify their conclusions, communicate them to others, and respond to the arguments of others. They reason inductively about data, making plausible arguments that take into account the context from which the data arose. Mathematically proficient students are also able to compare the effectiveness of two plausible arguments, distinguish correct logic or reasoning from that which is flawed, and—if there is a flaw in an argument—explain what it is.
Eureka Math Module 3 Lesson 1-4
MP.4 Model with mathematics. Students use exponential functions to model situations involving exponential growth and decay. They model the number of digits needed to assign identifiers using logarithms. They model exponential growth using a simulation with collected data. The application of exponential functions and logarithms as a means to solve an exponential equation is a focus of several lessons that deal with financial literacy and planning a budget. Here, students must make sense of several different quantities and their relationships as they plan and prioritize for their future financial solvency.
Eureka Math Module 3 Lesson 1,6
MP.6 Attend to precision.
Mathematically proficient students try to communicate precisely to others. They try to use clear definitions in discussion with others and in their own reasoning. They state the meaning of the symbols they choose, including using the equal sign consistently and appropriately. They are careful about specifying units of measure, and labeling axes to clarify the correspondence with quantities in a problem. They calculate accurately and efficiently, express numerical answers with a degree of precision appropriate for the problem context.
Eureka Math Module 3 Lesson 3
MP.7 Look for and make use of structure. Students extend the laws of exponents for integer exponents to rational and real number exponents. They connect how these laws are related to the properties of logarithms and understand how to rearrange an exponential equation into logarithmic form. Students analyze the structure of exponential and logarithmic functions to
Eureka Math Module 3 Lesson 2,3,4

12/19/2014 Page 8 of 50
understand how to sketch graphs and see how the properties relate to transformations of these types of functions. They analyze the structure of expressions to reveal properties such as recognizing when a function models exponential growth versus decay. Students use the structure of equations to understand how to identify an appropriate solution method.
MP.8 Look for and express regularity in repeated reasoning.
Students discover the properties of logarithms and the meaning of a logarithm by investigating numeric examples. They develop formulas that involve exponentials and logarithms by extending patterns and examining tables and graphs. Students generalize transformations of graphs of logarithmic functions by examining several different cases.
Eureka Math Module 3 Lesson 3,4,5,6

12/19/2014 Page 9 of 50
HS Algebra II Semester 2
Module 3: Exponential and Logarithmic Functions (45 days) Topic B: Logarithms (9 Instructional Days)
The lessons covered in Topic A familiarize students with the laws and properties of real -valued exponents. In Topic B, students extend their work with exponential functions to include solving exponential equations numerically and to develop an understanding of the relationship between logarithms and exponentials.
Big Idea:
Logarithms can be used to solve the exponential equations modeling many real-life situations.
Logarithmic equations can be solved graphically through the use of technology.
Logarithmic functions (and logarithmic scales) can be useful to represent numbers that are very large or that vary greatly and are used to describe real-world situations (Richter scale, Decibels, pH scale, etc.).
The logarithm of a number is the exponent that another value (the base) must be raised to produce the given number.
Logb y = x is another way of expressing bx = y and that this logarithmic expression can be used to determine the solution of an equation where the
unknown is in the exponent.
Essential Questions:
What can be modeled using logarithmic functions?
What type of function is best to model a given situation?
How can logarithmic equations be solved?
What is a logarithm?
How are logarithms and exponentials related?
What are the key features of the graph of a logarithmic function?
How can a logarithmic function be represented numerically or in a table?
Vocabulary Logarithm, common logarithm, change of base formula
Assessment Galileo: Topic B Assessment
Standard Common Core Standards Explanations & Examples Resources
N.Q.A.2
A. Reason qualitatively and units to solve
problems
Define appropriate quantities for the purpose of descriptive modeling.
Eureka Math Module 3 Lesson 9-10

12/19/2014 Page 10 of 50
A.CED.A.1 A. Create equations that describe numbers or relationships
Create equations and inequalities in one variable and use them to solve problems. Include equations arising from linear and quadratic functions, and simple rational and exponential functions.
Equations can represent real world and mathematical problems. Include equations and inequalities that arise when comparing the values of two different functions, such as one describing linear growth and one describing exponential growth.
Eureka Math Module 3 Lesson 7
F.BF.A.1a A. Build a function that models a relationship between two quantities
Write a function that describes a relationship between two quantities.
b. Determine an explicit expression, a recursive process, or steps for calculation from a context.
Students will analyze a given problem to determine the function expressed by identifying patterns in the function’s rate of change. They will specify intervals of increase, decrease, constancy, and, if possible, relate them to the function’s description in words or graphically. Students may use graphing calculators or programs, spreadsheets, or computer algebra systems to model functions.
Eureka Math Module 3 Lesson 7
F.LE.A.4 A. Construct and compare linear, quadratic, and exponential models and solve problems
For exponential models, express as a logarithm the solution to ab
ct = d where a, c, and d are numbers and
the base b is 2, 10, or e; evaluate the logarithm using technology.
Students may use graphing calculators or programs, spreadsheets, or computer algebra systems to analyze exponential models and evaluate logarithms.
Eureka Math Module 3 Lesson 8,10-15
12/19/2014 Page 11 of 50
MP.1 Make sense of problems and persevere in solving them.
Students make sense of rational and real number exponents and in doing so are able to apply exponential functions to solve problems involving exponential growth and decay for continuous domains such as time. They explore logarithms numerically and graphically to understand their meaning and how they can be used to solve exponential equations. Students have multiple opportunities to make connections between information presented graphically, numerically, and algebraically and search for similarities between these representations to further understand the underlying mathematical properties of exponents and logarithms. When presented with a wide variety of information related to financial planning, students make sense of the given information and use appropriate formulas to effectively plan for a long-term budget and savings plan.
Eureka Math Module 3 Lesson 9
MP.2 Reason abstractly and quantitatively. Students consider appropriate units when exploring the properties of exponents for very large and very small numbers. They reason about quantities when solving a wide variety of problems that can be modeled using logarithms or exponential functions. Students relate the parameters in exponential expressions to the situations they model. They write and solve equations and then interpret their solutions within the context of a problem.
Eureka Math Module 3 Lesson 9
MP.3 Construct viable arguments and critique the reasoning of others.
Mathematically proficient students understand and use stated assumptions, definitions, and previously established results in constructing arguments. They make conjectures and build a logical progression of statements to explore the truth of their conjectures. They are able to analyze situations by breaking them into cases, and can recognize and use counterexamples. They justify their conclusions, communicate them to others, and respond to the arguments of others. They reason inductively about data, making plausible arguments that take into account the context from which the data arose. Mathematically proficient students are also able to compare the effectiveness of two plausible arguments, distinguish correct logic or reasoning from that which is flawed, and—if there is a flaw in an argument—explain what it is.
Eureka Math Module 3 Lesson 7,9,12,13,14,15
MP.4 Model with mathematics. Students use exponential functions to model situations involving exponential growth and decay. They model the number of digits needed to assign identifiers using logarithms. They model exponential growth using a simulation with collected data. The application of exponential functions and logarithms as a means to solve an
Eureka Math Module 3 Lesson 9

12/19/2014 Page 12 of 50
exponential equation is a focus of several lessons that deal with financial literacy and planning a budget. Here, students must make sense of several different quantities and their relationships as they plan and prioritize for their future financial solvency.
MP.5 Use appropriate tools strategically.
Mathematically proficient students consider the available tools when solving a mathematical problem. These tools might include pencil and paper, concrete models, a ruler, a protractor, a calculator, a spreadsheet, a computer algebra system, a statistical package, or dynamic geometry software. Proficient students are sufficiently familiar with tools appropriate for their grade or course to make sound decisions about when each of these tools might be helpful, recognizing both the insight to be gained and their limitations. For example, mathematically proficient high school students analyze graphs of functions and solutions generated using a graphing calculator. They detect possible errors by strategically using estimation and other mathematical knowledge. When making mathematical models, they know that technology can enable them to visualize the results of varying assumptions, explore consequences, and compare predictions with data. They are able to use technological tools to explore and deepen their understanding of concepts.
Eureka Math Module 3 Lesson 15
MP.6 Attend to precision.
Mathematically proficient students try to communicate precisely to others. They try to use clear definitions in discussion with others and in their own reasoning. They state the meaning of the symbols they choose, including using the equal sign consistently and appropriately. They are careful about specifying units of measure, and labeling axes to clarify the correspondence with quantities in a problem. They calculate accurately and efficiently, express numerical answers with a degree of precision appropriate for the problem context.
Eureka Math Module 3 Lesson 15
MP.7 Look for and make use of structure. Students extend the laws of exponents for integer exponents to rational and real number exponents. They connect how these laws are related to the properties of logarithms and understand how to rearrange an exponential equation into logarithmic form. Students analyze the structure of exponential and logarithmic functions to understand how to sketch graphs and see how the properties relate to transformations of these types of functions. They analyze the structure of expressions to reveal properties such as recognizing when a function models exponential growth versus decay. Students use the structure of equations to understand how to identify an appropriate solution
Eureka Math Module 3 Lesson 7,10

12/19/2014 Page 13 of 50
method.
MP.8 Look for and express regularity in repeated reasoning.
Students discover the properties of logarithms and the meaning of a logarithm by investigating numeric examples. They develop formulas that involve exponentials and logarithms by extending patterns and examining tables and graphs. Students generalize transformations of graphs of logarithmic functions by examining several different cases.
Eureka Math Module 3 Lesson 7,8,10,11

12/19/2014 Page 14 of 50
HS Algebra II Semester 2
Module 3: Exponential and Logarithmic Functions (45 days) Topic C: Exponential and Logarithmic Functions and their Graphs (7 Instructional Days)
The lessons covered in Topic A familiarize students with the laws and properties of real -valued exponents. In Topic B, students extend their work with exponential functions to include solving exponential equations numerically and to develop an understanding of the relationship between logarithms and exponentials.
Big Idea:
Essential Questions:
Vocabulary Invertible function, general form of a logarithmic function, general form of an exponential function
Assessment Galileo: Topic C Assessment
Standard Common Core Standards Explanations & Examples Resources
F.IF.B.4 B. Interpret functions that arise in applications in terms of context
For a function that models a relationship between two quantities, interpret key features of graphs and tables in terms of the quantities, and sketch graphs showing key features given a verbal description of the relationship. Key features include: intercepts; intervals where the function is increasing, decreasing, positive, or negative; relative maximums and minimums; symmetries; end behavior; and periodicity.
Students may be given graphs to interpret or produce graphs given an expression or table for the function, by hand or using technology.
Eureka Math Module 3 Lesson 17-18,21
F.IF.B.5 B. Interpret functions that arise in applications in terms of context
Relate the domain of a function to its graph and, where applicable, to the quantitative relationship it describes.
Eureka Math Module 3 Lesson 17-18

12/19/2014 Page 15 of 50
For example, if the function (𝑛) gives the number of person-hours it takes to assemble 𝑛 engines in a factory, then the positive integers would be an appropriate domain for the function.
F.IF.C.7e C. Analyze functions using different representation
Graph functions expressed symbolically and show key features of the graph, by hand in simple cases and using technology for more complicated cases.
e. Graph exponential and logarithmic functions, showing intercepts and end behavior, and trigonometric functions, showing period, midline, and amplitude.
Key characteristics include but are not limited to maxima, minima, intercepts, symmetry, end behavior, and asymptotes. Students may use graphing calculators or programs, spreadsheets, or computer algebra systems to graph functions.
Eureka Math Module 3 Lesson 16-18,20-21
F.BF.A.1a A. Build a function that models a relationship between two quantities
Write a function that describes a relationship between two quantities.
a. Determine an explicit expression, a recursive process, or steps for calculation from a context.
Students will analyze a given problem to determine the function expressed by identifying patterns in the function’s rate of change. They will specify intervals of increase, decrease, constancy, and, if possible, relate them to the function’s description in words or graphically. Students may use graphing calculators or programs, spreadsheets, or computer algebra systems to model functions.
Eureka Math Module 3 Lesson 22
F.BF.B.3 A. Build a function that models a relationship between two quantities
Identify the effect on the graph of replacing f(x) by f(x) + k, k f(x), f(kx), and f(x + k) for specific values of k (both positive and negative); find the value of k given the graphs. Experiment with cases and illustrate an explanation of the effects on the graph using technology. Include recognizing even and odd functions
Students will apply transformations to functions and recognize functions as even and odd. Students may use graphing calculators or programs, spreadsheets, or computer algebra systems to graph functions.
Eureka Math Module 3 Lesson 20-21
12/19/2014 Page 16 of 50
from their graphs and algebraic expressions for them.
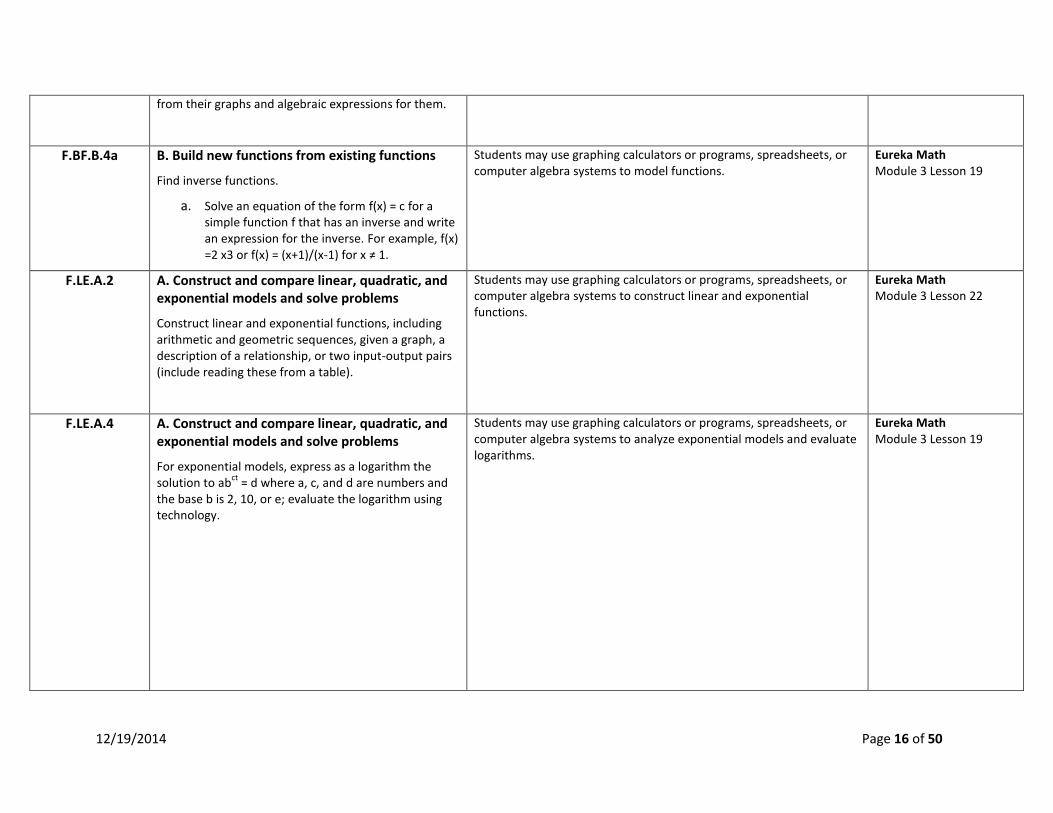
F.BF.B.4a B. Build new functions from existing functions
Find inverse functions.
a. Solve an equation of the form f(x) = c for a simple function f that has an inverse and write an expression for the inverse. For example, f(x) =2 x3 or f(x) = (x+1)/(x-1) for x ≠ 1.
Students may use graphing calculators or programs, spreadsheets, or computer algebra systems to model functions.
Eureka Math Module 3 Lesson 19
F.LE.A.2 A. Construct and compare linear, quadratic, and exponential models and solve problems
Construct linear and exponential functions, including arithmetic and geometric sequences, given a graph, a description of a relationship, or two input-output pairs (include reading these from a table).
Students may use graphing calculators or programs, spreadsheets, or computer algebra systems to construct linear and exponential functions.
Eureka Math Module 3 Lesson 22
F.LE.A.4 A. Construct and compare linear, quadratic, and exponential models and solve problems
For exponential models, express as a logarithm the solution to ab
ct = d where a, c, and d are numbers and
the base b is 2, 10, or e; evaluate the logarithm using technology.
Students may use graphing calculators or programs, spreadsheets, or computer algebra systems to analyze exponential models and evaluate logarithms.
Eureka Math Module 3 Lesson 19
12/19/2014 Page 17 of 50
MP.1 Make sense of problems and persevere in solving them.
Students make sense of rational and real number exponents and in doing so are able to apply exponential functions to solve problems involving exponential growth and decay for continuous domains such as time. They explore logarithms numerically and graphically to understand their meaning and how they can be used to solve exponential equations. Students have multiple opportunities to make connections between information presented graphically, numerically, and algebraically and search for similarities between these representations to further understand the underlying mathematical properties of exponents and logarithms. When presented with a wide variety of information related to financial planning, students make sense of the given information and use appropriate formulas to effectively plan for a long-term budget and savings plan.
Eureka Math Module 3 Lesson 20,21
MP.2 Reason abstractly and quantitatively. Students consider appropriate units when exploring the properties of exponents for very large and very small numbers. They reason about quantities when solving a wide variety of problems that can be modeled using logarithms or exponential functions. Students relate the parameters in exponential expressions to the situations they model. They write and solve equations and then interpret their solutions within the context of a problem.
Eureka Math Module 3 Lesson 20
MP.3 Construct viable arguments and critique the reasoning of others.
Mathematically proficient students understand and use stated assumptions, definitions, and previously established results in constructing arguments. They make conjectures and build a logical progression of statements to explore the truth of their conjectures. They are able to analyze situations by breaking them into cases, and can recognize and use counterexamples. They justify their conclusions, communicate them to others, and respond to the arguments of others. They reason inductively about data, making plausible arguments that take into account the context from which the data arose. Mathematically proficient students are also able to compare the effectiveness of two plausible arguments, distinguish correct logic or reasoning from that which is flawed, and—if there is a flaw in an argument—explain what it is.
Eureka Math Module 3 Lesson 16,18,20,21
MP.7 Look for and make use of structure. Students extend the laws of exponents for integer exponents to rational and real number exponents. They connect how these laws are related to the properties of logarithms and understand how to rearrange an exponential equation into logarithmic form. Students analyze the structure of exponential and logarithmic functions to
Eureka Math Module 3 Lesson 17-21

12/19/2014 Page 18 of 50
understand how to sketch graphs and see how the properties relate to transformations of these types of functions. They analyze the structure of expressions to reveal properties such as recognizing when a function models exponential growth versus decay. Students use the structure of equations to understand how to identify an appropriate solution method.
MP.8 Look for and express regularity in repeated reasoning.
Students discover the properties of logarithms and the meaning of a logarithm by investigating numeric examples. They develop formulas that involve exponentials and logarithms by extending patterns and examining tables and graphs. Students generalize transformations of graphs of logarithmic functions by examining several different cases.
Eureka Math Module 3 Lesson 18,20,21

12/19/2014 Page 19 of 50
HS Algebra II Semester 2
Module 3: Exponential and Logarithmic Functions (45 days) Topic D: Using Logarithms in Modeling Situations (6 Instructional Days)
This topic opens with a simulation and modeling activity where students start with one bean, roll it out of a cup onto the table, and add more beans each time the marked side is up. While clearly an exponential model, the lesson unfolds by having students discover this relationship, without exp licitly stating that the results are exponential, by examining patterns when the data is represented numerically and graphically. Students blend what they know about probability and exponential functions to interpret the parameters and 𝑏𝑏 in the functions 𝑓𝑓(𝑡𝑡)= (𝑏𝑏𝑡𝑡) that they find to model their experimental data (F-LE.B.5, A-CED.A.2). In both Algebra I and Lesson 6 in this module, students had to solve exponential equations when modeling real -world situations numerically or graphically. Lesson 24 shows students how to use logarithms to solve these types of equations analytically and makes the connections between numeric, graphical, and analytical ap proaches explicit, invoking the related standards F-LE.A.4, F-BF.B.4a, and A-REI.D.11. Students will be encouraged to use multiple approaches to solve equations generated in the next several lessons. In Lessons 25 to 27, a general growth/decay rate formula is presented to students to help construct models from data and desc riptions of situations. Students must use properties of exponents to rewrite exponential expressions in order to interpret the properties of the function (F-IF.C.8b). For example, in Lesson 27, students compare the initial populations and annual growth rates of population functions given in the forms 𝐸𝐸(𝑡𝑡)=281.4(1.0093)𝑡𝑡−100, 𝑓𝑓(𝑡𝑡)=81.1(1.0126)𝑡𝑡, and 𝑔𝑔(𝑡𝑡)=76.2(13.6)𝑡𝑡/10. Many of the situations and problems presented here were first encountered in Module 3 of Algebra I; students are now able to solve equations involving exponents that they could only estimate previously, such as finding the time when the population of the United States is expected to surpass a half -billion people. Students answer application questions in the context of the situation. They use technology to evaluate logarithms of base 10 and 𝑒𝑒. Additionally, Lesson 25 begins to develop geometric sequences that will be needed for the financial content in the next Topic (F-BF.A.2). Lesson 26 continues developing the skills of distinguishing between situations that require exponential-vs-linear models (F-LE.A.1), and Lesson 27 continues the work with geometric sequences that started in Lesson 25 (F-IF.B.3, F-BF.A.1a). Lesson 28 closes this topic and addresses F-BF.A.1b by revisiting Newton’s Law of Cooling, a formula that involves the sum of an exponential function and a constant function. Students first learned about this formula in Algebra I but now that they are armed with logarithms and have more ex perience understanding how transformations affect the graph of a function, they can find the precise value of the decay constant using logarithms and, thus, can solve problems related to this formula more precisely and with greater depth of understanding.
Big Idea:
Essential Questions:
Vocabulary
Assessment Galileo: Topic D Assessment
Standard Common Core Standards Explanations & Examples Resources
A.SSE.B.3c B. Write expressions in equivalent forms to solve problems
Eureka Math Module 3 Lesson 26

12/19/2014 Page 20 of 50
Choose and produce an equivalent form of an expression to reveal and explain properties of the quantity represented by the expression.
c. Use the properties of exponents to transform expressions for exponential functions. For example the expression 1.15t can be rewritten as (1.15
1/12)
12t ≈ 1.012
12t to reveal the approximate
equivalent monthly interest rate if the annual rate is 15%.
A.CED.A.1 A. Create equations that describe numbers or relationships
Create equations and inequalities in one variable and use them to solve problems. Include equations arising from linear and quadratic functions, and simple rational and exponential functions.
Equations can represent real world and mathematical problems. Include equations and inequalities that arise when comparing the values of two different functions, such as one describing linear growth and one describing exponential growth.
Eureka Math Module 3 Lesson 26-27
A.REI.D.11 D. Represent and solve equations and inequalities graphically
Explain why the x-coordinates of the points where the graphs of the equations y = f(x) and y = g(x) intersect are the solutions of the equation f(x) = g(x); find the solutions approximately, e.g., using technology to graph the functions, make tables of values, or find successive approximations. Include cases where f(x) and/or g(x) are linear, polynomial, rational, absolute value, exponential, and logarithmic functions.
Students need to understand that numerical solution methods (data in a table used to approximate an algebraic function) and graphical solution methods may produce approximate solutions, and algebraic solution methods produce precise solutions that can be represented graphically or numerically. Students may use graphing calculators or programs to generate tables of values, graph, or solve a variety of functions.
Eureka Math Module 3 Lesson 24
F.IF.A.3 A. Understand the concept of a function and use of function notation
Recognize that sequences are functions, sometimes defined recursively, whose domain is a subset of the integers. For example, the Fibonacci sequence is
Eureka Math Module 3 Lesson 26

12/19/2014 Page 21 of 50
defined recursively by f(0) = f(1) = 1, f(n+1) = f(n) + f(n-1) for n ≥ 1.
F.IF.B.6 B. Interpret functions that arise in applications in terms of context
Calculate and interpret the average rate of change of a function (presented symbolically or as a table) over a specified interval. Estimate the rate of change from a graph.
The average rate of change of a function y = f(x) over an interval [a,b] is
𝑥
𝑓(𝑏) 𝑓( )
𝑏 . In addition to finding average rates of change from
functions given symbolically, graphically, or in a table, Students may collect data from experiments or simulations (ex. falling ball, velocity of a car, etc.) and find average rates of change for the function modeling the situation.
Eureka Math Module 3 Lesson 27
F.IF.C.8b C. Analyze functions using different representation Write a function defined by an expression in different but equivalent forms to reveal and explain different properties of the function.
b. Use the properties of exponents to interpret expressions for exponential functions. For example, identify percent rate of ch ange in functions such as =(1.02)𝑡, =(0.97)𝑡, =(1.01)
12𝑡, =(1.2)𝑡/10
, and classify them as representing exponential growth or decay.
Tasks include knowing and applying
Eureka Math Module 3 Lesson 23,27
F.IF.C.9 C. Analyze functions using different representation
Compare properties of two functions each represented in a different way (algebraically, graphically, numerically in tables, or by verbal descriptions). For example, given a graph of one quadratic function and an algebraic expression for another, say which has the larger maximum.
In Algebra II, tasks may involve polynomial, exponential, logarithmic, and trigonometric functions. Students should focus on applications and how key features relate to characteristics of a situation, making selection of a particular type of function model appropriate.
Eureka Math Module 3 Lesson 27,29
12/19/2014 Page 22 of 50
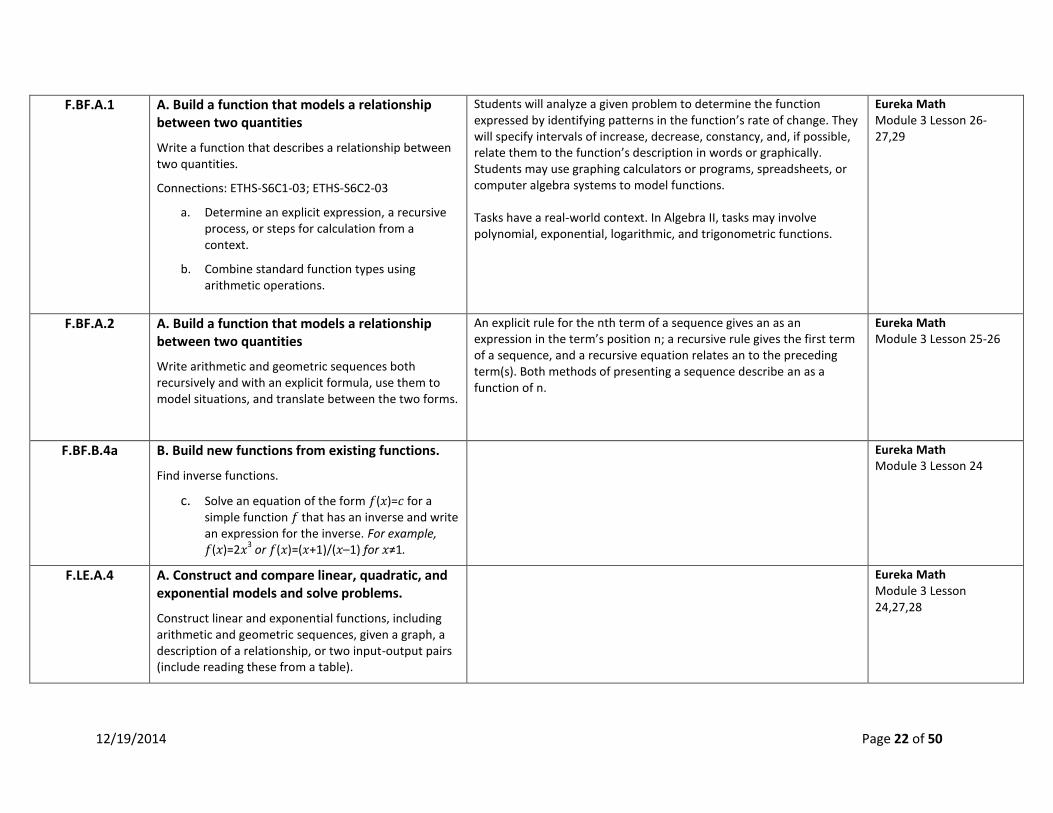
F.BF.A.1 A. Build a function that models a relationship between two quantities
Write a function that describes a relationship between two quantities.
Connections: ETHS-S6C1-03; ETHS-S6C2-03
a. Determine an explicit expression, a recursive process, or steps for calculation from a context.
b. Combine standard function types using arithmetic operations.
Students will analyze a given problem to determine the function expressed by identifying patterns in the function’s rate of change. They will specify intervals of increase, decrease, constancy, and, if possible, relate them to the function’s description in words or graphically. Students may use graphing calculators or programs, spreadsheets, or computer algebra systems to model functions. Tasks have a real‐world context. In Algebra II, tasks may involve polynomial, exponential, logarithmic, and trigonometric functions.
Eureka Math Module 3 Lesson 26-27,29
F.BF.A.2 A. Build a function that models a relationship between two quantities
Write arithmetic and geometric sequences both recursively and with an explicit formula, use them to model situations, and translate between the two forms.
An explicit rule for the nth term of a sequence gives an as an expression in the term’s position n; a recursive rule gives the first term of a sequence, and a recursive equation relates an to the preceding term(s). Both methods of presenting a sequence describe an as a function of n.
Eureka Math Module 3 Lesson 25-26
F.BF.B.4a B. Build new functions from existing functions.
Find inverse functions.
c. Solve an equation of the form 𝑓(𝑥)=𝑐 for a simple function 𝑓 that has an inverse and write an expression for the inverse. For example, 𝑓(𝑥)=2𝑥
3 or 𝑓(𝑥)=(𝑥+1)/(𝑥–1) for 𝑥≠1.
Eureka Math Module 3 Lesson 24
F.LE.A.4 A. Construct and compare linear, quadratic, and exponential models and solve problems.
Construct linear and exponential functions, including arithmetic and geometric sequences, given a graph, a description of a relationship, or two input-output pairs (include reading these from a table).
Eureka Math Module 3 Lesson 24,27,28

12/19/2014 Page 23 of 50
F.LE.B.5 B. Interpret expressions for functions in terms of the situation they model
Interpret the parameters in a linear or exponential function in terms of a context.
Students may use graphing calculators or programs, spreadsheets, or computer algebra systems to model and interpret parameters in linear, quadratic or exponential functions.
Eureka Math Module 3 Lesson 23
MP.1 Make sense of problems and persevere in solving them.
Students make sense of rational and real number exponents and in doing so are able to apply exponential functions to solve problems involving exponential growth and decay for continuous domains such as time. They explore logarithms numerically and graphically to understand their meaning and how they can be used to solve exponential equations. Students have multiple opportunities to make connections between information presented graphically, numerically, and algebraically and search for similarities between these representations to further understand the underlying mathematical properties of exponents and logarithms. When presented with a wide variety of information related to financial planning, students make sense of the given information and use appropriate formulas to effectively plan for a long-term budget and savings plan.
Eureka Math Module 3 Lesson 28
MP.2 Reason abstractly and quantitatively. Students consider appropriate units when exploring the properties of exponents for very large and very small numbers. They reason about quantities when solving a wide variety of problems that can be modeled using logarithms or exponential functions. Students relate the parameters in exponential expressions to the situations they model. They write and solve equations and then interpret their solutions within the context of a problem.
Eureka Math Module 3 Lesson 23-26,28
MP.3 Construct viable arguments and critique the reasoning of others.
Mathematically proficient students understand and use stated assumptions, definitions, and previously established results in constructing arguments. They make conjectures and build a logical progression of statements to explore the truth of their conjectures. They are able to analyze situations by breaking them into cases, and can recognize and use counterexamples. They justify their conclusions, communicate them to others, and respond to the arguments of others. They reason inductively about data, making plausible arguments that take into account the context from which the data arose. Mathematically proficient students are also able to compare the effectiveness of two plausible arguments, distinguish correct logic or
Eureka Math Module 3 Lesson 25,27,28

12/19/2014 Page 24 of 50
reasoning from that which is flawed, and—if there is a flaw in an argument—explain what it is.
MP.4 Model with mathematics. Students use exponential functions to model situations involving exponential growth and decay. They model the number of digits needed to assign identifiers using logarithms. They model exponential growth using a simulation with collected data. The application of exponential functions and logarithms as a means to solve an exponential equation is a focus of several lessons that deal with financial literacy and planning a budget. Here, students must make sense of several different quantities and their relationships as they plan and prioritize for their future financial solvency.
Eureka Math Module 3 Lesson 26
MP.7 Look for and make use of structure. Students extend the laws of exponents for integer exponents to rational and real number exponents. They connect how these laws are related to the properties of logarithms and understand how to rearrange an exponential equation into logarithmic form. Students analyze the structure of exponential and logarithmic functions to understand how to sketch graphs and see how the properties relate to transformations of these types of functions. They analyze the structure of expressions to reveal properties such as recognizing when a function models exponential growth versus decay. Students use the structure of equations to understand how to identify an appropriate solution method.
Eureka Math Module 3 Lesson 23,26,27
MP.8 Look for and express regularity in repeated reasoning.
Students discover the properties of logarithms and the meaning of a logarithm by investigating numeric examples. They develop formulas that involve exponentials and logarithms by extending patterns and examining tables and graphs. Students generalize transformations of graphs of logarithmic functions by examining several different cases.
Eureka Math Module 3 Lesson 26

12/19/2014 Page 25 of 50
HS Algebra II Semester 2
Module 3: Exponential and Logarithmic Functions (45 days) Topic E: Geometric Series and Finance (5 Instructional Days)
Topic E is a culminating series of lessons driven by MP.4, Modeling with Mathematics. Students apply what they have learned about mathematical models and exponential growth to financial literacy, while developing and practicing the formula for the sum of a finite geometric series.
Big Idea:
Essential Questions:
Vocabulary Series, geometric series, sum of a finite geometric series, future value of an annuity, present value of an annuity, amortization
Assessment Galileo: Topic E Assessment
Standard Common Core Standards Explanations & Examples Resources
A.SSE.B.4
B. Write expressions in equivalent forms to solve problems Derive the formula for the sum of a finite geometric series (when the common ratio is not 1), and use the formula to solve problems. For example, calculate mortgage payments.
Eureka Math Module 3 Lesson 29-33
F.IF.C.7e C. Analyze functions using different representation
Graph functions expressed symbolically and show key features of the graph, by hand in simple cases and using technology for more complicated cases.
e. Graph exponential and logarithmic functions, showing intercepts and end behavior, and trigonometric functions,
Key characteristics include but are not limited to maxima, minima, intercepts, symmetry, end behavior, and asymptotes. Students may use graphing calculators or programs, spreadsheets, or computer algebra systems to graph functions.
Eureka Math Module 3 Lesson 31

12/19/2014 Page 26 of 50
showing period, midline, and amplitude.
F.IF.C.8b
C. Analyze functions using different representation Write a function defined by an expression in different but equivalent forms to reveal and explain different properties of the function.
d. Use the properties of exponents to interpret expressions for exponential functions. For example, identify percent rate of ch ange in functions such as =(1.02)𝑡, =(0.97)𝑡, =(1.01)
12𝑡, =(1.2)𝑡/10
, and classify them as representing exponential growth or decay.
Tasks include knowing and applying
Eureka Math Module 3 Lesson 29-33
F.IF.C.9
C. Analyze functions using different representation Compare properties of two functions each represented in a different way (algebraically, graphically, numerically in tables, or by verbal descriptions). For example, given a graph of one quadratic function and an algebraic expression for another, say which has the larger maximum.
In Algebra II, tasks may involve polynomial, exponential, logarithmic, and trigonometric functions. Students should focus on applications and how key features relate to characteristics of a situation, making selection of a particular type of function model appropriate.
Eureka Math Module 3 Lesson 30-32
F.BF.A.1b
A. Build a function that models a relationship between two quantities Write a function that describes a relationship between two quantities.
b. Combine standard function types using arithmetic operations.
Students will analyze a given problem to determine the function expressed by identifying patterns in the function’s rate of change. They will specify intervals of increase, decrease, constancy, and, if possible, relate them to the function’s description in words or graphically. Students may use graphing calculators or programs, spreadsheets, or computer algebra systems to model functions.
Eureka Math Module 3 Lesson 30,33
F.BF.A.2 A. Build a function that models a relationship between two quantities
Eureka Math Module 3 Lesson 29

12/19/2014 Page 27 of 50
Write arithmetic and geometric sequences both recursively and with an explicit formula, use them to model situations, and translate between the two forms.
F.LE.B.5 B. Interpret expressions for functions in terms of the situation they model
Interpret the parameters in a linear or exponential function in terms of a context.
Students may use graphing calculators or programs, spreadsheets, or computer algebra systems to model and interpret parameters in linear, quadratic or exponential functions.
Eureka Math Module 3 Lesson 31
MP.2 Reason abstractly and quantitatively.
Students consider appropriate units when exploring the properties of exponents for very large and very small numbers. They reason about quantities when solving a wide variety of problems that can be modeled using logarithms or exponential functions. Students relate the parameters in exponential expressions to the situations they model. They write and solve equations and then interpret their solutions within the context of a problem.
Eureka Math Module 3 Lesson 29-30
MP.3 Construct viable arguments and critique the reasoning of others.
Mathematically proficient students understand and use stated assumptions, definitions, and previously established results in constructing arguments. They make conjectures and build a logical progression of statements to explore the truth of their conjectures. They are able to analyze situations by breaking them into cases, and can recognize and use counterexamples. They justify their conclusions, communicate them to others, and respond to the arguments of others. They reason inductively about data, making plausible arguments that take into account the context from which the data arose. Mathematically proficient students are also able to compare the effectiveness of two plausible arguments, distinguish correct logic or reasoning from that which is flawed, and—if there is a flaw in an argument—explain what it is.
Eureka Math Module 3 Lesson 33
MP.4 Model with mathematics. Students use exponential functions to model situations involving exponential growth and decay. They model the number of digits needed to assign identifiers using logarithms. They model exponential growth using a simulation with collected data. The application of exponential functions and logarithms as a means to solve an exponential equation is a focus of several lessons that deal with
Eureka Math Module 3 Lesson 29-30

12/19/2014 Page 28 of 50
financial literacy and planning a budget. Here, students must make sense of several different quantities and their relationships as they plan and prioritize for their future financial solvency.
MP.7 Look for and make use of structure. Students extend the laws of exponents for integer exponents to rational and real number exponents. They connect how these laws are related to the properties of logarithms and understand how to rearrange an exponential equation into logarithmic form. Students analyze the structure of exponential and logarithmic functions to understand how to sketch graphs and see how the properties relate to transformations of these types of functions. They analyze the structure of expressions to reveal properties such as recognizing when a function models exponential growth versus decay. Students use the structure of equations to understand how to identify an appropriate solution method.
Eureka Math Module 3 Lesson 29
MP.8 Look for and express regularity in repeated reasoning.
Students discover the properties of logarithms and the meaning of a logarithm by investigating numeric examples. They develop formulas that involve exponentials and logarithms by extending patterns and examining tables and graphs. Students generalize transformations of graphs of logarithmic functions by examining several different cases.
Eureka Math Module 3 Lesson 29,30
12/19/2014 Page 29 of 50
HS Algebra II Semester 2
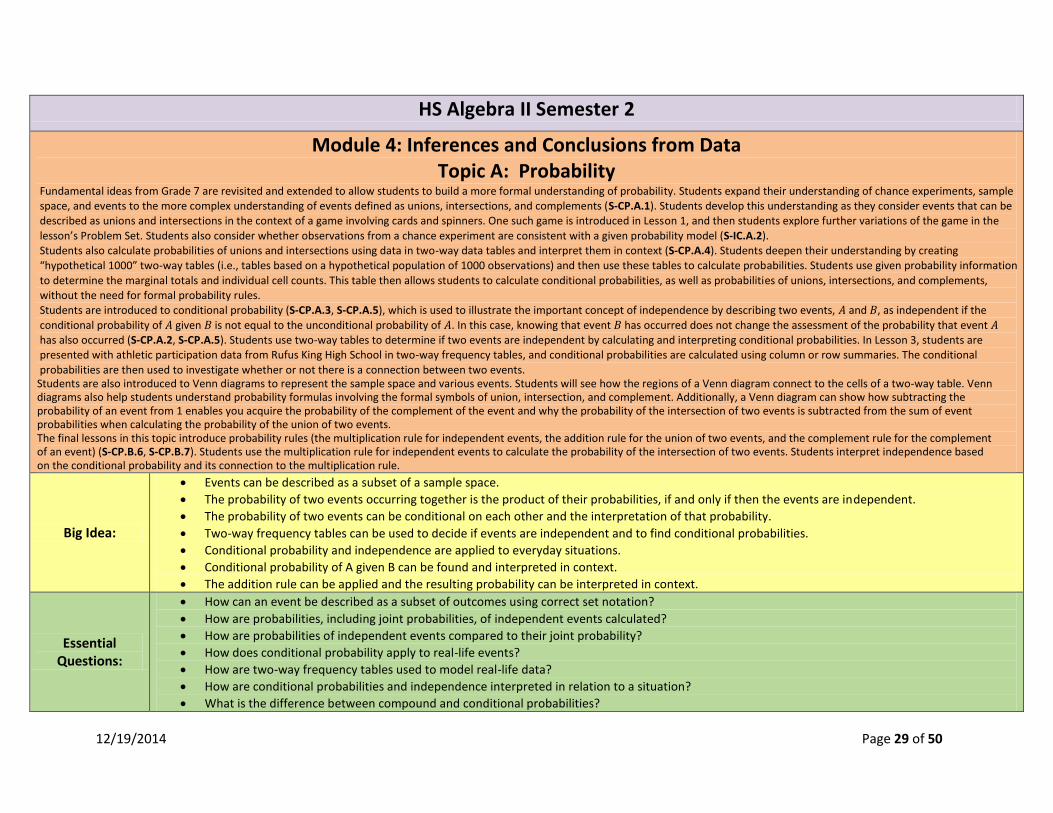
Module 4: Inferences and Conclusions from Data Topic A: Probability
Fundamental ideas from Grade 7 are revisited and extended to allow students to build a more formal understanding of probability. Students expand their understanding of chance experiments, sample space, and events to the more complex understanding of events defined as unions, intersections, and complements (S-CP.A.1). Students develop this understanding as they consider events that can be described as unions and intersections in the context of a game involving cards and spinners. One such game is introduced in Lesson 1, and then students explore further variations of the game in the
lesson’s Problem Set. Students also consider whether observations from a chance experiment are consistent with a given probability model (S-IC.A.2). Students also calculate probabilities of unions and intersections using data in two-way data tables and interpret them in context (S-CP.A.4). Students deepen their understanding by creating “hypothetical 1000” two-way tables (i.e., tables based on a hypothetical population of 1000 observations) and then use these tables to calculate probabilities. Students use given probability information
to determine the marginal totals and individual cell counts. This table then allows students to calculate conditional probabilities, as well as probabilities of unions, intersections, and complements, without the need for formal probability rules. Students are introduced to conditional probability (S-CP.A.3, S-CP.A.5), which is used to illustrate the important concept of independence by describing two events, 𝐴 and 𝐵, as independent if the
conditional probability of 𝐴 given 𝐵 is not equal to the unconditional probability of 𝐴. In this case, knowing that event 𝐵 has occurred does not change the assessment of the probability that event 𝐴 has also occurred (S-CP.A.2, S-CP.A.5). Students use two-way tables to determine if two events are independent by calculating and interpreting conditional probabilities. In Lesson 3, students are presented with athletic participation data from Rufus King High School in two-way frequency tables, and conditional probabilities are calculated using column or row summaries. The conditional
probabilities are then used to investigate whether or not there is a connection between two events. Students are also introduced to Venn diagrams to represent the sample space and various events. Students will see how the regions of a Venn diagram connect to the cells of a two-way table. Venn diagrams also help students understand probability formulas involving the formal symbols of union, intersection, and complement. Additionally, a Venn diagram can show how subtracting the probability of an event from 1 enables you acquire the probability of the complement of the event and why the probability of the intersection of two events is subtracted from the sum of event probabilities when calculating the probability of the union of two events. The final lessons in this topic introduce probability rules (the multiplication rule for independent events, the addition rule for the union of two events, and the complement rule for the complement of an event) (S-CP.B.6, S-CP.B.7). Students use the multiplication rule for independent events to calculate the probability of the intersection of two events. Students interpret independence based on the conditional probability and its connection to the multiplication rule.
Big Idea:
Events can be described as a subset of a sample space.
The probability of two events occurring together is the product of their probabilities, if and only if then the events are independent.
The probability of two events can be conditional on each other and the interpretation of that probability.
Two-way frequency tables can be used to decide if events are independent and to find conditional probabilities.
Conditional probability and independence are applied to everyday situations.
Conditional probability of A given B can be found and interpreted in context.
The addition rule can be applied and the resulting probability can be interpreted in context.
Essential Questions:
How can an event be described as a subset of outcomes using correct set notation?
How are probabilities, including joint probabilities, of independent events calculated?
How are probabilities of independent events compared to their joint probability?
How does conditional probability apply to real-life events?
How are two-way frequency tables used to model real-life data?
How are conditional probabilities and independence interpreted in relation to a situation?
What is the difference between compound and conditional probabilities?

12/19/2014 Page 30 of 50
How is the probability of event (A or B) found?
Vocabulary Sample space, event, probability of an event, two-way frequency table, hypothetical 1000 two-way table, conditional probability, independent event, complement rule, addition rule, disjoint events
Assessments Galileo: Module 4 Pre-assessment of Foundational Skills, Topic A assessment
Standard Common Core Standards Explanations & Examples Resources
S.IC.A.2
A. Understand and evaluate random processes underlying statistical experiments. Decide if a specified model is consistent with results from a given data-generating process, e.g., using simulation. For example, a model says a spinning coin falls heads up with probability 0.5. Would a result of 5 tails in a row cause you to question the model?
Eureka Math Module 4 Lesson 1
S.CP.A.1
A. Understand independence and conditional probability and use them to interpret data Describe events as subsets of a sample space (the set of outcomes) using characteristics (or categories) of the outcomes, or as unions, intersections, or complements of other events (“or,” “and,” “not”).
Intersection: The intersection of two sets A and B is the set of elements that are common to both set A and set B. It is denoted by A ∩ B and is read ‘A intersection B’.
A ∩ B in the diagram is {1, 5}
this means: BOTH/AND
Union: The union of two sets A and B is the set of elements, which are
Eureka Math Module 4 Lesson 5,6,7

12/19/2014 Page 31 of 50
in A or in B or in both. It is denoted by A ∪ B and is read ‘A union B’.
A ∪ B in the diagram is {1, 2, 3, 4, 5, 7}
this means: EITHER/OR/ANY
could be both
Complement: The complement of the set A ∪B is the set of elements that are members of the universal set U but are not in A ∪ B. It is denoted by (A ∪ B )’
(A ∪ B )’ in the diagram is {8}
S.CP.A.2 A. Understand independence and conditional
probability and use them to interpret data Understand that two events A and B are independent if the probability of A and B occurring together is the product of their probabilities, and use this characterization to determine if they are independent.
S.CP.2 Identify two events as independent or not. Explain properties of Independence and Conditional Probabilities in context and simple English.
Eureka Math Module 4 Lesson 4,6

12/19/2014 Page 32 of 50
S.CP.A.3 A. Understand independence and conditional probability and use them to interpret data Understand the conditional probability of A given B as P(A and B)/P(B), and interpret independence of A and B as saying that the conditional probability of A given B is the same as the probability of A, and the conditional probability of B given A is the same as the probability of B.
S.CP.3 Define and calculate conditional probabilities. Use the Multiplication Principal to decide if two events are independent and to calculate conditional probabilities.
Eureka Math Module 4 Lesson 3,4,6
S.CP.A.4 A. Understand independence and conditional probability and use them to interpret data Construct and interpret two-way frequency tables of data when two categories are associated with each
Students may use spreadsheets, graphing calculators, and simulations to create frequency tables and conduct analyses to determine if events are independent or determine approximate conditional probabilities.
Eureka Math Module 4 Lesson 2,3,4

12/19/2014 Page 33 of 50
object being classified. Use the two-way table as a sample space to decide if events are independent and to approximate conditional probabilities. For example, collect data from a random sample of students in your school on their favorite subject among math, science, and English. Estimate the probability that a randomly selected student from your school will favor science given that the student is in tenth grade. Do the same for other subjects and compare the results.
S.CP.A.5 A. Understand independence and conditional probability and use them to interpret data Recognize and explain the concepts of conditional
Examples:
What is the probability of drawing a heart from a standard deck of cards on a second draw, given that a heart was drawn on the first draw and not replaced? Are these events
Eureka Math Module 4 Lesson 4-6
12/19/2014 Page 34 of 50
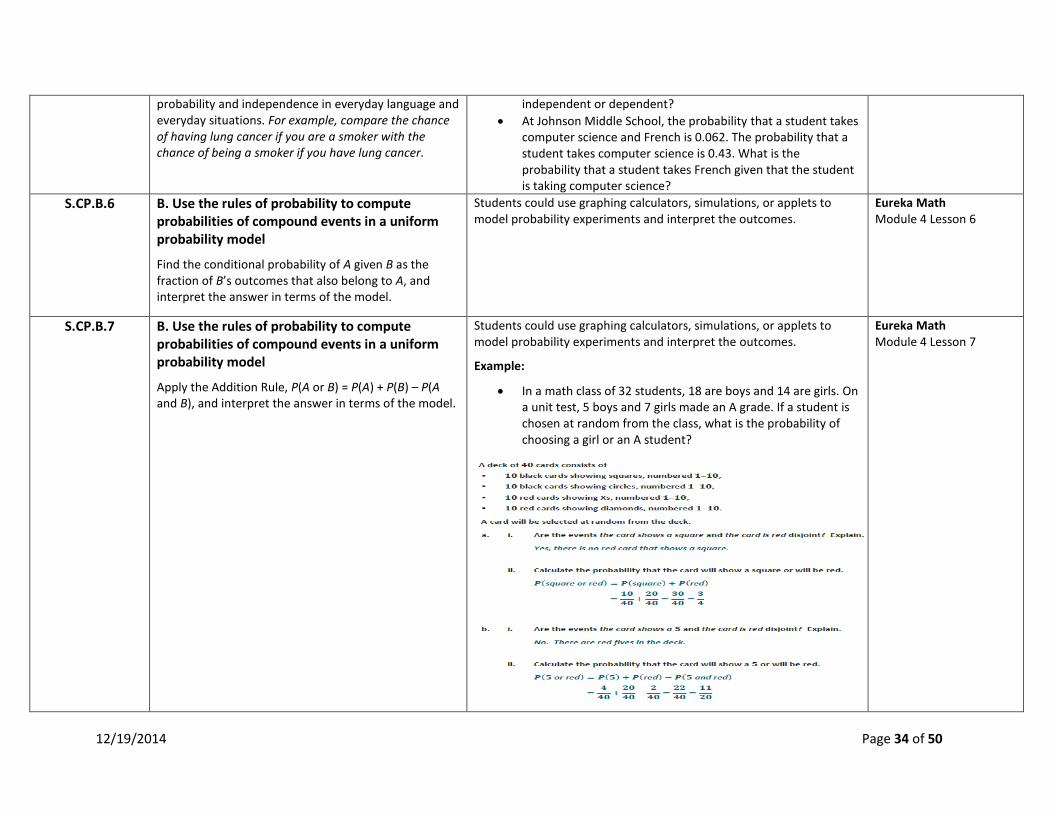
probability and independence in everyday language and everyday situations. For example, compare the chance of having lung cancer if you are a smoker with the chance of being a smoker if you have lung cancer.
independent or dependent?
At Johnson Middle School, the probability that a student takes computer science and French is 0.062. The probability that a student takes computer science is 0.43. What is the probability that a student takes French given that the student is taking computer science?
S.CP.B.6 B. Use the rules of probability to compute probabilities of compound events in a uniform probability model
Find the conditional probability of A given B as the fraction of B’s outcomes that also belong to A, and interpret the answer in terms of the model.
Students could use graphing calculators, simulations, or applets to model probability experiments and interpret the outcomes.
Eureka Math Module 4 Lesson 6
S.CP.B.7 B. Use the rules of probability to compute probabilities of compound events in a uniform probability model
Apply the Addition Rule, P(A or B) = P(A) + P(B) – P(A and B), and interpret the answer in terms of the model.
Students could use graphing calculators, simulations, or applets to model probability experiments and interpret the outcomes.
Example:
In a math class of 32 students, 18 are boys and 14 are girls. On a unit test, 5 boys and 7 girls made an A grade. If a student is chosen at random from the class, what is the probability of choosing a girl or an A student?
Eureka Math Module 4 Lesson 7

12/19/2014 Page 35 of 50
MP.1 Make sense of problems and persevere in solving them.
Mathematically proficient students start by explaining to themselves the meaning of a problem and looking for entry points to its solution. They analyze givens, constraints, relationships, and goals. They make conjectures about the form and meaning of the solution and plan a solution pathway rather than simply jumping into a solution attempt. They consider analogous problems, and try special cases and simpler forms of the original problem in order to gain insight into its solution. They monitor and evaluate their progress and change course if necessary. Mathematically proficient students check their answers to problems using a different method, and they continually ask themselves, "Does this make sense?" They can understand the approaches of others to solving complex problems and identify correspondences between different approaches.
Eureka Math Module 4 Lesson 5,7
MP.2 Reason abstractly and quantitatively. Students use data from a sample to estimate a population mean or proportion and generalize from a sample to the population. They associate a margin of error with estimates based on a sample and interpret them in the context of generalizing from a sample to the population. Students also make conjectures or claims about independence and use arguments based on probabilities to support them.
Eureka Math Module 4 Lesson 1-5
MP.3 Construct viable arguments and critique the reasoning of others.
Students test conjectures about treatment differences in the context of a statistical experiment. Students critique and evaluate reports based on data from random samples and reports based on data from experiments. Students frequently develop conjectures and use statistical reasoning to evaluate them.
Eureka Math Module 4 Lesson 1,2,4
MP.4 Model with mathematics. Students use smooth curves to model data distributions. Students use the normal distribution as a model in order to answer questions about a data distribution. Students use probability models to describe real-world contexts.
Eureka Math Module 4 Lesson 6
MP.8 Look for and express regularity in repeated reasoning.
Mathematically proficient students notice if calculations are repeated, and look both for general methods and for shortcuts. As they work to solve a problem, mathematically proficient students maintain oversight of the process, while attending to the details. They continually evaluate the reasonableness of their intermediate results.
Eureka Math Module 4 Lesson 6

12/19/2014 Page 36 of 50
HS Algebra II Semester 2
Module 4: Inferences and Conclusions from Data Topic B: Modeling Data Distributions
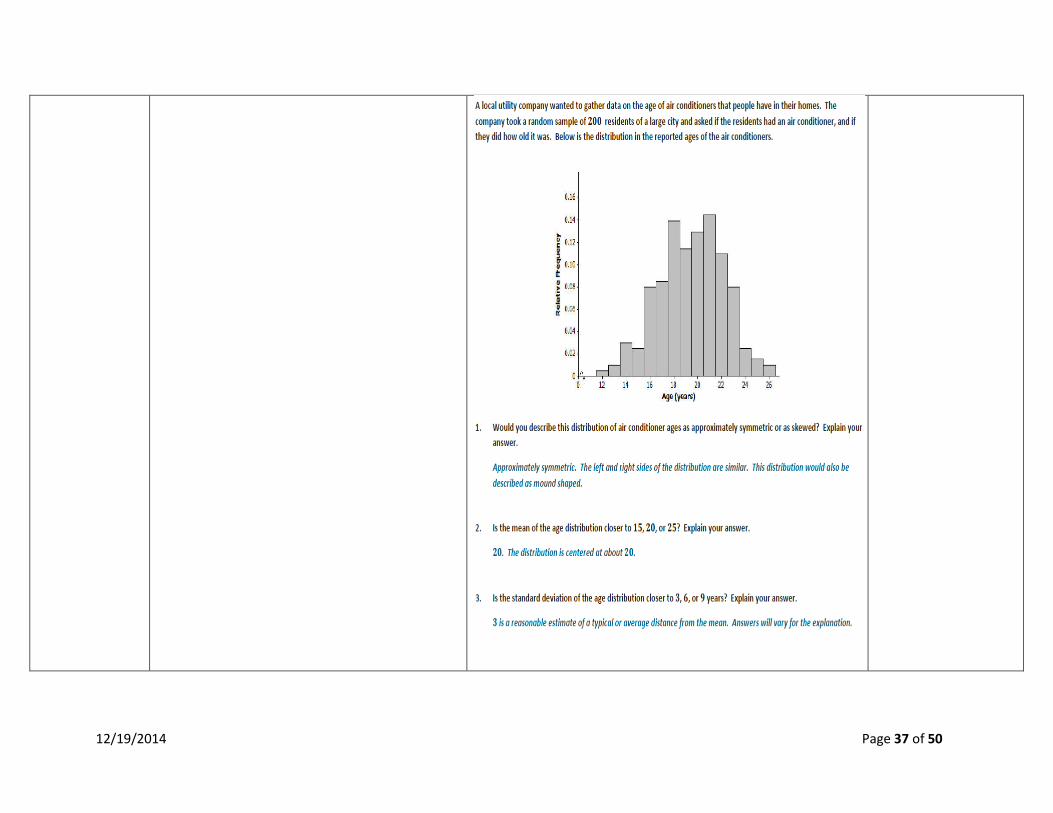
This topic introduces students to the idea of using a smooth curve to model a data distribution, eventually leading to using the normal distribution to model data distributions that are bell shaped and symmetric. Many naturally occurring variables, such as arm span, weight, reaction times, and standardized test scores, have distributions that are well described by a normal curve. Students begin by reviewing their previous work with shape, center, and variability. Students use the mean and standard deviation to describe center and variability for a data distribution that is approximately symmetric. This provides a foundation for selecting an appropriate normal distribution to model a given data distribution. Students learn to draw a smooth curve that could be used to model a given data distribution. A smooth curve is first used to model a relative-frequency histogram, which shows that the area under the curve represents the approximate proportion of data falling in a given interval. Properties of the normal distribution are introduced by asking students to distinguish between reasonable and unreasonable data distributions for using a normal distribution model. Students use tables and technology to calculate normal probabilities. They work with graphing calculators, tables of normal curve areas, and spreadsheets to calculate probabilities in the examples and exercises provided (S-ID.A.4).
Big Idea:
Statistics is a process of making inferences.
The mean and standard deviation of a data set is used to fit a normal distribution.
Essential Questions:
How is a data set fit to a normal curve?
Vocabulary Standard deviation, deviations, symmetric, skewed, center, shape, spread, normal curve, mean, z scores, normal distribution, normal probability
Assessments Galileo: Topic B Assessment
Standard Common Core Standards Explanations & Examples Resources
S.ID.A.4
A. Summarize, represent, and interpret data on a single count or measurement variable Use the mean and standard deviation of a data set to fit it to a normal distribution and to estimate population percentages. Recognize that there are data sets for which such a procedure is not appropriate. Use calculators, spreadsheets, and tables to estimate areas under the normal curve.
Students may use spreadsheets, graphing calculators, statistical software and tables to analyze the fit between a data set and normal distributions and estimate areas under the curve.
Eureka Math Module 4 Lesson 8-11
12/19/2014 Page 37 of 50

12/19/2014 Page 38 of 50

12/19/2014 Page 39 of 50

12/19/2014 Page 40 of 50
MP.2 Reason abstractly and quantitatively. Students use data from a sample to estimate a population mean
or proportion and generalize from a sample to the population. They associate a margin of error with estimates based on a
Eureka Math Module 4 Lesson 8

12/19/2014 Page 41 of 50
sample and interpret them in the context of generalizing from a sample to the population. Students also make conjectures or claims about independence and use arguments based on probabilities to support them.
MP.3
Construct viable arguments and critique the reasoning of others.
Students test conjectures about treatment differences in the context of a statistical experiment. Students critique and evaluate reports based on data from random samples and reports based on data from experiments. Students frequently develop conjectures and use statistical reasoning to evaluate them.
Eureka Math Module 4 Lesson 10
MP.4
Model with mathematics. Students use smooth curves to model data distributions. Students use the normal distribution as a model in order to answer questions about a data distribution. Students use probability models to describe real-world contexts.
Eureka Math Module 4 Lesson 9-11
MP.5
Use appropriate tools strategically. Students use technology to carry out simulations in order to study sampling variability. Students also use technology to compute estimates of population characteristics (such as the mean and standard deviation) and to calculate margin of error. Students also use simulation to investigate statistical significance in the context of comparing treatments in a statistical experiment.
Eureka Math Module 4 Lesson 9,11
12/19/2014 Page 42 of 50
HS Algebra II Semester 2
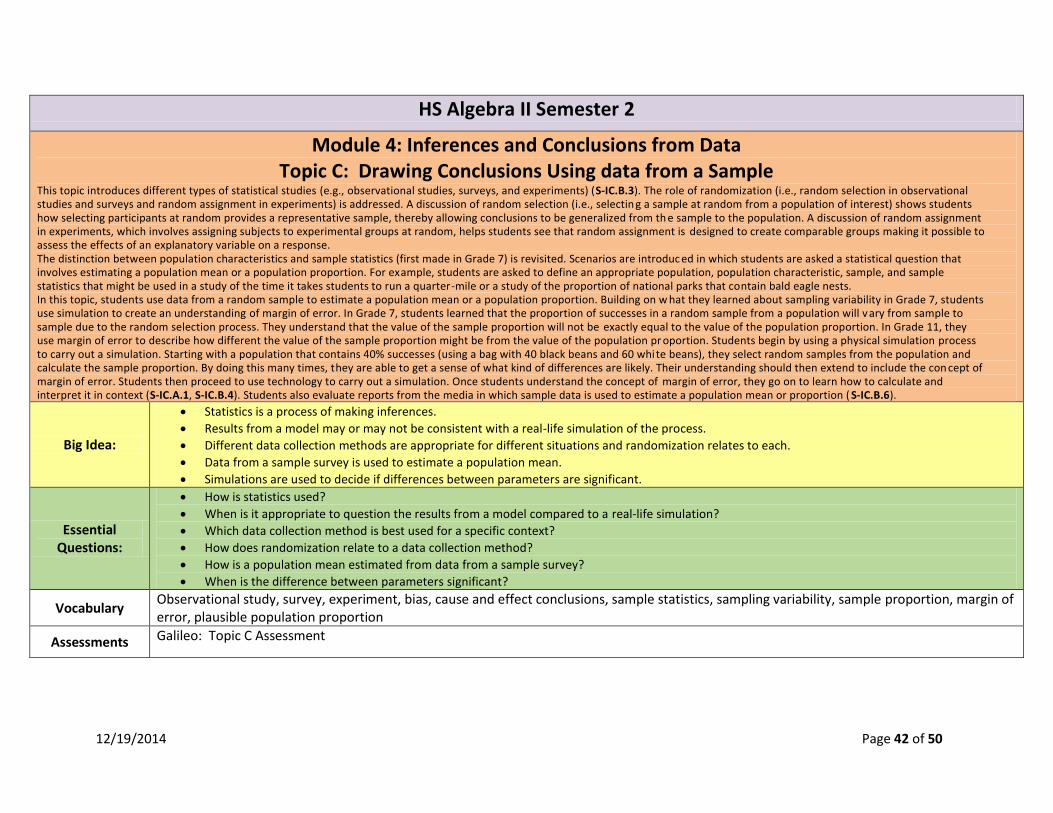
Module 4: Inferences and Conclusions from Data Topic C: Drawing Conclusions Using data from a Sample
This topic introduces different types of statistical studies (e.g., observational studies, surveys, and experiments) (S-IC.B.3). The role of randomization (i.e., random selection in observational studies and surveys and random assignment in experiments) is addressed. A discussion of random selection (i.e., selectin g a sample at random from a population of interest) shows students how selecting participants at random provides a representative sample, thereby allowing conclusions to be generalized from th e sample to the population. A discussion of random assignment in experiments, which involves assigning subjects to experimental groups at random, helps students see that random assignment is designed to create comparable groups making it possible to assess the effects of an explanatory variable on a response. The distinction between population characteristics and sample statistics (first made in Grade 7) is revisited. Scenarios are introduc ed in which students are asked a statistical question that involves estimating a population mean or a population proportion. For example, students are asked to define an appropriate population, population characteristic, sample, and sample statistics that might be used in a study of the time it takes students to run a quarter-mile or a study of the proportion of national parks that contain bald eagle nests. In this topic, students use data from a random sample to estimate a population mean or a population proportion. Building on w hat they learned about sampling variability in Grade 7, students use simulation to create an understanding of margin of error. In Grade 7, students learned that the proportion of successes in a random sample from a population will v ary from sample to sample due to the random selection process. They understand that the value of the sample proportion will not be exactly equal to the value of the population proportion. In Grade 11, they use margin of error to describe how different the value of the sample proportion might be from the value of the population pr oportion. Students begin by using a physical simulation process to carry out a simulation. Starting with a population that contains 40% successes (using a bag with 40 black beans and 60 white beans), they select random samples from the population and calculate the sample proportion. By doing this many times, they are able to get a sense of what kind of differences are likely. Their understanding should then extend to include the con cept of margin of error. Students then proceed to use technology to carry out a simulation. Once students understand the concept of margin of error, they go on to learn how to calculate and interpret it in context (S-IC.A.1, S-IC.B.4). Students also evaluate reports from the media in which sample data is used to estimate a population mean or proportion ( S-IC.B.6).
Big Idea:
Statistics is a process of making inferences.
Results from a model may or may not be consistent with a real-life simulation of the process.
Different data collection methods are appropriate for different situations and randomization relates to each.
Data from a sample survey is used to estimate a population mean.
Simulations are used to decide if differences between parameters are significant.
Essential Questions:
How is statistics used?
When is it appropriate to question the results from a model compared to a real-life simulation?
Which data collection method is best used for a specific context?
How does randomization relate to a data collection method?
How is a population mean estimated from data from a sample survey?
When is the difference between parameters significant?
Vocabulary Observational study, survey, experiment, bias, cause and effect conclusions, sample statistics, sampling variability, sample proportion, margin of error, plausible population proportion
Assessments Galileo: Topic C Assessment

12/19/2014 Page 43 of 50
Standard Common Core Standards Explanations & Examples Resources
S.IC.A.1
A. Understand and evaluate random processes underlying statistical experiments Understand statistics as a process for making inferences to be made about population parameters based on a random sample from that population.
S.IC.1 Explain in context the difference between values describing a population and a sample.
Eureka Math Module 4 Lesson 12-22
S.IC.B.3
A. Make inferences and justify conclusions from sample surveys, experiments, and observational studies Recognize the purposes of and differences among sample surveys, experiments, and observational studies; explain how randomization relates to each.
Students should be able to explain techniques/applications for randomly selecting study subjects from a population and how those techniques/applications differ from those used to randomly assign existing subjects to control groups or experimental groups in a statistical experiment.
In statistics, an observational study draws inferences about the possible effect of a treatment on subjects, where the assignment of subjects into a treated group versus a control group is outside the control of the investigator (for example, observing data on academic achievement and socio-economic status to see if there is a relationship between them). This is in contrast to controlled experiments, such as randomized controlled trials, where each subject is randomly assigned to a treated group or a control group before the start of the treatment.
Eureka Math Module 4 Lesson 12

12/19/2014 Page 44 of 50

12/19/2014 Page 45 of 50
S.IC.B.4
B. Make inferences and justify conclusions from sample surveys, experiments, and observational studies Use data from a sample survey to estimate a population mean or proportion; develop a margin of error through the use of simulation models for random sampling.
Students may use computer generated simulation models based upon sample surveys results to estimate population statistics and margins of error.
Eureka Math Module 4 Lesson 13-17,20,21,22

12/19/2014 Page 46 of 50
S.IC.B.6
B. Make inferences and justify conclusions from sample surveys, experiments, and observational studies Evaluate reports based on data.
Explanations can include but are not limited to sample size, biased survey sample, interval scale, unlabeled scale, uneven scale, and outliers that distort the line-of-best-fit. In a pictogram the symbol scale used can also be a source of distortion.
As a strategy, collect reports published in the media and ask students to consider the source of the data, the design of the study, and the way the data are analyzed and displayed.
Eureka Math Module 4 Lesson 12-22
MP.1
Make sense of problems and persevere in solving them.
Mathematically proficient students start by explaining to themselves the meaning of a problem and looking for entry points to its solution. They analyze givens, constraints, relationships, and goals. They make conjectures about the form and meaning of the solution and plan a solution pathway rather than simply jumping into a solution attempt. They consider analogous problems, and try special cases and simpler forms of the original problem in order to gain insight into its solution. They monitor and evaluate their progress and change course if necessary. Mathematically proficient students check their answers to problems using a different method, and they continually ask themselves, "Does this make sense?" They can understand the approaches of others to solving complex problems and identify correspondences between different approaches.
Eureka Math Module 4 Lesson 13,15
12/19/2014 Page 47 of 50
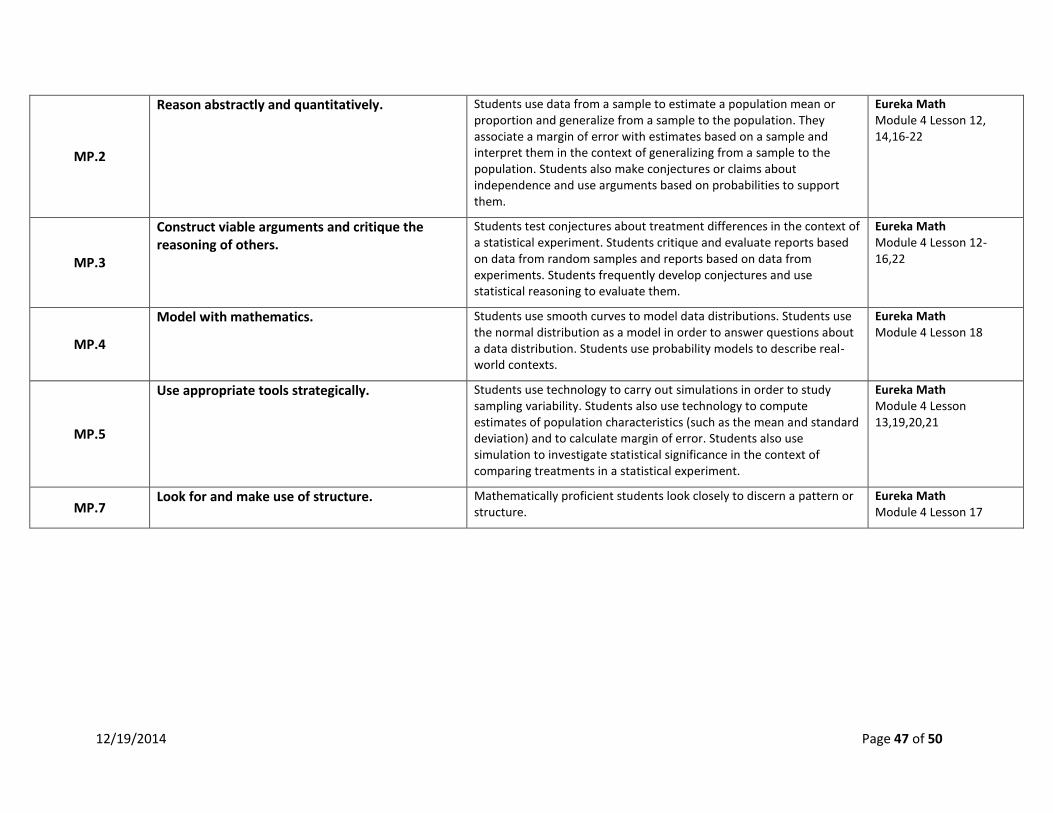
MP.2
Reason abstractly and quantitatively. Students use data from a sample to estimate a population mean or proportion and generalize from a sample to the population. They associate a margin of error with estimates based on a sample and interpret them in the context of generalizing from a sample to the population. Students also make conjectures or claims about independence and use arguments based on probabilities to support them.
Eureka Math Module 4 Lesson 12, 14,16-22
MP.3
Construct viable arguments and critique the reasoning of others.
Students test conjectures about treatment differences in the context of a statistical experiment. Students critique and evaluate reports based on data from random samples and reports based on data from experiments. Students frequently develop conjectures and use statistical reasoning to evaluate them.
Eureka Math Module 4 Lesson 12-16,22
MP.4
Model with mathematics. Students use smooth curves to model data distributions. Students use the normal distribution as a model in order to answer questions about a data distribution. Students use probability models to describe real-world contexts.
Eureka Math Module 4 Lesson 18
MP.5
Use appropriate tools strategically. Students use technology to carry out simulations in order to study sampling variability. Students also use technology to compute estimates of population characteristics (such as the mean and standard deviation) and to calculate margin of error. Students also use simulation to investigate statistical significance in the context of comparing treatments in a statistical experiment.
Eureka Math Module 4 Lesson 13,19,20,21
MP.7 Look for and make use of structure.
Mathematically proficient students look closely to discern a pattern or structure.
Eureka Math Module 4 Lesson 17

12/19/2014 Page 48 of 50
HS Algebra II Semester 2
Module 4: Inferences and Conclusions from Data Topic D: Drawing Conclusions Using data from an Experiment
This topic focuses on drawing conclusions based on data from a statistical experiment. Experiments are introduced as investig ations designed to compare the effect of two treatments on a response variable. Students revisit the distinction between random selection and random assignment. When comparing two treatments using data from a statistical experiment, it is important to assess whether the observed differ ence in group means indicates a real difference between the treatments in the experiment or whether it is possible that there is no difference and that the observed difference is just a byproduct of the random assignment of s ubjects to treatments (S-IC.B.5). To help students understand how this distinction is made, lessons in this topic use simulation to create a randomization distribution as a way of exploring the types of differences they might expect to see by chance when there is no real difference between groups. By understanding these differences, students a re able to determine whether an observed difference in means is significant (S-IC.B.5). Students also critique and evaluate published reports based on statistical experiments that compare two treatments ( S-IC.B.6). For example, students read a short summary of an article in the online New England Journal of Medicine describing an experiment to determine if wearing a brace helps adolescents with scoliosis. And then they watch an online video report for the Wall Street Journal titled “BMW Drivers Really are Jerks” that describes a study of the relationship between driving behavior and type of car driven.
Big Idea:
Statistics is a process of making inferences.
Results from a model may or may not be consistent with a real-life simulation of the process.
Different data collection methods are appropriate for different situations and randomization relates to each.
Data from a sample survey is used to estimate a population mean.
Simulations are used to decide if differences between parameters are significant.
Essential Questions:
How is statistics used?
When is it appropriate to question the results from a model compared to a real-life simulation?
Which data collection method is best used for a specific context?
How does randomization relate to a data collection method?
How is a population mean estimated from data from a sample survey?
When is the difference between parameters significant?
Vocabulary Assignment, random selection, random assignment, subject, response variable, treatments, placebo, “changeinscore”
Assessments Galileo: Topic D Assessment
Standard Common Core Standards Explanations & Examples Resources
S.IC.B.3
B. Make inferences and justify conclusions from sample surveys, experiments, and observational studies
Students should be able to explain techniques/applications for randomly selecting study subjects from a population and how those techniques/applications differ from those used to randomly assign existing subjects to control groups or experimental groups in a
Eureka Math Module 4 Lesson 23-29

12/19/2014 Page 49 of 50
Recognize the purposes of and differences among sample surveys, experiments, and observational studies; explain how randomization relates to each.
statistical experiment.
In statistics, an observational study draws inferences about the possible effect of a treatment on subjects, where the assignment of subjects into a treated group versus a control group is outside the control of the investigator (for example, observing data on academic achievement and socio-economic status to see if there is a relationship between them). This is in contrast to controlled experiments, such as randomized controlled trials, where each subject is randomly assigned to a treated group or a control group before the start of the treatment.
S.IC.B.5
B. Make inferences and justify conclusions from sample surveys, experiments, and observational studies Use data from a randomized experiment to compare two treatments; use simulations to decide if differences between parameters are significant.
Students may use computer generated simulation models to decide how likely it is that observed differences in a randomized experiment are due to chance.
Treatment is a term used in the context of an experimental design to refer to any prescribed combination of values of explanatory variables. For example, one wants to determine the effectiveness of weed killer. Two equal parcels of land in a neighborhood are treated; one with a placebo and one with weed killer to determine whether there is a significant difference in effectiveness in eliminating weeds.
Eureka Math Module 4 Lesson 24-29
S.IC.B.6
B. Make inferences and justify conclusions from sample surveys, experiments, and observational studies Evaluate reports based on data.
Explanations can include but are not limited to sample size, biased survey sample, interval scale, unlabeled scale, uneven scale, and outliers that distort the line-of-best-fit. In a pictogram the symbol scale used can also be a source of distortion.
As a strategy, collect reports published in the media and ask students to consider the source of the data, the design of the study, and the way the data are analyzed and displayed.
Eureka Math Module 4 Lesson 28-30
MP.1
Make sense of problems and persevere in solving them.
Mathematically proficient students start by explaining to themselves the meaning of a problem and looking for entry points to its solution. They analyze givens, constraints, relationships, and goals. They make conjectures about the form and meaning of the solution and plan a solution pathway rather than simply jumping into a solution attempt. They consider analogous problems, and try special cases and simpler forms of the original problem in order to gain insight into its solution. They monitor and evaluate their progress and change course if
Eureka Math Module 4 Lesson 23

12/19/2014 Page 50 of 50
necessary. Mathematically proficient students check their answers to problems using a different method, and they continually ask themselves, "Does this make sense?" They can understand the approaches of others to solving complex problems and identify correspondences between different approaches.
MP.2
Reason abstractly and quantitatively. Students use data from a sample to estimate a population mean or proportion and generalize from a sample to the population. They associate a margin of error with estimates based on a sample and interpret them in the context of generalizing from a sample to the population. Students also make conjectures or claims about independence and use arguments based on probabilities to support them.
Eureka Math Module 4 Lesson 23,24,26
MP.3
Construct viable arguments and critique the reasoning of others.
Students test conjectures about treatment differences in the context of a statistical experiment. Students critique and evaluate reports based on data from random samples and reports based on data from experiments. Students frequently develop conjectures and use statistical reasoning to evaluate them.
Eureka Math Module 4 Lesson 23,24,25,28-30
MP.4
Model with mathematics. Students use smooth curves to model data distributions. Students use the normal distribution as a model in order to answer questions about a data distribution. Students use probability models to describe real-world contexts.
Eureka Math Module 4 Lesson 25,27
MP.5
Use appropriate tools strategically. Students use technology to carry out simulations in order to study sampling variability. Students also use technology to compute estimates of population characteristics (such as the mean and standard deviation) and to calculate margin of error. Students also use simulation to investigate statistical significance in the context of comparing treatments in a statistical experiment.
Eureka Math Module 4 Lesson 27,28