hs hus rqhr
TRANSCRIPT

The Canadian Neonatal Network ™
Le Réseau Néonatal Canadien ™ Annual Report 2019 Rapport Annuel
KGH
MSH EDM
ECH
HSJ
RCH
JCHC
MUHC
LHSC
SMH
SUNY
CHUS
OTTA
RUH
IWK
SBGH
JGH GVS
CBRH
CHUQ
UUH
FMC
SEHC
ACH
HSCC
RQHR
HMR
HHSC
HSC SJRH
WRH
BCCH
i
Acknowledgements This report is based upon data collected from 32 Health Care Organizations that were members of the Canadian Neonatal Network™ during the year 2018. In addition to all the investigators and the funding agency, we would like to recognize the invaluable support of the Neonatal Intensive Care Units (NICUs) that collected this information, the support of all of the participating sites and most importantly, the dedication and hard work of the Site Investigators, NICU Medical Directors and Data Abstractors. Structure of the CNN The Canadian Neonatal Network™ (CNN) is a group of researchers who collaborate on research issues relating to neonatal care. The CNN was founded in 1995 by Dr. Shoo Lee. The CNN maintains a standardized neonatal database and provides unique opportunities for researchers to participate in collaborative projects on a national and international scale. Health care professionals, health services researchers, and health care administrators participate actively in clinical, epidemiologic, outcomes, health services, health policy and informatics research aimed at improving quality, effectiveness and efficiency of neonatal care. Research results are published in Network reports and in peer-reviewed journals. Funding The CNN infrastructure is funded by the Canadian Institutes of Health Research. Individual participating sites provided additional funding for data collection and other related resources. The coordinating center, Maternal-Infant Care Research Centre, is supported by Mount Sinai Hospital, Toronto, Ontario. Coordinating Centre of the CNN Maternal-Infant Care Research Centre, Mount Sinai Hospital, Toronto, Ontario Chairman: Dr. Shoo K. Lee, University of Toronto Governing Board: Dr. Khalid Aziz, University of Alberta Dr. Kimberly Dow, Queen’s University Dr. Shoo K. Lee, University of Toronto (Chair) Dr. Douglas McMillan, Dalhousie University Dr. Bruno Piedboeuf, Université Laval Dr. Molly Seshia, University of Manitoba Dr. Nalini Singhal, University of Calgary Director: Dr. Prakesh Shah, University of Toronto Associate Director Dr. Marc Beltempo, McGill University Executive Committee: Dr. Marc Beltempo, McGill University Ms. Martine Claveau, McGill University
ii
Dr. Walid El-Naggar, Dalhousie University Dr. Abhay Lodha, University of Calgary Dr. Amit Mukerji, McMaster University Dr. Prakesh Shah, University of Toronto (Chair) Dr. Joseph Ting, University of British Columbia Dr. Eugene Ng, University of Toronto
CNN Coordinator: Ms. Priscilla Chan, Mount Sinai Hospital Report Analyst: Mr. Eugene W. Yoon, Mount Sinai Hospital Report Review Committee: Dr. Marc Beltempo, McGill University (Co-Chair) Dr. George Carson, University of Saskatchewan Dr. Orlando DaSilva, Western University Dr. Akhil Deshpandey, Memorial University Dr. Michael Dunn, University of Toronto Dr. Amit Mukerji, McMaster University Ms. Wendy Seidlitz, Hamilton Health Sciences Dr. Prakesh Shah, University of Toronto (Co-Chair) Dr. Joseph Ting, University of British Columbia Participating CNN Sites and Site Investigators in 2019: Victoria General Hospital, Victoria, British Columbia Dr. Jaideep Kanungo BC Women’s Hospital, Vancouver, British Columbia Dr. Joseph Ting Royal Columbian Hospital, New Westminster, Dr. Zenon Cieslak
British Columbia Surrey Memorial Hospital, Surrey, British Columbia Dr. Rebecca Sherlock Foothills Medical Centre, Calgary, Alberta Dr. Ayman Abou Mehrem Alberta Children’s Hospital, Calgary, Alberta Dr. Carlos Fajardo Royal Alexandra Hospital, Edmonton, Alberta Dr. Khalid Aziz &
& University of Alberta Hospital – Dr. Jennifer Toye Stollery Children's, Edmonton, Alberta
Royal University Hospital, Saskatoon, Saskatchewan Dr. Sibasis Daspal & Dr. Lannae Strueby Regina General Hospital, Regina, Saskatchewan Dr. Zarin Kalapesi & Dr. Jaya Bodani Winnipeg Health Sciences Centre, Winnipeg, Manitoba Dr. Mary Seshia & Dr. Deepak Louis St. Boniface General Hospital, Winnipeg, Manitoba Dr. Ruben Alvaro Windsor Regional Hospital, Windsor, Ontario Dr. Mohammed Adie London Health Sciences Centre, London, Ontario Dr. Orlando DaSilva Hamilton Health Sciences, Hamilton, Ontario Dr. Amit Mukerji Mount Sinai Hospital, Toronto, Ontario Dr. Prakesh Shah Hospital for Sick Children, Toronto, Ontario Dr. Kyong-Soon Lee Sunnybrook Health Sciences Centre, Toronto, Ontario Dr. Michael Dunn &
Dr. Eugene Ng Kingston Health Sciences Centre, Kingston, Ontario Dr. Faiza Khurshid
iii
Children’s Hospital of Eastern Ontario, Ottawa, Ontario Dr. Brigitte Lemyre & The Ottawa Hospital, Ottawa, Ontario
Jewish General Hospital, Montréal, Québec Dr. Ermelinda Pelausa Hôpital Sainte-Justine, Montréal, Québec Dr. Keith Barrington,
Dr. Anie Lapointe & Mr. Guillaume Ethier
Montreal Children’s Hospital – McGill University Health Dr. Marc Beltempo & Centre, Montréal, Québec Ms. Martine Claveau Centre Hospitalier Universitaire de Québec, Sainte Foy, Dr. Bruno Piedboeuf &
Québec Dr. Christine Drolet Centre Hospitalier Universitaire de Sherbrooke, Sherbrooke, Dr. Valérie Bertelle &
Québec Dr. Edith Massé Hôpital Maisonneuve-Rosemont, Montréal, Québec Dr. Marie St-Hilaire Dr. Everett Chalmers Hospital, Fredericton, New Brunswick Dr. Hala Makary Saint John Regional Hospital, Saint John, New Brunswick Dr. Cecil Ojah & Dr. Luis Monterrosa Moncton Hospital, Moncton, New Brunswick Dr. Rody Canning IWK Health Centre, Halifax, Nova Scotia Dr. Jehier Afifi Cape Breton Regional Hospital, Sydney, Nova Scotia Dr. Andrzej Kajetanowicz Janeway Children’s Health and Rehabilitation Centre, Dr. Julie Emberley
St. John’s, Newfoundland University of Utah Hospital, Salt Lake City, Utah Dr. Bradley A. Yoder Written & Prepared By: Marc Beltempo, Prakesh Shah, Eugene W. Yoon, Priscilla Chan, Nevetha Balachandran and Members of the Annual Report Review Committee Cover page adapted by Nevetha Balachandran @ www.123rf.com/profile_paprika
iv
Table of contents
Page
A. Executive Summary 1 B. CNN Site Characteristics 3 C. Information Systems 4 D. Descriptive Analyses 5 Flow diagram 6 D.1. Analyses based on number of eligible admissions to participating sites Presentation #1 All admissions: Type of admissions: All sites 8
Presentation #2 All admissions: Admission illness severity scores (SNAP-II and SNAP-IIPE): Sites with complete data
10
D.2. Analyses based on number of eligible neonates admitted to participating sites Presentation #3 Gestational age distribution: All sites and all admitted neonates 13 Presentation #4 Survival to discharge by GA: All admissions including delivery room deaths 15 Presentation #5 Birth weight distribution: All sites and all admitted neonates 16 Presentation #6 Survival to discharge by BW: All admissions including delivery room deaths 17 Presentation #6b Survival to discharge by BW: BW < 1000g including delivery room deaths 18 Presentation #7a Maternal and peripartum characteristics: All neonates 19 Presentation #7b Timing of single course of Antenatal Corticosteroids: GA <33 weeks 21 Presentation #7c Timing of deferred cord clamping: GA <33 weeks 22 Presentation #8a Resuscitation details: GA < 31 weeks 23 Presentation #8b Resuscitation details: GA ≥ 31 weeks 24 Presentation #9 Early onset sepsis: All GA 25 Presentation #10 Late onset sepsis: All GA 26 Presentation #11 Late onset sepsis: All BW 27 Presentation #12 Other diagnoses / interventions / procedures: All GA 28 D.3. Analyses based on number of very preterm (GA < 33 weeks) or VLBW (< 1500g) neonates Presentation #13 Patent ductus arteriosus treatments: GA < 33 weeks 31 Presentation #14 Patent ductus arteriosus treatments: BW < 1500g 32 Presentation #15 Neuroimaging findings: GA < 33 weeks 33 Presentation #16 Neuroimaging findings: BW < 1500g 35 Presentation #17 Necrotizing enterocolitis treatments: GA < 33 weeks 37 Presentation #18 Necrotizing enterocolitis treatments: BW < 1500g 38 Presentation #19 Chronic lung disease at 36 weeks PMA or discharge: GA<33 weeks 39 Presentation #20 Chronic lung disease at 36 weeks PMA or discharge: BW <1500g 40 Presentation #21 Retinopathy of prematurity staging: GA < 33 weeks 41 Presentation #22 Retinopathy of prematurity staging: BW < 1500g 42 Presentation #23 Retinopathy of prematurity treatments: GA < 33 weeks 43 Presentation #24 Retinopathy of prematurity treatments: BW < 1500g 44 Presentation #25 Mortality or select morbidity: GA < 33 weeks 45 E. Site Comparisons E.1. Site Comparisons – Care Practices Presentation #26 Prenatal and delivery room care practices: GA<29 weeks: Site specific crude rates 48
v
(inborn only)
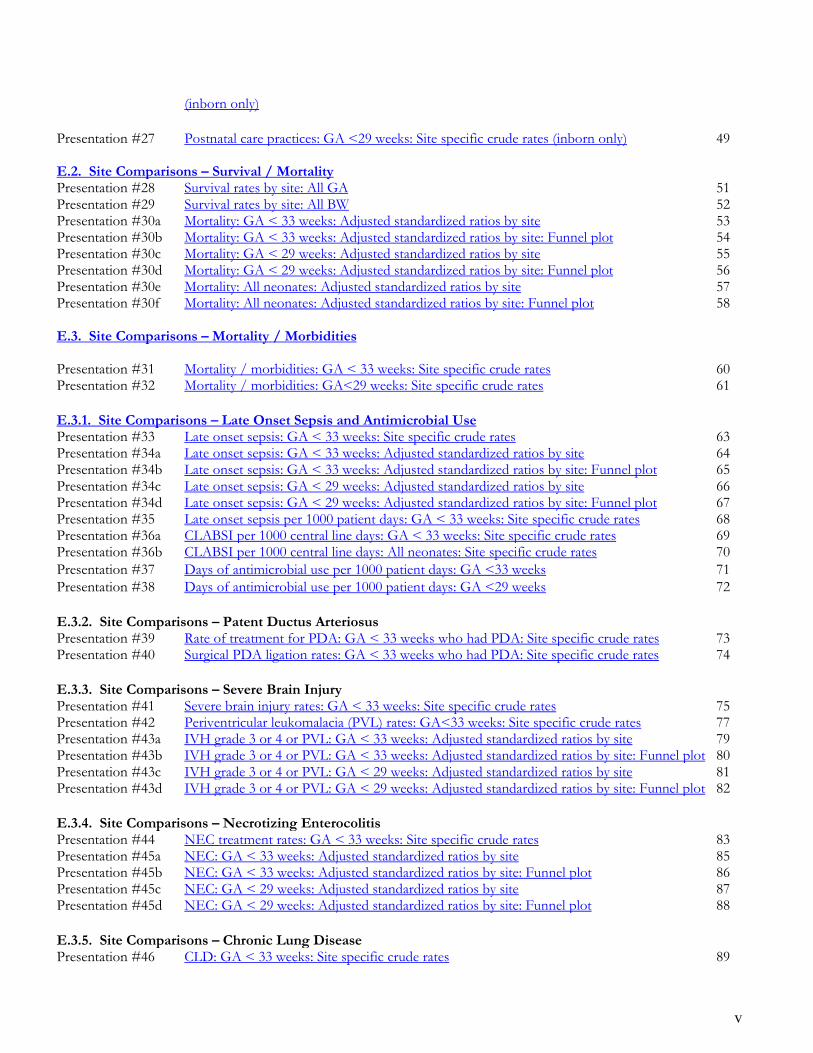
Presentation #27 Postnatal care practices: GA <29 weeks: Site specific crude rates (inborn only) 49 E.2. Site Comparisons – Survival / Mortality Presentation #28 Survival rates by site: All GA 51 Presentation #29 Survival rates by site: All BW 52 Presentation #30a Mortality: GA < 33 weeks: Adjusted standardized ratios by site 53 Presentation #30b Mortality: GA < 33 weeks: Adjusted standardized ratios by site: Funnel plot 54 Presentation #30c Mortality: GA < 29 weeks: Adjusted standardized ratios by site 55 Presentation #30d Mortality: GA < 29 weeks: Adjusted standardized ratios by site: Funnel plot 56 Presentation #30e Mortality: All neonates: Adjusted standardized ratios by site 57 Presentation #30f Mortality: All neonates: Adjusted standardized ratios by site: Funnel plot 58 E.3. Site Comparisons – Mortality / Morbidities
Presentation #31 Mortality / morbidities: GA < 33 weeks: Site specific crude rates 60 Presentation #32 Mortality / morbidities: GA<29 weeks: Site specific crude rates 61
E.3.1. Site Comparisons – Late Onset Sepsis and Antimicrobial Use Presentation #33 Late onset sepsis: GA < 33 weeks: Site specific crude rates 63 Presentation #34a Late onset sepsis: GA < 33 weeks: Adjusted standardized ratios by site 64 Presentation #34b Late onset sepsis: GA < 33 weeks: Adjusted standardized ratios by site: Funnel plot 65 Presentation #34c Late onset sepsis: GA < 29 weeks: Adjusted standardized ratios by site 66 Presentation #34d Late onset sepsis: GA < 29 weeks: Adjusted standardized ratios by site: Funnel plot 67 Presentation #35 Late onset sepsis per 1000 patient days: GA < 33 weeks: Site specific crude rates 68 Presentation #36a CLABSI per 1000 central line days: GA < 33 weeks: Site specific crude rates 69 Presentation #36b CLABSI per 1000 central line days: All neonates: Site specific crude rates 70
Presentation #37 Days of antimicrobial use per 1000 patient days: GA <33 weeks 71
Presentation #38 Days of antimicrobial use per 1000 patient days: GA <29 weeks 72
E.3.2. Site Comparisons – Patent Ductus Arteriosus Presentation #39 Rate of treatment for PDA: GA < 33 weeks who had PDA: Site specific crude rates 73 Presentation #40 Surgical PDA ligation rates: GA < 33 weeks who had PDA: Site specific crude rates 74
E.3.3. Site Comparisons – Severe Brain Injury Presentation #41 Severe brain injury rates: GA < 33 weeks: Site specific crude rates 75 Presentation #42 Periventricular leukomalacia (PVL) rates: GA<33 weeks: Site specific crude rates 77 Presentation #43a IVH grade 3 or 4 or PVL: GA < 33 weeks: Adjusted standardized ratios by site 79 Presentation #43b IVH grade 3 or 4 or PVL: GA < 33 weeks: Adjusted standardized ratios by site: Funnel plot 80 Presentation #43c IVH grade 3 or 4 or PVL: GA < 29 weeks: Adjusted standardized ratios by site 81 Presentation #43d IVH grade 3 or 4 or PVL: GA < 29 weeks: Adjusted standardized ratios by site: Funnel plot 82
E.3.4. Site Comparisons – Necrotizing Enterocolitis Presentation #44 NEC treatment rates: GA < 33 weeks: Site specific crude rates 83 Presentation #45a NEC: GA < 33 weeks: Adjusted standardized ratios by site 85 Presentation #45b NEC: GA < 33 weeks: Adjusted standardized ratios by site: Funnel plot 86 Presentation #45c NEC: GA < 29 weeks: Adjusted standardized ratios by site 87 Presentation #45d NEC: GA < 29 weeks: Adjusted standardized ratios by site: Funnel plot 88
E.3.5. Site Comparisons – Chronic Lung Disease Presentation #46 CLD: GA < 33 weeks: Site specific crude rates 89
vi
Presentation #47a CLD: GA < 33 weeks: Adjusted standardized ratios by site 90 Presentation #47b CLD: GA < 33 weeks: Adjusted standardized ratios by site: Funnel plot 91 Presentation #47c CLD: GA < 29 weeks: Adjusted standardized ratios by site 92 Presentation #47d CLD: GA < 29 weeks: Adjusted standardized ratios by site: Funnel plot 93
E.3.6. Site Comparisons – Postnatal Use of Steroids Presentation #48a Postnatal use of steroids for treatment of CLD: GA < 29 weeks: Site specific crude rates 94 Presentation #48b Systemic steroids for hypotension: GA < 33 weeks: Site specific crude rates 95
E.3.7. Site Comparisons – Retinopathy of Prematurity Presentation #49a ROP > Stage 3: GA<33 weeks: Adjusted standardized ratios by site 96 Presentation #49b ROP > Stage 3: GA<33 weeks: Adjusted standardized ratios by site: Funnel plot 97 Presentation #49c ROP > Stage 3: GA<29 weeks: Adjusted standardized ratios by site 98 Presentation #49d ROP > Stage 3: GA<29 weeks: Adjusted standardized ratios by site: Funnel plot 99 E.3.8. Site Comparisons – Mortality or Major Morbidity Presentation #50a Mortality or major morbidity: GA < 33 weeks: Adjusted standardized ratios by site 100
Presentation #50b Mortality or major morbidity: GA < 33 weeks: Adjusted standardized ratios by site: Funnel plot
101
Presentation #50c Mortality or major morbidity: GA < 29 weeks: Adjusted standardized ratios by site 102
Presentation #50d Mortality or major morbidity: GA < 29 weeks: Adjusted standardized ratios by site: Funnel plot
103
F. Discharge Disposition & Status Presentation #51 Final Discharge destination: All GA: Crude rates 105 Presentation #52 Support at discharge: Neonates who were discharged directly home: Crude rates 106
G. Hypoxic Ischemic Encephalopathy
Presentation #53 Hypoxic Ischemic Encephalopathy 108 H. Trend Analyses over the last 10 years 111 I. 2019 CNN publications 130
J. Appendices
Outcomes Definitions 134
CNN Definitions and Major Anomalies 135
Abbreviations 136

A. Executive Summary
1
A. Executive Summary
Inclusion summary: This report from the Canadian Neonatal NetworkTM (CNN) is based on data from 32 tertiary NICU sites that contributed data in the year 2019. Admissions between January 1, 2019 and December 31, 2019 who were discharged by March 31, 2020 were included. Eleven (11) infants who were admitted in 2018 but discharged after March 31, 2019 were also included in the 2019 report. Delivery room deaths, moribund neonates, and readmissions from 2018 were excluded.
Total number of eligible admissions to participating sites 15 981 (See section D.1 for analyses)
Total number of eligible individual neonates 14 868 (See section D.2. for analyses)
Total number of eligible very preterm (GA <33 weeks) neonates 4 446 Total number of eligible extremely preterm (GA <29 weeks) neonates 1 718
(See section D.3. for analyses)
Total number of eligible very low birth weight (BW <1500 g) neonates 2 956 (See section D.3. for analyses) Important information for data interpretations:
a. Neonates who were transferred to a “normal newborn care area” (level I nursery) or discharged home within 24 hours of their admission to the site were excluded.
b. In 2019, eight (8) sites were only able to contribute data from a subset of eligible neonates admitted to their NICUs due to resource limitations or challenges related to the COVID-19 pandemic. See page 3 for data collection criteria of all participating sites.
c. Characteristics of participating sites were highlighted at the outset of the presentations.
d. ‘Missing’ data on outcome variables varied for each presentation. Caution should be used when interpreting the information. When possible, both the total number of neonates and the number of neonates with available data were provided.
e. The denominators for all percentages in this report included neonates whose data for that particular item were available.
f. This report included data from neonates who were admitted to the NICUs, except for Presentations #4, #6 and #6b.
g. Presentations #4, #6 and #6b included delivery room deaths. h. Neonates who were not admitted to participating NICUs were not included in
this report.
A. Executive Summary
2
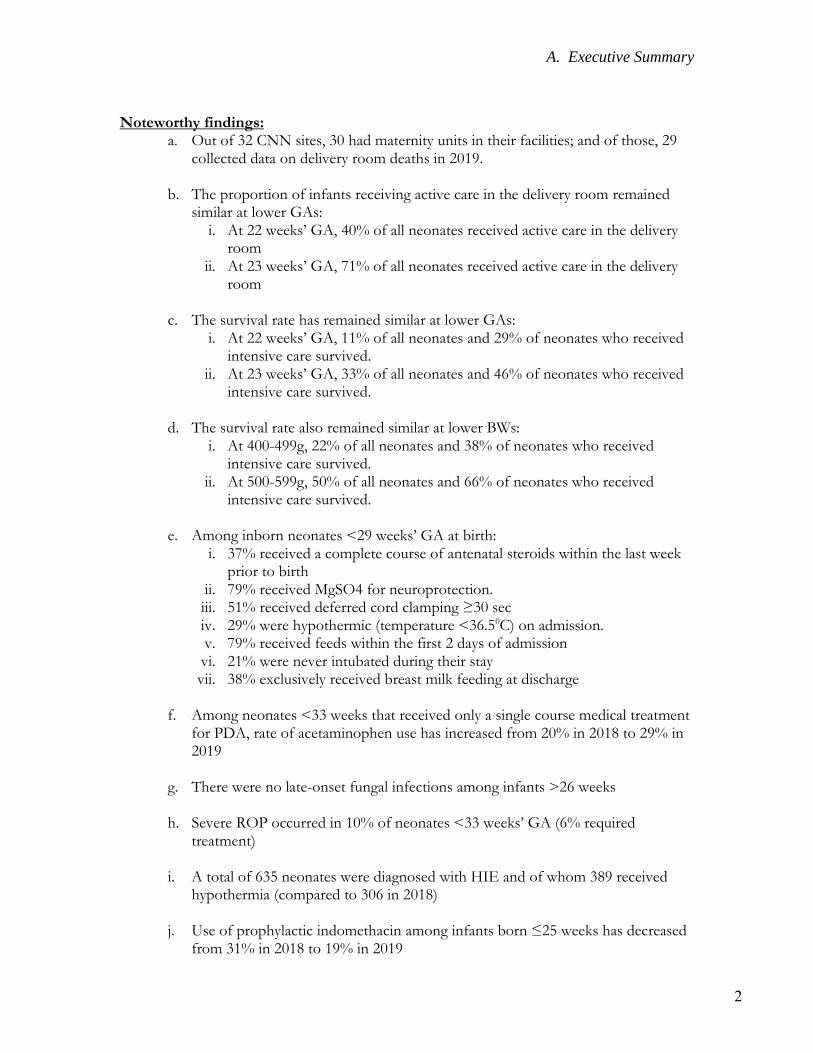
Noteworthy findings:
a. Out of 32 CNN sites, 30 had maternity units in their facilities; and of those, 29 collected data on delivery room deaths in 2019.
b. The proportion of infants receiving active care in the delivery room remained
similar at lower GAs: i. At 22 weeks’ GA, 40% of all neonates received active care in the delivery
room ii. At 23 weeks’ GA, 71% of all neonates received active care in the delivery
room
c. The survival rate has remained similar at lower GAs: i. At 22 weeks’ GA, 11% of all neonates and 29% of neonates who received
intensive care survived. ii. At 23 weeks’ GA, 33% of all neonates and 46% of neonates who received
intensive care survived.
d. The survival rate also remained similar at lower BWs: i. At 400-499g, 22% of all neonates and 38% of neonates who received
intensive care survived. ii. At 500-599g, 50% of all neonates and 66% of neonates who received
intensive care survived.
e. Among inborn neonates <29 weeks’ GA at birth: i. 37% received a complete course of antenatal steroids within the last week
prior to birth ii. 79% received MgSO4 for neuroprotection. iii. 51% received deferred cord clamping ≥30 sec iv. 29% were hypothermic (temperature <36.50C) on admission. v. 79% received feeds within the first 2 days of admission vi. 21% were never intubated during their stay vii. 38% exclusively received breast milk feeding at discharge
f. Among neonates <33 weeks that received only a single course medical treatment
for PDA, rate of acetaminophen use has increased from 20% in 2018 to 29% in 2019
g. There were no late-onset fungal infections among infants >26 weeks
h. Severe ROP occurred in 10% of neonates <33 weeks’ GA (6% required
treatment)
i. A total of 635 neonates were diagnosed with HIE and of whom 389 received hypothermia (compared to 306 in 2018)
j. Use of prophylactic indomethacin among infants born ≤25 weeks has decreased
from 31% in 2018 to 19% in 2019
B. Site Characteristics
3
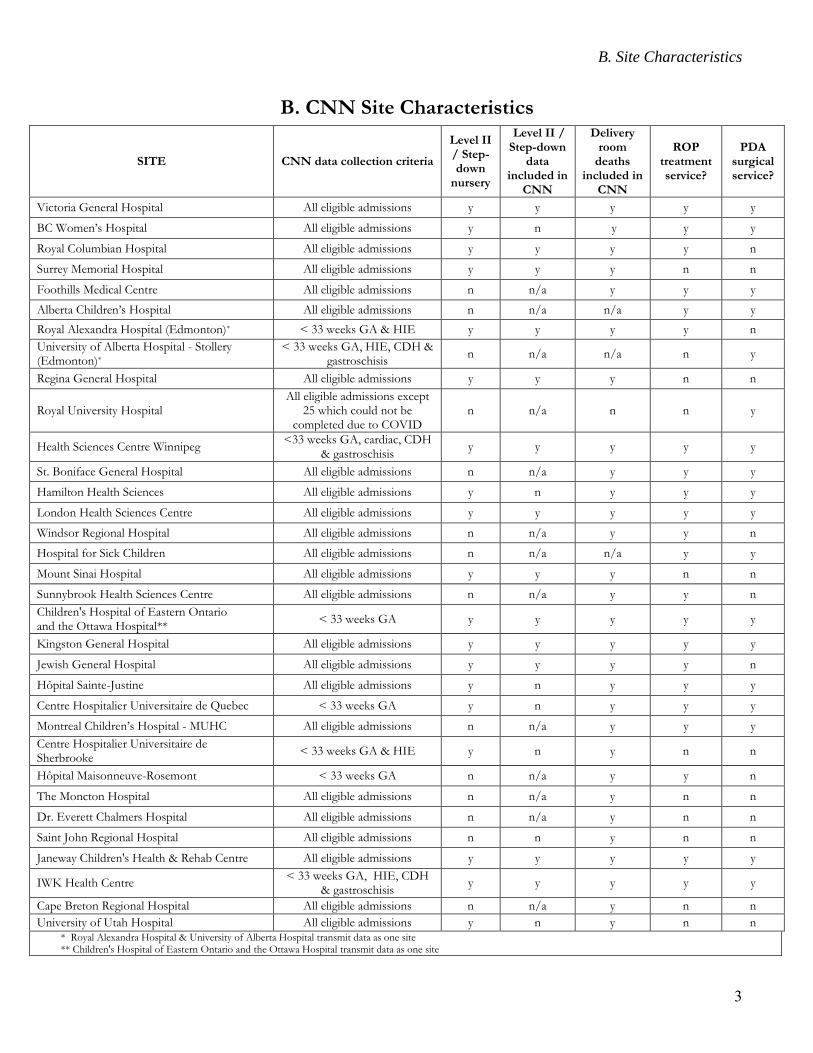
B. CNN Site Characteristics
SITE CNN data collection criteria
Level II / Step-down
nursery
Level II / Step-down
data included in
CNN
Delivery room
deaths included in
CNN
ROP treatment service?
PDA surgical service?
Victoria General Hospital All eligible admissions y y y y y
BC Women’s Hospital All eligible admissions y n y y y
Royal Columbian Hospital All eligible admissions y y y y n
Surrey Memorial Hospital All eligible admissions y y y n n
Foothills Medical Centre All eligible admissions n n/a y y y
Alberta Children’s Hospital All eligible admissions n n/a n/a y y
Royal Alexandra Hospital (Edmonton)* < 33 weeks GA & HIE y y y y n
University of Alberta Hospital - Stollery (Edmonton)*
< 33 weeks GA, HIE, CDH & gastroschisis
n n/a n/a n y
Regina General Hospital All eligible admissions y y y n n
Royal University Hospital All eligible admissions except
25 which could not be completed due to COVID
n n/a n n y
Health Sciences Centre Winnipeg <33 weeks GA, cardiac, CDH
& gastroschisis y y y y y
St. Boniface General Hospital All eligible admissions n n/a y y y
Hamilton Health Sciences All eligible admissions y n y y y
London Health Sciences Centre All eligible admissions y y y y y
Windsor Regional Hospital All eligible admissions n n/a y y n
Hospital for Sick Children All eligible admissions n n/a n/a y y
Mount Sinai Hospital All eligible admissions y y y n n
Sunnybrook Health Sciences Centre All eligible admissions n n/a y y n
Children's Hospital of Eastern Ontario and the Ottawa Hospital**
< 33 weeks GA y y y y y
Kingston General Hospital All eligible admissions y y y y y
Jewish General Hospital All eligible admissions y y y y n
Hôpital Sainte-Justine All eligible admissions y n y y y
Centre Hospitalier Universitaire de Quebec < 33 weeks GA y n y y y
Montreal Children’s Hospital - MUHC All eligible admissions n n/a y y y
Centre Hospitalier Universitaire de Sherbrooke
< 33 weeks GA & HIE y n y n n
Hôpital Maisonneuve-Rosemont < 33 weeks GA n n/a y y n
The Moncton Hospital All eligible admissions n n/a y n n
Dr. Everett Chalmers Hospital All eligible admissions n n/a y n n
Saint John Regional Hospital All eligible admissions n n y n n
Janeway Children's Health & Rehab Centre All eligible admissions y y y y y
IWK Health Centre < 33 weeks GA, HIE, CDH
& gastroschisis y y y y y
Cape Breton Regional Hospital All eligible admissions n n/a y n n
University of Utah Hospital All eligible admissions y n y n n * Royal Alexandra Hospital & University of Alberta Hospital transmit data as one site ** Children's Hospital of Eastern Ontario and the Ottawa Hospital transmit data as one site
C. Information Systems
4
C. Information Systems
Neonates included in this report are those who were admitted to a CNN participating site between January 1, 2019 and December 31, 2019, and were discharged by March 31, 2020. The neonates must have had a length of stay at one of the CNN participating sites for greater than or equal to 24 hours, or died or were transferred to another level 2 or 3 facility within 24 hours. Eleven (11) infants who were admitted in 2018 but discharged after March 31, 2019 were also included in the 2019 report. Delivery room deaths, moribund neonates, and readmissions from 2018 were excluded. A total of 14 868 patients accounted for 15 981 admissions as some neonates were admitted on more than one occasions. Patient information was retrospectively abstracted from patient charts by trained personnel using standard definitions and protocols contained in a standard manual of operations. Data were usually entered into a laptop computer using a customized data entry program with built-in error checking and subsequently sent electronically to the Canadian Neonatal Network™ Coordinating Centre located at the Maternal-Infant Care Research Centre (MiCare) in Toronto, Ontario. Patient data at each participating site are available to the respective site investigator and data abstractor only. Patient identifiers were stripped prior to data transfer to the Coordinating Centre. Patient confidentiality was strictly observed. A unique identifier was generated for each entry of neonate into the system and that identifier was followed throughout one or more hospital stays. Individual-level data are used for analyses, but only aggregate data are reported. The results presented in this report will not identify participating sites by name; each site is anonymous using a randomly assigned number. Whenever a small cell size (1 to 4 individuals) was observed in the data output, the data were grouped to maintain anonymity. At each participating site, data are stored in a secured database in the site or in an alternate secured site used by the site to store patient information (e.g. health records department, computer services department). At the Coordinating Centre, the central database is stored in a secured computer database located on a server and an off-site back up that is maintained and secured by the Mount Sinai Hospital Information Technology Department. At the Coordinating Centre, information was verified for completeness and was reviewed for accuracy by looking for “unusual” and missing values on individual data items and by comparison with other information that might be related (e.g. gestational age [GA] and birth weight [BW]). However, the principal accuracy rests upon the diligence and capabilities of the individual sites. Each site had one or occasionally two dedicated person(s) responsible for data acquisition and transmission. At the Coordinating Centre, analyses were conducted using univariate, bivariate, and multivariate analyses for the total cohort, and for individual sites. Multivariable regression analysis was used to identify risk factors associated with mortality and major morbidities. Grouped data enabled development of outcome graphs by GA and BW for mortality and selected major morbidities. Similar systems have been used to assist in quality assurance and predict resource utilization.
D. Descriptive Analyses
5
D. Descriptive Analyses
This section is divided into three sub-sections.
Section D.1. Analyses based on number of eligible admissions to participating sites
These include data from 15 981 eligible admissions (including readmissions) to 32 sites. 24 of these sites submitted complete data (n=13 989) on all admissions and 8 sites submitted data on a selected admission cohort (n=1 992).
Section D.2. Analyses based on number of eligible neonates admitted to participating sites
These include data from 14 868 eligible neonates admitted to 32 sites. 24 of these sites submitted complete data (n=13 080) on all eligible admitted neonates and 8 sites submitted data on selected eligible admitted neonates (n=1 788).
Section D.3. Analyses based on number of eligible very preterm (GA <33 weeks) or very low birth weight (BW <1500g) neonates
These include data from 4 446 eligible very preterm neonates and 2 956 eligible very low birth weight (VLBW) neonates.
D. Descriptive Analyses
6
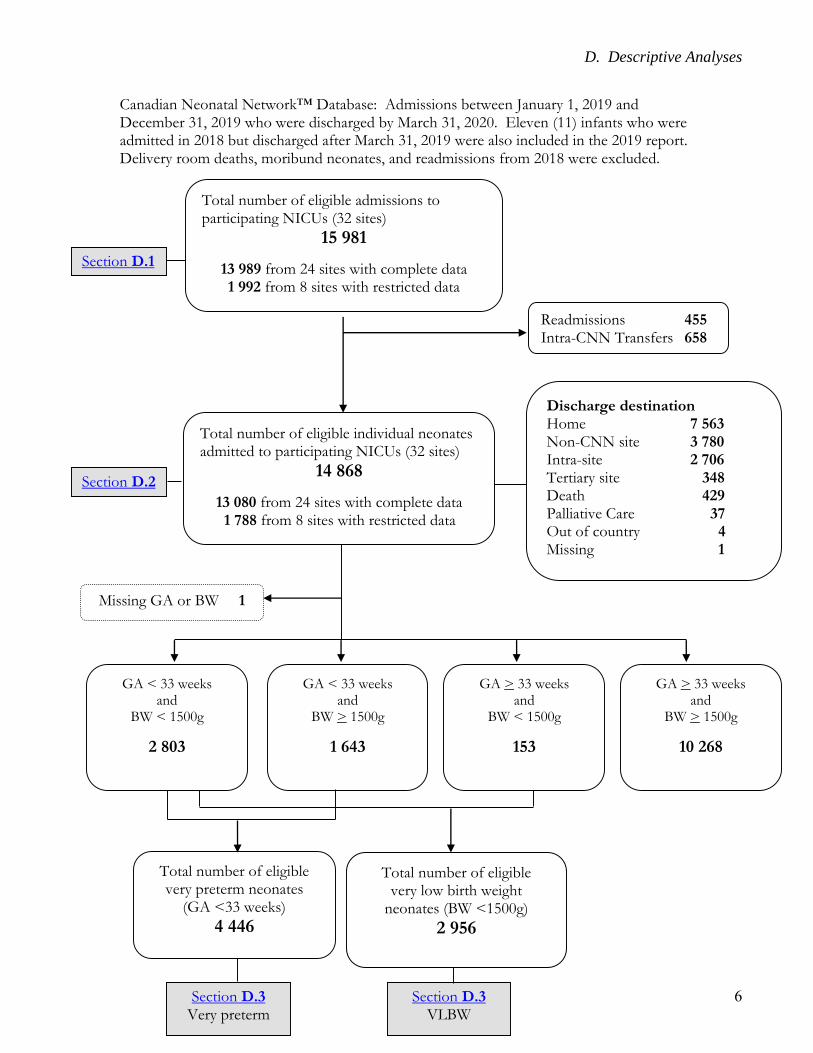
Canadian Neonatal Network™ Database: Admissions between January 1, 2019 and December 31, 2019 who were discharged by March 31, 2020. Eleven (11) infants who were admitted in 2018 but discharged after March 31, 2019 were also included in the 2019 report. Delivery room deaths, moribund neonates, and readmissions from 2018 were excluded.
GA > 33 weeks and
BW > 1500g
10 268
GA > 33 weeks and
BW < 1500g
153
Discharge destination Home 7 563 Non-CNN site 3 780 Intra-site 2 706 Tertiary site 348 Death 429 Palliative Care 37 Out of country 4 Missing 1
GA < 33 weeks and
BW > 1500g
1 643
GA < 33 weeks and
BW < 1500g
2 803
Section D.3 Very preterm
Section D.3 VLBW
Missing GA or BW 1
Total number of eligible very preterm neonates
(GA <33 weeks)
4 446
Total number of eligible very low birth weight
neonates (BW <1500g)
2 956
Readmissions 455 Intra-CNN Transfers 658
Section D.2
Total number of eligible admissions to participating NICUs (32 sites)
15 981
13 989 from 24 sites with complete data 1 992 from 8 sites with restricted data
Section D.1
Total number of eligible individual neonates admitted to participating NICUs (32 sites)
14 868
13 080 from 24 sites with complete data 1 788 from 8 sites with restricted data
D. Descriptive Analyses
7
Section D.1
Analyses based on number of eligible admissions to participating sites
These include data from 15 981 eligible admissions (including readmissions) to 32 sites. 24 of these sites submitted complete data (n=13 989) on all admissions and 8 sites submitted data on a selected admission cohort (n=1 992).
D. Descriptive Analyses
8
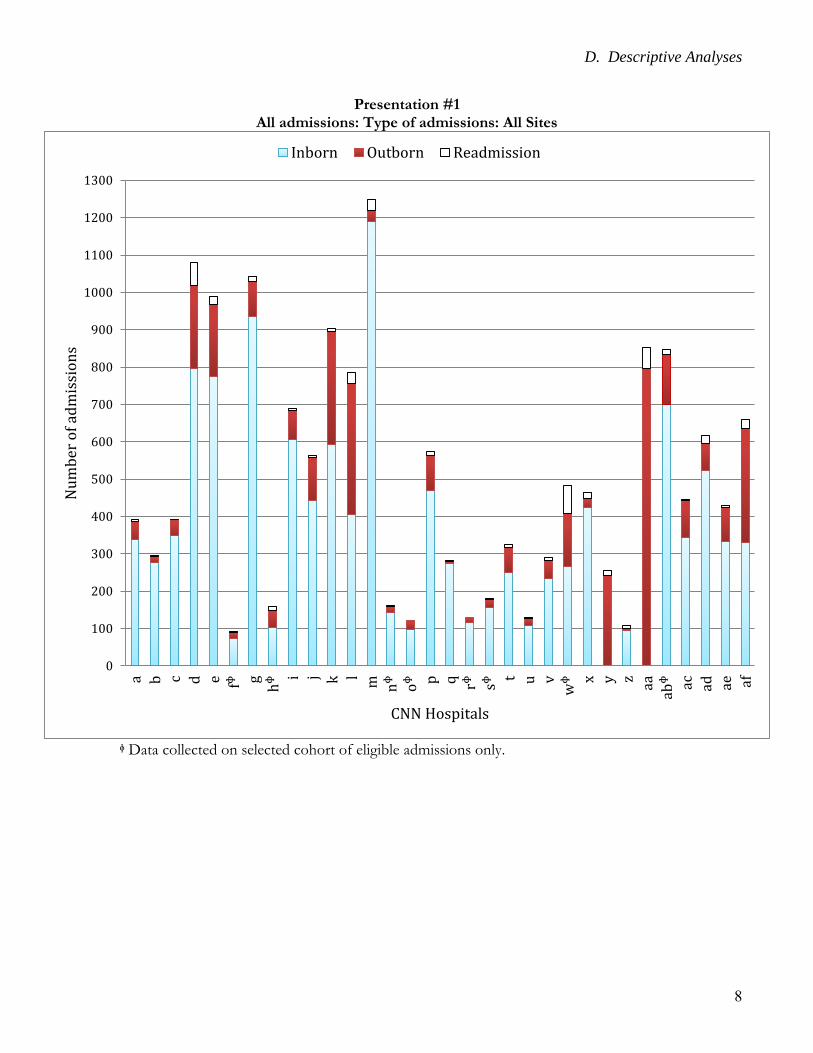
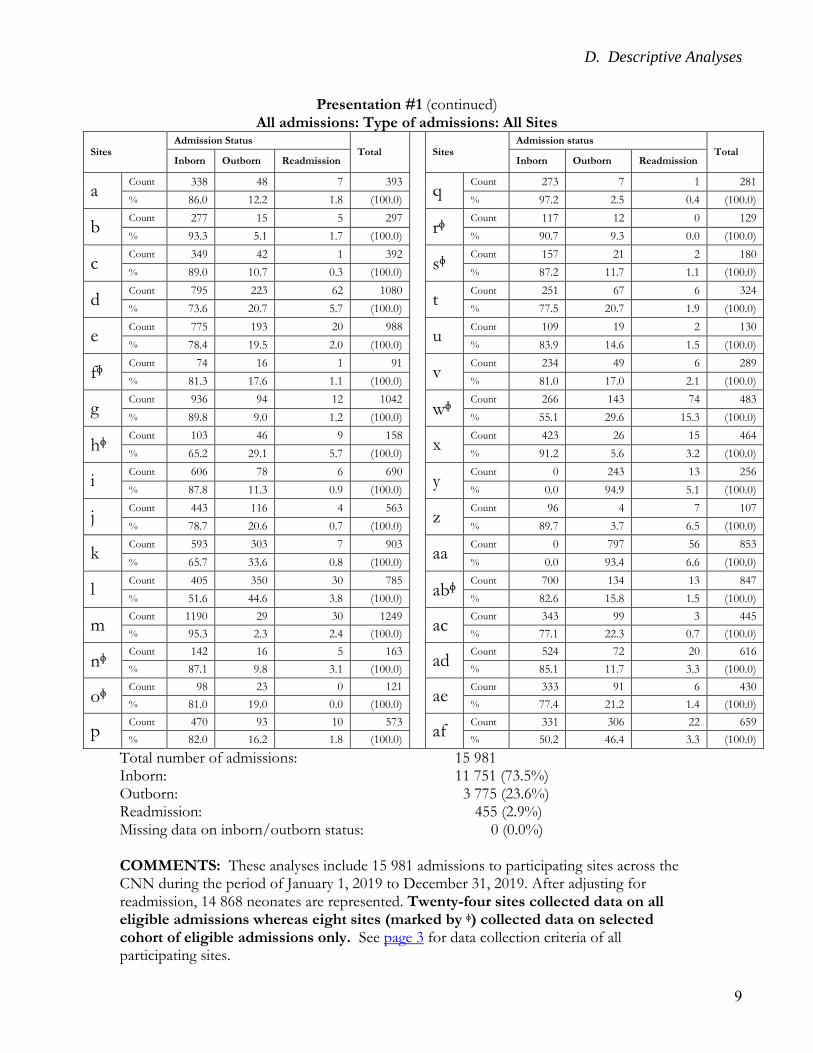
Presentation #1 All admissions: Type of admissions: All Sites
ᶲ Data collected on selected cohort of eligible admissions only.
0
100
200
300
400
500
600
700
800
900
1000
1100
1200
1300
a b c d e fᶲ g
hᶲ i j k l
m nᶲ
oᶲ p q rᶲ sᶲ
t u v
wᶲ x y z
aa
abᶲ ac ad ae af
Nu
mb
er o
f ad
mis
sio
ns
CNN Hospitals
Inborn Outborn Readmission
D. Descriptive Analyses
9
Presentation #1 (continued) All admissions: Type of admissions: All Sites
Sites Admission Status
Total
Sites Admission status
Total Inborn Outborn Readmission Inborn Outborn Readmission
a Count 338 48 7 393
q Count 273 7 1 281
% 86.0 12.2 1.8 (100.0) % 97.2 2.5 0.4 (100.0)
b Count 277 15 5 297
rᶲ Count 117 12 0 129
% 93.3 5.1 1.7 (100.0) % 90.7 9.3 0.0 (100.0)
c Count 349 42 1 392
sᶲ Count 157 21 2 180
% 89.0 10.7 0.3 (100.0) % 87.2 11.7 1.1 (100.0)
d Count 795 223 62 1080
t Count 251 67 6 324
% 73.6 20.7 5.7 (100.0) % 77.5 20.7 1.9 (100.0)
e Count 775 193 20 988
u Count 109 19 2 130
% 78.4 19.5 2.0 (100.0) % 83.9 14.6 1.5 (100.0)
fᶲ Count 74 16 1 91
v Count 234 49 6 289
% 81.3 17.6 1.1 (100.0) % 81.0 17.0 2.1 (100.0)
g Count 936 94 12 1042
wᶲ Count 266 143 74 483
% 89.8 9.0 1.2 (100.0) % 55.1 29.6 15.3 (100.0)
hᶲ Count 103 46 9 158
x Count 423 26 15 464
% 65.2 29.1 5.7 (100.0) % 91.2 5.6 3.2 (100.0)
i Count 606 78 6 690
y Count 0 243 13 256
% 87.8 11.3 0.9 (100.0) % 0.0 94.9 5.1 (100.0)
j Count 443 116 4 563
z Count 96 4 7 107
% 78.7 20.6 0.7 (100.0) % 89.7 3.7 6.5 (100.0)
k Count 593 303 7 903
aa Count 0 797 56 853
% 65.7 33.6 0.8 (100.0) % 0.0 93.4 6.6 (100.0)
l Count 405 350 30 785
abᶲ Count 700 134 13 847
% 51.6 44.6 3.8 (100.0) % 82.6 15.8 1.5 (100.0)
m Count 1190 29 30 1249
ac Count 343 99 3 445
% 95.3 2.3 2.4 (100.0) % 77.1 22.3 0.7 (100.0)
nᶲ Count 142 16 5 163
ad Count 524 72 20 616
% 87.1 9.8 3.1 (100.0) % 85.1 11.7 3.3 (100.0)
oᶲ Count 98 23 0 121
ae Count 333 91 6 430
% 81.0 19.0 0.0 (100.0) % 77.4 21.2 1.4 (100.0)
p Count 470 93 10 573
af Count 331 306 22 659
% 82.0 16.2 1.8 (100.0) % 50.2 46.4 3.3 (100.0)
Total number of admissions: 15 981 Inborn: 11 751 (73.5%) Outborn: 3 775 (23.6%) Readmission: 455 (2.9%) Missing data on inborn/outborn status: 0 (0.0%)
COMMENTS: These analyses include 15 981 admissions to participating sites across the CNN during the period of January 1, 2019 to December 31, 2019. After adjusting for readmission, 14 868 neonates are represented. Twenty-four sites collected data on all eligible admissions whereas eight sites (marked by ᶲ) collected data on selected cohort of eligible admissions only. See page 3 for data collection criteria of all participating sites.
D. Descriptive Analyses
10
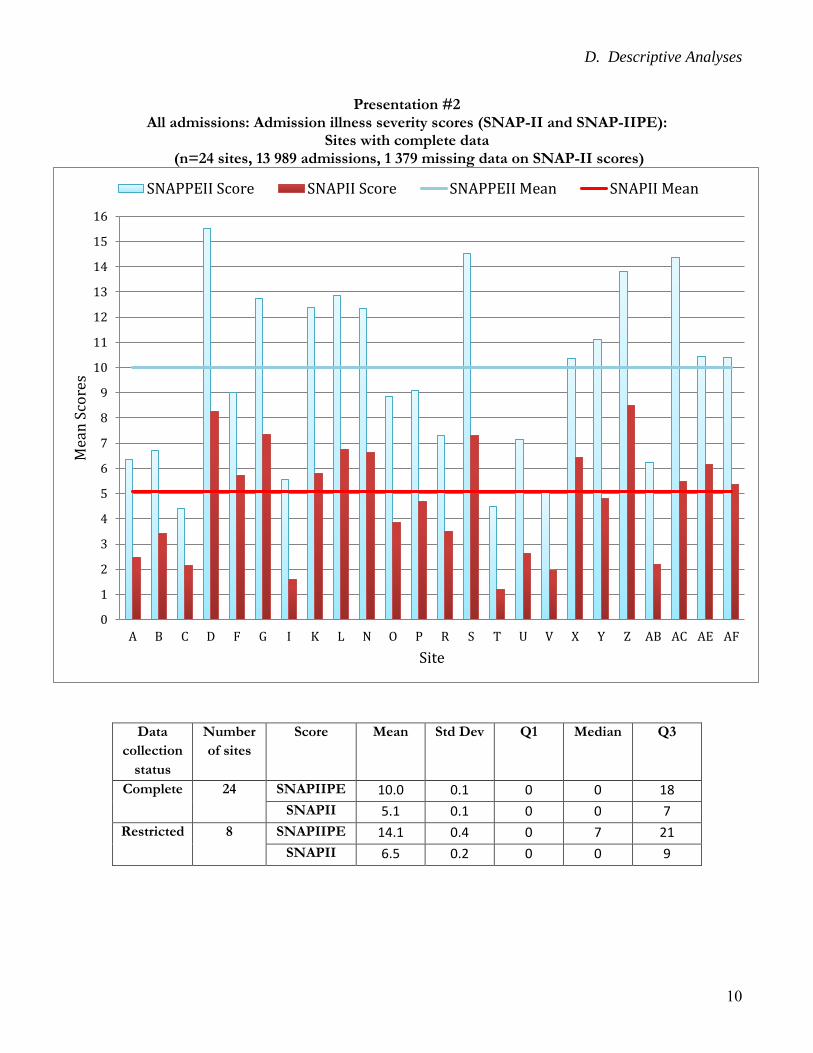
Presentation #2 All admissions: Admission illness severity scores (SNAP-II and SNAP-IIPE):
Sites with complete data (n=24 sites, 13 989 admissions, 1 379 missing data on SNAP-II scores)
Data
collection
status
Number
of sites
Score Mean Std Dev Q1 Median Q3
Complete 24 SNAPIIPE 10.0 0.1 0 0 18
SNAPII 5.1 0.1 0 0 7
Restricted 8 SNAPIIPE 14.1 0.4 0 7 21
SNAPII 6.5 0.2 0 0 9
0
1
2
3
4
5
6
7
8
9
10
11
12
13
14
15
16
A B C D F G I K L N O P R S T U V X Y Z AB AC AE AF
Mea
n S
core
s
Site
SNAPPEII Score SNAPII Score SNAPPEII Mean SNAPII Mean
D. Descriptive Analyses
11
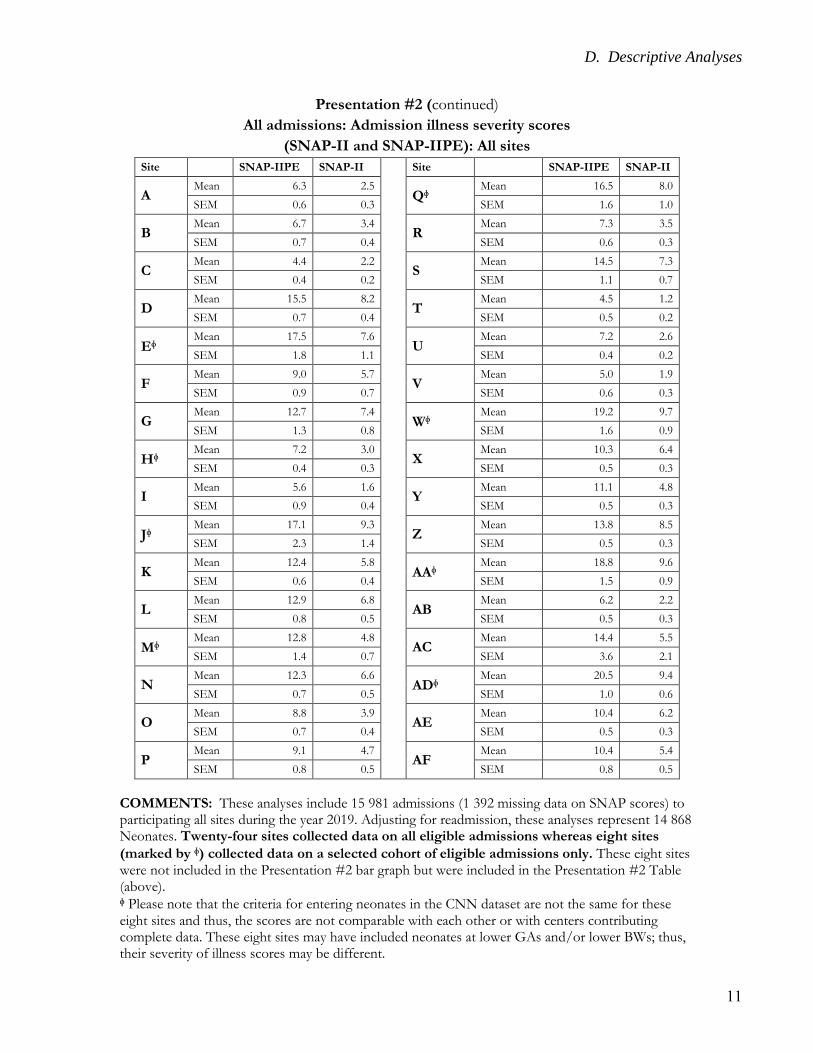
Presentation #2 (continued)
All admissions: Admission illness severity scores
(SNAP-II and SNAP-IIPE): All sites
Site SNAP-IIPE SNAP-II Site SNAP-IIPE SNAP-II
A Mean 6.3 2.5
Qᶲ Mean 16.5 8.0
SEM 0.6 0.3 SEM 1.6 1.0
B Mean 6.7 3.4
R Mean 7.3 3.5
SEM 0.7 0.4 SEM 0.6 0.3
C Mean 4.4 2.2
S Mean 14.5 7.3
SEM 0.4 0.2 SEM 1.1 0.7
D Mean 15.5 8.2
T Mean 4.5 1.2
SEM 0.7 0.4 SEM 0.5 0.2
Eᶲ Mean 17.5 7.6
U Mean 7.2 2.6
SEM 1.8 1.1 SEM 0.4 0.2
F Mean 9.0 5.7
V Mean 5.0 1.9
SEM 0.9 0.7 SEM 0.6 0.3
G Mean 12.7 7.4
Wᶲ Mean 19.2 9.7
SEM 1.3 0.8 SEM 1.6 0.9
Hᶲ Mean 7.2 3.0
X Mean 10.3 6.4
SEM 0.4 0.3 SEM 0.5 0.3
I Mean 5.6 1.6
Y Mean 11.1 4.8
SEM 0.9 0.4 SEM 0.5 0.3
Jᶲ Mean 17.1 9.3
Z Mean 13.8 8.5
SEM 2.3 1.4 SEM 0.5 0.3
K Mean 12.4 5.8
AAᶲ Mean 18.8 9.6
SEM 0.6 0.4 SEM 1.5 0.9
L Mean 12.9 6.8
AB Mean 6.2 2.2
SEM 0.8 0.5 SEM 0.5 0.3
Mᶲ Mean 12.8 4.8
AC Mean 14.4 5.5
SEM 1.4 0.7 SEM 3.6 2.1
N Mean 12.3 6.6
ADᶲ Mean 20.5 9.4
SEM 0.7 0.5 SEM 1.0 0.6
O Mean 8.8 3.9
AE Mean 10.4 6.2
SEM 0.7 0.4 SEM 0.5 0.3
P Mean 9.1 4.7
AF Mean 10.4 5.4
SEM 0.8 0.5 SEM 0.8 0.5
COMMENTS: These analyses include 15 981 admissions (1 392 missing data on SNAP scores) to participating all sites during the year 2019. Adjusting for readmission, these analyses represent 14 868 Neonates. Twenty-four sites collected data on all eligible admissions whereas eight sites
(marked by ᶲ) collected data on a selected cohort of eligible admissions only. These eight sites were not included in the Presentation #2 bar graph but were included in the Presentation #2 Table (above).
ᶲ Please note that the criteria for entering neonates in the CNN dataset are not the same for these eight sites and thus, the scores are not comparable with each other or with centers contributing complete data. These eight sites may have included neonates at lower GAs and/or lower BWs; thus, their severity of illness scores may be different.
D. Descriptive Analyses
12
Section D.2
Analyses based on number of eligible neonates admitted to participating sites
These include data from 14 868 eligible neonates admitted to 32 sites. 24 of these sites submitted complete data (n=12 903) on all eligible admitted neonates and 8 sites submitted data on a selected cohort of eligible admitted neonates (n=1 965).
D. Descriptive Analyses
13
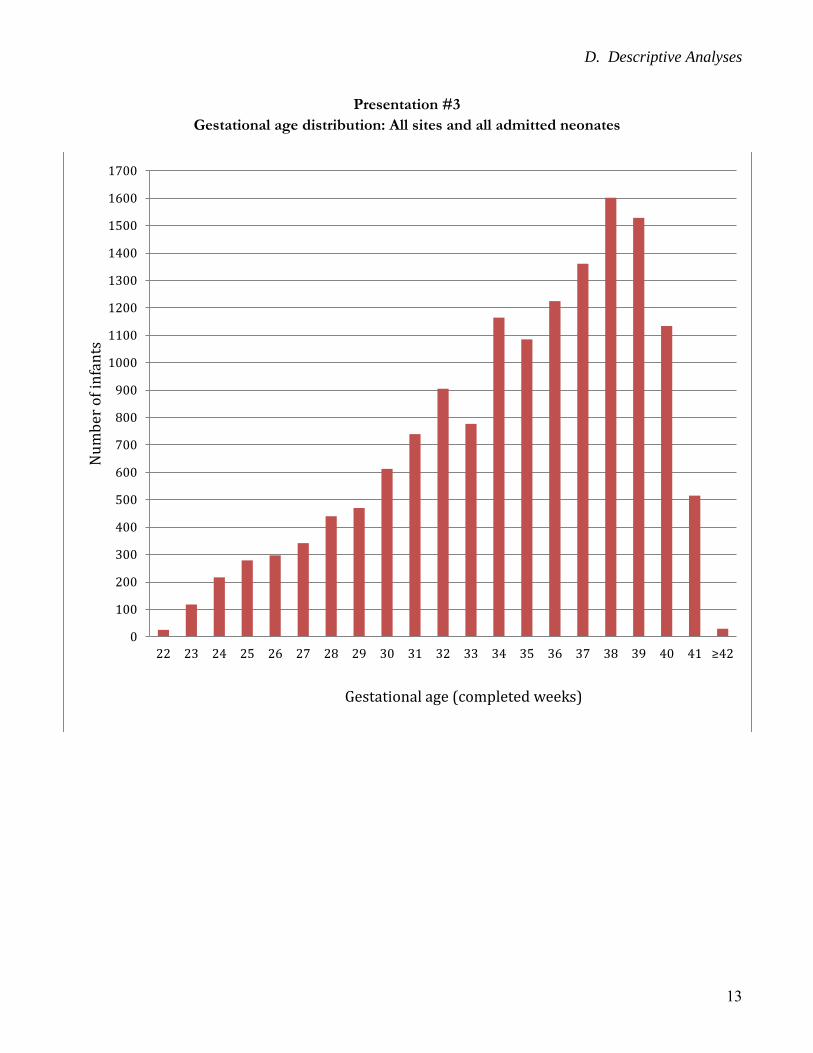
Presentation #3
Gestational age distribution: All sites and all admitted neonates
0
100
200
300
400
500
600
700
800
900
1000
1100
1200
1300
1400
1500
1600
1700
22 23 24 25 26 27 28 29 30 31 32 33 34 35 36 37 38 39 40 41 ≥42
Nu
mb
er o
f in
fan
ts
Gestational age (completed weeks)
D. Descriptive Analyses
14
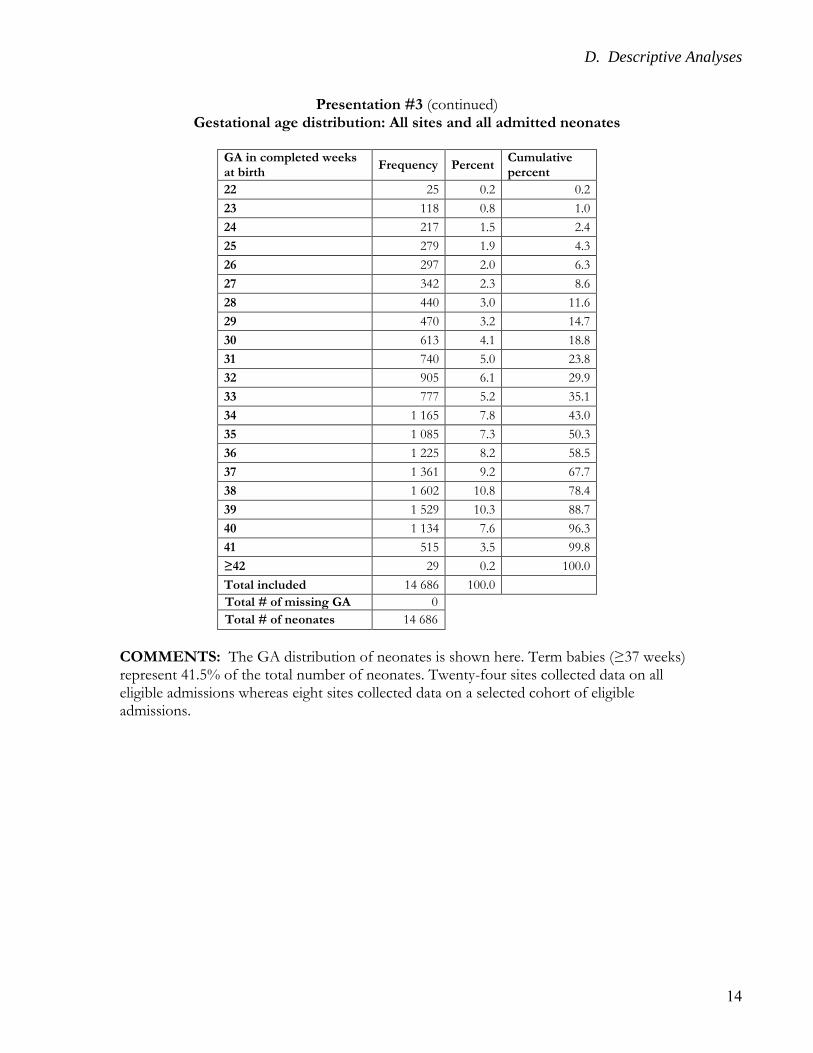
Presentation #3 (continued) Gestational age distribution: All sites and all admitted neonates
GA in completed weeks at birth
Frequency Percent Cumulative percent
22 25 0.2 0.2
23 118 0.8 1.0
24 217 1.5 2.4
25 279 1.9 4.3
26 297 2.0 6.3
27 342 2.3 8.6
28 440 3.0 11.6
29 470 3.2 14.7
30 613 4.1 18.8
31 740 5.0 23.8
32 905 6.1 29.9
33 777 5.2 35.1
34 1 165 7.8 43.0
35 1 085 7.3 50.3
36 1 225 8.2 58.5
37 1 361 9.2 67.7
38 1 602 10.8 78.4
39 1 529 10.3 88.7
40 1 134 7.6 96.3
41 515 3.5 99.8
≥42 29 0.2 100.0
Total included 14 686 100.0
Total # of missing GA 0
Total # of neonates 14 686
COMMENTS: The GA distribution of neonates is shown here. Term babies (≥37 weeks) represent 41.5% of the total number of neonates. Twenty-four sites collected data on all eligible admissions whereas eight sites collected data on a selected cohort of eligible admissions.
D. Descriptive Analyses
15
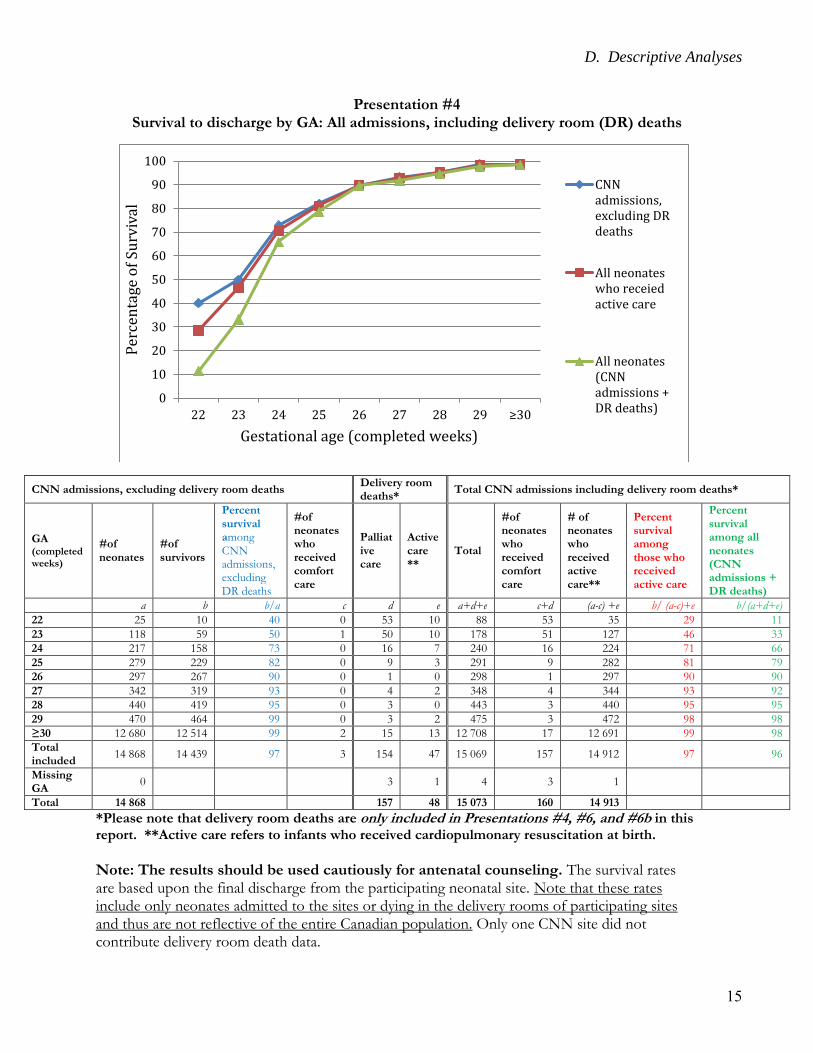
Presentation #4 Survival to discharge by GA: All admissions, including delivery room (DR) deaths
*Please note that delivery room deaths are only included in Presentations #4, #6, and #6b in this report. **Active care refers to infants who received cardiopulmonary resuscitation at birth.
Note: The results should be used cautiously for antenatal counseling. The survival rates are based upon the final discharge from the participating neonatal site. Note that these rates include only neonates admitted to the sites or dying in the delivery rooms of participating sites and thus are not reflective of the entire Canadian population. Only one CNN site did not contribute delivery room death data.
0
10
20
30
40
50
60
70
80
90
100
22 23 24 25 26 27 28 29 ≥30
Per
cen
tage
of
Surv
ival
Gestational age (completed weeks)
CNNadmissions,excluding DRdeaths
All neonateswho receiedactive care
All neonates(CNNadmissions +DR deaths)
CNN admissions, excluding delivery room deaths Delivery room deaths*
Total CNN admissions including delivery room deaths*
GA (completed weeks)
#of neonates
#of survivors
Percent survival among CNN admissions, excluding DR deaths
#of neonates who received comfort care
Palliative care
Active care **
Total
#of neonates who received comfort care
# of neonates who received active care**
Percent survival among those who received active care
Percent survival among all neonates (CNN admissions + DR deaths)
a b b/a c d e a+d+e c+d (a-c) +e b/ (a-c)+e b/(a+d+e)
22 25 10 40 0 53 10 88 53 35 29 11
23 118 59 50 1 50 10 178 51 127 46 33
24 217 158 73 0 16 7 240 16 224 71 66
25 279 229 82 0 9 3 291 9 282 81 79
26 297 267 90 0 1 0 298 1 297 90 90
27 342 319 93 0 4 2 348 4 344 93 92
28 440 419 95 0 3 0 443 3 440 95 95
29 470 464 99 0 3 2 475 3 472 98 98
≥30 12 680 12 514 99 2 15 13 12 708 17 12 691 99 98
Total included
14 868 14 439 97 3 154 47 15 069 157 14 912 97 96
Missing GA
0 3 1 4 3 1
Total 14 868 157 48 15 073 160 14 913
D. Descriptive Analyses
16
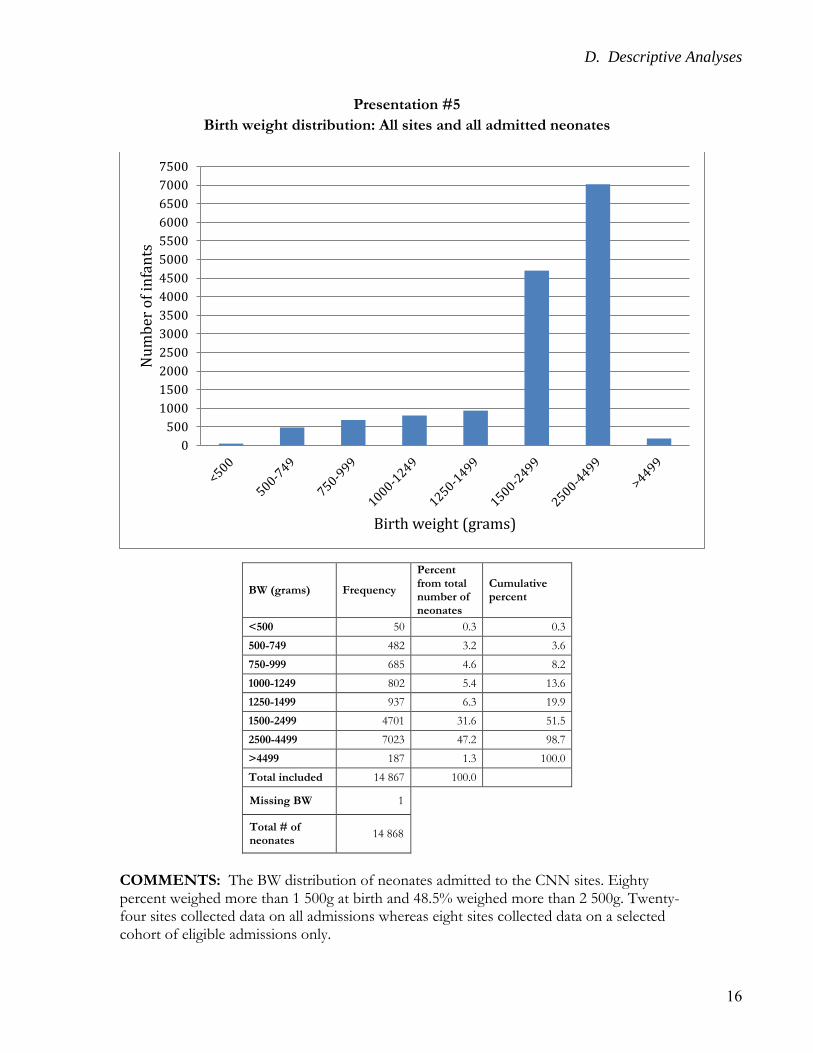
Presentation #5
Birth weight distribution: All sites and all admitted neonates
BW (grams) Frequency
Percent from total number of neonates
Cumulative percent
<500 50 0.3 0.3
500-749 482 3.2 3.6
750-999 685 4.6 8.2
1000-1249 802 5.4 13.6
1250-1499 937 6.3 19.9
1500-2499 4701 31.6 51.5
2500-4499 7023 47.2 98.7
>4499 187 1.3 100.0
Total included 14 867 100.0
Missing BW 1
Total # of neonates
14 868
COMMENTS: The BW distribution of neonates admitted to the CNN sites. Eighty percent weighed more than 1 500g at birth and 48.5% weighed more than 2 500g. Twenty-four sites collected data on all admissions whereas eight sites collected data on a selected cohort of eligible admissions only.
0
500
1000
1500
2000
2500
3000
3500
4000
4500
5000
5500
6000
6500
7000
7500
Nu
mb
er o
f in
fan
ts
Birth weight (grams)
D. Descriptive Analyses
17
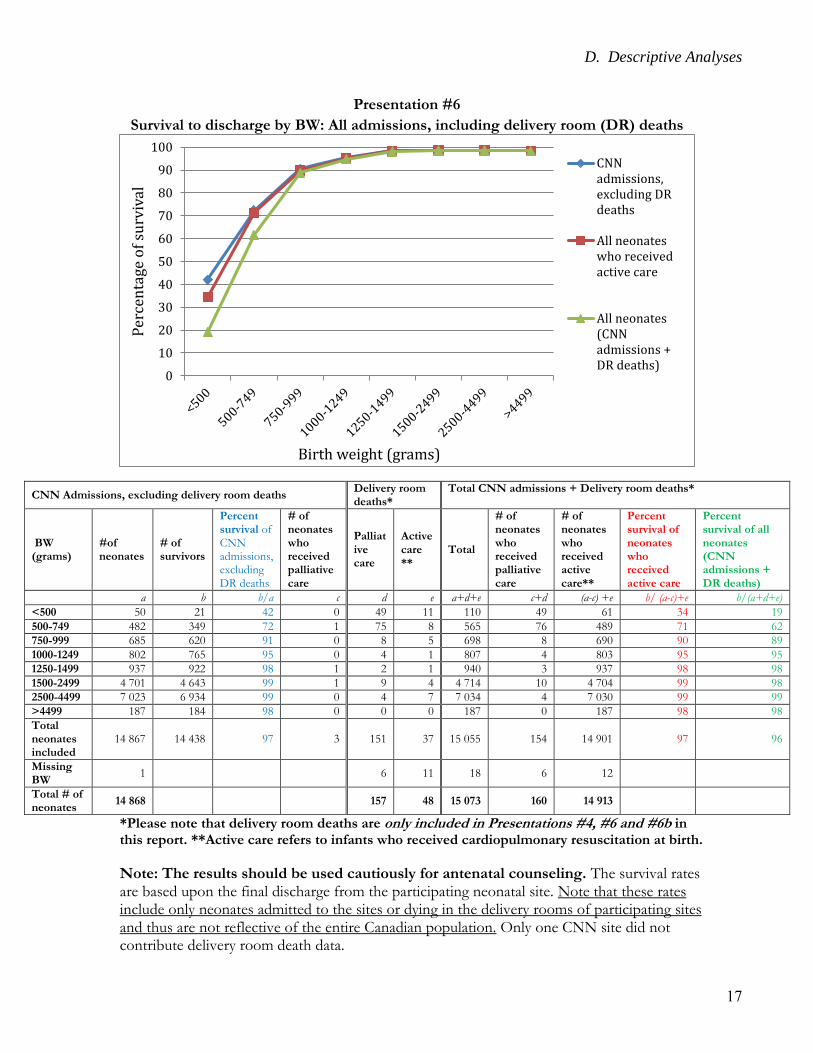
Presentation #6
Survival to discharge by BW: All admissions, including delivery room (DR) deaths
*Please note that delivery room deaths are only included in Presentations #4, #6 and #6b in this report. **Active care refers to infants who received cardiopulmonary resuscitation at birth.
Note: The results should be used cautiously for antenatal counseling. The survival rates are based upon the final discharge from the participating neonatal site. Note that these rates include only neonates admitted to the sites or dying in the delivery rooms of participating sites and thus are not reflective of the entire Canadian population. Only one CNN site did not contribute delivery room death data.
0
10
20
30
40
50
60
70
80
90
100P
erce
nta
ge o
f su
rviv
al
Birth weight (grams)
CNNadmissions,excluding DRdeaths
All neonateswho receivedactive care
All neonates(CNNadmissions +DR deaths)
CNN Admissions, excluding delivery room deaths Delivery room deaths*
Total CNN admissions + Delivery room deaths*
BW (grams)
#of neonates
# of survivors
Percent survival of CNN admissions, excluding DR deaths
# of neonates who received palliative care
Palliative care
Active care **
Total
# of neonates who received palliative care
# of neonates who received active care**
Percent survival of neonates who received active care
Percent survival of all neonates (CNN admissions + DR deaths)
a b b/a c d e a+d+e c+d (a-c) +e b/ (a-c)+e b/(a+d+e)
<500 50 21 42 0 49 11 110 49 61 34 19
500-749 482 349 72 1 75 8 565 76 489 71 62
750-999 685 620 91 0 8 5 698 8 690 90 89
1000-1249 802 765 95 0 4 1 807 4 803 95 95
1250-1499 937 922 98 1 2 1 940 3 937 98 98
1500-2499 4 701 4 643 99 1 9 4 4 714 10 4 704 99 98
2500-4499 7 023 6 934 99 0 4 7 7 034 4 7 030 99 99
>4499 187 184 98 0 0 0 187 0 187 98 98
Total neonates included
14 867 14 438 97 3 151 37 15 055 154 14 901 97 96
Missing BW
1 6 11 18 6 12
Total # of neonates
14 868 157 48 15 073 160 14 913
D. Descriptive Analyses
18
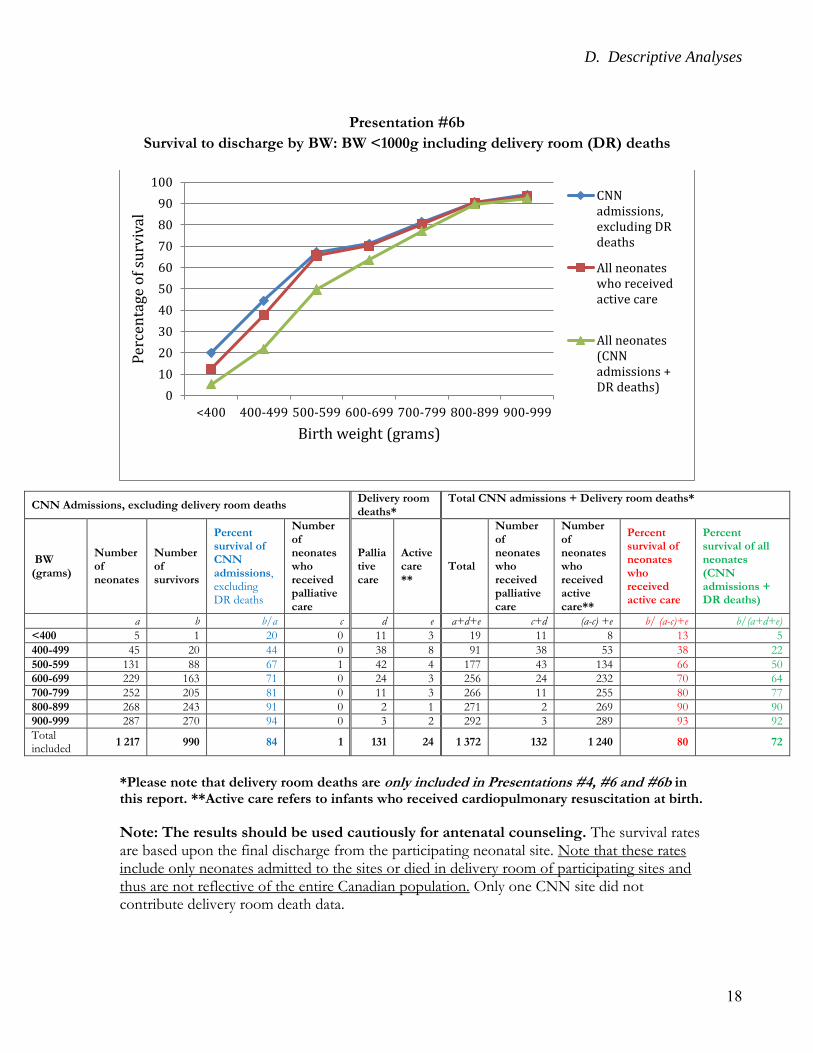
Presentation #6b
Survival to discharge by BW: BW <1000g including delivery room (DR) deaths
*Please note that delivery room deaths are only included in Presentations #4, #6 and #6b in this report. **Active care refers to infants who received cardiopulmonary resuscitation at birth.
Note: The results should be used cautiously for antenatal counseling. The survival rates are based upon the final discharge from the participating neonatal site. Note that these rates include only neonates admitted to the sites or died in delivery room of participating sites and thus are not reflective of the entire Canadian population. Only one CNN site did not contribute delivery room death data.
0
10
20
30
40
50
60
70
80
90
100
<400 400-499 500-599 600-699 700-799 800-899 900-999
Per
cen
tage
of
surv
ival
Birth weight (grams)
CNNadmissions,excluding DRdeaths
All neonateswho receivedactive care
All neonates(CNNadmissions +DR deaths)
CNN Admissions, excluding delivery room deaths Delivery room deaths*
Total CNN admissions + Delivery room deaths*
BW (grams)
Number of neonates
Number of survivors
Percent survival of CNN admissions, excluding DR deaths
Number of neonates who received palliative care
Palliative care
Active care **
Total
Number of neonates who received palliative care
Number of neonates who received active care**
Percent survival of neonates who received active care
Percent survival of all neonates (CNN admissions + DR deaths)
a b b/a c d e a+d+e c+d (a-c) +e b/ (a-c)+e b/(a+d+e)
<400 5 1 20 0 11 3 19 11 8 13 5
400-499 45 20 44 0 38 8 91 38 53 38 22
500-599 131 88 67 1 42 4 177 43 134 66 50
600-699 229 163 71 0 24 3 256 24 232 70 64
700-799 252 205 81 0 11 3 266 11 255 80 77
800-899 268 243 91 0 2 1 271 2 269 90 90
900-999 287 270 94 0 3 2 292 3 289 93 92
Total included
1 217 990 84 1 131 24 1 372 132 1 240 80 72
D. Descriptive Analyses
19
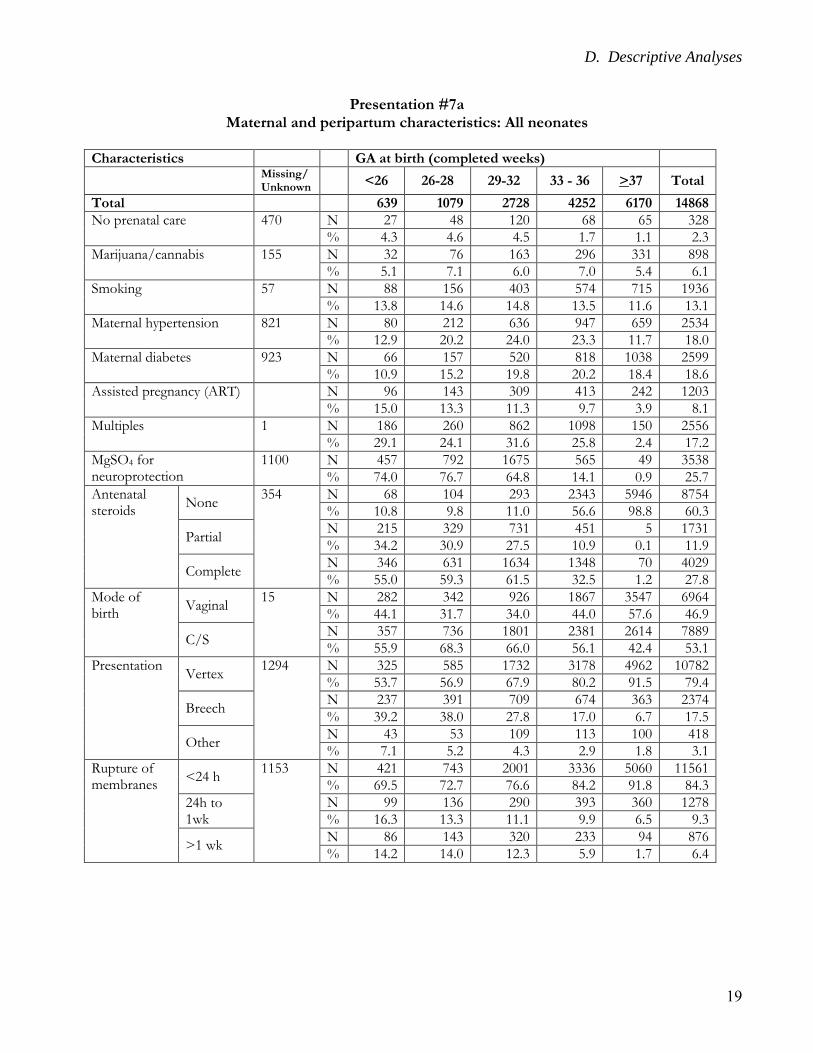
Presentation #7a Maternal and peripartum characteristics: All neonates
Characteristics GA at birth (completed weeks)
Missing/Unknown
<26 26-28 29-32 33 - 36 >37 Total
Total 639 1079 2728 4252 6170 14868
No prenatal care 470 N 27 48 120 68 65 328
% 4.3 4.6 4.5 1.7 1.1 2.3
Marijuana/cannabis 155 N 32 76 163 296 331 898
% 5.1 7.1 6.0 7.0 5.4 6.1
Smoking 57 N 88 156 403 574 715 1936
% 13.8 14.6 14.8 13.5 11.6 13.1
Maternal hypertension 821 N 80 212 636 947 659 2534
% 12.9 20.2 24.0 23.3 11.7 18.0
Maternal diabetes 923 N 66 157 520 818 1038 2599
% 10.9 15.2 19.8 20.2 18.4 18.6
Assisted pregnancy (ART) N 96 143 309 413 242 1203
% 15.0 13.3 11.3 9.7 3.9 8.1
Multiples 1 N 186 260 862 1098 150 2556
% 29.1 24.1 31.6 25.8 2.4 17.2
MgSO4 for neuroprotection
1100 N 457 792 1675 565 49 3538
% 74.0 76.7 64.8 14.1 0.9 25.7
Antenatal steroids
None 354 N 68 104 293 2343 5946 8754
% 10.8 9.8 11.0 56.6 98.8 60.3
Partial N 215 329 731 451 5 1731
% 34.2 30.9 27.5 10.9 0.1 11.9
Complete N 346 631 1634 1348 70 4029
% 55.0 59.3 61.5 32.5 1.2 27.8
Mode of birth
Vaginal 15 N 282 342 926 1867 3547 6964
% 44.1 31.7 34.0 44.0 57.6 46.9
C/S N 357 736 1801 2381 2614 7889
% 55.9 68.3 66.0 56.1 42.4 53.1
Presentation Vertex
1294 N 325 585 1732 3178 4962 10782
% 53.7 56.9 67.9 80.2 91.5 79.4
Breech N 237 391 709 674 363 2374
% 39.2 38.0 27.8 17.0 6.7 17.5
Other N 43 53 109 113 100 418
% 7.1 5.2 4.3 2.9 1.8 3.1
Rupture of membranes
<24 h 1153 N 421 743 2001 3336 5060 11561
% 69.5 72.7 76.6 84.2 91.8 84.3
24h to 1wk
N 99 136 290 393 360 1278
% 16.3 13.3 11.1 9.9 6.5 9.3
>1 wk N 86 143 320 233 94 876
% 14.2 14.0 12.3 5.9 1.7 6.4
D. Descriptive Analyses
20
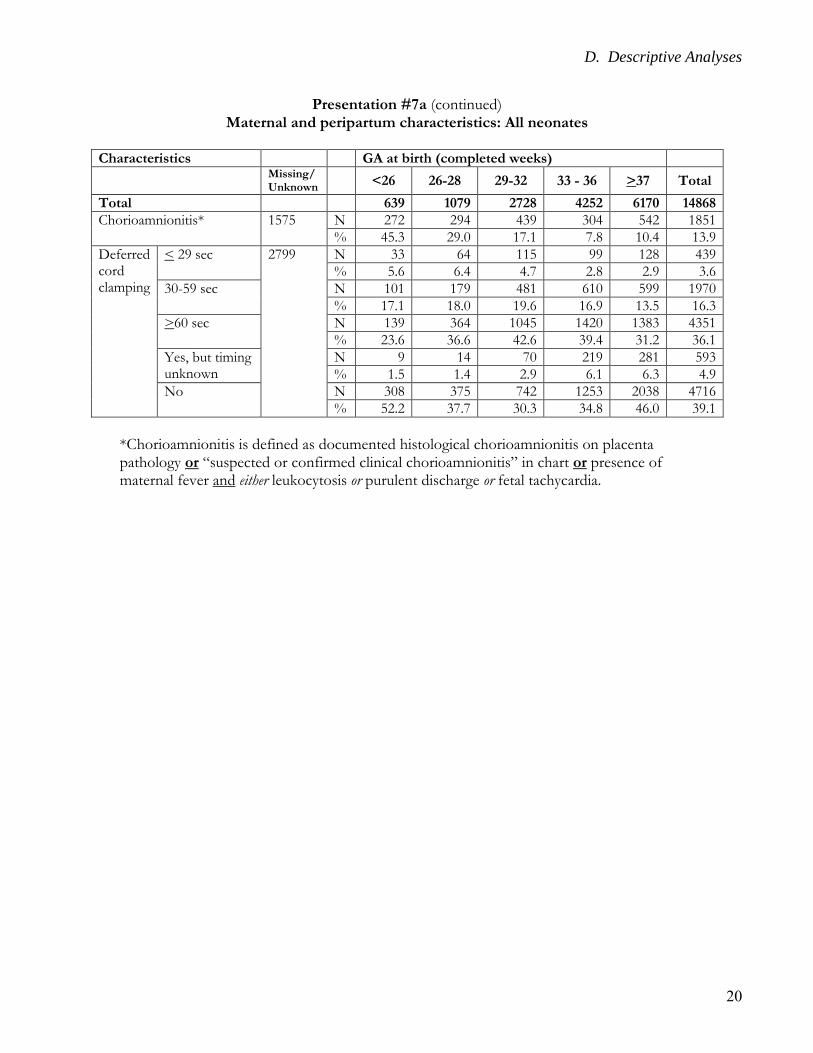
Presentation #7a (continued) Maternal and peripartum characteristics: All neonates
Characteristics GA at birth (completed weeks)
Missing/Unknown
<26 26-28 29-32 33 - 36 >37 Total
Total 639 1079 2728 4252 6170 14868
Chorioamnionitis* 1575 N 272 294 439 304 542 1851
% 45.3 29.0 17.1 7.8 10.4 13.9
Deferred cord clamping
< 29 sec 2799 N 33 64 115 99 128 439
% 5.6 6.4 4.7 2.8 2.9 3.6
30-59 sec N 101 179 481 610 599 1970
% 17.1 18.0 19.6 16.9 13.5 16.3
>60 sec N 139 364 1045 1420 1383 4351
% 23.6 36.6 42.6 39.4 31.2 36.1
Yes, but timing unknown
N 9 14 70 219 281 593
% 1.5 1.4 2.9 6.1 6.3 4.9
No N 308 375 742 1253 2038 4716
% 52.2 37.7 30.3 34.8 46.0 39.1
*Chorioamnionitis is defined as documented histological chorioamnionitis on placenta pathology or “suspected or confirmed clinical chorioamnionitis” in chart or presence of maternal fever and either leukocytosis or purulent discharge or fetal tachycardia.
D. Descriptive Analyses
21
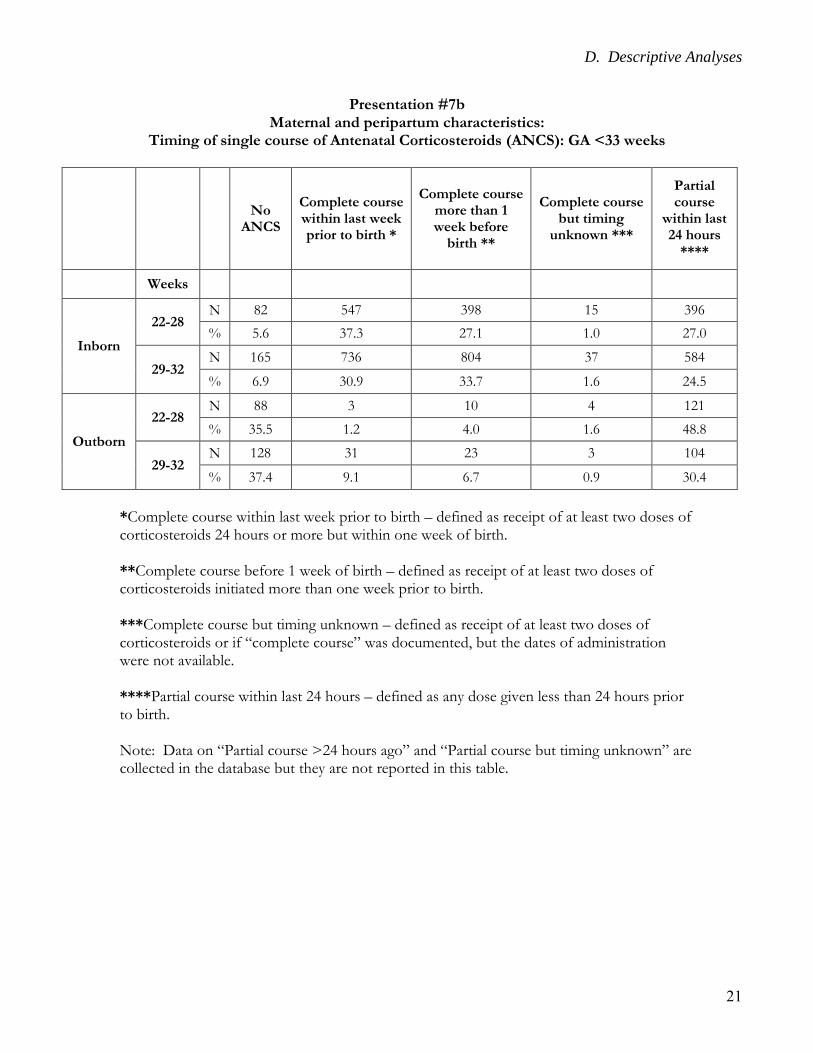
Presentation #7b Maternal and peripartum characteristics:
Timing of single course of Antenatal Corticosteroids (ANCS): GA <33 weeks
No
ANCS
Complete course within last week prior to birth *
Complete course more than 1 week before
birth **
Complete course but timing
unknown ***
Partial course
within last 24 hours
****
Weeks
Inborn
22-28 N 82 547 398 15 396
% 5.6 37.3 27.1 1.0 27.0
29-32 N 165 736 804 37 584
% 6.9 30.9 33.7 1.6 24.5
Outborn
22-28 N 88 3 10 4 121
% 35.5 1.2 4.0 1.6 48.8
29-32 N 128 31 23 3 104
% 37.4 9.1 6.7 0.9 30.4
*Complete course within last week prior to birth – defined as receipt of at least two doses of corticosteroids 24 hours or more but within one week of birth. **Complete course before 1 week of birth – defined as receipt of at least two doses of corticosteroids initiated more than one week prior to birth. ***Complete course but timing unknown – defined as receipt of at least two doses of corticosteroids or if “complete course” was documented, but the dates of administration were not available. ****Partial course within last 24 hours – defined as any dose given less than 24 hours prior to birth. Note: Data on “Partial course >24 hours ago” and “Partial course but timing unknown” are collected in the database but they are not reported in this table.
D. Descriptive Analyses
22
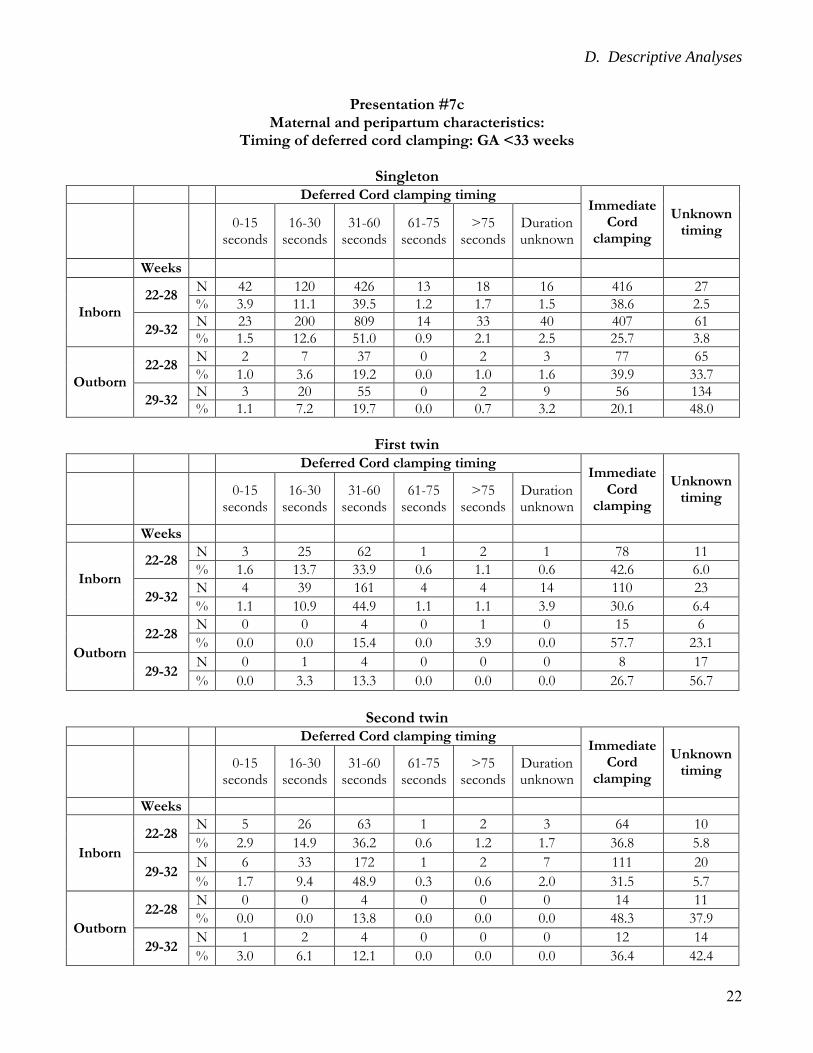
Presentation #7c Maternal and peripartum characteristics:
Timing of deferred cord clamping: GA <33 weeks
Singleton Deferred Cord clamping timing
Immediate Cord
clamping
Unknown timing
0-15 seconds
16-30 seconds
31-60 seconds
61-75 seconds
>75 seconds
Duration unknown
Weeks
Inborn
22-28 N 42 120 426 13 18 16 416 27
% 3.9 11.1 39.5 1.2 1.7 1.5 38.6 2.5
29-32 N 23 200 809 14 33 40 407 61
% 1.5 12.6 51.0 0.9 2.1 2.5 25.7 3.8
Outborn
22-28 N 2 7 37 0 2 3 77 65
% 1.0 3.6 19.2 0.0 1.0 1.6 39.9 33.7
29-32 N 3 20 55 0 2 9 56 134
% 1.1 7.2 19.7 0.0 0.7 3.2 20.1 48.0
First twin
Deferred Cord clamping timing Immediate
Cord clamping
Unknown timing
0-15 seconds
16-30 seconds
31-60 seconds
61-75 seconds
>75 seconds
Duration unknown
Weeks
Inborn
22-28 N 3 25 62 1 2 1 78 11
% 1.6 13.7 33.9 0.6 1.1 0.6 42.6 6.0
29-32 N 4 39 161 4 4 14 110 23
% 1.1 10.9 44.9 1.1 1.1 3.9 30.6 6.4
Outborn
22-28 N 0 0 4 0 1 0 15 6
% 0.0 0.0 15.4 0.0 3.9 0.0 57.7 23.1
29-32 N 0 1 4 0 0 0 8 17
% 0.0 3.3 13.3 0.0 0.0 0.0 26.7 56.7
Second twin
Deferred Cord clamping timing Immediate
Cord clamping
Unknown timing
0-15 seconds
16-30 seconds
31-60 seconds
61-75 seconds
>75 seconds
Duration unknown
Weeks
Inborn
22-28 N 5 26 63 1 2 3 64 10
% 2.9 14.9 36.2 0.6 1.2 1.7 36.8 5.8
29-32 N 6 33 172 1 2 7 111 20
% 1.7 9.4 48.9 0.3 0.6 2.0 31.5 5.7
Outborn
22-28 N 0 0 4 0 0 0 14 11
% 0.0 0.0 13.8 0.0 0.0 0.0 48.3 37.9
29-32 N 1 2 4 0 0 0 12 14
% 3.0 6.1 12.1 0.0 0.0 0.0 36.4 42.4
D. Descriptive Analyses
23
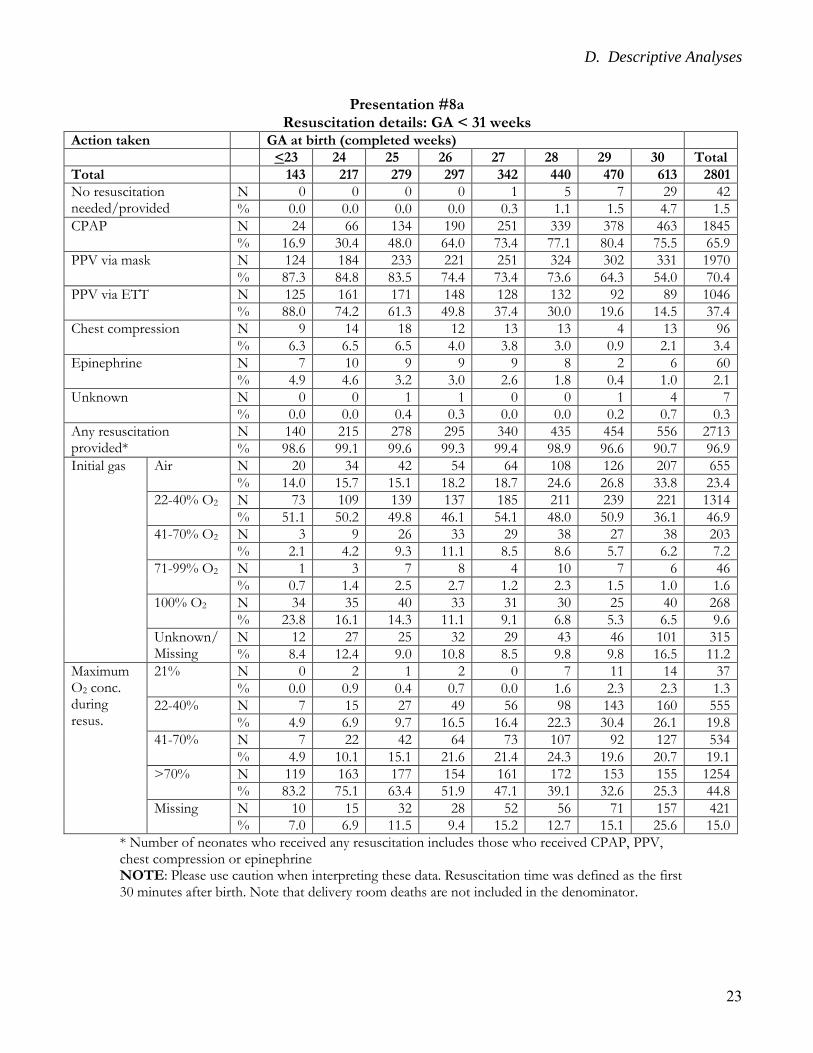
Presentation #8a Resuscitation details: GA < 31 weeks
Action taken GA at birth (completed weeks)
<23 24 25 26 27 28 29 30 Total
Total 143 217 279 297 342 440 470 613 2801
No resuscitation needed/provided
N 0 0 0 0 1 5 7 29 42
% 0.0 0.0 0.0 0.0 0.3 1.1 1.5 4.7 1.5
CPAP N 24 66 134 190 251 339 378 463 1845
% 16.9 30.4 48.0 64.0 73.4 77.1 80.4 75.5 65.9
PPV via mask N 124 184 233 221 251 324 302 331 1970
% 87.3 84.8 83.5 74.4 73.4 73.6 64.3 54.0 70.4
PPV via ETT N 125 161 171 148 128 132 92 89 1046
% 88.0 74.2 61.3 49.8 37.4 30.0 19.6 14.5 37.4
Chest compression N 9 14 18 12 13 13 4 13 96
% 6.3 6.5 6.5 4.0 3.8 3.0 0.9 2.1 3.4
Epinephrine N 7 10 9 9 9 8 2 6 60
% 4.9 4.6 3.2 3.0 2.6 1.8 0.4 1.0 2.1
Unknown N 0 0 1 1 0 0 1 4 7
% 0.0 0.0 0.4 0.3 0.0 0.0 0.2 0.7 0.3
Any resuscitation provided*
N 140 215 278 295 340 435 454 556 2713
% 98.6 99.1 99.6 99.3 99.4 98.9 96.6 90.7 96.9
Initial gas Air N 20 34 42 54 64 108 126 207 655
% 14.0 15.7 15.1 18.2 18.7 24.6 26.8 33.8 23.4
22-40% O2 N 73 109 139 137 185 211 239 221 1314
% 51.1 50.2 49.8 46.1 54.1 48.0 50.9 36.1 46.9
41-70% O2 N 3 9 26 33 29 38 27 38 203
% 2.1 4.2 9.3 11.1 8.5 8.6 5.7 6.2 7.2
71-99% O2 N 1 3 7 8 4 10 7 6 46
% 0.7 1.4 2.5 2.7 1.2 2.3 1.5 1.0 1.6
100% O2 N 34 35 40 33 31 30 25 40 268
% 23.8 16.1 14.3 11.1 9.1 6.8 5.3 6.5 9.6
Unknown/Missing
N 12 27 25 32 29 43 46 101 315
% 8.4 12.4 9.0 10.8 8.5 9.8 9.8 16.5 11.2
Maximum O2 conc. during resus.
21% N 0 2 1 2 0 7 11 14 37
% 0.0 0.9 0.4 0.7 0.0 1.6 2.3 2.3 1.3
22-40% N 7 15 27 49 56 98 143 160 555
% 4.9 6.9 9.7 16.5 16.4 22.3 30.4 26.1 19.8
41-70% N 7 22 42 64 73 107 92 127 534
% 4.9 10.1 15.1 21.6 21.4 24.3 19.6 20.7 19.1
>70% N 119 163 177 154 161 172 153 155 1254
% 83.2 75.1 63.4 51.9 47.1 39.1 32.6 25.3 44.8
Missing N 10 15 32 28 52 56 71 157 421
% 7.0 6.9 11.5 9.4 15.2 12.7 15.1 25.6 15.0
* Number of neonates who received any resuscitation includes those who received CPAP, PPV, chest compression or epinephrine NOTE: Please use caution when interpreting these data. Resuscitation time was defined as the first 30 minutes after birth. Note that delivery room deaths are not included in the denominator.
D. Descriptive Analyses
24
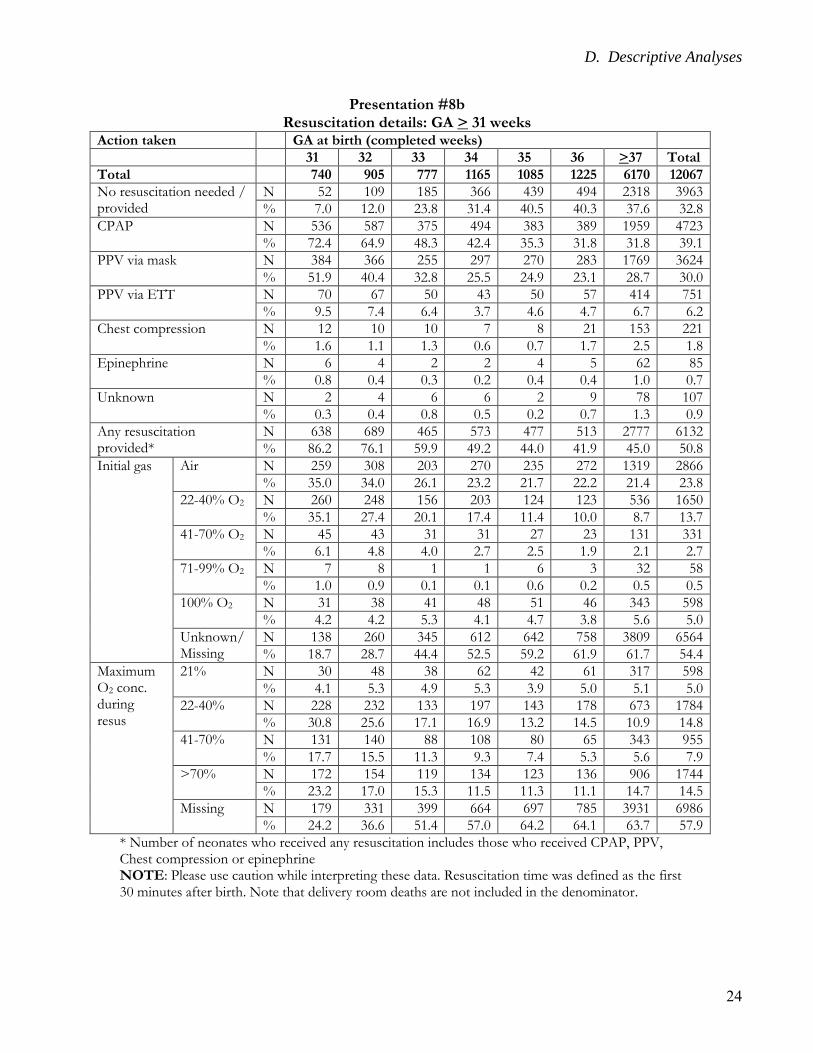
Presentation #8b Resuscitation details: GA > 31 weeks
Action taken GA at birth (completed weeks)
31 32 33 34 35 36 >37 Total
Total 740 905 777 1165 1085 1225 6170 12067
No resuscitation needed / provided
N 52 109 185 366 439 494 2318 3963
% 7.0 12.0 23.8 31.4 40.5 40.3 37.6 32.8
CPAP N 536 587 375 494 383 389 1959 4723
% 72.4 64.9 48.3 42.4 35.3 31.8 31.8 39.1
PPV via mask N 384 366 255 297 270 283 1769 3624
% 51.9 40.4 32.8 25.5 24.9 23.1 28.7 30.0
PPV via ETT N 70 67 50 43 50 57 414 751
% 9.5 7.4 6.4 3.7 4.6 4.7 6.7 6.2
Chest compression N 12 10 10 7 8 21 153 221
% 1.6 1.1 1.3 0.6 0.7 1.7 2.5 1.8
Epinephrine N 6 4 2 2 4 5 62 85
% 0.8 0.4 0.3 0.2 0.4 0.4 1.0 0.7
Unknown N 2 4 6 6 2 9 78 107
% 0.3 0.4 0.8 0.5 0.2 0.7 1.3 0.9
Any resuscitation provided*
N 638 689 465 573 477 513 2777 6132
% 86.2 76.1 59.9 49.2 44.0 41.9 45.0 50.8
Initial gas Air N 259 308 203 270 235 272 1319 2866
% 35.0 34.0 26.1 23.2 21.7 22.2 21.4 23.8
22-40% O2 N 260 248 156 203 124 123 536 1650
% 35.1 27.4 20.1 17.4 11.4 10.0 8.7 13.7
41-70% O2 N 45 43 31 31 27 23 131 331
% 6.1 4.8 4.0 2.7 2.5 1.9 2.1 2.7
71-99% O2 N 7 8 1 1 6 3 32 58
% 1.0 0.9 0.1 0.1 0.6 0.2 0.5 0.5
100% O2 N 31 38 41 48 51 46 343 598
% 4.2 4.2 5.3 4.1 4.7 3.8 5.6 5.0
Unknown/Missing
N 138 260 345 612 642 758 3809 6564
% 18.7 28.7 44.4 52.5 59.2 61.9 61.7 54.4
Maximum O2 conc. during resus
21% N 30 48 38 62 42 61 317 598
% 4.1 5.3 4.9 5.3 3.9 5.0 5.1 5.0
22-40% N 228 232 133 197 143 178 673 1784
% 30.8 25.6 17.1 16.9 13.2 14.5 10.9 14.8
41-70% N 131 140 88 108 80 65 343 955
% 17.7 15.5 11.3 9.3 7.4 5.3 5.6 7.9
>70% N 172 154 119 134 123 136 906 1744
% 23.2 17.0 15.3 11.5 11.3 11.1 14.7 14.5
Missing N 179 331 399 664 697 785 3931 6986
% 24.2 36.6 51.4 57.0 64.2 64.1 63.7 57.9
* Number of neonates who received any resuscitation includes those who received CPAP, PPV, Chest compression or epinephrine NOTE: Please use caution while interpreting these data. Resuscitation time was defined as the first 30 minutes after birth. Note that delivery room deaths are not included in the denominator.
D. Descriptive Analyses
25
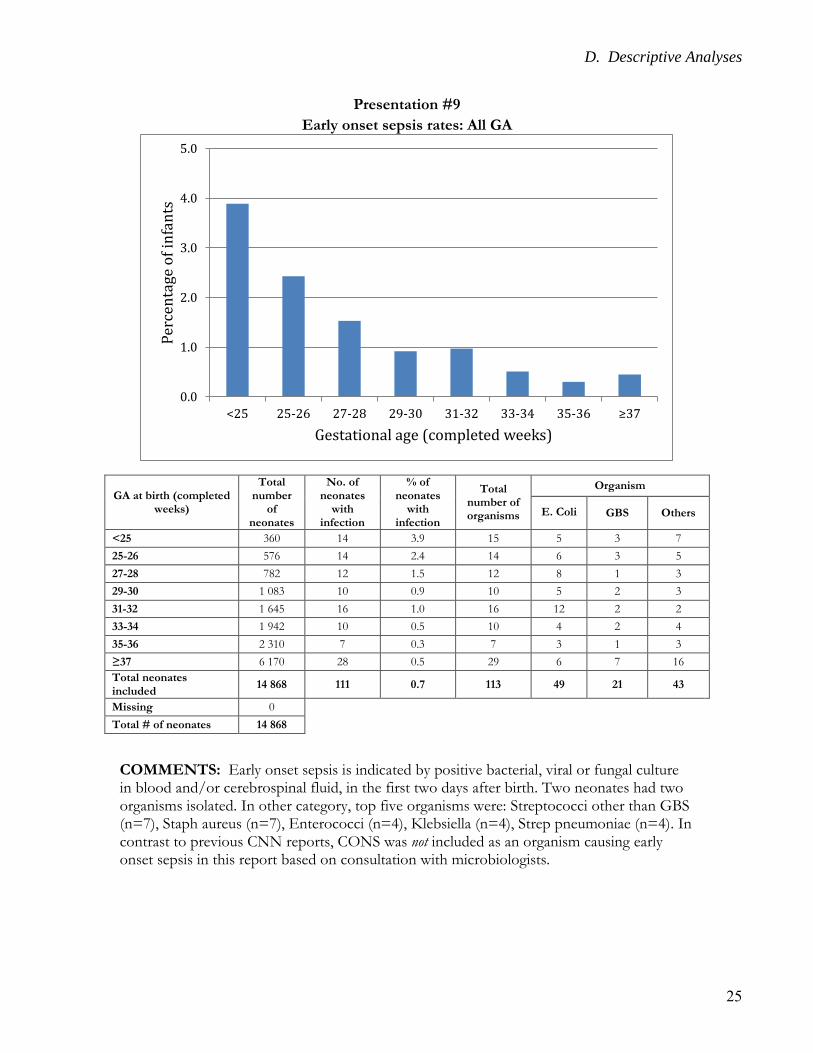
Presentation #9
Early onset sepsis rates: All GA
GA at birth (completed weeks)
Total number
of neonates
No. of neonates
with infection
% of neonates
with infection
Total number of organisms
Organism
E. Coli GBS Others
<25 360 14 3.9 15 5 3 7
25-26 576 14 2.4 14 6 3 5
27-28 782 12 1.5 12 8 1 3
29-30 1 083 10 0.9 10 5 2 3
31-32 1 645 16 1.0 16 12 2 2
33-34 1 942 10 0.5 10 4 2 4
35-36 2 310 7 0.3 7 3 1 3
≥37 6 170 28 0.5 29 6 7 16
Total neonates included
14 868 111 0.7 113 49 21 43
Missing 0
Total # of neonates 14 868
COMMENTS: Early onset sepsis is indicated by positive bacterial, viral or fungal culture in blood and/or cerebrospinal fluid, in the first two days after birth. Two neonates had two organisms isolated. In other category, top five organisms were: Streptococci other than GBS (n=7), Staph aureus (n=7), Enterococci (n=4), Klebsiella (n=4), Strep pneumoniae (n=4). In contrast to previous CNN reports, CONS was not included as an organism causing early onset sepsis in this report based on consultation with microbiologists.
0.0
1.0
2.0
3.0
4.0
5.0
<25 25-26 27-28 29-30 31-32 33-34 35-36 ≥37
Per
cen
tage
of
infa
nts
Gestational age (completed weeks)
D. Descriptive Analyses
26
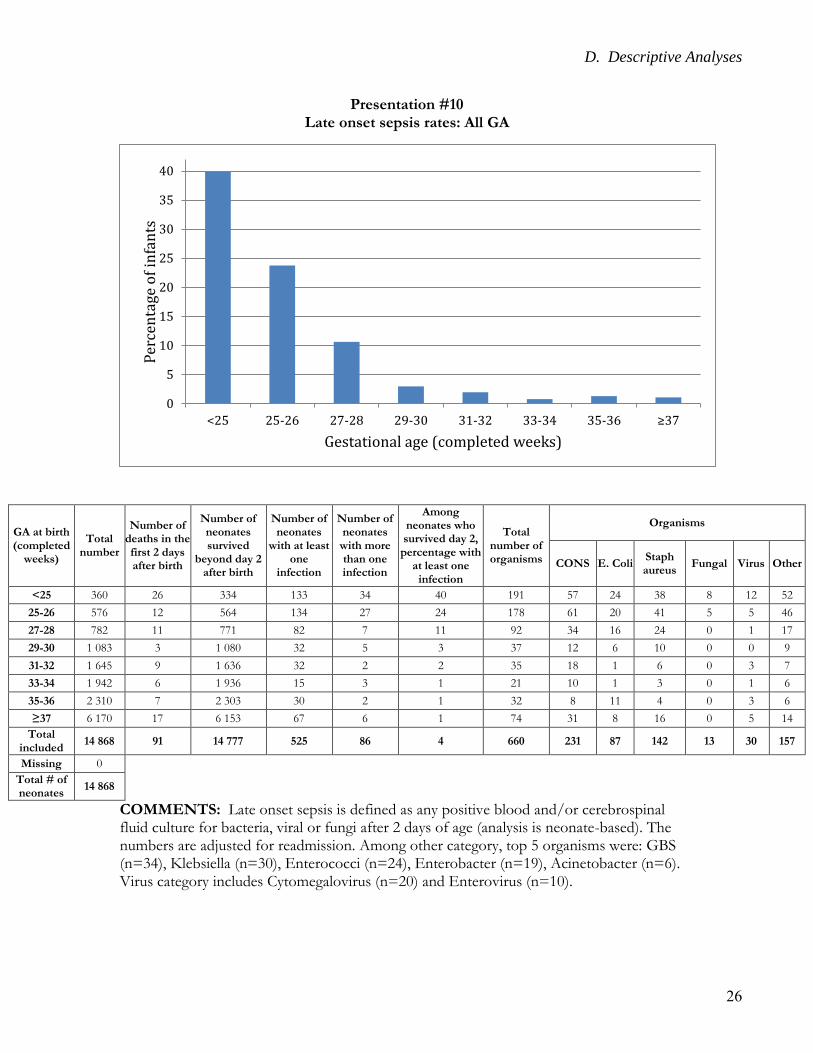
Presentation #10 Late onset sepsis rates: All GA
COMMENTS: Late onset sepsis is defined as any positive blood and/or cerebrospinal fluid culture for bacteria, viral or fungi after 2 days of age (analysis is neonate-based). The numbers are adjusted for readmission. Among other category, top 5 organisms were: GBS (n=34), Klebsiella (n=30), Enterococci (n=24), Enterobacter (n=19), Acinetobacter (n=6). Virus category includes Cytomegalovirus (n=20) and Enterovirus (n=10).
0
5
10
15
20
25
30
35
40
<25 25-26 27-28 29-30 31-32 33-34 35-36 ≥37
Per
cen
tage
of
infa
nts
Gestational age (completed weeks)
GA at birth (completed
weeks)
Total number
Number of deaths in the first 2 days after birth
Number of neonates survived
beyond day 2 after birth
Number of neonates
with at least one
infection
Number of neonates
with more than one infection
Among neonates who survived day 2,
percentage with at least one
infection
Total number of organisms
Organisms
CONS E. Coli Staph aureus
Fungal Virus Other
<25 360 26 334 133 34 40 191 57 24 38 8 12 52
25-26 576 12 564 134 27 24 178 61 20 41 5 5 46
27-28 782 11 771 82 7 11 92 34 16 24 0 1 17
29-30 1 083 3 1 080 32 5 3 37 12 6 10 0 0 9
31-32 1 645 9 1 636 32 2 2 35 18 1 6 0 3 7
33-34 1 942 6 1 936 15 3 1 21 10 1 3 0 1 6
35-36 2 310 7 2 303 30 2 1 32 8 11 4 0 3 6
≥37 6 170 17 6 153 67 6 1 74 31 8 16 0 5 14
Total included
14 868 91 14 777 525 86 4 660 231 87 142 13 30 157
Missing 0
Total # of neonates
14 868
D. Descriptive Analyses
27
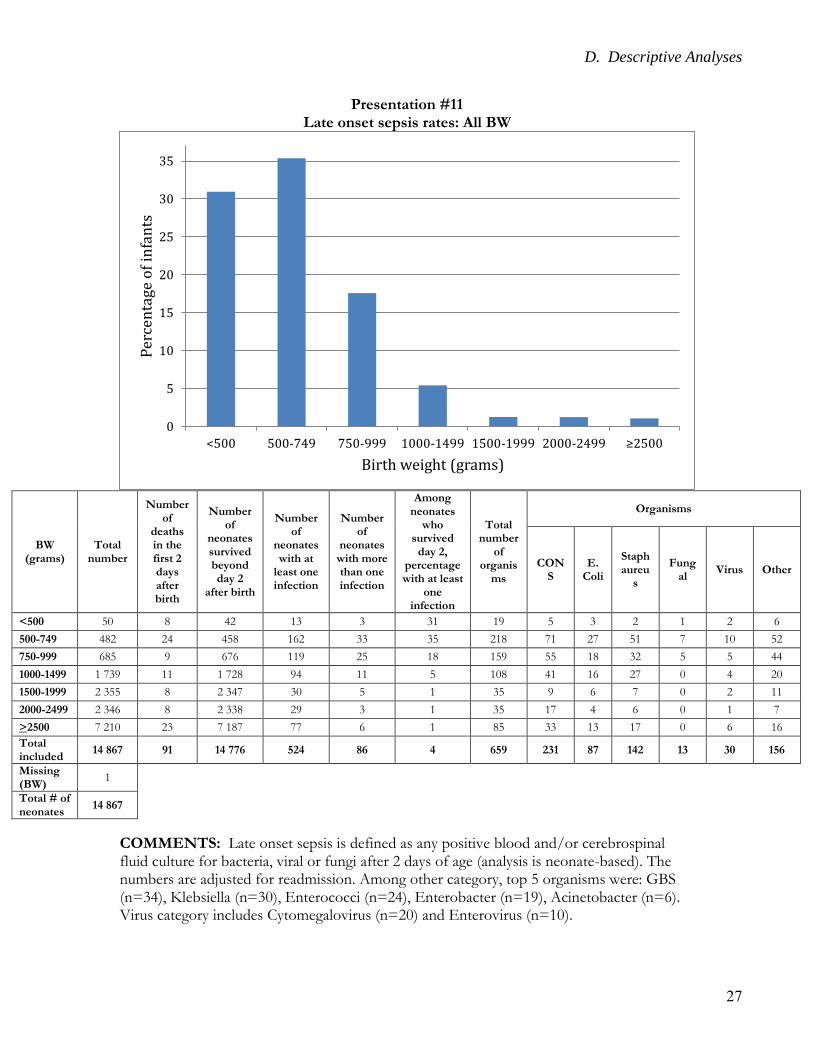
Presentation #11 Late onset sepsis rates: All BW
BW (grams)
Total number
Number of
deaths in the first 2 days after birth
Number of
neonates survived beyond day 2
after birth
Number of
neonates with at
least one infection
Number of
neonates with more than one infection
Among neonates
who survived
day 2, percentage with at least
one infection
Total number
of organis
ms
Organisms
CONS
E. Coli
Staph aureu
s
Fungal
Virus Other
<500 50 8 42 13 3 31 19 5 3 2 1 2 6
500-749 482 24 458 162 33 35 218 71 27 51 7 10 52
750-999 685 9 676 119 25 18 159 55 18 32 5 5 44
1000-1499 1 739 11 1 728 94 11 5 108 41 16 27 0 4 20
1500-1999 2 355 8 2 347 30 5 1 35 9 6 7 0 2 11
2000-2499 2 346 8 2 338 29 3 1 35 17 4 6 0 1 7
>2500 7 210 23 7 187 77 6 1 85 33 13 17 0 6 16
Total included
14 867 91 14 776 524 86 4 659 231 87 142 13 30 156
Missing (BW)
1
Total # of neonates
14 867
COMMENTS: Late onset sepsis is defined as any positive blood and/or cerebrospinal fluid culture for bacteria, viral or fungi after 2 days of age (analysis is neonate-based). The numbers are adjusted for readmission. Among other category, top 5 organisms were: GBS (n=34), Klebsiella (n=30), Enterococci (n=24), Enterobacter (n=19), Acinetobacter (n=6). Virus category includes Cytomegalovirus (n=20) and Enterovirus (n=10).
0
5
10
15
20
25
30
35
<500 500-749 750-999 1000-1499 1500-1999 2000-2499 ≥2500
Per
cen
tage
of
infa
nts
Birth weight (grams)
D. Descriptive Analyses
28
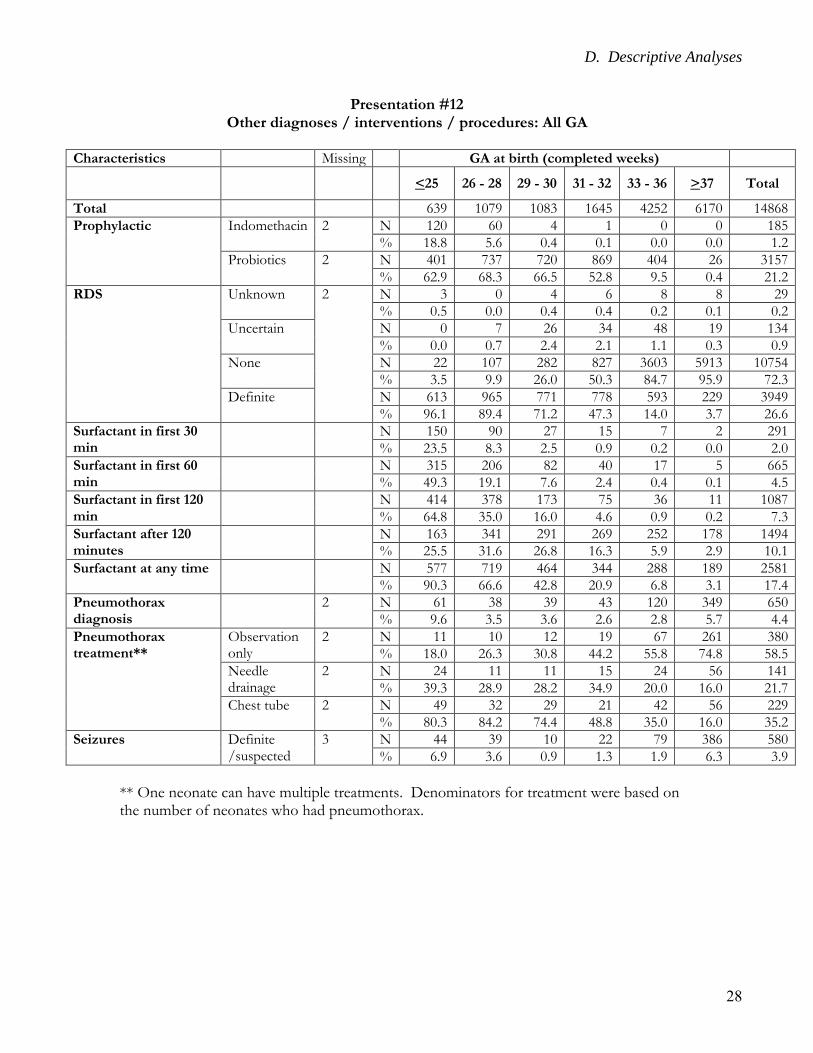
Presentation #12 Other diagnoses / interventions / procedures: All GA
Characteristics Missing GA at birth (completed weeks)
<25 26 - 28 29 - 30 31 - 32 33 - 36 >37 Total
Total 639 1079 1083 1645 4252 6170 14868
Prophylactic Indomethacin 2 N 120 60 4 1 0 0 185
% 18.8 5.6 0.4 0.1 0.0 0.0 1.2
Probiotics 2 N 401 737 720 869 404 26 3157
% 62.9 68.3 66.5 52.8 9.5 0.4 21.2
RDS Unknown 2 N 3 0 4 6 8 8 29
% 0.5 0.0 0.4 0.4 0.2 0.1 0.2
Uncertain N 0 7 26 34 48 19 134
% 0.0 0.7 2.4 2.1 1.1 0.3 0.9
None N 22 107 282 827 3603 5913 10754
% 3.5 9.9 26.0 50.3 84.7 95.9 72.3
Definite N 613 965 771 778 593 229 3949
% 96.1 89.4 71.2 47.3 14.0 3.7 26.6
Surfactant in first 30 min
N 150 90 27 15 7 2 291
% 23.5 8.3 2.5 0.9 0.2 0.0 2.0
Surfactant in first 60 min
N 315 206 82 40 17 5 665
% 49.3 19.1 7.6 2.4 0.4 0.1 4.5
Surfactant in first 120 min
N 414 378 173 75 36 11 1087
% 64.8 35.0 16.0 4.6 0.9 0.2 7.3
Surfactant after 120 minutes
N 163 341 291 269 252 178 1494
% 25.5 31.6 26.8 16.3 5.9 2.9 10.1
Surfactant at any time N 577 719 464 344 288 189 2581
% 90.3 66.6 42.8 20.9 6.8 3.1 17.4
Pneumothorax diagnosis
2 N 61 38 39 43 120 349 650
% 9.6 3.5 3.6 2.6 2.8 5.7 4.4
Pneumothorax treatment**
Observation only
2 N 11 10 12 19 67 261 380
% 18.0 26.3 30.8 44.2 55.8 74.8 58.5
Needle drainage
2 N 24 11 11 15 24 56 141
% 39.3 28.9 28.2 34.9 20.0 16.0 21.7
Chest tube 2 N 49 32 29 21 42 56 229
% 80.3 84.2 74.4 48.8 35.0 16.0 35.2
Seizures Definite /suspected
3 N 44 39 10 22 79 386 580
% 6.9 3.6 0.9 1.3 1.9 6.3 3.9
** One neonate can have multiple treatments. Denominators for treatment were based on the number of neonates who had pneumothorax.
D. Descriptive Analyses
29
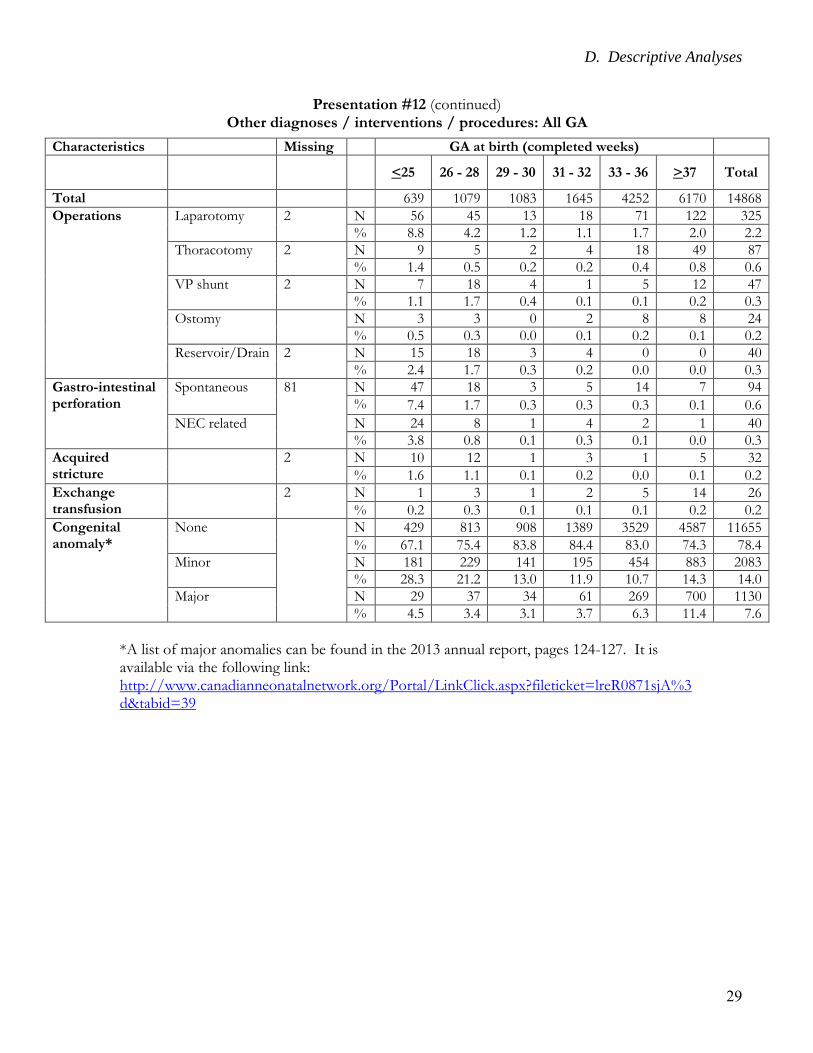
Presentation #12 (continued) Other diagnoses / interventions / procedures: All GA
*A list of major anomalies can be found in the 2013 annual report, pages 124-127. It is available via the following link: http://www.canadianneonatalnetwork.org/Portal/LinkClick.aspx?fileticket=lreR0871sjA%3d&tabid=39
Characteristics Missing GA at birth (completed weeks)
<25 26 - 28 29 - 30 31 - 32 33 - 36 >37 Total
Total 639 1079 1083 1645 4252 6170 14868
Operations Laparotomy 2 N 56 45 13 18 71 122 325
% 8.8 4.2 1.2 1.1 1.7 2.0 2.2
Thoracotomy 2 N 9 5 2 4 18 49 87
% 1.4 0.5 0.2 0.2 0.4 0.8 0.6
VP shunt 2 N 7 18 4 1 5 12 47
% 1.1 1.7 0.4 0.1 0.1 0.2 0.3
Ostomy N 3 3 0 2 8 8 24
% 0.5 0.3 0.0 0.1 0.2 0.1 0.2
Reservoir/Drain 2 N 15 18 3 4 0 0 40
% 2.4 1.7 0.3 0.2 0.0 0.0 0.3
Gastro-intestinal perforation
Spontaneous 81 N 47 18 3 5 14 7 94
% 7.4 1.7 0.3 0.3 0.3 0.1 0.6
NEC related N 24 8 1 4 2 1 40
% 3.8 0.8 0.1 0.3 0.1 0.0 0.3
Acquired stricture
2 N 10 12 1 3 1 5 32
% 1.6 1.1 0.1 0.2 0.0 0.1 0.2
Exchange transfusion
2 N 1 3 1 2 5 14 26
% 0.2 0.3 0.1 0.1 0.1 0.2 0.2
Congenital anomaly*
None N 429 813 908 1389 3529 4587 11655
% 67.1 75.4 83.8 84.4 83.0 74.3 78.4
Minor N 181 229 141 195 454 883 2083
% 28.3 21.2 13.0 11.9 10.7 14.3 14.0
Major N 29 37 34 61 269 700 1130
% 4.5 3.4 3.1 3.7 6.3 11.4 7.6
D. Descriptive Analyses
30
Section D.3
Analyses based on number of eligible very preterm (GA <33 weeks) or very low birth weight (BW <1 500g) neonates These included data from 4 446 eligible very preterm neonates and 2 956 eligible VLBW neonates.
D. Descriptive Analyses
31
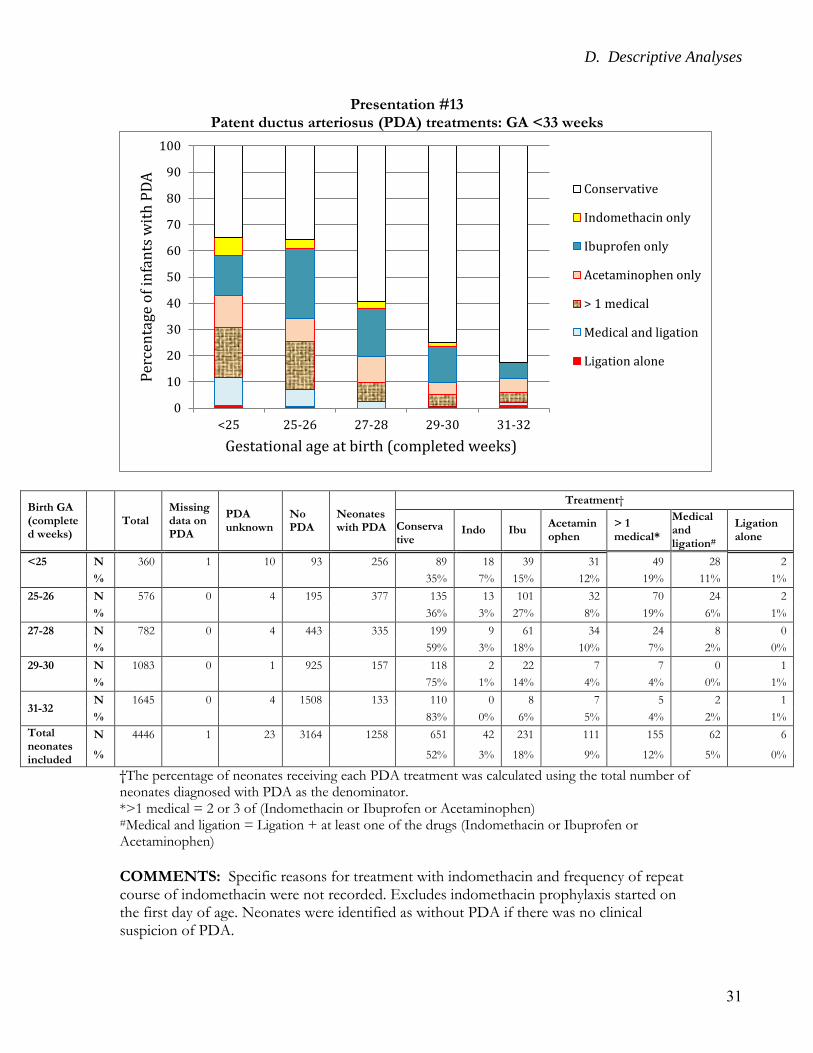
Presentation #13 Patent ductus arteriosus (PDA) treatments: GA <33 weeks
†The percentage of neonates receiving each PDA treatment was calculated using the total number of neonates diagnosed with PDA as the denominator. *>1 medical = 2 or 3 of (Indomethacin or Ibuprofen or Acetaminophen) #Medical and ligation = Ligation + at least one of the drugs (Indomethacin or Ibuprofen or Acetaminophen)
COMMENTS: Specific reasons for treatment with indomethacin and frequency of repeat course of indomethacin were not recorded. Excludes indomethacin prophylaxis started on the first day of age. Neonates were identified as without PDA if there was no clinical suspicion of PDA.
0
10
20
30
40
50
60
70
80
90
100
<25 25-26 27-28 29-30 31-32
Per
cen
tage
of
infa
nts
wit
h P
DA
Gestational age at birth (completed weeks)
Conservative
Indomethacin only
Ibuprofen only
Acetaminophen only
> 1 medical
Medical and ligation
Ligation alone
Birth GA (completed weeks)
Total Missing data on PDA
PDA unknown
No PDA
Neonates with PDA
Treatment†
Conservative
Indo Ibu Acetaminophen
> 1 medical*
Medical and ligation#
Ligation alone
<25 N 360 1 10 93 256 89 18 39 31 49 28 2
% 35% 7% 15% 12% 19% 11% 1%
25-26 N 576 0 4 195 377 135 13 101 32 70 24 2
% 36% 3% 27% 8% 19% 6% 1%
27-28 N 782 0 4 443 335 199 9 61 34 24 8 0
% 59% 3% 18% 10% 7% 2% 0%
29-30 N 1083 0 1 925 157 118 2 22 7 7 0 1
% 75% 1% 14% 4% 4% 0% 1%
31-32 N 1645 0 4 1508 133 110 0 8 7 5 2 1
% 83% 0% 6% 5% 4% 2% 1%
Total neonates included
N 4446 1 23 3164 1258 651 42 231 111 155 62 6
% 52% 3% 18% 9% 12% 5% 0%
D. Descriptive Analyses
32
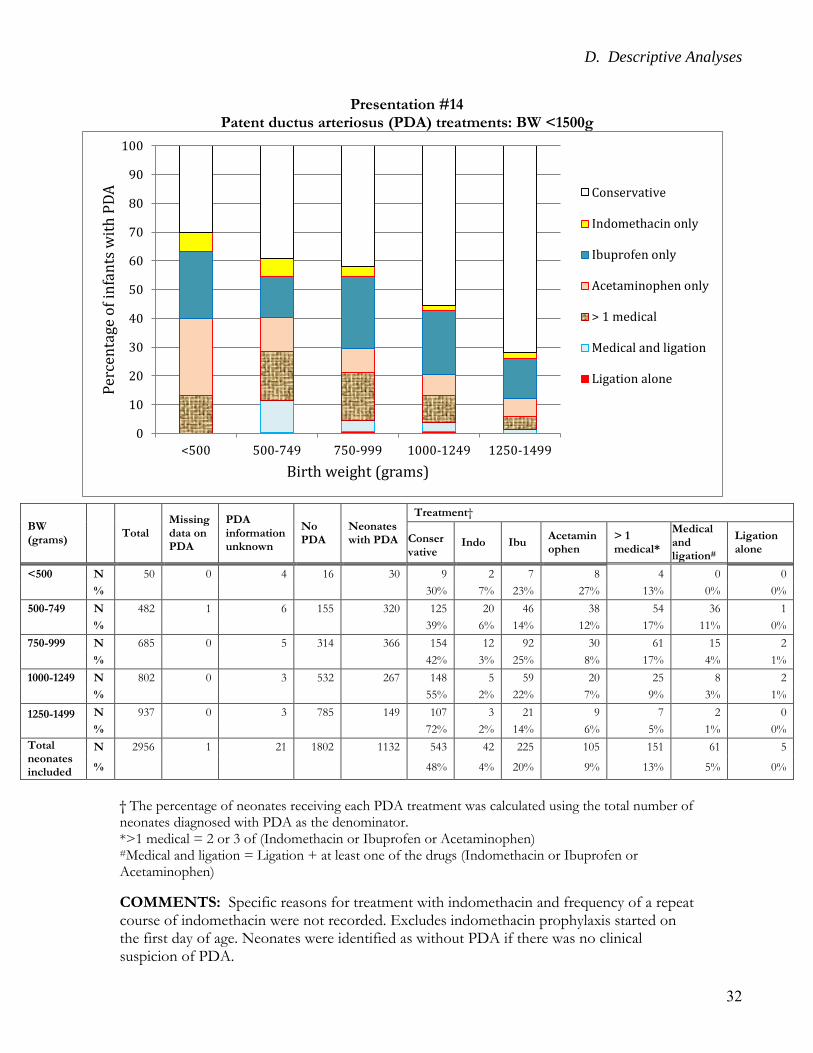
Presentation #14 Patent ductus arteriosus (PDA) treatments: BW <1500g
† The percentage of neonates receiving each PDA treatment was calculated using the total number of neonates diagnosed with PDA as the denominator. *>1 medical = 2 or 3 of (Indomethacin or Ibuprofen or Acetaminophen) #Medical and ligation = Ligation + at least one of the drugs (Indomethacin or Ibuprofen or Acetaminophen)
COMMENTS: Specific reasons for treatment with indomethacin and frequency of a repeat course of indomethacin were not recorded. Excludes indomethacin prophylaxis started on the first day of age. Neonates were identified as without PDA if there was no clinical suspicion of PDA.
0
10
20
30
40
50
60
70
80
90
100
<500 500-749 750-999 1000-1249 1250-1499
Per
cen
tage
of
infa
nts
wit
h P
DA
Birth weight (grams)
Conservative
Indomethacin only
Ibuprofen only
Acetaminophen only
> 1 medical
Medical and ligation
Ligation alone
BW (grams)
Total Missing data on PDA
PDA information unknown
No PDA
Neonates with PDA
Treatment†
Conservative
Indo Ibu Acetaminophen
> 1 medical*
Medical and ligation#
Ligation alone
<500 N 50 0 4 16 30 9 2 7 8 4 0 0
% 30% 7% 23% 27% 13% 0% 0%
500-749 N 482 1 6 155 320 125 20 46 38 54 36 1
% 39% 6% 14% 12% 17% 11% 0%
750-999 N 685 0 5 314 366 154 12 92 30 61 15 2
% 42% 3% 25% 8% 17% 4% 1%
1000-1249 N 802 0 3 532 267 148 5 59 20 25 8 2
% 55% 2% 22% 7% 9% 3% 1%
1250-1499
N 937 0 3 785 149 107 3 21 9 7 2 0
% 72% 2% 14% 6% 5% 1% 0%
Total neonates included
N 2956 1 21 1802 1132 543 42 225 105 151 61 5
% 48% 4% 20% 9% 13% 5% 0%
D. Descriptive Analyses
33
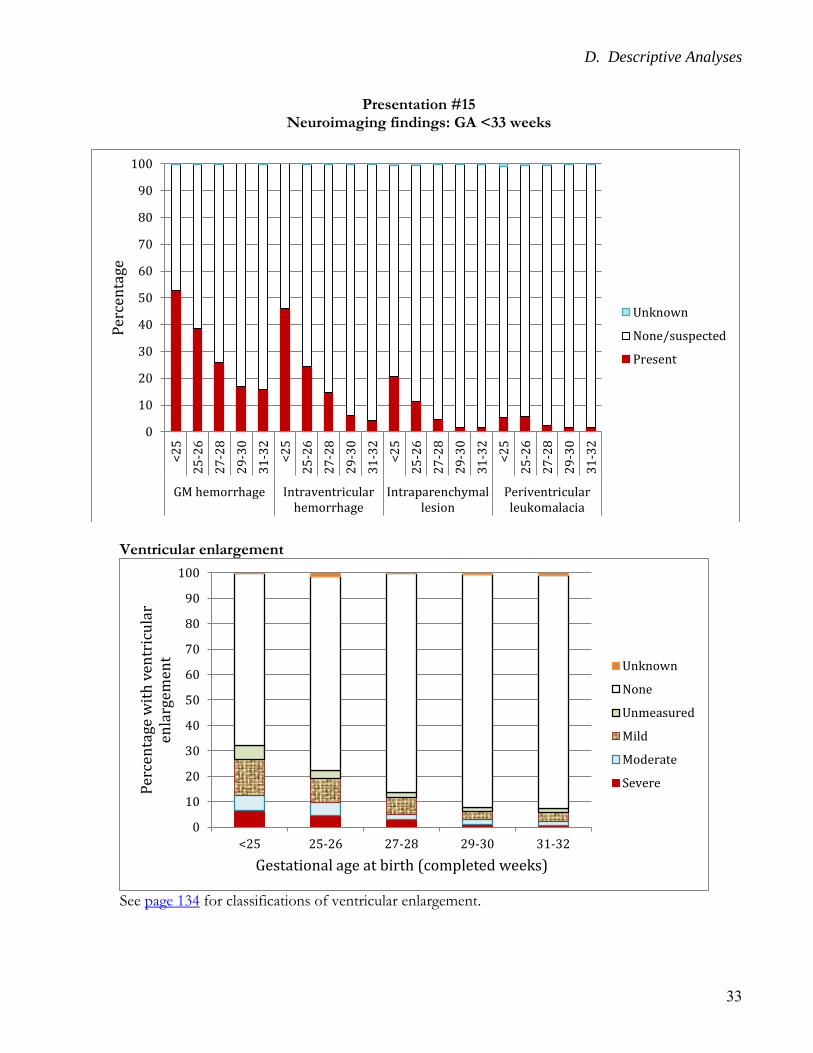
Presentation #15 Neuroimaging findings: GA <33 weeks
Ventricular enlargement
See page 134 for classifications of ventricular enlargement.
0
10
20
30
40
50
60
70
80
90
100<
25
25
-26
27
-28
29
-30
31
-32
<2
5
25
-26
27
-28
29
-30
31
-32
<2
5
25
-26
27
-28
29
-30
31
-32
<2
5
25
-26
27
-28
29
-30
31
-32
GM hemorrhage Intraventricularhemorrhage
Intraparenchymallesion
Periventricularleukomalacia
Per
cen
tage
Unknown
None/suspected
Present
0
10
20
30
40
50
60
70
80
90
100
<25 25-26 27-28 29-30 31-32
Per
cen
tage
wit
h v
entr
icu
lar
enla
rgem
ent
Gestational age at birth (completed weeks)
Unknown
None
Unmeasured
Mild
Moderate
Severe
D. Descriptive Analyses
34
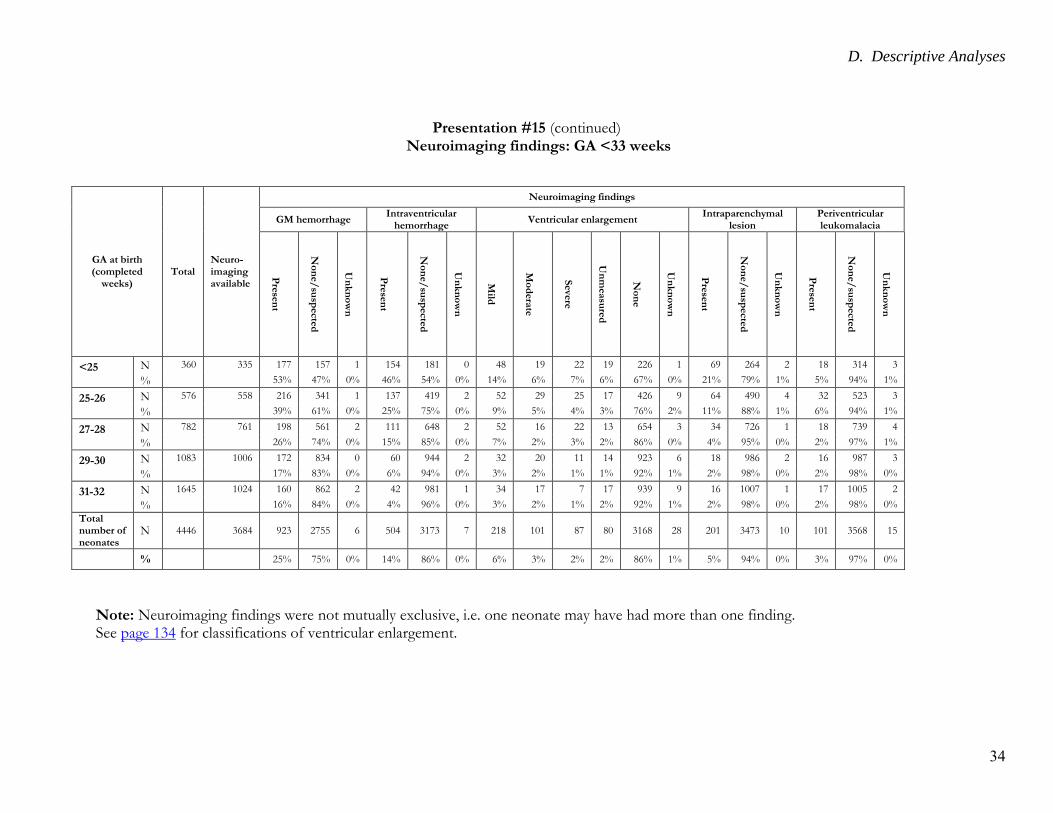
Presentation #15 (continued) Neuroimaging findings: GA <33 weeks
GA at birth (completed
weeks) Total
Neuro-imaging available
Neuroimaging findings
GM hemorrhage Intraventricular
hemorrhage Ventricular enlargement
Intraparenchymal lesion
Periventricular leukomalacia
Pre
sen
t
No
ne/
susp
ecte
d
Un
kn
ow
n
Pre
sen
t
No
ne/
susp
ecte
d
Un
kn
ow
n
Mild
Mo
dera
te
Severe
Un
measu
red
No
ne
Un
kn
ow
n
Pre
sen
t
No
ne/
susp
ecte
d
Un
kn
ow
n
Pre
sen
t
No
ne/
susp
ecte
d
Un
kn
ow
n
<25
N 360 335 177 157 1 154 181 0 48 19 22 19 226 1 69 264 2 18 314 3
% 53% 47% 0% 46% 54% 0% 14% 6% 7% 6% 67% 0% 21% 79% 1% 5% 94% 1%
25-26
N 576 558 216 341 1 137 419 2 52 29 25 17 426 9 64 490 4 32 523 3
% 39% 61% 0% 25% 75% 0% 9% 5% 4% 3% 76% 2% 11% 88% 1% 6% 94% 1%
27-28
N 782 761 198 561 2 111 648 2 52 16 22 13 654 3 34 726 1 18 739 4
% 26% 74% 0% 15% 85% 0% 7% 2% 3% 2% 86% 0% 4% 95% 0% 2% 97% 1%
29-30
N 1083 1006 172 834 0 60 944 2 32 20 11 14 923 6 18 986 2 16 987 3
% 17% 83% 0% 6% 94% 0% 3% 2% 1% 1% 92% 1% 2% 98% 0% 2% 98% 0%
31-32
N 1645 1024 160 862 2 42 981 1 34 17 7 17 939 9 16 1007 1 17 1005 2
% 16% 84% 0% 4% 96% 0% 3% 2% 1% 2% 92% 1% 2% 98% 0% 2% 98% 0%
Total number of neonates
N 4446 3684 923 2755 6 504 3173 7 218 101 87 80 3168 28 201 3473 10 101 3568 15
% 25% 75% 0% 14% 86% 0% 6% 3% 2% 2% 86% 1% 5% 94% 0% 3% 97% 0%
Note: Neuroimaging findings were not mutually exclusive, i.e. one neonate may have had more than one finding. See page 134 for classifications of ventricular enlargement.
D. Descriptive Analyses
35
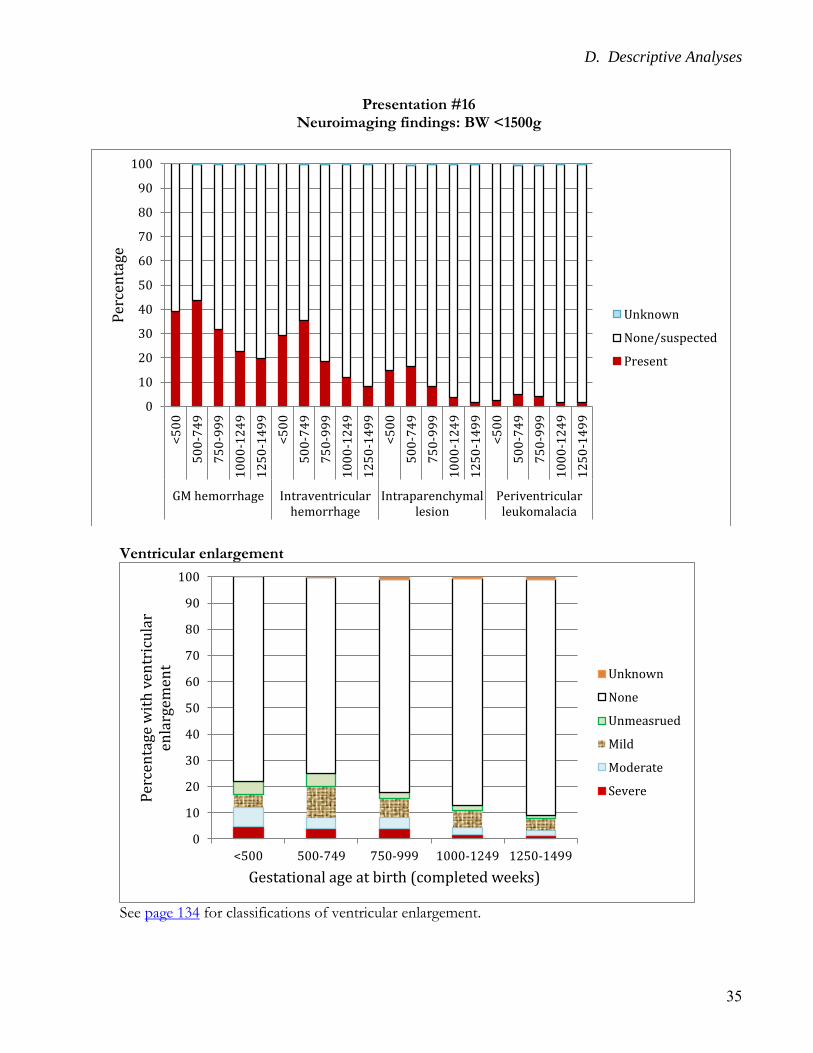
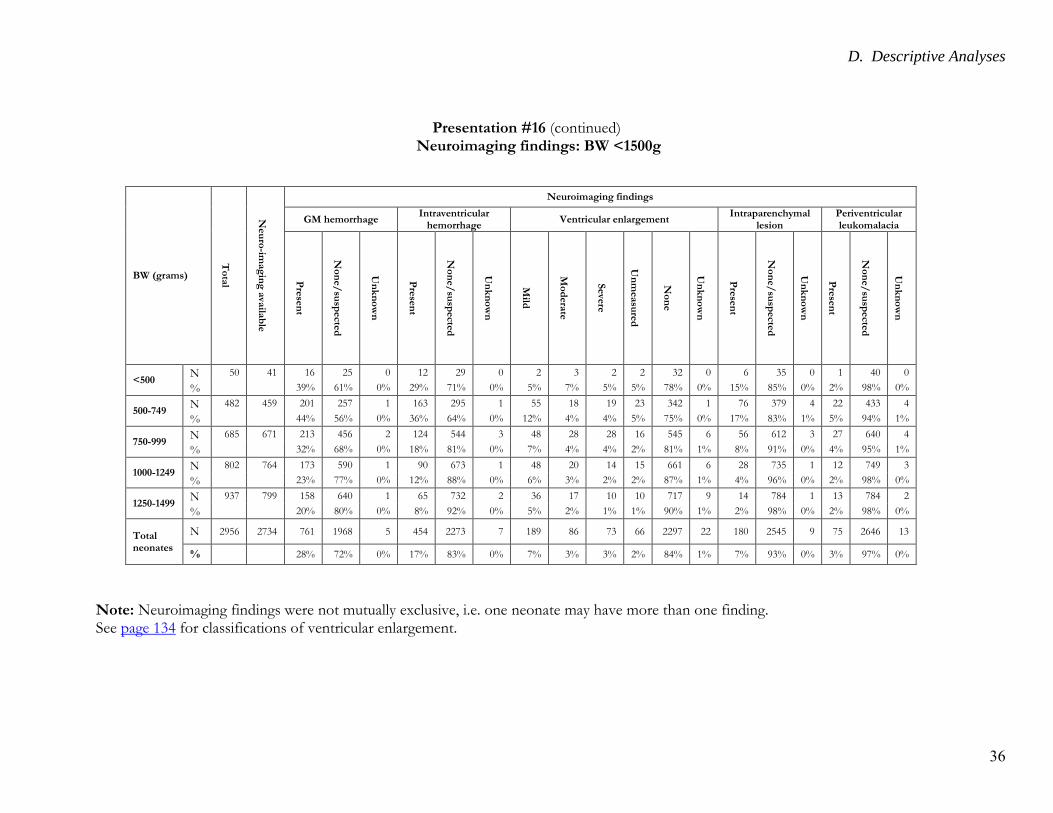
Presentation #16 Neuroimaging findings: BW <1500g
Ventricular enlargement
See page 134 for classifications of ventricular enlargement.
0
10
20
30
40
50
60
70
80
90
100<
50
0
50
0-7
49
75
0-9
99
10
00
-12
49
12
50
-14
99
<5
00
50
0-7
49
75
0-9
99
10
00
-12
49
12
50
-14
99
<5
00
50
0-7
49
75
0-9
99
10
00
-12
49
12
50
-14
99
<5
00
50
0-7
49
75
0-9
99
10
00
-12
49
12
50
-14
99
GM hemorrhage Intraventricularhemorrhage
Intraparenchymallesion
Periventricularleukomalacia
Per
cen
tage
Unknown
None/suspected
Present
0
10
20
30
40
50
60
70
80
90
100
<500 500-749 750-999 1000-1249 1250-1499
Per
cen
tage
wit
h v
entr
icu
lar
enla
rgem
ent
Gestational age at birth (completed weeks)
Unknown
None
Unmeasrued
Mild
Moderate
Severe
D. Descriptive Analyses
36
Presentation #16 (continued) Neuroimaging findings: BW <1500g
BW (grams)
To
tal
Neu
ro-im
ag
ing
availa
ble
Neuroimaging findings
GM hemorrhage Intraventricular
hemorrhage Ventricular enlargement
Intraparenchymal lesion
Periventricular leukomalacia
Pre
sen
t
No
ne/
susp
ecte
d
Un
kn
ow
n
Pre
sen
t
No
ne/
susp
ecte
d
Un
kn
ow
n
Mild
Mo
dera
te
Severe
Un
measu
red
No
ne
Un
kn
ow
n
Pre
sen
t
No
ne/
susp
ecte
d
Un
kn
ow
n
Pre
sen
t
No
ne/
susp
ecte
d
Un
kn
ow
n
<500 N 50 41 16 25 0 12 29 0 2 3 2 2 32 0 6 35 0 1 40 0
% 39% 61% 0% 29% 71% 0% 5% 7% 5% 5% 78% 0% 15% 85% 0% 2% 98% 0%
500-749 N 482 459 201 257 1 163 295 1 55 18 19 23 342 1 76 379 4 22 433 4
% 44% 56% 0% 36% 64% 0% 12% 4% 4% 5% 75% 0% 17% 83% 1% 5% 94% 1%
750-999 N 685 671 213 456 2 124 544 3 48 28 28 16 545 6 56 612 3 27 640 4
% 32% 68% 0% 18% 81% 0% 7% 4% 4% 2% 81% 1% 8% 91% 0% 4% 95% 1%
1000-1249 N 802 764 173 590 1 90 673 1 48 20 14 15 661 6 28 735 1 12 749 3
% 23% 77% 0% 12% 88% 0% 6% 3% 2% 2% 87% 1% 4% 96% 0% 2% 98% 0%
1250-1499 N 937 799 158 640 1 65 732 2 36 17 10 10 717 9 14 784 1 13 784 2
% 20% 80% 0% 8% 92% 0% 5% 2% 1% 1% 90% 1% 2% 98% 0% 2% 98% 0%
Total neonates
N 2956 2734 761 1968 5 454 2273 7 189 86 73 66 2297 22 180 2545 9 75 2646 13
% 28% 72% 0% 17% 83% 0% 7% 3% 3% 2% 84% 1% 7% 93% 0% 3% 97% 0%
Note: Neuroimaging findings were not mutually exclusive, i.e. one neonate may have more than one finding. See page 134 for classifications of ventricular enlargement.
D. Descriptive Analyses
37
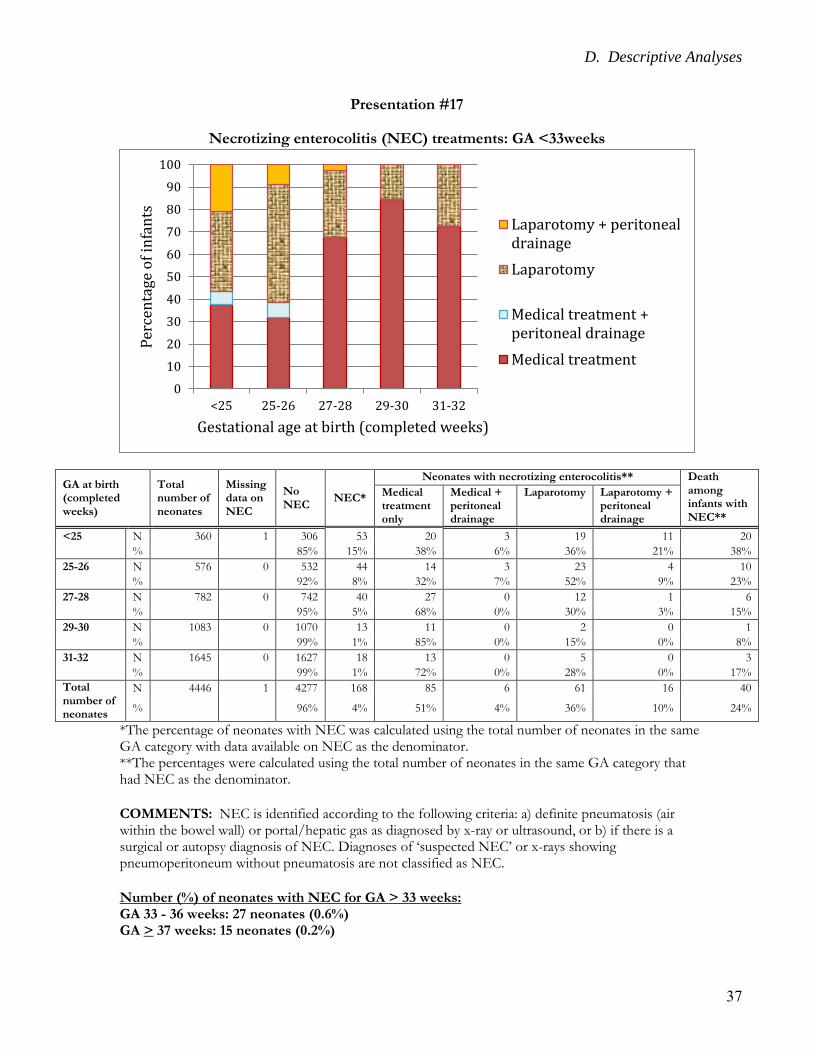
Presentation #17
Necrotizing enterocolitis (NEC) treatments: GA <33weeks
GA at birth (completed weeks)
Total number of neonates
Missing data on NEC
No NEC
NEC*
Neonates with necrotizing enterocolitis** Death among infants with NEC**
Medical treatment only
Medical + peritoneal drainage
Laparotomy Laparotomy + peritoneal drainage
<25 N 360 1 306 53 20 3 19 11 20
% 85% 15% 38% 6% 36% 21% 38%
25-26 N 576 0 532 44 14 3 23 4 10
% 92% 8% 32% 7% 52% 9% 23%
27-28 N 782 0 742 40 27 0 12 1 6
% 95% 5% 68% 0% 30% 3% 15%
29-30 N 1083 0 1070 13 11 0 2 0 1
% 99% 1% 85% 0% 15% 0% 8%
31-32 N 1645 0 1627 18 13 0 5 0 3
% 99% 1% 72% 0% 28% 0% 17%
Total number of neonates
N 4446 1 4277 168 85 6 61 16 40
% 96% 4% 51% 4% 36% 10% 24%
*The percentage of neonates with NEC was calculated using the total number of neonates in the same GA category with data available on NEC as the denominator. **The percentages were calculated using the total number of neonates in the same GA category that had NEC as the denominator.
COMMENTS: NEC is identified according to the following criteria: a) definite pneumatosis (air within the bowel wall) or portal/hepatic gas as diagnosed by x-ray or ultrasound, or b) if there is a surgical or autopsy diagnosis of NEC. Diagnoses of ‘suspected NEC’ or x-rays showing pneumoperitoneum without pneumatosis are not classified as NEC.
Number (%) of neonates with NEC for GA > 33 weeks: GA 33 - 36 weeks: 27 neonates (0.6%) GA > 37 weeks: 15 neonates (0.2%)
0
10
20
30
40
50
60
70
80
90
100
<25 25-26 27-28 29-30 31-32
Per
cen
tage
of
infa
nts
Gestational age at birth (completed weeks)
Laparotomy + peritonealdrainage
Laparotomy
Medical treatment +peritoneal drainage
Medical treatment
D. Descriptive Analyses
38
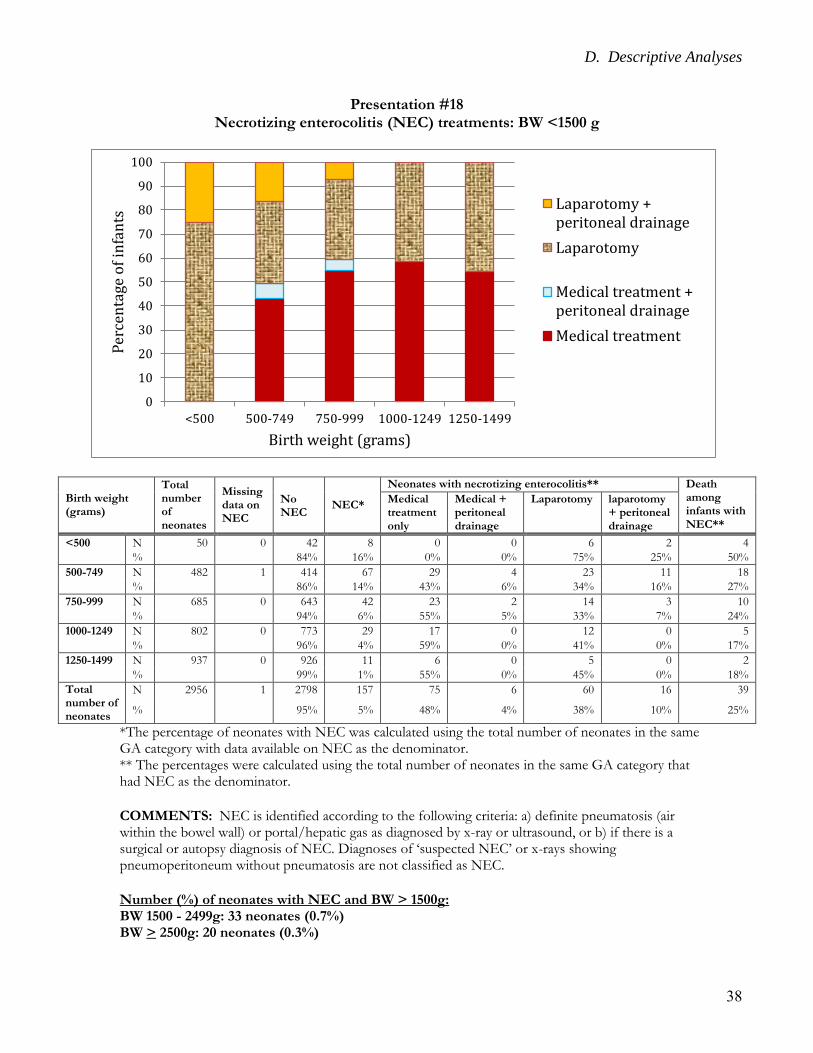
Presentation #18 Necrotizing enterocolitis (NEC) treatments: BW <1500 g
Birth weight (grams)
Total number of neonates
Missing data on NEC
NEC*
Neonates with necrotizing enterocolitis** Death among infants with NEC**
No NEC
Medical treatment only
Medical + peritoneal drainage
Laparotomy laparotomy + peritoneal drainage
<500 N 50 0 42 8 0 0 6 2 4
% 84% 16% 0% 0% 75% 25% 50%
500-749 N 482 1 414 67 29 4 23 11 18
% 86% 14% 43% 6% 34% 16% 27%
750-999 N 685 0 643 42 23 2 14 3 10
% 94% 6% 55% 5% 33% 7% 24%
1000-1249 N 802 0 773 29 17 0 12 0 5
% 96% 4% 59% 0% 41% 0% 17%
1250-1499 N 937 0 926 11 6 0 5 0 2
% 99% 1% 55% 0% 45% 0% 18%
Total number of neonates
N 2956 1 2798 157 75 6 60 16 39
% 95% 5% 48% 4% 38% 10% 25%
*The percentage of neonates with NEC was calculated using the total number of neonates in the same GA category with data available on NEC as the denominator. ** The percentages were calculated using the total number of neonates in the same GA category that had NEC as the denominator.
COMMENTS: NEC is identified according to the following criteria: a) definite pneumatosis (air within the bowel wall) or portal/hepatic gas as diagnosed by x-ray or ultrasound, or b) if there is a surgical or autopsy diagnosis of NEC. Diagnoses of ‘suspected NEC’ or x-rays showing pneumoperitoneum without pneumatosis are not classified as NEC.
Number (%) of neonates with NEC and BW > 1500g: BW 1500 - 2499g: 33 neonates (0.7%) BW > 2500g: 20 neonates (0.3%)
0
10
20
30
40
50
60
70
80
90
100
<500 500-749 750-999 1000-1249 1250-1499
Per
cen
tage
of
infa
nts
Birth weight (grams)
Laparotomy +peritoneal drainage
Laparotomy
Medical treatment +peritoneal drainage
Medical treatment
D. Descriptive Analyses
39
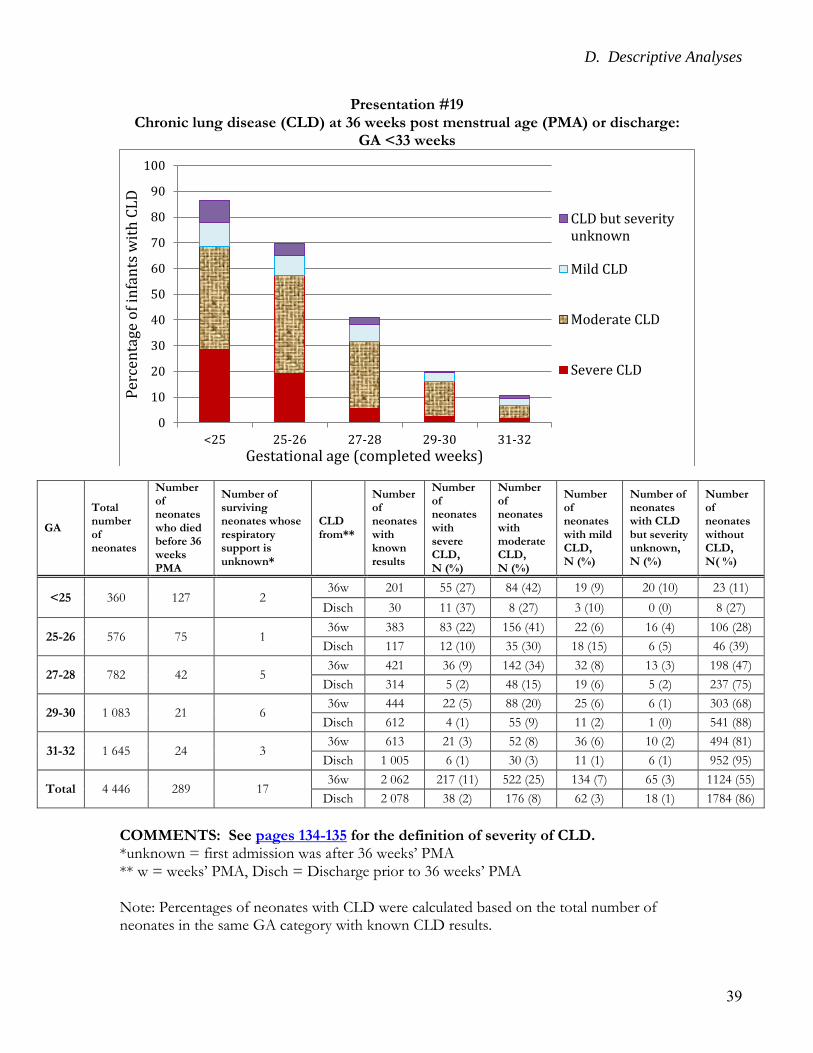
Presentation #19 Chronic lung disease (CLD) at 36 weeks post menstrual age (PMA) or discharge:
GA <33 weeks
GA
Total number of neonates
Number of neonates who died before 36 weeks PMA
Number of surviving neonates whose respiratory support is unknown*
CLD from**
Number of neonates with known results
Number of neonates with severe CLD, N (%)
Number of neonates with moderate CLD, N (%)
Number of neonates with mild CLD, N (%)
Number of neonates with CLD but severity unknown, N (%)
Number of neonates without CLD, N( %)
<25 360 127 2 36w 201 55 (27) 84 (42) 19 (9) 20 (10) 23 (11)
Disch 30 11 (37) 8 (27) 3 (10) 0 (0) 8 (27)
25-26 576 75 1 36w 383 83 (22) 156 (41) 22 (6) 16 (4) 106 (28)
Disch 117 12 (10) 35 (30) 18 (15) 6 (5) 46 (39)
27-28 782 42 5 36w 421 36 (9) 142 (34) 32 (8) 13 (3) 198 (47)
Disch 314 5 (2) 48 (15) 19 (6) 5 (2) 237 (75)
29-30 1 083 21 6 36w 444 22 (5) 88 (20) 25 (6) 6 (1) 303 (68)
Disch 612 4 (1) 55 (9) 11 (2) 1 (0) 541 (88)
31-32 1 645 24 3 36w 613 21 (3) 52 (8) 36 (6) 10 (2) 494 (81)
Disch 1 005 6 (1) 30 (3) 11 (1) 6 (1) 952 (95)
Total 4 446 289 17 36w 2 062 217 (11) 522 (25) 134 (7) 65 (3) 1124 (55)
Disch 2 078 38 (2) 176 (8) 62 (3) 18 (1) 1784 (86)
COMMENTS: See pages 134-135 for the definition of severity of CLD. *unknown = first admission was after 36 weeks’ PMA ** w = weeks’ PMA, Disch = Discharge prior to 36 weeks’ PMA Note: Percentages of neonates with CLD were calculated based on the total number of neonates in the same GA category with known CLD results.
0
10
20
30
40
50
60
70
80
90
100
<25 25-26 27-28 29-30 31-32
Per
cen
tage
of
infa
nts
wit
h C
LD
Gestational age (completed weeks)
CLD but severityunknown
Mild CLD
Moderate CLD
Severe CLD
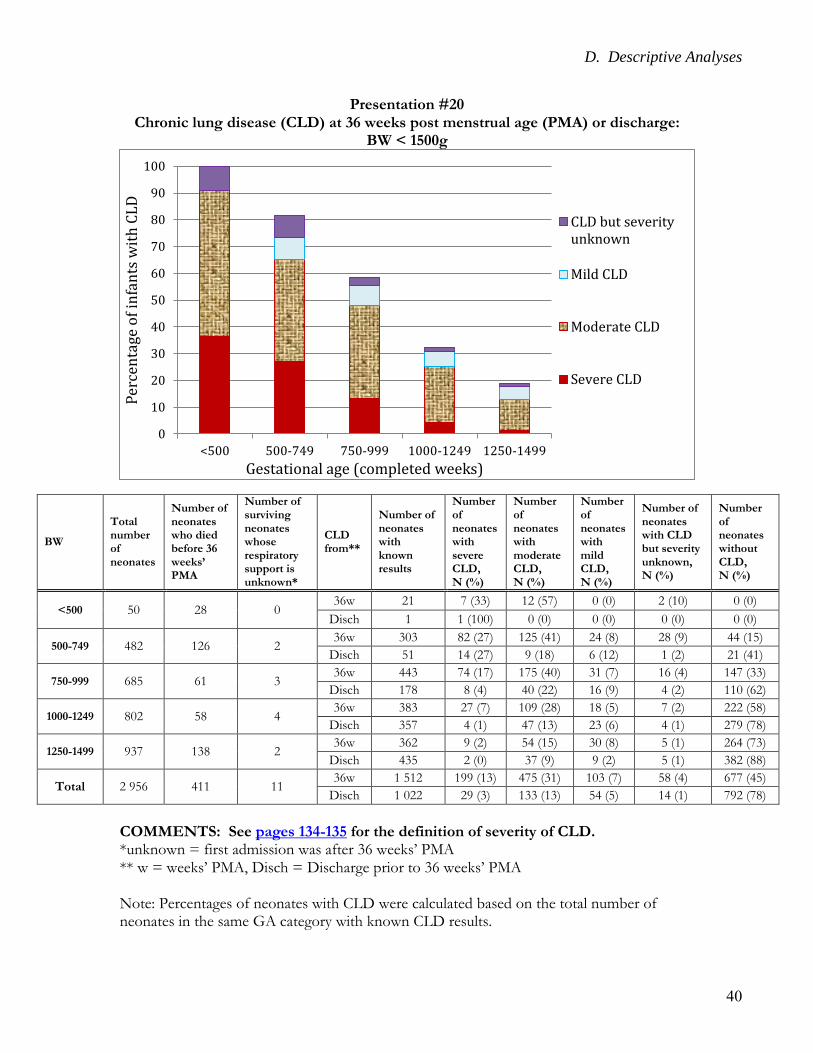
D. Descriptive Analyses
40
Presentation #20 Chronic lung disease (CLD) at 36 weeks post menstrual age (PMA) or discharge:
BW < 1500g
BW
Total number of neonates
Number of neonates who died before 36 weeks’ PMA
Number of surviving neonates whose respiratory support is unknown*
CLD from**
Number of neonates with known results
Number of neonates with severe CLD, N (%)
Number of neonates with moderate CLD, N (%)
Number of neonates with mild CLD, N (%)
Number of neonates with CLD but severity unknown, N (%)
Number of neonates without CLD, N (%)
<500 50 28 0 36w 21 7 (33) 12 (57) 0 (0) 2 (10) 0 (0)
Disch 1 1 (100) 0 (0) 0 (0) 0 (0) 0 (0)
500-749 482 126 2 36w 303 82 (27) 125 (41) 24 (8) 28 (9) 44 (15)
Disch 51 14 (27) 9 (18) 6 (12) 1 (2) 21 (41)
750-999 685 61 3 36w 443 74 (17) 175 (40) 31 (7) 16 (4) 147 (33)
Disch 178 8 (4) 40 (22) 16 (9) 4 (2) 110 (62)
1000-1249 802 58 4 36w 383 27 (7) 109 (28) 18 (5) 7 (2) 222 (58)
Disch 357 4 (1) 47 (13) 23 (6) 4 (1) 279 (78)
1250-1499 937 138 2 36w 362 9 (2) 54 (15) 30 (8) 5 (1) 264 (73)
Disch 435 2 (0) 37 (9) 9 (2) 5 (1) 382 (88)
Total 2 956 411 11 36w 1 512 199 (13) 475 (31) 103 (7) 58 (4) 677 (45)
Disch 1 022 29 (3) 133 (13) 54 (5) 14 (1) 792 (78)
COMMENTS: See pages 134-135 for the definition of severity of CLD. *unknown = first admission was after 36 weeks’ PMA ** w = weeks’ PMA, Disch = Discharge prior to 36 weeks’ PMA Note: Percentages of neonates with CLD were calculated based on the total number of neonates in the same GA category with known CLD results.
0
10
20
30
40
50
60
70
80
90
100
<500 500-749 750-999 1000-1249 1250-1499
Per
cen
tage
of
infa
nts
wit
h C
LD
Gestational age (completed weeks)
CLD but severityunknown
Mild CLD
Moderate CLD
Severe CLD
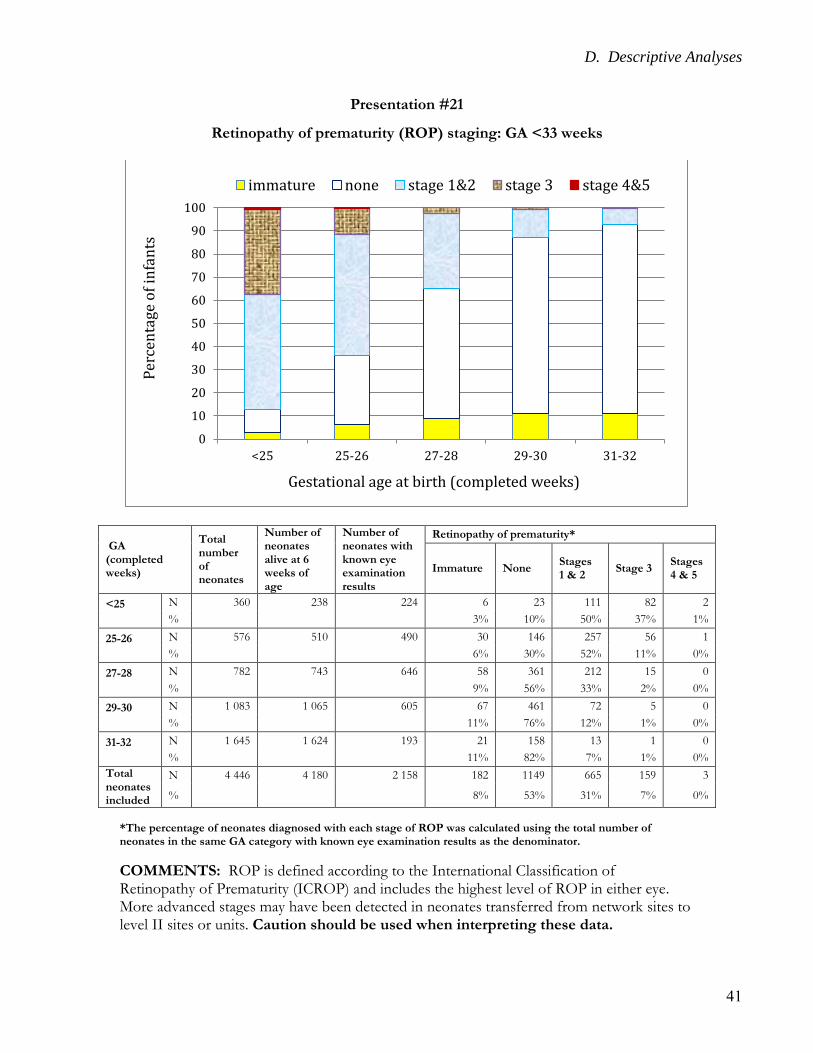
D. Descriptive Analyses
41
Presentation #21
Retinopathy of prematurity (ROP) staging: GA <33 weeks
GA (completed weeks)
Total number of neonates
Number of neonates alive at 6 weeks of age
Number of neonates with known eye examination results
Retinopathy of prematurity*
Immature None Stages 1 & 2
Stage 3 Stages 4 & 5
<25
N 360 238 224 6 23 111 82 2
% 3% 10% 50% 37% 1%
25-26
N 576 510 490 30 146 257 56 1
% 6% 30% 52% 11% 0%
27-28
N 782 743 646 58 361 212 15 0
% 9% 56% 33% 2% 0%
29-30
N 1 083 1 065 605 67 461 72 5 0
% 11% 76% 12% 1% 0%
31-32
N 1 645 1 624 193 21 158 13 1 0
% 11% 82% 7% 1% 0%
Total neonates included
N 4 446 4 180 2 158 182 1149 665 159 3
% 8% 53% 31% 7% 0%
*The percentage of neonates diagnosed with each stage of ROP was calculated using the total number of neonates in the same GA category with known eye examination results as the denominator.
COMMENTS: ROP is defined according to the International Classification of Retinopathy of Prematurity (ICROP) and includes the highest level of ROP in either eye. More advanced stages may have been detected in neonates transferred from network sites to level II sites or units. Caution should be used when interpreting these data.
0
10
20
30
40
50
60
70
80
90
100
<25 25-26 27-28 29-30 31-32
Per
cen
tage
of
infa
nts
Gestational age at birth (completed weeks)
immature none stage 1&2 stage 3 stage 4&5
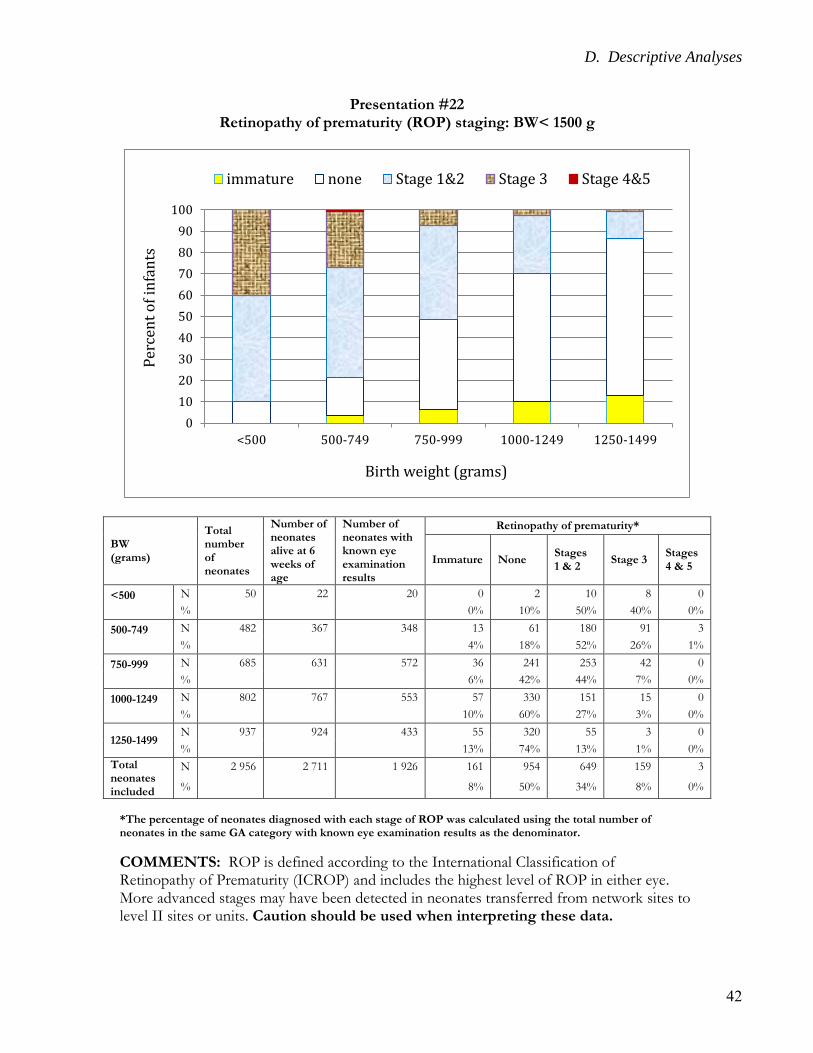
D. Descriptive Analyses
42
Presentation #22 Retinopathy of prematurity (ROP) staging: BW< 1500 g
BW (grams)
Total number of neonates
Number of neonates alive at 6 weeks of age
Number of neonates with known eye examination results
Retinopathy of prematurity*
Immature None Stages 1 & 2
Stage 3 Stages 4 & 5
<500
N 50 22 20 0 2 10 8 0
% 0% 10% 50% 40% 0%
500-749
N 482 367 348 13 61 180 91 3
% 4% 18% 52% 26% 1%
750-999
N 685 631 572 36 241 253 42 0
% 6% 42% 44% 7% 0%
1000-1249
N 802 767 553 57 330 151 15 0
% 10% 60% 27% 3% 0%
1250-1499 N 937 924 433 55 320 55 3 0
% 13% 74% 13% 1% 0%
Total neonates included
N 2 956 2 711 1 926 161 954 649 159 3
% 8% 50% 34% 8% 0%
*The percentage of neonates diagnosed with each stage of ROP was calculated using the total number of neonates in the same GA category with known eye examination results as the denominator.
COMMENTS: ROP is defined according to the International Classification of Retinopathy of Prematurity (ICROP) and includes the highest level of ROP in either eye. More advanced stages may have been detected in neonates transferred from network sites to level II sites or units. Caution should be used when interpreting these data.
0
10
20
30
40
50
60
70
80
90
100
<500 500-749 750-999 1000-1249 1250-1499
Per
cen
t o
f in
fan
ts
Birth weight (grams)
immature none Stage 1&2 Stage 3 Stage 4&5
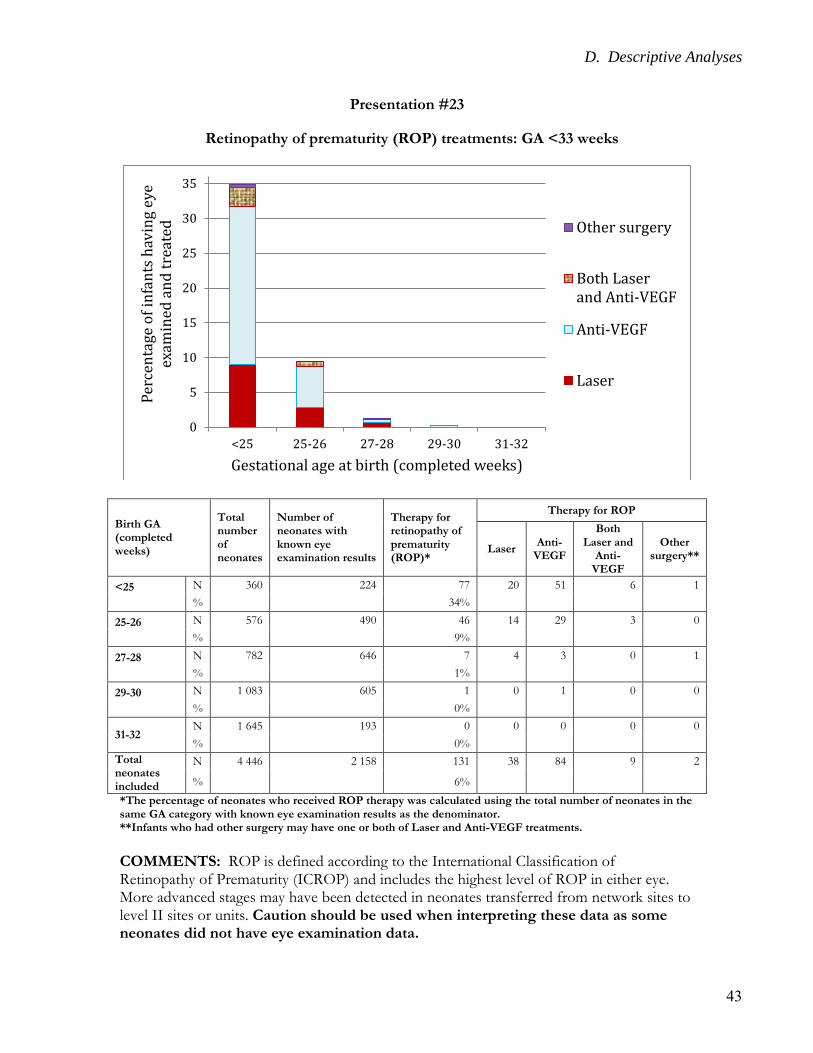
D. Descriptive Analyses
43
Presentation #23
Retinopathy of prematurity (ROP) treatments: GA <33 weeks
Birth GA (completed weeks)
Total number of neonates
Number of neonates with known eye examination results
Therapy for retinopathy of prematurity (ROP)*
Therapy for ROP
Laser Anti-
VEGF
Both Laser and
Anti-VEGF
Other surgery**
<25
N 360 224 77 20 51 6 1
% 34%
25-26
N 576 490 46 14 29 3 0
% 9%
27-28
N 782 646 7 4 3 0 1
% 1%
29-30
N 1 083 605 1 0 1 0 0
% 0%
31-32 N 1 645 193 0 0 0 0 0
% 0%
Total neonates included
N 4 446 2 158 131 38 84 9 2
% 6%
*The percentage of neonates who received ROP therapy was calculated using the total number of neonates in the same GA category with known eye examination results as the denominator. **Infants who had other surgery may have one or both of Laser and Anti-VEGF treatments.
COMMENTS: ROP is defined according to the International Classification of Retinopathy of Prematurity (ICROP) and includes the highest level of ROP in either eye. More advanced stages may have been detected in neonates transferred from network sites to level II sites or units. Caution should be used when interpreting these data as some neonates did not have eye examination data.
0
5
10
15
20
25
30
35
<25 25-26 27-28 29-30 31-32
Per
cen
tage
of
infa
nts
hav
ing
eye
exam
ined
an
d t
reat
ed
Gestational age at birth (completed weeks)
Other surgery
Both Laserand Anti-VEGF
Anti-VEGF
Laser
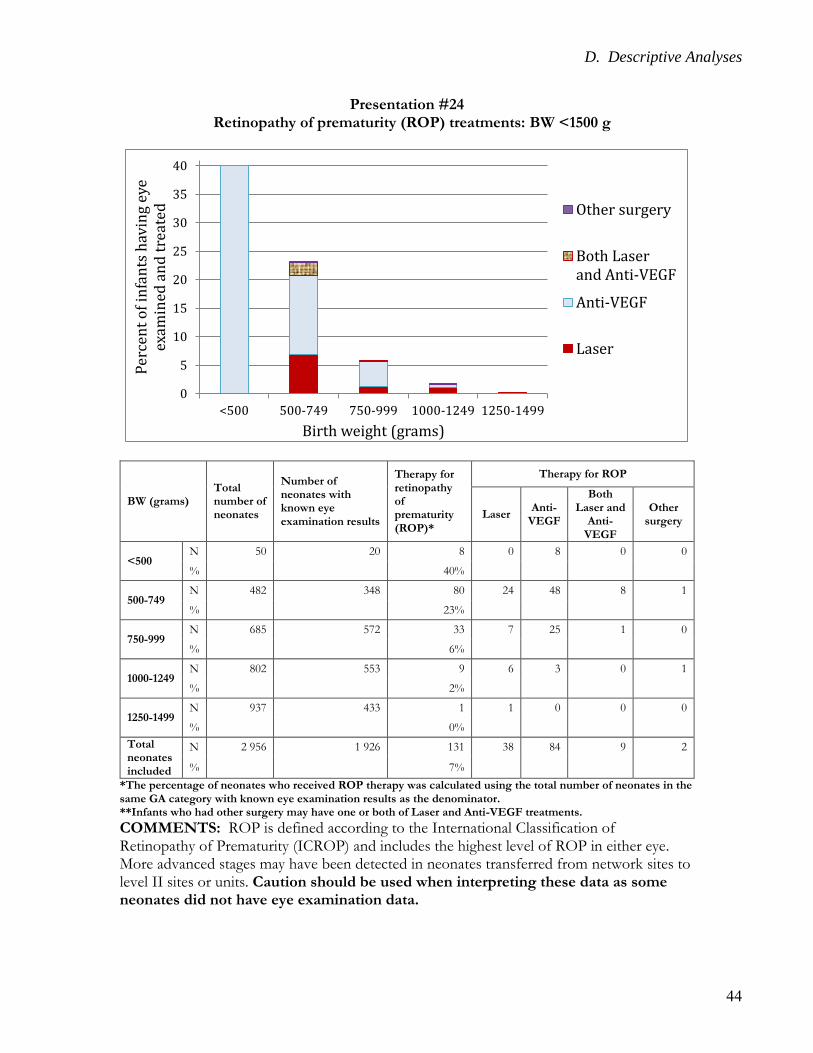
D. Descriptive Analyses
44
Presentation #24 Retinopathy of prematurity (ROP) treatments: BW <1500 g
BW (grams) Total number of neonates
Number of neonates with known eye examination results
Therapy for retinopathy of prematurity (ROP)*
Therapy for ROP
Laser Anti-
VEGF
Both Laser and
Anti-VEGF
Other surgery
<500 N 50 20 8 0 8 0 0
% 40%
500-749 N 482 348 80 24 48 8 1
% 23%
750-999 N 685 572 33 7 25 1 0
% 6%
1000-1249 N 802 553 9 6 3 0 1
% 2%
1250-1499 N 937 433 1 1 0 0 0
% 0%
Total neonates included
N 2 956 1 926 131 38 84 9 2
% 7%
*The percentage of neonates who received ROP therapy was calculated using the total number of neonates in the same GA category with known eye examination results as the denominator. **Infants who had other surgery may have one or both of Laser and Anti-VEGF treatments. COMMENTS: ROP is defined according to the International Classification of Retinopathy of Prematurity (ICROP) and includes the highest level of ROP in either eye. More advanced stages may have been detected in neonates transferred from network sites to level II sites or units. Caution should be used when interpreting these data as some neonates did not have eye examination data.
0
5
10
15
20
25
30
35
40
<500 500-749 750-999 1000-1249 1250-1499
Per
cen
t o
f in
fan
ts h
avin
g ey
e ex
amin
ed a
nd
tre
ated
Birth weight (grams)
Other surgery
Both Laserand Anti-VEGF
Anti-VEGF
Laser
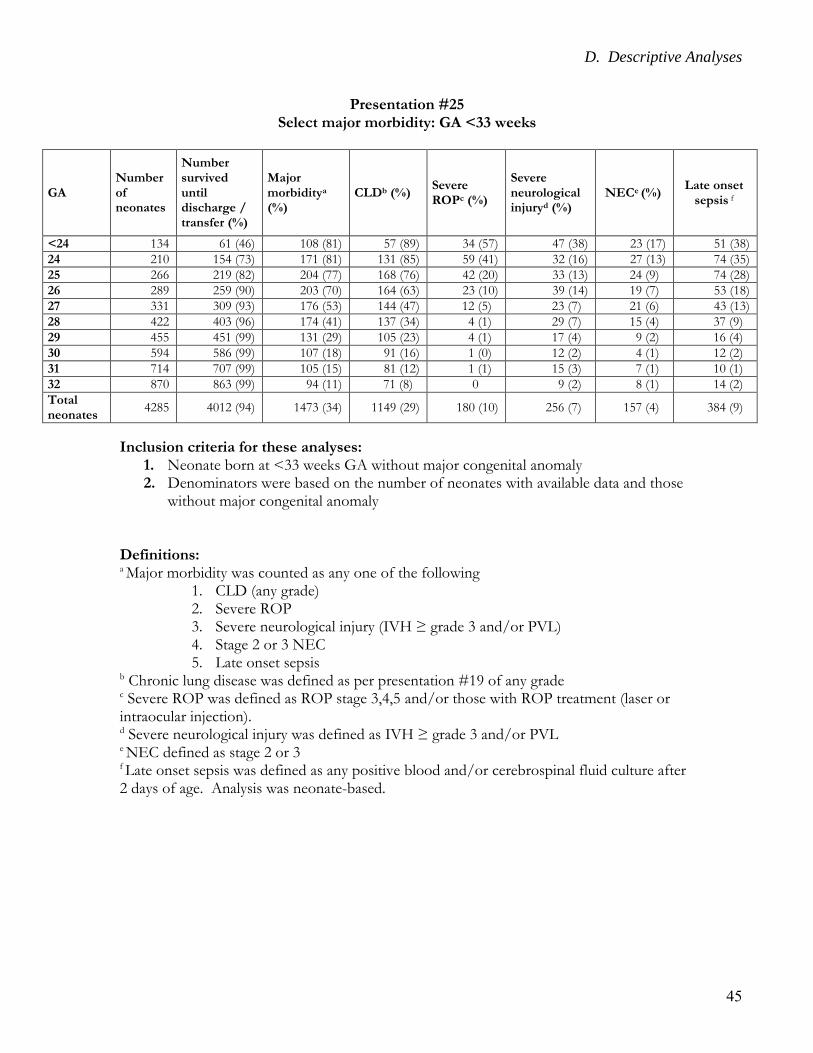
D. Descriptive Analyses
45
Presentation #25 Select major morbidity: GA <33 weeks
GA Number of neonates
Number survived until discharge / transfer (%)
Major morbiditya (%)
CLDb (%) Severe ROPc (%)
Severe neurological injuryd (%)
NECe (%) Late onset
sepsis f
<24 134 61 (46) 108 (81) 57 (89) 34 (57) 47 (38) 23 (17) 51 (38)
24 210 154 (73) 171 (81) 131 (85) 59 (41) 32 (16) 27 (13) 74 (35)
25 266 219 (82) 204 (77) 168 (76) 42 (20) 33 (13) 24 (9) 74 (28)
26 289 259 (90) 203 (70) 164 (63) 23 (10) 39 (14) 19 (7) 53 (18)
27 331 309 (93) 176 (53) 144 (47) 12 (5) 23 (7) 21 (6) 43 (13)
28 422 403 (96) 174 (41) 137 (34) 4 (1) 29 (7) 15 (4) 37 (9)
29 455 451 (99) 131 (29) 105 (23) 4 (1) 17 (4) 9 (2) 16 (4)
30 594 586 (99) 107 (18) 91 (16) 1 (0) 12 (2) 4 (1) 12 (2)
31 714 707 (99) 105 (15) 81 (12) 1 (1) 15 (3) 7 (1) 10 (1)
32 870 863 (99) 94 (11) 71 (8) 0 9 (2) 8 (1) 14 (2)
Total neonates
4285 4012 (94) 1473 (34) 1149 (29) 180 (10) 256 (7) 157 (4) 384 (9)
Inclusion criteria for these analyses: 1. Neonate born at <33 weeks GA without major congenital anomaly 2. Denominators were based on the number of neonates with available data and those
without major congenital anomaly Definitions: a Major morbidity was counted as any one of the following
1. CLD (any grade) 2. Severe ROP 3. Severe neurological injury (IVH ≥ grade 3 and/or PVL) 4. Stage 2 or 3 NEC 5. Late onset sepsis
b Chronic lung disease was defined as per presentation #19 of any grade c Severe ROP was defined as ROP stage 3,4,5 and/or those with ROP treatment (laser or intraocular injection). d Severe neurological injury was defined as IVH ≥ grade 3 and/or PVL e NEC defined as stage 2 or 3 f Late onset sepsis was defined as any positive blood and/or cerebrospinal fluid culture after 2 days of age. Analysis was neonate-based.

E. Site Comparisons
46
E. Site Comparisons
E. Site Comparisons
47
E.1. Site Comparisons –
Care Practices
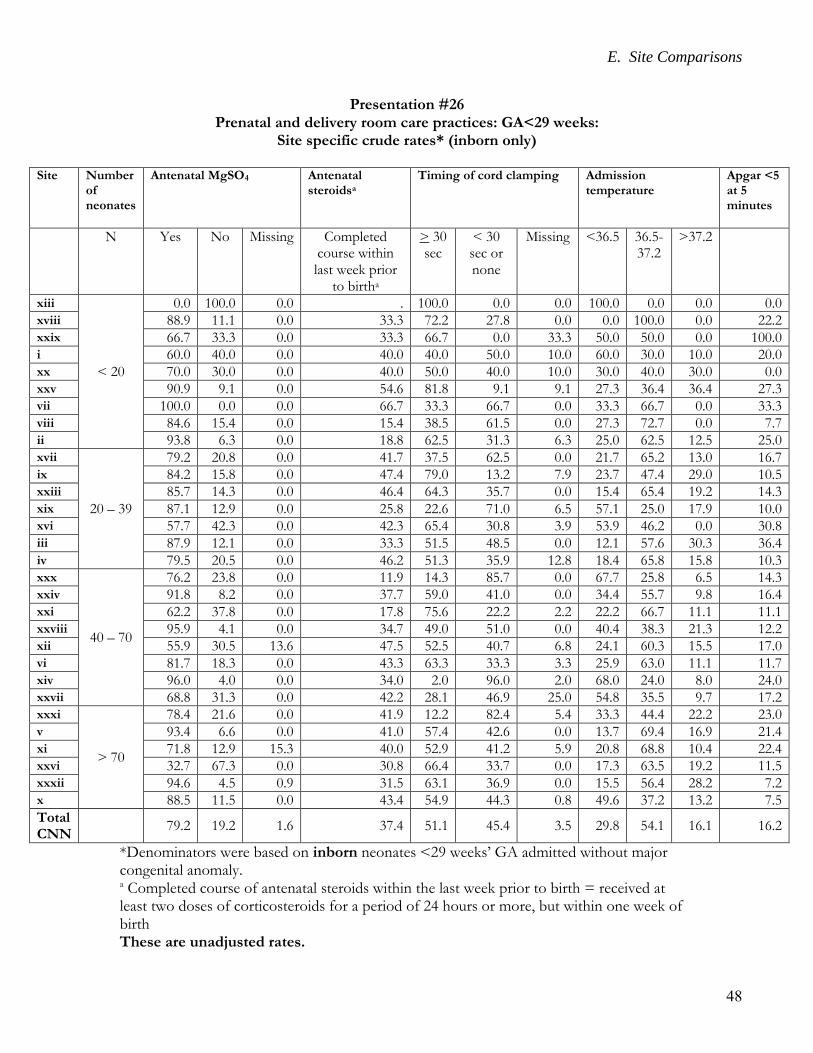
E. Site Comparisons
48
Presentation #26 Prenatal and delivery room care practices: GA<29 weeks:
Site specific crude rates* (inborn only)
Site
Number of neonates
Antenatal MgSO4 Antenatal steroidsa
Timing of cord clamping Admission temperature
Apgar <5 at 5 minutes
N Yes No Missing Completed course within last week prior
to birtha
> 30 sec
< 30 sec or none
Missing <36.5 36.5-37.2
>37.2
xiii
< 20
0.0 100.0 0.0 . 100.0 0.0 0.0 100.0 0.0 0.0 0.0 xviii 88.9 11.1 0.0 33.3 72.2 27.8 0.0 0.0 100.0 0.0 22.2 xxix 66.7 33.3 0.0 33.3 66.7 0.0 33.3 50.0 50.0 0.0 100.0 i 60.0 40.0 0.0 40.0 40.0 50.0 10.0 60.0 30.0 10.0 20.0 xx 70.0 30.0 0.0 40.0 50.0 40.0 10.0 30.0 40.0 30.0 0.0 xxv 90.9 9.1 0.0 54.6 81.8 9.1 9.1 27.3 36.4 36.4 27.3 vii 100.0 0.0 0.0 66.7 33.3 66.7 0.0 33.3 66.7 0.0 33.3 viii 84.6 15.4 0.0 15.4 38.5 61.5 0.0 27.3 72.7 0.0 7.7 ii 93.8 6.3 0.0 18.8 62.5 31.3 6.3 25.0 62.5 12.5 25.0 xvii
20 – 39
79.2 20.8 0.0 41.7 37.5 62.5 0.0 21.7 65.2 13.0 16.7 ix 84.2 15.8 0.0 47.4 79.0 13.2 7.9 23.7 47.4 29.0 10.5 xxiii 85.7 14.3 0.0 46.4 64.3 35.7 0.0 15.4 65.4 19.2 14.3 xix 87.1 12.9 0.0 25.8 22.6 71.0 6.5 57.1 25.0 17.9 10.0 xvi 57.7 42.3 0.0 42.3 65.4 30.8 3.9 53.9 46.2 0.0 30.8 iii 87.9 12.1 0.0 33.3 51.5 48.5 0.0 12.1 57.6 30.3 36.4 iv 79.5 20.5 0.0 46.2 51.3 35.9 12.8 18.4 65.8 15.8 10.3 xxx
40 – 70
76.2 23.8 0.0 11.9 14.3 85.7 0.0 67.7 25.8 6.5 14.3 xxiv 91.8 8.2 0.0 37.7 59.0 41.0 0.0 34.4 55.7 9.8 16.4 xxi 62.2 37.8 0.0 17.8 75.6 22.2 2.2 22.2 66.7 11.1 11.1 xxviii 95.9 4.1 0.0 34.7 49.0 51.0 0.0 40.4 38.3 21.3 12.2 xii 55.9 30.5 13.6 47.5 52.5 40.7 6.8 24.1 60.3 15.5 17.0 vi 81.7 18.3 0.0 43.3 63.3 33.3 3.3 25.9 63.0 11.1 11.7 xiv 96.0 4.0 0.0 34.0 2.0 96.0 2.0 68.0 24.0 8.0 24.0 xxvii 68.8 31.3 0.0 42.2 28.1 46.9 25.0 54.8 35.5 9.7 17.2 xxxi
> 70
78.4 21.6 0.0 41.9 12.2 82.4 5.4 33.3 44.4 22.2 23.0 v 93.4 6.6 0.0 41.0 57.4 42.6 0.0 13.7 69.4 16.9 21.4 xi 71.8 12.9 15.3 40.0 52.9 41.2 5.9 20.8 68.8 10.4 22.4 xxvi 32.7 67.3 0.0 30.8 66.4 33.7 0.0 17.3 63.5 19.2 11.5 xxxii 94.6 4.5 0.9 31.5 63.1 36.9 0.0 15.5 56.4 28.2 7.2 x 88.5 11.5 0.0 43.4 54.9 44.3 0.8 49.6 37.2 13.2 7.5
Total CNN
79.2 19.2 1.6 37.4 51.1 45.4 3.5 29.8 54.1 16.1 16.2
*Denominators were based on inborn neonates <29 weeks’ GA admitted without major congenital anomaly. a Completed course of antenatal steroids within the last week prior to birth = received at least two doses of corticosteroids for a period of 24 hours or more, but within one week of birth These are unadjusted rates.
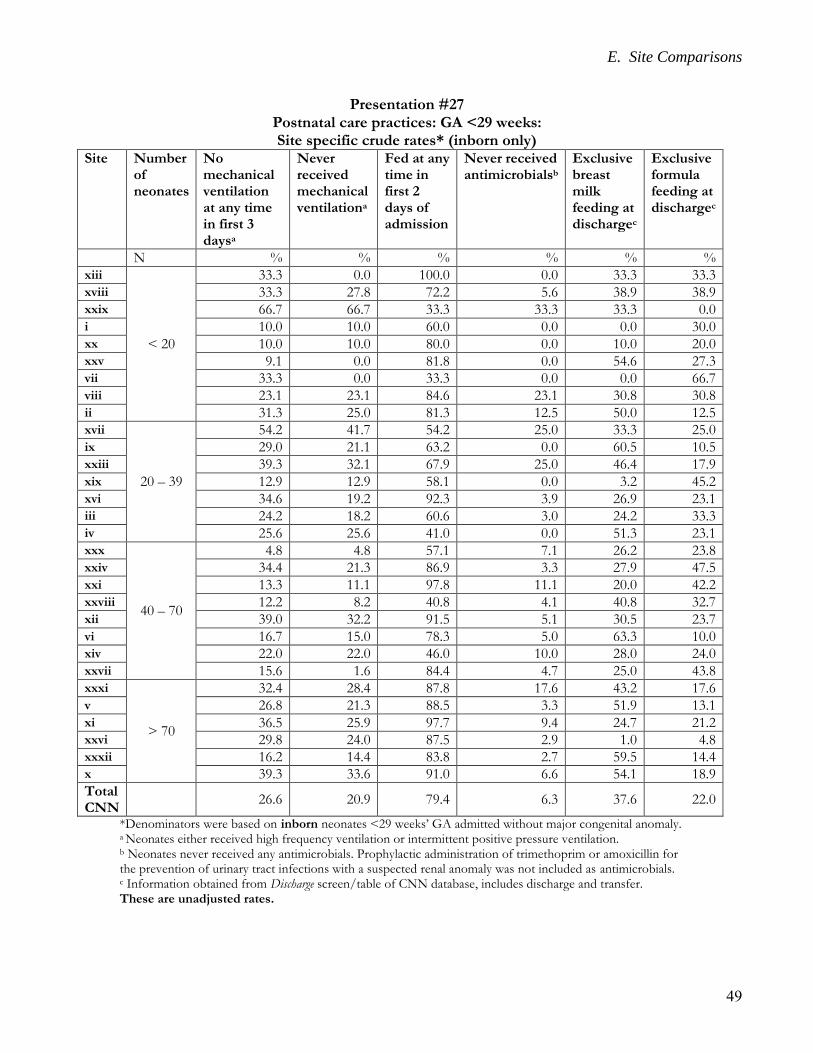
E. Site Comparisons
49
Presentation #27 Postnatal care practices: GA <29 weeks: Site specific crude rates* (inborn only)
Site Number of neonates
No mechanical ventilation at any time in first 3 daysa
Never received mechanical ventilationa
Fed at any time in first 2 days of admission
Never received antimicrobialsb
Exclusive breast milk feeding at dischargec
Exclusive formula feeding at dischargec
N % % % % % % xiii
< 20
33.3 0.0 100.0 0.0 33.3 33.3 xviii 33.3 27.8 72.2 5.6 38.9 38.9 xxix 66.7 66.7 33.3 33.3 33.3 0.0 i 10.0 10.0 60.0 0.0 0.0 30.0 xx 10.0 10.0 80.0 0.0 10.0 20.0 xxv 9.1 0.0 81.8 0.0 54.6 27.3 vii 33.3 0.0 33.3 0.0 0.0 66.7 viii 23.1 23.1 84.6 23.1 30.8 30.8 ii 31.3 25.0 81.3 12.5 50.0 12.5 xvii
20 – 39
54.2 41.7 54.2 25.0 33.3 25.0 ix 29.0 21.1 63.2 0.0 60.5 10.5 xxiii 39.3 32.1 67.9 25.0 46.4 17.9 xix 12.9 12.9 58.1 0.0 3.2 45.2 xvi 34.6 19.2 92.3 3.9 26.9 23.1 iii 24.2 18.2 60.6 3.0 24.2 33.3 iv 25.6 25.6 41.0 0.0 51.3 23.1 xxx
40 – 70
4.8 4.8 57.1 7.1 26.2 23.8 xxiv 34.4 21.3 86.9 3.3 27.9 47.5 xxi 13.3 11.1 97.8 11.1 20.0 42.2 xxviii 12.2 8.2 40.8 4.1 40.8 32.7 xii 39.0 32.2 91.5 5.1 30.5 23.7 vi 16.7 15.0 78.3 5.0 63.3 10.0 xiv 22.0 22.0 46.0 10.0 28.0 24.0 xxvii 15.6 1.6 84.4 4.7 25.0 43.8 xxxi
> 70
32.4 28.4 87.8 17.6 43.2 17.6 v 26.8 21.3 88.5 3.3 51.9 13.1 xi 36.5 25.9 97.7 9.4 24.7 21.2 xxvi 29.8 24.0 87.5 2.9 1.0 4.8 xxxii 16.2 14.4 83.8 2.7 59.5 14.4 x 39.3 33.6 91.0 6.6 54.1 18.9
Total CNN
26.6 20.9 79.4 6.3 37.6 22.0
*Denominators were based on inborn neonates <29 weeks’ GA admitted without major congenital anomaly. a Neonates either received high frequency ventilation or intermittent positive pressure ventilation. b Neonates never received any antimicrobials. Prophylactic administration of trimethoprim or amoxicillin for the prevention of urinary tract infections with a suspected renal anomaly was not included as antimicrobials. c Information obtained from Discharge screen/table of CNN database, includes discharge and transfer. These are unadjusted rates.
E. Site Comparisons
50
E.2. Site Comparisons –
Survival / Mortality
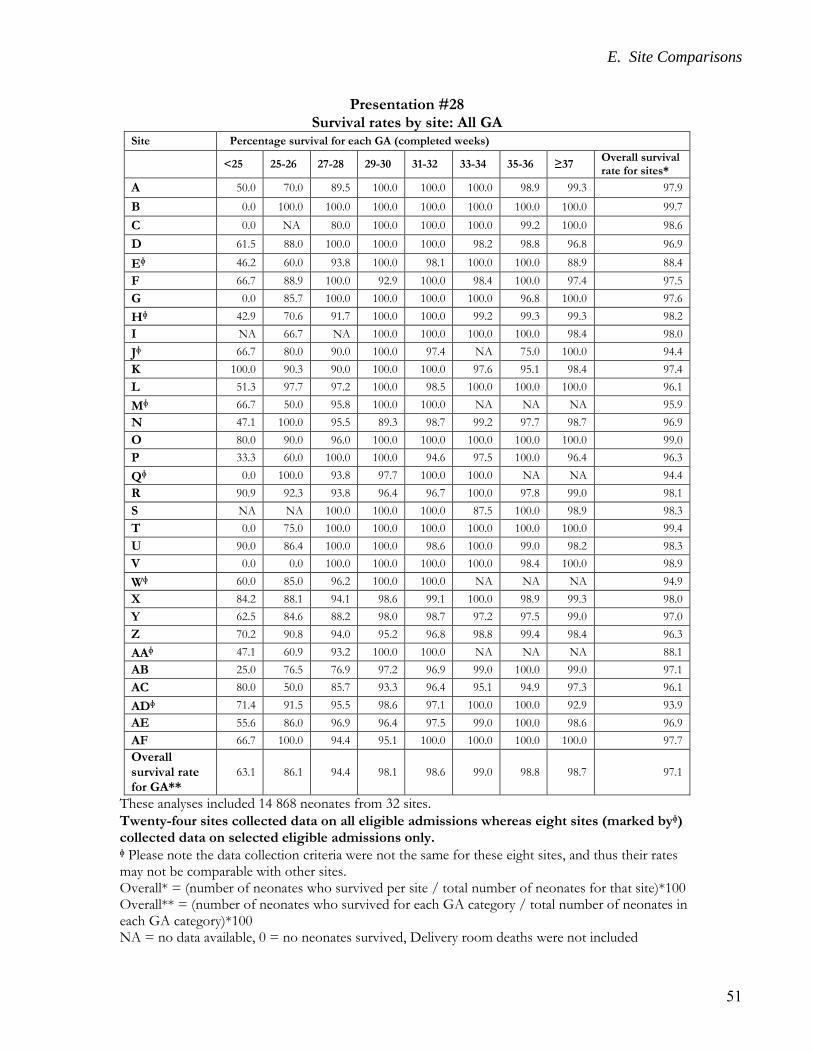
E. Site Comparisons
51
Presentation #28 Survival rates by site: All GA
Site Percentage survival for each GA (completed weeks)
<25 25-26 27-28 29-30 31-32 33-34 35-36 ≥37 Overall survival rate for sites*
A 50.0 70.0 89.5 100.0 100.0 100.0 98.9 99.3 97.9
B 0.0 100.0 100.0 100.0 100.0 100.0 100.0 100.0 99.7
C 0.0 NA 80.0 100.0 100.0 100.0 99.2 100.0 98.6
D 61.5 88.0 100.0 100.0 100.0 98.2 98.8 96.8 96.9
Eᶲ 46.2 60.0 93.8 100.0 98.1 100.0 100.0 88.9 88.4
F 66.7 88.9 100.0 92.9 100.0 98.4 100.0 97.4 97.5
G 0.0 85.7 100.0 100.0 100.0 100.0 96.8 100.0 97.6
Hᶲ 42.9 70.6 91.7 100.0 100.0 99.2 99.3 99.3 98.2
I NA 66.7 NA 100.0 100.0 100.0 100.0 98.4 98.0
Jᶲ 66.7 80.0 90.0 100.0 97.4 NA 75.0 100.0 94.4
K 100.0 90.3 90.0 100.0 100.0 97.6 95.1 98.4 97.4
L 51.3 97.7 97.2 100.0 98.5 100.0 100.0 100.0 96.1
Mᶲ 66.7 50.0 95.8 100.0 100.0 NA NA NA 95.9
N 47.1 100.0 95.5 89.3 98.7 99.2 97.7 98.7 96.9
O 80.0 90.0 96.0 100.0 100.0 100.0 100.0 100.0 99.0
P 33.3 60.0 100.0 100.0 94.6 97.5 100.0 96.4 96.3
Qᶲ 0.0 100.0 93.8 97.7 100.0 100.0 NA NA 94.4
R 90.9 92.3 93.8 96.4 96.7 100.0 97.8 99.0 98.1
S NA NA 100.0 100.0 100.0 87.5 100.0 98.9 98.3
T 0.0 75.0 100.0 100.0 100.0 100.0 100.0 100.0 99.4
U 90.0 86.4 100.0 100.0 98.6 100.0 99.0 98.2 98.3
V 0.0 0.0 100.0 100.0 100.0 100.0 98.4 100.0 98.9
Wᶲ 60.0 85.0 96.2 100.0 100.0 NA NA NA 94.9
X 84.2 88.1 94.1 98.6 99.1 100.0 98.9 99.3 98.0
Y 62.5 84.6 88.2 98.0 98.7 97.2 97.5 99.0 97.0
Z 70.2 90.8 94.0 95.2 96.8 98.8 99.4 98.4 96.3
AAᶲ 47.1 60.9 93.2 100.0 100.0 NA NA NA 88.1
AB 25.0 76.5 76.9 97.2 96.9 99.0 100.0 99.0 97.1
AC 80.0 50.0 85.7 93.3 96.4 95.1 94.9 97.3 96.1
ADᶲ 71.4 91.5 95.5 98.6 97.1 100.0 100.0 92.9 93.9
AE 55.6 86.0 96.9 96.4 97.5 99.0 100.0 98.6 96.9
AF 66.7 100.0 94.4 95.1 100.0 100.0 100.0 100.0 97.7
Overall survival rate for GA**
63.1 86.1 94.4 98.1 98.6 99.0 98.8 98.7 97.1
These analyses included 14 868 neonates from 32 sites.
Twenty-four sites collected data on all eligible admissions whereas eight sites (marked byᶲ) collected data on selected eligible admissions only.
ᶲ Please note the data collection criteria were not the same for these eight sites, and thus their rates may not be comparable with other sites. Overall* = (number of neonates who survived per site / total number of neonates for that site)*100 Overall** = (number of neonates who survived for each GA category / total number of neonates in each GA category)*100 NA = no data available, 0 = no neonates survived, Delivery room deaths were not included
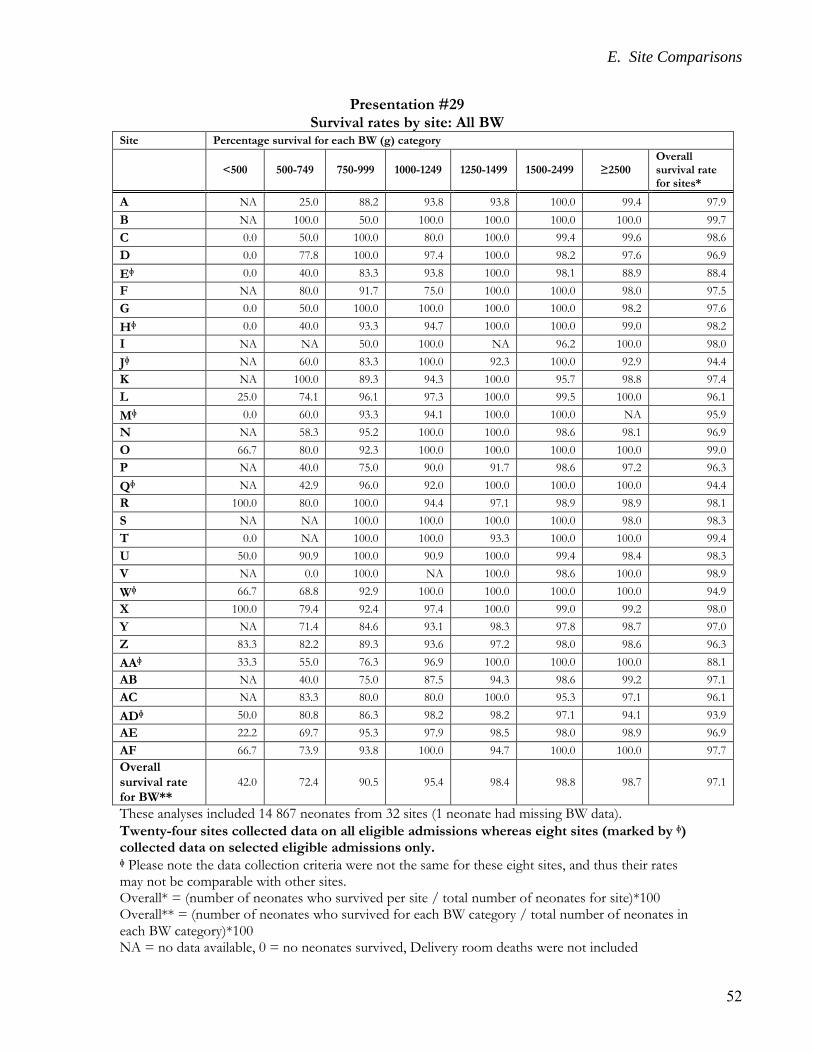
E. Site Comparisons
52
Presentation #29 Survival rates by site: All BW
Site Percentage survival for each BW (g) category
<500 500-749 750-999 1000-1249 1250-1499 1500-2499 ≥2500 Overall survival rate for sites*
A NA 25.0 88.2 93.8 93.8 100.0 99.4 97.9
B NA 100.0 50.0 100.0 100.0 100.0 100.0 99.7
C 0.0 50.0 100.0 80.0 100.0 99.4 99.6 98.6
D 0.0 77.8 100.0 97.4 100.0 98.2 97.6 96.9
Eᶲ 0.0 40.0 83.3 93.8 100.0 98.1 88.9 88.4
F NA 80.0 91.7 75.0 100.0 100.0 98.0 97.5
G 0.0 50.0 100.0 100.0 100.0 100.0 98.2 97.6
Hᶲ 0.0 40.0 93.3 94.7 100.0 100.0 99.0 98.2
I NA NA 50.0 100.0 NA 96.2 100.0 98.0
Jᶲ NA 60.0 83.3 100.0 92.3 100.0 92.9 94.4
K NA 100.0 89.3 94.3 100.0 95.7 98.8 97.4
L 25.0 74.1 96.1 97.3 100.0 99.5 100.0 96.1
Mᶲ 0.0 60.0 93.3 94.1 100.0 100.0 NA 95.9
N NA 58.3 95.2 100.0 100.0 98.6 98.1 96.9
O 66.7 80.0 92.3 100.0 100.0 100.0 100.0 99.0
P NA 40.0 75.0 90.0 91.7 98.6 97.2 96.3
Qᶲ NA 42.9 96.0 92.0 100.0 100.0 100.0 94.4
R 100.0 80.0 100.0 94.4 97.1 98.9 98.9 98.1
S NA NA 100.0 100.0 100.0 100.0 98.0 98.3
T 0.0 NA 100.0 100.0 93.3 100.0 100.0 99.4
U 50.0 90.9 100.0 90.9 100.0 99.4 98.4 98.3
V NA 0.0 100.0 NA 100.0 98.6 100.0 98.9
Wᶲ 66.7 68.8 92.9 100.0 100.0 100.0 100.0 94.9
X 100.0 79.4 92.4 97.4 100.0 99.0 99.2 98.0
Y NA 71.4 84.6 93.1 98.3 97.8 98.7 97.0
Z 83.3 82.2 89.3 93.6 97.2 98.0 98.6 96.3
AAᶲ 33.3 55.0 76.3 96.9 100.0 100.0 100.0 88.1
AB NA 40.0 75.0 87.5 94.3 98.6 99.2 97.1
AC NA 83.3 80.0 80.0 100.0 95.3 97.1 96.1
ADᶲ 50.0 80.8 86.3 98.2 98.2 97.1 94.1 93.9
AE 22.2 69.7 95.3 97.9 98.5 98.0 98.9 96.9
AF 66.7 73.9 93.8 100.0 94.7 100.0 100.0 97.7
Overall survival rate for BW**
42.0 72.4 90.5 95.4 98.4 98.8 98.7 97.1
These analyses included 14 867 neonates from 32 sites (1 neonate had missing BW data).
Twenty-four sites collected data on all eligible admissions whereas eight sites (marked by ᶲ) collected data on selected eligible admissions only.
ᶲ Please note the data collection criteria were not the same for these eight sites, and thus their rates may not be comparable with other sites. Overall* = (number of neonates who survived per site / total number of neonates for site)*100 Overall** = (number of neonates who survived for each BW category / total number of neonates in each BW category)*100 NA = no data available, 0 = no neonates survived, Delivery room deaths were not included
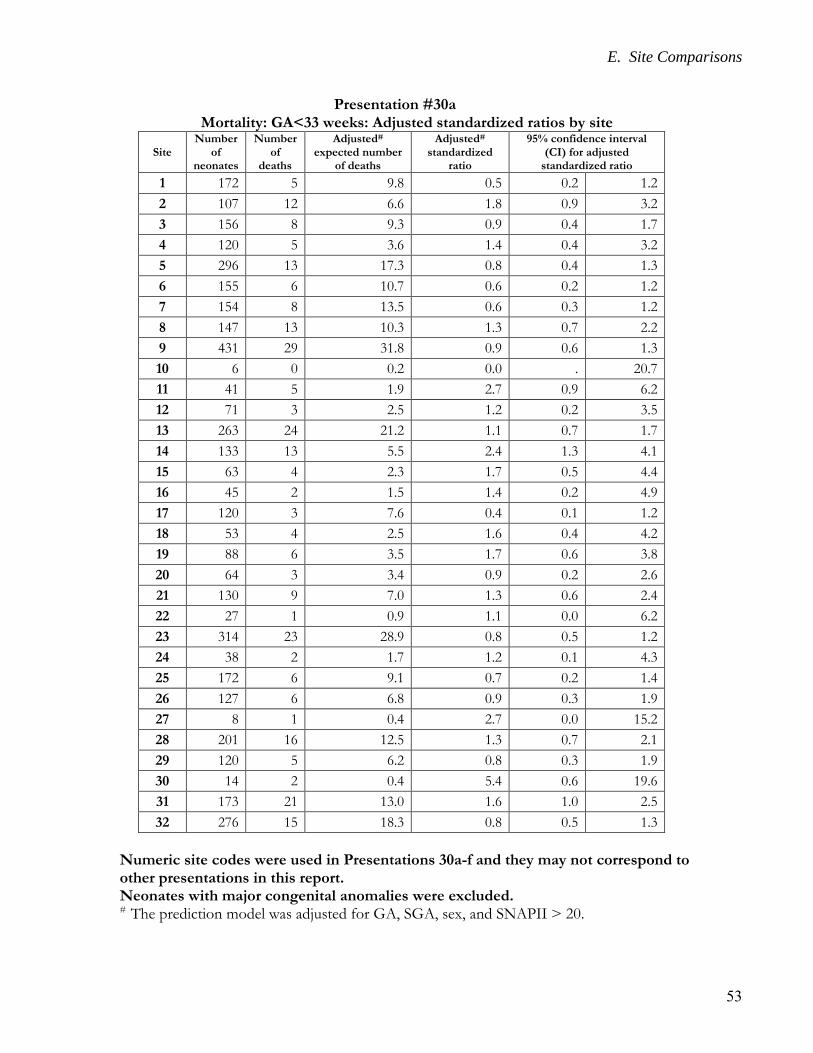
E. Site Comparisons
53
Presentation #30a Mortality: GA<33 weeks: Adjusted standardized ratios by site
Site Number
of neonates
Number of
deaths
Adjusted# expected number
of deaths
Adjusted# standardized
ratio
95% confidence interval (CI) for adjusted
standardized ratio
1 172 5 9.8 0.5 0.2 1.2
2 107 12 6.6 1.8 0.9 3.2
3 156 8 9.3 0.9 0.4 1.7
4 120 5 3.6 1.4 0.4 3.2
5 296 13 17.3 0.8 0.4 1.3
6 155 6 10.7 0.6 0.2 1.2
7 154 8 13.5 0.6 0.3 1.2
8 147 13 10.3 1.3 0.7 2.2
9 431 29 31.8 0.9 0.6 1.3
10 6 0 0.2 0.0 . 20.7
11 41 5 1.9 2.7 0.9 6.2
12 71 3 2.5 1.2 0.2 3.5
13 263 24 21.2 1.1 0.7 1.7
14 133 13 5.5 2.4 1.3 4.1
15 63 4 2.3 1.7 0.5 4.4
16 45 2 1.5 1.4 0.2 4.9
17 120 3 7.6 0.4 0.1 1.2
18 53 4 2.5 1.6 0.4 4.2
19 88 6 3.5 1.7 0.6 3.8
20 64 3 3.4 0.9 0.2 2.6
21 130 9 7.0 1.3 0.6 2.4
22 27 1 0.9 1.1 0.0 6.2
23 314 23 28.9 0.8 0.5 1.2
24 38 2 1.7 1.2 0.1 4.3
25 172 6 9.1 0.7 0.2 1.4
26 127 6 6.8 0.9 0.3 1.9
27 8 1 0.4 2.7 0.0 15.2
28 201 16 12.5 1.3 0.7 2.1
29 120 5 6.2 0.8 0.3 1.9
30 14 2 0.4 5.4 0.6 19.6
31 173 21 13.0 1.6 1.0 2.5
32 276 15 18.3 0.8 0.5 1.3
Numeric site codes were used in Presentations 30a-f and they may not correspond to other presentations in this report. Neonates with major congenital anomalies were excluded. # The prediction model was adjusted for GA, SGA, sex, and SNAPII > 20.
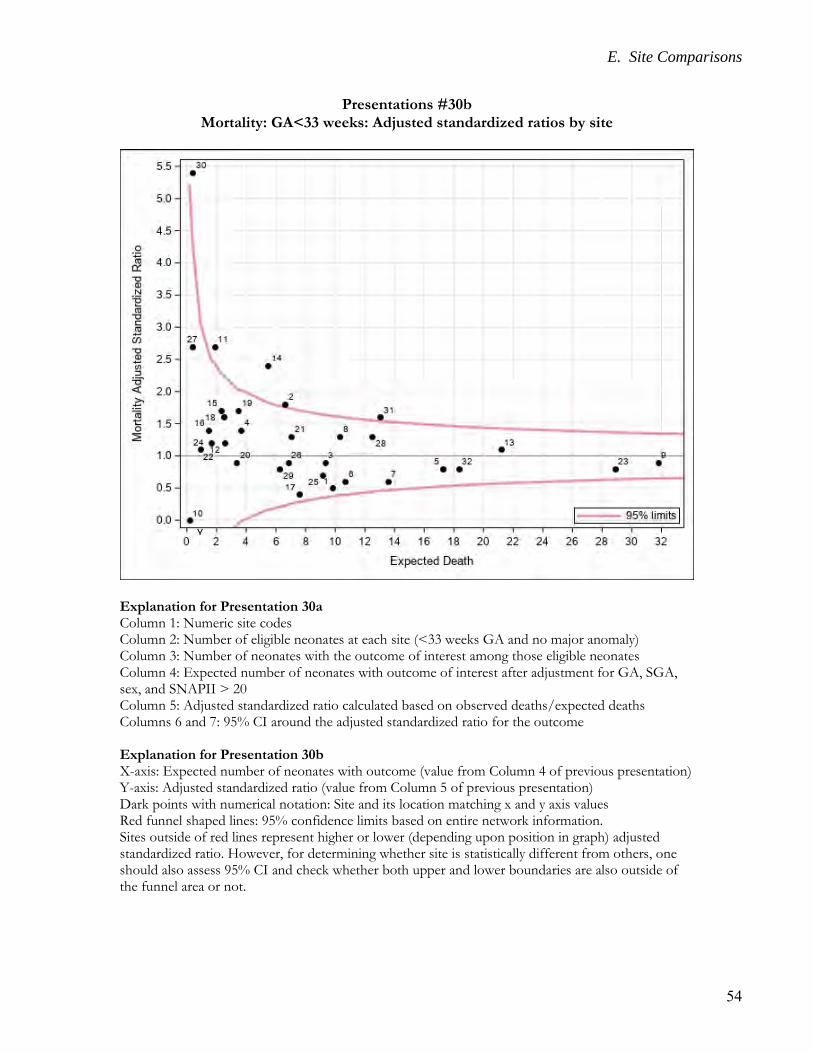
E. Site Comparisons
54
Presentations #30b Mortality: GA<33 weeks: Adjusted standardized ratios by site
Explanation for Presentation 30a Column 1: Numeric site codes Column 2: Number of eligible neonates at each site (<33 weeks GA and no major anomaly) Column 3: Number of neonates with the outcome of interest among those eligible neonates Column 4: Expected number of neonates with outcome of interest after adjustment for GA, SGA, sex, and SNAPII > 20 Column 5: Adjusted standardized ratio calculated based on observed deaths/expected deaths Columns 6 and 7: 95% CI around the adjusted standardized ratio for the outcome Explanation for Presentation 30b X-axis: Expected number of neonates with outcome (value from Column 4 of previous presentation) Y-axis: Adjusted standardized ratio (value from Column 5 of previous presentation) Dark points with numerical notation: Site and its location matching x and y axis values Red funnel shaped lines: 95% confidence limits based on entire network information. Sites outside of red lines represent higher or lower (depending upon position in graph) adjusted standardized ratio. However, for determining whether site is statistically different from others, one should also assess 95% CI and check whether both upper and lower boundaries are also outside of the funnel area or not.
Y
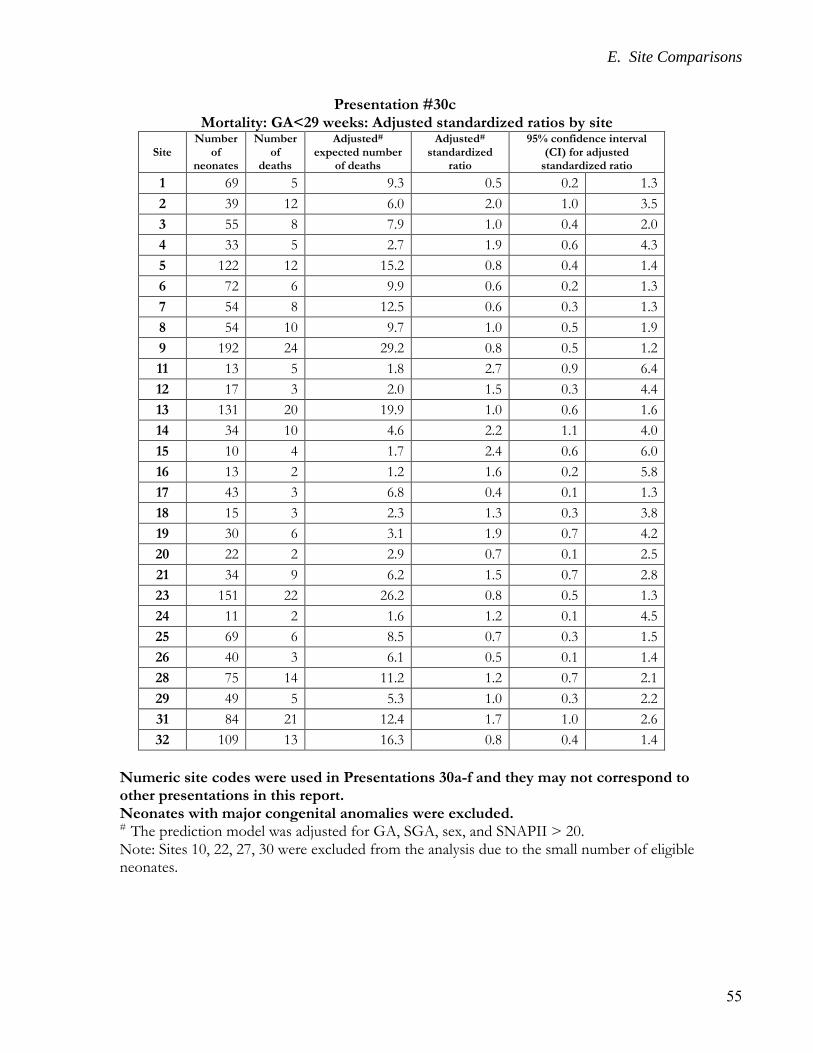
E. Site Comparisons
55
Presentation #30c Mortality: GA<29 weeks: Adjusted standardized ratios by site
Site Number
of neonates
Number of
deaths
Adjusted# expected number
of deaths
Adjusted# standardized
ratio
95% confidence interval (CI) for adjusted
standardized ratio
1 69 5 9.3 0.5 0.2 1.3
2 39 12 6.0 2.0 1.0 3.5
3 55 8 7.9 1.0 0.4 2.0
4 33 5 2.7 1.9 0.6 4.3
5 122 12 15.2 0.8 0.4 1.4
6 72 6 9.9 0.6 0.2 1.3
7 54 8 12.5 0.6 0.3 1.3
8 54 10 9.7 1.0 0.5 1.9
9 192 24 29.2 0.8 0.5 1.2
11 13 5 1.8 2.7 0.9 6.4
12 17 3 2.0 1.5 0.3 4.4
13 131 20 19.9 1.0 0.6 1.6
14 34 10 4.6 2.2 1.1 4.0
15 10 4 1.7 2.4 0.6 6.0
16 13 2 1.2 1.6 0.2 5.8
17 43 3 6.8 0.4 0.1 1.3
18 15 3 2.3 1.3 0.3 3.8
19 30 6 3.1 1.9 0.7 4.2
20 22 2 2.9 0.7 0.1 2.5
21 34 9 6.2 1.5 0.7 2.8
23 151 22 26.2 0.8 0.5 1.3
24 11 2 1.6 1.2 0.1 4.5
25 69 6 8.5 0.7 0.3 1.5
26 40 3 6.1 0.5 0.1 1.4
28 75 14 11.2 1.2 0.7 2.1
29 49 5 5.3 1.0 0.3 2.2
31 84 21 12.4 1.7 1.0 2.6
32 109 13 16.3 0.8 0.4 1.4
Numeric site codes were used in Presentations 30a-f and they may not correspond to other presentations in this report. Neonates with major congenital anomalies were excluded. # The prediction model was adjusted for GA, SGA, sex, and SNAPII > 20. Note: Sites 10, 22, 27, 30 were excluded from the analysis due to the small number of eligible neonates.
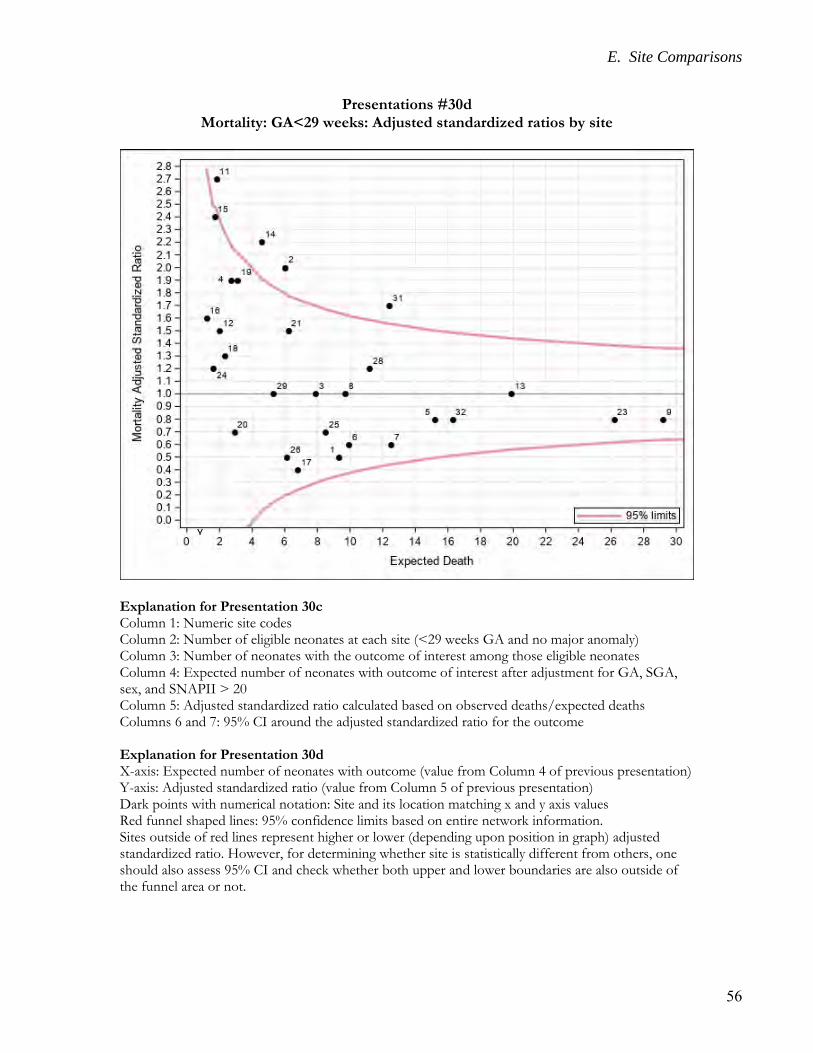
E. Site Comparisons
56
Presentations #30d Mortality: GA<29 weeks: Adjusted standardized ratios by site
Explanation for Presentation 30c Column 1: Numeric site codes Column 2: Number of eligible neonates at each site (<29 weeks GA and no major anomaly) Column 3: Number of neonates with the outcome of interest among those eligible neonates Column 4: Expected number of neonates with outcome of interest after adjustment for GA, SGA, sex, and SNAPII > 20 Column 5: Adjusted standardized ratio calculated based on observed deaths/expected deaths Columns 6 and 7: 95% CI around the adjusted standardized ratio for the outcome Explanation for Presentation 30d X-axis: Expected number of neonates with outcome (value from Column 4 of previous presentation) Y-axis: Adjusted standardized ratio (value from Column 5 of previous presentation) Dark points with numerical notation: Site and its location matching x and y axis values Red funnel shaped lines: 95% confidence limits based on entire network information. Sites outside of red lines represent higher or lower (depending upon position in graph) adjusted standardized ratio. However, for determining whether site is statistically different from others, one should also assess 95% CI and check whether both upper and lower boundaries are also outside of the funnel area or not.
Y
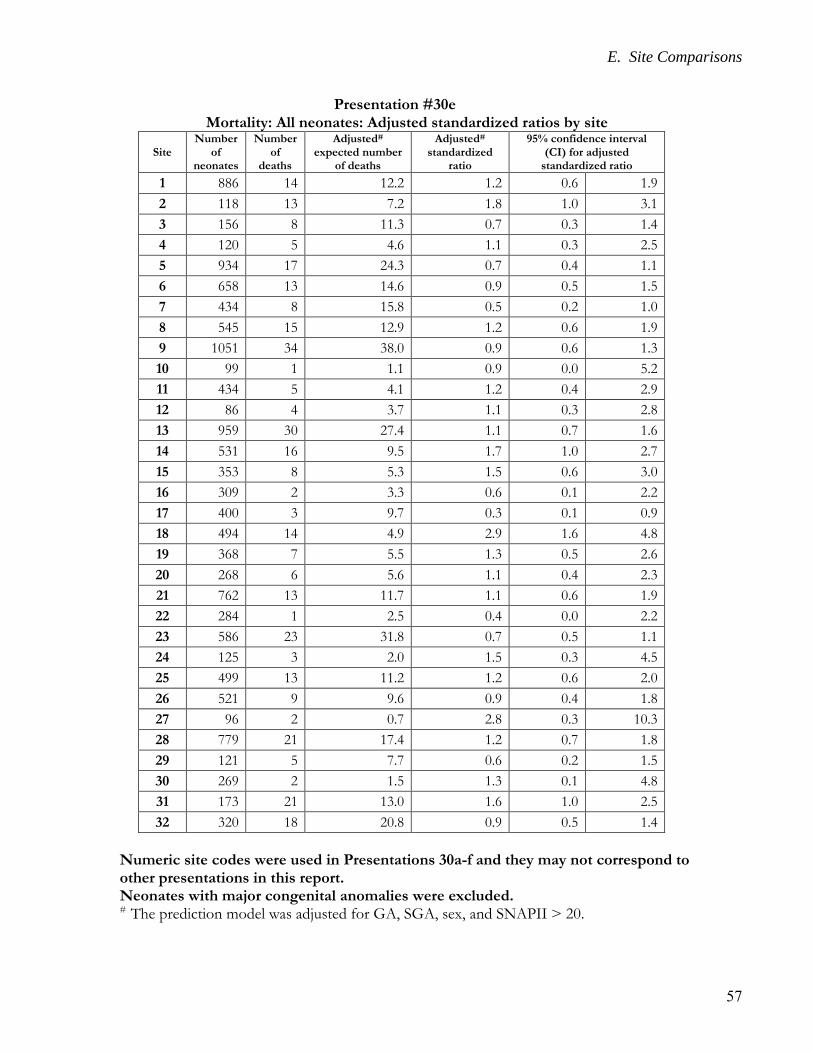
E. Site Comparisons
57
Presentation #30e Mortality: All neonates: Adjusted standardized ratios by site
Site Number
of neonates
Number of
deaths
Adjusted# expected number
of deaths
Adjusted# standardized
ratio
95% confidence interval (CI) for adjusted
standardized ratio
1 886 14 12.2 1.2 0.6 1.9
2 118 13 7.2 1.8 1.0 3.1
3 156 8 11.3 0.7 0.3 1.4
4 120 5 4.6 1.1 0.3 2.5
5 934 17 24.3 0.7 0.4 1.1
6 658 13 14.6 0.9 0.5 1.5
7 434 8 15.8 0.5 0.2 1.0
8 545 15 12.9 1.2 0.6 1.9
9 1051 34 38.0 0.9 0.6 1.3
10 99 1 1.1 0.9 0.0 5.2
11 434 5 4.1 1.2 0.4 2.9
12 86 4 3.7 1.1 0.3 2.8
13 959 30 27.4 1.1 0.7 1.6
14 531 16 9.5 1.7 1.0 2.7
15 353 8 5.3 1.5 0.6 3.0
16 309 2 3.3 0.6 0.1 2.2
17 400 3 9.7 0.3 0.1 0.9
18 494 14 4.9 2.9 1.6 4.8
19 368 7 5.5 1.3 0.5 2.6
20 268 6 5.6 1.1 0.4 2.3
21 762 13 11.7 1.1 0.6 1.9
22 284 1 2.5 0.4 0.0 2.2
23 586 23 31.8 0.7 0.5 1.1
24 125 3 2.0 1.5 0.3 4.5
25 499 13 11.2 1.2 0.6 2.0
26 521 9 9.6 0.9 0.4 1.8
27 96 2 0.7 2.8 0.3 10.3
28 779 21 17.4 1.2 0.7 1.8
29 121 5 7.7 0.6 0.2 1.5
30 269 2 1.5 1.3 0.1 4.8
31 173 21 13.0 1.6 1.0 2.5
32 320 18 20.8 0.9 0.5 1.4
Numeric site codes were used in Presentations 30a-f and they may not correspond to other presentations in this report. Neonates with major congenital anomalies were excluded. # The prediction model was adjusted for GA, SGA, sex, and SNAPII > 20.
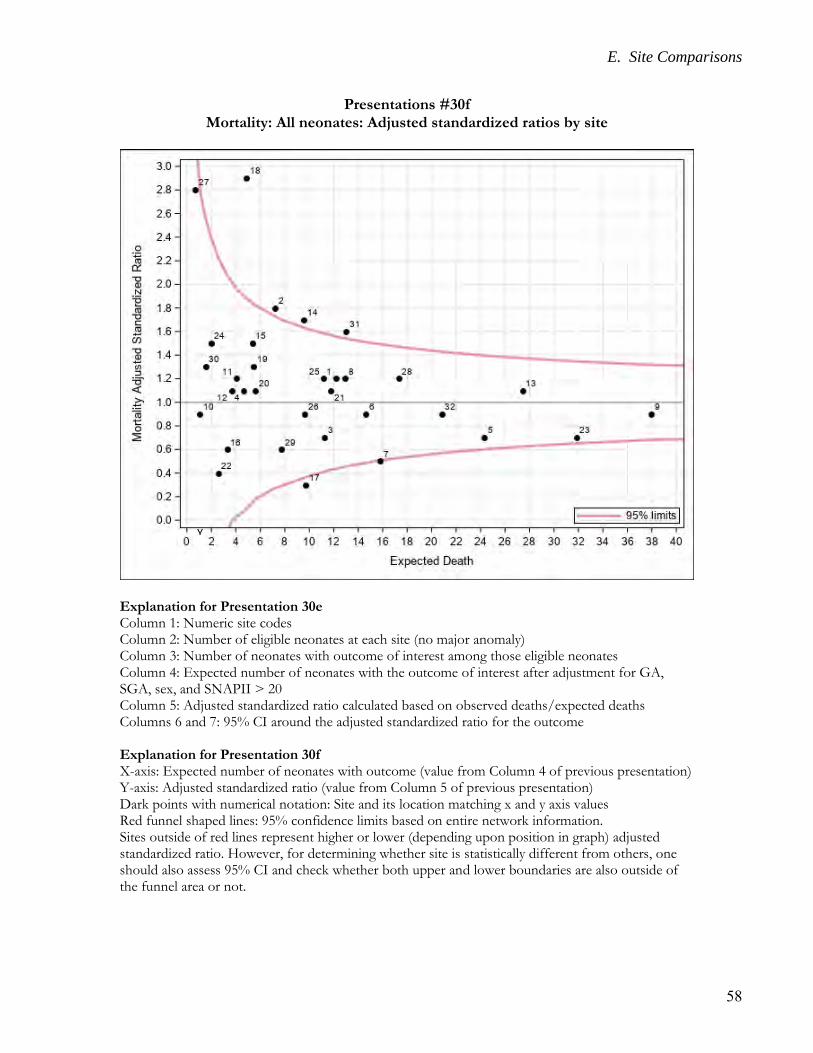
E. Site Comparisons
58
Presentations #30f Mortality: All neonates: Adjusted standardized ratios by site
Explanation for Presentation 30e Column 1: Numeric site codes Column 2: Number of eligible neonates at each site (no major anomaly) Column 3: Number of neonates with outcome of interest among those eligible neonates Column 4: Expected number of neonates with the outcome of interest after adjustment for GA, SGA, sex, and SNAPII > 20 Column 5: Adjusted standardized ratio calculated based on observed deaths/expected deaths Columns 6 and 7: 95% CI around the adjusted standardized ratio for the outcome Explanation for Presentation 30f X-axis: Expected number of neonates with outcome (value from Column 4 of previous presentation) Y-axis: Adjusted standardized ratio (value from Column 5 of previous presentation) Dark points with numerical notation: Site and its location matching x and y axis values Red funnel shaped lines: 95% confidence limits based on entire network information. Sites outside of red lines represent higher or lower (depending upon position in graph) adjusted standardized ratio. However, for determining whether site is statistically different from others, one should also assess 95% CI and check whether both upper and lower boundaries are also outside of the funnel area or not.
Y
E. Site Comparisons
59
E.3. Site Comparisons –
Mortality / Morbidities
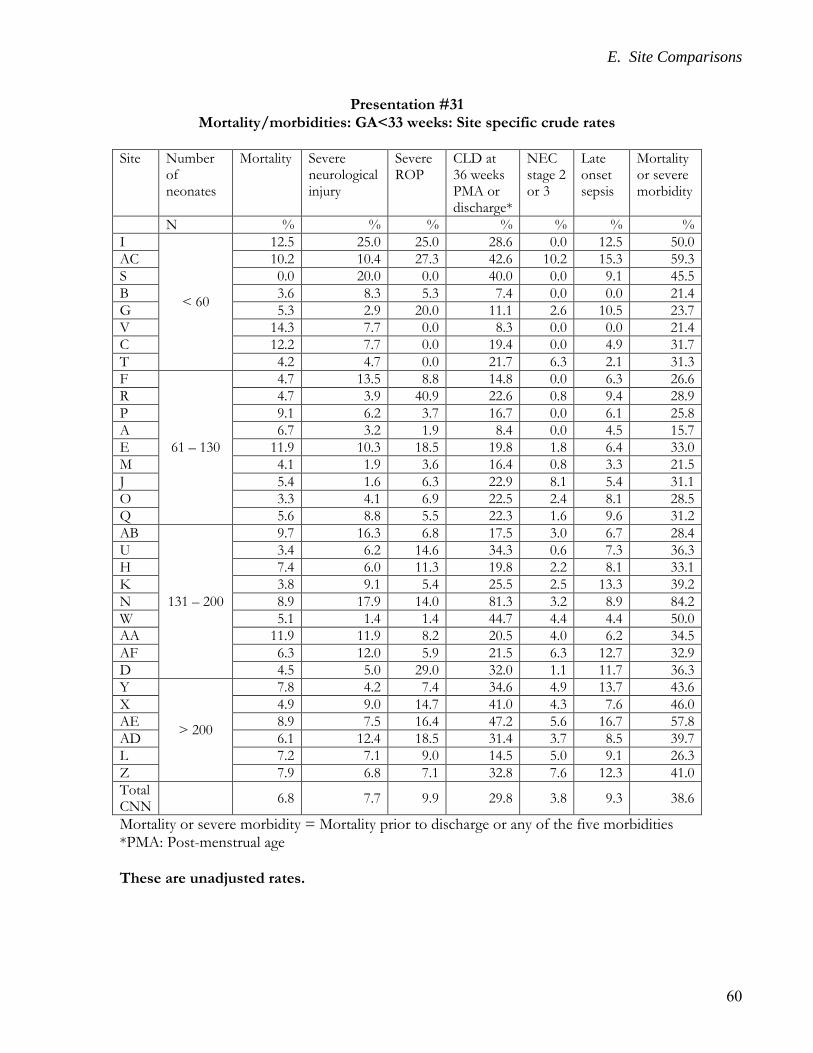
E. Site Comparisons
60
Presentation #31 Mortality/morbidities: GA<33 weeks: Site specific crude rates
Site Number
of neonates
Mortality Severe neurological injury
Severe ROP
CLD at 36 weeks PMA or discharge*
NEC stage 2 or 3
Late onset sepsis
Mortality or severe morbidity
N % % % % % % %
I
< 60
12.5 25.0 25.0 28.6 0.0 12.5 50.0
AC 10.2 10.4 27.3 42.6 10.2 15.3 59.3
S 0.0 20.0 0.0 40.0 0.0 9.1 45.5
B 3.6 8.3 5.3 7.4 0.0 0.0 21.4
G 5.3 2.9 20.0 11.1 2.6 10.5 23.7
V 14.3 7.7 0.0 8.3 0.0 0.0 21.4
C 12.2 7.7 0.0 19.4 0.0 4.9 31.7
T 4.2 4.7 0.0 21.7 6.3 2.1 31.3
F
61 – 130
4.7 13.5 8.8 14.8 0.0 6.3 26.6
R 4.7 3.9 40.9 22.6 0.8 9.4 28.9
P 9.1 6.2 3.7 16.7 0.0 6.1 25.8
A 6.7 3.2 1.9 8.4 0.0 4.5 15.7
E 11.9 10.3 18.5 19.8 1.8 6.4 33.0
M 4.1 1.9 3.6 16.4 0.8 3.3 21.5
J 5.4 1.6 6.3 22.9 8.1 5.4 31.1
O 3.3 4.1 6.9 22.5 2.4 8.1 28.5
Q 5.6 8.8 5.5 22.3 1.6 9.6 31.2
AB
131 – 200
9.7 16.3 6.8 17.5 3.0 6.7 28.4
U 3.4 6.2 14.6 34.3 0.6 7.3 36.3
H 7.4 6.0 11.3 19.8 2.2 8.1 33.1
K 3.8 9.1 5.4 25.5 2.5 13.3 39.2
N 8.9 17.9 14.0 81.3 3.2 8.9 84.2
W 5.1 1.4 1.4 44.7 4.4 4.4 50.0
AA 11.9 11.9 8.2 20.5 4.0 6.2 34.5
AF 6.3 12.0 5.9 21.5 6.3 12.7 32.9
D 4.5 5.0 29.0 32.0 1.1 11.7 36.3
Y
> 200
7.8 4.2 7.4 34.6 4.9 13.7 43.6
X 4.9 9.0 14.7 41.0 4.3 7.6 46.0
AE 8.9 7.5 16.4 47.2 5.6 16.7 57.8
AD 6.1 12.4 18.5 31.4 3.7 8.5 39.7
L 7.2 7.1 9.0 14.5 5.0 9.1 26.3
Z 7.9 6.8 7.1 32.8 7.6 12.3 41.0
Total CNN
6.8 7.7 9.9 29.8 3.8 9.3 38.6
Mortality or severe morbidity = Mortality prior to discharge or any of the five morbidities *PMA: Post-menstrual age These are unadjusted rates.
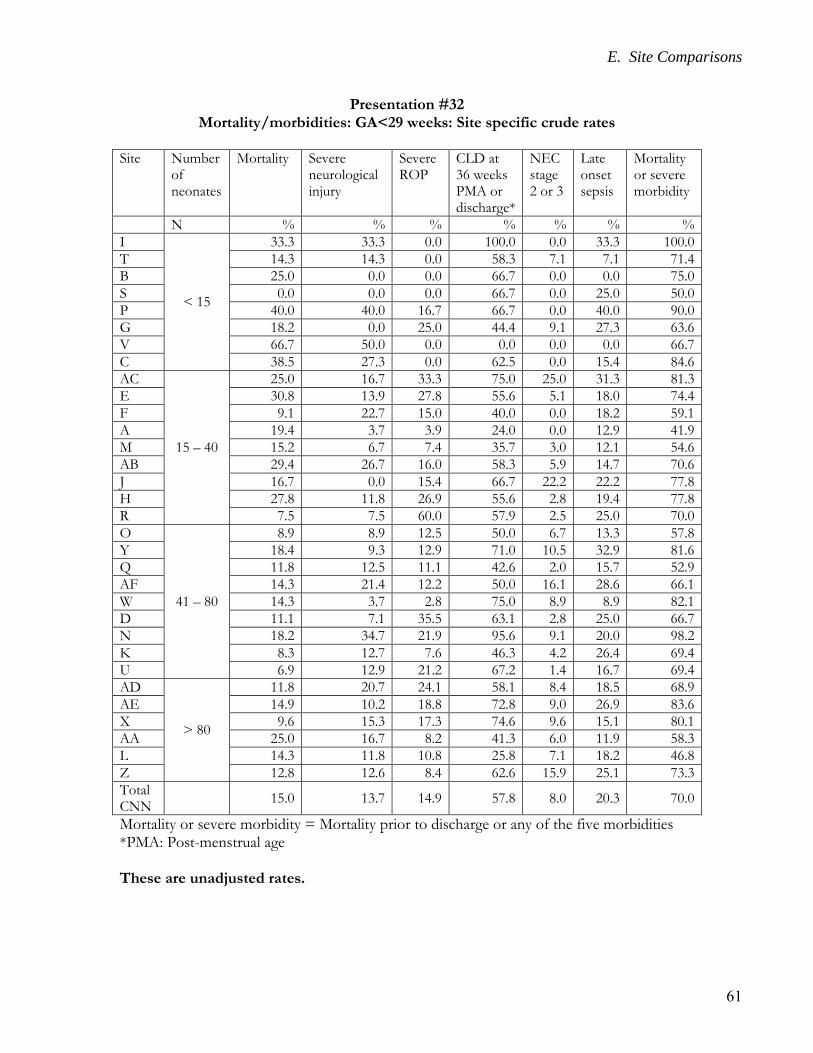
E. Site Comparisons
61
Presentation #32 Mortality/morbidities: GA<29 weeks: Site specific crude rates
Site Number
of neonates
Mortality Severe neurological injury
Severe ROP
CLD at 36 weeks PMA or discharge*
NEC stage 2 or 3
Late onset sepsis
Mortality or severe morbidity
N % % % % % % %
I
< 15
33.3 33.3 0.0 100.0 0.0 33.3 100.0
T 14.3 14.3 0.0 58.3 7.1 7.1 71.4
B 25.0 0.0 0.0 66.7 0.0 0.0 75.0
S 0.0 0.0 0.0 66.7 0.0 25.0 50.0
P 40.0 40.0 16.7 66.7 0.0 40.0 90.0
G 18.2 0.0 25.0 44.4 9.1 27.3 63.6
V 66.7 50.0 0.0 0.0 0.0 0.0 66.7
C 38.5 27.3 0.0 62.5 0.0 15.4 84.6
AC
15 – 40
25.0 16.7 33.3 75.0 25.0 31.3 81.3
E 30.8 13.9 27.8 55.6 5.1 18.0 74.4
F 9.1 22.7 15.0 40.0 0.0 18.2 59.1
A 19.4 3.7 3.9 24.0 0.0 12.9 41.9
M 15.2 6.7 7.4 35.7 3.0 12.1 54.6
AB 29.4 26.7 16.0 58.3 5.9 14.7 70.6
J 16.7 0.0 15.4 66.7 22.2 22.2 77.8
H 27.8 11.8 26.9 55.6 2.8 19.4 77.8
R 7.5 7.5 60.0 57.9 2.5 25.0 70.0
O
41 – 80
8.9 8.9 12.5 50.0 6.7 13.3 57.8
Y 18.4 9.3 12.9 71.0 10.5 32.9 81.6
Q 11.8 12.5 11.1 42.6 2.0 15.7 52.9
AF 14.3 21.4 12.2 50.0 16.1 28.6 66.1
W 14.3 3.7 2.8 75.0 8.9 8.9 82.1
D 11.1 7.1 35.5 63.1 2.8 25.0 66.7
N 18.2 34.7 21.9 95.6 9.1 20.0 98.2
K 8.3 12.7 7.6 46.3 4.2 26.4 69.4
U 6.9 12.9 21.2 67.2 1.4 16.7 69.4
AD
> 80
11.8 20.7 24.1 58.1 8.4 18.5 68.9
AE 14.9 10.2 18.8 72.8 9.0 26.9 83.6
X 9.6 15.3 17.3 74.6 9.6 15.1 80.1
AA 25.0 16.7 8.2 41.3 6.0 11.9 58.3
L 14.3 11.8 10.8 25.8 7.1 18.2 46.8
Z 12.8 12.6 8.4 62.6 15.9 25.1 73.3
Total CNN
15.0 13.7 14.9 57.8 8.0 20.3 70.0
Mortality or severe morbidity = Mortality prior to discharge or any of the five morbidities *PMA: Post-menstrual age These are unadjusted rates.
E. Site Comparisons
62
E.3.1. Site Comparisons –
Late Onset Sepsis and Antimicrobial Use
In presentations #33 and #34, late onset sepsis was attributed to the hospital where the
first episode of sepsis was acquired. Each neonate was counted only once even if there were
multiple episodes of infections.
In presentations #35 and #36, assignment of infection was based on location where the
infection happened and not assigned to the hospital where the first episode of sepsis was
acquired. Each episode of infection was counted (the total number of episodes exceeds the
total number of neonates).
In all other presentations of this report, all morbidities including late onset sepsis were
attributed to the hospital where the neonate was first admitted.
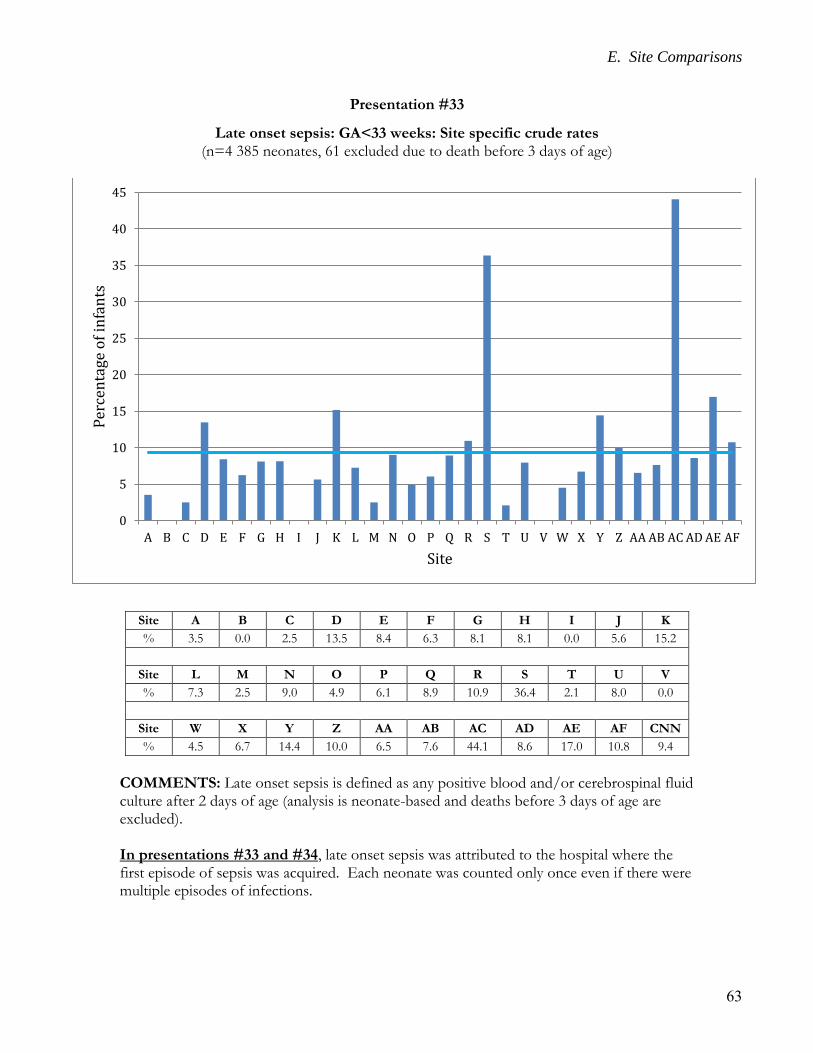
E. Site Comparisons
63
Presentation #33
Late onset sepsis: GA<33 weeks: Site specific crude rates (n=4 385 neonates, 61 excluded due to death before 3 days of age)
COMMENTS: Late onset sepsis is defined as any positive blood and/or cerebrospinal fluid culture after 2 days of age (analysis is neonate-based and deaths before 3 days of age are excluded). In presentations #33 and #34, late onset sepsis was attributed to the hospital where the first episode of sepsis was acquired. Each neonate was counted only once even if there were multiple episodes of infections.
0
5
10
15
20
25
30
35
40
45
A B C D E F G H I J K L M N O P Q R S T U V W X Y Z AA AB AC AD AE AF
Per
cen
tage
of
infa
nts
Site
Site A B C D E F G H I J K
% 3.5 0.0 2.5 13.5 8.4 6.3 8.1 8.1 0.0 5.6 15.2
Site L M N O P Q R S T U V
% 7.3 2.5 9.0 4.9 6.1 8.9 10.9 36.4 2.1 8.0 0.0
Site W X Y Z AA AB AC AD AE AF CNN
% 4.5 6.7 14.4 10.0 6.5 7.6 44.1 8.6 17.0 10.8 9.4
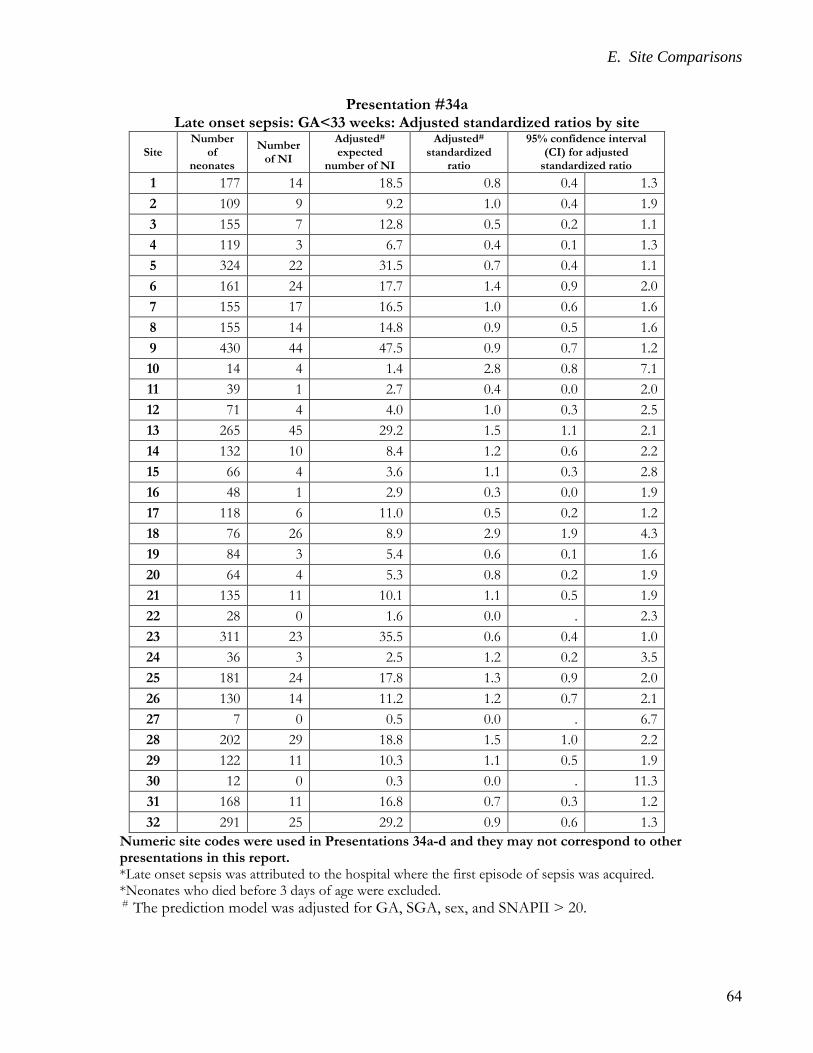
E. Site Comparisons
64
Presentation #34a Late onset sepsis: GA<33 weeks: Adjusted standardized ratios by site
Site Number
of neonates
Number of NI
Adjusted# expected
number of NI
Adjusted# standardized
ratio
95% confidence interval (CI) for adjusted
standardized ratio
1 177 14 18.5 0.8 0.4 1.3
2 109 9 9.2 1.0 0.4 1.9
3 155 7 12.8 0.5 0.2 1.1
4 119 3 6.7 0.4 0.1 1.3
5 324 22 31.5 0.7 0.4 1.1
6 161 24 17.7 1.4 0.9 2.0
7 155 17 16.5 1.0 0.6 1.6
8 155 14 14.8 0.9 0.5 1.6
9 430 44 47.5 0.9 0.7 1.2
10 14 4 1.4 2.8 0.8 7.1
11 39 1 2.7 0.4 0.0 2.0
12 71 4 4.0 1.0 0.3 2.5
13 265 45 29.2 1.5 1.1 2.1
14 132 10 8.4 1.2 0.6 2.2
15 66 4 3.6 1.1 0.3 2.8
16 48 1 2.9 0.3 0.0 1.9
17 118 6 11.0 0.5 0.2 1.2
18 76 26 8.9 2.9 1.9 4.3
19 84 3 5.4 0.6 0.1 1.6
20 64 4 5.3 0.8 0.2 1.9
21 135 11 10.1 1.1 0.5 1.9
22 28 0 1.6 0.0 . 2.3
23 311 23 35.5 0.6 0.4 1.0
24 36 3 2.5 1.2 0.2 3.5
25 181 24 17.8 1.3 0.9 2.0
26 130 14 11.2 1.2 0.7 2.1
27 7 0 0.5 0.0 . 6.7
28 202 29 18.8 1.5 1.0 2.2
29 122 11 10.3 1.1 0.5 1.9
30 12 0 0.3 0.0 . 11.3
31 168 11 16.8 0.7 0.3 1.2
32 291 25 29.2 0.9 0.6 1.3
Numeric site codes were used in Presentations 34a-d and they may not correspond to other presentations in this report. *Late onset sepsis was attributed to the hospital where the first episode of sepsis was acquired. *Neonates who died before 3 days of age were excluded. # The prediction model was adjusted for GA, SGA, sex, and SNAPII > 20.
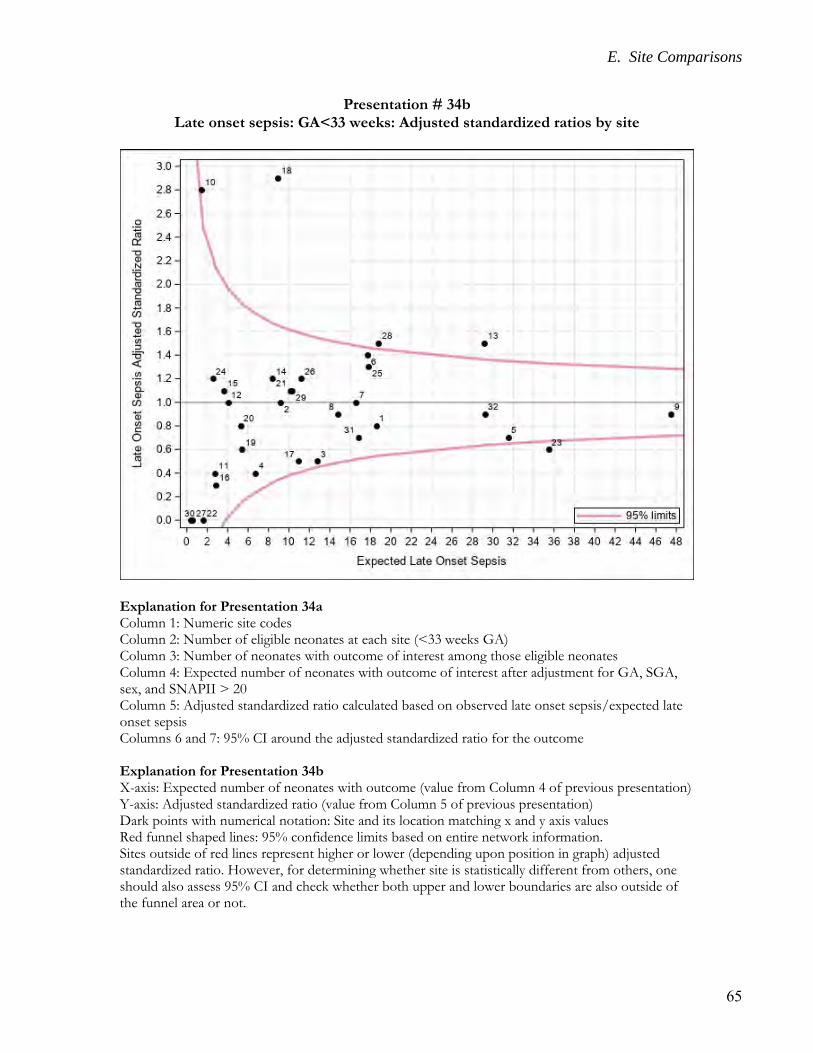
E. Site Comparisons
65
Presentation # 34b Late onset sepsis: GA<33 weeks: Adjusted standardized ratios by site
Explanation for Presentation 34a Column 1: Numeric site codes Column 2: Number of eligible neonates at each site (<33 weeks GA) Column 3: Number of neonates with outcome of interest among those eligible neonates Column 4: Expected number of neonates with outcome of interest after adjustment for GA, SGA, sex, and SNAPII > 20 Column 5: Adjusted standardized ratio calculated based on observed late onset sepsis/expected late onset sepsis Columns 6 and 7: 95% CI around the adjusted standardized ratio for the outcome Explanation for Presentation 34b X-axis: Expected number of neonates with outcome (value from Column 4 of previous presentation) Y-axis: Adjusted standardized ratio (value from Column 5 of previous presentation) Dark points with numerical notation: Site and its location matching x and y axis values Red funnel shaped lines: 95% confidence limits based on entire network information. Sites outside of red lines represent higher or lower (depending upon position in graph) adjusted standardized ratio. However, for determining whether site is statistically different from others, one should also assess 95% CI and check whether both upper and lower boundaries are also outside of the funnel area or not.
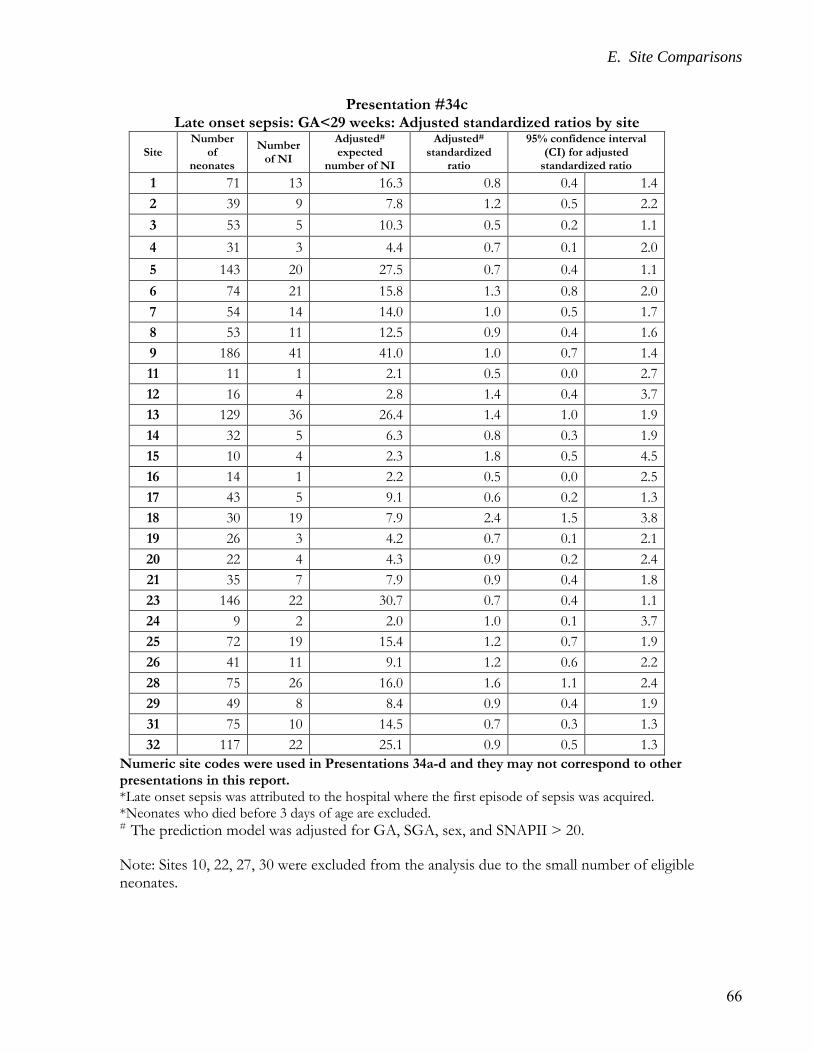
E. Site Comparisons
66
Presentation #34c Late onset sepsis: GA<29 weeks: Adjusted standardized ratios by site
Site Number
of neonates
Number of NI
Adjusted# expected
number of NI
Adjusted# standardized
ratio
95% confidence interval (CI) for adjusted
standardized ratio
1 71 13 16.3 0.8 0.4 1.4
2 39 9 7.8 1.2 0.5 2.2
3 53 5 10.3 0.5 0.2 1.1
4 31 3 4.4 0.7 0.1 2.0
5 143 20 27.5 0.7 0.4 1.1
6 74 21 15.8 1.3 0.8 2.0
7 54 14 14.0 1.0 0.5 1.7
8 53 11 12.5 0.9 0.4 1.6
9 186 41 41.0 1.0 0.7 1.4
11 11 1 2.1 0.5 0.0 2.7
12 16 4 2.8 1.4 0.4 3.7
13 129 36 26.4 1.4 1.0 1.9
14 32 5 6.3 0.8 0.3 1.9
15 10 4 2.3 1.8 0.5 4.5
16 14 1 2.2 0.5 0.0 2.5
17 43 5 9.1 0.6 0.2 1.3
18 30 19 7.9 2.4 1.5 3.8
19 26 3 4.2 0.7 0.1 2.1
20 22 4 4.3 0.9 0.2 2.4
21 35 7 7.9 0.9 0.4 1.8
23 146 22 30.7 0.7 0.4 1.1
24 9 2 2.0 1.0 0.1 3.7
25 72 19 15.4 1.2 0.7 1.9
26 41 11 9.1 1.2 0.6 2.2
28 75 26 16.0 1.6 1.1 2.4
29 49 8 8.4 0.9 0.4 1.9
31 75 10 14.5 0.7 0.3 1.3
32 117 22 25.1 0.9 0.5 1.3
Numeric site codes were used in Presentations 34a-d and they may not correspond to other presentations in this report. *Late onset sepsis was attributed to the hospital where the first episode of sepsis was acquired. *Neonates who died before 3 days of age are excluded. # The prediction model was adjusted for GA, SGA, sex, and SNAPII > 20.
Note: Sites 10, 22, 27, 30 were excluded from the analysis due to the small number of eligible neonates.
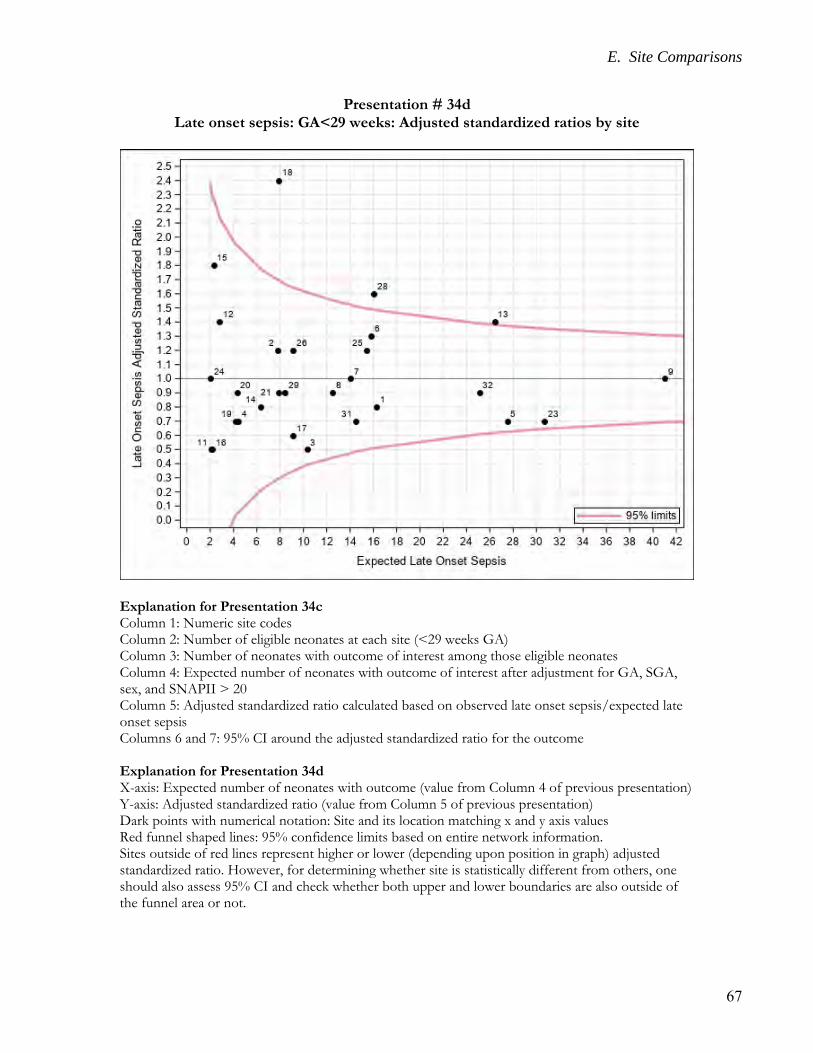
E. Site Comparisons
67
Presentation # 34d Late onset sepsis: GA<29 weeks: Adjusted standardized ratios by site
Explanation for Presentation 34c Column 1: Numeric site codes Column 2: Number of eligible neonates at each site (<29 weeks GA) Column 3: Number of neonates with outcome of interest among those eligible neonates Column 4: Expected number of neonates with outcome of interest after adjustment for GA, SGA, sex, and SNAPII > 20 Column 5: Adjusted standardized ratio calculated based on observed late onset sepsis/expected late onset sepsis Columns 6 and 7: 95% CI around the adjusted standardized ratio for the outcome Explanation for Presentation 34d X-axis: Expected number of neonates with outcome (value from Column 4 of previous presentation) Y-axis: Adjusted standardized ratio (value from Column 5 of previous presentation) Dark points with numerical notation: Site and its location matching x and y axis values Red funnel shaped lines: 95% confidence limits based on entire network information. Sites outside of red lines represent higher or lower (depending upon position in graph) adjusted standardized ratio. However, for determining whether site is statistically different from others, one should also assess 95% CI and check whether both upper and lower boundaries are also outside of the funnel area or not.
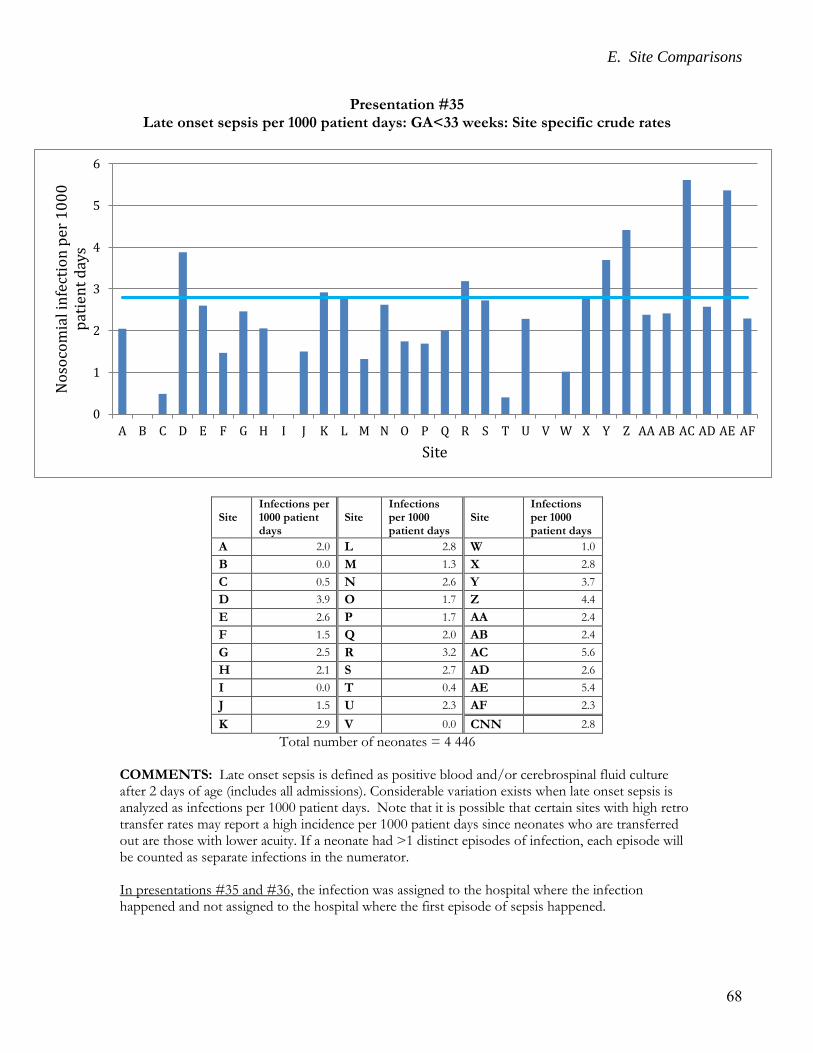
E. Site Comparisons
68
Presentation #35 Late onset sepsis per 1000 patient days: GA<33 weeks: Site specific crude rates
Site Infections per 1000 patient days
Site Infections per 1000 patient days
Site Infections per 1000 patient days
A 2.0 L 2.8 W 1.0
B 0.0 M 1.3 X 2.8
C 0.5 N 2.6 Y 3.7
D 3.9 O 1.7 Z 4.4
E 2.6 P 1.7 AA 2.4
F 1.5 Q 2.0 AB 2.4
G 2.5 R 3.2 AC 5.6
H 2.1 S 2.7 AD 2.6
I 0.0 T 0.4 AE 5.4
J 1.5 U 2.3 AF 2.3
K 2.9 V 0.0 CNN 2.8
Total number of neonates = 4 446
COMMENTS: Late onset sepsis is defined as positive blood and/or cerebrospinal fluid culture after 2 days of age (includes all admissions). Considerable variation exists when late onset sepsis is analyzed as infections per 1000 patient days. Note that it is possible that certain sites with high retro transfer rates may report a high incidence per 1000 patient days since neonates who are transferred out are those with lower acuity. If a neonate had >1 distinct episodes of infection, each episode will be counted as separate infections in the numerator. In presentations #35 and #36, the infection was assigned to the hospital where the infection happened and not assigned to the hospital where the first episode of sepsis happened.
0
1
2
3
4
5
6
A B C D E F G H I J K L M N O P Q R S T U V W X Y Z AA AB AC AD AE AF
No
soco
mia
l in
fect
ion
per
10
00
p
atie
nt
day
s
Site
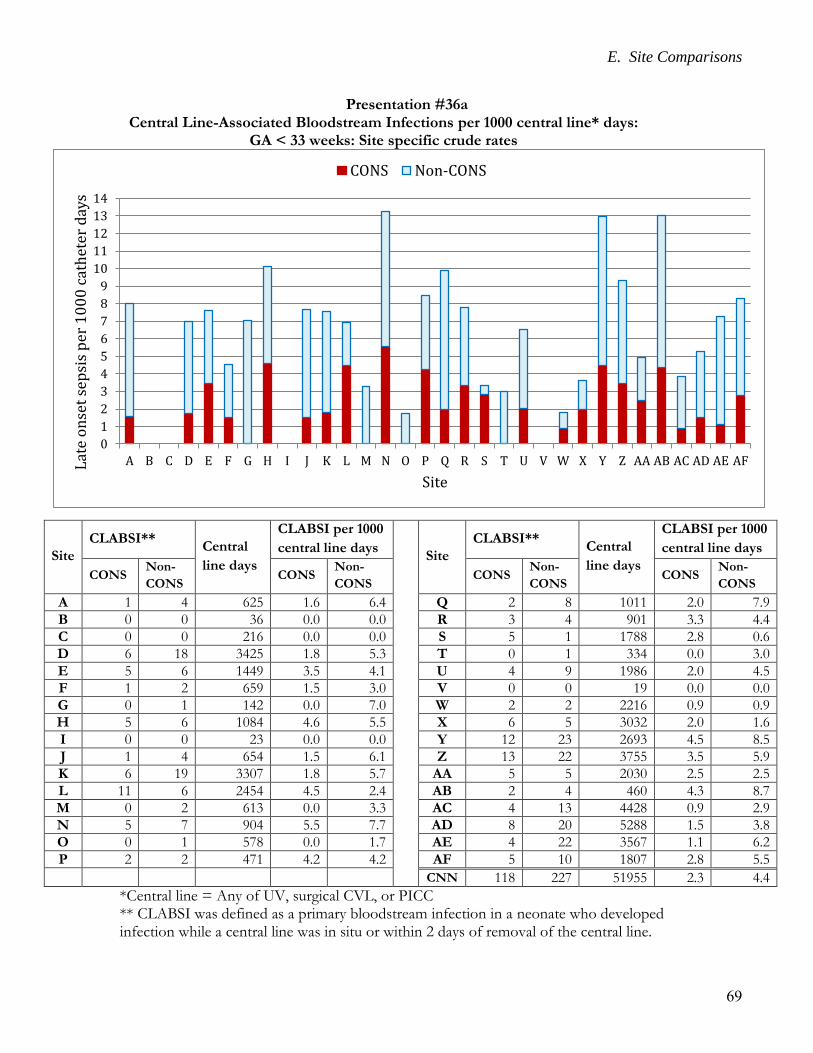
E. Site Comparisons
69
Presentation #36a Central Line-Associated Bloodstream Infections per 1000 central line* days:
GA < 33 weeks: Site specific crude rates
Site
CLABSI** Central
line days
CLABSI per 1000
central line days
Site
CLABSI** Central
line days
CLABSI per 1000
central line days
CONS Non-
CONS CONS
Non-
CONS
CONS
Non-
CONS CONS
Non-
CONS
A 1 4 625 1.6 6.4 Q 2 8 1011 2.0 7.9
B 0 0 36 0.0 0.0 R 3 4 901 3.3 4.4
C 0 0 216 0.0 0.0 S 5 1 1788 2.8 0.6
D 6 18 3425 1.8 5.3 T 0 1 334 0.0 3.0
E 5 6 1449 3.5 4.1 U 4 9 1986 2.0 4.5
F 1 2 659 1.5 3.0 V 0 0 19 0.0 0.0
G 0 1 142 0.0 7.0 W 2 2 2216 0.9 0.9
H 5 6 1084 4.6 5.5 X 6 5 3032 2.0 1.6
I 0 0 23 0.0 0.0 Y 12 23 2693 4.5 8.5
J 1 4 654 1.5 6.1 Z 13 22 3755 3.5 5.9
K 6 19 3307 1.8 5.7 AA 5 5 2030 2.5 2.5
L 11 6 2454 4.5 2.4 AB 2 4 460 4.3 8.7
M 0 2 613 0.0 3.3 AC 4 13 4428 0.9 2.9
N 5 7 904 5.5 7.7 AD 8 20 5288 1.5 3.8
O 0 1 578 0.0 1.7 AE 4 22 3567 1.1 6.2
P 2 2 471 4.2 4.2 AF 5 10 1807 2.8 5.5
CNN 118 227 51955 2.3 4.4
*Central line = Any of UV, surgical CVL, or PICC ** CLABSI was defined as a primary bloodstream infection in a neonate who developed infection while a central line was in situ or within 2 days of removal of the central line.
0
1
2
3
4
5
6
7
8
9
10
11
12
13
14
A B C D E F G H I J K L M N O P Q R S T U V W X Y Z AA AB AC AD AE AFLat
e o
nse
t se
psi
s p
er 1
00
0 c
ath
eter
day
s
Site
CONS Non-CONS
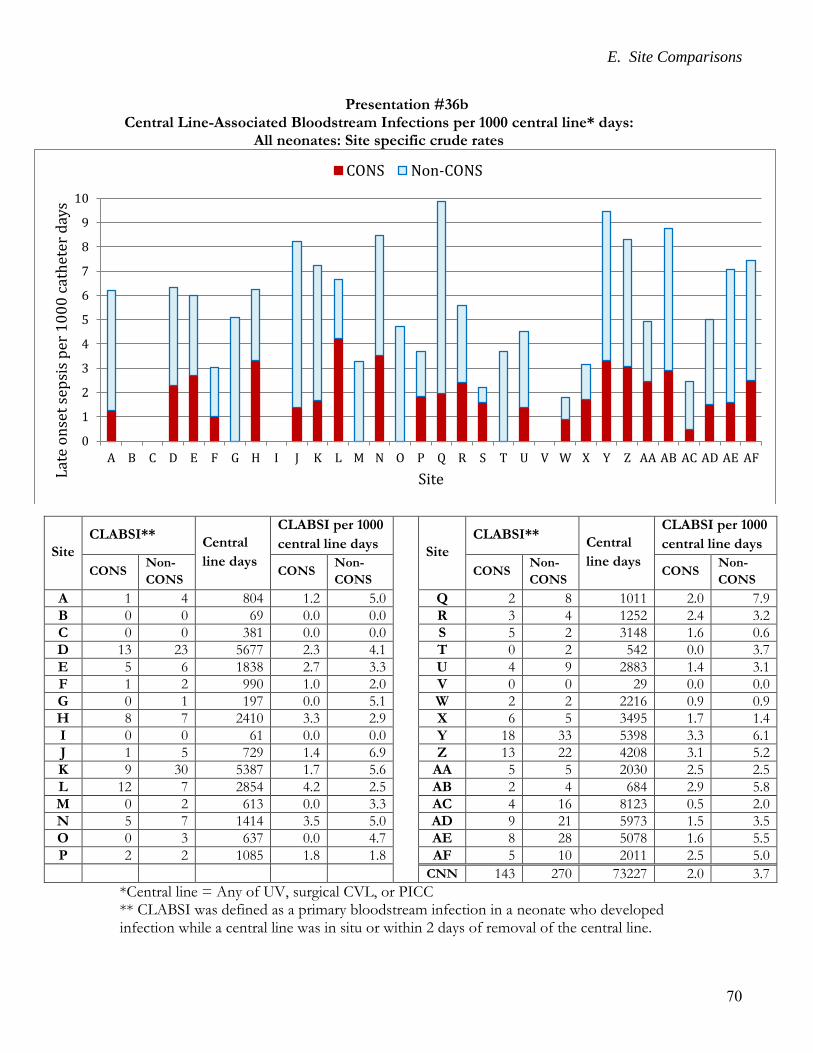
E. Site Comparisons
70
Presentation #36b Central Line-Associated Bloodstream Infections per 1000 central line* days:
All neonates: Site specific crude rates
Site
CLABSI** Central
line days
CLABSI per 1000
central line days
Site
CLABSI** Central
line days
CLABSI per 1000
central line days
CONS Non-
CONS CONS
Non-
CONS
CONS
Non-
CONS CONS
Non-
CONS
A 1 4 804 1.2 5.0 Q 2 8 1011 2.0 7.9
B 0 0 69 0.0 0.0 R 3 4 1252 2.4 3.2
C 0 0 381 0.0 0.0 S 5 2 3148 1.6 0.6
D 13 23 5677 2.3 4.1 T 0 2 542 0.0 3.7
E 5 6 1838 2.7 3.3 U 4 9 2883 1.4 3.1
F 1 2 990 1.0 2.0 V 0 0 29 0.0 0.0
G 0 1 197 0.0 5.1 W 2 2 2216 0.9 0.9
H 8 7 2410 3.3 2.9 X 6 5 3495 1.7 1.4
I 0 0 61 0.0 0.0 Y 18 33 5398 3.3 6.1
J 1 5 729 1.4 6.9 Z 13 22 4208 3.1 5.2
K 9 30 5387 1.7 5.6 AA 5 5 2030 2.5 2.5
L 12 7 2854 4.2 2.5 AB 2 4 684 2.9 5.8
M 0 2 613 0.0 3.3 AC 4 16 8123 0.5 2.0
N 5 7 1414 3.5 5.0 AD 9 21 5973 1.5 3.5
O 0 3 637 0.0 4.7 AE 8 28 5078 1.6 5.5
P 2 2 1085 1.8 1.8 AF 5 10 2011 2.5 5.0
CNN 143 270 73227 2.0 3.7
*Central line = Any of UV, surgical CVL, or PICC ** CLABSI was defined as a primary bloodstream infection in a neonate who developed infection while a central line was in situ or within 2 days of removal of the central line.
0
1
2
3
4
5
6
7
8
9
10
A B C D E F G H I J K L M N O P Q R S T U V W X Y Z AA AB AC AD AE AF
Lat
e o
nse
t se
psi
s p
er 1
00
0 c
ath
eter
day
s
Site
CONS Non-CONS
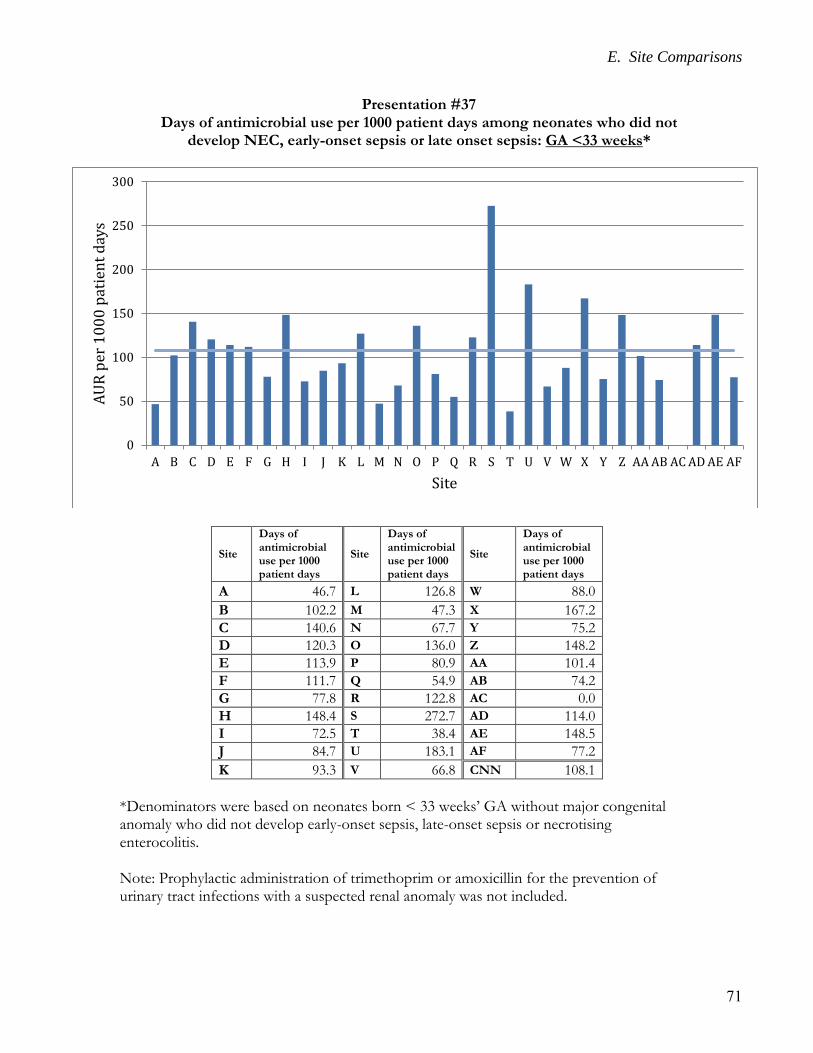
E. Site Comparisons
71
Presentation #37 Days of antimicrobial use per 1000 patient days among neonates who did not
develop NEC, early-onset sepsis or late onset sepsis: GA <33 weeks*
Site
Days of antimicrobial use per 1000 patient days
Site
Days of antimicrobial use per 1000 patient days
Site
Days of antimicrobial use per 1000 patient days
A 46.7 L 126.8 W 88.0
B 102.2 M 47.3 X 167.2
C 140.6 N 67.7 Y 75.2
D 120.3 O 136.0 Z 148.2
E 113.9 P 80.9 AA 101.4
F 111.7 Q 54.9 AB 74.2
G 77.8 R 122.8 AC 0.0
H 148.4 S 272.7 AD 114.0
I 72.5 T 38.4 AE 148.5
J 84.7 U 183.1 AF 77.2
K 93.3 V 66.8 CNN 108.1
*Denominators were based on neonates born < 33 weeks’ GA without major congenital anomaly who did not develop early-onset sepsis, late-onset sepsis or necrotising enterocolitis. Note: Prophylactic administration of trimethoprim or amoxicillin for the prevention of urinary tract infections with a suspected renal anomaly was not included.
0
50
100
150
200
250
300
A B C D E F G H I J K L M N O P Q R S T U V W X Y Z AA AB AC AD AE AF
AU
R p
er 1
00
0 p
atie
nt
day
s
Site
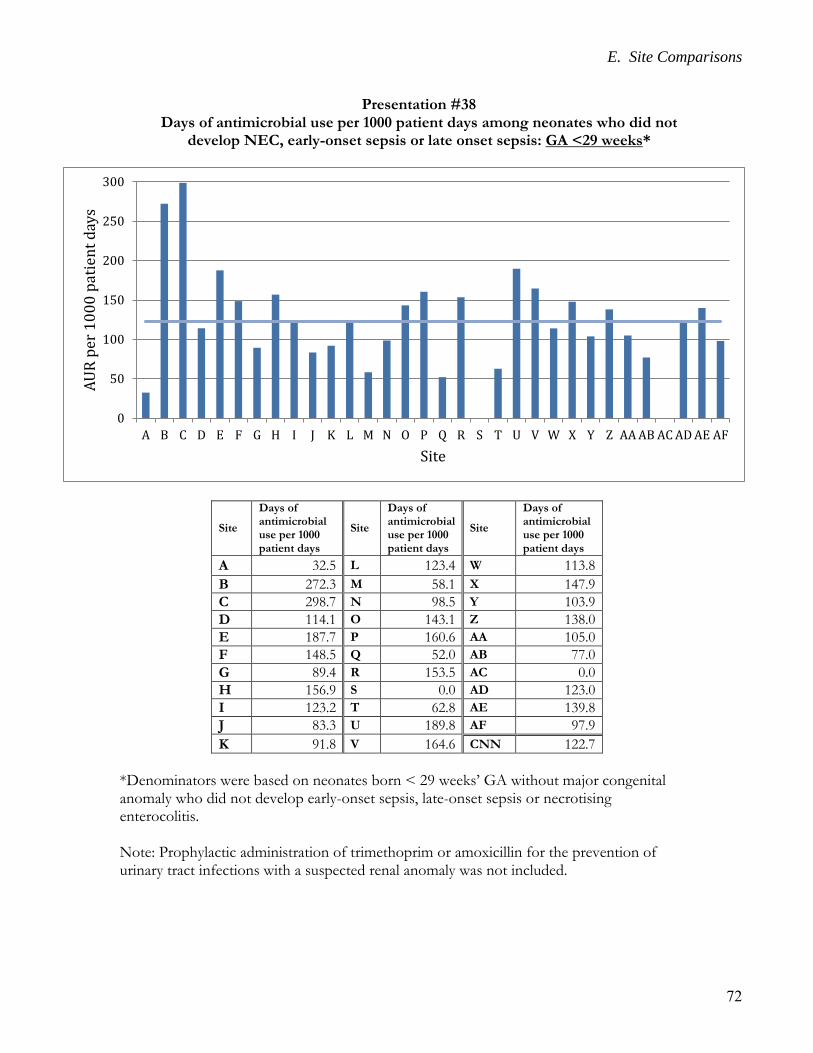
E. Site Comparisons
72
Presentation #38 Days of antimicrobial use per 1000 patient days among neonates who did not
develop NEC, early-onset sepsis or late onset sepsis: GA <29 weeks*
Site
Days of antimicrobial use per 1000 patient days
Site
Days of antimicrobial use per 1000 patient days
Site
Days of antimicrobial use per 1000 patient days
A 32.5 L 123.4 W 113.8
B 272.3 M 58.1 X 147.9
C 298.7 N 98.5 Y 103.9
D 114.1 O 143.1 Z 138.0
E 187.7 P 160.6 AA 105.0
F 148.5 Q 52.0 AB 77.0
G 89.4 R 153.5 AC 0.0
H 156.9 S 0.0 AD 123.0
I 123.2 T 62.8 AE 139.8
J 83.3 U 189.8 AF 97.9
K 91.8 V 164.6 CNN 122.7
*Denominators were based on neonates born < 29 weeks’ GA without major congenital anomaly who did not develop early-onset sepsis, late-onset sepsis or necrotising enterocolitis. Note: Prophylactic administration of trimethoprim or amoxicillin for the prevention of urinary tract infections with a suspected renal anomaly was not included.
0
50
100
150
200
250
300
A B C D E F G H I J K L M N O P Q R S T U V W X Y Z AA AB AC AD AE AF
AU
R p
er 1
00
0 p
atie
nt
day
s
Site
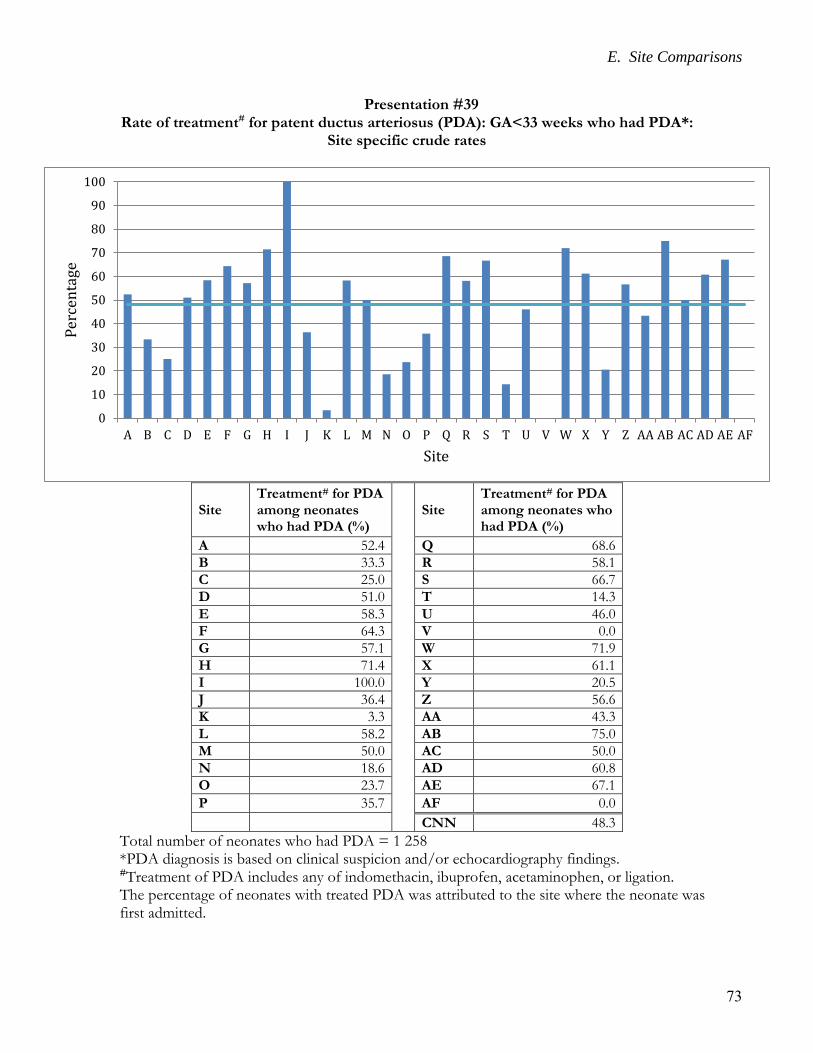
E. Site Comparisons
73
Presentation #39
Rate of treatment# for patent ductus arteriosus (PDA): GA<33 weeks who had PDA*: Site specific crude rates
Site Treatment# for PDA among neonates who had PDA (%)
Site Treatment# for PDA among neonates who had PDA (%)
A 52.4 Q 68.6
B 33.3 R 58.1
C 25.0 S 66.7
D 51.0 T 14.3
E 58.3 U 46.0
F 64.3 V 0.0
G 57.1 W 71.9
H 71.4 X 61.1
I 100.0 Y 20.5
J 36.4 Z 56.6
K 3.3 AA 43.3
L 58.2 AB 75.0
M 50.0 AC 50.0
N 18.6 AD 60.8
O 23.7 AE 67.1
P 35.7 AF 0.0
CNN 48.3
Total number of neonates who had PDA = 1 258 *PDA diagnosis is based on clinical suspicion and/or echocardiography findings. #Treatment of PDA includes any of indomethacin, ibuprofen, acetaminophen, or ligation. The percentage of neonates with treated PDA was attributed to the site where the neonate was first admitted.
0
10
20
30
40
50
60
70
80
90
100
A B C D E F G H I J K L M N O P Q R S T U V W X Y Z AA AB AC AD AE AF
Per
cen
tage
Site
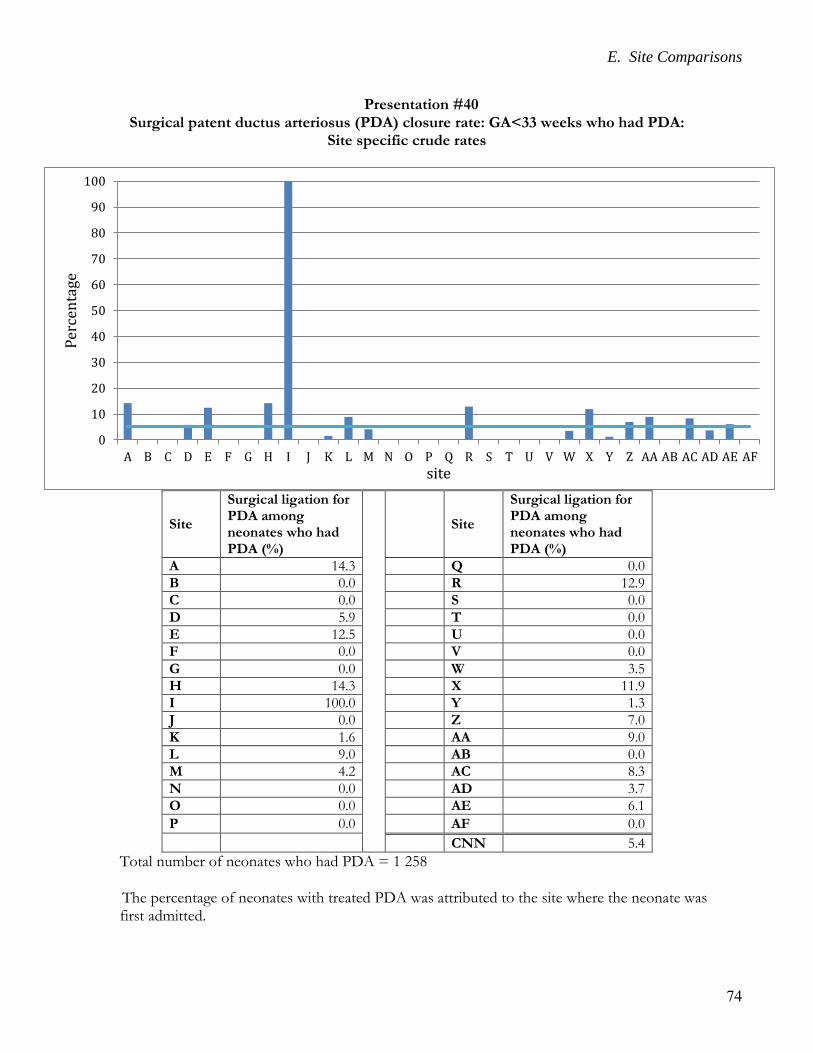
E. Site Comparisons
74
Presentation #40
Surgical patent ductus arteriosus (PDA) closure rate: GA<33 weeks who had PDA: Site specific crude rates
Site
Surgical ligation for PDA among neonates who had PDA (%)
Site
Surgical ligation for PDA among neonates who had PDA (%)
A 14.3 Q 0.0
B 0.0 R 12.9
C 0.0 S 0.0
D 5.9 T 0.0
E 12.5 U 0.0
F 0.0 V 0.0
G 0.0 W 3.5
H 14.3 X 11.9
I 100.0 Y 1.3
J 0.0 Z 7.0
K 1.6 AA 9.0
L 9.0 AB 0.0
M 4.2 AC 8.3
N 0.0 AD 3.7
O 0.0 AE 6.1
P 0.0 AF 0.0
CNN 5.4
Total number of neonates who had PDA = 1 258
The percentage of neonates with treated PDA was attributed to the site where the neonate was first admitted.
0
10
20
30
40
50
60
70
80
90
100
A B C D E F G H I J K L M N O P Q R S T U V W X Y Z AA AB AC AD AE AF
Per
cen
tage
site
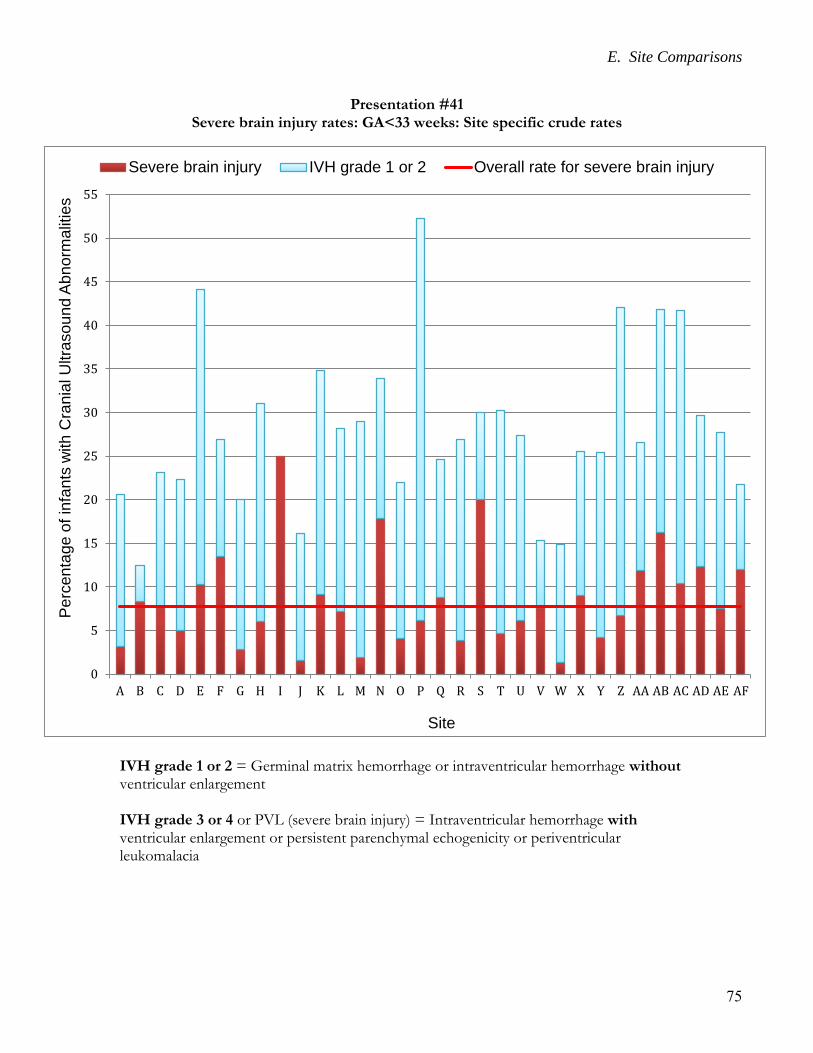
E. Site Comparisons
75
Presentation #41 Severe brain injury rates: GA<33 weeks: Site specific crude rates
IVH grade 1 or 2 = Germinal matrix hemorrhage or intraventricular hemorrhage without ventricular enlargement IVH grade 3 or 4 or PVL (severe brain injury) = Intraventricular hemorrhage with ventricular enlargement or persistent parenchymal echogenicity or periventricular leukomalacia
0
5
10
15
20
25
30
35
40
45
50
55
A B C D E F G H I J K L M N O P Q R S T U V W X Y Z AA AB AC AD AE AF
Pe
rcen
tage
of
infa
nts
with
Cra
nia
l U
ltra
so
un
d A
bn
orm
alit
ies
Site
Severe brain injury IVH grade 1 or 2 Overall rate for severe brain injury
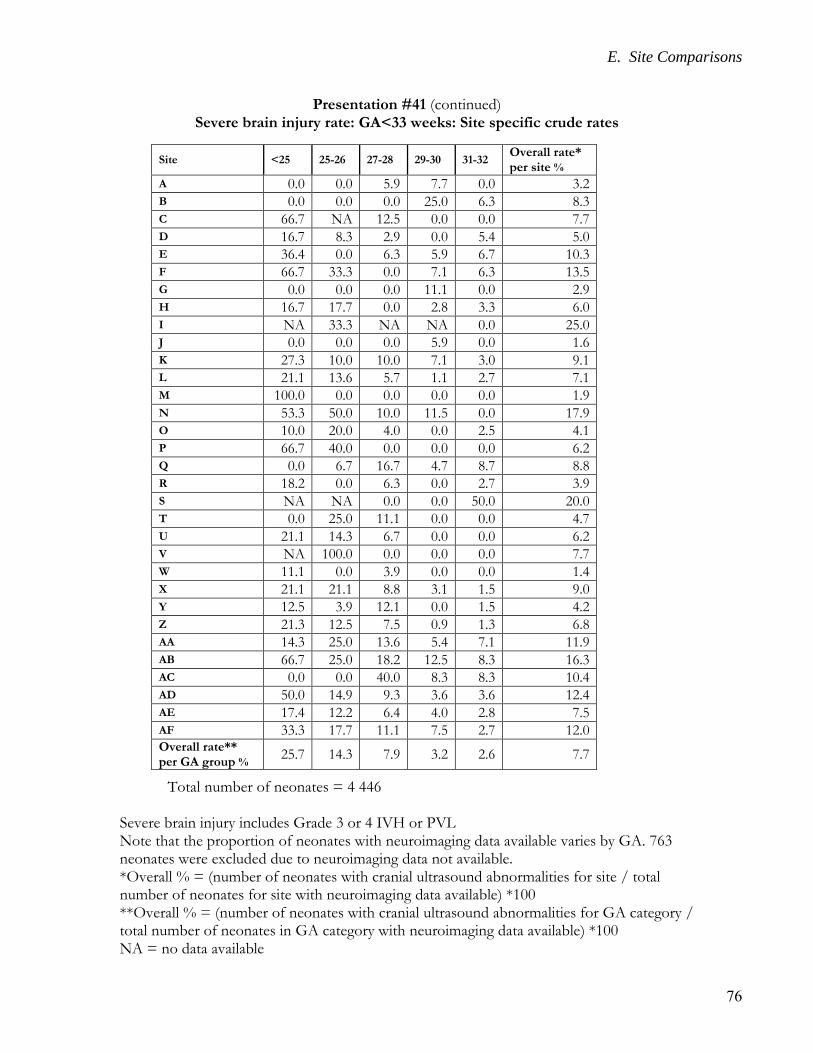
E. Site Comparisons
76
Presentation #41 (continued) Severe brain injury rate: GA<33 weeks: Site specific crude rates
Total number of neonates = 4 446
Severe brain injury includes Grade 3 or 4 IVH or PVL Note that the proportion of neonates with neuroimaging data available varies by GA. 763 neonates were excluded due to neuroimaging data not available. *Overall % = (number of neonates with cranial ultrasound abnormalities for site / total number of neonates for site with neuroimaging data available) *100 **Overall % = (number of neonates with cranial ultrasound abnormalities for GA category / total number of neonates in GA category with neuroimaging data available) *100 NA = no data available
Site <25 25-26 27-28 29-30 31-32 Overall rate* per site %
A 0.0 0.0 5.9 7.7 0.0 3.2 B 0.0 0.0 0.0 25.0 6.3 8.3 C 66.7 NA 12.5 0.0 0.0 7.7 D 16.7 8.3 2.9 0.0 5.4 5.0 E 36.4 0.0 6.3 5.9 6.7 10.3 F 66.7 33.3 0.0 7.1 6.3 13.5 G 0.0 0.0 0.0 11.1 0.0 2.9 H 16.7 17.7 0.0 2.8 3.3 6.0 I NA 33.3 NA NA 0.0 25.0 J 0.0 0.0 0.0 5.9 0.0 1.6 K 27.3 10.0 10.0 7.1 3.0 9.1 L 21.1 13.6 5.7 1.1 2.7 7.1 M 100.0 0.0 0.0 0.0 0.0 1.9 N 53.3 50.0 10.0 11.5 0.0 17.9 O 10.0 20.0 4.0 0.0 2.5 4.1 P 66.7 40.0 0.0 0.0 0.0 6.2 Q 0.0 6.7 16.7 4.7 8.7 8.8 R 18.2 0.0 6.3 0.0 2.7 3.9 S NA NA 0.0 0.0 50.0 20.0 T 0.0 25.0 11.1 0.0 0.0 4.7 U 21.1 14.3 6.7 0.0 0.0 6.2 V NA 100.0 0.0 0.0 0.0 7.7 W 11.1 0.0 3.9 0.0 0.0 1.4 X 21.1 21.1 8.8 3.1 1.5 9.0 Y 12.5 3.9 12.1 0.0 1.5 4.2 Z 21.3 12.5 7.5 0.9 1.3 6.8 AA 14.3 25.0 13.6 5.4 7.1 11.9 AB 66.7 25.0 18.2 12.5 8.3 16.3 AC 0.0 0.0 40.0 8.3 8.3 10.4 AD 50.0 14.9 9.3 3.6 3.6 12.4 AE 17.4 12.2 6.4 4.0 2.8 7.5 AF 33.3 17.7 11.1 7.5 2.7 12.0 Overall rate** per GA group %
25.7 14.3 7.9 3.2 2.6 7.7
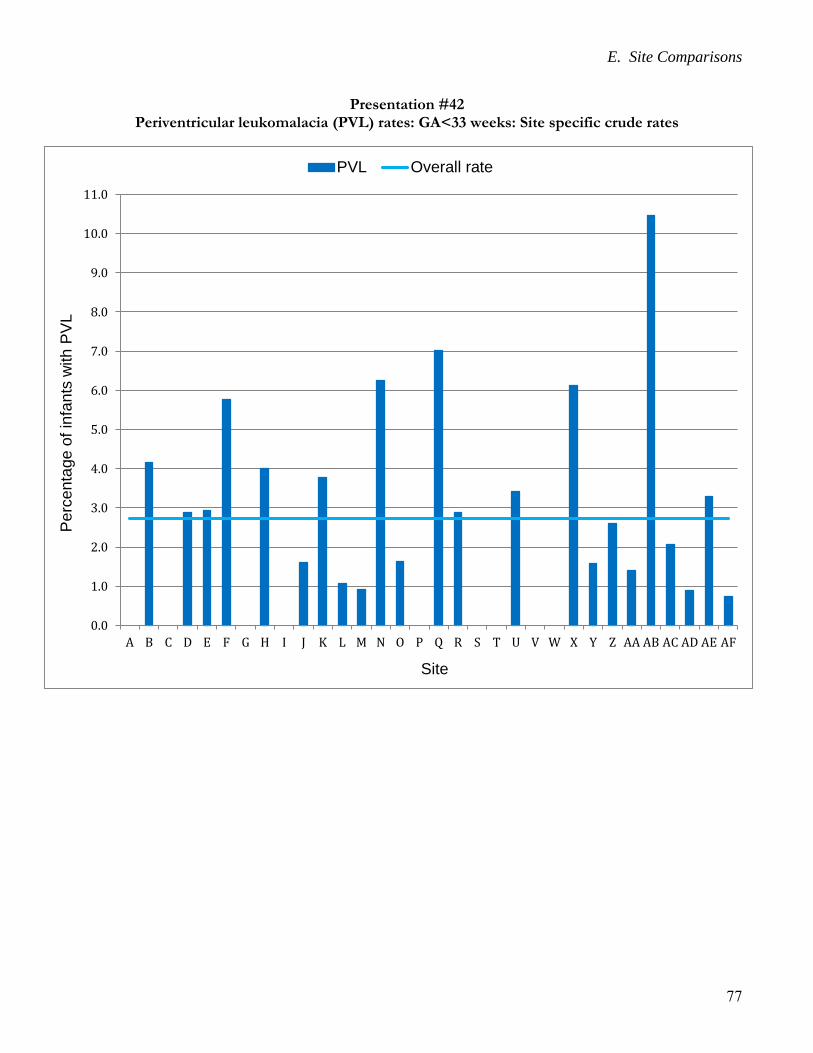
E. Site Comparisons
77
Presentation #42 Periventricular leukomalacia (PVL) rates: GA<33 weeks: Site specific crude rates
0.0
1.0
2.0
3.0
4.0
5.0
6.0
7.0
8.0
9.0
10.0
11.0
A B C D E F G H I J K L M N O P Q R S T U V W X Y Z AA AB AC AD AE AF
Pe
rcen
tage
of
infa
nts
with
PV
L
Site
PVL Overall rate
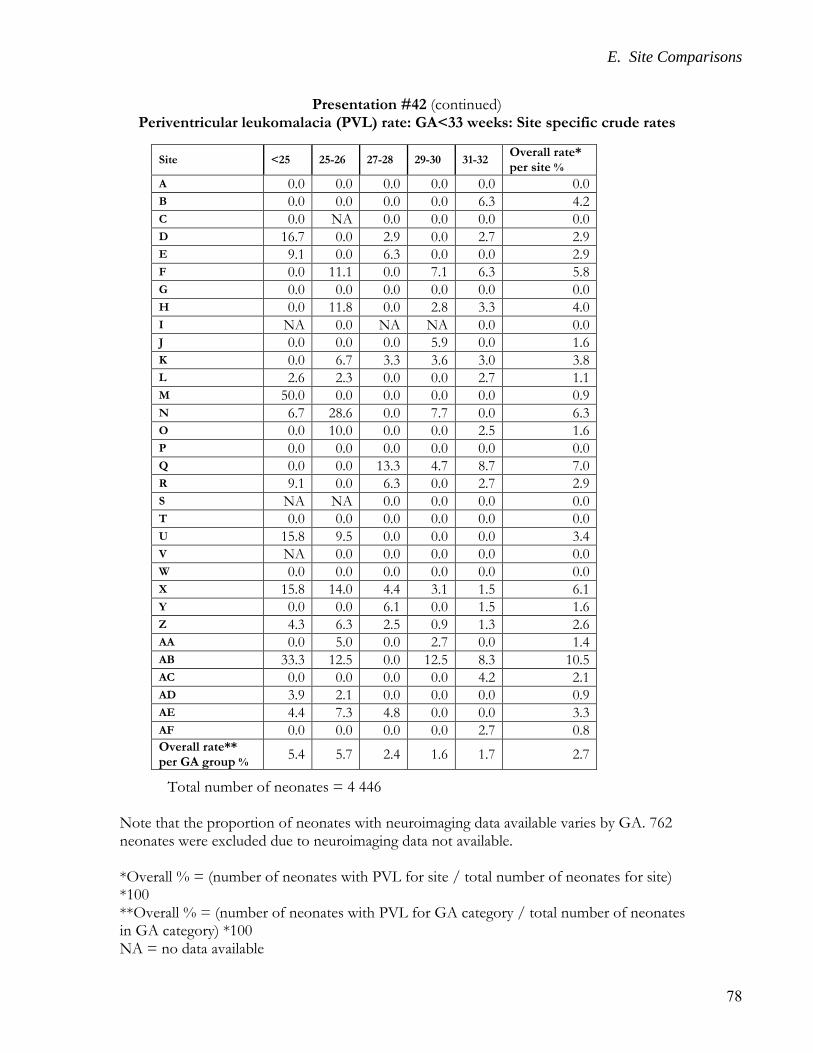
E. Site Comparisons
78
Presentation #42 (continued) Periventricular leukomalacia (PVL) rate: GA<33 weeks: Site specific crude rates
Total number of neonates = 4 446
Note that the proportion of neonates with neuroimaging data available varies by GA. 762 neonates were excluded due to neuroimaging data not available. *Overall % = (number of neonates with PVL for site / total number of neonates for site) *100 **Overall % = (number of neonates with PVL for GA category / total number of neonates in GA category) *100 NA = no data available
Site <25 25-26 27-28 29-30 31-32 Overall rate* per site %
A 0.0 0.0 0.0 0.0 0.0 0.0 B 0.0 0.0 0.0 0.0 6.3 4.2 C 0.0 NA 0.0 0.0 0.0 0.0 D 16.7 0.0 2.9 0.0 2.7 2.9 E 9.1 0.0 6.3 0.0 0.0 2.9 F 0.0 11.1 0.0 7.1 6.3 5.8 G 0.0 0.0 0.0 0.0 0.0 0.0 H 0.0 11.8 0.0 2.8 3.3 4.0 I NA 0.0 NA NA 0.0 0.0 J 0.0 0.0 0.0 5.9 0.0 1.6 K 0.0 6.7 3.3 3.6 3.0 3.8 L 2.6 2.3 0.0 0.0 2.7 1.1 M 50.0 0.0 0.0 0.0 0.0 0.9 N 6.7 28.6 0.0 7.7 0.0 6.3 O 0.0 10.0 0.0 0.0 2.5 1.6 P 0.0 0.0 0.0 0.0 0.0 0.0 Q 0.0 0.0 13.3 4.7 8.7 7.0 R 9.1 0.0 6.3 0.0 2.7 2.9 S NA NA 0.0 0.0 0.0 0.0 T 0.0 0.0 0.0 0.0 0.0 0.0 U 15.8 9.5 0.0 0.0 0.0 3.4 V NA 0.0 0.0 0.0 0.0 0.0 W 0.0 0.0 0.0 0.0 0.0 0.0 X 15.8 14.0 4.4 3.1 1.5 6.1 Y 0.0 0.0 6.1 0.0 1.5 1.6 Z 4.3 6.3 2.5 0.9 1.3 2.6 AA 0.0 5.0 0.0 2.7 0.0 1.4 AB 33.3 12.5 0.0 12.5 8.3 10.5 AC 0.0 0.0 0.0 0.0 4.2 2.1 AD 3.9 2.1 0.0 0.0 0.0 0.9 AE 4.4 7.3 4.8 0.0 0.0 3.3 AF 0.0 0.0 0.0 0.0 2.7 0.8 Overall rate** per GA group %
5.4 5.7 2.4 1.6 1.7 2.7
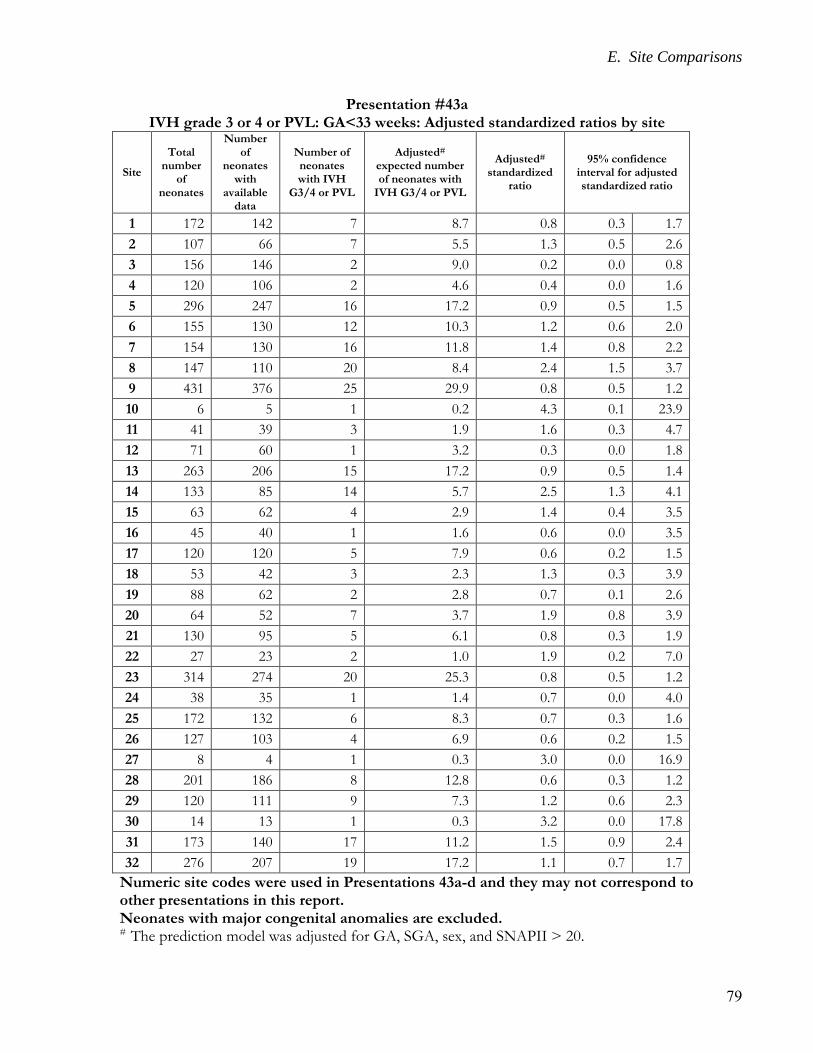
E. Site Comparisons
79
Presentation #43a IVH grade 3 or 4 or PVL: GA<33 weeks: Adjusted standardized ratios by site
Site
Total number
of neonates
Number of
neonates with
available data
Number of neonates with IVH
G3/4 or PVL
Adjusted# expected number of neonates with
IVH G3/4 or PVL
Adjusted# standardized
ratio
95% confidence interval for adjusted standardized ratio
1 172 142 7 8.7 0.8 0.3 1.7
2 107 66 7 5.5 1.3 0.5 2.6
3 156 146 2 9.0 0.2 0.0 0.8
4 120 106 2 4.6 0.4 0.0 1.6
5 296 247 16 17.2 0.9 0.5 1.5
6 155 130 12 10.3 1.2 0.6 2.0
7 154 130 16 11.8 1.4 0.8 2.2
8 147 110 20 8.4 2.4 1.5 3.7
9 431 376 25 29.9 0.8 0.5 1.2
10 6 5 1 0.2 4.3 0.1 23.9
11 41 39 3 1.9 1.6 0.3 4.7
12 71 60 1 3.2 0.3 0.0 1.8
13 263 206 15 17.2 0.9 0.5 1.4
14 133 85 14 5.7 2.5 1.3 4.1
15 63 62 4 2.9 1.4 0.4 3.5
16 45 40 1 1.6 0.6 0.0 3.5
17 120 120 5 7.9 0.6 0.2 1.5
18 53 42 3 2.3 1.3 0.3 3.9
19 88 62 2 2.8 0.7 0.1 2.6
20 64 52 7 3.7 1.9 0.8 3.9
21 130 95 5 6.1 0.8 0.3 1.9
22 27 23 2 1.0 1.9 0.2 7.0
23 314 274 20 25.3 0.8 0.5 1.2
24 38 35 1 1.4 0.7 0.0 4.0
25 172 132 6 8.3 0.7 0.3 1.6
26 127 103 4 6.9 0.6 0.2 1.5
27 8 4 1 0.3 3.0 0.0 16.9
28 201 186 8 12.8 0.6 0.3 1.2
29 120 111 9 7.3 1.2 0.6 2.3
30 14 13 1 0.3 3.2 0.0 17.8
31 173 140 17 11.2 1.5 0.9 2.4
32 276 207 19 17.2 1.1 0.7 1.7
Numeric site codes were used in Presentations 43a-d and they may not correspond to other presentations in this report. Neonates with major congenital anomalies are excluded. # The prediction model was adjusted for GA, SGA, sex, and SNAPII > 20.
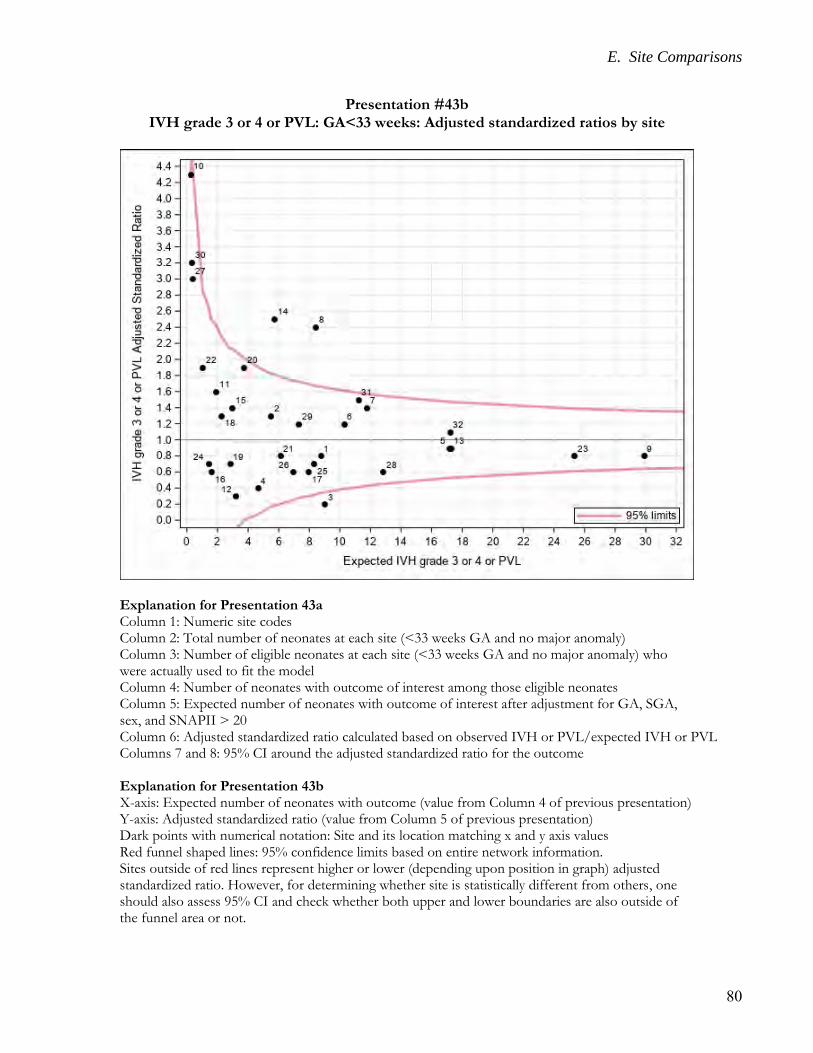
E. Site Comparisons
80
Presentation #43b IVH grade 3 or 4 or PVL: GA<33 weeks: Adjusted standardized ratios by site
Explanation for Presentation 43a Column 1: Numeric site codes Column 2: Total number of neonates at each site (<33 weeks GA and no major anomaly) Column 3: Number of eligible neonates at each site (<33 weeks GA and no major anomaly) who were actually used to fit the model Column 4: Number of neonates with outcome of interest among those eligible neonates Column 5: Expected number of neonates with outcome of interest after adjustment for GA, SGA, sex, and SNAPII > 20 Column 6: Adjusted standardized ratio calculated based on observed IVH or PVL/expected IVH or PVL Columns 7 and 8: 95% CI around the adjusted standardized ratio for the outcome Explanation for Presentation 43b X-axis: Expected number of neonates with outcome (value from Column 4 of previous presentation) Y-axis: Adjusted standardized ratio (value from Column 5 of previous presentation) Dark points with numerical notation: Site and its location matching x and y axis values Red funnel shaped lines: 95% confidence limits based on entire network information. Sites outside of red lines represent higher or lower (depending upon position in graph) adjusted standardized ratio. However, for determining whether site is statistically different from others, one should also assess 95% CI and check whether both upper and lower boundaries are also outside of the funnel area or not.
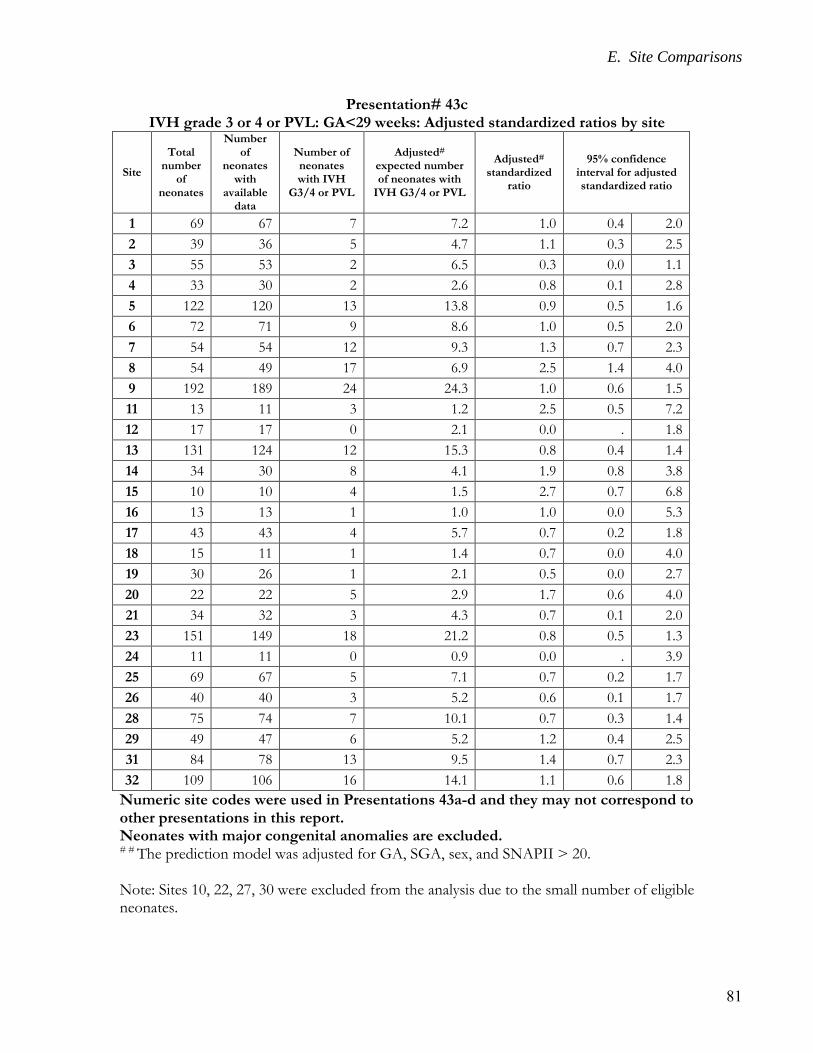
E. Site Comparisons
81
Presentation# 43c IVH grade 3 or 4 or PVL: GA<29 weeks: Adjusted standardized ratios by site
Site
Total number
of neonates
Number of
neonates with
available data
Number of neonates with IVH
G3/4 or PVL
Adjusted# expected number of neonates with
IVH G3/4 or PVL
Adjusted# standardized
ratio
95% confidence interval for adjusted standardized ratio
1 69 67 7 7.2 1.0 0.4 2.0
2 39 36 5 4.7 1.1 0.3 2.5
3 55 53 2 6.5 0.3 0.0 1.1
4 33 30 2 2.6 0.8 0.1 2.8
5 122 120 13 13.8 0.9 0.5 1.6
6 72 71 9 8.6 1.0 0.5 2.0
7 54 54 12 9.3 1.3 0.7 2.3
8 54 49 17 6.9 2.5 1.4 4.0
9 192 189 24 24.3 1.0 0.6 1.5
11 13 11 3 1.2 2.5 0.5 7.2
12 17 17 0 2.1 0.0 . 1.8
13 131 124 12 15.3 0.8 0.4 1.4
14 34 30 8 4.1 1.9 0.8 3.8
15 10 10 4 1.5 2.7 0.7 6.8
16 13 13 1 1.0 1.0 0.0 5.3
17 43 43 4 5.7 0.7 0.2 1.8
18 15 11 1 1.4 0.7 0.0 4.0
19 30 26 1 2.1 0.5 0.0 2.7
20 22 22 5 2.9 1.7 0.6 4.0
21 34 32 3 4.3 0.7 0.1 2.0
23 151 149 18 21.2 0.8 0.5 1.3
24 11 11 0 0.9 0.0 . 3.9
25 69 67 5 7.1 0.7 0.2 1.7
26 40 40 3 5.2 0.6 0.1 1.7
28 75 74 7 10.1 0.7 0.3 1.4
29 49 47 6 5.2 1.2 0.4 2.5
31 84 78 13 9.5 1.4 0.7 2.3
32 109 106 16 14.1 1.1 0.6 1.8
Numeric site codes were used in Presentations 43a-d and they may not correspond to other presentations in this report. Neonates with major congenital anomalies are excluded. # # The prediction model was adjusted for GA, SGA, sex, and SNAPII > 20. Note: Sites 10, 22, 27, 30 were excluded from the analysis due to the small number of eligible neonates.
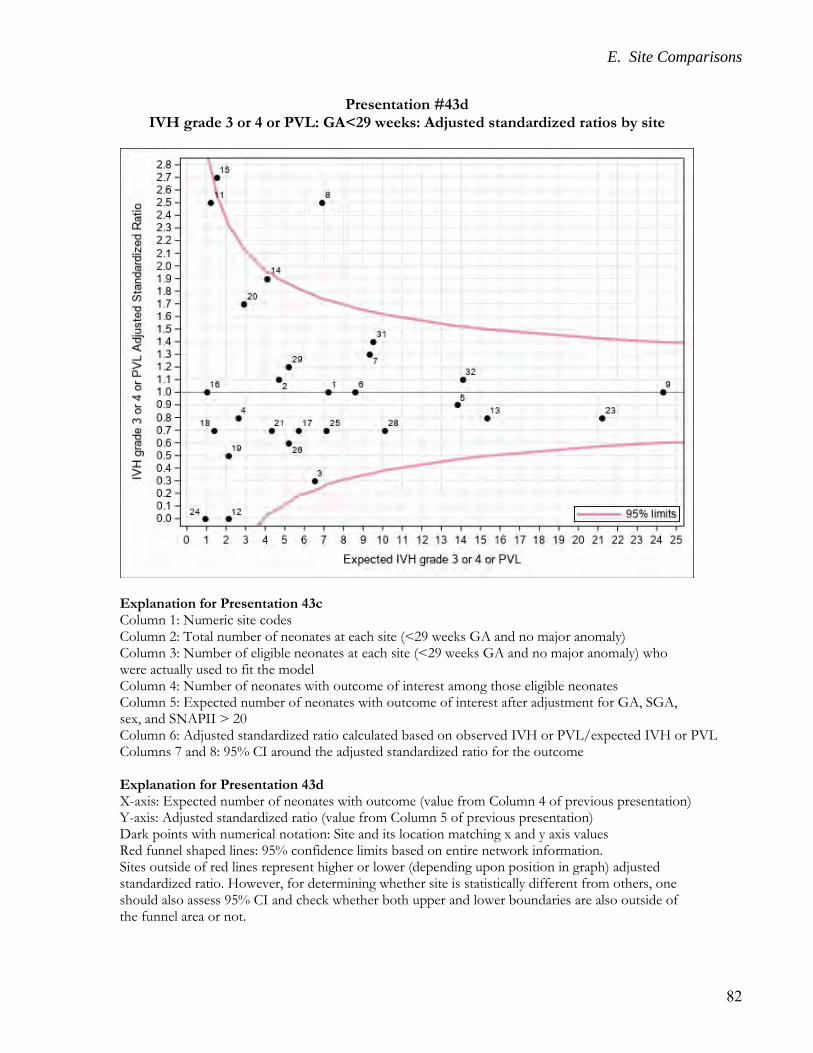
E. Site Comparisons
82
Presentation #43d IVH grade 3 or 4 or PVL: GA<29 weeks: Adjusted standardized ratios by site
Explanation for Presentation 43c Column 1: Numeric site codes Column 2: Total number of neonates at each site (<29 weeks GA and no major anomaly) Column 3: Number of eligible neonates at each site (<29 weeks GA and no major anomaly) who were actually used to fit the model Column 4: Number of neonates with outcome of interest among those eligible neonates Column 5: Expected number of neonates with outcome of interest after adjustment for GA, SGA, sex, and SNAPII > 20 Column 6: Adjusted standardized ratio calculated based on observed IVH or PVL/expected IVH or PVL Columns 7 and 8: 95% CI around the adjusted standardized ratio for the outcome Explanation for Presentation 43d X-axis: Expected number of neonates with outcome (value from Column 4 of previous presentation) Y-axis: Adjusted standardized ratio (value from Column 5 of previous presentation) Dark points with numerical notation: Site and its location matching x and y axis values Red funnel shaped lines: 95% confidence limits based on entire network information. Sites outside of red lines represent higher or lower (depending upon position in graph) adjusted standardized ratio. However, for determining whether site is statistically different from others, one should also assess 95% CI and check whether both upper and lower boundaries are also outside of the funnel area or not.
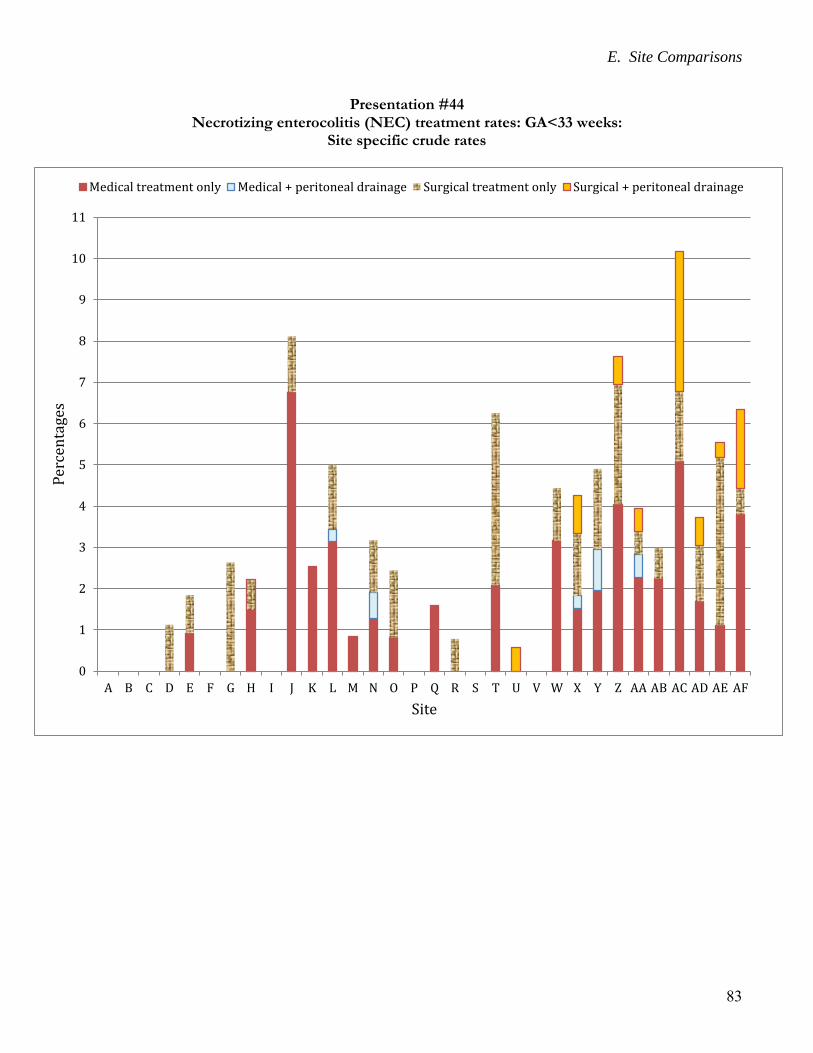
E. Site Comparisons
83
Presentation #44 Necrotizing enterocolitis (NEC) treatment rates: GA<33 weeks:
Site specific crude rates
0
1
2
3
4
5
6
7
8
9
10
11
A B C D E F G H I J K L M N O P Q R S T U V W X Y Z AA AB AC AD AE AF
Per
cen
tage
s
Site
Medical treatment only Medical + peritoneal drainage Surgical treatment only Surgical + peritoneal drainage
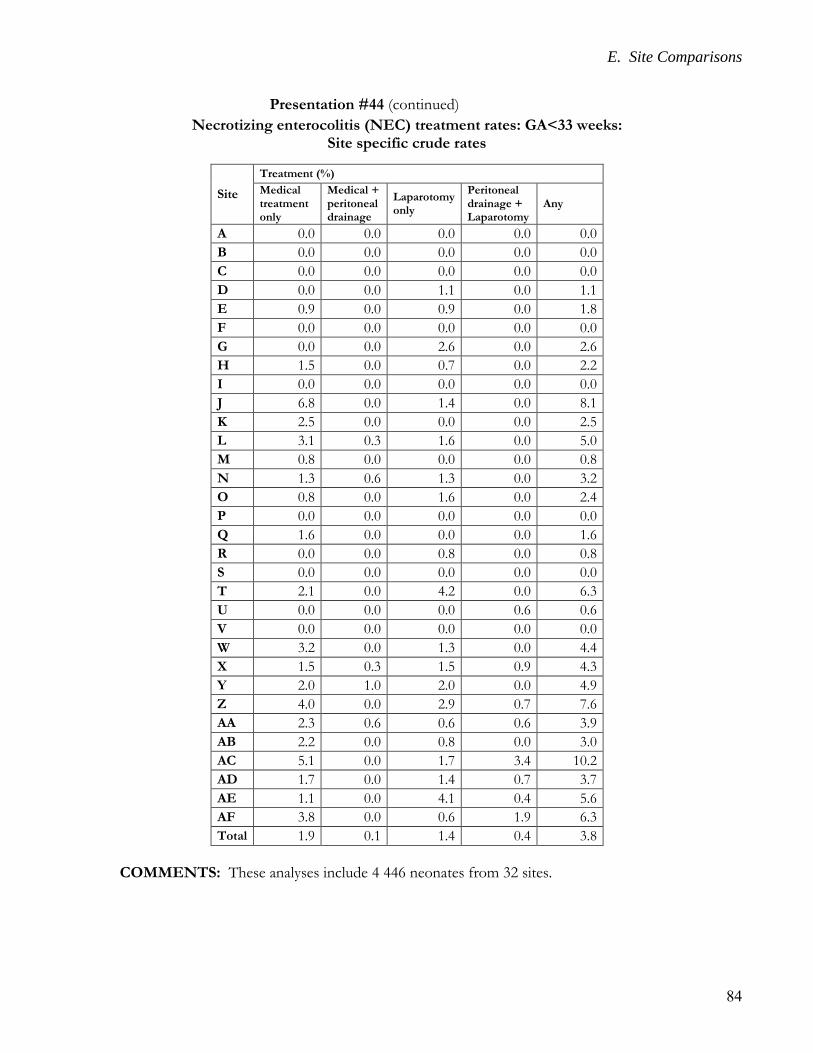
E. Site Comparisons
84
Presentation #44 (continued)
Necrotizing enterocolitis (NEC) treatment rates: GA<33 weeks: Site specific crude rates
Site
Treatment (%)
Medical treatment only
Medical + peritoneal drainage
Laparotomy only
Peritoneal drainage + Laparotomy
Any
A 0.0 0.0 0.0 0.0 0.0
B 0.0 0.0 0.0 0.0 0.0
C 0.0 0.0 0.0 0.0 0.0
D 0.0 0.0 1.1 0.0 1.1
E 0.9 0.0 0.9 0.0 1.8
F 0.0 0.0 0.0 0.0 0.0
G 0.0 0.0 2.6 0.0 2.6
H 1.5 0.0 0.7 0.0 2.2
I 0.0 0.0 0.0 0.0 0.0
J 6.8 0.0 1.4 0.0 8.1
K 2.5 0.0 0.0 0.0 2.5
L 3.1 0.3 1.6 0.0 5.0
M 0.8 0.0 0.0 0.0 0.8
N 1.3 0.6 1.3 0.0 3.2
O 0.8 0.0 1.6 0.0 2.4
P 0.0 0.0 0.0 0.0 0.0
Q 1.6 0.0 0.0 0.0 1.6
R 0.0 0.0 0.8 0.0 0.8
S 0.0 0.0 0.0 0.0 0.0
T 2.1 0.0 4.2 0.0 6.3
U 0.0 0.0 0.0 0.6 0.6
V 0.0 0.0 0.0 0.0 0.0
W 3.2 0.0 1.3 0.0 4.4
X 1.5 0.3 1.5 0.9 4.3
Y 2.0 1.0 2.0 0.0 4.9
Z 4.0 0.0 2.9 0.7 7.6
AA 2.3 0.6 0.6 0.6 3.9
AB 2.2 0.0 0.8 0.0 3.0
AC 5.1 0.0 1.7 3.4 10.2
AD 1.7 0.0 1.4 0.7 3.7
AE 1.1 0.0 4.1 0.4 5.6
AF 3.8 0.0 0.6 1.9 6.3
Total 1.9 0.1 1.4 0.4 3.8
COMMENTS: These analyses include 4 446 neonates from 32 sites.
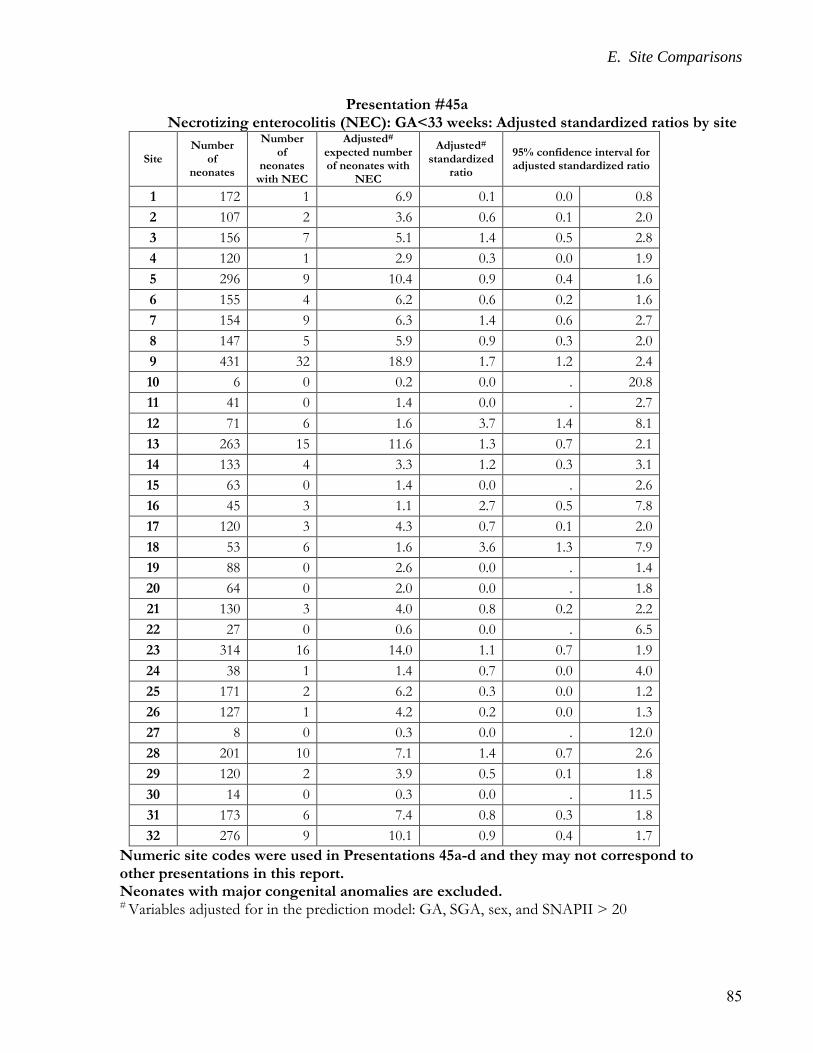
E. Site Comparisons
85
Presentation #45a Necrotizing enterocolitis (NEC): GA<33 weeks: Adjusted standardized ratios by site
Site Number
of neonates
Number of
neonates with NEC
Adjusted# expected number of neonates with
NEC
Adjusted# standardized
ratio
95% confidence interval for adjusted standardized ratio
1 172 1 6.9 0.1 0.0 0.8
2 107 2 3.6 0.6 0.1 2.0
3 156 7 5.1 1.4 0.5 2.8
4 120 1 2.9 0.3 0.0 1.9
5 296 9 10.4 0.9 0.4 1.6
6 155 4 6.2 0.6 0.2 1.6
7 154 9 6.3 1.4 0.6 2.7
8 147 5 5.9 0.9 0.3 2.0
9 431 32 18.9 1.7 1.2 2.4
10 6 0 0.2 0.0 . 20.8
11 41 0 1.4 0.0 . 2.7
12 71 6 1.6 3.7 1.4 8.1
13 263 15 11.6 1.3 0.7 2.1
14 133 4 3.3 1.2 0.3 3.1
15 63 0 1.4 0.0 . 2.6
16 45 3 1.1 2.7 0.5 7.8
17 120 3 4.3 0.7 0.1 2.0
18 53 6 1.6 3.6 1.3 7.9
19 88 0 2.6 0.0 . 1.4
20 64 0 2.0 0.0 . 1.8
21 130 3 4.0 0.8 0.2 2.2
22 27 0 0.6 0.0 . 6.5
23 314 16 14.0 1.1 0.7 1.9
24 38 1 1.4 0.7 0.0 4.0
25 171 2 6.2 0.3 0.0 1.2
26 127 1 4.2 0.2 0.0 1.3
27 8 0 0.3 0.0 . 12.0
28 201 10 7.1 1.4 0.7 2.6
29 120 2 3.9 0.5 0.1 1.8
30 14 0 0.3 0.0 . 11.5
31 173 6 7.4 0.8 0.3 1.8
32 276 9 10.1 0.9 0.4 1.7
Numeric site codes were used in Presentations 45a-d and they may not correspond to other presentations in this report. Neonates with major congenital anomalies are excluded. # Variables adjusted for in the prediction model: GA, SGA, sex, and SNAPII > 20
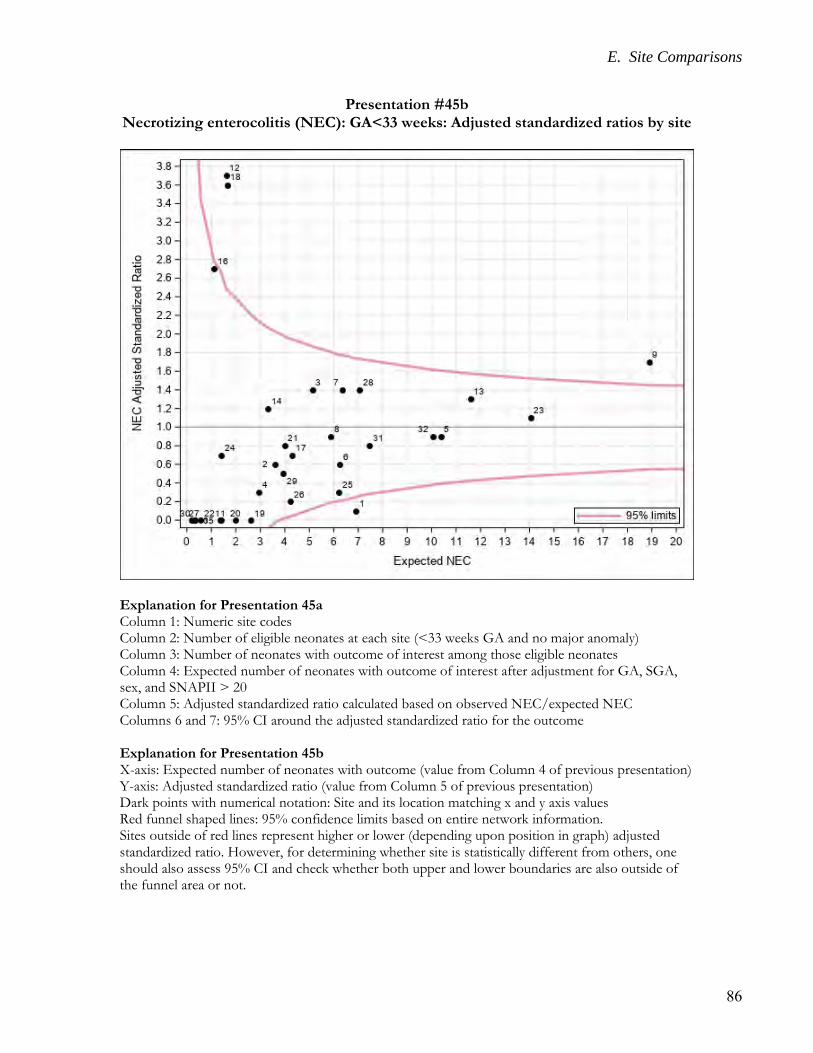
E. Site Comparisons
86
Presentation #45b Necrotizing enterocolitis (NEC): GA<33 weeks: Adjusted standardized ratios by site
Explanation for Presentation 45a Column 1: Numeric site codes Column 2: Number of eligible neonates at each site (<33 weeks GA and no major anomaly) Column 3: Number of neonates with outcome of interest among those eligible neonates Column 4: Expected number of neonates with outcome of interest after adjustment for GA, SGA, sex, and SNAPII > 20 Column 5: Adjusted standardized ratio calculated based on observed NEC/expected NEC Columns 6 and 7: 95% CI around the adjusted standardized ratio for the outcome Explanation for Presentation 45b X-axis: Expected number of neonates with outcome (value from Column 4 of previous presentation) Y-axis: Adjusted standardized ratio (value from Column 5 of previous presentation) Dark points with numerical notation: Site and its location matching x and y axis values Red funnel shaped lines: 95% confidence limits based on entire network information. Sites outside of red lines represent higher or lower (depending upon position in graph) adjusted standardized ratio. However, for determining whether site is statistically different from others, one should also assess 95% CI and check whether both upper and lower boundaries are also outside of the funnel area or not.
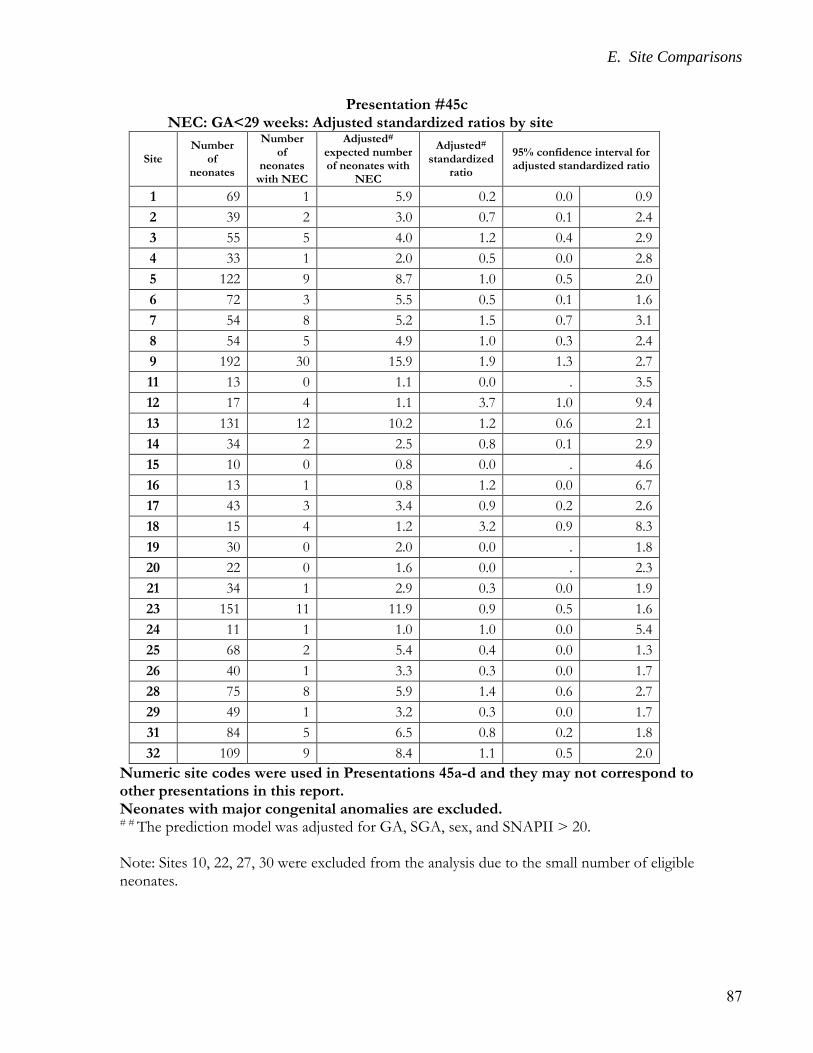
E. Site Comparisons
87
Presentation #45c NEC: GA<29 weeks: Adjusted standardized ratios by site
Site Number
of neonates
Number of
neonates with NEC
Adjusted# expected number of neonates with
NEC
Adjusted# standardized
ratio
95% confidence interval for adjusted standardized ratio
1 69 1 5.9 0.2 0.0 0.9
2 39 2 3.0 0.7 0.1 2.4
3 55 5 4.0 1.2 0.4 2.9
4 33 1 2.0 0.5 0.0 2.8
5 122 9 8.7 1.0 0.5 2.0
6 72 3 5.5 0.5 0.1 1.6
7 54 8 5.2 1.5 0.7 3.1
8 54 5 4.9 1.0 0.3 2.4
9 192 30 15.9 1.9 1.3 2.7
11 13 0 1.1 0.0 . 3.5
12 17 4 1.1 3.7 1.0 9.4
13 131 12 10.2 1.2 0.6 2.1
14 34 2 2.5 0.8 0.1 2.9
15 10 0 0.8 0.0 . 4.6
16 13 1 0.8 1.2 0.0 6.7
17 43 3 3.4 0.9 0.2 2.6
18 15 4 1.2 3.2 0.9 8.3
19 30 0 2.0 0.0 . 1.8
20 22 0 1.6 0.0 . 2.3
21 34 1 2.9 0.3 0.0 1.9
23 151 11 11.9 0.9 0.5 1.6
24 11 1 1.0 1.0 0.0 5.4
25 68 2 5.4 0.4 0.0 1.3
26 40 1 3.3 0.3 0.0 1.7
28 75 8 5.9 1.4 0.6 2.7
29 49 1 3.2 0.3 0.0 1.7
31 84 5 6.5 0.8 0.2 1.8
32 109 9 8.4 1.1 0.5 2.0
Numeric site codes were used in Presentations 45a-d and they may not correspond to other presentations in this report. Neonates with major congenital anomalies are excluded. # # The prediction model was adjusted for GA, SGA, sex, and SNAPII > 20. Note: Sites 10, 22, 27, 30 were excluded from the analysis due to the small number of eligible neonates.
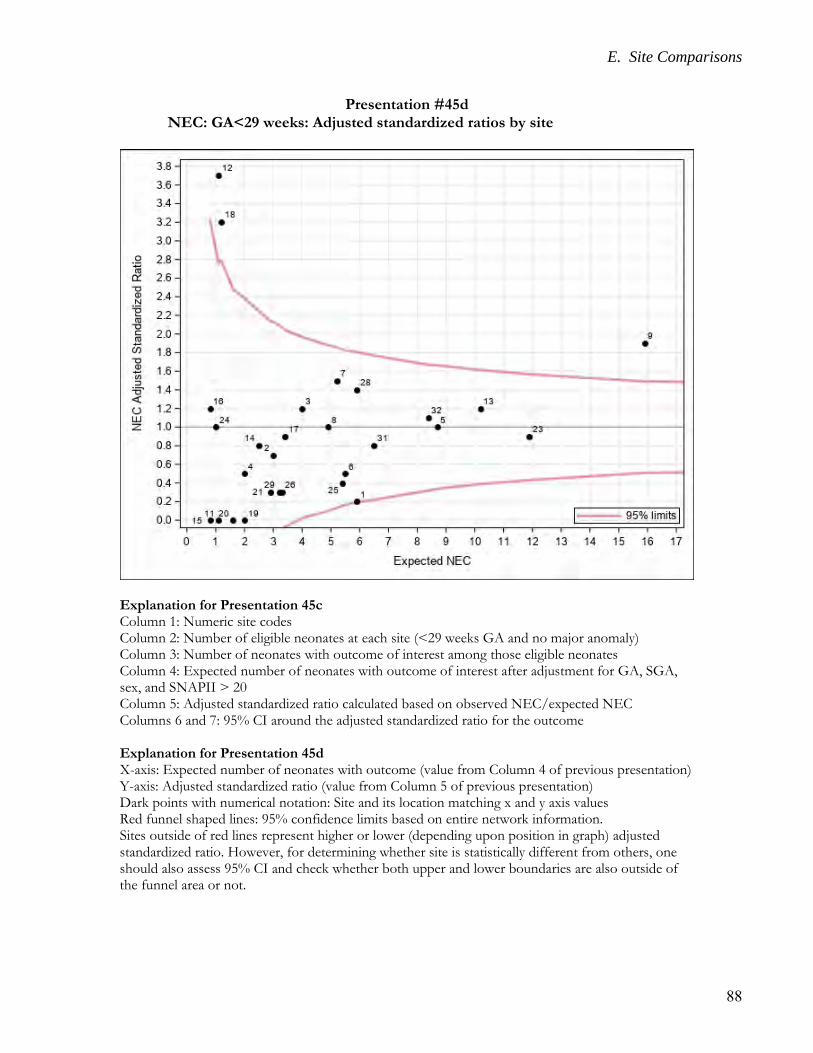
E. Site Comparisons
88
Presentation #45d NEC: GA<29 weeks: Adjusted standardized ratios by site
Explanation for Presentation 45c Column 1: Numeric site codes Column 2: Number of eligible neonates at each site (<29 weeks GA and no major anomaly) Column 3: Number of neonates with outcome of interest among those eligible neonates Column 4: Expected number of neonates with outcome of interest after adjustment for GA, SGA, sex, and SNAPII > 20 Column 5: Adjusted standardized ratio calculated based on observed NEC/expected NEC Columns 6 and 7: 95% CI around the adjusted standardized ratio for the outcome Explanation for Presentation 45d X-axis: Expected number of neonates with outcome (value from Column 4 of previous presentation) Y-axis: Adjusted standardized ratio (value from Column 5 of previous presentation) Dark points with numerical notation: Site and its location matching x and y axis values Red funnel shaped lines: 95% confidence limits based on entire network information. Sites outside of red lines represent higher or lower (depending upon position in graph) adjusted standardized ratio. However, for determining whether site is statistically different from others, one should also assess 95% CI and check whether both upper and lower boundaries are also outside of the funnel area or not.
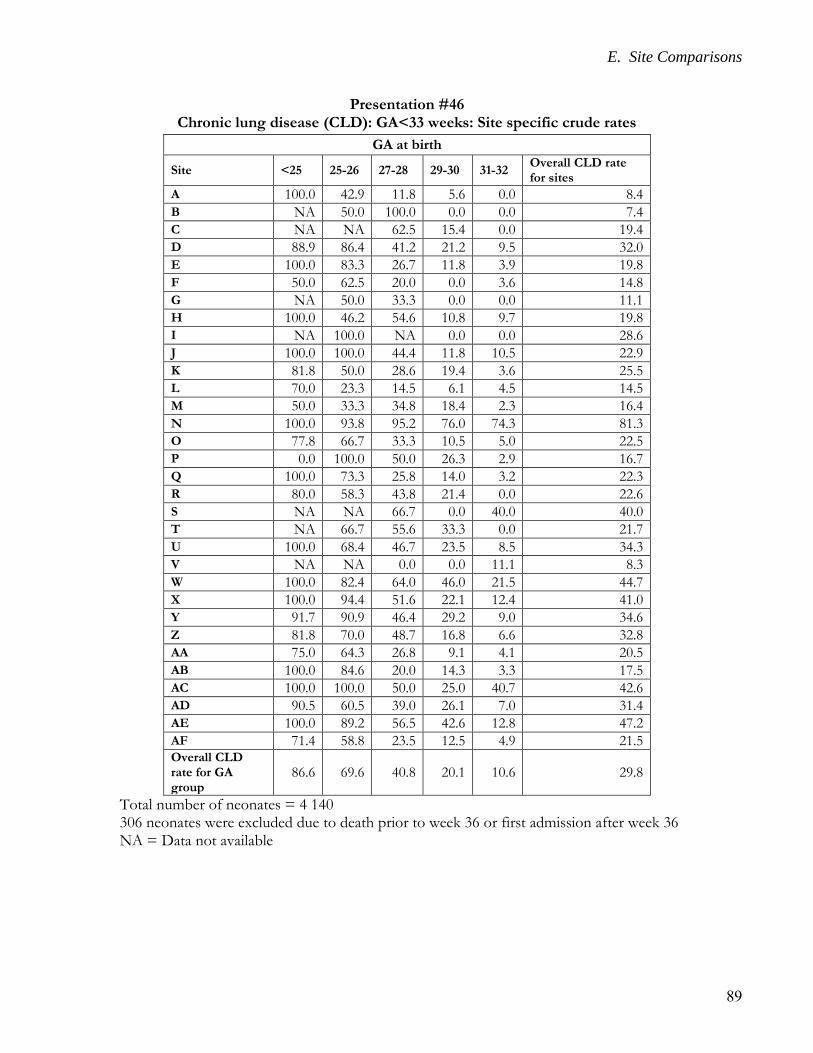
E. Site Comparisons
89
Presentation #46
Chronic lung disease (CLD): GA<33 weeks: Site specific crude rates
GA at birth
Site <25 25-26 27-28 29-30 31-32 Overall CLD rate for sites
A 100.0 42.9 11.8 5.6 0.0 8.4
B NA 50.0 100.0 0.0 0.0 7.4
C NA NA 62.5 15.4 0.0 19.4
D 88.9 86.4 41.2 21.2 9.5 32.0
E 100.0 83.3 26.7 11.8 3.9 19.8
F 50.0 62.5 20.0 0.0 3.6 14.8
G NA 50.0 33.3 0.0 0.0 11.1
H 100.0 46.2 54.6 10.8 9.7 19.8
I NA 100.0 NA 0.0 0.0 28.6
J 100.0 100.0 44.4 11.8 10.5 22.9
K 81.8 50.0 28.6 19.4 3.6 25.5
L 70.0 23.3 14.5 6.1 4.5 14.5
M 50.0 33.3 34.8 18.4 2.3 16.4
N 100.0 93.8 95.2 76.0 74.3 81.3
O 77.8 66.7 33.3 10.5 5.0 22.5
P 0.0 100.0 50.0 26.3 2.9 16.7
Q 100.0 73.3 25.8 14.0 3.2 22.3
R 80.0 58.3 43.8 21.4 0.0 22.6
S NA NA 66.7 0.0 40.0 40.0
T NA 66.7 55.6 33.3 0.0 21.7
U 100.0 68.4 46.7 23.5 8.5 34.3
V NA NA 0.0 0.0 11.1 8.3
W 100.0 82.4 64.0 46.0 21.5 44.7
X 100.0 94.4 51.6 22.1 12.4 41.0
Y 91.7 90.9 46.4 29.2 9.0 34.6
Z 81.8 70.0 48.7 16.8 6.6 32.8
AA 75.0 64.3 26.8 9.1 4.1 20.5
AB 100.0 84.6 20.0 14.3 3.3 17.5
AC 100.0 100.0 50.0 25.0 40.7 42.6
AD 90.5 60.5 39.0 26.1 7.0 31.4
AE 100.0 89.2 56.5 42.6 12.8 47.2
AF 71.4 58.8 23.5 12.5 4.9 21.5 Overall CLD rate for GA group
86.6 69.6 40.8 20.1 10.6 29.8
Total number of neonates = 4 140 306 neonates were excluded due to death prior to week 36 or first admission after week 36 NA = Data not available
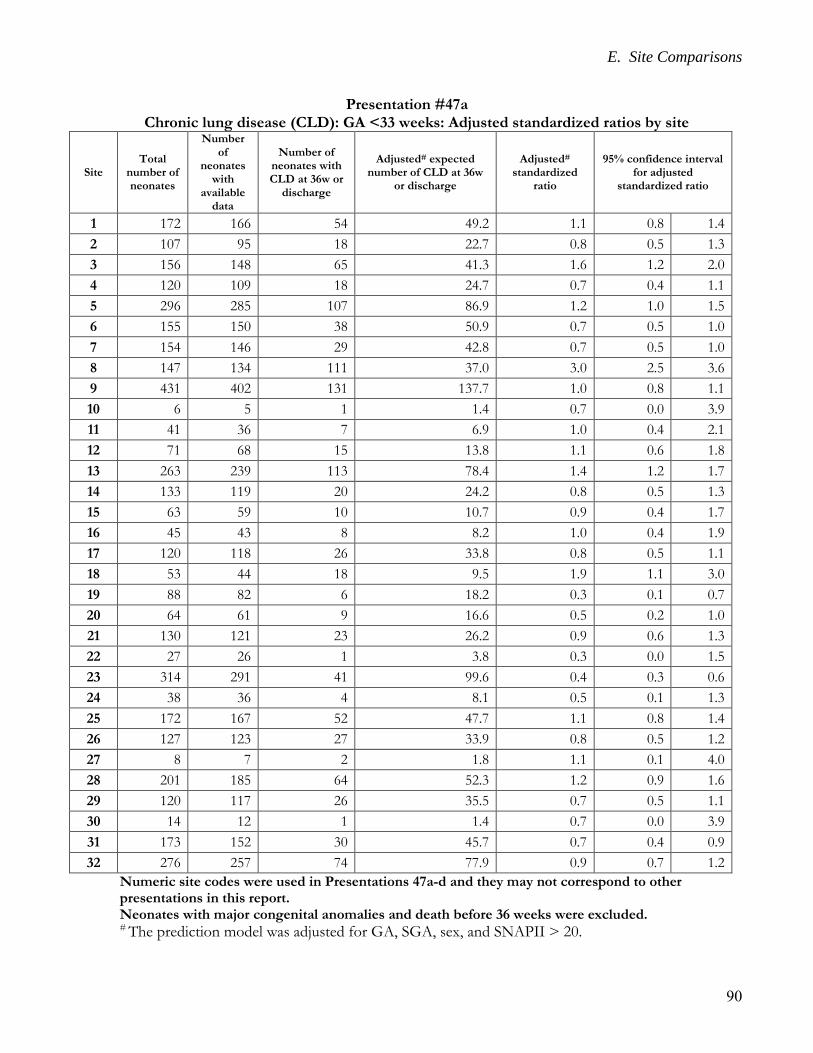
E. Site Comparisons
90
Presentation #47a Chronic lung disease (CLD): GA <33 weeks: Adjusted standardized ratios by site
Site Total
number of neonates
Number of
neonates with
available data
Number of neonates with CLD at 36w or
discharge
Adjusted# expected number of CLD at 36w
or discharge
Adjusted# standardized
ratio
95% confidence interval for adjusted
standardized ratio
1 172 166 54 49.2 1.1 0.8 1.4
2 107 95 18 22.7 0.8 0.5 1.3
3 156 148 65 41.3 1.6 1.2 2.0
4 120 109 18 24.7 0.7 0.4 1.1
5 296 285 107 86.9 1.2 1.0 1.5
6 155 150 38 50.9 0.7 0.5 1.0
7 154 146 29 42.8 0.7 0.5 1.0
8 147 134 111 37.0 3.0 2.5 3.6
9 431 402 131 137.7 1.0 0.8 1.1
10 6 5 1 1.4 0.7 0.0 3.9
11 41 36 7 6.9 1.0 0.4 2.1
12 71 68 15 13.8 1.1 0.6 1.8
13 263 239 113 78.4 1.4 1.2 1.7
14 133 119 20 24.2 0.8 0.5 1.3
15 63 59 10 10.7 0.9 0.4 1.7
16 45 43 8 8.2 1.0 0.4 1.9
17 120 118 26 33.8 0.8 0.5 1.1
18 53 44 18 9.5 1.9 1.1 3.0
19 88 82 6 18.2 0.3 0.1 0.7
20 64 61 9 16.6 0.5 0.2 1.0
21 130 121 23 26.2 0.9 0.6 1.3
22 27 26 1 3.8 0.3 0.0 1.5
23 314 291 41 99.6 0.4 0.3 0.6
24 38 36 4 8.1 0.5 0.1 1.3
25 172 167 52 47.7 1.1 0.8 1.4
26 127 123 27 33.9 0.8 0.5 1.2
27 8 7 2 1.8 1.1 0.1 4.0
28 201 185 64 52.3 1.2 0.9 1.6
29 120 117 26 35.5 0.7 0.5 1.1
30 14 12 1 1.4 0.7 0.0 3.9
31 173 152 30 45.7 0.7 0.4 0.9
32 276 257 74 77.9 0.9 0.7 1.2
Numeric site codes were used in Presentations 47a-d and they may not correspond to other presentations in this report. Neonates with major congenital anomalies and death before 36 weeks were excluded. # The prediction model was adjusted for GA, SGA, sex, and SNAPII > 20.
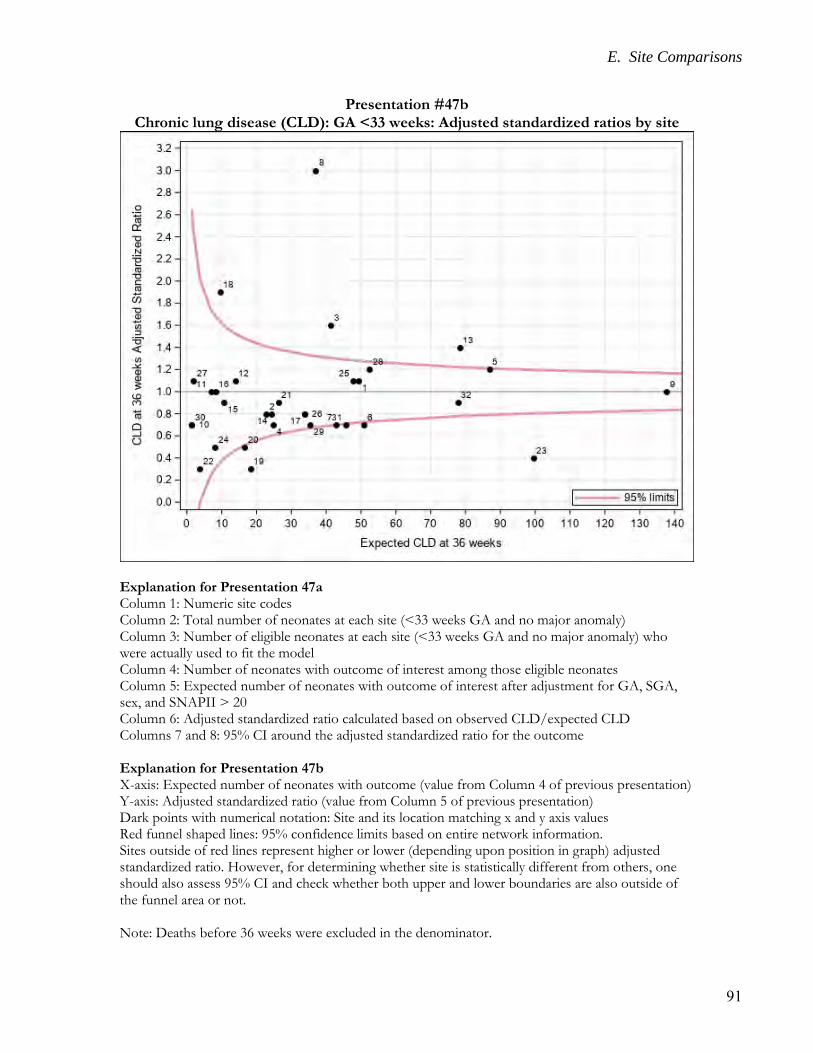
E. Site Comparisons
91
Presentation #47b Chronic lung disease (CLD): GA <33 weeks: Adjusted standardized ratios by site
Explanation for Presentation 47a Column 1: Numeric site codes Column 2: Total number of neonates at each site (<33 weeks GA and no major anomaly) Column 3: Number of eligible neonates at each site (<33 weeks GA and no major anomaly) who were actually used to fit the model Column 4: Number of neonates with outcome of interest among those eligible neonates Column 5: Expected number of neonates with outcome of interest after adjustment for GA, SGA, sex, and SNAPII > 20 Column 6: Adjusted standardized ratio calculated based on observed CLD/expected CLD Columns 7 and 8: 95% CI around the adjusted standardized ratio for the outcome Explanation for Presentation 47b X-axis: Expected number of neonates with outcome (value from Column 4 of previous presentation) Y-axis: Adjusted standardized ratio (value from Column 5 of previous presentation) Dark points with numerical notation: Site and its location matching x and y axis values Red funnel shaped lines: 95% confidence limits based on entire network information. Sites outside of red lines represent higher or lower (depending upon position in graph) adjusted standardized ratio. However, for determining whether site is statistically different from others, one should also assess 95% CI and check whether both upper and lower boundaries are also outside of the funnel area or not. Note: Deaths before 36 weeks were excluded in the denominator.
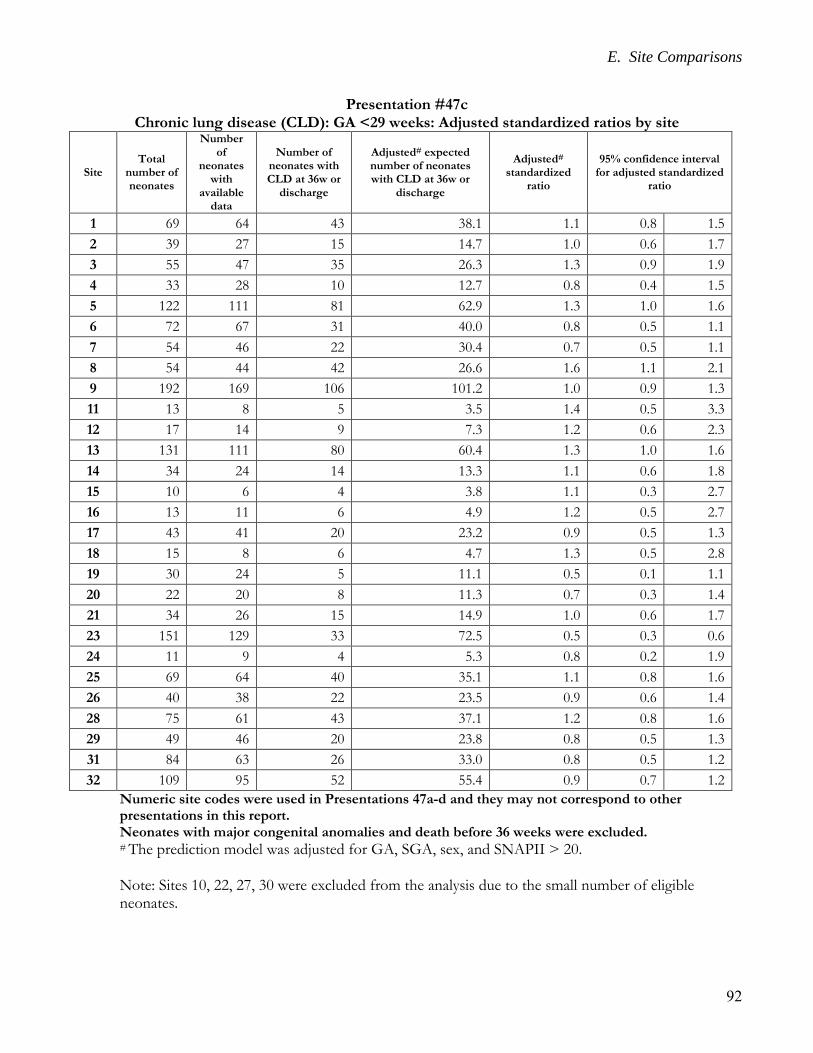
E. Site Comparisons
92
Presentation #47c
Chronic lung disease (CLD): GA <29 weeks: Adjusted standardized ratios by site
Site Total
number of neonates
Number of
neonates with
available data
Number of neonates with CLD at 36w or
discharge
Adjusted# expected number of neonates with CLD at 36w or
discharge
Adjusted# standardized
ratio
95% confidence interval for adjusted standardized
ratio
1 69 64 43 38.1 1.1 0.8 1.5
2 39 27 15 14.7 1.0 0.6 1.7
3 55 47 35 26.3 1.3 0.9 1.9
4 33 28 10 12.7 0.8 0.4 1.5
5 122 111 81 62.9 1.3 1.0 1.6
6 72 67 31 40.0 0.8 0.5 1.1
7 54 46 22 30.4 0.7 0.5 1.1
8 54 44 42 26.6 1.6 1.1 2.1
9 192 169 106 101.2 1.0 0.9 1.3
11 13 8 5 3.5 1.4 0.5 3.3
12 17 14 9 7.3 1.2 0.6 2.3
13 131 111 80 60.4 1.3 1.0 1.6
14 34 24 14 13.3 1.1 0.6 1.8
15 10 6 4 3.8 1.1 0.3 2.7
16 13 11 6 4.9 1.2 0.5 2.7
17 43 41 20 23.2 0.9 0.5 1.3
18 15 8 6 4.7 1.3 0.5 2.8
19 30 24 5 11.1 0.5 0.1 1.1
20 22 20 8 11.3 0.7 0.3 1.4
21 34 26 15 14.9 1.0 0.6 1.7
23 151 129 33 72.5 0.5 0.3 0.6
24 11 9 4 5.3 0.8 0.2 1.9
25 69 64 40 35.1 1.1 0.8 1.6
26 40 38 22 23.5 0.9 0.6 1.4
28 75 61 43 37.1 1.2 0.8 1.6
29 49 46 20 23.8 0.8 0.5 1.3
31 84 63 26 33.0 0.8 0.5 1.2
32 109 95 52 55.4 0.9 0.7 1.2
Numeric site codes were used in Presentations 47a-d and they may not correspond to other presentations in this report. Neonates with major congenital anomalies and death before 36 weeks were excluded. # The prediction model was adjusted for GA, SGA, sex, and SNAPII > 20. Note: Sites 10, 22, 27, 30 were excluded from the analysis due to the small number of eligible neonates.
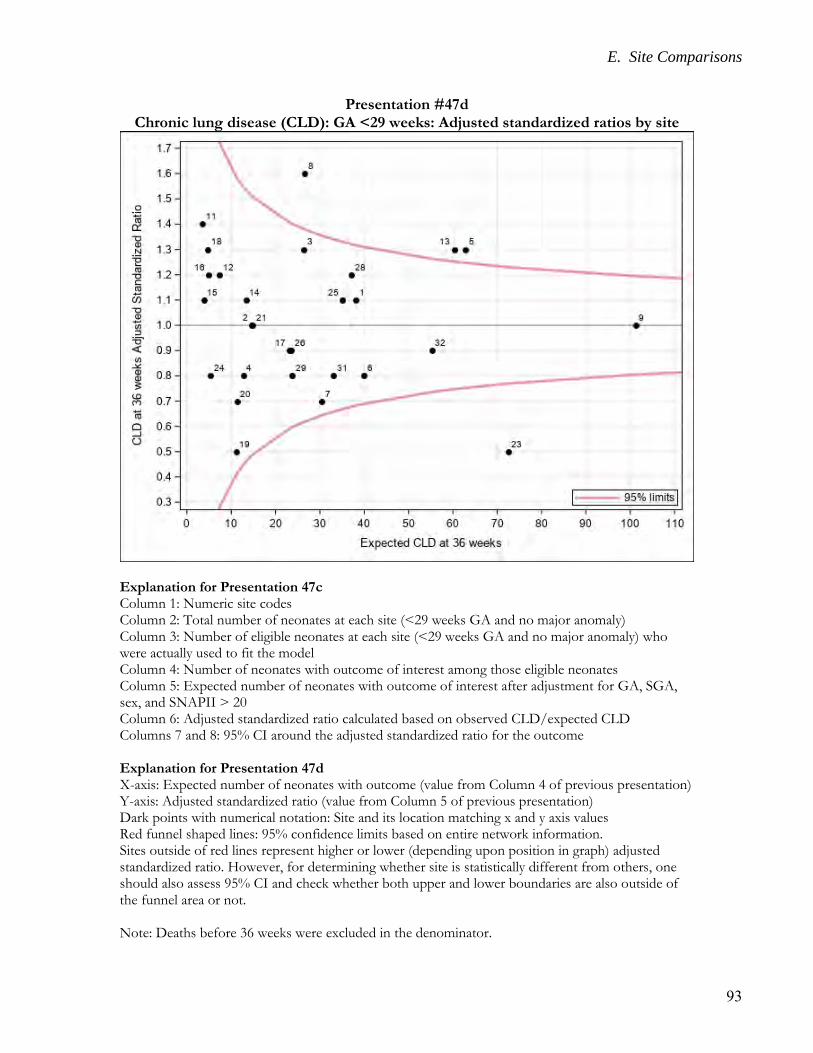
E. Site Comparisons
93
Presentation #47d Chronic lung disease (CLD): GA <29 weeks: Adjusted standardized ratios by site
Explanation for Presentation 47c Column 1: Numeric site codes Column 2: Total number of neonates at each site (<29 weeks GA and no major anomaly) Column 3: Number of eligible neonates at each site (<29 weeks GA and no major anomaly) who were actually used to fit the model Column 4: Number of neonates with outcome of interest among those eligible neonates Column 5: Expected number of neonates with outcome of interest after adjustment for GA, SGA, sex, and SNAPII > 20 Column 6: Adjusted standardized ratio calculated based on observed CLD/expected CLD Columns 7 and 8: 95% CI around the adjusted standardized ratio for the outcome Explanation for Presentation 47d X-axis: Expected number of neonates with outcome (value from Column 4 of previous presentation) Y-axis: Adjusted standardized ratio (value from Column 5 of previous presentation) Dark points with numerical notation: Site and its location matching x and y axis values Red funnel shaped lines: 95% confidence limits based on entire network information. Sites outside of red lines represent higher or lower (depending upon position in graph) adjusted standardized ratio. However, for determining whether site is statistically different from others, one should also assess 95% CI and check whether both upper and lower boundaries are also outside of the funnel area or not. Note: Deaths before 36 weeks were excluded in the denominator.
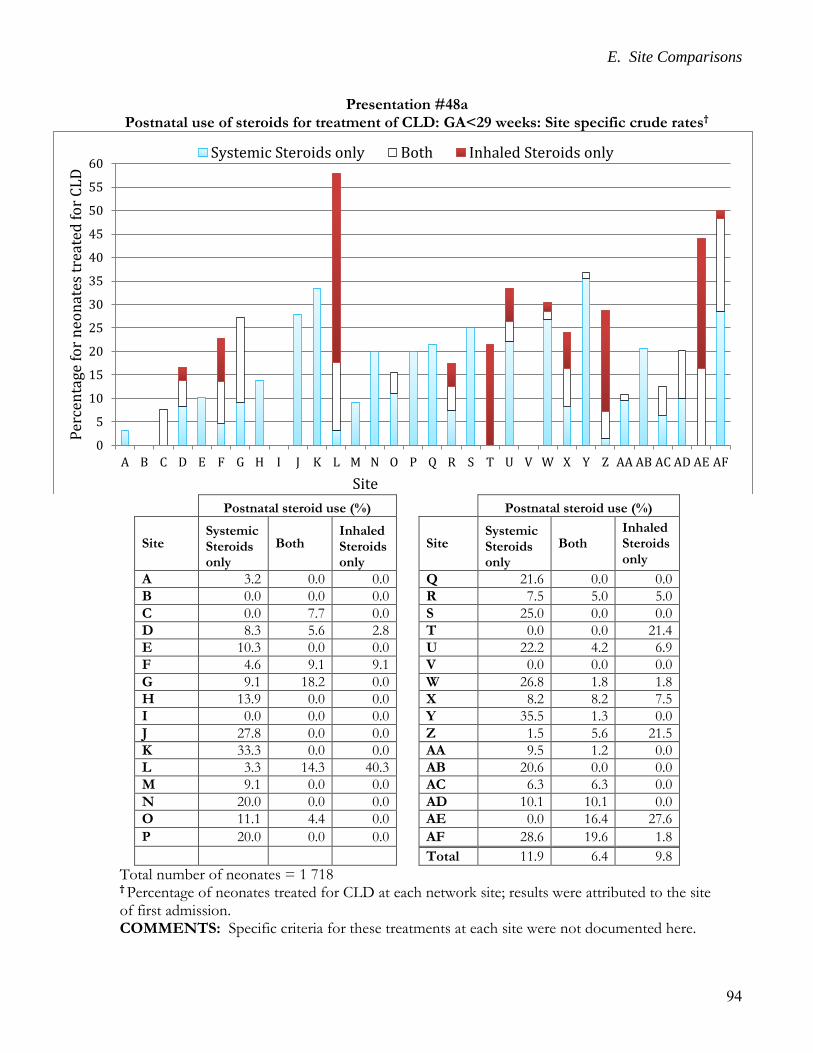
E. Site Comparisons
94
Presentation #48a Postnatal use of steroids for treatment of CLD: GA<29 weeks: Site specific crude rates†
Postnatal steroid use (%) Postnatal steroid use (%)
Site Systemic Steroids only
Both Inhaled Steroids only
Site Systemic Steroids only
Both Inhaled Steroids only
A 3.2 0.0 0.0 Q 21.6 0.0 0.0
B 0.0 0.0 0.0 R 7.5 5.0 5.0
C 0.0 7.7 0.0 S 25.0 0.0 0.0
D 8.3 5.6 2.8 T 0.0 0.0 21.4
E 10.3 0.0 0.0 U 22.2 4.2 6.9
F 4.6 9.1 9.1 V 0.0 0.0 0.0
G 9.1 18.2 0.0 W 26.8 1.8 1.8
H 13.9 0.0 0.0 X 8.2 8.2 7.5
I 0.0 0.0 0.0 Y 35.5 1.3 0.0
J 27.8 0.0 0.0 Z 1.5 5.6 21.5
K 33.3 0.0 0.0 AA 9.5 1.2 0.0
L 3.3 14.3 40.3 AB 20.6 0.0 0.0
M 9.1 0.0 0.0 AC 6.3 6.3 0.0
N 20.0 0.0 0.0 AD 10.1 10.1 0.0
O 11.1 4.4 0.0 AE 0.0 16.4 27.6
P 20.0 0.0 0.0 AF 28.6 19.6 1.8
Total 11.9 6.4 9.8
Total number of neonates = 1 718 † Percentage of neonates treated for CLD at each network site; results were attributed to the site of first admission. COMMENTS: Specific criteria for these treatments at each site were not documented here.
0
5
10
15
20
25
30
35
40
45
50
55
60
A B C D E F G H I J K L M N O P Q R S T U V W X Y Z AA AB AC AD AE AF
Per
cen
tage
fo
r n
eon
ates
tre
ated
for
CL
D
Site
Systemic Steroids only Both Inhaled Steroids only
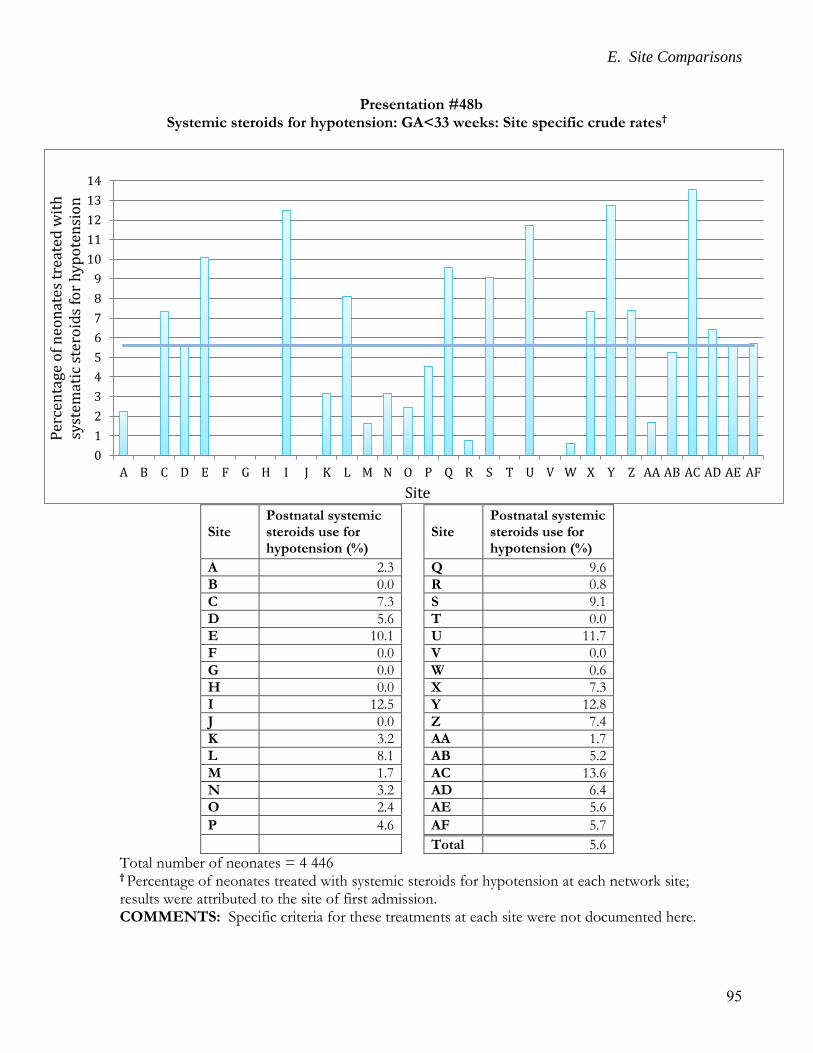
E. Site Comparisons
95
Presentation #48b
Systemic steroids for hypotension: GA<33 weeks: Site specific crude rates†
Site Postnatal systemic steroids use for hypotension (%)
Site Postnatal systemic steroids use for hypotension (%)
A 2.3 Q 9.6
B 0.0 R 0.8
C 7.3 S 9.1
D 5.6 T 0.0
E 10.1 U 11.7
F 0.0 V 0.0
G 0.0 W 0.6
H 0.0 X 7.3
I 12.5 Y 12.8
J 0.0 Z 7.4
K 3.2 AA 1.7
L 8.1 AB 5.2
M 1.7 AC 13.6
N 3.2 AD 6.4
O 2.4 AE 5.6
P 4.6 AF 5.7
Total 5.6
Total number of neonates = 4 446 † Percentage of neonates treated with systemic steroids for hypotension at each network site; results were attributed to the site of first admission. COMMENTS: Specific criteria for these treatments at each site were not documented here.
0
1
2
3
4
5
6
7
8
9
10
11
12
13
14
A B C D E F G H I J K L M N O P Q R S T U V W X Y Z AA AB AC AD AE AF
Per
cen
tage
of
neo
nat
es t
reat
ed w
ith
sy
stem
atic
ste
roid
s fo
r h
ypo
ten
sio
n
Site
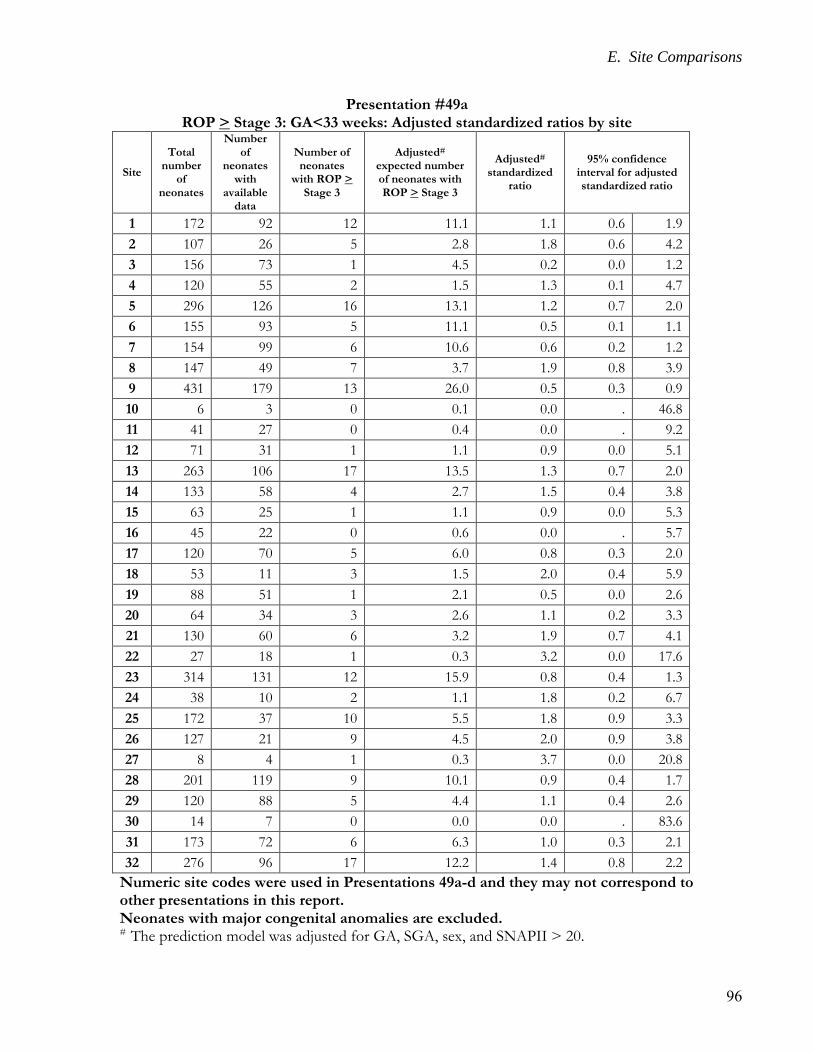
E. Site Comparisons
96
Presentation #49a ROP > Stage 3: GA<33 weeks: Adjusted standardized ratios by site
Site
Total number
of neonates
Number of
neonates with
available data
Number of neonates
with ROP > Stage 3
Adjusted# expected number of neonates with ROP > Stage 3
Adjusted# standardized
ratio
95% confidence interval for adjusted standardized ratio
1 172 92 12 11.1 1.1 0.6 1.9
2 107 26 5 2.8 1.8 0.6 4.2
3 156 73 1 4.5 0.2 0.0 1.2
4 120 55 2 1.5 1.3 0.1 4.7
5 296 126 16 13.1 1.2 0.7 2.0
6 155 93 5 11.1 0.5 0.1 1.1
7 154 99 6 10.6 0.6 0.2 1.2
8 147 49 7 3.7 1.9 0.8 3.9
9 431 179 13 26.0 0.5 0.3 0.9
10 6 3 0 0.1 0.0 . 46.8
11 41 27 0 0.4 0.0 . 9.2
12 71 31 1 1.1 0.9 0.0 5.1
13 263 106 17 13.5 1.3 0.7 2.0
14 133 58 4 2.7 1.5 0.4 3.8
15 63 25 1 1.1 0.9 0.0 5.3
16 45 22 0 0.6 0.0 . 5.7
17 120 70 5 6.0 0.8 0.3 2.0
18 53 11 3 1.5 2.0 0.4 5.9
19 88 51 1 2.1 0.5 0.0 2.6
20 64 34 3 2.6 1.1 0.2 3.3
21 130 60 6 3.2 1.9 0.7 4.1
22 27 18 1 0.3 3.2 0.0 17.6
23 314 131 12 15.9 0.8 0.4 1.3
24 38 10 2 1.1 1.8 0.2 6.7
25 172 37 10 5.5 1.8 0.9 3.3
26 127 21 9 4.5 2.0 0.9 3.8
27 8 4 1 0.3 3.7 0.0 20.8
28 201 119 9 10.1 0.9 0.4 1.7
29 120 88 5 4.4 1.1 0.4 2.6
30 14 7 0 0.0 0.0 . 83.6
31 173 72 6 6.3 1.0 0.3 2.1
32 276 96 17 12.2 1.4 0.8 2.2
Numeric site codes were used in Presentations 49a-d and they may not correspond to other presentations in this report. Neonates with major congenital anomalies are excluded. # The prediction model was adjusted for GA, SGA, sex, and SNAPII > 20.
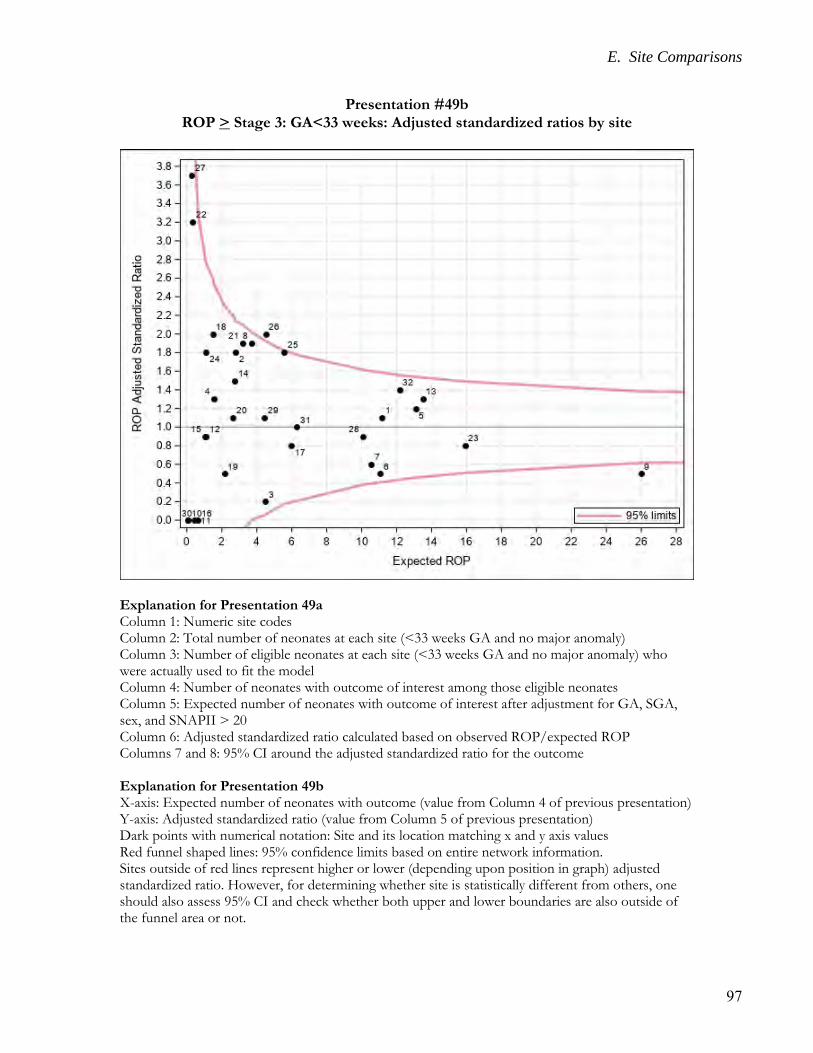
E. Site Comparisons
97
Presentation #49b ROP > Stage 3: GA<33 weeks: Adjusted standardized ratios by site
Explanation for Presentation 49a Column 1: Numeric site codes Column 2: Total number of neonates at each site (<33 weeks GA and no major anomaly) Column 3: Number of eligible neonates at each site (<33 weeks GA and no major anomaly) who were actually used to fit the model Column 4: Number of neonates with outcome of interest among those eligible neonates Column 5: Expected number of neonates with outcome of interest after adjustment for GA, SGA, sex, and SNAPII > 20 Column 6: Adjusted standardized ratio calculated based on observed ROP/expected ROP Columns 7 and 8: 95% CI around the adjusted standardized ratio for the outcome Explanation for Presentation 49b X-axis: Expected number of neonates with outcome (value from Column 4 of previous presentation) Y-axis: Adjusted standardized ratio (value from Column 5 of previous presentation) Dark points with numerical notation: Site and its location matching x and y axis values Red funnel shaped lines: 95% confidence limits based on entire network information. Sites outside of red lines represent higher or lower (depending upon position in graph) adjusted standardized ratio. However, for determining whether site is statistically different from others, one should also assess 95% CI and check whether both upper and lower boundaries are also outside of the funnel area or not.
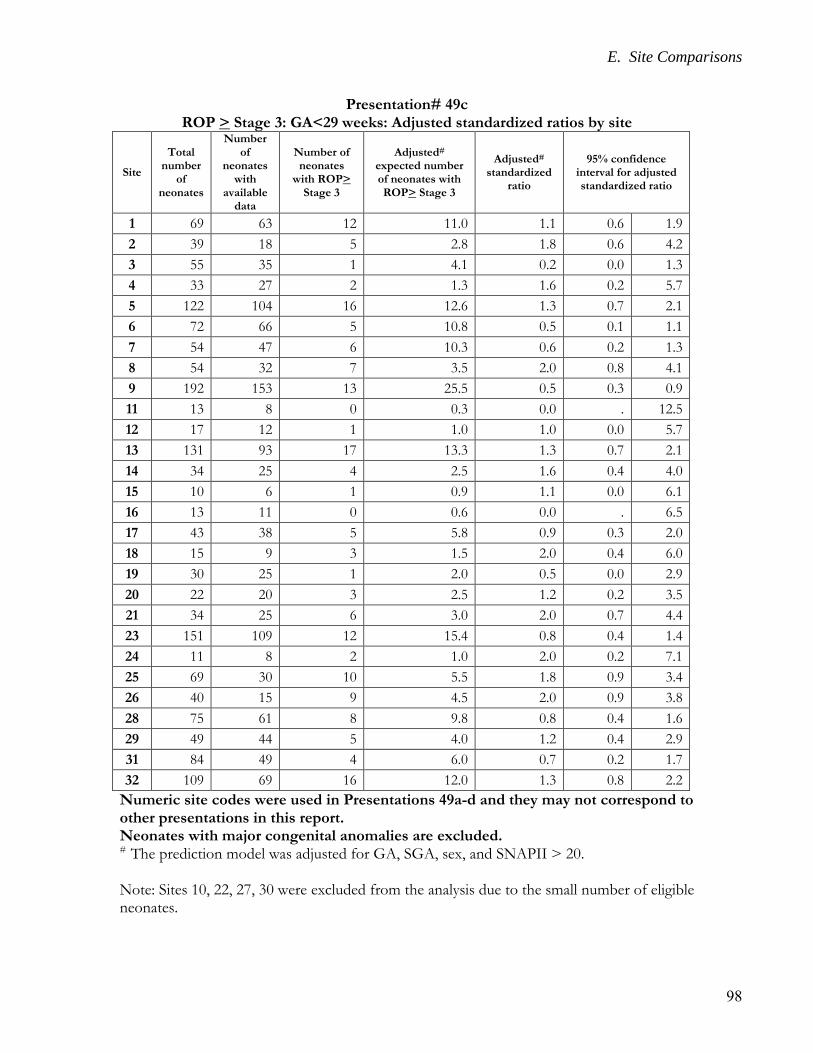
E. Site Comparisons
98
Presentation# 49c ROP > Stage 3: GA<29 weeks: Adjusted standardized ratios by site
Site
Total number
of neonates
Number of
neonates with
available data
Number of neonates
with ROP> Stage 3
Adjusted# expected number of neonates with ROP> Stage 3
Adjusted# standardized
ratio
95% confidence interval for adjusted standardized ratio
1 69 63 12 11.0 1.1 0.6 1.9
2 39 18 5 2.8 1.8 0.6 4.2
3 55 35 1 4.1 0.2 0.0 1.3
4 33 27 2 1.3 1.6 0.2 5.7
5 122 104 16 12.6 1.3 0.7 2.1
6 72 66 5 10.8 0.5 0.1 1.1
7 54 47 6 10.3 0.6 0.2 1.3
8 54 32 7 3.5 2.0 0.8 4.1
9 192 153 13 25.5 0.5 0.3 0.9
11 13 8 0 0.3 0.0 . 12.5
12 17 12 1 1.0 1.0 0.0 5.7
13 131 93 17 13.3 1.3 0.7 2.1
14 34 25 4 2.5 1.6 0.4 4.0
15 10 6 1 0.9 1.1 0.0 6.1
16 13 11 0 0.6 0.0 . 6.5
17 43 38 5 5.8 0.9 0.3 2.0
18 15 9 3 1.5 2.0 0.4 6.0
19 30 25 1 2.0 0.5 0.0 2.9
20 22 20 3 2.5 1.2 0.2 3.5
21 34 25 6 3.0 2.0 0.7 4.4
23 151 109 12 15.4 0.8 0.4 1.4
24 11 8 2 1.0 2.0 0.2 7.1
25 69 30 10 5.5 1.8 0.9 3.4
26 40 15 9 4.5 2.0 0.9 3.8
28 75 61 8 9.8 0.8 0.4 1.6
29 49 44 5 4.0 1.2 0.4 2.9
31 84 49 4 6.0 0.7 0.2 1.7
32 109 69 16 12.0 1.3 0.8 2.2
Numeric site codes were used in Presentations 49a-d and they may not correspond to other presentations in this report. Neonates with major congenital anomalies are excluded. # The prediction model was adjusted for GA, SGA, sex, and SNAPII > 20. Note: Sites 10, 22, 27, 30 were excluded from the analysis due to the small number of eligible neonates.
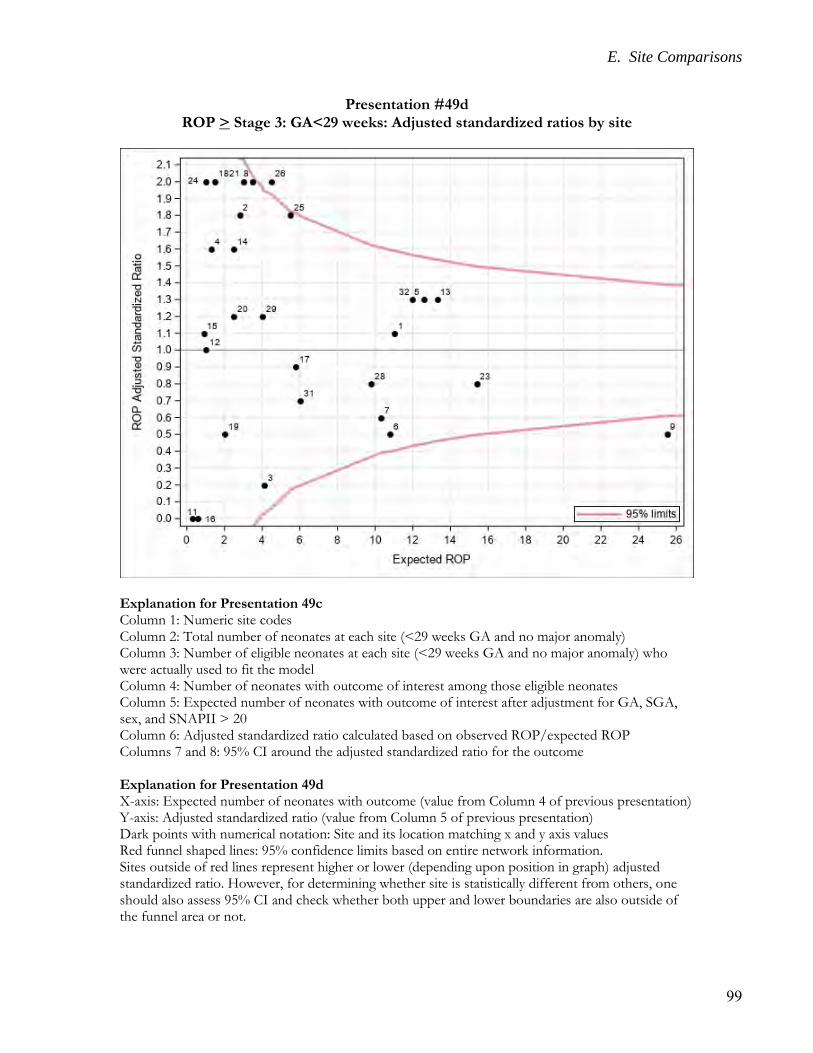
E. Site Comparisons
99
Presentation #49d ROP > Stage 3: GA<29 weeks: Adjusted standardized ratios by site
Explanation for Presentation 49c Column 1: Numeric site codes Column 2: Total number of neonates at each site (<29 weeks GA and no major anomaly) Column 3: Number of eligible neonates at each site (<29 weeks GA and no major anomaly) who were actually used to fit the model Column 4: Number of neonates with outcome of interest among those eligible neonates Column 5: Expected number of neonates with outcome of interest after adjustment for GA, SGA, sex, and SNAPII > 20 Column 6: Adjusted standardized ratio calculated based on observed ROP/expected ROP Columns 7 and 8: 95% CI around the adjusted standardized ratio for the outcome Explanation for Presentation 49d X-axis: Expected number of neonates with outcome (value from Column 4 of previous presentation) Y-axis: Adjusted standardized ratio (value from Column 5 of previous presentation) Dark points with numerical notation: Site and its location matching x and y axis values Red funnel shaped lines: 95% confidence limits based on entire network information. Sites outside of red lines represent higher or lower (depending upon position in graph) adjusted standardized ratio. However, for determining whether site is statistically different from others, one should also assess 95% CI and check whether both upper and lower boundaries are also outside of the funnel area or not.
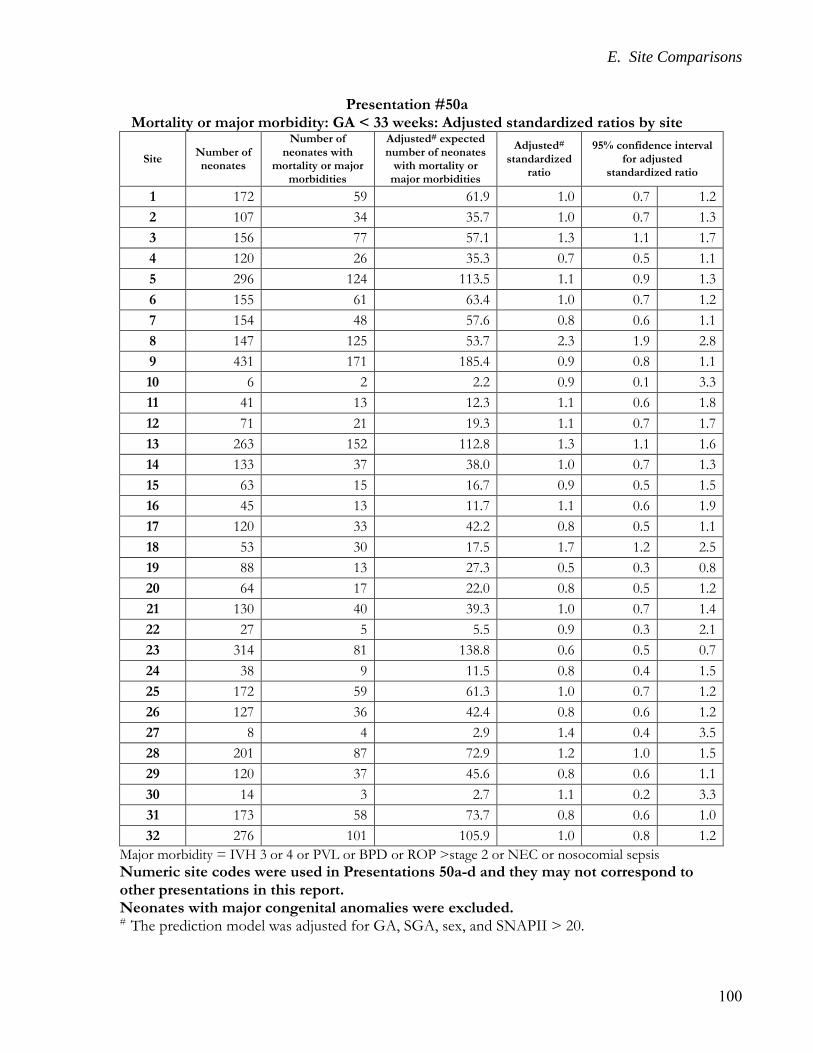
E. Site Comparisons
100
Presentation #50a Mortality or major morbidity: GA < 33 weeks: Adjusted standardized ratios by site
Site Number of neonates
Number of neonates with
mortality or major morbidities
Adjusted# expected number of neonates
with mortality or major morbidities
Adjusted# standardized
ratio
95% confidence interval for adjusted
standardized ratio
1 172 59 61.9 1.0 0.7 1.2
2 107 34 35.7 1.0 0.7 1.3
3 156 77 57.1 1.3 1.1 1.7
4 120 26 35.3 0.7 0.5 1.1
5 296 124 113.5 1.1 0.9 1.3
6 155 61 63.4 1.0 0.7 1.2
7 154 48 57.6 0.8 0.6 1.1
8 147 125 53.7 2.3 1.9 2.8
9 431 171 185.4 0.9 0.8 1.1
10 6 2 2.2 0.9 0.1 3.3
11 41 13 12.3 1.1 0.6 1.8
12 71 21 19.3 1.1 0.7 1.7
13 263 152 112.8 1.3 1.1 1.6
14 133 37 38.0 1.0 0.7 1.3
15 63 15 16.7 0.9 0.5 1.5
16 45 13 11.7 1.1 0.6 1.9
17 120 33 42.2 0.8 0.5 1.1
18 53 30 17.5 1.7 1.2 2.5
19 88 13 27.3 0.5 0.3 0.8
20 64 17 22.0 0.8 0.5 1.2
21 130 40 39.3 1.0 0.7 1.4
22 27 5 5.5 0.9 0.3 2.1
23 314 81 138.8 0.6 0.5 0.7
24 38 9 11.5 0.8 0.4 1.5
25 172 59 61.3 1.0 0.7 1.2
26 127 36 42.4 0.8 0.6 1.2
27 8 4 2.9 1.4 0.4 3.5
28 201 87 72.9 1.2 1.0 1.5
29 120 37 45.6 0.8 0.6 1.1
30 14 3 2.7 1.1 0.2 3.3
31 173 58 73.7 0.8 0.6 1.0
32 276 101 105.9 1.0 0.8 1.2
Major morbidity = IVH 3 or 4 or PVL or BPD or ROP >stage 2 or NEC or nosocomial sepsis
Numeric site codes were used in Presentations 50a-d and they may not correspond to other presentations in this report. Neonates with major congenital anomalies were excluded. # The prediction model was adjusted for GA, SGA, sex, and SNAPII > 20.
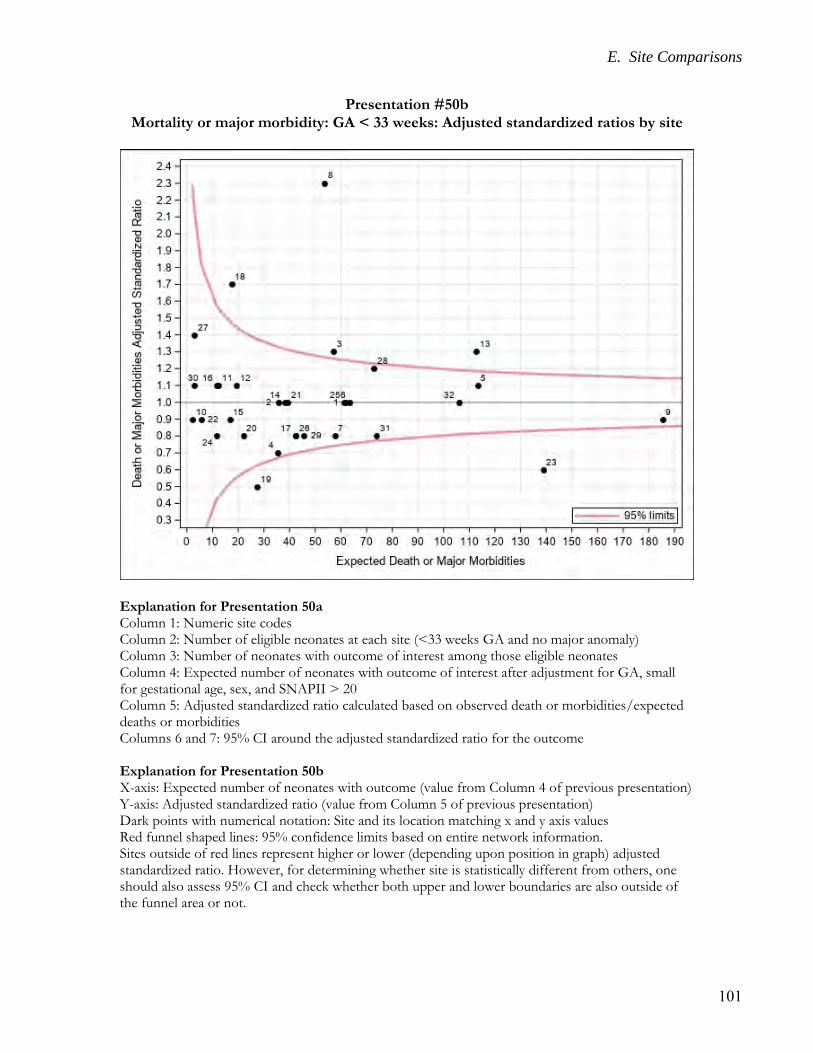
E. Site Comparisons
101
Presentation #50b Mortality or major morbidity: GA < 33 weeks: Adjusted standardized ratios by site
Explanation for Presentation 50a Column 1: Numeric site codes Column 2: Number of eligible neonates at each site (<33 weeks GA and no major anomaly) Column 3: Number of neonates with outcome of interest among those eligible neonates Column 4: Expected number of neonates with outcome of interest after adjustment for GA, small for gestational age, sex, and SNAPII > 20 Column 5: Adjusted standardized ratio calculated based on observed death or morbidities/expected deaths or morbidities Columns 6 and 7: 95% CI around the adjusted standardized ratio for the outcome Explanation for Presentation 50b X-axis: Expected number of neonates with outcome (value from Column 4 of previous presentation) Y-axis: Adjusted standardized ratio (value from Column 5 of previous presentation) Dark points with numerical notation: Site and its location matching x and y axis values Red funnel shaped lines: 95% confidence limits based on entire network information. Sites outside of red lines represent higher or lower (depending upon position in graph) adjusted standardized ratio. However, for determining whether site is statistically different from others, one should also assess 95% CI and check whether both upper and lower boundaries are also outside of the funnel area or not.
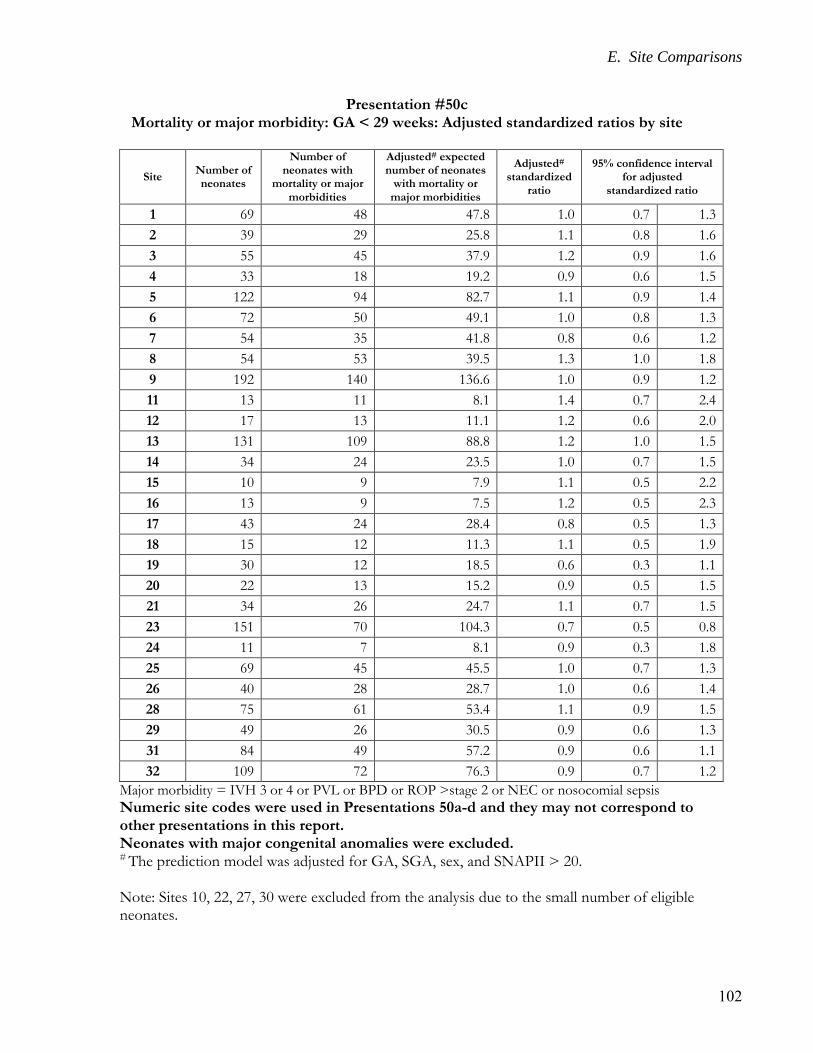
E. Site Comparisons
102
Presentation #50c Mortality or major morbidity: GA < 29 weeks: Adjusted standardized ratios by site
Site Number of neonates
Number of neonates with
mortality or major morbidities
Adjusted# expected number of neonates
with mortality or major morbidities
Adjusted# standardized
ratio
95% confidence interval for adjusted
standardized ratio
1 69 48 47.8 1.0 0.7 1.3
2 39 29 25.8 1.1 0.8 1.6
3 55 45 37.9 1.2 0.9 1.6
4 33 18 19.2 0.9 0.6 1.5
5 122 94 82.7 1.1 0.9 1.4
6 72 50 49.1 1.0 0.8 1.3
7 54 35 41.8 0.8 0.6 1.2
8 54 53 39.5 1.3 1.0 1.8
9 192 140 136.6 1.0 0.9 1.2
11 13 11 8.1 1.4 0.7 2.4
12 17 13 11.1 1.2 0.6 2.0
13 131 109 88.8 1.2 1.0 1.5
14 34 24 23.5 1.0 0.7 1.5
15 10 9 7.9 1.1 0.5 2.2
16 13 9 7.5 1.2 0.5 2.3
17 43 24 28.4 0.8 0.5 1.3
18 15 12 11.3 1.1 0.5 1.9
19 30 12 18.5 0.6 0.3 1.1
20 22 13 15.2 0.9 0.5 1.5
21 34 26 24.7 1.1 0.7 1.5
23 151 70 104.3 0.7 0.5 0.8
24 11 7 8.1 0.9 0.3 1.8
25 69 45 45.5 1.0 0.7 1.3
26 40 28 28.7 1.0 0.6 1.4
28 75 61 53.4 1.1 0.9 1.5
29 49 26 30.5 0.9 0.6 1.3
31 84 49 57.2 0.9 0.6 1.1
32 109 72 76.3 0.9 0.7 1.2
Major morbidity = IVH 3 or 4 or PVL or BPD or ROP >stage 2 or NEC or nosocomial sepsis
Numeric site codes were used in Presentations 50a-d and they may not correspond to other presentations in this report. Neonates with major congenital anomalies were excluded. # The prediction model was adjusted for GA, SGA, sex, and SNAPII > 20. Note: Sites 10, 22, 27, 30 were excluded from the analysis due to the small number of eligible neonates.

E. Site Comparisons
103
Presentation #50d Mortality or major morbidity: GA < 29 weeks: Adjusted standardized ratios by site
Explanation for Presentation 50c Column 1: Numeric site codes Column 2: Number of eligible neonates at each site (<29 weeks GA and no major anomaly) Column 3: Number of neonates with outcome of interest among those eligible neonates Column 4: Expected number of neonates with outcome of interest after adjustment for GA, SGA, sex, and SNAPII > 20 Column 5: Adjusted standardized ratio calculated based on observed death or morbidities/expected deaths or morbidities Columns 6 and 7: 95% CI around the adjusted standardized ratio for the outcome Explanation for Presentation 50d X-axis: Expected number of neonates with outcome (value from Column 4 of previous presentation) Y-axis: Adjusted standardized ratio (value from Column 5 of previous presentation) Dark points with numerical notation: Site and its location matching x and y axis values Red funnel shaped lines: 95% confidence limits based on entire network information. Sites outside of red lines represent higher or lower (depending upon position in graph) adjusted standardized ratio. However, for determining whether site is statistically different from others, one should also assess 95% CI and check whether both upper and lower boundaries are also outside of the funnel area or not.

F. Discharge Disposition and Status
104
F. Discharge Disposition and Status
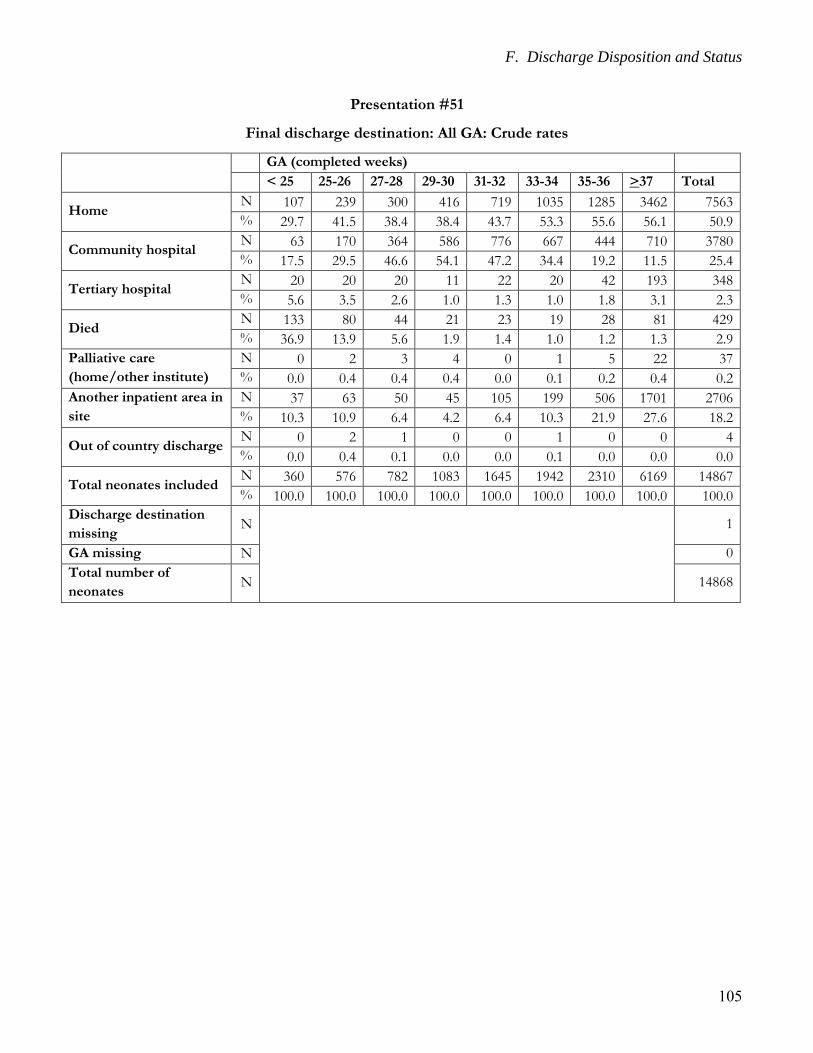
F. Discharge Disposition and Status
105
Presentation #51
Final discharge destination: All GA: Crude rates
GA (completed weeks)
< 25 25-26 27-28 29-30 31-32 33-34 35-36 >37 Total
Home N 107 239 300 416 719 1035 1285 3462 7563
% 29.7 41.5 38.4 38.4 43.7 53.3 55.6 56.1 50.9
Community hospital N 63 170 364 586 776 667 444 710 3780
% 17.5 29.5 46.6 54.1 47.2 34.4 19.2 11.5 25.4
Tertiary hospital N 20 20 20 11 22 20 42 193 348
% 5.6 3.5 2.6 1.0 1.3 1.0 1.8 3.1 2.3
Died N 133 80 44 21 23 19 28 81 429
% 36.9 13.9 5.6 1.9 1.4 1.0 1.2 1.3 2.9
Palliative care
(home/other institute)
N 0 2 3 4 0 1 5 22 37
% 0.0 0.4 0.4 0.4 0.0 0.1 0.2 0.4 0.2
Another inpatient area in
site
N 37 63 50 45 105 199 506 1701 2706
% 10.3 10.9 6.4 4.2 6.4 10.3 21.9 27.6 18.2
Out of country discharge N 0 2 1 0 0 1 0 0 4
% 0.0 0.4 0.1 0.0 0.0 0.1 0.0 0.0 0.0
Total neonates included N 360 576 782 1083 1645 1942 2310 6169 14867
% 100.0 100.0 100.0 100.0 100.0 100.0 100.0 100.0 100.0
Discharge destination
missing N
1
GA missing N 0
Total number of
neonates N 14868
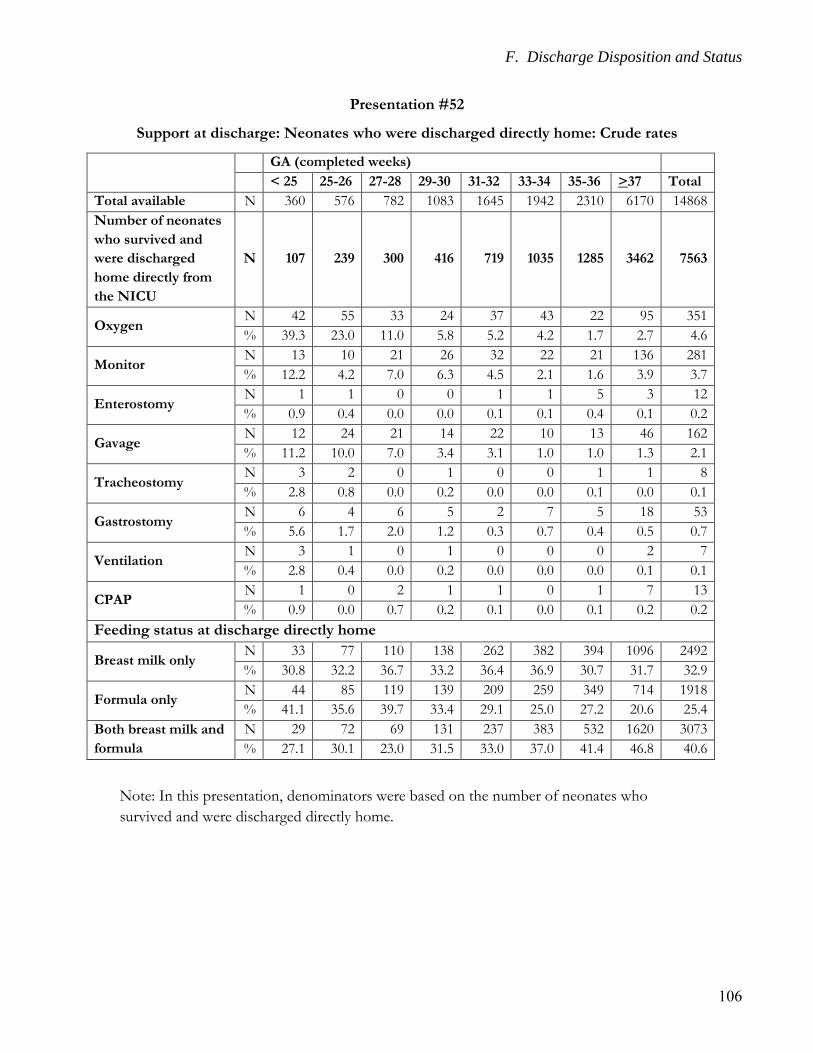
F. Discharge Disposition and Status
106
Presentation #52
Support at discharge: Neonates who were discharged directly home: Crude rates
GA (completed weeks)
< 25 25-26 27-28 29-30 31-32 33-34 35-36 >37 Total
Total available N 360 576 782 1083 1645 1942 2310 6170 14868
Number of neonates
who survived and
were discharged
home directly from
the NICU
N 107 239 300 416 719 1035 1285 3462 7563
Oxygen N 42 55 33 24 37 43 22 95 351
% 39.3 23.0 11.0 5.8 5.2 4.2 1.7 2.7 4.6
Monitor N 13 10 21 26 32 22 21 136 281
% 12.2 4.2 7.0 6.3 4.5 2.1 1.6 3.9 3.7
Enterostomy N 1 1 0 0 1 1 5 3 12
% 0.9 0.4 0.0 0.0 0.1 0.1 0.4 0.1 0.2
Gavage N 12 24 21 14 22 10 13 46 162
% 11.2 10.0 7.0 3.4 3.1 1.0 1.0 1.3 2.1
Tracheostomy N 3 2 0 1 0 0 1 1 8
% 2.8 0.8 0.0 0.2 0.0 0.0 0.1 0.0 0.1
Gastrostomy N 6 4 6 5 2 7 5 18 53
% 5.6 1.7 2.0 1.2 0.3 0.7 0.4 0.5 0.7
Ventilation N 3 1 0 1 0 0 0 2 7
% 2.8 0.4 0.0 0.2 0.0 0.0 0.0 0.1 0.1
CPAP N 1 0 2 1 1 0 1 7 13
% 0.9 0.0 0.7 0.2 0.1 0.0 0.1 0.2 0.2
Feeding status at discharge directly home
Breast milk only N 33 77 110 138 262 382 394 1096 2492
% 30.8 32.2 36.7 33.2 36.4 36.9 30.7 31.7 32.9
Formula only N 44 85 119 139 209 259 349 714 1918
% 41.1 35.6 39.7 33.4 29.1 25.0 27.2 20.6 25.4
Both breast milk and
formula
N 29 72 69 131 237 383 532 1620 3073
% 27.1 30.1 23.0 31.5 33.0 37.0 41.4 46.8 40.6
Note: In this presentation, denominators were based on the number of neonates who
survived and were discharged directly home.
G. Hypoxic Ischemic Encephalopathy
107
G. Hypoxic Ischemic Encephalopathy
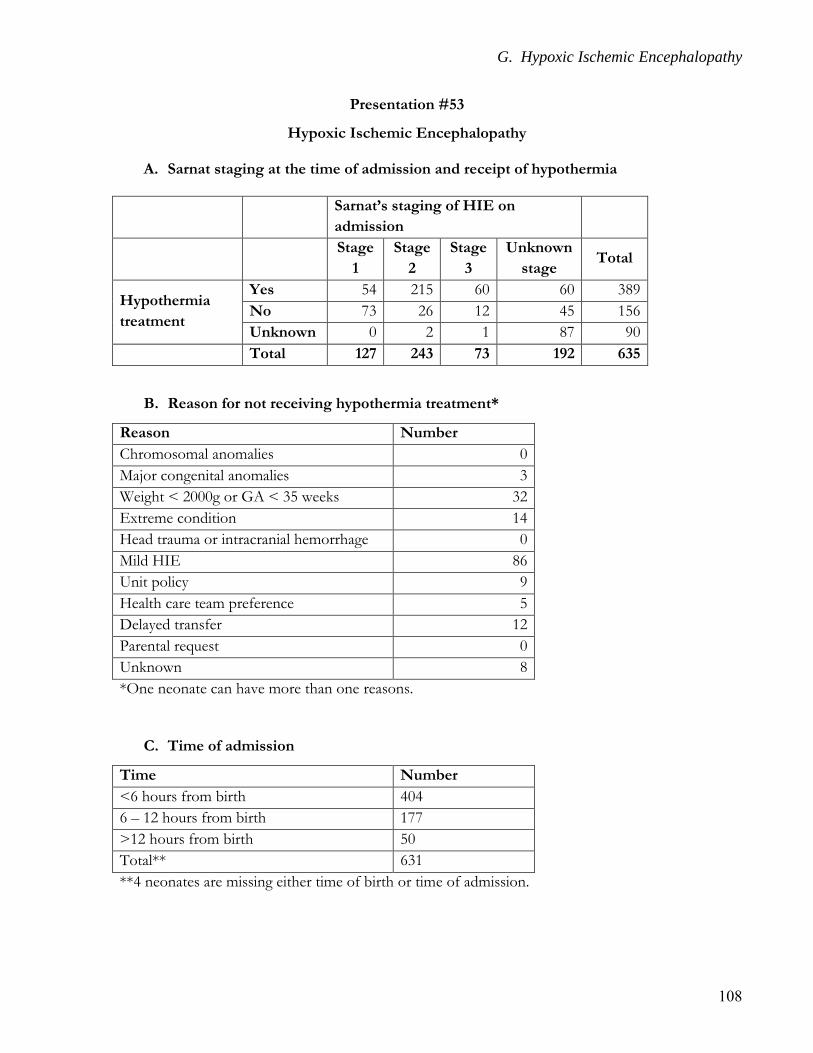
G. Hypoxic Ischemic Encephalopathy
108
Presentation #53
Hypoxic Ischemic Encephalopathy
A. Sarnat staging at the time of admission and receipt of hypothermia
Sarnat’s staging of HIE on
admission
Stage
1
Stage
2
Stage
3
Unknown
stage Total
Hypothermia
treatment
Yes 54 215 60 60 389
No 73 26 12 45 156
Unknown 0 2 1 87 90
Total 127 243 73 192 635
B. Reason for not receiving hypothermia treatment*
Reason Number
Chromosomal anomalies 0
Major congenital anomalies 3
Weight < 2000g or GA < 35 weeks 32
Extreme condition 14
Head trauma or intracranial hemorrhage 0
Mild HIE 86
Unit policy 9
Health care team preference 5
Delayed transfer 12
Parental request 0
Unknown 8
*One neonate can have more than one reasons.
C. Time of admission
Time Number
<6 hours from birth 404
6 – 12 hours from birth 177
>12 hours from birth 50
Total** 631
**4 neonates are missing either time of birth or time of admission.
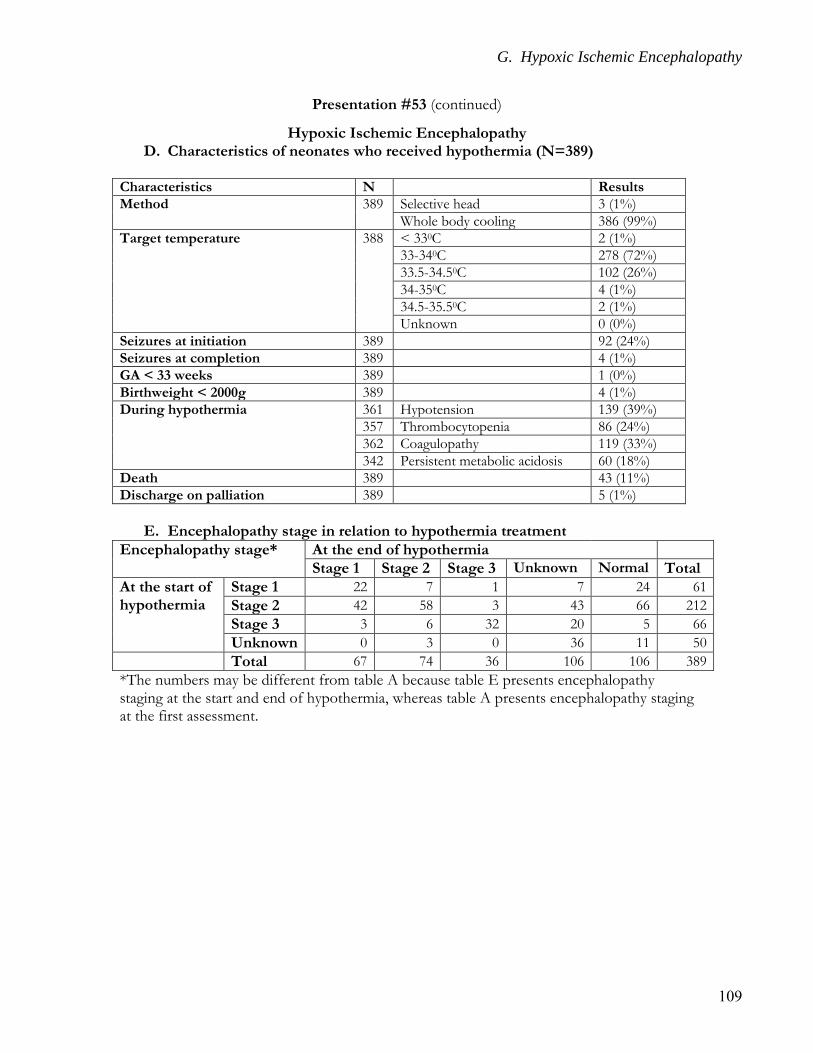
G. Hypoxic Ischemic Encephalopathy
109
Presentation #53 (continued)
Hypoxic Ischemic Encephalopathy D. Characteristics of neonates who received hypothermia (N=389)
Characteristics N Results
Method 389 Selective head 3 (1%)
Whole body cooling 386 (99%)
Target temperature 388 < 330C 2 (1%)
33-340C 278 (72%)
33.5-34.50C 102 (26%)
34-350C 4 (1%)
34.5-35.50C 2 (1%)
Unknown 0 (0%)
Seizures at initiation 389 92 (24%)
Seizures at completion 389 4 (1%)
GA < 33 weeks 389 1 (0%)
Birthweight < 2000g 389 4 (1%)
During hypothermia 361 Hypotension 139 (39%)
357 Thrombocytopenia 86 (24%)
362 Coagulopathy 119 (33%)
342 Persistent metabolic acidosis 60 (18%)
Death 389 43 (11%)
Discharge on palliation 389 5 (1%)
E. Encephalopathy stage in relation to hypothermia treatment
Encephalopathy stage*
At the end of hypothermia
Stage 1 Stage 2 Stage 3 Unknown Normal Total
At the start of hypothermia
Stage 1 22 7 1 7 24 61
Stage 2 42 58 3 43 66 212
Stage 3 3 6 32 20 5 66
Unknown 0 3 0 36 11 50
Total 67 74 36 106 106 389
*The numbers may be different from table A because table E presents encephalopathy staging at the start and end of hypothermia, whereas table A presents encephalopathy staging at the first assessment.
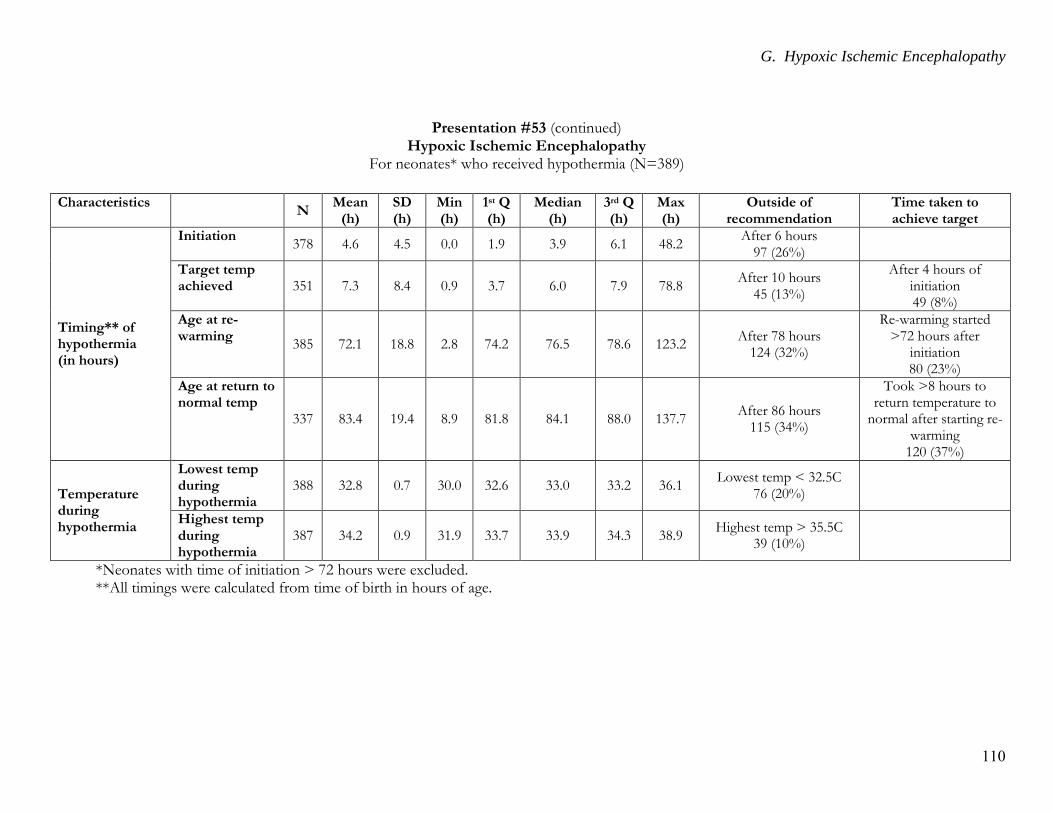
G. Hypoxic Ischemic Encephalopathy
110
Presentation #53 (continued) Hypoxic Ischemic Encephalopathy
For neonates* who received hypothermia (N=389)
Characteristics N
Mean (h)
SD (h)
Min (h)
1st Q (h)
Median (h)
3rd Q (h)
Max (h)
Outside of recommendation
Time taken to achieve target
Timing** of hypothermia (in hours)
Initiation 378 4.6 4.5 0.0 1.9 3.9 6.1 48.2
After 6 hours 97 (26%)
Target temp achieved 351 7.3 8.4 0.9 3.7 6.0 7.9 78.8
After 10 hours 45 (13%)
After 4 hours of initiation 49 (8%)
Age at re-warming
385 72.1 18.8 2.8 74.2 76.5 78.6 123.2 After 78 hours
124 (32%)
Re-warming started >72 hours after
initiation 80 (23%)
Age at return to normal temp
337 83.4 19.4 8.9 81.8 84.1 88.0 137.7 After 86 hours
115 (34%)
Took >8 hours to return temperature to
normal after starting re-warming
120 (37%)
Temperature during hypothermia
Lowest temp during hypothermia
388 32.8 0.7 30.0 32.6 33.0 33.2 36.1 Lowest temp < 32.5C
76 (20%)
Highest temp during hypothermia
387 34.2 0.9 31.9 33.7 33.9 34.3 38.9 Highest temp > 35.5C
39 (10%)
*Neonates with time of initiation > 72 hours were excluded. **All timings were calculated from time of birth in hours of age.
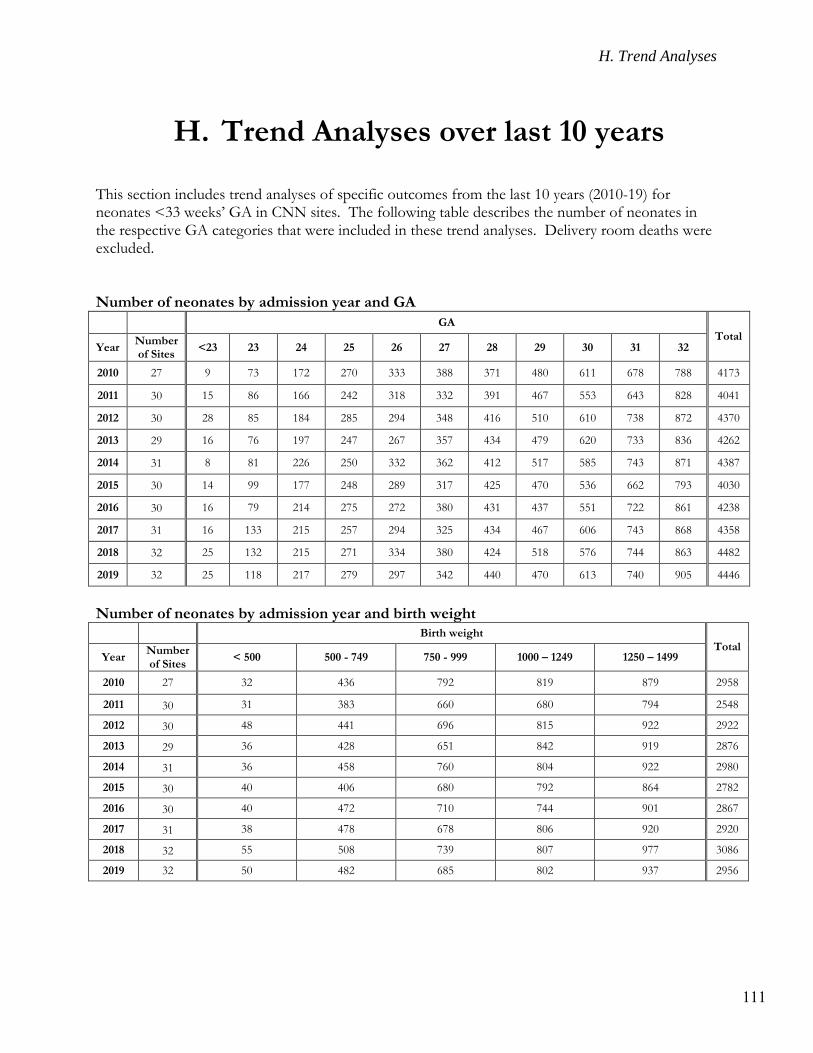
H. Trend Analyses
111
H. Trend Analyses over last 10 years This section includes trend analyses of specific outcomes from the last 10 years (2010-19) for neonates <33 weeks’ GA in CNN sites. The following table describes the number of neonates in the respective GA categories that were included in these trend analyses. Delivery room deaths were excluded. Number of neonates by admission year and GA
GA
Total Year
Number of Sites
<23 23 24 25 26 27 28 29 30 31 32
2010
27
9 73 172 270 333 388 371 480 611 678 788 4173
2011
30 15 86 166 242 318 332 391 467 553 643 828 4041
2012
30 28 85 184 285 294 348 416 510 610 738 872 4370
2013
29 16 76 197 247 267 357 434 479 620 733 836 4262
2014
31 8 81 226 250 332 362 412 517 585 743 871 4387
2015
30 14 99 177 248 289 317 425 470 536 662 793 4030
2016
30 16 79 214 275 272 380 431 437 551 722 861 4238
2017
31 16 133 215 257 294 325 434 467 606 743 868 4358
2018
32 25 132 215 271 334 380 424 518 576 744 863 4482
2019 32 25 118 217 279 297 342 440 470 613 740 905 4446
Number of neonates by admission year and birth weight
Birth weight
Total Year
Number of Sites
< 500 500 - 749 750 - 999 1000 – 1249 1250 – 1499
2010
27
32 436 792 819 879 2958
2011
30 31 383 660 680 794 2548
2012
30 48 441 696 815 922 2922
2013
29 36 428 651 842 919 2876
2014
31 36 458 760 804 922 2980
2015
30 40 406 680 792 864 2782
2016
30 40 472 710 744 901 2867
2017
31 38 478 678 806 920 2920
2018
32 55 508 739 807 977 3086
2019 32 50 482 685 802 937 2956
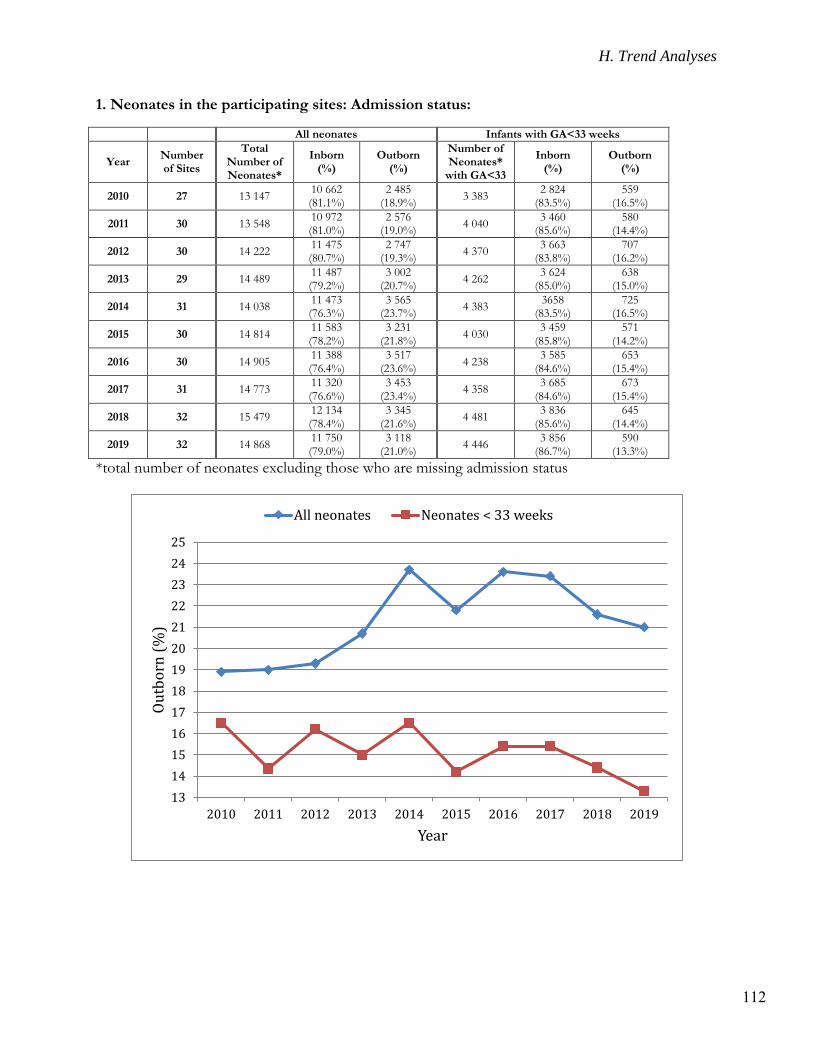
H. Trend Analyses
112
1. Neonates in the participating sites: Admission status:
All neonates Infants with GA<33 weeks
Year Number of Sites
Total Number of Neonates*
Inborn (%)
Outborn (%)
Number of Neonates*
with GA<33
Inborn (%)
Outborn (%)
2010 27 13 147 10 662 (81.1%)
2 485 (18.9%)
3 383 2 824
(83.5%) 559
(16.5%)
2011 30 13 548 10 972 (81.0%)
2 576 (19.0%)
4 040 3 460
(85.6%) 580
(14.4%)
2012 30 14 222 11 475 (80.7%)
2 747 (19.3%)
4 370 3 663
(83.8%) 707
(16.2%)
2013 29 14 489 11 487 (79.2%)
3 002 (20.7%)
4 262 3 624
(85.0%) 638
(15.0%)
2014 31 14 038 11 473 (76.3%)
3 565 (23.7%)
4 383 3658
(83.5%) 725
(16.5%)
2015 30 14 814 11 583 (78.2%)
3 231 (21.8%)
4 030 3 459
(85.8%) 571
(14.2%)
2016 30 14 905 11 388 (76.4%)
3 517 (23.6%)
4 238 3 585
(84.6%) 653
(15.4%)
2017 31 14 773 11 320 (76.6%)
3 453 (23.4%)
4 358 3 685
(84.6%) 673
(15.4%)
2018 32 15 479 12 134 (78.4%)
3 345 (21.6%)
4 481 3 836
(85.6%) 645
(14.4%)
2019 32 14 868 11 750 (79.0%)
3 118 (21.0%)
4 446 3 856
(86.7%) 590
(13.3%)
*total number of neonates excluding those who are missing admission status
13
14
15
16
17
18
19
20
21
22
23
24
25
2010 2011 2012 2013 2014 2015 2016 2017 2018 2019
Ou
tbo
rn (
%)
Year
All neonates Neonates < 33 weeks
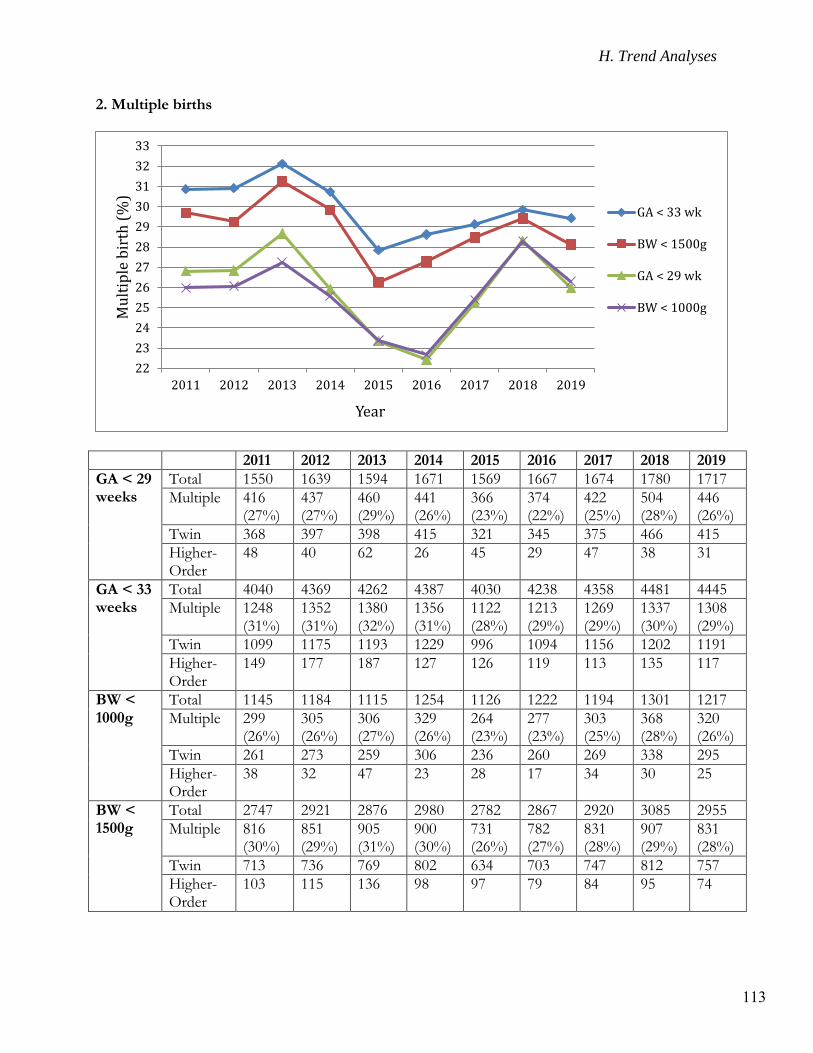
H. Trend Analyses
113
2. Multiple births
2011 2012 2013 2014 2015 2016 2017 2018 2019
GA < 29 weeks
Total 1550 1639 1594 1671 1569 1667 1674 1780 1717
Multiple 416 (27%)
437 (27%)
460 (29%)
441 (26%)
366 (23%)
374 (22%)
422 (25%)
504 (28%)
446 (26%)
Twin 368 397 398 415 321 345 375 466 415
Higher-Order
48 40 62 26 45 29 47 38 31
GA < 33 weeks
Total 4040 4369 4262 4387 4030 4238 4358 4481 4445
Multiple 1248 (31%)
1352 (31%)
1380 (32%)
1356 (31%)
1122 (28%)
1213 (29%)
1269 (29%)
1337 (30%)
1308 (29%)
Twin 1099 1175 1193 1229 996 1094 1156 1202 1191
Higher-Order
149 177 187 127 126 119 113 135 117
BW < 1000g
Total 1145 1184 1115 1254 1126 1222 1194 1301 1217
Multiple 299 (26%)
305 (26%)
306 (27%)
329 (26%)
264 (23%)
277 (23%)
303 (25%)
368 (28%)
320 (26%)
Twin 261 273 259 306 236 260 269 338 295
Higher-Order
38 32 47 23 28 17 34 30 25
BW < 1500g
Total 2747 2921 2876 2980 2782 2867 2920 3085 2955
Multiple 816 (30%)
851 (29%)
905 (31%)
900 (30%)
731 (26%)
782 (27%)
831 (28%)
907 (29%)
831 (28%)
Twin 713 736 769 802 634 703 747 812 757
Higher-Order
103 115 136 98 97 79 84 95 74
22
23
24
25
26
27
28
29
30
31
32
33
2011 2012 2013 2014 2015 2016 2017 2018 2019
Mu
ltip
le b
irth
(%
)
Year
GA < 33 wk
BW < 1500g
GA < 29 wk
BW < 1000g
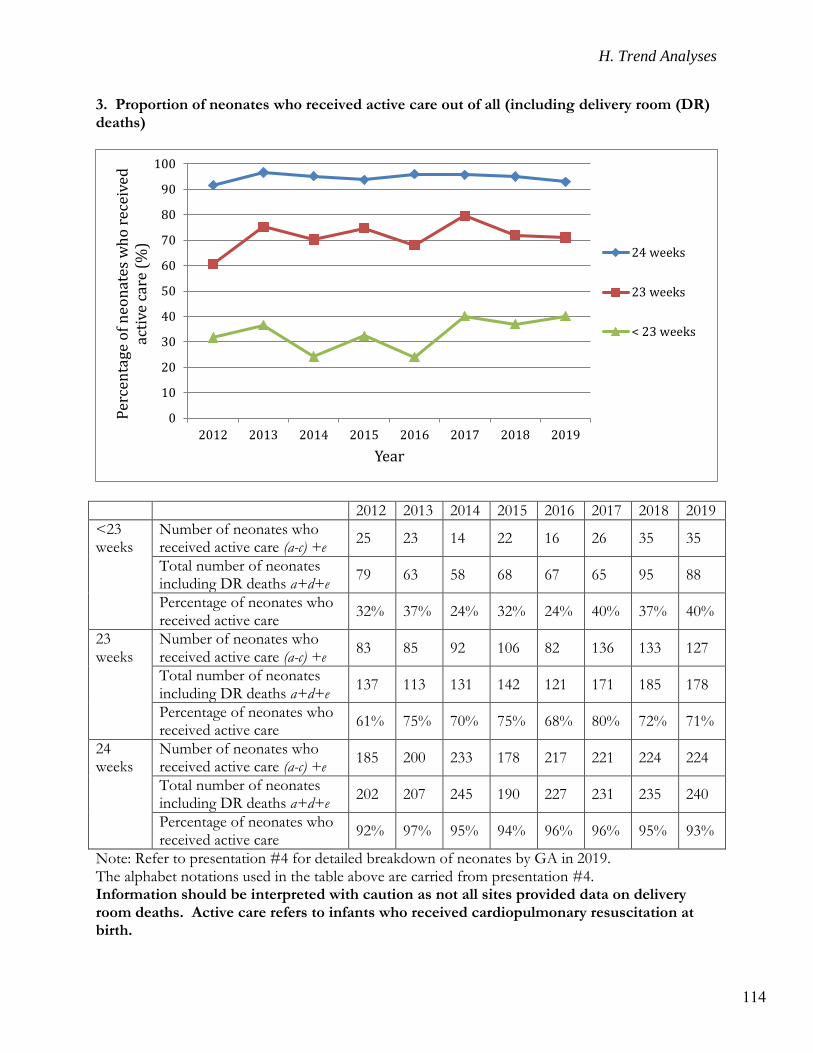
H. Trend Analyses
114
3. Proportion of neonates who received active care out of all (including delivery room (DR) deaths)
2012 2013 2014 2015 2016 2017 2018 2019
<23 weeks
Number of neonates who received active care (a-c) +e
25 23 14 22 16 26 35 35
Total number of neonates including DR deaths a+d+e
79 63 58 68 67 65 95 88
Percentage of neonates who received active care
32% 37% 24% 32% 24% 40% 37% 40%
23 weeks
Number of neonates who received active care (a-c) +e
83 85 92 106 82 136 133 127
Total number of neonates including DR deaths a+d+e
137 113 131 142 121 171 185 178
Percentage of neonates who received active care
61% 75% 70% 75% 68% 80% 72% 71%
24 weeks
Number of neonates who received active care (a-c) +e
185 200 233 178 217 221 224 224
Total number of neonates including DR deaths a+d+e
202 207 245 190 227 231 235 240
Percentage of neonates who received active care
92% 97% 95% 94% 96% 96% 95% 93%
Note: Refer to presentation #4 for detailed breakdown of neonates by GA in 2019. The alphabet notations used in the table above are carried from presentation #4. Information should be interpreted with caution as not all sites provided data on delivery room deaths. Active care refers to infants who received cardiopulmonary resuscitation at birth.
0
10
20
30
40
50
60
70
80
90
100
2012 2013 2014 2015 2016 2017 2018 2019
Per
cen
tage
of
neo
nat
es w
ho
rec
eive
d
acti
ve c
are
(%)
Year
24 weeks
23 weeks
< 23 weeks
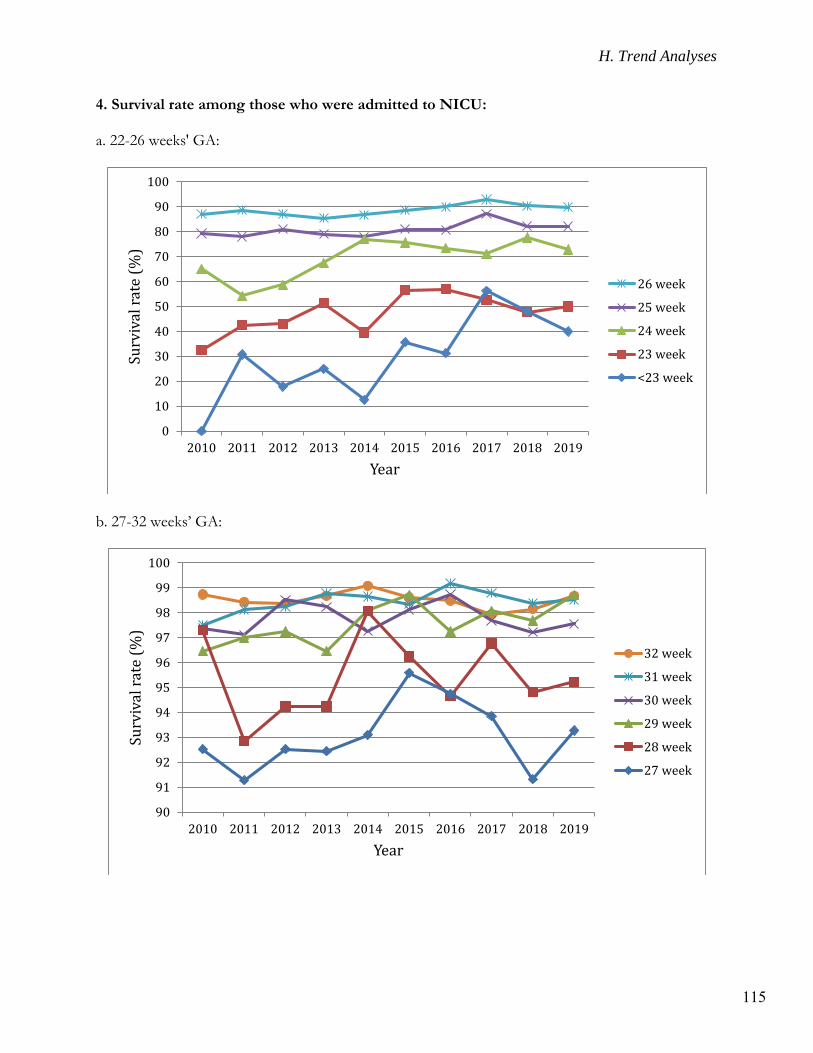
H. Trend Analyses
115
4. Survival rate among those who were admitted to NICU: a. 22-26 weeks' GA:
b. 27-32 weeks’ GA:
0
10
20
30
40
50
60
70
80
90
100
2010 2011 2012 2013 2014 2015 2016 2017 2018 2019
Surv
ival
rat
e (%
)
Year
26 week
25 week
24 week
23 week
<23 week
90
91
92
93
94
95
96
97
98
99
100
2010 2011 2012 2013 2014 2015 2016 2017 2018 2019
Surv
ival
rat
e (%
)
Year
32 week
31 week
30 week
29 week
28 week
27 week
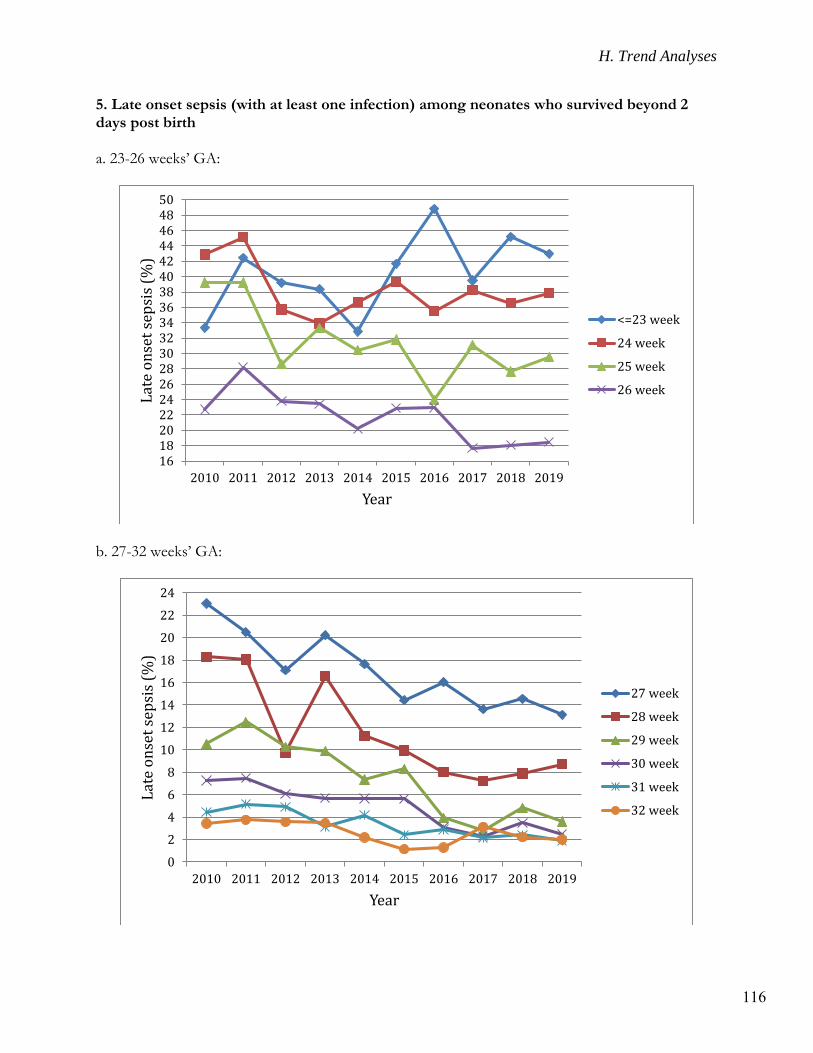
H. Trend Analyses
116
5. Late onset sepsis (with at least one infection) among neonates who survived beyond 2 days post birth a. 23-26 weeks’ GA:
b. 27-32 weeks’ GA:
161820222426283032343638404244464850
2010 2011 2012 2013 2014 2015 2016 2017 2018 2019
Lat
e o
nse
t se
psi
s (%
)
Year
<=23 week
24 week
25 week
26 week
0
2
4
6
8
10
12
14
16
18
20
22
24
2010 2011 2012 2013 2014 2015 2016 2017 2018 2019
Lat
e o
nse
t se
psi
s (%
)
Year
27 week
28 week
29 week
30 week
31 week
32 week
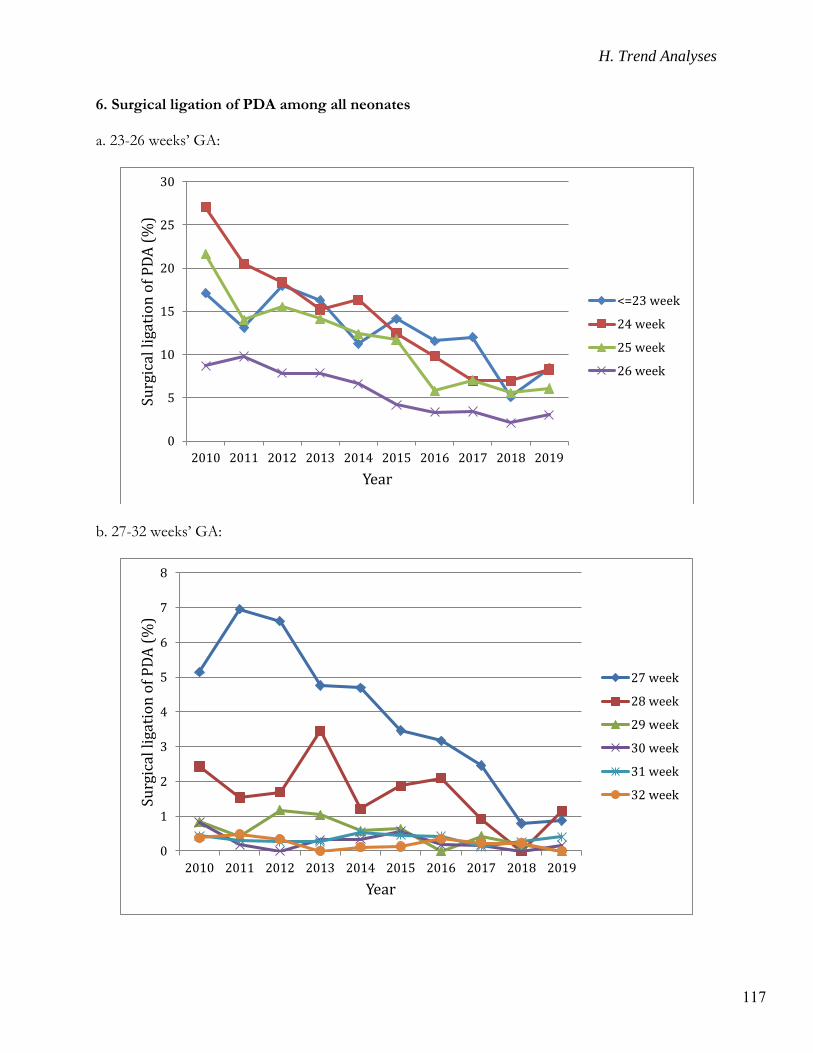
H. Trend Analyses
117
6. Surgical ligation of PDA among all neonates a. 23-26 weeks’ GA:
b. 27-32 weeks’ GA:
0
5
10
15
20
25
30
2010 2011 2012 2013 2014 2015 2016 2017 2018 2019
Surg
ical
lig
atio
n o
f P
DA
(%
)
Year
<=23 week
24 week
25 week
26 week
0
1
2
3
4
5
6
7
8
2010 2011 2012 2013 2014 2015 2016 2017 2018 2019
Surg
ical
lig
atio
n o
f P
DA
(%
)
Year
27 week
28 week
29 week
30 week
31 week
32 week
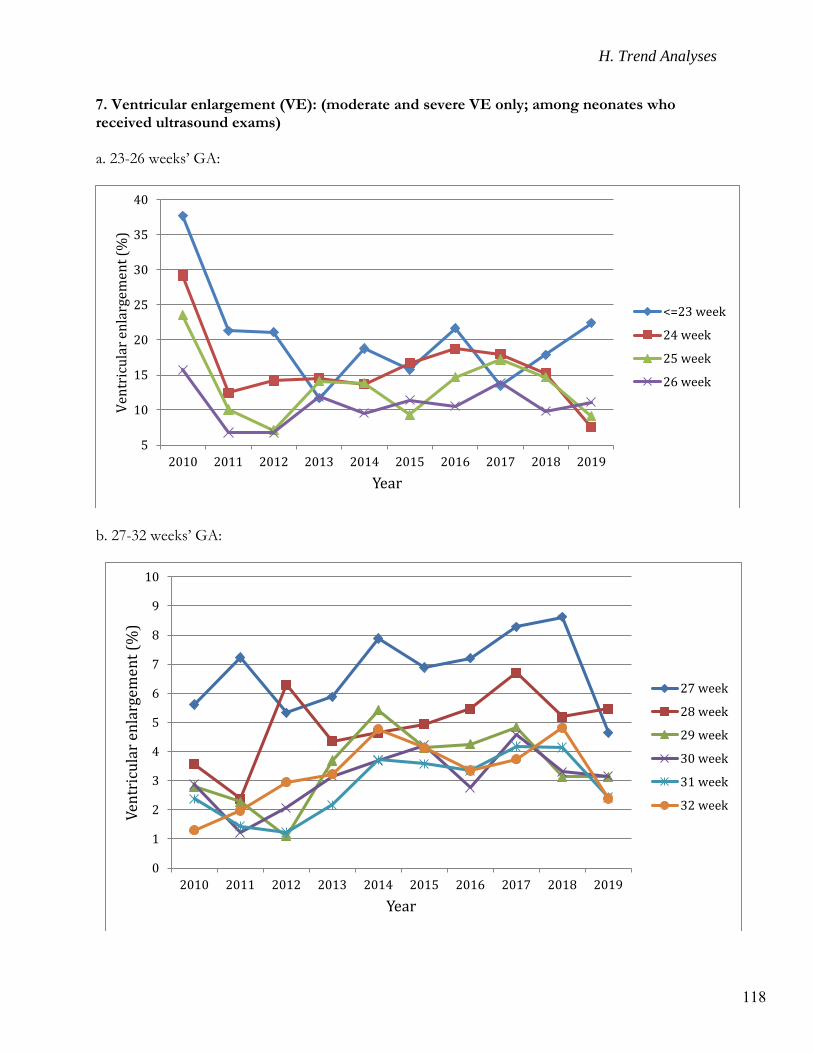
H. Trend Analyses
118
7. Ventricular enlargement (VE): (moderate and severe VE only; among neonates who received ultrasound exams) a. 23-26 weeks’ GA:
b. 27-32 weeks’ GA:
5
10
15
20
25
30
35
40
2010 2011 2012 2013 2014 2015 2016 2017 2018 2019
Ven
tric
ula
r en
larg
emen
t (%
)
Year
<=23 week
24 week
25 week
26 week
0
1
2
3
4
5
6
7
8
9
10
2010 2011 2012 2013 2014 2015 2016 2017 2018 2019
Ven
tric
ula
r en
larg
emen
t (%
)
Year
27 week
28 week
29 week
30 week
31 week
32 week
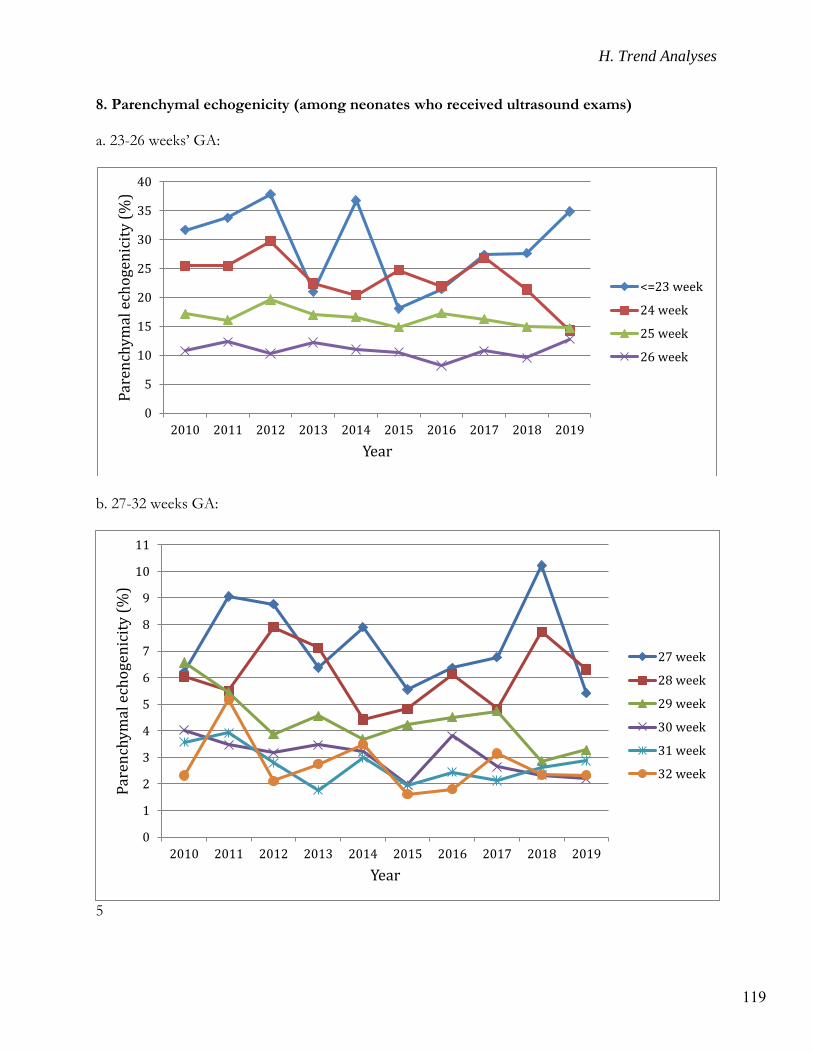
H. Trend Analyses
119
8. Parenchymal echogenicity (among neonates who received ultrasound exams) a. 23-26 weeks’ GA:
b. 27-32 weeks GA:
5
0
5
10
15
20
25
30
35
40
2010 2011 2012 2013 2014 2015 2016 2017 2018 2019
Par
ench
ymal
ech
oge
nic
ity
(%
)
Year
<=23 week
24 week
25 week
26 week
0
1
2
3
4
5
6
7
8
9
10
11
2010 2011 2012 2013 2014 2015 2016 2017 2018 2019
Par
ench
ymal
ech
oge
nic
ity
(%
)
Year
27 week
28 week
29 week
30 week
31 week
32 week
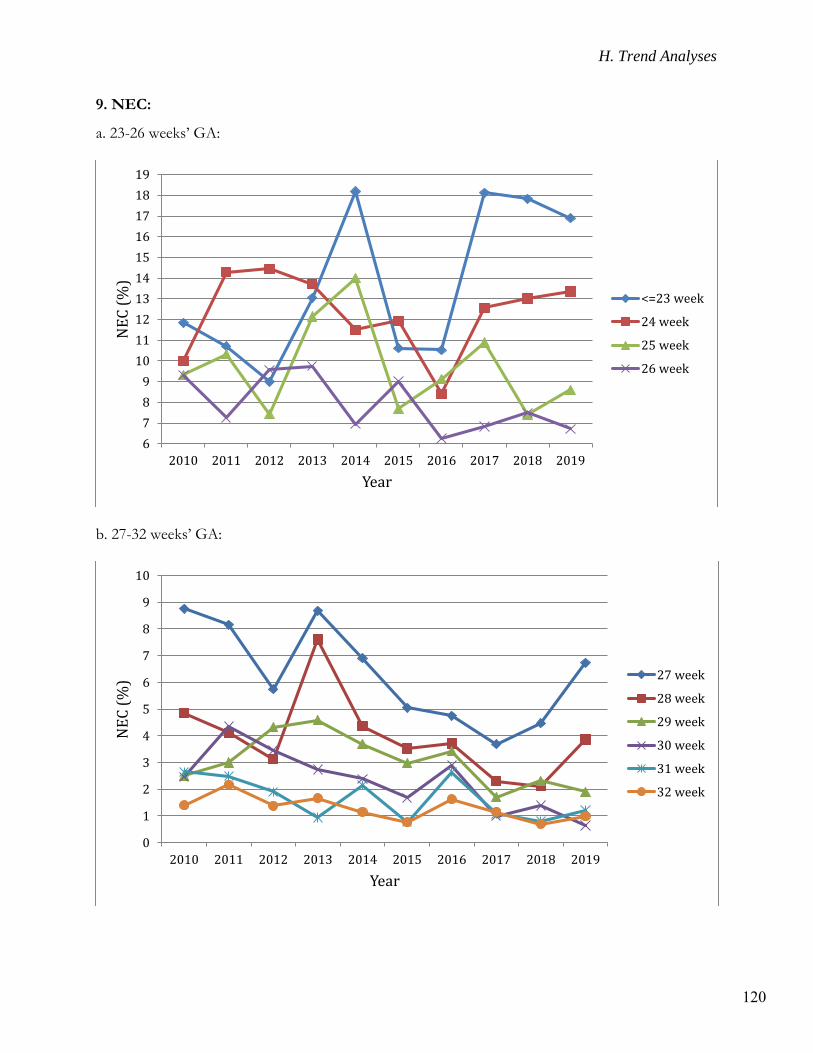
H. Trend Analyses
120
9. NEC:
a. 23-26 weeks’ GA:
b. 27-32 weeks’ GA:
6
7
8
9
10
11
12
13
14
15
16
17
18
19
2010 2011 2012 2013 2014 2015 2016 2017 2018 2019
NE
C (
%)
Year
<=23 week
24 week
25 week
26 week
0
1
2
3
4
5
6
7
8
9
10
2010 2011 2012 2013 2014 2015 2016 2017 2018 2019
NE
C (
%)
Year
27 week
28 week
29 week
30 week
31 week
32 week
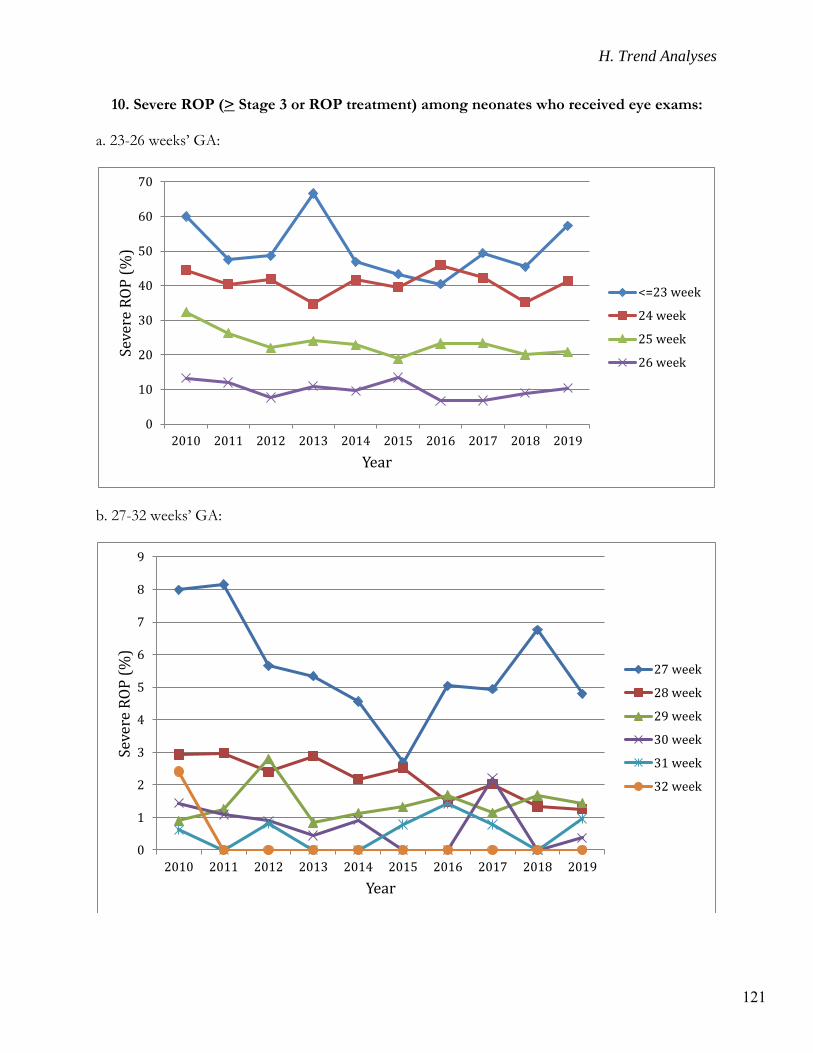
H. Trend Analyses
121
10. Severe ROP (> Stage 3 or ROP treatment) among neonates who received eye exams: a. 23-26 weeks’ GA:
b. 27-32 weeks’ GA:
0
10
20
30
40
50
60
70
2010 2011 2012 2013 2014 2015 2016 2017 2018 2019
Seve
re R
OP
(%
)
Year
<=23 week
24 week
25 week
26 week
0
1
2
3
4
5
6
7
8
9
2010 2011 2012 2013 2014 2015 2016 2017 2018 2019
Seve
re R
OP
(%
)
Year
27 week
28 week
29 week
30 week
31 week
32 week
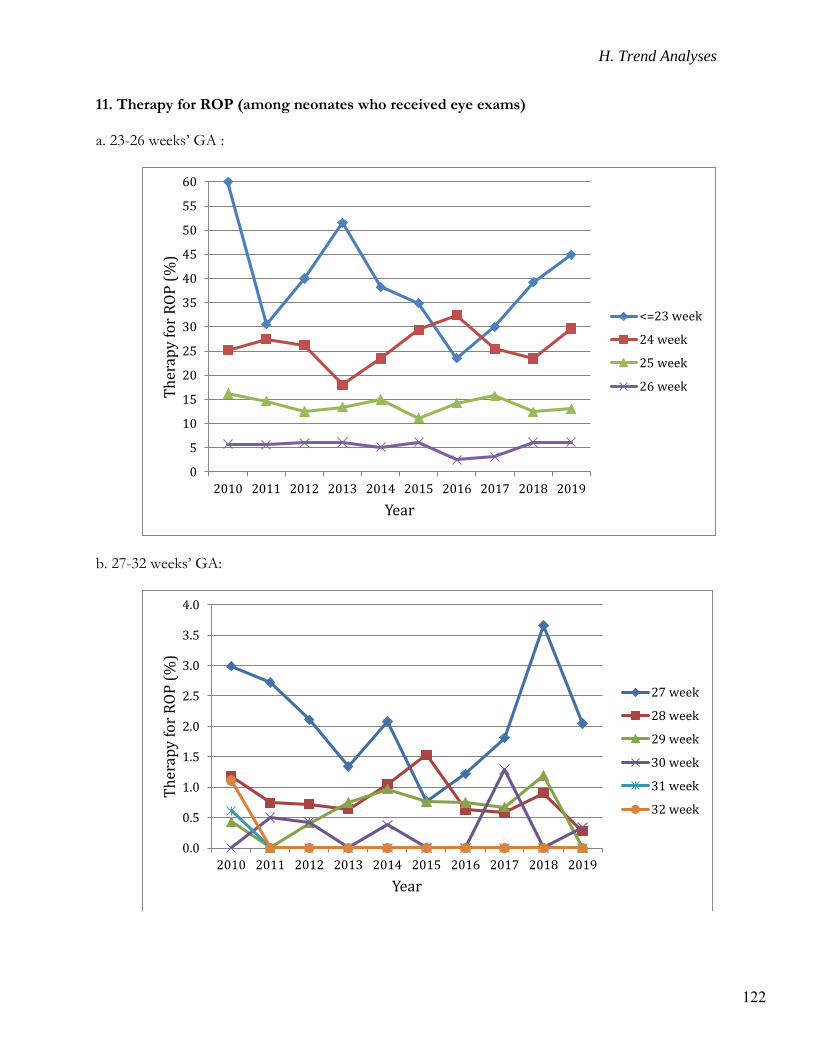
H. Trend Analyses
122
11. Therapy for ROP (among neonates who received eye exams) a. 23-26 weeks’ GA :
b. 27-32 weeks’ GA:
0
5
10
15
20
25
30
35
40
45
50
55
60
2010 2011 2012 2013 2014 2015 2016 2017 2018 2019
Th
erap
y fo
r R
OP
(%
)
Year
<=23 week
24 week
25 week
26 week
0.0
0.5
1.0
1.5
2.0
2.5
3.0
3.5
4.0
2010 2011 2012 2013 2014 2015 2016 2017 2018 2019
Th
erap
y f
or
RO
P (
%)
Year
27 week
28 week
29 week
30 week
31 week
32 week
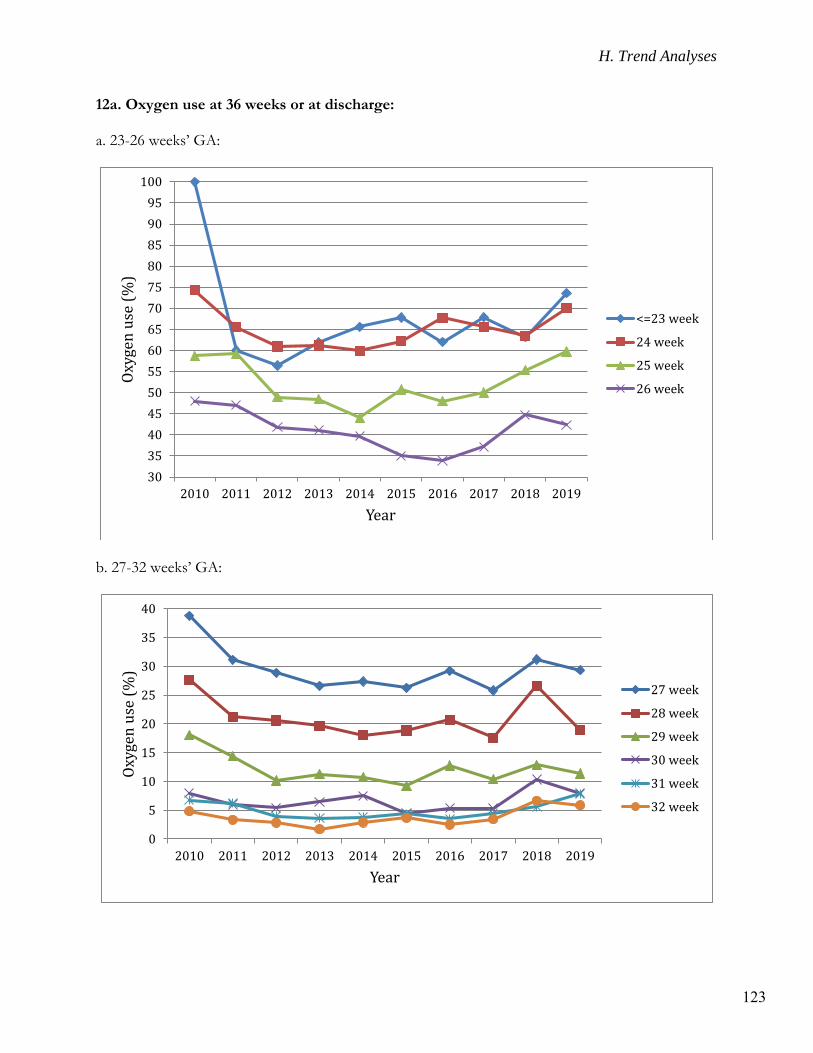
H. Trend Analyses
123
12a. Oxygen use at 36 weeks or at discharge: a. 23-26 weeks’ GA:
b. 27-32 weeks’ GA:
30
35
40
45
50
55
60
65
70
75
80
85
90
95
100
2010 2011 2012 2013 2014 2015 2016 2017 2018 2019
Oxy
gen
use
(%
)
Year
<=23 week
24 week
25 week
26 week
0
5
10
15
20
25
30
35
40
2010 2011 2012 2013 2014 2015 2016 2017 2018 2019
Oxy
gen
use
(%
)
Year
27 week
28 week
29 week
30 week
31 week
32 week
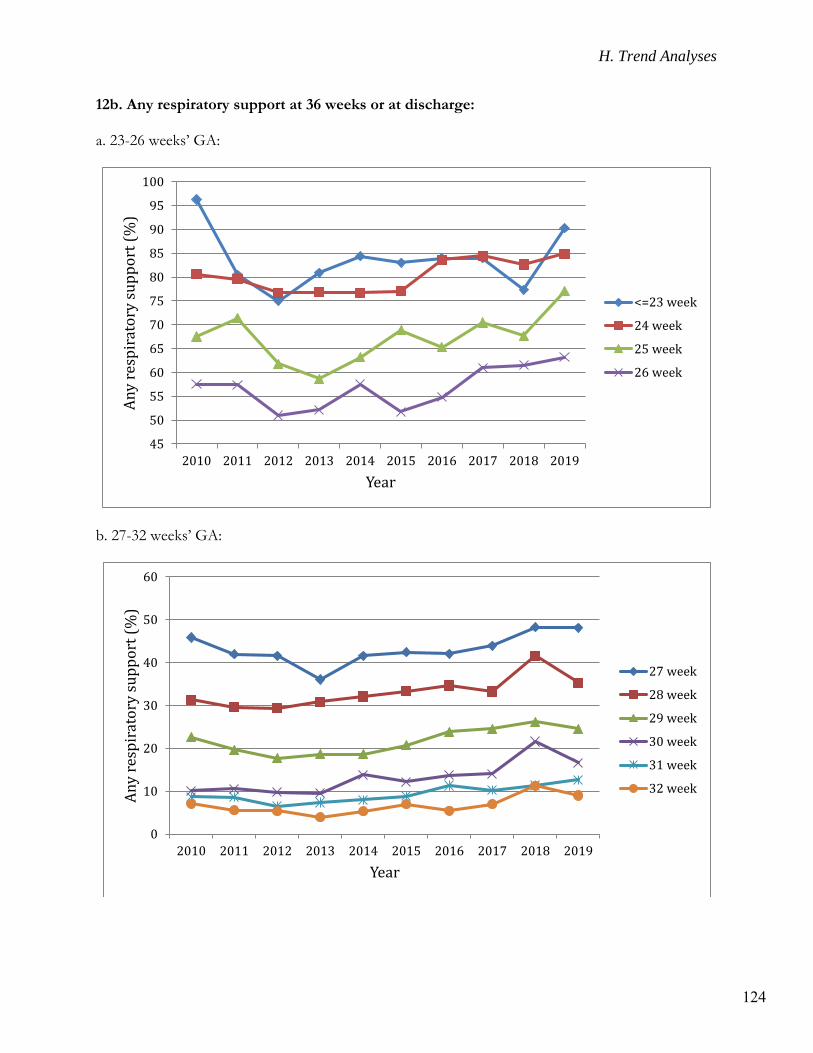
H. Trend Analyses
124
12b. Any respiratory support at 36 weeks or at discharge: a. 23-26 weeks’ GA:
b. 27-32 weeks’ GA:
45
50
55
60
65
70
75
80
85
90
95
100
2010 2011 2012 2013 2014 2015 2016 2017 2018 2019
An
y re
spir
ato
ry s
up
po
rt (
%)
Year
<=23 week
24 week
25 week
26 week
0
10
20
30
40
50
60
2010 2011 2012 2013 2014 2015 2016 2017 2018 2019
An
y re
spir
ato
ry s
up
po
rt (
%)
Year
27 week
28 week
29 week
30 week
31 week
32 week
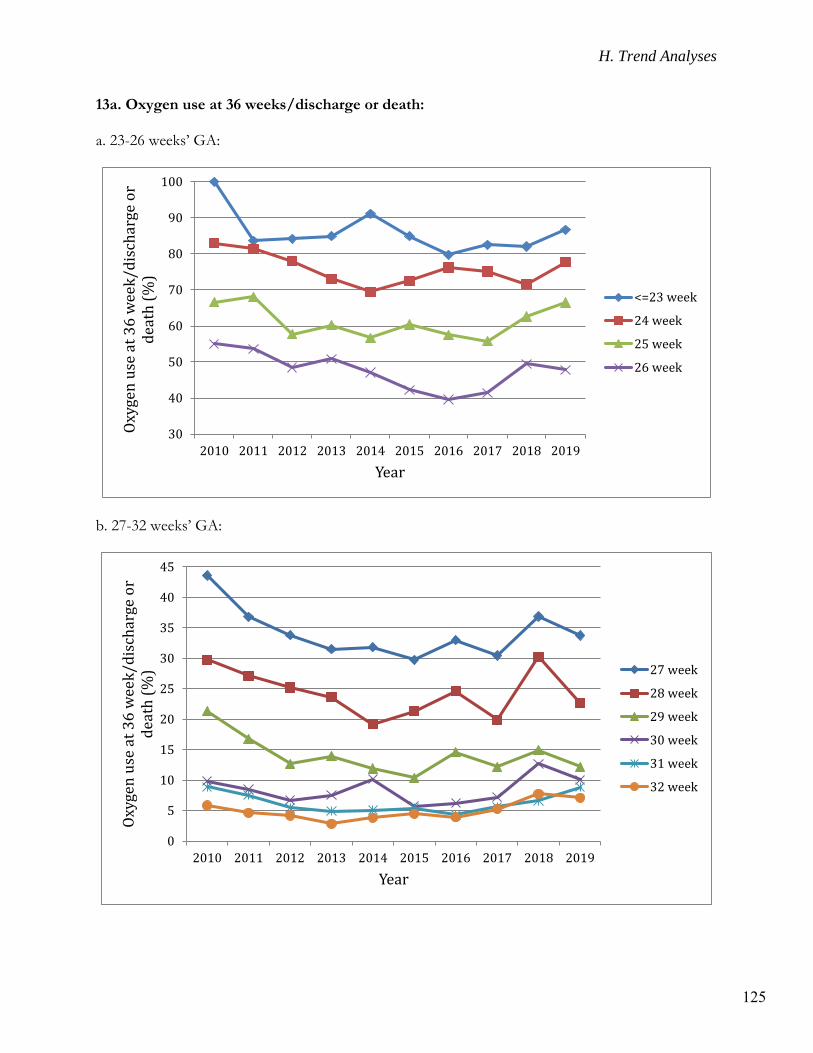
H. Trend Analyses
125
13a. Oxygen use at 36 weeks/discharge or death: a. 23-26 weeks’ GA:
b. 27-32 weeks’ GA:
30
40
50
60
70
80
90
100
2010 2011 2012 2013 2014 2015 2016 2017 2018 2019
Oxy
gen
use
at
36
wee
k/d
isch
arge
or
dea
th (
%)
Year
<=23 week
24 week
25 week
26 week
0
5
10
15
20
25
30
35
40
45
2010 2011 2012 2013 2014 2015 2016 2017 2018 2019
Oxy
gen
use
at
36
wee
k/d
isch
arge
or
dea
th (
%)
Year
27 week
28 week
29 week
30 week
31 week
32 week
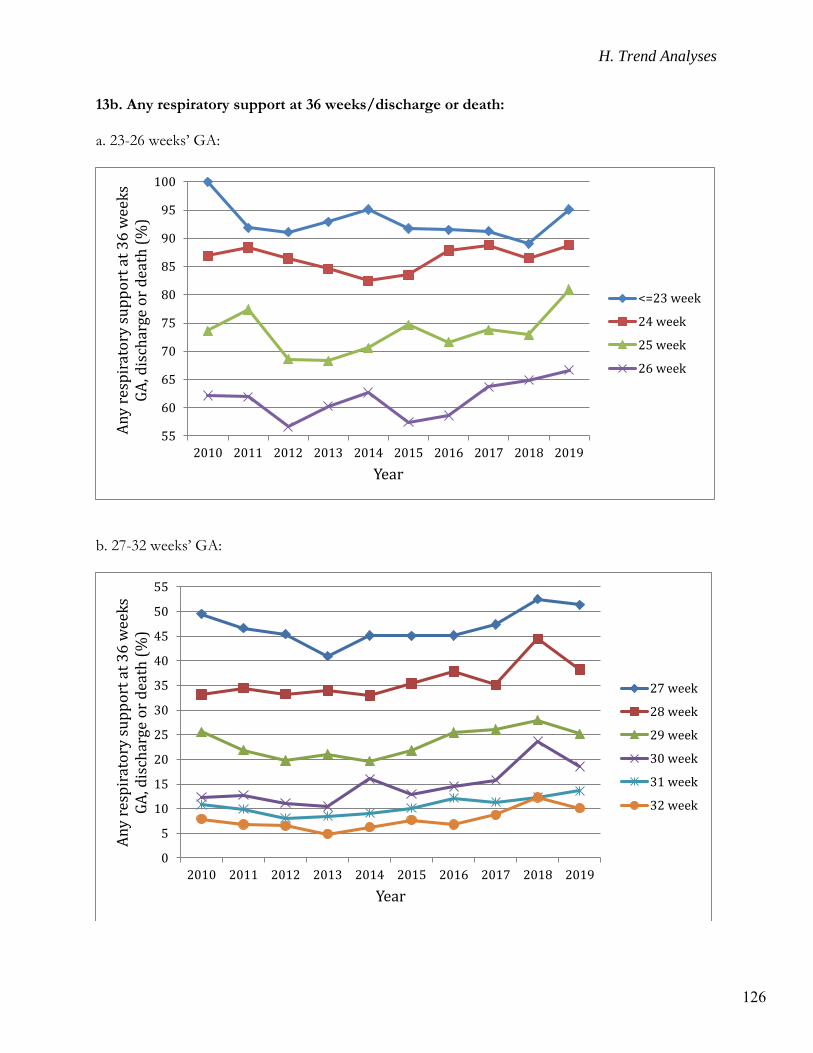
H. Trend Analyses
126
13b. Any respiratory support at 36 weeks/discharge or death: a. 23-26 weeks’ GA:
b. 27-32 weeks’ GA:
55
60
65
70
75
80
85
90
95
100
2010 2011 2012 2013 2014 2015 2016 2017 2018 2019
An
y re
spir
ato
ry s
up
po
rt a
t 3
6 w
eek
s G
A, d
isch
arge
or
dea
th (
%)
Year
<=23 week
24 week
25 week
26 week
0
5
10
15
20
25
30
35
40
45
50
55
2010 2011 2012 2013 2014 2015 2016 2017 2018 2019
An
y re
spir
ato
ry s
up
po
rt a
t 3
6 w
eek
s G
A, d
isch
arge
or
dea
th (
%)
Year
27 week
28 week
29 week
30 week
31 week
32 week
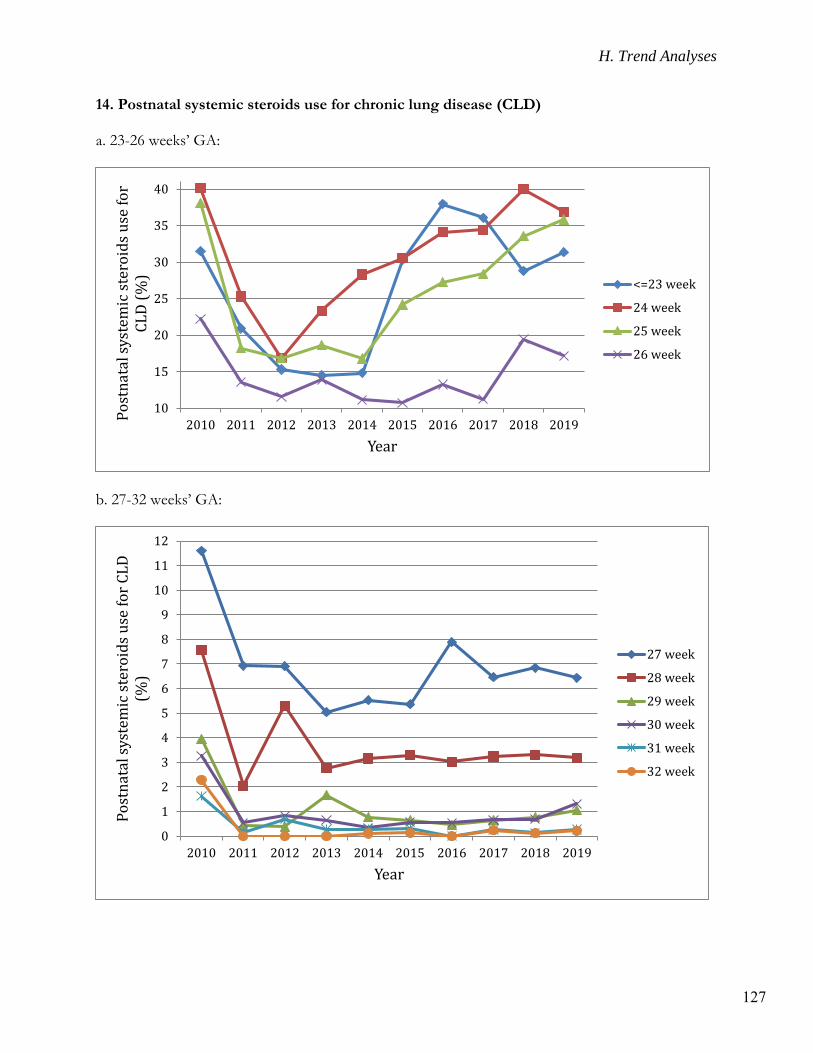
H. Trend Analyses
127
14. Postnatal systemic steroids use for chronic lung disease (CLD) a. 23-26 weeks’ GA:
b. 27-32 weeks’ GA:
10
15
20
25
30
35
40
2010 2011 2012 2013 2014 2015 2016 2017 2018 2019
Po
stn
atal
sys
tem
ic s
tero
ids
use
fo
r C
LD
(%
)
Year
<=23 week
24 week
25 week
26 week
0
1
2
3
4
5
6
7
8
9
10
11
12
2010 2011 2012 2013 2014 2015 2016 2017 2018 2019
Po
stn
atal
sys
tem
ic s
tero
ids
use
fo
r C
LD
(%
)
Year
27 week
28 week
29 week
30 week
31 week
32 week
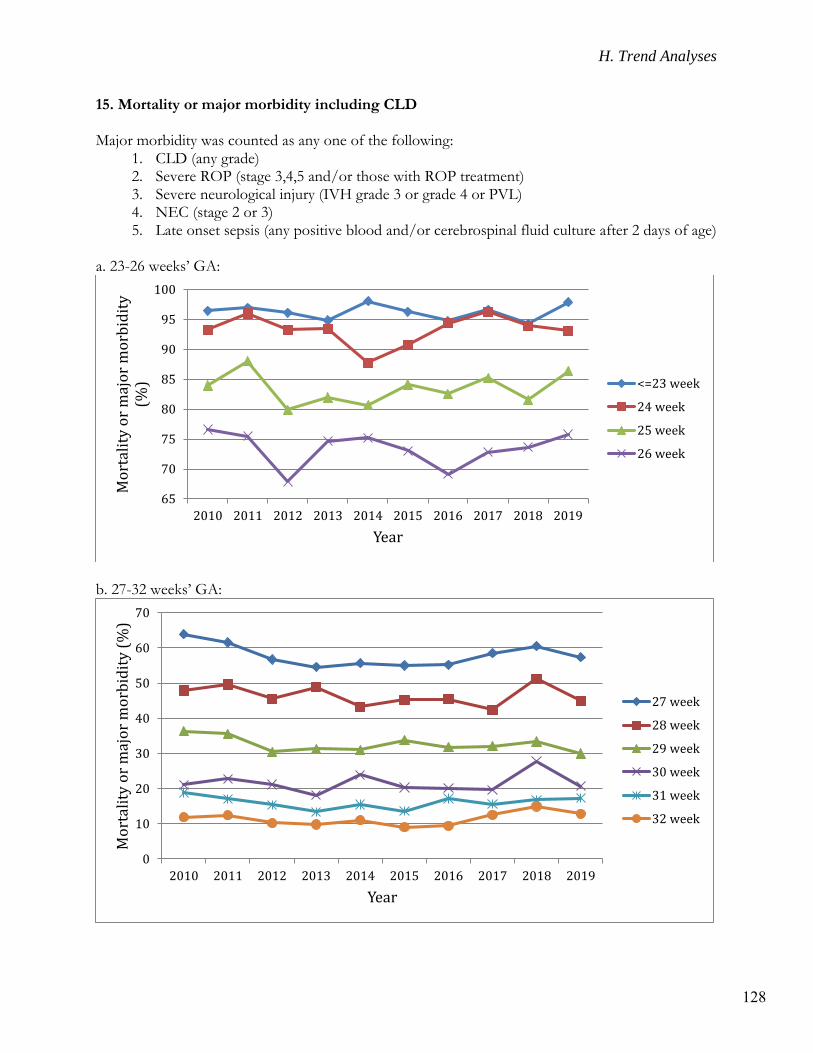
H. Trend Analyses
128
15. Mortality or major morbidity including CLD Major morbidity was counted as any one of the following:
1. CLD (any grade) 2. Severe ROP (stage 3,4,5 and/or those with ROP treatment) 3. Severe neurological injury (IVH grade 3 or grade 4 or PVL) 4. NEC (stage 2 or 3) 5. Late onset sepsis (any positive blood and/or cerebrospinal fluid culture after 2 days of age)
a. 23-26 weeks’ GA:
b. 27-32 weeks’ GA:
65
70
75
80
85
90
95
100
2010 2011 2012 2013 2014 2015 2016 2017 2018 2019
Mo
rtal
ity
or
maj
or
mo
rbid
ity
(%
)
Year
<=23 week
24 week
25 week
26 week
0
10
20
30
40
50
60
70
2010 2011 2012 2013 2014 2015 2016 2017 2018 2019
Mo
rtal
ity
or
maj
or
mo
rbid
ity
(%
)
Year
27 week
28 week
29 week
30 week
31 week
32 week
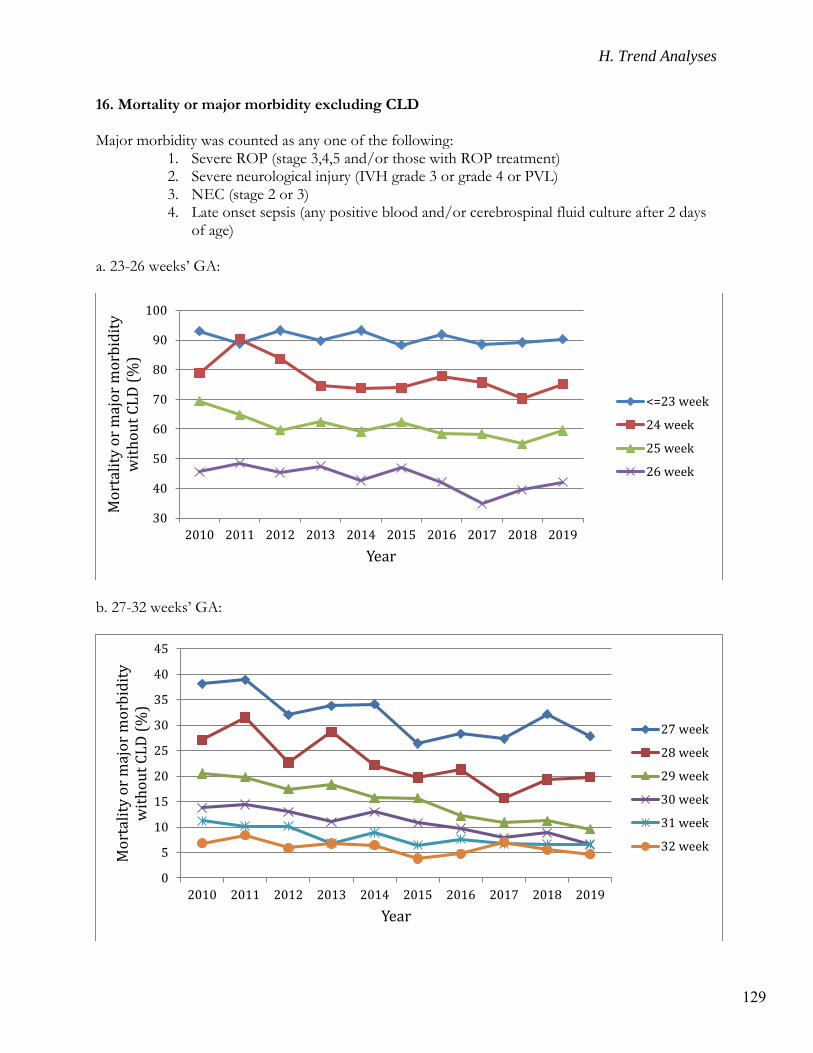
H. Trend Analyses
129
16. Mortality or major morbidity excluding CLD Major morbidity was counted as any one of the following:
1. Severe ROP (stage 3,4,5 and/or those with ROP treatment) 2. Severe neurological injury (IVH grade 3 or grade 4 or PVL) 3. NEC (stage 2 or 3) 4. Late onset sepsis (any positive blood and/or cerebrospinal fluid culture after 2 days
of age) a. 23-26 weeks’ GA:
b. 27-32 weeks’ GA:
30
40
50
60
70
80
90
100
2010 2011 2012 2013 2014 2015 2016 2017 2018 2019
Mo
rtal
ity
or
maj
or
mo
rbid
ity
w
ith
ou
t C
LD
(%
)
Year
<=23 week
24 week
25 week
26 week
0
5
10
15
20
25
30
35
40
45
2010 2011 2012 2013 2014 2015 2016 2017 2018 2019
Mo
rtal
ity
or
maj
or
mo
rbid
ity
w
ith
ou
t C
LD
(%
)
Year
27 week
28 week
29 week
30 week
31 week
32 week
I. Publications
130
I. 2019 CNN publications
Peer reviewed publications
1) Iwami H, Isayama T, Lodha A, Canning R, Abou Mehrem A, Lee SK, Synnes A, Shah PS,
Canadian Neonatal Network and Canadian Neontal Follow-Up Network Investigators. Outcomes after Neonatal Seizures in Infants Less Than 29 Weeks' Gestation: A Population-Based Cohort Study. Am J Perinatol. 2019 Jan; 36:191-199.
2) Lodha A, Entz R, Synnes A, Creighton D, Ysuf K, Lapointe A, Yang J, Shah PS, Investigators of the Canadaian Neonatal Network and the Canadian Neonatal Follow-Up Network. Early Caffeine Administration and Neurodevelopmental Outcomes in Preterm Infants. Pediatrics. 2019 Jan; 143(1).
3) Fischer N, Soraisham A, Shah PS, Synnes A, Rabi Y, Singhal N, Ting JY, Creighton D, Dewey D, Ballantyne M, Lodha A, Canadian Neonatal Network and Canadian Neonatal Follow-up Network Site Investigators. Extensive cardiopulmonary resuscitation of preterm neonates at birth and mortality and developmental outcomes. Resuscitation. 2019 Feb; 135-57-65.
4) Singh B, Shah PS, Afifi J, Simpson CD, Mitra S, Dow K, El-Naggar W. Probiotics for Preterm Infants: A National Retrospective Cohort Study. J Perinatology. 2019 Jan: 39; 533-539
5) Woodward MA, Williams C, Lodha AK, Shah PS, Shivananda S, Canadian Neonatal Network Investigators. Morbidity, mortality and resource utilization among neonates with Down syndrome admitted to NICUs. Global Scientific Research Journal of Pediatrics. 2018; 1(1), pp. 1-10.
6) Shafey A, Bashir RA, Shah PS, Synne A, Kelly E. Outcomes and resource usage of infants born at ≤ 25 weeks gestation in Canada. Paediatrics & Child Health. 2019 Feb; 25(4): 207-215.
7) Ting JY, Roberts A, Sherlock R, Ojah C, Cieslak Z, Dunn M, Barrington K, Yoon E, Shah PS. Duration of Initial Empirical Antibiotic Therapy and Outcomes in Very Low Birth Weight Infants. Pediatrics. March 2019; 143(3).
8) Zipursky A, Yoon E, Emberley J, Bertelle V, Makary H, Kanungo J, Lee SK, Shah PS. CLABSI and Non-CLABSI Surveillance in Canadian Tertiary Care NICUs. Pediatrics. 2019 May: 208:176-182.e6.
9) El-Naggar W, Afifi J, McMillan D, Toye J, Kajetanowicz A, Yoon E, Shah PS. Epidemiology of Meningitis in Canadian Neonatal Intensive Care Units. Pediatric Infectious Disease Journal. 2019 May; 38(5): 476-480.
10) Beltempo M, Shah PS, Ye XY, Afifi J, Lee S, McMillan DD; Canadian Neonatal Network Investigators. SNAP-II for prediction of mortality and morbidity in extremely preterm infants. J Matern Fetal Neonatal Med. 2019 Aug; 32(16): 2694-2701.
11) Keir AK, Karam O, Hodyl N, Stark MJ, Liley HG, Shah PS, Stanworth SJ; NeoBolus Study Group. International, multicentre, observational study of fluid bolus therapy in neonates. J Paediatr Child Health. 2019 June; 55(6): 632-639.
12) Aldana-Aguirre JC, Toye J, Shah PS, Yoon EW, Kumaran K; Canadian Neonatal Network Investigators. Patent ductus arteriosus and small for gestational age infants: Treatment approaches and outcomes. Early Human Development. 2019 April: 131: 10-14.
I. Publications
131
13) Thampi N, Shah PS, Nelson S, Agarwal A, Steinberg M, Diambomba Y, Morris AM. Prospective audit and feedback on antibiotic use in neonatal intensive care: a retrospective cohort study. BMC Pediatr. 2019 April; 19(1):105.
14) ElSayed E, Daspal S, Yee W, Pelausa E, Canning R, Shah PS, Yusuf K; Canadian Neonatal Network Investigators. Outcomes of singleton small for gestational age preterm infants exposed to maternal hypertension: a retrospective cohort study. Pediatr Research. 2019 Aug; 86:269-275.
15) Lodha A, Shah PS, Soraisham AS, Rabi Y, Mehrem AA, Singhal N; Canadian Neonatal Network Investigators. Association of Deferred vs Immediate Cord Clamping With Severe Neurological Injury and Survival in Extremely Low-Gestational-Age Neonates. JAMA Netw Open. 2019 Mar; 2(3).
16) Ediger K, Hasan SU, Synnes A, Shah J, Creighton D, Isayama T, Shah PS, Lodha A. Canadian Neonatal Network and Canadian Neonatal Follow-Up Network. Maternal smoking and neurodevelopmental outcomes in infants <29 weeks gestation: a multicenter cohort study. J Perinatology. 2019 Jun; 39:791-799.
17) Shah PS, Dunn M, Aziz K, Shah V, Deshpandey A, Mukerji A, Ng E, Mohammad K, Ulrich C, Amaral N, Lemyre B, Synnes A, Piedboeuf B, Yee WH, Ye XY, Lee SK. Sustained quality improvement in outcomes of preterm neonates with a gestational age less than 29 weeks: results from the Evidence-based Practice for Improving Quality Phase 31. Can. J. Physiol. Pharmacol. 2019 Jan; 97: 213–221.
18) Zhong YJ, Claveau M, Yoon EW, Aziz K, Singhal N, Shah PS, Wintermark, P. Neonates with a 10-min Apgar score of zero: Outcomes by gestational age. Resuscitation. 2019 July; 143: 77-84.
19) Rizzolo A, Shah PS, Boucorian I, Lemyre B, Bertelle V, Pelausa E, St-Hilaire M, Dahlgren L, Beltempo M. Cumulative effect of evidence-based practices on outcomes of preterm infants born at <29 weeks gestational age. Paediatrics & Child Health. 2019 June; 24(Suppl2): e46-47.
20) Sabri K, Shivananda S, Farrokhyar F, Selvitella A, Easterbrook B, Seidlitz W, Lee SK, Canadian Neonatal Network and the Canadian Association of Pediatric Ophthalmology and Strabismus. Refining evidence-retinopathy of prematurity screening guidelines: The SCREENROP study. Paediatrics & Child Health. 2019 June; doi: 10.1093/pch/pxz085
21) Goswami IR, Whyte H, Wintermark P, Mohammad K, Shivananda S, Louis D, Yoon EW, Shah PS, Canadian Neonatal Network Investigators. Characteristics and short-term outcomes of neonates with mild hypoxic-ischemic encephalopathy treated with hypothermia. J Perinatol. 2019 Nov; [Epub ahead of print].
22) Shah PS, Lui K, Reichman B, Norman M, Kusuda S, Lehtonen L, Adams M, Vento M, Darlow BA, Modi N, Rusconi F, Håkansson S, Feliciano LS, Helenius KK, Bassler D, Hirano S, Lee SK; on behalf of the International Network for Evaluating Outcomes (iNeo) of Neonates. The International Network for Evaluating Outcomes (iNeo) of neonates: evolution, progress and opportunities. Transl Pediatr. 2019;8(3):170-181.
23) Helenius K, Morisaki N, Kusuda S, Shah PS, Norman M, Lehtonen L, Reichman B, Darlow BA, Noguchi A, Adams M, Bassler D, Håkansson S, Isayama T, Berti E, Lee SK, Vento M, Lui K; International Network for Evaluation of Outcomes of neonates (iNeo). Survey shows marked variations in approaches to redirection of care for critically ill very preterm infants in 11 countries. Acta Paediatr. 2019 Oct; [Epub ahead of print].
24) Adams M, Bassler D, Darlow BA, Lui K, Reichman B, Hakansson S, Norman M, Lee SK, Helenius KK, Lehtonen L, San Feliciano L, Vento M, Moroni M, Beltempo M, Yang J, Shah PS; International Network for EvaluatingOutcomes (iNeo) of Neonates. Preventive
I. Publications
132
strategies and factors associated with surgically treated necrotising enterocolitis in extremely preterm infants: an international unit survey linked with retrospective cohort data analysis. BMJ Open. 2019 Oct; 9:e031086.
25) Lui K, Lee SK, Kusuda S, Adams M, Vento M, Reichman B, Darlow BA, Lehtonen L, Modi N, Norman M, Håkansson S, Bassler D, Rusconi F, Lodha A, Yang J, Shah PS; International Network for Evaluation of Outcomes (iNeo) of neonates Investigators. Trends in Outcomes for Neonates Born Very Preterm and Very Low Birth Weight in 11 High-Income Countries. J Pediatr. 2019 Dec;215:32-40.
26) Shahroor M, Lehtonen L, Lee SK, Håkansson S, Vento M, Darlow BA, Adams M, Mori A, Lui K, Bassler D, Morisaki N, Modi N, Noguchi A, Kusuda S, Beltempo M, Helenius K, Isayama T, Reichman B, Shah PS; on behalf of the International Network for Evaluation of Outcomes (iNeo) of neonates. Unit-Level Variations in Healthcare Professionals' Availability for Preterm Neonates <29 Weeks' Gestation: An International Survey. Neonatology. 2019;116(4):347-355.
27) Nielsen CC, Amrhein CG, Shah PS, Aziz K, Osornio-Vargas AR. Spatiotemporal Patterns of Small for Gestational Age and Low Birth Weight Births and Associations With Land Use and Socioeconomic Status. Environ Health Insights. 2019 Aug ;13:1-13.
28) Redpath S, Shah PS, Moore GP, Yang J, Toye J, Perreault T, Lee KS; Canadian Neonatal Transport Network and Canadian Neonatal Network Investigators. Do transport factors increase the risk of severe brain injury in outborn infants <33 weeks gestational age? J Perinatol. 2019 Aug; [Epub ahead of print].
29) Beltempo M, Wintermark P, Lemyre B, Shalish W, Martel-Bucci A, Narvey M, Ng EH, Guillot M, Shah PS; Canadian Neonatal Network Investigators. Predictors of Severe Neurologic Injury on Ultrasound Scan of the Head and Risk Factor-based Screening for Infants Born Preterm. J Pediatr. 2019 Nov;214:27-33.
30) Synnes A, Gillone J, Majnemer A, Lodha A, Creighton D, Moddemann D, Shah PS; Canadian Neonatal Network; Canadian Neonatal Follow-up Network. Preterm children with
suspected cerebral palsy at 19 months corrected age in the Canadian neonatal follow-up network. Early Hum Dev. 2019 Sep;136:7-13.
31) Garfinkle J, Yoon EW, Alvaro R, Nwaesei C, Claveau M, Lee SK, Shah PS; Canadian Neonatal Network Investigators. Trends in sex-specific differences in outcomes in extreme preterms: progress or natural barriers? Arch Dis Child Fetal Neonatal Ed. 2019 Jun; [Epub ahead of print].
32) Shah PS, Lehtonen L. Net worth of networks: opportunities and potential. Acta Paediatr. 2019 Aug;108(8):1374-1376.
Abstracts
1) Beltempo M, Wintermark P, Lemyre B, Shalish W, Martel- Bucci A, Narvey M, Ng E,
Guillot M, Shah PS. Predictors of Severe Neurological Injury and Risk Factor-based Screening for Preterm Infants. E-PAS 2019:1861.472.
2) Beltempo M, Wintermark P, Afifi J, Shivananda S, Louis D, Redpath S, Lee KS, Fajardo C, Mohammad K, Shah PS. Center variations in practices and outcomes of infants with hypoxic-ischemic encephalopathy treated with therapeutic hypothermia in Canada. E-PAS 2019:1861.473.
I. Publications
133
3) Sallam K, Daspal S, Ojah C, Abou Mehrem A, Yang J, Shah PS, Yusuf K, Sex based neonatal outcomes of singleton preterm infants less than 33 weeks gestation born to mothers with hypertension and normotensive pregnancies. E-PAS 2019:1863.486.
4) Ghotra S, Feeny D, Barr R, Synnes A, Yang J, Shah PS, Vincer M, Afifi J, Lee SK, Saigal S. Parent Reported Health Status of Preterm Survivors in a Multicentric Canadian Cohort. E-PAS 2019:1871.555.
5) O’Brien, Lee SK, Alvaro R, Bracht M, Cruz M, da Silva O, Lui K, Mirea L, Narvey M, Ng E, Robson K, Soraisham A, Ye X, Synnes A. The effect of Family Integrated Care (FICare) on growth and neurodevelopmental outcome in infants born < 29 weeks gestational age. E-PAS 2019:1871.55.
6) Rau S, Yoon E, Alvaro R, da Silva O, Makary H, Lee SK, Shah PS. Actuarial survival of neonates of 22-25 weeks’ GA. E-PAS 2019:1515.1.
7) Gagliardi L, Rusconi F, Reichman B, Adams M, Modi N, Lehtonen L, Kusuda S, Vento M, Darlow B, Bassler D, Isayama T, Norman M, Håkansson S, Lee SK, Lui K, Yang J, Shah PS. Sex pairing and weight discordance are associated with adverse outcomes in very preterm twins. E-PAS 2019:1515.6.
8) Norman M, Håkansson S, Kusuda S, Vento M, Lehtonen L, Reichman B, Darlow B, Adams M, Bassler D, Isayama T, Rusconi F, Lee SK, Lui K, Yang J, Shah PS. Neonatal outcome in very preterm infants with severe congenital heart defects: an international cohort study. E-PAS 2019:2170.5.
9) Brown BE, Shah PS, Afifi J, Sherlock R, Nwaesei C, Monterossa L, Crane J, Ye X, El-Naggar W. Delayed cord clamping for preterm infants with restricted growth for age. E-PAS 2019:2755.9.
10) Sicard M, Moussa A, Barrington K, Martin B, Luu TM, Ting JY, Roberts A, Paquette V, Shah PS, Kelly E, Autmizguine J. Neonatal Outcomes after Linezolid exposure for Coagulase negative Staphylococcal Infection: Real World Evidence. E-PAS 2019:2826.205.
11) Ting JY, Roberts A, Yoon E, Lapointe A, Drolet C, Shah PS. Variability and trends in antimicrobial prescriptions among infants born at <33 weeks’ gestational age. E-PAS 2019:2826.208.
12) Wong J, Ting JY, Shivananda S, Dunn M, Mukerji A, Beltempo M, Shah PS. Characteristics and outcomes of preterm neonates managed without early invasive mechanical ventilation. E-PAS 2019:2855.479.
13) El-Naggar W, Afifi J, Dorling J, Bodani J, Cieslak Z, Canning R, Lee Sk, Ye X, Shah PS. A comparison of the different strategies for managing the umbilical cord at birth. E-PAS 2019:2856.492.
14) Rizzolo A, Shah PS, Lemyre B, Bertelle V, Pelausa E, St-Hilaire M, Beltempo M. The Cumulative Effect Of Evidence-Based Practices On Outcomes Of Preterm Infants Born <29 Weeks. E-PAS 2019:3695.7.
15) Rochefort-Beaudoin C, Nuyt AM, Delrue MA, Ye X, Lee SK, Shah PS, Luu TM. Preterm infants with minor congenital anomalies: additional risk for neonatal complications. E-PAS 2019:3874.66.
16) Qureshi M, Shah PS, Mohammad K, Afifi J, Piedboeuf B, Abdelgadir D, Ye X, Calderon S, Yuen J, Taylor B, Aziz K. Prophylactic indomethacin: The impact on brain and gut injury may be gestational age dependent. E-PAS 2019:4167.623.
J. Appendices
134
J. Appendices
Outcomes Definitions
Mortality: Death prior to discharge from the NICU. Severe neurological injury: Intraventricular hemorrhage (IVH), ventricular enlargement or parenchymal echogenicity or periventricular leukomalacia (PVL): Defined as grade 3 IVH (intraventricular hemorrhage with ventricular enlargement) or grade 4 IVH (intraventricular hemorrhage and persistent parenchymal echogenicity) or persistent parenchymal echogenicity. Ventricular enlargement
- None: Measurement of ventricles was <7 mm at any level section of lateral ventricle.
- Mild: Measurement was 7 to 10 mm at any level of the larger lateral ventricle. Classify as “mild” if there was no mention of “ventricular enlargement”, “ventriculomegaly” or “hydrocephalus”, or if the most severe report was of “mild ventriculomegaly” or “mild ventricular enlargement”, or if described as “suspected”
- Moderate: Measurement was 11 to 15 mm at any level of the larger lateral ventricle on sagittal scan. Classify as “moderate” if the terms “grade III IVH”, “ventricular enlargement”, “ventriculomegaly” or “hydrocephalus” were used with “moderate”, or without descriptors.
- Severe: Measurement was >15 mm at any level of the larger lateral ventricle on a sagittal scan, or ventricular drainage/shunting was required. If no measurement was made, classify as “severe” if the terms “severe” or “significant” were used to describe “grade III IVH”, “ventricular enlargement”, “ventriculomegaly” or “hydrocephalus”.
- Not measured
- Unknown Severe retinopathy of prematurity (ROP): Stage 3, 4 or 5 ROP as defined by the International Classification of Retinopathy of Prematurity1 and/or those infants requiring treatment (laser or intraocular injection). ROP was scored as the highest stage in either eye identified at any time. Necrotizing enterocolitis (NEC): Stage 2 or 3 NEC according to Bell’s classification2, diagnosed by clinical and imaging findings. Sepsis: Isolation of bacterial, fungal or viral organism from blood or cerebrospinal fluid in a symptomatic infant.
1 An International Committee for the Classification of Retinopathy of Prematurity. The International Classificaiton of Retinopathy of Prematurity Revisited. Arch Ophthalmol 2005;123:991-999 2 Bell MJ, Ternberg JL, Feigin RD, et al. Neonatal necrotizing enterocolitis. Therapeutic decisions based upon clinical staging. Ann Surg 1978;187:1–7
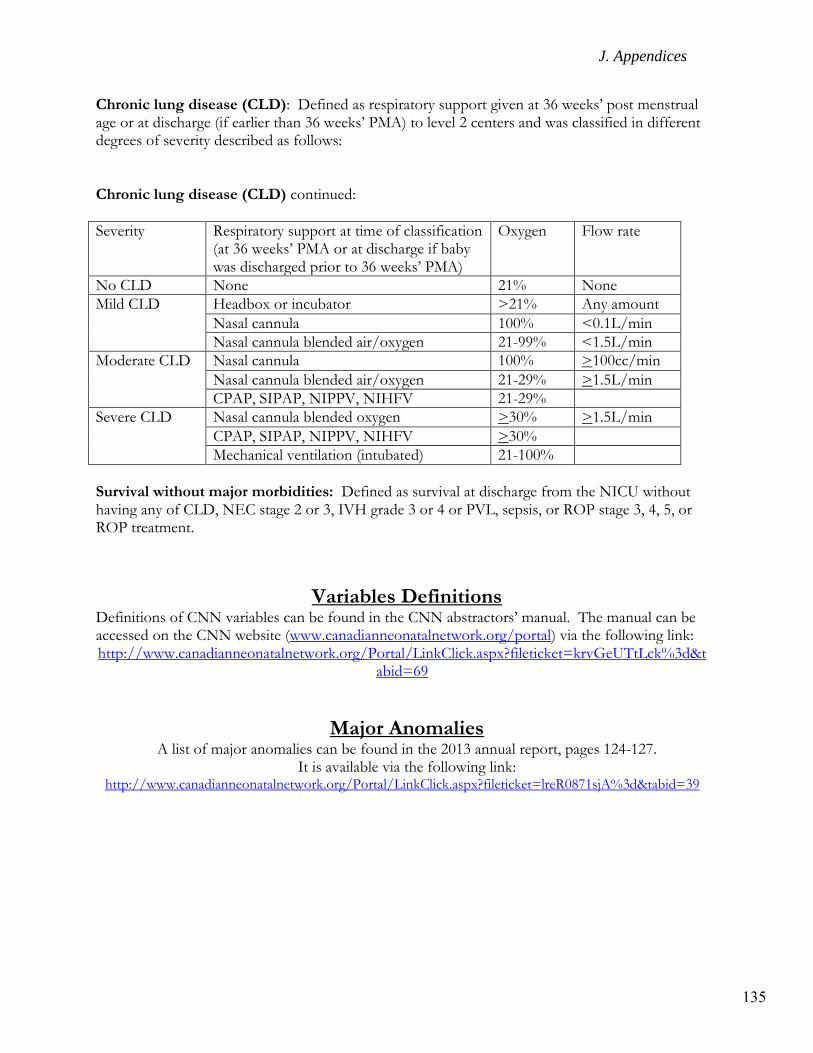
J. Appendices
135
Chronic lung disease (CLD): Defined as respiratory support given at 36 weeks’ post menstrual age or at discharge (if earlier than 36 weeks’ PMA) to level 2 centers and was classified in different degrees of severity described as follows: Chronic lung disease (CLD) continued:
Severity Respiratory support at time of classification (at 36 weeks’ PMA or at discharge if baby was discharged prior to 36 weeks’ PMA)
Oxygen Flow rate
No CLD None 21% None
Mild CLD Headbox or incubator >21% Any amount
Nasal cannula 100% <0.1L/min
Nasal cannula blended air/oxygen 21-99% <1.5L/min
Moderate CLD Nasal cannula 100% >100cc/min
Nasal cannula blended air/oxygen 21-29% >1.5L/min
CPAP, SIPAP, NIPPV, NIHFV 21-29%
Severe CLD Nasal cannula blended oxygen >30% >1.5L/min
CPAP, SIPAP, NIPPV, NIHFV >30%
Mechanical ventilation (intubated) 21-100%
Survival without major morbidities: Defined as survival at discharge from the NICU without having any of CLD, NEC stage 2 or 3, IVH grade 3 or 4 or PVL, sepsis, or ROP stage 3, 4, 5, or ROP treatment.
Variables Definitions Definitions of CNN variables can be found in the CNN abstractors’ manual. The manual can be accessed on the CNN website (www.canadianneonatalnetwork.org/portal) via the following link: http://www.canadianneonatalnetwork.org/Portal/LinkClick.aspx?fileticket=krvGeUTtLck%3d&t
abid=69
Major Anomalies A list of major anomalies can be found in the 2013 annual report, pages 124-127.
It is available via the following link: http://www.canadianneonatalnetwork.org/Portal/LinkClick.aspx?fileticket=lreR0871sjA%3d&tabid=39
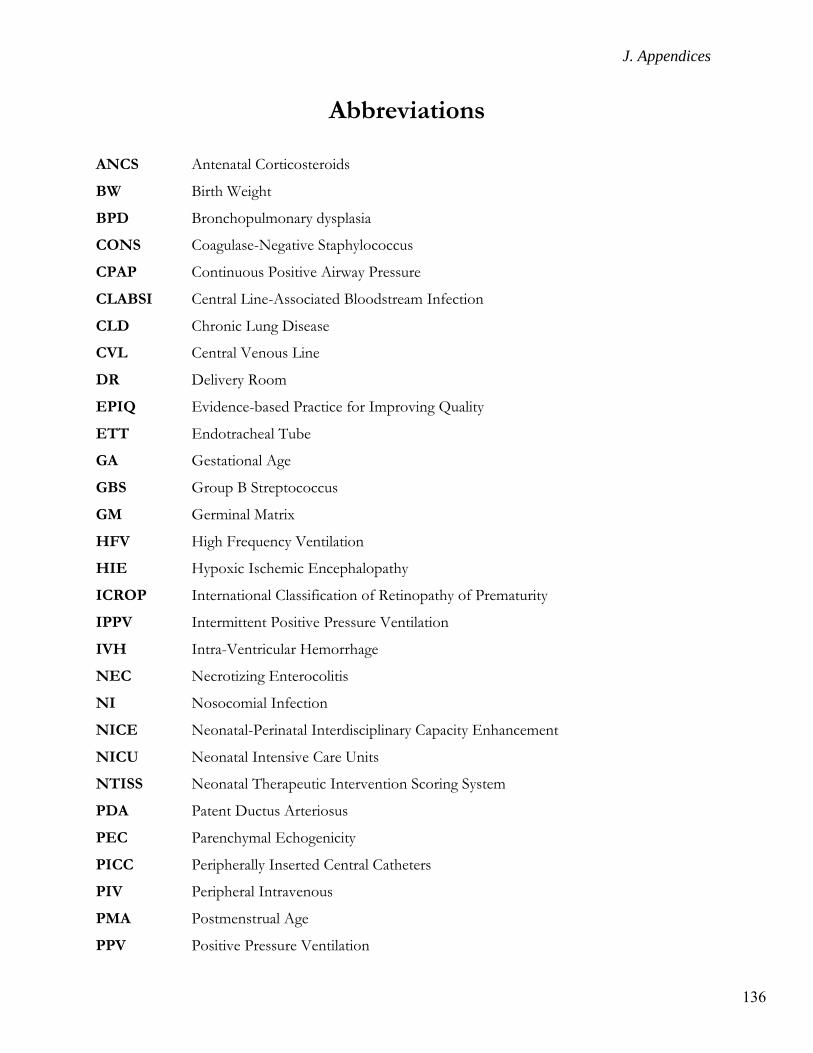
J. Appendices
136
Abbreviations
ANCS Antenatal Corticosteroids
BW Birth Weight
BPD Bronchopulmonary dysplasia
CONS Coagulase-Negative Staphylococcus
CPAP Continuous Positive Airway Pressure
CLABSI Central Line-Associated Bloodstream Infection
CLD Chronic Lung Disease
CVL Central Venous Line
DR Delivery Room
EPIQ Evidence-based Practice for Improving Quality
ETT Endotracheal Tube
GA Gestational Age
GBS Group B Streptococcus
GM Germinal Matrix
HFV High Frequency Ventilation
HIE Hypoxic Ischemic Encephalopathy
ICROP International Classification of Retinopathy of Prematurity
IPPV Intermittent Positive Pressure Ventilation
IVH Intra-Ventricular Hemorrhage
NEC Necrotizing Enterocolitis
NI Nosocomial Infection
NICE Neonatal-Perinatal Interdisciplinary Capacity Enhancement
NICU Neonatal Intensive Care Units
NTISS Neonatal Therapeutic Intervention Scoring System
PDA Patent Ductus Arteriosus
PEC Parenchymal Echogenicity
PICC Peripherally Inserted Central Catheters
PIV Peripheral Intravenous
PMA Postmenstrual Age
PPV Positive Pressure Ventilation
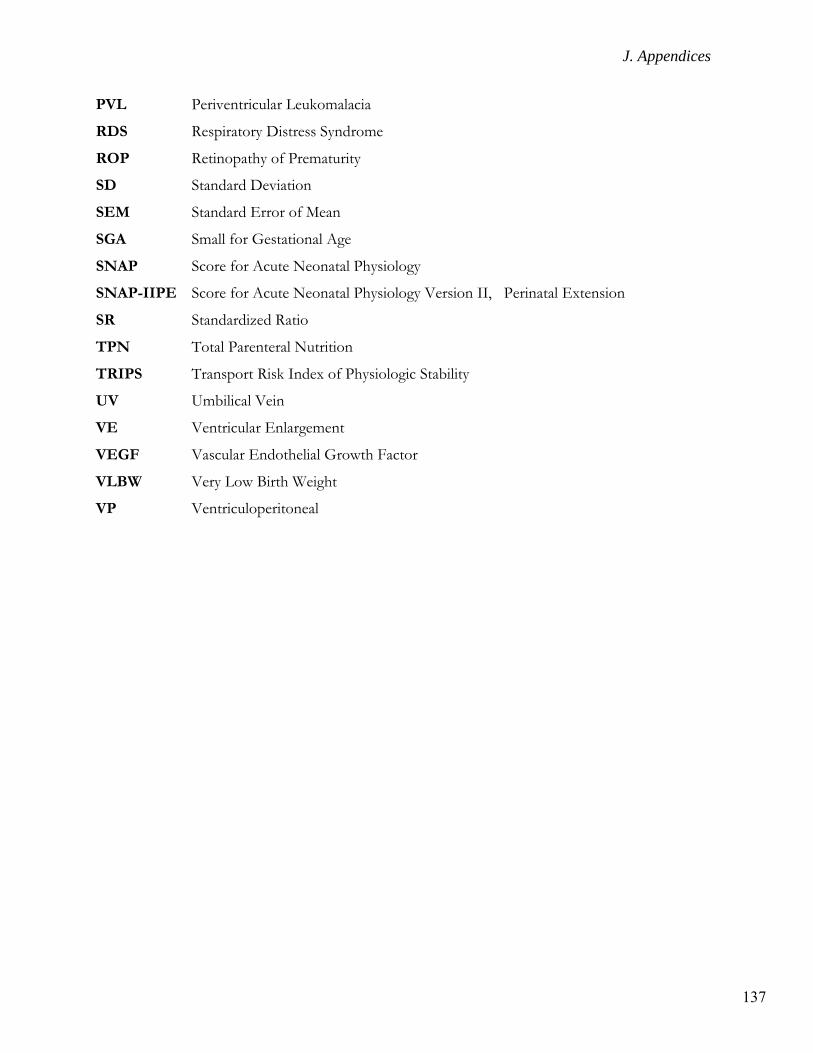
J. Appendices
137
PVL Periventricular Leukomalacia
RDS Respiratory Distress Syndrome
ROP Retinopathy of Prematurity
SD Standard Deviation
SEM Standard Error of Mean
SGA Small for Gestational Age
SNAP Score for Acute Neonatal Physiology
SNAP-IIPE Score for Acute Neonatal Physiology Version II, Perinatal Extension
SR Standardized Ratio
TPN Total Parenteral Nutrition
TRIPS Transport Risk Index of Physiologic Stability
UV Umbilical Vein
VE Ventricular Enlargement
VEGF Vascular Endothelial Growth Factor
VLBW Very Low Birth Weight
VP Ventriculoperitoneal

138
© Canadian Neonatal Network™ 2020
All rights reserved. No part of this publication may be reused, republished, stored in a retrieval
system or transmitted in any form or by any means-electronic, mechanical, photocopying, recordings or otherwise-without prior consent of the publisher.
Canadian Neonatal Network™, Maternal-Infant Care Research Centre
700 University Avenue, Suite 8-500, Toronto ON M5G 1X6