hs2 electricity strategy - whatdotheyknow
TRANSCRIPT

HS2 electricity strategyFINAL REPORTApril 2018

2© 2018 KPMG LLP, a UK limited liability partnership and a member firm of the KPMG network of independent member firms affiliated with KPMG International Cooperative (“KPMG International”), a Swiss entity. All rights reserved.
Document Classification: KPMG Confidential
Table of contents
1 Executive summary 3
2 Introduction and scope 10
3 Recent trends on the UK electricity market 15
4 Methodology 23
5 Electricity demand forecast 26
6 Goals and objective of the HS2 electricity strategy and evaluation criteria 32
7 Initial feasibility analysis 39
7.1 Available contractual structures
7.2 Potential technologies
7.3 Summary of contractual structures and potential technologies
8 Short list of options 75
9 Risks and Opportunities 102
10 Roadmap 107
Appendices 112

Executive summary
1.

4© 2018 KPMG LLP, a UK limited liability partnership and a member firm of the KPMG network of independent member firms affiliated with KPMG International Cooperative (“KPMG International”), a Swiss entity. All rights reserved.
Document Classification: KPMG Confidential
Executive Summary (1/6)Executive summary
Context and scope of the report
• HS2 is the planned high speed rail network connecting London to Birmingham, and then to both Manchester and Leeds. The network will become operational over 2 phases and is due to be fully completed by 2033.
• Once fully operational, HS2 will place c.3TWh of additional load on the UK national grid, increasing from c.1.2TWh during phase 1 + 2a. This will represent between a 40-67% increase in the total GB rail sector demand for electricity.
• The annual cost of electricity for HS2 will range around £90-110 million in Phase 1 + 2a operation and £200-245 million in Phase 2b.
• KPMG has been engaged to support HS2 in the context of formulating a comprehensive electricity strategy that clearly outlines how HS2 can ensure certainty of supply whilst also delivering maximum whole life value for the HS2 investment.
• KPMG has produced a strategy that outlines how electricity will be supplied for the operational phases of HS2. The electricity strategy set out in this report considers at a minimum:
• HS2’s operational carbon objective; • HS2’s requirement for security of supply; and, • HS2’s requirement for electricity price certainty.
• Further, this report considers and balances the above objectives with further objectives identified during the stakeholder engagement process over the course of the engagement.
• For further details, please refer to sections 2 and 5 of the report.
Developments in the electricity sector
• The GB electricity market is currently going through a transitional period of significant change. These changes are being driven by a range of commercial, political and environmental factors.
• The UK Government has introduced a number of levy charges and subsidies to encourage businesses to operate in a more environmentally friendly way and ensure security of supply. For example, capacity market payments, Contracts for Difference, and the Renewables Obligation. The receipts from these charges is forecasted to grow in the next couple of years.
• Recent years has seen a significant increase in the levels of small scale, renewable electricity generation that is connecting to the network, largely at the distribution level. By their nature, these new forms of ‘decentralised ‘generation are more intermittent than large scale, conventional generation. The effects of which are wide reaching.
• Despite bringing the wholesale price of electricity down, the increased penetration of renewables has resulted in more volatile prices in recent years. The subsidies in place to support renewable generation are funded by levies on end consumers which has added to the retail bills.
• Further, the costs associated with managing and balancing the electricity network are increasing. The move away from conventional generation places additional costs on the system operator National Grid. This costs are ultimately passed on to users in the form of higher electricity prices.
• The current charging arrangements are under a period of review, as the industry regulator Ofgem assesses the extent to which the current arrangements are fair. It is possible that the outcome of this review will lead to further increased costs for owners of distributed generation.
• For further details, please refer to section 3 of the report.

5© 2018 KPMG LLP, a UK limited liability partnership and a member firm of the KPMG network of independent member firms affiliated with KPMG International Cooperative (“KPMG International”), a Swiss entity. All rights reserved.
Document Classification: KPMG Confidential
Executive Summary (2/6)Executive summary
Methodology
• In developing HS2’s electricity strategy, we have followed a methodology that was developed and agreed in consultation with HS2’s stakeholders.
• The methodology set out a range of contractual arrangements and available technologies that could be contracted by HS2, and assessed these against an agreed evaluation criteria to develop a short-list of electricity options.
• The following 6 steps were taken in the development of HS2’s electricity strategy: 1) Agree objectives and establish stakeholder plan; 2) Agree assessment criteria and evaluation approach; 3) Develop robust electricity usage forecast and assess feasibility of potential technologies and contractual agreements; 4) Formulate and assess all feasible contractual structures and technologies against the assessment criteria; 5) Further analysis of shortlisted options; and 6) Develop a detailed road map.
• For further details, please refer to section 4 of the report.
Contractual arrangements and available technologies considered
• We assessed a range of contractual structures and potential technologies for their feasibility as part of HS2’s strategy.
• The contractual structures considered for HS2 in this report are all technology agnostic.
• We considered the following contractual structures;
• We considered the following categories of technologies:
• For further detail please refer to section 7 of the report.
Goals and objectives for HS2 electricity strategy and evaluation criteria
• In collaboration with stakeholders, we have developed the evaluation criteria for HS2, which have been used to understand the organisational goals and constraints for the electricity strategy.
• These objectives were then used to develop 7 evaluation criteria that were used to assess each of the potential contractual arrangements and technology options that might form HS2’s electricity strategy.
• This evaluation criteria has been used to qualitatively and quantitatively assess each of the potential options set out below.
• For further details, please refer to section 6 of the report.
Security of supply – maximise the availability of electricity for uninterrupted HS2 operations.
Deliverability – the options should not compromise or delay the implementation of the HS2 program.
Carbon reduction – the option should deliver or outperform HS2's operational carbon objective.
Cost optimisation – the option should optimise HS2’s costs. Cost certainty – the option should minimise HS2’s exposure to
electricity price volatility and ensure price stability/ predictability. Optimise commercial risk – the option should minimise HS2’s
commercial risk. Capex affordability – the option should minimise any need for
HS2 to seek additional capex funding.
Traditional supply contract (EC4T) Corporate PPA’s, both sleeved and direct; Private wire solution, both 3rd part and direct ownership
Intermittent renewables (solar, onshore/offshore wind) Base-load/ dispatchable renewables (Energy from Waste) Conventional generation (Gas base-load) Non-generation technologies (storage, demand side response)

6© 2018 KPMG LLP, a UK limited liability partnership and a member firm of the KPMG network of independent member firms affiliated with KPMG International Cooperative (“KPMG International”), a Swiss entity. All rights reserved.
Document Classification: KPMG Confidential
Executive Summary (3/6)Executive summary
Contractual arrangement
The contractual structures considered for HS2 are described briefly below.
Traditional supply agreement (EC4T)
In this contractual arrangement, the electricity is being procured through a contract with an electricity supplier. Network Rail applies this approach for procuring electricity on behalf of the rail operators, the current supplier is EDF and all the traction electricity is procured under a framework agreement (EC4T).
Power Purchase Agreement market
• Corporate Power Purchase Agreements (PPAs) have grown in popularity in recent years. PPAs allow a buyer, or off-taker, to enter into an agreement with a developer/supplier in order to secure a fixed price of electricity over a given period of time.
• There are a number of benefits associated with corporate PPA’s and these have driven demand for them:
PPAs allow the off-taker to lock in a fixed price, reducing exposure to volatile wholesale prices;
PPA’s can be agreed with developers who generate wholly from renewable sources, helping to reduce a companies carbon emissions.
• We have identified two PPA models, direct or sleeved. A sleeve PPA is typically a 10-15 year fixed electricity price contract with a renewable generator whereby the electricity provider manages the balance of electricity demand. We consider that the sleeved PPA model is more appropriate for HS2 as the direct model would require HS2 to set up an in-house energy procurement team, adding additional complexity to the contractual arrangement
• Through soft market sounding, we have spoken to a number of developers (e.g. Orsted, EDF) to gauge their appetite for entering into a corporate PPA arrangement with HS2.
• They have indicated that they would be able to offer capacity through a PPA and that they would be interested in exploring the contractual arrangement further.
• For further detail please refer to section 7 of the report.
Private wire solution
• Under a private wire agreement, electricity is purchased from a power plant on (or near) the sites where the electricity is consumed.
• Private wire agreements offer an alternative to corporate PPAs in that companies can invest directly in a renewable electricity generation asset on or near their own site; or alternatively commission the construction of the asset by a third party.
• Private wire solutions are beneficial in that, as the national grid is essentially ‘by-passed’, costly network charges can be significantly reduced (although charges for private wires are currently under review by Ofgem as part of their wider charging review). This can potentially make a private wire solution cheaper compared to both corporate PPAs and traditional supply arrangements.
• The sites maintain a connection with the wider distribution or transmission network in order to ensure security of supply for instances where the generator is not able to fulfil the off-takers demand
• Should HS2 decide to own the generation assets under a private wire solution directly, it is likely that there would be additional capex requirements beyond the pre-agreed budget.
• A private wire solution with third party ownership would help to significantly reduce this additional capex requirement and is therefore considered to be more appropriate to HS2’s requirements over the direct ownership structure.
• For further detail please refer to section 7 of the report.

7© 2018 KPMG LLP, a UK limited liability partnership and a member firm of the KPMG network of independent member firms affiliated with KPMG International Cooperative (“KPMG International”), a Swiss entity. All rights reserved.
Document Classification: KPMG Confidential
Executive Summary (4/6)Executive summary
Shortlist of options
• Following an assessment of the various contractual structures and technologies against the evaluation criteria, we developed a shortlist of 5 options that are considered viable for forming HS2’s electricity strategy.
• The options developed combine both contractual structures (sleeved PPA and 3rd party owned private wire) with a number of potential renewable technologies. While option 1 relies exclusively on sleeved corporate PPAs to supply HS2’s electricity demand, the other four options include an increasing proportion of electricity delivered via a 3rd party owned and operated private wire solution.
• Option 1 - 100% renewable sleeved corporate PPA
• Option 2 - 100% 3rd party owned and operated private wire (onsite) for stations, and 100% renewable sleeved corporate PPA for the traction assets
• Option 3 - Renewable sleeved PPA for traction assets and on-site generation for stations for Phase 1 + 2a and maximise 3rd party owned and operated private wire for Phase 2b based on HS2’s risk appetite (30-60%)
• Option 4 - 100% 3rd party owned and operated private wire with a balancing power provider
0 2 3 4
Proportion of renewable corporate sleeved PPA
Proportion of 3rd party owned and operated private wire
5
• Option 5 - Combination of Option 1-4, with gradual movement from Option 1-4 over time
• For Options 1-4, it is envisaged that there will be ‘review points’ throughout the life of the agreements to ensure there are opportunities to renegotiate and the potential to transition demand from sleeved PPAs to private wires if beneficial.
Preferred option• Considering the current market environment and the projection for
the electricity market over the next 10-20 years, out of the 5 options we consider that option 3, phasing in a private wire solution over time, represents the most attractive option to HS2, and fully satisfies each of the agreed evaluation criteria.
• This option does not preclude HS2 from developing and/or owning on-site renewables as may be required to meet regulatory and BREAM requirements, and which may already be in scope of HS2's Main Works Contracts
• Our recommendations are subject to market and regulatory developments.
• For further detail please refer to section 8 of the report.
Option 3 Description
Phase 1 + 2a
3rd party owned and operated on-site generation for Stations should be maximised; whilst all traction electricity
would be met through a 100% renewable sleeved PPA.
Phase 2b
Maximise 3rd party owned and operated private wire for Phase 2 based on HS2’s risk appetite and the rest of the
demand to be met through PPA.
Detailed technical and cost studies will be required to identify potential sites and to assess the amount of traction
electricity that could be sourced from such private wire connections.
Description of the preferred option
EC4T
1

8© 2018 KPMG LLP, a UK limited liability partnership and a member firm of the KPMG network of independent member firms affiliated with KPMG International Cooperative (“KPMG International”), a Swiss entity. All rights reserved.
Document Classification: KPMG Confidential
Executive Summary (5/6)Reasons for selecting the preferred option• Under this option, the analysis suggests that HS2 could meet its
electricity demand in Phase 1 + 2a of the project, through a sleeved corporate PPA arrangement. The opportunity for a 3rd
party owned and operated private wire solution could then be investigated and then depending on HS2’s risk appetite, maximum capacity could be developed ready for deployment in Phase 2b, in 2033.
• This option provides the highest alignment to HS2’s physical connection plans, i.e. using the connections to the transmission network for Phase 1 + 2a and enables HS2 to develop private wire generation for Phase 2b.
• For Phase 1 + 2a, the transmission network connection points have been identified, traction power systems have been designed, and to change them at this stage would introduce risks. Furthermore, the time that would be required to identify the sites for renewable generation for traction and the subsequent consenting timeframes, is also deemed to be high-risk for Phase 1 + 2a.
• HS2 already has a connection agreement in place with National Grid, and its important that the benefits associated with this agreement are realised. HS2 has already spent £76m on connection for Phase 1, this cost has been considered in selecting the preferred option.
• A corporate PPA provider could assign certain assets to HS2 (e.g. part of an offshore wind farm) which could create reputation benefits for HS2. The generation assets can either come from an existing portfolio or from newly built assets. In both cases, it can be argued that HS2’s commitment creates additionality. The concept of additionality in the electricity sector is complex as is explored further in the appendix. Additionality is not necessary limited to new projects. It could be that where a developer has a limited amount of capital available for development, the re-financing of existing assets to free up capital for further developments is critical to create additional assets into the system.
• For Phase 2b traction assets, HS2 has the opportunity to explore the private-wire options since no connection plans have been decided yet.
• HS2 will also need to review energy policy changes regularly (including some imminent policy changes) to ensure that the case for private wire connections remains strong.
• Transitioning to a private wire based solution in Phase 2b would provide HS2 with the time necessary to develop and construct an optimum solution. It will be important for the optimal level of private wire to be determined from both a technical and cost balance perspective in order for the benefits to be maximised.
• The capacity of the private wire assets will be determined by the maximum risk that HS2 is willing to take on the private wire development. Regardless of the capacity, we envisage that the electricity generated under the private wire solution would be made up of solar or onshore wind combined with DSR and battery storage solutions.
• It is envisaged the for a 3rd party owned and operated private wire solution land acquisition, planning permission, consenting and other development activities will become the responsibility of the 3rd party developer.
• There are a number of further points that will need consideration should this option be progressed. For example, technical feasibility of private solution should be considered carefully given HS2’s technical constraints.
• This recommended options is technology agnostic and in practice will likely be a combination of different technologies to meet the needs of HS2.
• For further detail please refer to section 8 of the report.

9© 2018 KPMG LLP, a UK limited liability partnership and a member firm of the KPMG network of independent member firms affiliated with KPMG International Cooperative (“KPMG International”), a Swiss entity. All rights reserved.
Document Classification: KPMG Confidential
Executive Summary (6/6)Executive summary
Key Considerations
• Market/ commercial – UK Government policy can significantly impact on the prospects for certain technologies. Despite a fall in technology costs, some still rely on government subsidies. It is likely that Government will continue with its decarbonisation agenda, supporting the further roll out of renewable generation. However, it is important to understand, and plan for, the degradation of such support as this could have significant implications for HS2’s electricity strategy.
• Regulatory – There are a number of key regulatory developments and decisions expected in the coming years that it will be paramount for HS2 to keep abreast of as these could have implications for the competitiveness of the options.
• Ofgem’s decision on the Targeted Charging Review, for example, is expected in 2019. The decision could involve the reduction / removal of “embedded benefits” which could make the private wire options less attractive from a cost optimisation perspective. Further, Government and Ofgem plan to deliver a smarter, more flexible energy system by removing barriers to smart technologies (including storage). This plan may have positive implications for storage and DSR solutions.
• Technological - The cost of renewable technologies is rapidly falling which means that cost estimates for technologies might not be accurate in the long term. This is especially relevant in relation to offshore wind and solar technologies. The change in technological costs could reshape the ranking order of the technologies.
• It will be important for HS2 to undertake further cost estimate exercises in the future, closer to when the preferred technology options are determined.
Next steps
• In delivering the preferred option, there are a number of key activities and milestones that HS2 and its stakeholders will have to undertake between now and 2032.
• In the first instance, HS2 will be required to engage with the PPA market, meeting with providers and developers to help inform initial views on nature of the market, and the range of products that might be available to HS2. This will enable HS2 to refine its views on the deliverability of the sleeved corporate PPA arrangement.
• HS2's position on 'additionality' of low carbon electricity supply should be agreed to ensure the goal to achieving carbon reduction for the programme whilst also supporting a UK-wide transition to a low carbon economy is met.
• HS2 should also start to think about identifying potential sites for locating private wire generation and undertake technical feasibility studies. It will be important that HS2 undertakes this work early, as there are a number of complexities and interdependencies associated with the private wire solution.
• In the early 2020’s, we would expect HS2 to have started the selection process for sleeved renewable PPA providers, down–selecting the developers and balancing power providers which meet HS2’s deliverability and risk appetite, ensuring that the selection criteria is technology agnostic. This would be followed by a formal invitation to tender and then a decision being made on a preferred PPA provider.
• Where new generation assets are required for the corporate PPA, construction of the assets will need to commence around 2023/24 in order for the launch of Phase 1 in 2026 and Phase 2a in 2027.
• Around the time of the Phase 1 launch, HS2 will need to start undertaking the selection process for the private wire owner and operator. There will be a number of steps associated with this phase of the process; obtaining planning consents, construction of the assets etc., which will be the responsibility of the 3rd party but it is important that this starts well ahead of 2032.
• For further detail please refer to section 10 of the report.

Introduction and scope
2.

11© 2018 KPMG LLP, a UK limited liability partnership and a member firm of the KPMG network of independent member firms affiliated with KPMG International Cooperative (“KPMG International”), a Swiss entity. All rights reserved.
Document Classification: KPMG Confidential
Overview of the HS2 ProjectHS2 is the planned high speed rail network connecting London to Birmingham, and then to both Manchester and Leeds. It isestimated that HS2 will reduce travel times from London to Birmingham from 1 hour 21 minutes to 49 minutes, from Londonto Leeds from 2 hours 11 minutes to 1 hour 21 minutes, and journeys from Manchester to London from 2 hours 8 minutes to 1hour and 8 minutes.
• High Speed 2 (HS2) is a planned high-speed railway in the United Kingdom linking London, Birmingham, theEast Midlands, Leeds and Manchester.
• It would be the second high-speed rail line in Britain, after High Speed 1 (HS1) which connects London to theChannel Tunnel.
• It is the most ambitious infrastructure project in the UK, and the first new railway north of London in over 120years. It will be fully integrated with the country’s transport networks, boosting capacity and connectivity. Itwill support the creation of homes and jobs and unlock the collective potential of the UK regions. Work on thefirst phase is scheduled to begin in 2017, reaching Birmingham by 2026, Crewe on the left leg of the "Y" by2027, and fully completed by 2033.
Phase 1• Phase 1 will run from London Euston station, through the Chilterns, South Northamptonshire and
Warwickshire to Birmingham Interchange and Curzon Street station in central Birmingham. It will join theWest Coast Main Line, north of Lichfield for services on to Manchester.
Phase 2a• Phase 2a will run from Birmingham to Crewe where it will connect to the existing railway.
Phase 2b• Phase 2 will run from the West Midlands to Manchester and Leeds, with stations at
Manchester Airport, Manchester Piccadilly, the East Midlands (close to Derby andNottingham), Sheffield and Leeds. It will connect to the existing railway at Crewe, nearGolborne (south of Wigan), and southwest of York.
Starting from 2026, our trains will be used by tens of thousands of people every day, transforming linksacross the Midlands and the North and providing much-needed extra capacity between Britain’s major cities.
“
“
- Chris Rayner, HS2 Managing Director – Operations and Infrastructure Management Directorate
Due to the timings of completion and the more developed nature with phase 1 and phase 2a, at the request of the HS2 team, the strategy has been split into phase 1 + 2a and phase 2b.

12© 2018 KPMG LLP, a UK limited liability partnership and a member firm of the KPMG network of independent member firms affiliated with KPMG International Cooperative (“KPMG International”), a Swiss entity. All rights reserved.
Document Classification: KPMG Confidential
HS2’s electricity needs Introduction
Once HS2 is operational, the infrastructure and operations will place an incremental load on the UK’s electricity network and initial estimates have predicted a cost of up to £200m/year if procured through traditional supply contracts.
4.45 4.45
3
0.0
1.0
2.0
3.0
4.0
5.0
6.0
7.0
8.0
2016 2033
Elec
trici
ty D
aman
d(T
Wh/
yr)
GB Rail (non-HS2) HS2
HS2 electricity need compared to GB rail electricity requirement
Impact of HS2• This would represent a significant additional load for the GB electricity network to bear, increasing from c.1.2TWh of additional load during Phase
1 + 2a, and over c.3TWh of additional load across Phase 2b.• Current estimates suggest that the roll-out of HS2 could increase the electricity demand of the GB rail sector by between 40 – 67%.• Given the size of the additional electricity requirement presented by HS2, there is significant scope for a number of potential strategies to be
employed in meeting that additional need.
1.01
2.37 0.11
0.42
0.12
0.21
-
0.50
1.00
1.50
2.00
2.50
3.00
3.50
Phase 1 + 2a Phase 2b
TWh
per y
ear
HS2 Annual Demand
Non-traction and OtherTraction Power - Conventional Rail NetworkTraction Power - HS2 Network

13© 2018 KPMG LLP, a UK limited liability partnership and a member firm of the KPMG network of independent member firms affiliated with KPMG International Cooperative (“KPMG International”), a Swiss entity. All rights reserved.
Document Classification: KPMG Confidential
Scope and structure of this report
Scope• KPMG has been engaged to support HS2 in the context of formulating a comprehensive electricity strategy that clearly outlines how HS2 can
ensure certainty of supply whilst also delivering maximum whole life value for the HS2 investment. KPMG in conjunction with HS2 have produced a strategy that outlines how electricity will be supplied for the operational phases of HS2.
• More specifically, the electricity strategy considers at a minimum:
• HS2’s decarbonisation targets; • HS2’s requirement for security of supply; and, • HS2’s requirement for electricity price certainty.
• Further, this report considers and balances the above objectives with further objectives identified during the stakeholder engagement process over the course of the engagement (these are detailed in section 4). As part of the strategy document produced, the KPMG has consulted with key stakeholders within HS2, as well as with others across the industry.
• Current electricity strategy is intended to provide a strategy and options for operations on HS2’s network only, and therefore excludes the electricity for HS2 trains when they are running on the Conventional Rail Network (CRN). When they are on the CRN, traction electricity for the HS2 trains will be provided by Network Rail.
Structure of this report• In section 3, we highlight some recent trends in the UK electricity market which have an impact on HS2’s electricity strategy.
• Section 4 of this report provides the detail on our approach and methodology to formulating the electricity strategy.
• In section 5, we present the results from the electricity demand estimation exercise as well as discuss the limitations of the analysis.
• In section 6, we set out the evaluation criteria which were the outputs of the initial stakeholder engagement exercise. These evaluation criteria are used to evaluate the long list of electricity options available to HS2.
• Section 7 then discusses the long list of electricity options available to HS2. The electricity options can be broken down into the choice of technology and the choice of contract under which the technology will be procured. The advantages and disadvantages of the potential options are discussed and evaluated using the agreed evaluation criteria.
• Section 8 describes the evaluation exercise to narrow down the options into a shortlist. Section 9 discusses the risks and opportunities regarding the shortlisted options.
• Finally, section 10 presents a roadmap for implementing the electricity strategy.
Introduction
The scope and structure of this report is set out below.

14© 2018 KPMG LLP, a UK limited liability partnership and a member firm of the KPMG network of independent member firms affiliated with KPMG International Cooperative (“KPMG International”), a Swiss entity. All rights reserved.
Document Classification: KPMG Confidential
HS2’s Strategic Goals and Objectives
HS2 Strategic Goals Overlap with goals and objectives for HS2’s electricity strategy
1HS2 will be a catalyst for sustained and balanced economic growth across the UK
―Not covered by HS2’s electricity strategy. The mandate of the electricity strategy is not sufficiently wide to efficiently consider economic growth across the UK.
2
HS2 will add capacity and connectivity as part of a 21st
century integrated transport system
―Not covered by HS2’s electricity strategy. This organisational objective relates to connecting cities, which we do not consider relevant to assessing the power options.
3 HS2 will deliver value to the UK tax payer and passenger
Overlaps with HS2’s electricity strategy.The proposed electricity strategy objectives include “cost minimisation” and “balance sheet impact” which will feed into HS2’s overall objective 3.1 (delivering the program on time and on cost). The proposed goal and objective “minimising commercial risk” maps to HS2’s overall strategic objective 3.2 (ensuring commercial viability).
4 HS2 will set new standards in passenger experience
Overlaps with HS2’s electricity strategy.As this relates to customer service and experience, HS2’s electricity strategy could facilitate this organisational objective through the “security of supply” objective through the minimisation of disruptions attributed to power shortages / outages.
5 HS2 will create opportunities for skills and employment ―
Not covered by HS2’s electricity strategy. At this stage “creating skills and employment” was not considered a meaningful evaluation criteria of the potential power options.
6
HS2 will create a railway designed, built and operated with world-class health, safety and security standards
―
Not covered by HS2’s electricity strategy. This strategic concerns health and safety which is not a meaningful evaluation criteria at this stage as it does not drive the decision around which power options(s) will be selected; rather, this objective would be more suitable as part of the procurement process.
7HS2 will create an environmentally sustainable solution and be a good neighbour to local communities
Overlaps with HS2’s electricity strategy.The proposed strategic objective of “carbon reduction” within HS2’s electricity strategy will contribute towards achieving HS2’s overall environmental objectives.
In the process of formulating the objectives for HS2’s electricity strategy, KPMG have considered how HS2’s electricity strategy could align to it’s wider organisational objectives. Where possible, the electricity strategy has been aligned to HS2’s wider organisation strategic goals and objectives. Below is a mapping of HS2’s strategic goals and objectives to the proposed evaluation criteria covered by the electricity strategy.

Recent trends in the UK electricity market
3.

16© 2018 KPMG LLP, a UK limited liability partnership and a member firm of the KPMG network of independent member firms affiliated with KPMG International Cooperative (“KPMG International”), a Swiss entity. All rights reserved.
Document Classification: KPMG Confidential
Introduction to the current trends in the UK electricity marketSignificant changes impacting the GB electricity market• The GB electricity market is currently going through a transitional
period of significant change. These changes are being driven by a range of commercial, political and environmental factors.
• The UK Government has introduced a number of environmental levy charges to encourage businesses to operate in a more environmentally friendly way. For example, Capacity Market payments, Contracts for Difference, and the Renewables Obligation. The receipts from these charges is forecasted to grow in the next couple of years.
• Recent years have seen a significant increase in the levels of small scale, renewable electricity generation that is connecting to the network, largely at the distribution level. By their nature, these new forms of ‘decentralised ‘generation are more intermittent than large scale, conventional generation. The effects of which are wide reaching.
• Despite bringing the wholesale price of electricity down, the increased penetration of renewables has resulted in significantly more volatile prices in recent years.
• Further, the costs associated with managing and balancing the electricity network are increasing. The move away from conventional generation places additional costs on the system operator National Grid. These costs are ultimately passed on to users in the form of higher electricity prices.
• The current charging arrangements are under a period of review, as the industry regulator Ofgem assesses the extent to which the current arrangements are fair. It is likely that the outcome of this review will lead to further increased costs for owners of distributed generation.
Trends in electricity costs
Structure of the section• The key changes of the electricity market impact the choices that
HS2 will have in the future for choosing the electricity option and they should be taken into account when setting out the electricity strategy for HS2.
• Current section of the report provides an overview of the recent trends and outlooks for the main price elements of the electricity and characteristics of the UK network such as:
Wholesale costs
Balancing charges
Transmission charges
Distribution charges
Environmental policy charges
Carbon emission
Security of supply

17© 2018 KPMG LLP, a UK limited liability partnership and a member firm of the KPMG network of independent member firms affiliated with KPMG International Cooperative (“KPMG International”), a Swiss entity. All rights reserved.
Document Classification: KPMG Confidential
Increasing volatility in the wholesale prices
Increasing volatility in wholesale prices
Sources: Nord Pool
GB Electricity Prices (£/MWh)
Wholesale market
• Movement in the electricity wholesale price is determined by a number of drivers:• Generation source costs – cost of commodities is set on a global market (e.g. natural gas, which for some contracts are still
index linked to the price of oil) • Generation mix – increased penetration of intermittent renewables likely to bring the wholesale price down, despite increases in
associated balancing and network costs. • Demand – demand has generally been falling in recent years but is expected to begin to rise as the electrification of transport
gathers momentum.
• The volatility seen in wholesale prices has been largely due to the increased share of renewables in the energy mix.
• Poyry has forecast increasing electricity wholesale prices up the late 2030s due to the increasing demand. The variation in Poyry’sforecasts, year-on-year, demonstrates the inherent uncertainty in predicting future electricity prices.
Increasing wholesale prices
Electricity wholesale price forecast (£/MWh)
Sources: Poyry
020406080100120140160180
25456585
105125145165
His
toric
Ele
ctric
ity P
rice
(£/M
Wh)
N2EX Base N2EX Peak
Trends in electricity costs
40
50
60
70
80
90
2012
2013
2014
2015
2016
2017
2018
2019
2020
2021
2022
2023
2024
2025
2026
2027
2028
2029
2030
2031
2032
2033
2034
2035
2036
2037El
ectri
city
Pric
e Fo
reca
st(£
/MW
h)
2012 2013 2014 2015 2016 2017

18© 2018 KPMG LLP, a UK limited liability partnership and a member firm of the KPMG network of independent member firms affiliated with KPMG International Cooperative (“KPMG International”), a Swiss entity. All rights reserved.
Document Classification: KPMG Confidential
Network Charges are expected to increaseTotal Annual BSUoS charges are increasing
Sources: National Grid
Historical annual BSUoS charges (£m)
Balancing Charges• National Grid procures a variety of services in order to avoid system
imbalance, and to ensure the security of electricity supply across the whole electricity system. The products differ in the length of notification, speed of response and delivery period.
• BEIS, NIC and Ofgem are expected to review the Balancing Market due to the increased intermittency on the system.
• With increased intermittency on the system, National Grid’s total cost of balancing services is increasing. National Grid forecast that the markets for Frequency Response and Reactive Power to increase over the next five year period.
• National Grid has recently undertaken a System Needs & Product Strategy (SNAPS) consultation and is in the process of reviewing the balancing services with the aim to provide market information that clearly sets out the system balancing needs, simplify the products to create transparency and ensure routes to market for all participants.
800 850 900 950
1,000 1,050 1,100 1,150
2011/12 2012/13 2013/14 2014/15 2015/16
BSU
oS c
harg
es
(£ m
illion
)
Trends in electricity costs
Increasing transmission charges
1.5
2
2.5
3
3.5
4
2017/18 2018/19 2019/20 2020/21 2021/22
TNU
oS fo
reca
st
(£bi
llion)
Five year TNUoS revenue forecast (£bn)
Transmission charges• The level of demand on the transmission network is decreasing due
to the increasing trend in decentralised energy. This also results in fewer customers paying for the operation and maintenance of the asset.
• Under the RIIO framework (RAB based model), the assets and associated costs are locked down for 8 years resulting in delays of response to market trends, i.e. decentralisation is likely to result in stranded assets on the transmission network, but with a time-lag.
• At the same time, the cost of the transmission system is increasing. This is due to an increasing number of offshore transmission assets being built.
• Currently, 27% of transmission charges are paid for by generators, with the remaining amount being paid by end users. This rule might change due to EU legislation.

19© 2018 KPMG LLP, a UK limited liability partnership and a member firm of the KPMG network of independent member firms affiliated with KPMG International Cooperative (“KPMG International”), a Swiss entity. All rights reserved.
Document Classification: KPMG Confidential
Increasing burden on distribution networksIncreasing decentralised generation
Sources: BEIS
GB solar deployment capacity (GW)
Distribution charges• The distribution charge covers the cost of operating and maintaining a
safe and reliable electricity network between the transmission system and end users, such as homes and businesses.
• Distribution network operators (DNO) are facing an increasing burden on their system due to increased local, decentralised generation. The drive towards decentralised energy is forcing the DNOs to take on more integrated services such as load shifting and demand side response (DSR) that enable more efficient energy management at a decentralised level.
• Local network operators are increasingly having to manage demand and supply at a local level as ‘Distributed System Operators’ (DSOs). This increases the cost of their operations and hence the distribution charges.
• Growth in decentralised energy is expected to continue to rise, despite cuts in subsidies, as technology costs fall.
Trends in electricity costs
0
5
10
2010 2011 2012 2013 2014 2015 2016 2017
GB
Sola
r Cap
acity
(G
W)
0 to ≤ 4 kW4 to ≤ 10 kW10 to ≤ 50 kW50 kW to ≤ 5 MW5 to ≤ 25 MW> 25 MW
Increasing penetration of EV and EV charging infrastructure
Forecast EV and Hybrid car penetration in the UK
0.0
2.0
4.0
6.0
8.0
0.00
0.20
0.40
0.60
0.80
Tota
l (C
umul
ativ
e) E
V &
Hyb
rid (m
illion
)
EV &
Hyb
rid s
ales
per
yea
r (m
illion
)
Sales per year - Low Sales per year - HighCumulative - High Cumulative - Low
Source: KPMG analysis
Electric vehicle and infrastructure penetration• The penetration of electric vehicles and associated charging
infrastructure is forecast to increase looking forward to 2030 and beyond. The penetration of EVs is likely to differ regionally and will be based on more than just population numbers.
• The penetration growth of EV’s is likely to be higher in regions withhigher population and population growth; higher population density; higher incomes; high numbers of taxis; regional grants; higher penetration of charging points; and shorter average journeys.
• HS2 is expected to own car parks facilities, with the potential for the deployment of EV charging infrastructure. The penetration of EV’s therefore will be particularly relevant to HS2, should it decide to go down a ‘self-generating’ route.
• If HS2 decides to pursue a strategy of self-generating, any surplus electricity that is generated could be used to charge EV’s that are connected to charging infrastructure in HS2’s car parks.

20© 2018 KPMG LLP, a UK limited liability partnership and a member firm of the KPMG network of independent member firms affiliated with KPMG International Cooperative (“KPMG International”), a Swiss entity. All rights reserved.
Document Classification: KPMG Confidential
Changes to the network charging arrangementsTrends in electricity costs
Network charges are expected to increase for distributed connected generation in the future
Ofgem Significant Code Review• In August 2017, Ofgem announced that they were issuing a
Significant Code Review (SCR) into the Targeted Charging Review.
• The primary scope of the review is said to cover residual charging for generation and demand, on both the transmission and distribution networks.
• Ofgem has invited discussion on how best to allocate transmission costs, potentially altering the scope of which users are covered by residual charges (for example, by potentially increasing network costs for users with onsite generation).
• The impact on different technologies remains to be seen, although is expected to benefit large, transmission-connected generation like offshore wind, whilst increasing costs for distribution-connected plant.
• A decision on any new residual charging arrangements is expected in Q3 2018 and the implementation of any changes is expected in 2-3 years time.
• Transmission connected generation and electricity suppliers are charged Transmission Network Use of System charges (TNUoS). TNUoS comprises two elements:
• a locational charge, that reflects the costs of connecting to the system in different locations; and,
• a residual charge (TDR) that is used to recover the remaining costs of the transmission system.
• Distribution connected generation, however, is treated as negative demand, and does not pay TDR. Instead, they are often paid by suppliers to generate during certain periods to reduce costs; incentivising generation to connect to the distribution network, even if this is not the optimal locational decision.
• This became an increasingly important issue as TDR is increasing as shown on the chart.
Ofgem ‘embedded benefits’ code modification• Ofgem became concerned that these payments, referred to as
‘embedded benefits’, were distorting the market and leading to an inefficient mix of transmission connected and distribution connected generation.
• Following consultation, in April 2017, Ofgem published a minded to decision to gradually reduce the level of TDR payments over the course of three years.
• This decision is likely to have the largest impact on distribution connected dispatchable generation.
• For distribution connected storage, TDR has historically formed a significant portion of revenues (c£40-45/kW), and Ofgem’s proposals are expected to see this reduced by up to two thirds.
Transmission Demand Residual costs (£kW) 2005 - 2021
Source: Ofgem

21© 2018 KPMG LLP, a UK limited liability partnership and a member firm of the KPMG network of independent member firms affiliated with KPMG International Cooperative (“KPMG International”), a Swiss entity. All rights reserved.
Document Classification: KPMG Confidential
Policy charges
Source: OBR, Fiscal Outlook, March 2017
Contracts for Difference (CfDs) is the main mechanism for incentivising investment in low carbon generation. It enables a competitive process to set the level of subsidy to low carbon generators. CfDs is an important driver of both investment decisions and costs faced by consumers.
Launched in 2002, the Renewables Obligation (RO) requires energy suppliers to source an increasing proportion of their electricity from renewable sources by purchasing Renewable Obligation Certificates (ROCs) from accredited renewable generators. Suppliers who hold insufficient ROCs must buy out their remaining requirement. The costs of ROCs are passed through to electricity consumers.
The Feed-in tariff is designed to support small-scale renewable generation in businesses and homes. It was launched in 2010 and offers an index-linked payment for every kWh of energy produced for a 10-25 year period, with different rates for different technologies. The scheme is funded by suppliers based on market share, with costs then being passed on to customers.
Climate Change Levy (CCL) is a tax on the use of certain fuel and power including electricity paid by non-domestic customers. It was introduced to incentivise businesses to reduce their energy consumption and to become more energy efficient, thereby reducing carbon emissions.
The Capacity Market (CM) is designed to make sure we have sufficient electricity available to meet our future needs. It operates as an annual auction, which started in December 2014, to procure the majority of the UK’s required energy capacity four years in advance. The cost of running the CM is passed through to consumers.
The UK Government has introduced a number of environmental levy charges to encourage businesses to operate in a more environmentally friendly way. The receipts from these charges is forecasted to grow in the next couple of years.
Government’s forecast for environmental levy budgets (£bn)
Trends in electricity costs
0.0 2.0 4.0 6.0 8.0
Climate Change Levy
Feed-in tariffs
Renewables obligation
Contracts for difference
Capacity market
£bn2015-16 2016-17 2017-18 2018-192019-20 2020-21 2021-22

22© 2018 KPMG LLP, a UK limited liability partnership and a member firm of the KPMG network of independent member firms affiliated with KPMG International Cooperative (“KPMG International”), a Swiss entity. All rights reserved.
Document Classification: KPMG Confidential
Carbon reduction & security of supplyZero carbon emission by late 2040s
Sources: BEIS
UK Power sector emissions intensity (gCO2e/kWh)
Decarbonisation• The UK Government has set carbon targets which aims to
decarbonise the economy and the electricity sector within it. Almost 30% of the UK’s electricity came from renewable sources in Q2-171 and this figure is expected to increase rapidly as contracted capacity continues to be built out. When combined with nuclear, this means almost half of Britain’s electricity generation is already produced from low carbon sources.
• The UK power sector is targeted to be decarbonised by the late 2040s.
Healthy capacity margin in short term
De-rated Capacity – Headroom above peak demand (GW)
Sources: National Grid
Security of Supply• National Grid has published its latest annual ‘Winter
Outlook’ (2017/18) which estimates a margin of 6.2GW for electricity, or 10.3%, above peak demand. This equates to a loss of load expectation of 0.01 hours (less than one minute), compared to the 3 hours set by Government2.
• National Grid has noted that this is the result of plants without Capacity Market agreements having indicated that they will remain operational in the coming winter. In the short term, this healthy margin should allay any security of supply concerns.
0
2
4
6
8
10
12
Winter10/11
Winter11/12
Winter12/13
Winter13/14
Winter14/15
Winter15/16
Winter16/17
Winter17/18
Hea
droo
m C
apac
ity (G
W)
050
100150200250300350400450
2015 2020 2025 2030 2035 2040 2045
Emis
sion
s In
tens
ity(g
CO
2e/k
Wh)
Trends in electricity costs
Sources: (1) BEIS, (2) Loss of load factor is set by the Government in the Electricity Market Reform package

Methodology4.

24© 2018 KPMG LLP, a UK limited liability partnership and a member firm of the KPMG network of independent member firms affiliated with KPMG International Cooperative (“KPMG International”), a Swiss entity. All rights reserved.
Document Classification: KPMG Confidential
Detailed methodologyBelow we set out the detailed methodology associated with formulating the electricity strategy. Broadly, the methodology can be broken down into six stages.
Methodology
Stage 1: Agree objectives and establish stakeholder approachThe key internal and external stakeholders were identified and a stakeholder engagement approach was established. The data requirements, inparticular for the electricity forecast, were discussed and established with HS2. The outputs from this stage included a stakeholder map andengagement approach over the course of this engagement. In addition, the overall objectives of the electricity strategy were agreed with HS2 at thisstage.
Stage 2: Agree assessment criteria and evaluation approachThe goals and objectives of the HS2 electricity strategy were agreed with key stakeholders in a workshop held on the 17th of October 2017. Moreimportantly, the workshop allowed the goals and objectives to be transposed into evaluation criteria which were employed in Stage 4: the assessmentof the potential technologies and contractual agreements available to HS2. The key output from this stage includes a robust framework for assessingthe potential technologies and contractual agreements which has been presented to and agreed with key stakeholders.Stage 3: Develop robust electricity usage forecast and assess feasibility of potential technologies and contractual agreementsHS2 peak and baseload demand were estimated in an electricity forecasting exercise. Broadly, a large part of this exercise focussed on estimatingtraction electricity requirements as this was likely to constitute the majority of HS2’s electricity requirements. In conducting the forecasting exercise,input from the relevant HS2 stakeholders was sought and embedded into the analysis.At this stage, KPMG also undertook an initial feasibility analysis of the potential technologies and contractual agreements available to HS2 given theevaluation criteria agreed with HS2 in stage 2. The initial feasibility study informs the formulation of the electricity options, carried out in the nextstage.Stage 4: Formulate and assess all feasible contractual structures and technologies against the assessment criteriaThe initial feasibility study provides the basis for the formulation of potential electricity options for HS2, which are a combination of potentialtechnologies and contractual agreements available to HS2. The formulated options were then assessed against the evaluation criteria identified inStage 2, and initial findings were shared with HS2.
Stage 5: Further analysis of shortlisted optionsThe initial assessment of the options and discussions with HS2 formed the basis of the ‘short list’ of options. Additional analysis was then conductedon the shortlisted options, in particular to understand the key considerations associated with implementing these options for HS2. Further, theshortlisted options were discussed with key stakeholders at a workshop held on 29 November 2017 and refined based on stakeholder feedback.
Stage 6: Develop a detailed road mapThe discussions and analysis carried out in stage five forms the basis for HS2’s preferred options. A comprehensive electricity strategy roadmap wasformulated based on the evaluation exercise and the key considerations. In particular, the electricity strategy set out key turning points / action pointsfor HS2 in terms of planning and implementation of the options as well as risks, in particular, regulatory change, technological advancement and theimpact on the options.

25© 2018 KPMG LLP, a UK limited liability partnership and a member firm of the KPMG network of independent member firms affiliated with KPMG International Cooperative (“KPMG International”), a Swiss entity. All rights reserved.
Document Classification: KPMG Confidential
Key stakeholdersMethodology
Throughout the process of developing HS2’s electricity strategy, we have engaged with a number of internal and externalstakeholders, holding a number of stakeholder workshops and steering group meetings. The objectives and outcomes ofthese meetings are set out below.
In developing this report, we have engaged with HS2’s key internal stakeholders across two workshops and two steering group meetings:
Workshop 1
Date: 17th October
Objectives:
1. Discuss, refine, and agree on the set of goals and objectives for HS2 electricity strategy – The identified goals and objectives for HS2 electricity strategy were discussed and refined. Agreement from key stakeholders on the evaluation criteria was obtained in this workshop.
2. Prioritisation of the evaluation criteria– The refined evaluation criteria were then prioritised in a group exercise.
Outcomes: The output of the workshop was a set of agreed and prioritised evaluation criteria for assessing the feasible electricity options (see below).
COST MINIMISATION
COST CERTAINTY
CARBON REDUCTION
MINIMISE COMMERCIAL RISK
SECURITY OF SUPPLY
BALANCE SHEET IMPACT
Eval
uatio
n cr
iteria
Workshop 2
Date: 29th November
Objectives:
To provide an update on progress and to share how criteria from 1st workshop have been used to develop the short list of strategic options:
• Provide an update against the project plan;
• Share the current results of the Electricity Demand forecast;
• Present the short-list of options and their evaluation;
• Give HS2 the opportunity to comment, make suggestions, and challenge;
• Identify areas for refinement and agree next steps.
Outcomes: The output of this workshop was an agreed shortlist of options that were taken forward for further assessment.
Steering Group Meeting
We have also engaged with other key stakeholders through two steering group meetings. These were held at HS2’s offices on the 22nd
November and the 13th December, and were used to present our proposals and latest thinking with other interested parties.
External stakeholder engagement
KPMG has also engaged with some of HS2’s external stakeholders, notably a number of potential solution providers, for example Orsted(formerly known as DONG energy) to understand the market appetite for potential commercial arrangements.
DELIVERABILITY

Electricity demand forecast
5.

27© 2018 KPMG LLP, a UK limited liability partnership and a member firm of the KPMG network of independent member firms affiliated with KPMG International Cooperative (“KPMG International”), a Swiss entity. All rights reserved.
Document Classification: KPMG Confidential
MethodologyElectricity demand forecast
The forecast includes two key calculations – for annual demand and for peak demand
Annual Demand Peak Demand
Annual demand outputs are available for each section of the route (HS2 Network and Conventional Rail Network), for each phase of the network construction.
Annual Power Demand = Traction Power consumption + Non-traction Power consumptions
Traction Power Consumption per journey[Power consumption (kWh) per km x Number of km per journey]+ [Auxiliary load per minute (kWh) x Number of minutes of journey]+ [Auxiliary load per minute (kWh) x 20 minutes of dwell time per journey]
Traction Power Consumption per year – for each northbound journey:∑ [Power consumption per journey x Number of northbound journeys per day (based on schedule) x Number of days in a year] Multiply output by 2 to take account of southbound journeys
Non-passenger movementsIt has been assumed that non-passenger movements will account for 1.5% of the HS2 network (per HS2 comments), and that power requirements will be the same as for the Conventional Rail Network
Adjustments taken into account 200m vs 400m trains Power requirements for HS2 Network vs Conventional Rail Network Network Losses
Non-traction power has already been provided on an annual basis – HS2 have confirmed that more detailed information (on a per station basis, for relevant operating hours) may follow.
Peak demand outputs are available for each section of the route (HS2 Network and Conventional Rail Network), for each phase of the network operation. Note that total peak demand for the whole network will not necessarily equal the sum of peak demand for each section/phase, as peak demand on different sections of the track may occur at different points in time.
Peak Demand = The power requirement for the most power intensive minute of the day (traction + non-traction)
Power requirement per minute (kWh / minute) for HS2 Network and Conventional Rail Network trains – this is based on the London to Birmingham power estimate calculated for annual demand, divided by the 49 minute journey time
Peak trains per hour – assumptions for number of trains per hour are input in the forecast for peak and off-peak hours, for both weekdays and weekends. Weekday peak hours are assumed as the busiest, and are used to calculate peak demand.
Together this is used to estimate the power requirement (kWh) during any one minute, for all trains running at that time. This is divided by 60 to arrive at peak demand (kW).
Per HS2 suggestions, non-traction power is currently assumed to be same for every minute in the day, although HS2 have confirmed that more detailed information (on a per station basis, for relevant operating hours) may follow.
Traction Power Consumption
Non-traction Power Consumption
Traction Power Consumption
Non-traction Power Consumption

28© 2018 KPMG LLP, a UK limited liability partnership and a member firm of the KPMG network of independent member firms affiliated with KPMG International Cooperative (“KPMG International”), a Swiss entity. All rights reserved.
Document Classification: KPMG Confidential
High level design of annual electricity demand forecastThis diagram sets out the forecasting approach in relation to developing an annual electricity consumption forecast and the information used from HS2 for the purpose of carrying out this exercise.
Electricity demand forecast
Inputs Output
Traction power consumption per day (weekday, weekend)Annual traction power consumption
Power consumption per km (200m rolling stock – HS2 Network and Conventional Network)
Number of trains per hour, per direction
Non-traction power requirements (MWh/year)• Stations• Tunnels• Depos
+Annual non-traction power Consumption
=Total power requirement
Distance per route (km)
Power consumption per train per km (kWh/km)
Calculations
x
=
Assumptions for first and last trains(6am and 11.30pm)
Daily schedule (hh:mm)(Number of trains running per minute)
Journey distance per captive route (km) and per conventional route (km)
Power consumption per journey
Key adjustments: 400m trains Auxiliary load (inc. dwell time)
Network losses Non-passenger movements Number of days in year

29© 2018 KPMG LLP, a UK limited liability partnership and a member firm of the KPMG network of independent member firms affiliated with KPMG International Cooperative (“KPMG International”), a Swiss entity. All rights reserved.
Document Classification: KPMG Confidential
High level design of peak electricity demand forecastThis diagram sets out the forecasting approach in relation to developing an annual electricity consumption forecast and the information used from HS2 for the purpose of carrying out this exercise.
Electricity demand forecast
Inputs Output
Traction power per minute of the day(Take minute with maximum kWh requirement in the day)
Power Consumption per km
Number of trains per hour during peak weekday periods
Non-traction power requirements (MWh/year)• Stations• Tunnels• Depos
Peak Demand
Calculations
Daily schedule (hh:mm)(Number of trains running per minute)
Journey times (minutes)& Dwell times (minutes)
Adjust for 400m trains and network losses
Power consumption per minute (dwell times)
Power consumption per minute, per 200m train journeyLondon to Birmingham distance (km)
London to Birmingham journey time (mins)
Peak traction power consumption per minutekWh to kW conversion
Peak power consumption per minute

30© 2018 KPMG LLP, a UK limited liability partnership and a member firm of the KPMG network of independent member firms affiliated with KPMG International Cooperative (“KPMG International”), a Swiss entity. All rights reserved.
Document Classification: KPMG Confidential
Key assumptionsElectricity demand forecast
Rolling Stock Dimensions Input Units and DescriptionType 1: 200m Length of rolling stockType 2: 400m Length of rolling stockPower ratio (400m relative to 200m) 2 400m trains use twice the power of 200m trains
Traction Power (per km)Power per trainset-km (200m HS2 Network) 24.97 kWh per trainset-km; these figures are extrapolated to calculate power per journey and
thereby power per yearPower per trainset-km (200m Conventional Rail Network) 15.27
Dwell power 300 kW, at all times train is runningDwell power 5 kWh per minuteDwell times at terminals 10 minutes Per terminal (2 terminals per journey)Dwell times at call stations 2 minutes Number of call stations varies by route
Non-passenger movements
Travel Distance (% of HS2 network) 1.50% Assumed that trains run without passengers, at slower speeds (requiring less power), at least twice a day (frequency to be confirmed)
Power requirement (kWh per trainset-km) 15.27 Assumed to be same as Conventional Rail NetworkNumber of rolling stock TBC
Network Losses - Traction PowerAverage expected loss (used for annual demand) 6%Maximum expected loss (used for peak demand) 7%
Route and ScheduleRatio of southbound trains to northbound trains 1 Assumed that there are exactly the same number of southbound trains as northoundFirst train 06:00 This decides the number of hours for which trains run throughout any given dayLast train 00:00Number of days trains run in year 365 Note that this may be changed to c.350Nunber of trains per hour (2026) 10 The exact route varies for each departureNunber of trains per hour (2027) 10 The exact route varies for each departure
Nunber of trains per hour (2033) 23 The exact route varies for each departure. Note that the forecast shows this as 29 trains, if 400m trains splitting into 2x 200m trains are taken into account
Non-traction PowerPower requirement per year (See note to right) Power requirement provided by HS2 on station by station basisDepots, tunnels and lineside (See note to right) High-level estimate currently used; more detailed data to be provided by HS2
The below tables sets out the key assumptions and inputs used to arrive at the forecast annual and peak demand figures

31© 2018 KPMG LLP, a UK limited liability partnership and a member firm of the KPMG network of independent member firms affiliated with KPMG International Cooperative (“KPMG International”), a Swiss entity. All rights reserved.
Document Classification: KPMG Confidential
Estimated annual demandElectricity demand forecast
Annual demand is estimated to reach 1.24 TWh by 2027 (“Phase 1 + 2a”) and 2.99 TWh by 2033 (“Phase 2b”)
Forecast Summary
Total demand in “Phase 1 + 2a” (i.e. in 2027) has been estimated as 1.24 TWh. This takes into account HS2 rolling stock running on both the HS2 network and the conventional rail network (north of Birmingham Curzon Street).
Total demand in “Phase 2b” (i.e. in 2033, once the full HS2 network has been constructed) has been estimated at 2.99 TWh. This too takes into account HS2 rolling stock running on both the HS2 network and the conventional rail network, the latter of which is now north of Manchester Piccadilly and Leeds on the western and eastern routes respectively.
Indicative installed capacity requirements to generate this volume of electricity are shown for different technologies in the appendix.
Traction power on the HS2 network comprises the largest portion of total annual power requirements for two main reasons:
1) Power requirement per km on the faster HS2 network is 24.97 kWh/km, compared to 15.27 kWh/km on the slower conventional rail network
2) There are a number of trains which run only, or largely, on the HS2 network, i.e. those that terminate at or soon after Birmingham Curzon Street, Manchester Piccadilly and Leeds, with a relatively small number of trains continuing after this point.
“Non-traction and Other” accounts for power requirements at stations (4 in Phase 1, 9 in Phase 2), depots, tunnels and lineside, non-passenger movements (e.g. at the start and end of the day and for maintenance purposes), and auxiliary load requirements before, during and after the train journey.
1.01
2.37 0.11
0.42
0.12
0.21
-
0.50
1.00
1.50
2.00
2.50
3.00
3.50
Phase 1 + 2a Phase 2b
TWh
per y
ear
HS2 Annual Demand
Non-traction and OtherTraction Power - Conventional Rail NetworkTraction Power - HS2 Network

Goals and objective of HS2’s electricity strategy and evaluation criteria
6.

33© 2018 KPMG LLP, a UK limited liability partnership and a member firm of the KPMG network of independent member firms affiliated with KPMG International Cooperative (“KPMG International”), a Swiss entity. All rights reserved.
Document Classification: KPMG Confidential
Evaluation criteriaThe evaluation criteria used for assessing the long list of technologies and contractual arrangements have been developed in closeconsultation with HS2 and its stakeholders. The process that was taken in developing and finalising these evaluation criteria is set outbelow.
Identifying the goals and objectives of the HS2 electricity strategy:
• In the first instance, a preliminary list of goals and objectives for the HS2 electricity strategy was developed. This list was developed following initial discussions with HS2 stakeholders at the kick-off meeting held on 17 September 2017 and, where relevant, looked to incorporate and reflect HS2’s wider organisational objectives.
• KPMG then refined that initial list of goals and objectives further, considering which of HS2’s wider organisational objectives could be met via HS2’s electricity strategy.
• A refined list was then presented and finalised at the first stakeholder workshop, attended by key HS2 stakeholders, that was held on 17 of October 2017.
The goals and objectives as evaluation criteria:
• The key purpose of the goals and objectives is to help develop an understanding of HS2’s targets and constraints associated with the electricitystrategy. Specifically, the goals and objectives can be transposed into an evaluation criteria that can be used for assessing the various technologiesand contractual agreements available to HS2.
• The technologies and contractual options which met the performance standards under each evaluation criteria were considered further in thedevelopment of HS2’s strategic options. Those technologies and contractual options that do not meet the performance standards set out undereach evaluation criteria were eliminated from the long list.
Aligning HS2’s electricity strategy to the wider organisational objectives:
• In the process of formulating the objectives for HS2’s electricity strategy, KPMG have considered how HS2’s electricity strategy could align to it’swider organisational objectives. Where possible, the electricity strategy has been aligned to HS2’s wider organisation strategic goals and objectives.A discussion of the alignment of the strategic objectives is set out in the introduction and scope.
Goals and objective of HS2’s electricity strategy and evaluation criteria

34© 2018 KPMG LLP, a UK limited liability partnership and a member firm of the KPMG network of independent member firms affiliated with KPMG International Cooperative (“KPMG International”), a Swiss entity. All rights reserved.
Document Classification: KPMG Confidential
Criteria Description
Summary of the evaluation criteria
Security of supply
Deliverability
Cost certainty
Carbon reduction
Optimise commercial risk
Cost optimisation
Affordability (capex)
The selected options should maximise the availability of electricity for uninterrupted HS2 operations.
The selected options should not compromise the achievement of HS2 timeframes and / or commencement of HS2 operations.
The selected options should minimise HS2’s exposure to electricity price volatility and ensure price predictability.
The options should optimise the cost of electricity for HS2 subject to the other strategic objectives.
The selected options should deliver or outperform Railway Operations’ carbon targets.
The selected options should minimise commercial risk to HS2, e.g. in terms of viability of the technologies, the robustness of the commercial agreements, etc.
The selected options should minimise any need for HS2 to seek additional capex funding (over and beyond HS2’s currently approved budget).
Goals and objective of HS2’s electricity strategy and evaluation criteria
A summary of the evaluation criteria is set out in the table below.

35© 2018 KPMG LLP, a UK limited liability partnership and a member firm of the KPMG network of independent member firms affiliated with KPMG International Cooperative (“KPMG International”), a Swiss entity. All rights reserved.
Document Classification: KPMG Confidential
Evaluation criteria (1)The strategic objectives agreed with HS2 are set out below. These were employed as evaluation criteria to assess the long list oftechnologies and contractual arrangements available to HS2. The assessment of the long list informed the formulation of the options. Theevaluation criteria are discussed in more detail below.
Goals and objective of HS2’s electricity strategy and evaluation criteria
1. Security of supply
Definition• Security of supply in the context of HS2’s evaluation of the potential
technologies and contractual arrangements dictates that the selectedoptions should maximise the availability of electricity for uninterruptedHS2 operations. The technologies, contractual arrangements andoptions for further consideration must meet this criteria.
Measure• For each of the potential technologies, contractual agreements and
options, we assessed security of supply by considering the risk ofoperational interruptions due to electricity supply failing to meetdemand and thus causing an interruption to HS2’s operations.
Evaluation methodology• The reliability of options was measured through a qualitative
comparison of electricity demand and electricity supply, consideringthe frequency of instances where supply failed to meet demand.
• For example, we considered the profile of solar generationthroughout the day versus HS2’s demand throughout the day as asimple stylized example. Solar produces the most electricity aroundmidday, but HS2’s electricity demand would likely peak in themornings and in the evenings, as commuters travel to and from work.
• The stylized example clearly shows that solar generation alone wouldnot be able to provide HS2 with the required level of security ofsupply. Furthermore, solar generation is intermittent - meaning solargeneration is not continuously available – therefore, solar technologydoes not meet HS2’s security of supply requirements on its own.
2. Deliverability
Definition• The selected options should not compromise or delay the
implementation of the HS2 program. The technologies, contractualarrangements and options for further consideration must meet thiscriteria.
Measure• We performed a qualitative assessment of the risk of the option
potentially delaying or compromising the roll-out of the HS2.• This involved assessing the extent to which there are reliable and
established players supplying a given technology, contractualagreements, or options in the market.
Evaluation methodology• The implementation risk of the options to HS2’s timeline were
assessed.• We considered the likely lead times associated with procuring
different generation technologies and considered if this fits withHS2’s overall timelines.

36© 2018 KPMG LLP, a UK limited liability partnership and a member firm of the KPMG network of independent member firms affiliated with KPMG International Cooperative (“KPMG International”), a Swiss entity. All rights reserved.
Document Classification: KPMG Confidential
Evaluation criteria (2)Goals and objective of HS2’s electricity strategy and evaluation criteria
3. Carbon reduction
Definition• The selected options should deliver or outperform Railway
Operations’ carbon targets.• At the time this report was produced, the relevant carbon targets
were still under consultation, however the proposed targets are setout below:
Measure• The projected carbon intensity of the various options were
compared to Railway Operations‘ carbon targets in terms of gramsof CO2e/kWh emitted.
Evaluation methodology• Options were compared and ranked according to their projected
carbon intensity, measured by grams of CO2e/kWh emitted.Options with carbon intensities that exceed Railway Operations’targets were not considered further.
4. Cost optimisation
Definition• The options should optimise the cost of electricity for HS2, subject to
the other strategic objectives.Measure• The quantitative measure of levelised cost of electricity (£/MWh) was
employed to assess the costs of technologies, contractualarrangements, and options on a comparable basis.
Evaluation methodology• We compared £/MWh cost of electricity for each technology,
contractual arrangement and option.• The lowest cost technology, contractual arrangement, or option were
selected for further consideration subject to meeting HS2’s otherstrategic objectives.
• As an illustrative example below, BEIS’ analysis of the levelised costof electricity for different technologies commissioning in 2025highlights the significant differences in generation costs.
PeriodProposed HS2 reference case for
evaluation of energy strategy options (gCO2e/kWh)
2026 - 2030 86
2031 - 2035 40
2036 - 2040 14
2041 - 2045 5
2046 - beyond 0
0 50 100 150 200 250
Nuclear PWR - FOAK
Coal - ASC with oxy cob. CCS -…
CCGT with post comb. CCS - FOAK
Coal - IGCC with CCS - FOAK
CCGT H class
OCGT 600MW (500hrs)
Offshore R3
Large scale solar PV
Onshore >5MW UK
Levelised Cost Estimates for Projects Commissioning in 2025 (£/MWh)
Source: HS2
Source: BEIS (2016), Electricity Generation Costs

37© 2018 KPMG LLP, a UK limited liability partnership and a member firm of the KPMG network of independent member firms affiliated with KPMG International Cooperative (“KPMG International”), a Swiss entity. All rights reserved.
Document Classification: KPMG Confidential
Evaluation criteria (3)Goals and objective of HS2’s electricity strategy and evaluation criteria
5. Cost certainty
Definition• The selected options should minimise HS2’s exposure to
electricity price volatility and ensure price stability andpredictability.
Measure• The ability of HS2 to be able to forecast the electricity costs over
a reasonable time period.• In addition, electricity costs incurred by HS2 should demonstrate
a low level of volatility.Evaluation methodology• We performed a qualitative assessment of the electricity options
against exposure to uncertain cost elements (e.g. wholesaleprices, network costs).
• GB electricity prices have been fairly volatile over time. Weconsidered the degree of the technologies’, contracts’, andoptions’ exposure to market factors which drive electricity pricevolatility.
6. Optimise commercial risk
Definition• The selected options should minimise HS2’s commercial risk,
e.g. in terms of viability of the technologies and risks around thecontractual commercial party, ensuring the options are viablewithin HS2’s timeframes, and ensuring the robustness of thecommercial agreements.
Measure• The commercial viability of the technologies and contractual
arrangements, i.e. to what extent have similar solutions beendeployed successfully elsewhere?
• Level of commercial risks that HS2 would be exposed to undersuch technological solutions and/ or contractual arrangements.
Evaluation methodology• We performed a qualitative assessment of the technological
viability and commercial risks associated with each option,based on desk-based review of implementation elsewhere.
• The qualitative review was validated by the feedback frommarket players through a soft market testing exercise.

38© 2018 KPMG LLP, a UK limited liability partnership and a member firm of the KPMG network of independent member firms affiliated with KPMG International Cooperative (“KPMG International”), a Swiss entity. All rights reserved.
Document Classification: KPMG Confidential
Evaluation criteria (4)Goals and objective of HS2’s electricity strategy and evaluation criteria
7. CAPEX Affordability
Definition• The selected technology, contractual arrangement, or option should minimise any
need for HS2 to seek additional capex funding (over and beyond HS2’s currentlyapproved budget).
Measure• The extent to which HS2 can minimise upfront / capital costs for each of the
potential technologies, contractual agreements and options.• Technologies, contractual arrangements and options that include an element of
upfront capital costs will not be disregarded in and of themselves. However, duringthe assessment, preference were afforded to those solutions with lower additionalcapital outlay than set out in HS2’s currently approved budget.
Evaluation methodology• The net capex impact of each technology, contractual agreement and option were
assessed. The net capex impact should be minimised subject to the otherevaluation criteria set out in this section.
Req
uire
d ca
pex
0%
100%
Balance sheet impact
100% additional capex required
Some additional capex required
0% additional capex required
E.g. obtain electricity through the wholesale market
E.g. third party owned and operate generation arrangements might require
renting, leasing, JV etc. costs
E.g. own and operate generation and/ or storage assets

Initial feasibility analysis
7.

40© 2018 KPMG LLP, a UK limited liability partnership and a member firm of the KPMG network of independent member firms affiliated with KPMG International Cooperative (“KPMG International”), a Swiss entity. All rights reserved.
Document Classification: KPMG Confidential
IntroductionInitial feasibility analysis
In this section, we describe our findings from the initial feasibility analysis of a “long list” of electricity procurement opportunities available to HS2. An overview of both the available contractual arrangements and potential technologies available are set out below.
The preceding section has provided an overview of each of the seven evaluation criteria that has been developed in close collaboration with HS2 and its stakeholders, through an iterative process.
The following section undertakes an assessment of each of the contractual structures and technologies against the evaluation criteria. In the mostcases, technologies and contractual arrangements are compared to the HS2’s EC4T base case, to help inform whether or not that option is to beprogressed to the short-list of viable options.
The assessment undertaken uses a combination of quantitative and qualitative analysis, depending on the nature of the criteria.
The outcome of the assessment for some of the evaluation criteria is dependent on the technology chosen. Where this is the case, the criterion doesnot impact the outcome of the viability of that option.
1. Available contractual structures (section 7.1)
2. Potential technologies (section 7.2)
SolarOnshore wind
Offshore wind
Intermittent commercialised renewables (non-dispatchable renewables)
Energy from waste
Base-load renewables / dispatchable renewables
Gas Base-load
Conventional generation
DSR
Battery storage
Other non-generation technologies
Private Wire Solution
Private wire with 3rd party ownershipPrivate wire with direct ownership
Corporate Power Purchase Agreement (PPA)
Sleeved Corporate PPA
Direct Corporate PPA
Traditional electricity supply (EC4T)
Procured through energy supplier

Available contractual structures
7.1

42© 2018 KPMG LLP, a UK limited liability partnership and a member firm of the KPMG network of independent member firms affiliated with KPMG International Cooperative (“KPMG International”), a Swiss entity. All rights reserved.
Document Classification: KPMG Confidential
Introduction to the contractual arrangementsIn this section we provide an overview of the contractual options and commercial structures available to HS2 for electricity procurement over the course of the operational period and the assessment against the evaluation criteria.• Traditionally, large corporates procure electricity through entering into a contract with a large energy supplier (e.g. Big Six in the UK). This means
that the electricity is imported from the national grid where the mixture of the fuel sources generating the electricity purchased invariably mirrors the generation mix of the country. There are instruments available in the electricity market that can provide low carbon electricity supply on the back of the supply contract such as renewable energy certificates (REGOs) or carbon offsets.
• However, these tools have their limitations in that they are hard to trace-back, and there is inherent difficulty in demonstrating the efficiency of carbon credits. This has resulted in the electricity market developing innovative contractual solutions that provide greater transparency of the origin of the electricity procured and provide additional low carbon benefits to the economy as a whole.
• These innovative solutions include procuring renewable energy through corporate PPAs, private wire offtake contracts and direct investment in on-site generation that can offer benefits of cost certainty and optimisation in line with carbon reduction targets.
• The contractual option chosen by HS2 has to comply with its goals and objectives, i.e. the electricity option has to maximise low carbon energy generation in a way that ensures security of supply, reduces exposure to volatile and increasing energy prices, minimises HS2’s upfront capex requirement and promotes HS2’s brand, demonstrating corporate responsibility.
Contractual option Description
Traditional electricity supply (EC4T)
Under this option, the electricity is procured through a contract with an electricity supplier. The contractual arrangement differs typically on the basis of: tenor of the agreement, the degree of fixing of the electricity price, and the costs associated with optimisation of electricity consumption.
Corporate PPA There are different types of Corporate PPAs offering varying benefits and trade-offs:1. Sleeved Corporate PPA: This option is typically a 10-15 year fixed electricity price contract with a renewable
generator whereby the electricity provider manages the balance of electricity demand i.e. the provider “sleeves the PPA”).
2. Direct Corporate PPA: This option is less common as it will require HS2 (the consumer) to contract directly with the generator with no arrangement for alternative/balancing supply thus HS2 being responsible for managing the balancing power and other risks of the physical electricity.
Private wire option Under this option, the energy is purchased from a power plant on (or adjacent to) the sites where the electricity is consumed. Contractually, there are two main categories under this option:
1. The electricity plant is owned by a third party who provides the electricity through a private-wire connected to the customer.
2. The electricity plant is owned by the customer but the design, construction and operation is outsourced to a specialist firm.
Initial feasibility analysis – available contractual structures

43© 2018 KPMG LLP, a UK limited liability partnership and a member firm of the KPMG network of independent member firms affiliated with KPMG International Cooperative (“KPMG International”), a Swiss entity. All rights reserved.
Document Classification: KPMG Confidential
Traditional supply contractTraditionally, when a customer buys electricity through the electricity network, that customer enters into a contract with a supplier who procures the electricity from electricity generators. These generators will differ based on the generation source used to produce the electricity, load profiles and prices. The electricity price paid for the supplier covers different cost elements of the electricity system as set out in the table below.
Generator 1
Generator 2
Generator 3
Supplier/ Trading companies
Customer
Generation cost
Balancingcharges
Transmissioncharges Losses Distribution
charges Policy charges Supplier margin
Description
The cost of generating the
electricity which is influenced by the
technological generation mix on
the market
Balancing Services Use of System charges
(BSUoS) and Balancing charges
are paid for the costs of managing
the system
Transmission Network Use of System
(TNUoS) is the cost of electricity
transmission paid to National Grid
Losses in the transmission and
distribution system
Distribution Network Use of System
(DNUoS) is the costof electricity
distribution paid to the distribution
network operator (DNO)
All the policy charges set by the
Government: Renewables
Obligations, CfD, Capacity Market, Small Scale FITs,
Hydro levy (AAHEDC)
Fee to cover the supplier’s costs
and profits
Nature of the costs
It can be fixed for a period of up to a
year
Fixed price per supplier
The charges are reconciled to cover
actual costs
Rates set by National Grid and the DNOs
The charges are reconciled to cover
actual costsLocational pricing based on HS2’s
connection points
The charges are reconciled to cover actual policy costs
Set by the supplier
Supply Contract
Procurement Contracts Big Six suppliers
Initial feasibility analysis – available contractual structures
Off-takers and traders

44© 2018 KPMG LLP, a UK limited liability partnership and a member firm of the KPMG network of independent member firms affiliated with KPMG International Cooperative (“KPMG International”), a Swiss entity. All rights reserved.
Document Classification: KPMG Confidential
Overview of EC4T contractIn this contractual arrangement, the electricity is being procured through a contract with an electricity supplier. Network Rail applies this approach for procuring electricity on behalf of the rail operators, the current supplier is EDF and all the traction electricity is procured under a framework agreement (EC4T).
We summarise below the EC4T price elements as a baseline of contract available to HS2.
Cost element
Distribution charges
(7%)
Transmission charges
(7.5%)
Margin
(0.2%)
Losses
(1.5%)
Balancing charges
(2%)
Policy charges
(13%)
Wholesale cost
(69%)Breakdown of electricity costs
Ener
gy C
osts
Del
iver
y C
osts
The key elements of the EC4T framework agreement:
Timing
• The current contract commenced in 2014 and will be effective up to 2024.
• The 10 year timeframe is designed to align with the timeframes for franchising/ franchises.
Pricing
• The price elements of the EC4T contract is set out in the chart base. The only price element fixed between EDF and Network Rail is the margin (EDF’s management fee), which is approximately 0.2% of the full price.
• As a general rule of thumb, Network Rail buys month-ahead.
• However, train operating companies can develop their own hedging/ purchasing strategies, and advise Network Rail of when they want Network Rail to purchase their electricity, e.g., winter ahead. Network Rail then purchases this from EDF, at the price that is being charged for winter-ahead at that point in time
• In addition to the full costs of electricity, Network Rail also pays Transmission Exit Charges and Grid Metering charges directly to National Grid.
Special clauses
• The EC4T framework does not set a specific carbon target for the supplier.
• There is no security of supply clause specified in the contract; therefore, Network Rail has built redundancy into their network connection.
Source: Network Rail, Methodology for calculating traction electricity tariffs for charter operators in CP5
EC4T electricity cost breakdown (2013/14)
Initial feasibility analysis – available contractual structures

45© 2018 KPMG LLP, a UK limited liability partnership and a member firm of the KPMG network of independent member firms affiliated with KPMG International Cooperative (“KPMG International”), a Swiss entity. All rights reserved.
Document Classification: KPMG Confidential
Evaluation of EC4TEvaluation criteria
Assessment: Overall assessment
Security of supply
• Traditionally, the UK electricity supply on the transmission network is up to a high standard ofsecurity of supply. It meets the criterion
Deliverability • Procuring electricity through a traditional supply contract provides a high degree of certainty and isunlikely to jeopardise the deliverability of HS2 It meets the criterion
Cost certainty • High uncertainty of wholesale costs, transmission charges, distribution charges and policy costs High uncertainty
Cost optimisation
• The electricity price paid for the supplier is built up by different price elements as shown onprevious slide. Current unit cost for industrial consumers is around £80-110MWh.
High uncertainty for wholesale costs and network charges
Carbon reduction
• HS2’s objective is to outperform the targets set by the UK Government and deliver a much moreaggressive carbon reduction pathway. In order to outperform the decarbonisation rate of thenational targets, green tariffs have to be chosen in the supply contract which can be certified byRenewable Energy Guarantees of Origin (REGO).
It can meet the criterion with the combination of green tariff and REGO
Optimise commercial risk
• The electricity supply market is dominated by the Big Six suppliers, i.e. Scottish Power, SSE, E.On,EDF Energy, nPower and Centrica. These companies are stable on the market and do not carry anycounterparty risk.
It meets the criterion
Capex affordability
• Procuring electricity from the distribution or transmission network does not require any capitalexpenditure from the consumer. It meets the criterion
Initial feasibility analysis – available contractual structures

46© 2018 KPMG LLP, a UK limited liability partnership and a member firm of the KPMG network of independent member firms affiliated with KPMG International Cooperative (“KPMG International”), a Swiss entity. All rights reserved.
Document Classification: KPMG Confidential
Corporate PPA’s – an overviewPower purchase agreements (PPAs) allow a buyer (off-taker) to enter into an agreement with a developer or supplier in order to secure a fixed price of electricity over a given period of time. PPAs are increasingly being used by corporates, and there are anumber of benefits in entering into such an agreement.
Initial feasibility analysis – available contractual structures
• A PPA is a contract between the off-taker (HS2) and an electricity producer (either a developer, generator, or supplier) to purchase electricity at a pre-agreed price for a pre-agreed period of time.
• The PPA contract would contain all the commercial terms of the agreement, including inter alia; the contract length, the delivery times/ dates, volume, price and product and point of delivery.
• The electricity sold under a PPA can be sourced from either a new build project, or from existing generation capacity.
• The pricing structure of a PPA can vary but is often based on either a fixed price (£/MWh), or at a discount to the prevailing wholesale electricity market price.
Drivers for corporate PPAs
• A compatible renewable subsidy regime supports the roll out of renewable corporate PPAs;
• High and volatile wholesale electricity prices provides an incentive for the off-taker to reduce costs and secure increased cost certainty;
• As availability of renewable resource increases, companies look to reduce their carbon footprint have greater opportunities for entering into renewable corporate PPAs;
• As electricity demand growth from company operationsincreases, so too do the costs for purchasing the electricity. Corporate PPAs can help to reduce the volatility and scope of this cost increase.
Corporate PPA Structures
There are different types of Corporate PPAs, these are discussed in more detail on the following slide.
Direct PPA Sleeved PPA
Benefits of corporate PPA’s
There are a number of benefits to both the off-taker and the developer in entering into a corporate PPA.
• Economics – PPAs allow the off-taker to lock in a fixed price for their electricity mitigating the risks of electricity price volatility
• Sustainability – Entering into a renewable corporate PPA, where the electricity bought is generated from a renewable source, corporates are able to reduce their carbon emissions.
• Brand – Corporate PPAs can improve a companies image when in a long standing agreement with a renewable developer.
• Leverage – Compared to owning generation assets, PPAs allow companies to focus on its core areas of activity.

47© 2018 KPMG LLP, a UK limited liability partnership and a member firm of the KPMG network of independent member firms affiliated with KPMG International Cooperative (“KPMG International”), a Swiss entity. All rights reserved.
Document Classification: KPMG Confidential
Corporate PPA structures
There are different types of Corporate PPAs offering varying benefits and trade-offs:
• Sleeved Corporate PPA: This option is typically a 10-15 year fixed electricity price contract with a renewable generator whereby an electricity supplier manages the balance of electricity demand i.e. the supplier “sleeves the PPA”.
• Direct Corporate PPA: This option is less common as it will require HS2 (the consumer) to contract directly with the generator. Under this agreement, there would be no arrangement for alternative/balancing supply, thus HS2 being responsible for managing the balancing and other risks of the physical electricity. We understand that currently in the UK, this direct procurement of electricity will require a supply licence.
Customer
Balancing electricity provider
Sleeved PPA
Generator
Customer
Direct PPA
Under a direct PPA, the customer contracts directly with the generator. The generator then sells the electricity to its own
supplier who credits the customer’s account with the corresponding electricity amount. To KPMG’s knowledge this
arrangement will require HS2 to have a supply licence.Under a sleeved PPA, the customer enters into contract with the
supplier. The supplier is then required to procure a ”Sleeving” arrangement with an energy utility company who tops up the energy to
provide a stable energy supply to the consumer.
Wholesale electricity
market
Contractual arrangement
Initial feasibility analysis – available contractual structures
Wholesale electricity
market
Generator

48© 2018 KPMG LLP, a UK limited liability partnership and a member firm of the KPMG network of independent member firms affiliated with KPMG International Cooperative (“KPMG International”), a Swiss entity. All rights reserved.
Document Classification: KPMG Confidential
Case studies – Corporate PPA
GE & GIG
Renewable direct PPA
There are numerous examples in the electricity market where large electricity consumers procure their energy through a corporate PPA Some of these examples are described below.
• In Sweden, GE and Green Investment Group (GIG formerly known as GIB) have partnered to deliver and operate 650 MW of onshore wind generation.
• The wind farm will be operated by GE through a 20 year Service Agreement.
• The electricity generated by the wind farm will be supplied to one of the largest aluminium producers in the world (a subsidiary of Norsk Hydro) through a 19-year fixed volume PPA.
• The PPA enables the manufacturer to fix a significant amount of its electricity demand.
• The balancing and hedging services for the PPA will be provided by NEAS Energy (part of Centrica plc).
• The PPA is understood to be the largest corporate wind energy PPA in the world.
• The equity partners raised approximately €800M in financing and have commenced construction of the project, which is expected to begin commissioning the turbines in the second half of 2018 and be fully operational by the end of 2019.
Marks & Spencer
Renewable sleeved
PPA
Renewable PPA and
direct investments
• In 2012, Google made a commitment to purchase 100% of its energy demand from renewable sources. In 2017, they have reached that goal.
• In 2010, Google entered into their first PPA with Nextra, a 20-year agreement with a 114 MW capacity wind farm in Iowa.
• Google has also committed over US$1b to renewable projects, mostly in solar PV and onshore wind assets in the US. For example, Google invested US$100m Shepherds Flat Wind Farm in Oregon (845 MW), one of the largest land-based wind farms in the world.
• M&S has a target of procuring or generating 100% renewable electricity for its stores, offices and distribution centres.
• In 2015, M&S completed the installation of the UK’s largest single roof mounted solar panel array on its East Midlands distribution centre in Castle Donington.
• M&S agreed a Power Purchase Agreement with Amber Infrastructure, who operates and maintains the 6.1MWp solar panel array. The agreement runs for 20 years, with commitment from M&S to purchase all the electricity generated by the solar panels.
Source: Companies’ website
Initial feasibility analysis – available contractual structures

49© 2018 KPMG LLP, a UK limited liability partnership and a member firm of the KPMG network of independent member firms affiliated with KPMG International Cooperative (“KPMG International”), a Swiss entity. All rights reserved.
Document Classification: KPMG Confidential
Corporate PPA - SleevedEvaluation criteria Details Evaluation
Security of supply
• Sleeved Corporate PPAs offer the same level of security of supply as the EC4T as “balancing electricity provider” is required to procure and deliver any demand requirements above what the generator can provide.
The criteria issatisfied.
Deliverability • Procuring electricity through a corporate sleeved PPA provides a high degree of certainty and is unlikelyto jeopardise the deliverability of HS2.
The criteria issatisfied.
Carbon reduction • Depending on the technology, it can meet the requirement. For example, if the generation mix of the PPA is mainly based on renewable sources, then the carbon reduction target is met.
Dependent on the technology chosen.
Cost optimisation
• Under a sleeved corporate PPA, the electricity price consists of generation cost, network charges, policy costs and PPA premium. The level of cost depends on the technology contracted under the PPA.
• Cost estimates for the different technologies are set out in section 7.2.
Dependent on the technology chosen.
Cost certainty • The charging mechanism in the PPA differs depending on the agreement between the provider and customer. HS2 can enter a fixed price contracts for the electricity cost/ wholesale market element of the bill increasing price certainty over baseline. For example, renewable technologies are likely to offer cost certainty given that they are not dependent on movements in fuel costs.
Dependent on the technology chosen.
Commercial risk • There are many reliable PPA providers in the market and the commercial risk is minimal. The criteria issatisfied.
Capex affordability • Corporate PPA has no upfront capex requirement. The criteria is
satisfied.
Initial feasibility analysis – available contractual structures
Summary:
• The Sleeved Corporate PPA satisfies all of the evaluation criteria identified. Sleeved PPAs offer the same level of security of supply as a traditional supply does, and can be delivered with no additional capex and the exposure to commercial risk minimised.
• A number of the evaluation criteria (e.g. carbon reduction, cost optimisation and cost certainty) are dependent on the generation technology chosen. However, renewable PPAs can provide the required carbon reduction and also are likely to provide cost certainty given that they are not dependent on movements in fuel costs.
• Corporate sleeved PPA is recommended to be taken forward as a viable contractual structure.
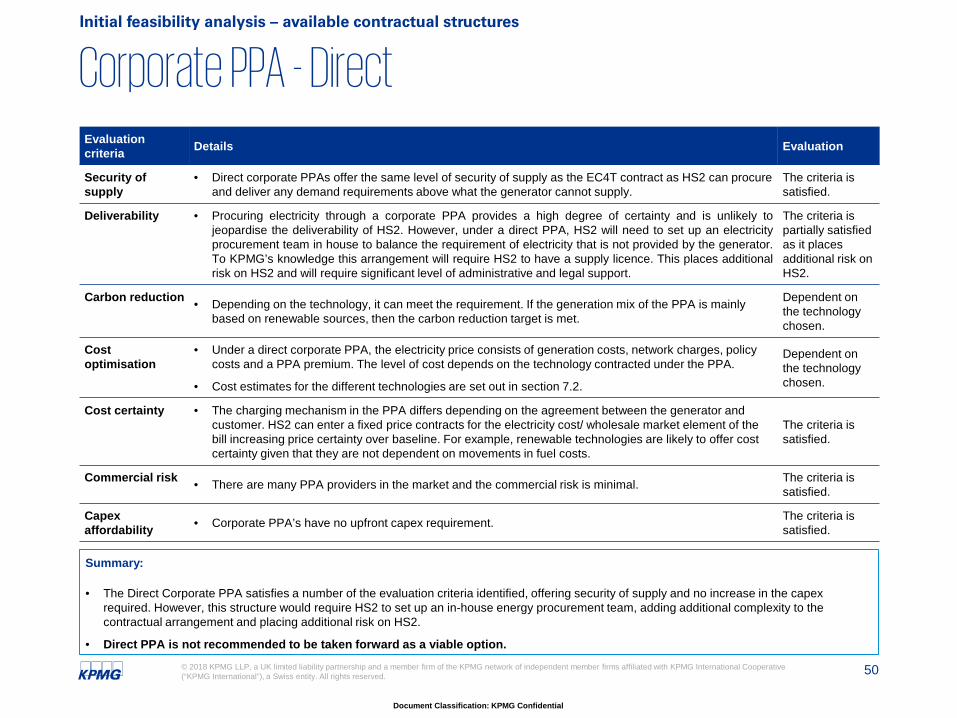
50© 2018 KPMG LLP, a UK limited liability partnership and a member firm of the KPMG network of independent member firms affiliated with KPMG International Cooperative (“KPMG International”), a Swiss entity. All rights reserved.
Document Classification: KPMG Confidential
Corporate PPA - DirectEvaluation criteria Details Evaluation
Security of supply
• Direct corporate PPAs offer the same level of security of supply as the EC4T contract as HS2 can procure and deliver any demand requirements above what the generator cannot supply.
The criteria issatisfied.
Deliverability • Procuring electricity through a corporate PPA provides a high degree of certainty and is unlikely tojeopardise the deliverability of HS2. However, under a direct PPA, HS2 will need to set up an electricityprocurement team in house to balance the requirement of electricity that is not provided by the generator.To KPMG’s knowledge this arrangement will require HS2 to have a supply licence. This places additionalrisk on HS2 and will require significant level of administrative and legal support.
The criteria ispartially satisfied as it places additional risk on HS2.
Carbon reduction • Depending on the technology, it can meet the requirement. If the generation mix of the PPA is mainly based on renewable sources, then the carbon reduction target is met.
Dependent on the technology chosen.
Cost optimisation
• Under a direct corporate PPA, the electricity price consists of generation costs, network charges, policy costs and a PPA premium. The level of cost depends on the technology contracted under the PPA.
• Cost estimates for the different technologies are set out in section 7.2.
Dependent on the technology chosen.
Cost certainty • The charging mechanism in the PPA differs depending on the agreement between the generator and customer. HS2 can enter a fixed price contracts for the electricity cost/ wholesale market element of the bill increasing price certainty over baseline. For example, renewable technologies are likely to offer cost certainty given that they are not dependent on movements in fuel costs.
The criteria is satisfied.
Commercial risk • There are many PPA providers in the market and the commercial risk is minimal. The criteria is satisfied.
Capex affordability • Corporate PPA’s have no upfront capex requirement. The criteria is
satisfied.
Initial feasibility analysis – available contractual structures
Summary:
• The Direct Corporate PPA satisfies a number of the evaluation criteria identified, offering security of supply and no increase in the capex required. However, this structure would require HS2 to set up an in-house energy procurement team, adding additional complexity to the contractual arrangement and placing additional risk on HS2.
• Direct PPA is not recommended to be taken forward as a viable option.

51© 2018 KPMG LLP, a UK limited liability partnership and a member firm of the KPMG network of independent member firms affiliated with KPMG International Cooperative (“KPMG International”), a Swiss entity. All rights reserved.
Document Classification: KPMG Confidential
Private wire – an overview (1)Under a private wire agreement, electricity is purchased from a power plant on (or near) the sites where the electricity is consumed. An overview of the private wire option is set out below.
Initial feasibility analysis – available contractual structures
• Private wire agreements offer an alternative to corporate PPAs in that companies can invest directly in a renewable electricity generation asset on or near their own site; or alternatively commission the construction of the asset by a third party (see next slide).
• Corporates with significant land areas have the opportunity to develop a power plant with a private wire (i.e. behind the meter solution (BTM)).
• Near-site assets may connect the electricity generation to the company by a ‘private wire’, by-passing the grid.
• In many cases however, the off-taker will maintain a connection with the wider distribution or transmission network in order to ensure security of supply for instances where the generator is not able to fulfil the off-takers demand. This is especially the case with renewable generation given their intermittency.
• On-site or near-site generation provides the most direct link between renewable generation and site consumption and can avoid network charges where regulations allow.
• This approach can however be constrained by site requirements, space availability and site conditions for the relevant generation.
• Compared to both corporate PPAs and traditional supply arrangements, the network and policy charges that the off-taker is liable to pay under the private wire is significantly reduced.
Off-takerGenerator
Wider distribution/ transmission network
Private wire structure
Private wire connection between generator and off-taker
Connection with wider network to ensure security of supply

52© 2018 KPMG LLP, a UK limited liability partnership and a member firm of the KPMG network of independent member firms affiliated with KPMG International Cooperative (“KPMG International”), a Swiss entity. All rights reserved.
Document Classification: KPMG Confidential
Private wire – an overview (2)Under the private wire model, there are two high level categories that contractual structures fall into; private wire with direct ownership, and private wire with 3rd party ownership.1. 3rd party ownership - The power plant is owned by a third party who provides the electricity through a private-wire connected to the customer;
2. Direct ownership - The power plant is owned by the customer but the design, construction and operation is outsourced to a specialist firm.
Power plantCustomer
3rd party
Power plant
Customer
3rd party
Ownership
Ownership
Private wire with direct ownershipPrivate wire with 3rd party ownership
Design, Build, Operation & Maintenance
Outsourced: Design, Build, Operation & Maintenance
Initial feasibility analysis – available contractual structures
Owning the asset requires the company to make the initial capital investment with a payback period (technology and location
dependent). However, ongoing maintenance, risk of cost over runs and sub-design performance could be the responsibility of
the contractor depending on the agreement.
By outsourcing to a third party and buying power through a behind the meter arrangement, the corporate buyer is not
responsible for the financing, installation and maintenance of the generation asset. This removes the initial capital requirement and
operational risk.

53© 2018 KPMG LLP, a UK limited liability partnership and a member firm of the KPMG network of independent member firms affiliated with KPMG International Cooperative (“KPMG International”), a Swiss entity. All rights reserved.
Document Classification: KPMG Confidential
Case studies – Private wire
Scottish Water
Direct ownership in power plants and private wire
There are numerous examples in the electricity market where large electricity consumers procure their energy through a combination of private wire and own investment in generation. Some of these examples are described below.
• Scottish Water is one the biggest electricity consumers in the UK, with a yearly demand of c.450 GWh across Scotland.
• Through a combination of Scottish Water’s own investment in renewable energy and hosting private investment on its estate through private wire, they now generate more renewable energy than they consume.
• Scottish Water has a diversified asset portfolio including hydro, wind, photovoltaic solar and combined heat and power (CHP) generation. They currently own 29 hydro turbines, 18 small scale wind turbines, 24 solar schemes, 2 biomass boilers and 2 CHP plants.
• They are also constantly exploring private wire opportunities to be connected to their assets, including community owned ones.
Source: Companies’ website
Initial feasibility analysis – available contractual structures
IKEA
Direct investment
in own generation
Ineos
On-site generation
• IKEA makes major investments in renewable energy projects in order to meet the expectation of sourcing 100% of the energy consumed at its stores, and by subcontractors, by 2020.
• It owns 314 offsite wind turbines and 700,000 solar panels on IKEA buildings.
• It procures a significant proportion of renewable energy from directly financed generation capacity, and has spent €1.5bn since 2009.
• Ineos has formed a special purpose vehicle with Viridor and Laing to design, build, finance and operate a new energy from waste CHP facility on their Runcorn site.
• The investments is a £400m, 750ktpa energy from waste on-site facility (70MW electricity + 50MW heat) producing about 20% of the firm’s total energy needs from renewable sources.
• The development is being funded through a mixture of public and private finance.
• There is a 25-year fixed electricity/ heat price in place with an equity upside.

54© 2018 KPMG LLP, a UK limited liability partnership and a member firm of the KPMG network of independent member firms affiliated with KPMG International Cooperative (“KPMG International”), a Swiss entity. All rights reserved.
Document Classification: KPMG Confidential
Private wire with 3rd party ownership (1/2)Evaluation criteria Details Evaluation
Security of supply
• The level of security of supply provided by a private wire option depends on the technology used for electricity generation. For example, intermittent renewable generation sources are not able to satisfy the security of supply requirement on their own, maintaining a connection with the wider distribution or transmission network and backup generation or storage is required to secure the supply.
• Given that the power plant is either on-site, or the consumer is directly connected to the power plant, the option has the potential to offer a greater degree of security of supply than the base-line.
The criteria is satisfied subject to renewables are coupled with a network connection to the network as back up
Deliverability • The deliverability of a private wire option for HS2 is highly dependent on the outcome of a detailed technical feasibility study. The feasibility study has to consider site specific issues, e.g. connection plans, available land.
• Depending on the scale and technology chosen, the option can be deliverable and can meet the requirement.
Dependent on the technology chosen and subject to detailed technical feasibility studies.
Carbon reduction • Depending on the technology used, it can meet the requirement. For example, if the generation mix is mainly based on renewable sources, then the carbon reduction target is met.
Dependent on the technology chosen.
Cost optimisation • In case of a private wire option, the final electricity price paid by the customer can be reduced in
comparison to base-line as there is a potential to reduce: (i) network (transmission or distribution) charges; and (ii) policy costs (e.g. climate change levies).
The criteria is satisfied.
Cost certainty • Depending on the technology used, it can meet the requirement. For example, renewable technologies are likely to offer cost certainty given that they are not dependent on movements in fuel costs.
Dependent on the technology chosen.
Commercial risk • For the private wire element, the technology choices of solar and onshore wind are already commercially proven technologies with significant capacity deployed in the market. The commercial risk for these technologies can only arise if a non-proven developer is chosen for the development and operation.
It meets the subject to choosing an established 3rd party developer
Capex affordability
• Private wire option can be developed by third parties, in which case the project has no additional capex requirement from the customer. The criteria is satisfied.
Initial feasibility analysis – available contractual structures

55© 2018 KPMG LLP, a UK limited liability partnership and a member firm of the KPMG network of independent member firms affiliated with KPMG International Cooperative (“KPMG International”), a Swiss entity. All rights reserved.
Document Classification: KPMG Confidential
Private wire with 3rd party ownership (2/2)Initial feasibility analysis – available contractual structures
Summary:
• The private wire with 3rd party ownership model satisfies a number of the evaluation criteria. The arrangement has the potential to provide a greater level of security of supply than the base case, has the potential for the final electricity price paid by HS2 to be reduced beyond the base case, and can be delivered with no additional capex.
• A number of the evaluation criteria (e.g. carbon reduction and cost certainty) are dependent on the generation technology chosen. However, renewable PPAs can provide the required carbon reduction and also are likely to provide cost certainty given that they are not dependent on movements in fuel costs.
• However, the deliverability of a private wire solution is highly dependent on detailed technical feasibility studies.
• Private wire with 3rd party ownership is recommended to be taken forward as a viable option.

56© 2018 KPMG LLP, a UK limited liability partnership and a member firm of the KPMG network of independent member firms affiliated with KPMG International Cooperative (“KPMG International”), a Swiss entity. All rights reserved.
Document Classification: KPMG Confidential
Private wire with direct ownership (1/2)Evaluation criteria Details Evaluation
Security of supply
• The level of security of supply provided by a private wire option depends on the technology used for electricity generation. For example, intermittent renewable generation sources are not able to satisfy the security of supply requirement on their own, maintaining a connection with the wider distribution or transmission network and backup generation or storage is required to secure the supply.
• Given that the power plant is either on-site, or the consumer is directly connected to the power plant, the option has the potential to offer a greater degree of security of supply than the base-line.
The criteria issatisfied subject to renewables are coupled with a network connection to the network as back up
Deliverability • The deliverability of a private wire option for HS2 is highly dependent on the outcome of a detailed technical feasibility study. The feasibility study has to consider site specific issues, e.g. connection plans, available land.
• Depending on the scale and technology chosen, the option can be deliverable and can meet the requirement.
Dependent on the technology chosen and subject to detailed technical feasibility studies.
Carbon reduction • Depending on the technology used, it can meet the requirement. For example, if the generation mix is mainly based on renewable sources, then the carbon reduction target is met.
Dependent on the technology chosen.
Cost optimisation
• In case of a private wire option, the final electricity price paid by the customer can be reduced in comparison to base-line as there is a potential to reduce: (i) network (transmission or distribution) charges; and (ii) policy costs (e.g. climate change levies).
The criteria issatisfied.
Cost certainty • Depending on the technology used, it can meet the requirement. For example, renewable technologies are likely to offer cost certainty given that they are not dependent on movements in fuel costs.
Dependent on the technology chosen.
Commercial risk • For the private wire element, the technology choices of solar and onshore wind are already commercially proven technologies with significant capacity deployed in the market. The commercial risk for these technologies can only arise if a non-proven developer is chosen for the development and operation.
It meets the subject to choosing an established 3rd
party developer
Capex affordability
• In case of direct ownership the degree of capex requirement varies from the cost of land up to the full cost of the development depending on the financing structure chosen, i.e. balance sheet or private finance option.
The criteria is not satisfied.
Initial feasibility analysis – available contractual structures

57© 2018 KPMG LLP, a UK limited liability partnership and a member firm of the KPMG network of independent member firms affiliated with KPMG International Cooperative (“KPMG International”), a Swiss entity. All rights reserved.
Document Classification: KPMG Confidential
Private wire with direct ownership (1/2)Initial feasibility analysis – available contractual structures
Summary:
• The private wire with direct ownership model has the potential to provide a greater level of security of supply than the base case, and for the final electricity price paid by HS2 to be reduced beyond the base case.
• However, in the case of direct ownership, there is a requirement for significant additional capex above HS2’s currently agreed budget.
• Private wire option with direct ownership is not recommended to be taken forward as a viable option.

Potential technologies
7.2
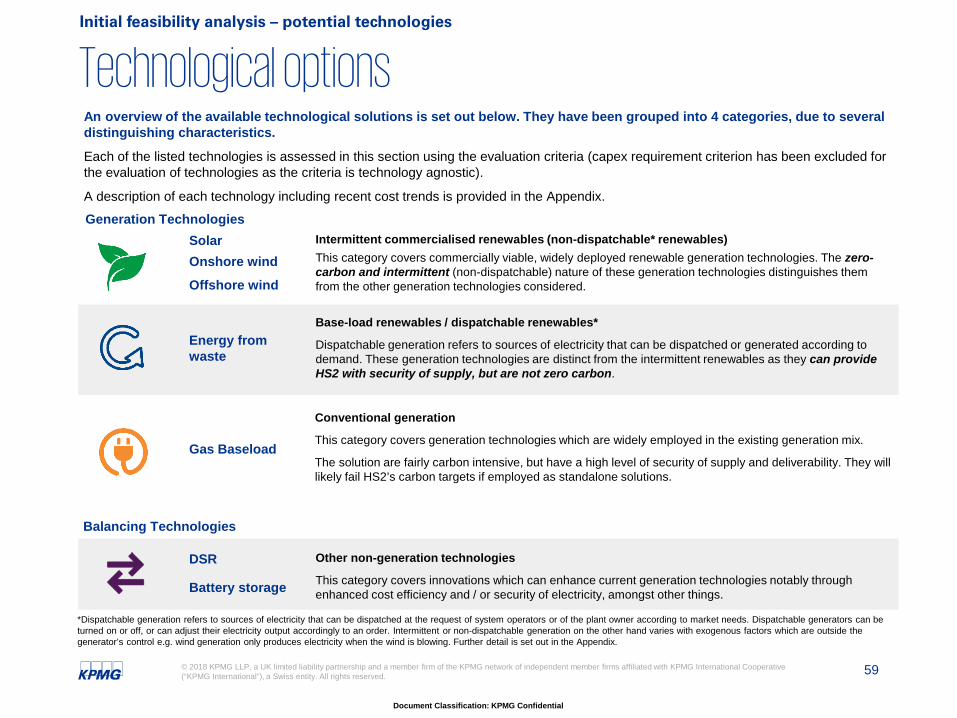
59© 2018 KPMG LLP, a UK limited liability partnership and a member firm of the KPMG network of independent member firms affiliated with KPMG International Cooperative (“KPMG International”), a Swiss entity. All rights reserved.
Document Classification: KPMG Confidential
Technological options
SolarOnshore windOffshore wind
Energy from waste
Gas Baseload
DSR
Battery storage
Intermittent commercialised renewables (non-dispatchable* renewables)This category covers commercially viable, widely deployed renewable generation technologies. The zero-carbon and intermittent (non-dispatchable) nature of these generation technologies distinguishes them from the other generation technologies considered.
Base-load renewables / dispatchable renewables*
Dispatchable generation refers to sources of electricity that can be dispatched or generated according to demand. These generation technologies are distinct from the intermittent renewables as they can provide HS2 with security of supply, but are not zero carbon.
Conventional generation
This category covers generation technologies which are widely employed in the existing generation mix.
The solution are fairly carbon intensive, but have a high level of security of supply and deliverability. They will likely fail HS2’s carbon targets if employed as standalone solutions.
Other non-generation technologies
This category covers innovations which can enhance current generation technologies notably through enhanced cost efficiency and / or security of electricity, amongst other things.
An overview of the available technological solutions is set out below. They have been grouped into 4 categories, due to several distinguishing characteristics.
Each of the listed technologies is assessed in this section using the evaluation criteria (capex requirement criterion has been excluded for the evaluation of technologies as the criteria is technology agnostic).
A description of each technology including recent cost trends is provided in the Appendix.
*Dispatchable generation refers to sources of electricity that can be dispatched at the request of system operators or of the plant owner according to market needs. Dispatchable generators can be turned on or off, or can adjust their electricity output accordingly to an order. Intermittent or non-dispatchable generation on the other hand varies with exogenous factors which are outside the generator’s control e.g. wind generation only produces electricity when the wind is blowing. Further detail is set out in the Appendix.
Initial feasibility analysis – potential technologies
Generation Technologies
Balancing Technologies

60© 2018 KPMG LLP, a UK limited liability partnership and a member firm of the KPMG network of independent member firms affiliated with KPMG International Cooperative (“KPMG International”), a Swiss entity. All rights reserved.
Document Classification: KPMG Confidential
Solar (1)
Evaluation criteria Details Evaluation
Security of supply • Given its intermittent nature, solar cannot be the only technology employed to meet HS2’s needs as it will not provide the required level of security of supply.
Would need to be coupled with other contractual or technological options to ensure required level of security of supply.
Deliverability • Development phase:• Up to 2 year for <50MW;• Up to 3 years for >50MW
• Construction period:• 1-2 years depending on size and location
• The largest solar farm in the UK (the Shotwick solar farm near Liverpool) has an installed capacity of 72MW which translates into a maximum output of 70GWh of electricity/year.
Proven technology that meets the deliverability criteria as solar can be deployed relatively quickly.
Carbon reduction • Solar represents a zero-carbon generation solution and would meet HS2’s carbon reduction targets as an individual solution.
Exceeds HS2’s carbon reduction targets.
Cost optimisation • Installation cost of both small- and large-scale solar capacity continues to fall, improving the economics of future installations and hence enabling it to deploy without subsidies.
• BEIS estimates that the LCOE of solar will continue to fall between 2020 and 2030, with the cost falling to less than £60/MWh by the end of 2020s.
• In addition, HS2 will have to bear the cost of balancing power as solar generation is an intermittent generation source.
The cost of solar is expected to reach grid parity in the near future, with the first subsidy free solar farm opened in Sept 2017 (Clayhill Solar)
Cost certainty • The LCOE of solar can be broken down broadly into two components: construction costs and generation/marginal costs. The generation costs of solar is zero, and the construction costs should also be fairly certain once the project has been commissioned.
Nil marginal cost can ensure price certainty for HS2.
Optimise commercial risk
• Solar is a commercially proven generation solution as demonstrated by the accelerated uptake of solar installed in the past 5 years. There is a sizeable operational capacity in the UK (12.3GW).
Solar PV is a commercially viable technology with a strong track record and a number of players in the market.
The evaluation of the suitability of solar generation (alone) according to HS2’s criteria is set out below.
Initial feasibility analysis – potential technologies

61© 2018 KPMG LLP, a UK limited liability partnership and a member firm of the KPMG network of independent member firms affiliated with KPMG International Cooperative (“KPMG International”), a Swiss entity. All rights reserved.
Document Classification: KPMG Confidential
Solar (2)
Summary:
• Solar generation is a technology that has a proven track record for its commercial viability and represents a zero-carbon generation solution. It can be deployed in a relatively short time-frame, when compared with the other options in the long-list, and has a number of established players in the market.
• The cost of solar is falling and has shown to be more cost efficient relative to the traditional supply when deployed via private wire solution. Furthermore, with zero marginal cost, there is significant cost certainty associated with solar generation.
• However, given its intermittent nature, solar cannot be the only technology employed to meet HS2’s needs as it will not provide the required level of security of supply. It would need to be coupled with other contractual or technological options to ensure required level of security of supply.
• In light of the above, solar generation is recommended to be taken forward.
Initial feasibility analysis – potential technologies

62© 2018 KPMG LLP, a UK limited liability partnership and a member firm of the KPMG network of independent member firms affiliated with KPMG International Cooperative (“KPMG International”), a Swiss entity. All rights reserved.
Document Classification: KPMG Confidential
Onshore wind (1)Evaluation criteria Details Evaluation
Security of supply
• Given its intermittent nature, onshore wind by itself would not be an appropriate solution for HS2 - instead, it would need to be coupled with a storage solution and a connection to the network to ensure security of supply.
Would need to be coupled with other contractual or technological options to ensure required level of security of supply.
Deliverability • Development phase:• Up to 2-5 year for<50MW;• Up to 4-5 years for >50MW
• Construction period:• 2-3 years depending on size and location
• The largest windfarm in the UK (the Whitelee Wind Farm) currently has a maximum capacity of only 539MW.
Proven technology that largely meets the deliverability criteria, despite the fact that onshore wind cannot be constructed as quickly as solar.
Carbon reduction
• Onshore wind represents a zero-carbon generation solution and would meet and exceed HS2’s carbon reduction targets as an individual solution.
Satisfies the criterion.
Cost optimisation
• Significant cost reduction as a result of the falling costs of onshore wind and further evidenced by falling clearing prices in continental Europe, offering less than £55/MWh by 2030.
• In addition, HS2 will have to bear the cost of balancing power as wind generation is an intermittent generation source.
The cost of onshore wind is expected to fall below wholesale market prices.
Cost certainty • The LCOE of onshore wind can be broken down broadly into two components: construction costs and generation/marginal costs. The generation costs of onshore wind is zero, and the construction costs should also be fairly certain once the project has been commissioned for.
Nil marginal cost can ensure price certainty for HS2.
Optimisecommercial risk
• Onshore wind is a commercially proven generation solution as demonstrated by the increasing uptake in capacity since its introduction. There is a sizeable operational capacity in the UK (over 11 GW).
• Onshore wind has however faced resistance from local communities and adverse policy changes (new onshore wind in England has stalled since policy changes in 2015) which introduces a degree of commercial risk.
A number of commercial risks in the planning and consenting stage however commercially viable and proven technology.
A high-level evaluation of the suitability of onshore wind generation (alone) according to HS2’s criteria is set out below.
Initial feasibility analysis – potential technologies

63© 2018 KPMG LLP, a UK limited liability partnership and a member firm of the KPMG network of independent member firms affiliated with KPMG International Cooperative (“KPMG International”), a Swiss entity. All rights reserved.
Document Classification: KPMG Confidential
Onshore wind (2)Initial feasibility analysis – potential technologies
Summary:
• Onshore wind is a technology with a proven track record for its commercial viability and represents a zero-carbon generation solution, significantly exceeding HS2’s carbon targets. Whilst the deployment period for onshore wind is longer than that for solar, it is significantly shorter than for both offshore wind and conventional thermal generation.
• With zero marginal cost, there is significant cost certainty associated with onshore wind.
• Despite being an established technology with a strong track record for commercial viability, there continues to be a number of commercial risks associated with onshore wind in the planning and consenting stages of development.
• Further, given its intermittent nature, onshore wind cannot be the only technology employed to meet HS2’s needs as it will not provide the required level of security of supply. It would need to be coupled with other contractual or technological options to ensure required level of security of supply.
• On balance, onshore wind is recommended to be taken forward as a viable option.

64© 2018 KPMG LLP, a UK limited liability partnership and a member firm of the KPMG network of independent member firms affiliated with KPMG International Cooperative (“KPMG International”), a Swiss entity. All rights reserved.
Document Classification: KPMG Confidential
A high-level evaluation of the suitability of offshore wind generation (alone) according to HS2’s criteria is set out below.
Offshore wind (1)
Evaluation criteria Details Evaluation
Security of supply
• Given its intermittent nature, offshore wind cannot be the only technology employed to meet HS2’s electricity needs as it will not provide the required level of security of supply.
Would need to be coupled with other contractual or technological options to ensure required level of security of supply.
Deliverability • Development phase:• Up to 5 years;
• Construction period:• 2-5 years depending on size and location
• Total installed capacity in the UK as at the end of 2016 is c.5GW. At present, the 630MW London Array offshore wind farm is the largest in the world.
• Significant development and construction risk.
A proven technology with an established track record, offshore wind is a deliverable technology. Development and construction stages significantly longer than for onshore wind or solar.
Carbon reduction
• Offshore wind represents a zero-carbon generation solution and would meet and exceed HS2’s carbon reduction targets as an individual solution.
Exceeds HS2’s carbon reduction targets.
Cost optimisation
• Costs are falling rapidly, and newly consented offshore wind farms are likely to be able to operate on a zero-subsidy basis over the coming decade, following the trends set by developers on mainland Europe. As such, the Government has indicated that it may remove the subsidy for offshore wind but no clear commitment has been made to date.
• HS2 will have to bear balancing costs as offshore wind generation is intermittent.
The cost of offshore wind is likely to be more cost efficient relative to traditional supply.
Cost certainty • The LCOE of offshore wind can be broken down broadly into two components: construction costs and generation/marginal costs.
• The generation, or marginal, costs for offshore wind is zero, and the construction costs should also be fairly certain once the project has been commissioned.
Nil marginal cost can ensure price certainty for HS2.
Initial feasibility analysis – potential technologies

65© 2018 KPMG LLP, a UK limited liability partnership and a member firm of the KPMG network of independent member firms affiliated with KPMG International Cooperative (“KPMG International”), a Swiss entity. All rights reserved.
Document Classification: KPMG Confidential
Offshore wind (2)Evaluation criteria Details Evaluation
Optimise commercial risk
• Offshore wind is a commercially proven generation solution as demonstrated by both the current and forecasted installed offshore wind capacity in the UK.
• There is a sizeable operational capacity in the UK (5GW). • Offshore wind has faces a number of challenges in the planning, consenting and
construction phases which carry a degree of commercial risk.
With a proven track record, offshore wind represents acommercially viable option. Despite this, there are a number of commercial risks at different development stages that would need to be managed.
Initial feasibility analysis – potential technologies
Summary:
• Offshore wind is a technology with a proven track record for its commercial viability and represents a zero-carbon generation solution, significantly exceeding HS2’s carbon targets. The cost of offshore wind is likely to be more cost efficient relative to HS2’s traditional supply. Furthermore, with zero marginal cost, there is significant cost certainty associated with onshore wind.
• Whilst being an established technology with a strong track record for commercial viability, there are a number of commercial risks at a number of key development stages that would need to be closely managed by the developer.
• Given the size and scale of offshore wind development, the deployment timeframes are, generally speaking, significantly longer than both solar and onshore wind, and potentially even conventional thermal generation.
• Based on soft market testing, a proportion of a wind farm’s capacity could be ring fenced for inclusion in a contractual arrangement. i.e. the large scale of offshore wind generation would not preclude it from being considered as a viable technology option.
• Given its intermittent nature, offshore wind cannot be the only technology employed to meet HS2’s needs as it will not provide the required level of security of supply. It would need to be coupled with other contractual or technological options to ensure required level of security of supply.
• Considering the above, offshore wind is recommended to be taken forward as a viable option.

66© 2018 KPMG LLP, a UK limited liability partnership and a member firm of the KPMG network of independent member firms affiliated with KPMG International Cooperative (“KPMG International”), a Swiss entity. All rights reserved.
Document Classification: KPMG Confidential
Energy from waste, EfW (1)Evaluation criteria
Details Evaluation
Security of supply
• EfW generation is dispatchable and therefore should not provide any issues with regards to security of supply.
EfW would meet the security of supply criteria without the need for additional technologies orcontracting arrangements.
Deliverability • Development phase:• Up to 2 years for <50MW;• Up to 3 years for >50MW
• Construction period:• 1-2 years depending on size and location
• The largest installed capacity at a UK-based EfW plant is 72MW (Cory Riverside Energy Recovery Facility, which processes residual ‘back bin’ waste to produce energy).
• Careful consideration needs to be given to the planning stage as EfW plants are likely to require extensive planning permission in terms of specific location and land requirements.
A proven technology with an established track record, EfW generation is a deliverable technology. Planning stages will require due care and consideration given complexities of the planning process.
Carbon reduction
• Some degree of CO2 emissions and other particulate matter associated with generation but appears to be within HS2’s carbon limits.
• Depending on the type of EfW plant, BEIS estimates that emissions could be between 14g-35gO2e per kWh.
EfW has higher CO2 emissions than solar or wind generation, but is likely to be within HS2’s carbon reduction targets.
Cost optimisation
• BEIS estimates that the LCOE of EfW is £45/MWh in 2020 and £43/MWh 2025, where the variation is largely due to construction costs and waste procurement costs.
EfW has competitive generation cost compared to the wholes market, however, the operational cost is highly dependent on the cost fuel stock.
Cost certainty • EfW plant are paid gate fees to remove waste, this is driven by the availability of waste in the area. EfW plant may have to significantly reduce their gate fees to unsure ample feedstock supply
• For non waste plant a cost is associated with the feedstock which results in higher marginal costs compared to wind or solar
It is possible that feedstock prices will vary over time. EfW therefore has lower cost certainty than that of solar or wind generation.
A high-level evaluation of the suitability of EfW generation (alone), according to HS2’s criteria, is set out below.
Initial feasibility analysis – potential technologies

67© 2018 KPMG LLP, a UK limited liability partnership and a member firm of the KPMG network of independent member firms affiliated with KPMG International Cooperative (“KPMG International”), a Swiss entity. All rights reserved.
Document Classification: KPMG Confidential
Energy from waste, EfW (2) Evaluation criteria Details Evaluation
Optimise commercial risk
• EfW is a commercially proven solution as demonstrated by the significant proportion of EfW in terms of overall renewables generation. There is a sizeable operational capacity in the UK.
• There could also be specific planning considerations which need to be addressed during the planning stage (mainly land and location requirements) to optimise commercial risk, depending on the type of contract.
With a proven track record, EfW represents a commercially viable option, albeit with some complexity around planning and construction.
Initial feasibility analysis – potential technologies
Summary:
• Energy from Waste generation represents a commercially viable option with a proven track record. It is a dispatchable form of generation and would therefore meet the security of supply criteria without the need for additional technologies or contracting arrangements.
• EfW has higher CO2 emissions than solar or wind generation, but is likely to still be within HS2’s carbon reduction targets.
• EfW has higher marginal costs than both solar and wind powered generation. Furthermore, it is possible that feedstock prices will vary over time, with potential volatility at periods of high demand. EfW therefore has lower cost certainty than that of solar or wind generation.
• Despite being a relatively established technology with a proven track record, EfW plants are likely to require extensive planning permission in terms of specific location and land requirements.
• Considering the above, Energy from Waste generation is not recommended to be taken forward as a viable option.

68© 2018 KPMG LLP, a UK limited liability partnership and a member firm of the KPMG network of independent member firms affiliated with KPMG International Cooperative (“KPMG International”), a Swiss entity. All rights reserved.
Document Classification: KPMG Confidential
Gas baseload (1)
Evaluation criteria
Details Evaluation
Security of supply
• Gas generation is dispatchable and therefore should not provide any issues with regards to security of supply.
Gas baseload would meet the security of supply criteria without the need for additional technologies orcontracting arrangements.
Deliverability • Construction period:• 2-3 years depending on size and location
• The largest installed capacity at a UK-based gas CCGT plant is c. 2GW (Pembroke Power Station).
• Careful consideration needs to be taken at the planning stage as gas CCGTs are likely to require extensive planning permission in terms of specific location and land requirements. They also have a long asset life so there is a degree of asset stranding risk.
Despite being an established technology with a proven track record, there are a number of complexities associated with the planning stage of new CCGT plants.
Carbon reduction
• Depending on the type of CCGT plant, BEIS estimates that emissions could be between 300g-400gCO2e per kWh. It does not appear to be within HS2’s targets.
Does not meet the criterion
Cost optimisation
• BEIS estimates that the LCOE of gas CCGTs is £66/MWh in 2020 and £82/MWh 2025. Gas baseload generation has higher cost than the forecast wholesale market price
Cost certainty • The cost of fuel results in higher marginal costs compared to wind or solar, although developers receive capacity payments to ensure security of supply.
Higher marginal cost than those technologies with zero marginal cost. There is also commodity risk in that gas prices vary over time, and are volatile at periods of tight margins.
Initial feasibility analysis – potential technologies
A high-level evaluation of the suitability of gas baseload plant according to HS2’s criteria is set out below.

69© 2018 KPMG LLP, a UK limited liability partnership and a member firm of the KPMG network of independent member firms affiliated with KPMG International Cooperative (“KPMG International”), a Swiss entity. All rights reserved.
Document Classification: KPMG Confidential
Gas baseload (2) Evaluation criteria Details Evaluation
Optimise commercial risk
• Gas baseload is a commercially proven solution as demonstrated by the significantproportion of gas CCGTs in terms of overall generation (20% - 30% in the last 5 years). There is a sizeable operational capacity in the UK.
• There could also be specific planning considerations which need to be addressed during the planning stage (mainly land and location requirements) to optimise commercial risk, depending on the type of contract.
With a proven track record, gas CCGT represents a commercially viable option, albeit with higher opex than solar or wind generation solutions.
Summary:
• Gas baseload represents a commercial viable option with a proven track record. It is a dispatchable form of generation and would therefore meet the security of supply criteria without the need for additional technologies or contracting arrangements.
• Gas generation releases higher CO2 emissions than solar or wind generation, but is likely to still be within HS2’s carbon reduction targets in the short term. However, gas fired power plants have an average asset life of around 25 years, and it is unlikely that gas baseload generation will be compatible with HS2’s carbon reduction targets over the 25 year life of the asset.
• Gas baseload has higher marginal costs than the renewable options. Furthermore, it is highly likely that natural gas prices will vary over time, with potential volatility at periods of tight margins. Gas baseload therefore has significantly lower cost certainty than that of both solar or wind generation.
• Considering the above, especially noting the implication of the 25 year asset life, gas baseload generation is not recommended to be taken forward as a viable option.
Initial feasibility analysis – potential technologies
Note that gas peaking has not been included in the analysis due to the peaking nature of its operation which is not compatible with HS2’s requirements. More information is available in the appendix

70© 2018 KPMG LLP, a UK limited liability partnership and a member firm of the KPMG network of independent member firms affiliated with KPMG International Cooperative (“KPMG International”), a Swiss entity. All rights reserved.
Document Classification: KPMG Confidential
Demand Side Response (DSR) Evaluation criteria Details
Security of supply • DSR can enhance security of supply when coupled with other technologies by providing short term back-up on non-traction assets.
Deliverability • In HS2’s case DSR is likely only to be viable as an enhancement to non-traction assets. However, it presents a significant opportunity when paired with on-site generation such as battery storage for HS2’s traction assets.
Carbon reduction • DSR can enable the implementation of low carbon generation and therefore reduce the carbon emissions of the system as a whole
Cost optimisation • DSR could offset HS2’s significant electricity costs as it constitutes an additional stream of revenues from providing grid balancing services.
Cost certainty • Low capex and opex involved in performing DSM
Optimise commercial risk
• There is minimal commercial risk associated with DSR solutions. This is due to the fact that there is currently significant Government support for DSR. However, there are a large number of technology participants in the market offering DSR solutions.
A high-level evaluation of how DSR can enhance HS2’s generation options, according to HS2’s evaluation criteria is set out below.
Summary:
• DSR is best used alongside intermittent generation technology to create flexibility in the system, which can add to the security of supply when the generation is not outputting.
• DSR is able to help accrue revenue through a number of different revenue streams (e.g. price arbitrage, ancillary service provision, capacity market payments etc.). Combining these various streams into a revenue stack, helps to support the commercial viability of the chosen electicityoption.
• The costs involved in deploying DSR technology is minimal and there are a large number of technology participants in the market offering DSR solutions.
• Considering the above, DSR technology is recommended to be taken forward as a viable option.
Initial feasibility analysis – potential technologies

71© 2018 KPMG LLP, a UK limited liability partnership and a member firm of the KPMG network of independent member firms affiliated with KPMG International Cooperative (“KPMG International”), a Swiss entity. All rights reserved.
Document Classification: KPMG Confidential
A high-level evaluation of how battery storage solutions can enhance HS2’s generation options, according to HS2’s evaluation criteria is set out below.
Battery storage
Evaluation criteria Details
Security of supply • Enhances the security of supply of intermittent renewables in particular, but would offer HS2 opportunities to smooth its demand curve and enhance the resilience of its electricity supply.
Deliverability • Lithium-ion and pumped hydro technologies are commercially viable battery storage options at this stage.
Carbon reduction • Storage can enable the implementation of low carbon generation and therefore reduce the carbon emissions of the system as a whole.
Cost optimisation • The cost of storage technologies is expected to fall significantly in the next decade. Battery storage could offset HS2’s significant electricity costs as it constitutes an additional stream of revenues from providing grid balancing services.
Cost certainty • Storage can export during periods of low generation (relative to demand), allowing it to capture peak prices, whilst smoothing and reducing prices.
Optimise commercial risk
• There are a large, and increasing, number of storage technology participants including installers and operators.
Initial feasibility analysis – potential technologies
Summary:
• Battery storage is best used alongside intermittent generation technology to create flexibility in the system, which can add to the security of supply when the generation is not outputting.
• Battery storage technologies are able to accrue revenue through a number of different revenue streams (e.g. price arbitrage, ancillary service provision, capacity market payments etc.). Combining these various streams into a revenue stack, helps to support the commercial viability of battery storage.
• The costs involved in deploying battery storage have decreased markedly in recent years, and this trend is expected to continue in future years. As these costs fall, the commercial case for battery storage strengthens further.
• When coupled with intermittent generation (solar or offshore/ onshore wind), battery storage can significantly enhance the resilience of HS2’s security of supply.
• Considering the above, battery storage technology is recommended to be taken forward as a viable option.

Summary of commercial structures and technologies
7.3

73© 2018 KPMG LLP, a UK limited liability partnership and a member firm of the KPMG network of independent member firms affiliated with KPMG International Cooperative (“KPMG International”), a Swiss entity. All rights reserved.
Document Classification: KPMG Confidential
Available contractual structures - summaryProcuring sustainable, reliable and affordable electricity that is able to deliver on HS2’s strategic objectives will be critical to the operation of the project.
Contractual option Key Considerations
Traditional supply
- It offers the most deliverable and low risk option for HS2. It is critical to ensuring security of supply essentially offering GB electricity market’s reliance.
- However, it is exposed to fluctuations in electricity prices (wholesale costs, network charges, policy costs) and it is unlikely to meet the decarbonisation target in a cost efficient manner.
- Downside costs: This option is exposed to changes in policy costs and rising network costs which could significantly impact the operation costs.
- Volatility risk: Traditional supply contract does not offer long term price certainty.
Sleeved renewable corporate PPA
- The analysis concludes that this option can offer the reliability of a supplier managing HS2’s consumption profile, with the potential of stable prices, without CAPEX increments.
- This option can offer partial cost certainty (HS2 will still be exposed to changes in network and policy costs) and will likely allow HS2 to meet its decarbonisation target in a cost efficient manner.
- Reputational risk: Locking in a PPA at a certain cost and the cost of other renewable technologies falls in an unprecedented manner.
Third party owned and operated private wire
- It is a cost optimal solution as the rising policy charges can be avoided.- It has the ability to meet HS2’s carbon reduction targets with stable costs
given the forecasted reduction in cost of renewable technologies.- Taking into account HS2’s deliverability considerations a certain amount of
energy needs to be procured from the traditional sources to avoid any security of supply considerations
- This solution can not be considered as greenwash- Commercial structures can ensure zero impact on HS2’s overall capex
position.
- HS2’s Technical feasibility: Land and connections feasibility needs to be considered in the adoption this option.
- Downside costs: The policy landscape (such as Ofgem’s Targeted Charging Review) could impact the economics of the option. Furthermore, HS2 will need to consider the falling cost of renewables, i.e. achieving currently forecasted cost reduction trajectory.
- Reputational risk: investing in a technology that is unable to deliver the cost savings and complexities in deployment management.
Initial feasibility analysis

74© 2018 KPMG LLP, a UK limited liability partnership and a member firm of the KPMG network of independent member firms affiliated with KPMG International Cooperative (“KPMG International”), a Swiss entity. All rights reserved.
Document Classification: KPMG Confidential
Available technologies - summaryProcuring sustainable, reliable and affordable electricity that is able to deliver on HS2’s strategic objectives will be critical to the operation of the project. Here we provide an overview of 5 potential technologies that we consider viable.Option and Description Key Considerations
Gen
erat
ion
Tech
nolo
gies
Solar- Solar as an option has low commercial and deliverability risk,
and we consider that this is an option that could be credibly rolled out without any implications on HS2’s timelines or business as there are a large, and increasing, number of credible technology participants.
- Further, solar generation is a zero carbon generation solution which would allow HS2 to exceed its decarbonisation targets.
- The cost of solar is falling and has shown to be more cost efficient relative to the traditional supply when deployed via private wire solution. With zero marginal cost, there is significant cost certainty associated with solar generation.
- However, given its intermittent nature, solar cannot be the only technology employed to meet HS2’s needs as it will not provide the required level of security of supply.
- It would need to be coupled with other contractual or technological options to ensure required level of security of supply.
Onshore wind- Proven track record representing a zero-carbon generation
solution, exceeding HS2’s carbon targets. - There is significant cost certainty associated with the
technology.
- Should HS2 decide to procure onshore generation consideration needs to be given to planning permission as there is likely to be a degree of resistance at the local level as onshore wind turbines have been considered an “eyesore” by communities.
- Given its intermittent nature, onshore wind cannot be the only technology employed to meet HS2’s needs as it will not provide the required level of security of supply. It would need to be coupled with other contractual or technological options to ensure required level of security of supply.
Offshore wind- Offshore wind is a technology with a proven track record for its
commercial viability and represents a zero-carbon generation solution, significantly exceeding HS2’s carbon targets.
- The cost of offshore wind is likely to be more cost efficient relative to HS2’s traditional supply. With zero marginal cost, there is significant cost certainty associated with onshore wind.
- Whilst an established technology with a strong track record for commercial viability, there are a number of commercial risks at a number of key development stages that would need to be closely managed by the developer.
- Given the size and scale of offshore wind development, the deployment timeframes are, generally speaking, significantly longer than both solar and onshore wind, and potentially even conventional thermal generation.
- Like with onshore wind and solar, offshore wind would need to be coupled with other contractual or technological options to ensure required level of security of supply.
Bal
anci
ng T
echn
olog
ies
Demand Side Response: - Demand side response (DSR) is one of the key demand-side
measures to help balance the whole network and increase efficiency.
• DSR is able to help accrue revenue through a number of different revenue streams (e.g. price arbitrage, ancillary service provision, capacity market payments etc.). Combining these various streams into a revenue stack, helps to support the commercial viability of the chosen electricity option.
Battery Storage- Battery storage technology has advanced in recent years and
now represents a commercially viable solution when coupled with intermittent generation.
- It could also be an innovative way for HS2 to address its traction power braking requirements which are estimated to be significant.
- The case for battery storage strengthens when all potential revenue streams are considered.
- Most importantly, battery storage would help address the intermittency issues associated with solar and onshore wind generation.
Initial feasibility analysis

Short-listed options
8.

76© 2018 KPMG LLP, a UK limited liability partnership and a member firm of the KPMG network of independent member firms affiliated with KPMG International Cooperative (“KPMG International”), a Swiss entity. All rights reserved.
Document Classification: KPMG Confidential
Approach to define the short list of electricity options
Available contractual structures and technologies Evaluation
Security of supply
Deliverability
Cost certainty
Carbon reduction
Optimise commercial risk
Cost optimisation
Affordability (capex)
SolarOnshore windOffshore wind
Energy from waste
DSRBattery storage
Gas Base-loadTech
nolo
gies
EC4T
Sleeved PPA
Direct PPA
Own built on-site generation
3rd party owned and operated private wire
Con
trac
tual
str
uctu
res
Short-listed options
A number of potential contractual structures and technologies have been developed that could contribute to HS2’s electricity strategy. These have been subject to an in depth assessment based on an agreed criteria to develop the short list of options (see the following slide).
Available Contractual Structures and technologies
• Based on KPMG insights, and our understanding of electricity market developments,we have been able to draw up a list of contractual structures and technologies thatcould be used in HS2’s electricity strategy.
• For the contractual structures, we considered the traditional supply contract, variantsof the PPA model (direct and sleeved), and 2 different private wire models (directownership and 3rd party ownership).
• In terms of the technologies considered, we included a range of generation and non-generation technologies; from conventional gas generation to intermittent renewables,and from dispatchable renewables to demand management and storage solutions.
• The available contractual structures and technologies are not mutually exclusive, andit is likely that some combination of these will be used in HS2’s electricity strategy.
Evaluation
• Working closely with HS2’s stakeholders, and drawing on HS2’s goals and objectivesfor the electricity strategy, we developed a set of seven criteria that was used forassessing each of the available contractual structures and technologies.
• For some of these criteria (security of supply and deliverability), it was necessary forthat criterion to be met in order to the contractual structure or technology to beprogressed to the short-list of options.
• The assessment undertaken used a combination of quantitative and qualitativeanalysis, depending on the nature of the criteria. For example, in assessing costoptimisation we were able to compare £/MWh cost of electricity for each technology,contractual arrangement and option. However, for assessing deliverability, we havereplied much more on soft market testing, and qualitative evaluation of equivalentprojects.
• An overview of the contractual structures and technologies that did not meet theevaluation criteria and the reasoning are set out on the following slide.

77© 2018 KPMG LLP, a UK limited liability partnership and a member firm of the KPMG network of independent member firms affiliated with KPMG International Cooperative (“KPMG International”), a Swiss entity. All rights reserved.
Document Classification: KPMG Confidential
Approach to define the short list of electricity options
Output of the evaluation
SolarOnshore windOffshore wind
Energy from waste
DSRBattery storage
Gas Base-loadTech
nolo
gies
EC4T
Sleeved PPA
Direct PPA
Own built on-site generation
3rd party owned and operated private wire
Con
trac
tual
str
uctu
res
Short-listed options
Contractual Structures
• Optimising HS2’s costs is an important criteria for the electricity strategy, and the EC4T contractdoes not represent a cost optimal solution, neither provides cost certainty – a number of the otheroptions have lower associated costs. Further, despite the fact that HS2 could purchase REGOs underEC4T, this option does not outperform HS2’s emissions targets to the same extent as otherstructures.
• Under the direct PPA contractual agreement, residual power balancing risk would sit with HS2, ratherthan with the PPA provider under a sleeved PPA. This would require HS2 to set up an in-houseenergy procurement team, adding additional complexity and risk to the contractual arrangement.
• Pursuing an own built on-site generation, or own build private wire solution would result in asignificant additional capex requirement as HS2 would be responsible for designing, constructing andultimately owning the generation assets. The 3rd party ownership model provides the same benefitsas a direct wire solution without the additional capital outlay. This does not preclude HS2 fromdeveloping and/or owning on-site renewables as may be required to meet regulatory and BREAMrequirements, and which may already be in scope of HS2's Main Works Contracts
• The sleeved PPA and 3rd party owned and operated private wire contractual structures have beenprogressed and will form the basis for the options considered in this section. EC4T has been includedin the shortlist as a baseline
Technologies
• The costs associated with generating electricity using Energy from Waste plants are highlydependent on feedstock prices. Feedstock prices have the potential to increase at periods oftightened supply, and consequently other technologies have higher cost certainty. Solar and windgeneration, for example, have zero marginal costs and therefore high predictability and stability ofcosts. Having said this, EfW plant could be considered in specific circumstances, potentially if an EfWplant were situated within the proximity of HS2’s assets.
• Gas technologies have not been progressed to the options stage. Like with EfW, the generationcosts for gas plants are highly dependent on wholesale gas prices, and are therefore reasonablyvolatile – this does not meet HS2 cost certainty criteria. Further, gas generating plant emits morecarbon than the other technologies considered.
• The intermittent renewables (solar, offshore/onshore wind), combined with DSR and batterystorage technologies have been short-listed and progressed to the options stage.
In formulating the short-list of options, we have dropped a number of the contractual structures and potential technologies as they do not meet the evaluation criteria in full. Justification for why those ‘dropped’ options have not been progressed is set out below.
Com
bina
tions
of r
enew
able
cor
pora
te s
leev
ed P
PA a
nd 3
rdpa
rty o
wne
d an
d op
erat
ed p
rivat
e w
ire

78© 2018 KPMG LLP, a UK limited liability partnership and a member firm of the KPMG network of independent member firms affiliated with KPMG International Cooperative (“KPMG International”), a Swiss entity. All rights reserved.
Document Classification: KPMG Confidential
Summary of approach to define the short list of electricity options
Available contractual structures and technologies
Evaluation Output of the evaluation
SolarOnshore windOffshore wind
Energy from waste
DSRBattery storage
Gas Base-loadTech
nolo
gies
EC4T
Sleeved PPA
Direct PPA
Own built on-site generation
3rd party owned and operated private wire
Con
trac
tual
str
uctu
res
Security of supply
Deliverability
Cost certainty
Carbon reduction
Optimise commercial risk
Cost optimisation
Affordability (capex)
SolarOnshore windOffshore wind
Energy from waste
DSRBattery storage
Gas Base-loadTech
nolo
gies
EC4T
Sleeved PPA
Direct PPA
Own built on-site generation
3rd party owned and operated private wire
Con
trac
tual
str
uctu
res
Options
100% renewable corporate sleeved PPA
100% of 3rd
party owned and operated private wire
Com
bina
tions
of r
enew
able
cor
pora
te
slee
ved
PPA
and
3rdpa
rty o
wne
d an
d op
erat
ed p
rivat
e w
ire
Short-listed options

79© 2018 KPMG LLP, a UK limited liability partnership and a member firm of the KPMG network of independent member firms affiliated with KPMG International Cooperative (“KPMG International”), a Swiss entity. All rights reserved.
Document Classification: KPMG Confidential
Summary of electricity options
0 2 3 4
Proportion of renewable corporate sleeved PPA
Proportion of 3rd
party owned and operated private wire
Approach to formulate the strategic options
HS2 will tender the electricity procurement on the basis of the contractual structures and the tender will be technology agnostic subject to meeting the carbon reduction targets. Therefore, the short-listed electricity options are a combination of different contractual arrangements. The strategic options were formulated in a way that they gradually move from the traditional supply contract (EC4T) to corporate PPA and then to private wire solutions.
The key distinguishing characteristics between the options are their varying costs and exposure to commercial risk.
The options should not be considered mutually exclusive and it is feasible and in fact probable that HS2 may move from option 1 through to option 4 over time as presented in option 5.
5
Short-listed options
Options Description
OPTION 0 Traditional supply contract (i.e., an HS2 variant of EC4T)
OPTION 1 100% renewable sleeved corporate PPA from 2026.
OPTION 2 100% 3rd party owned and operated private wire (onsite) for stations, and 100% renewable sleeved corporate PPA for the traction assets from 2026.
OPTION 3 Renewable sleeved PPA for traction assets and on-site generation for stations for Phase 1 + 2a and maximise 3rd party owned and operated private wire for Phase 2b based on HS2’s risk appetite (30-60%)
OPTION 4 100% 3rd party owned and operated private wire with a balancing power provider from 2026.
OPTION 5 Combination of Option 1 - 4, with gradual movement from Option 1 - 4 over time.
1
Overview of the strategic options
Description of the strategic options

80© 2018 KPMG LLP, a UK limited liability partnership and a member firm of the KPMG network of independent member firms affiliated with KPMG International Cooperative (“KPMG International”), a Swiss entity. All rights reserved.
Document Classification: KPMG Confidential
Overview of EC4T contractIn this option, the electricity is being procured through a contract with an electricity supplier. The contractual arrangement differs typically on the basis of: tenor of the agreement, the degree of fixing of the electricity price, and the costs associated with optimisation of electricity consumption. We summarise below the EC4T price elements as a baseline of contract available to HS2.
Cost element
Distribution charges
(7%)
Transmission charges
(7.5%)
Margin
(0.2%)
Losses
(1.5%)
Balancing charges
(2%)
Policy charges
(13%)
Wholesale cost
(69%)Breakdown of electricity costs
Ener
gy C
osts
Del
iver
y C
osts
EDF is the supplier for all Network Rail’s Traction Electricity under a framework agreement (EC4T).
Timing
• The current contract commenced in 2014 and will be effective up to 2024.
• The 10 year timeframe is designed to align with the timeframes for franchising/ franchises.
Pricing
• The price elements of the EC4T contract is set out in the chart base. The only price element fixed between EDF and Network Rail is the margin (EDF’s management fee), which is approximately 0.2% of the full price.
• As a general rule of thumb, Network Rail buys month-ahead.
• However, train operating companies can develop their own hedging/ purchasing strategies, and advise Network Rail of when they want Network Rail to purchase their electricity, e.g., winter ahead. Network Rail then purchases this from EDF, at the price that is being charged for winter-ahead at that point in time
• In addition to the full costs of electricity, Network Rail also pays Transmission Exit Charges and Grid Metering charges directly to National Grid.
Special clauses
• The EC4T framework does not set a specific carbon target for the supplier.
• There is no security of supply clause specified in the contract; therefore, Network Rail has built redundancy into their network connection.
Source: Network Rail, Methodology for calculating traction electricity tariffs for charter operators in CP5
EC4T electricity cost breakdown (2013/14)
Short-listed options

81© 2018 KPMG LLP, a UK limited liability partnership and a member firm of the KPMG network of independent member firms affiliated with KPMG International Cooperative (“KPMG International”), a Swiss entity. All rights reserved.
Document Classification: KPMG Confidential
Evaluation of EC4TEvaluation criteria
Assessment: Overall assessment
Security of supply
• Traditionally, the UK electricity supply on the transmission network is up to a highstandard of security of supply.
Provides the necessary securityof supply
Deliverability • Procuring electricity through a traditional supply contract provides a high degree ofcertainty and is unlikely to jeopardise the deliverability of HS2. Meets the deliverability criterion
Cost certainty
• High uncertainty of wholesale costs, transmission charges, distribution charges and policycosts.
Contract price can be fixed for up to 3 years; however, wholesale cost is very uncertain in long term
Cost optimisation
• The electricity price paid for the supplier is built up by different price elements as shownon previous slide. Current unit cost for industrial consumers is around £80-110MWh.
Traditional supply contract is likely to have higher cost than the other options
Carbon reduction
• HS2’s objective is to outperform the targets set by the UK Government and deliver amuch more aggressive carbon reduction pathway. In order to outperform thedecarbonisation rate of the national targets, green tariffs have to be chosen in the supplycontract which can be certified by Renewable Energy Guarantees of Origin (REGO).
Does not meet HS2’s carbon reduction targets; however, it could meet the criterion with the combination of green tariff and REGOcertificates
Optimise commercial risk
• The electricity supply market is dominated by the Big Six suppliers, i.e. Scottish Power,SSE, E.On, EDF Energy, nPower and Centrica. These companies are stable on the marketand do not carry any counterparty risk.
Meets the commercial risk criterion
Capex affordability
• Procuring electricity from the distribution or transmission network does not require anycapital expenditure from the consumer.
Meets capex affordabilitycriterion.
Short-listed options
The evaluation of the traditional supply contract (EC4T) is presented in the table below.

82© 2018 KPMG LLP, a UK limited liability partnership and a member firm of the KPMG network of independent member firms affiliated with KPMG International Cooperative (“KPMG International”), a Swiss entity. All rights reserved.
Document Classification: KPMG Confidential
Option 1
Onshore wind
PPA contractor
Generation units
Balancing power provider
Wholesale market
CO
NTR
ACTU
AL
OVE
RVI
EWTE
CH
NO
LOG
IES
Offshore wind
Solar
Battery storage
Up to 780 MW if all coming from onshore wind
Up to 520 MW if all coming form offshore wind
Up to 2,300 MW if all coming from solar
A sleeved renewable corporate PPA which will supply all of HS2’s power requirements (both traction and non-traction assets)
As the technology mix for the PPA consists of 100% intermittent renewable technologies, balancing power is needed to be provided
Under the sleeved PPA arrangement, the PPA provider contracts with the balancing power provider.
The technology split for the PPA is determined by the PPA provider to meet HS2’s demand.
Battery Storage will help balance the supply to HS2 and generate revenues from performing balancing services to the grid.
100% renewable sleeved corporate PPA from 2026
IN PRACTICE, IT WILL BE A COMBINATION OF ALL TECHNOLOGIES ABOVE TO MEET THE NEEDS OF
HS2 AND WE EXPECT THE MAJORITY COMING FROM OFFSHORE WIND
Short-listed options

83© 2018 KPMG LLP, a UK limited liability partnership and a member firm of the KPMG network of independent member firms affiliated with KPMG International Cooperative (“KPMG International”), a Swiss entity. All rights reserved.
Document Classification: KPMG Confidential
Evaluation of Option 1Evaluation criteria
Assessment: Overall assessment
Security of supply
• Sleeved PPA provides the required level of security of supply, i.e. the same level as EC4T does.Under the sleeved PPA arrangement, it is the PPA provider’s responsibility to contract for thebalancing power.
Provides the necessary security of supply
Deliverability • Corporate PPA market is a mature market, it is unlikely to put HS2’s deliverability in risk. Meets the deliverability criterion
Cost certainty
• The cost certainty of PPA depends on the pricing structure, but fixed price PPAs are very commonin the market.
Fixed price PPA meets the criterion
Cost optimisation
• Costs of renewable sources are rapidly declining, and this trend is expected to continue. Therefore;renewable PPA is likely to have lower cost than EC4T.
Renewable PPA islikely to have lower cost than EC4T
Carbon reduction
• The sleeved PPA will be provided through low carbon renewable generation sources. For thebalancing power, REGO certificates can be obtained which ensures that even the balancing poweris coming from low carbon sources (e.g. battery storage).
Meets HS2’s carbon reduction targets
Optimise commercial risk
• The sleeved PPA entails low commercial risk as it represents a fairly standard contract likely with areputable supplier.
It meets the criterionsubject to choosing an established PPA provider
Capex affordability
• Sleeved PPA does not have any upfront capex requirement. Meets capex affordability criterion.
Short-listed options
The evaluation of Option 1 is presented in the table below.
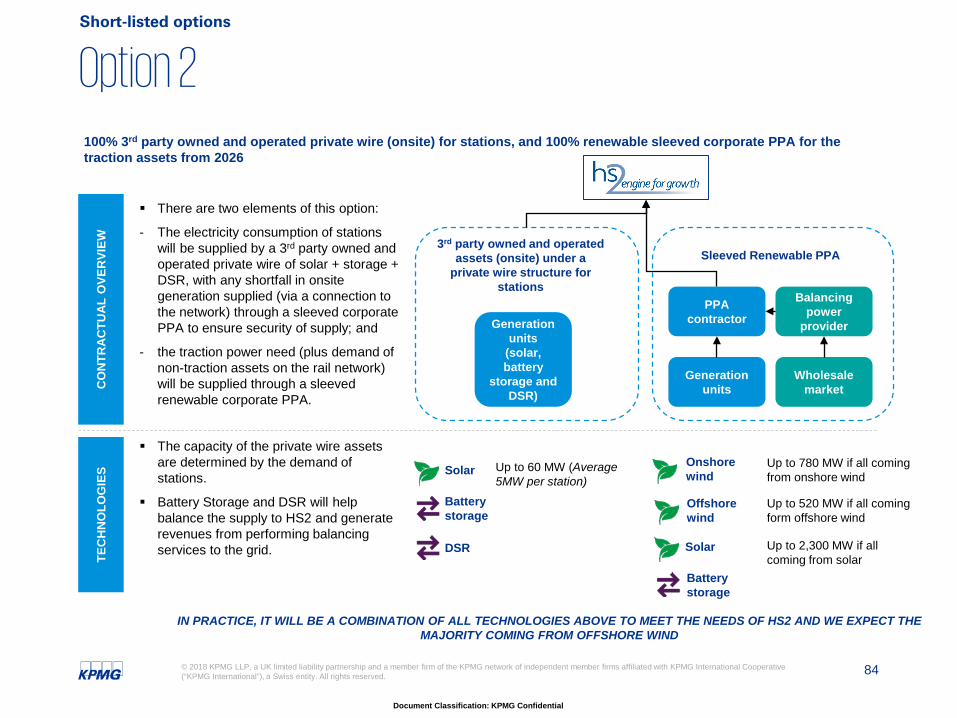
84© 2018 KPMG LLP, a UK limited liability partnership and a member firm of the KPMG network of independent member firms affiliated with KPMG International Cooperative (“KPMG International”), a Swiss entity. All rights reserved.
Document Classification: KPMG Confidential
Option 2
Onshore wind
PPA contractor
Generation units
Balancing power
provider
Wholesale marketC
ON
TRAC
TUAL
OVE
RVI
EWTE
CH
NO
LOG
IES
Offshore wind
Solar
Battery storage
There are two elements of this option:
- The electricity consumption of stations will be supplied by a 3rd party owned and operated private wire of solar + storage + DSR, with any shortfall in onsite generation supplied (via a connection to the network) through a sleeved corporate PPA to ensure security of supply; and
- the traction power need (plus demand of non-traction assets on the rail network) will be supplied through a sleeved renewable corporate PPA.
The capacity of the private wire assets are determined by the demand of stations.
Battery Storage and DSR will help balance the supply to HS2 and generate revenues from performing balancing services to the grid.
100% 3rd party owned and operated private wire (onsite) for stations, and 100% renewable sleeved corporate PPA for the traction assets from 2026
Sleeved Renewable PPA3rd party owned and operated
assets (onsite) under a private wire structure for
stations
Generation units
(solar, battery
storage and DSR)
Solar
Battery storage
Up to 60 MW (Average 5MW per station)
DSR
Up to 780 MW if all coming from onshore wind
Up to 520 MW if all coming form offshore wind
Up to 2,300 MW if all coming from solar
IN PRACTICE, IT WILL BE A COMBINATION OF ALL TECHNOLOGIES ABOVE TO MEET THE NEEDS OF HS2 AND WE EXPECT THE MAJORITY COMING FROM OFFSHORE WIND
Short-listed options

85© 2018 KPMG LLP, a UK limited liability partnership and a member firm of the KPMG network of independent member firms affiliated with KPMG International Cooperative (“KPMG International”), a Swiss entity. All rights reserved.
Document Classification: KPMG Confidential
Evaluation of Option 2Evaluation criteria
Assessment: Overall assessment
Security of supply
• Sleeved PPA provides the required level of security of supply, i.e. the same level as EC4T does.• Onsite battery storage increases reliability over the traditional supply from the network, but given
that the private wire is with intermittent generation the stations will maintain a connection to thenetwork to remove any impact of security of supply.
Provides the necessary security of supply
Deliverability• Corporate PPA market is a mature market, it is unlikely to put HS2’s deliverability in risk.• Onsite generation assets such as solar rooftop panels (<1 MW) can be procured and installed in
less than 6 months.
Meets the deliverability criterion
Cost certainty
• The cost certainty of PPA depends on the pricing structure, but fixed price PPAs are very commonin the market.
• Intermittent renewable sources installed onsite run on minimal marginal costs, hence ensuring coststability.
It meets the criterion
Cost optimisation
• Costs of renewable sources are rapidly declining, and this trend is expected to continue. Therefore;renewable PPA is likely to have lower cost than EC4T.
• One of the advantages of the private wire structure is that the final electricity price incurs limitednetwork and policy charges; however, this advantage is minimal in the overall mix of contractualsources.
It is likely to have lower cost than EC4T
Carbon reduction
• The sleeved PPA will be provided through low carbon renewable generation sources. For thebalancing power, REGO certificates can be obtained which ensures that even the balancing poweris coming from low carbon sources (e.g. battery storage).
• The private wire element is based on 100% renewable sources.
Meets HS2’s carbon reduction targets
Optimise commercial risk
• For the private wire element, the technology choices of solar and DSR are already commerciallyproven technologies with significant capacity deployed in the market. Battery storage is expected tobecome commercially viable in the next 5 years, i.e. it will become a proven technology. Thecommercial risk for these technologies can only arise if a non-proven developer is chosen for thedevelopment and operation.
It meets the criterion subject to choosing an established PPA provider and 3rd party developer
Capex affordability
• Sleeved PPA does not have any upfront capex requirement• 3rd party owned and operated private wire structure does not have any capex requirement for HS2
Meets capex affordability criterion
Short-listed options
The evaluation of Option 2 is presented in the table below.

86© 2018 KPMG LLP, a UK limited liability partnership and a member firm of the KPMG network of independent member firms affiliated with KPMG International Cooperative (“KPMG International”), a Swiss entity. All rights reserved.
Document Classification: KPMG Confidential
Option 3
Onshore wind
PPA contractor
Generation units
Balancing power
provider
Wholesale marketC
ON
TRAC
TUAL
OVE
RVI
EWTE
CH
NO
LOG
IES
Offshore wind
Solar
Battery storage
There are two elements of this option:
- Phase 1 + 2a: renewable sleeved corporate PPA for traction assets and on-site generation for stations; and
- Phase 2b: Maximum share (30-60%) of 3rd party owned and operated private wire of solar + storage + DSR + onshore wind based on HS2’s risk appetite and the rest of the electricity demand will be supplied through a sleeved renewable corporate PPA.
The capacity of the private wire assets will be determined by the maximum risk that HS2 is willing to take on the private wire development.
Battery Storage and DSR will help balance the supply to HS2 and generate revenues from performing balancing services to the grid.
Renewable sleeved PPA for traction assets and on-site generation for stations for Phase 1 + 2a and maximise 3rd party owned and operated private wire for Phase 2b based on HS2’s risk appetite (30-60%)
Sleeved Renewable PPA3rd party owned and operated
assets under a private wire structure
Generation units(solar, onshore
wind, battery storage and DSR)
Solar
Battery storage
Up to 1,150 MW if all coming from solar
DSR
Onshore wind
Up to 390 MW if all coming from onshore windNumbers are based on the assumption
of 50-50% split between private wire and PPA
Up to 390 MW if all coming from onshore wind
Up to 260 MW if all coming form offshore wind
Up to 1,150 MW if all coming from solar
IN PRACTICE, IT WILL BE A COMBINATION OF ALL TECHNOLOGIES ABOVE TO MEET THE NEEDS OF HS2
Short-listed options

87© 2018 KPMG LLP, a UK limited liability partnership and a member firm of the KPMG network of independent member firms affiliated with KPMG International Cooperative (“KPMG International”), a Swiss entity. All rights reserved.
Document Classification: KPMG Confidential
Evaluation of Option 3Evaluation criteria
Assessment: Overall assessment
Security of supply
• Sleeved PPA provides the required level of security of supply, i.e. the same level as EC4T does.• Onsite battery storage increases reliability over the traditional supply from the network.
Provides the necessary security of supply
Deliverability
• Corporate PPA market is a mature market, it is unlikely to put HS2’s deliverability in risk.• Onsite generation assets such as solar panels (<1 MW) can be procured and installed in less than
6 months. However, the consenting , planning and construction period for onshore wind can last upto 4-8 years.
Private wire element carries some deliverability risks
Cost certainty
• The cost certainty of PPA depends on the pricing structure, but fixed price PPAs are very commonin the market.
• Intermittent renewable sources installed onsite run on minimal marginal costs, hence ensuring coststability.
It meets the criterion
Cost optimisation
• Costs of renewable sources are rapidly declining, and this trend is expected to continue. Therefore;renewable PPA is likely to have lower cost than EC4T.
• One of the advantages of the private wire structure is that the final electricity price incurs limitednetwork and policy charges.
It is likely to have lower cost than EC4T
Carbon reduction
• The sleeved PPA will be provided through low carbon renewable generation sources. For thebalancing power, REGO certificates can be obtained which ensures that even the balancing poweris coming from low carbon sources (e.g. battery storage).
• The private wire element is based on 100% renewable sources.
Meets HS2’s carbon reduction targets
Optimise commercial risk
• For the private wire element, the technology choices of solar and onshore wind are alreadycommercially proven technologies with significant capacity deployed in the market. Battery storageis expected to become commercially viable in the next 5 years, i.e. it will become a proventechnology. The commercial risk for these technologies can only arise if a non-proven developer ischosen for the development and operation.
It meets the criterion subject to choosing an established PPA provider and 3rd party developer
Capex affordability
• Sleeved PPA does not have any upfront capex requirement• 3rd party owned and operated private wire structure does not have any capex requirement for HS2
Meets capex affordability criterion.
Short-listed options
The evaluation of Option 3 is presented in the table below.
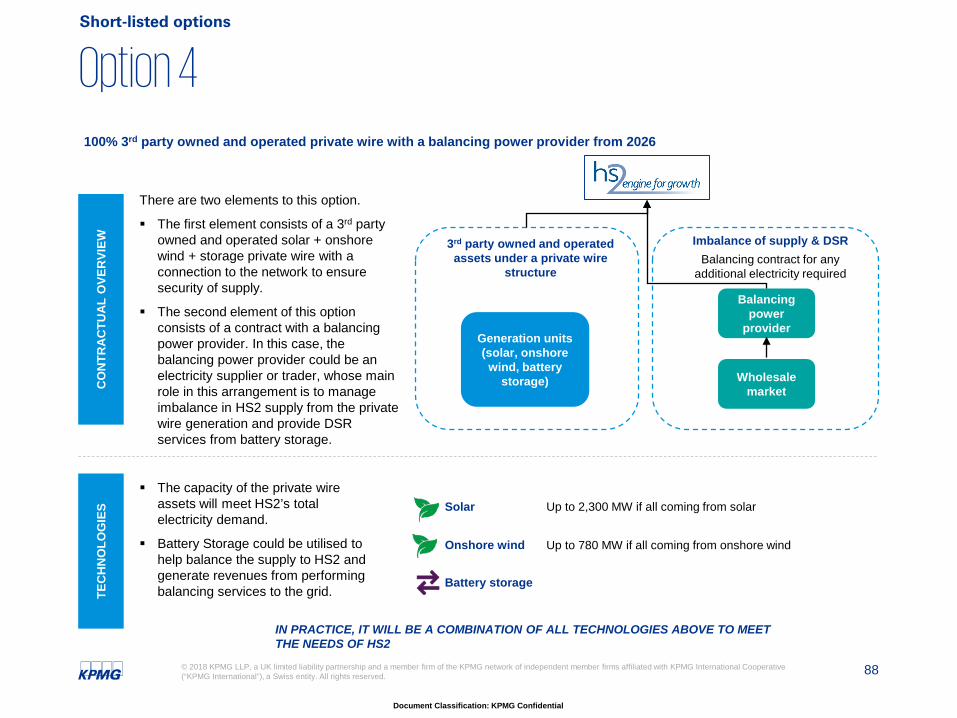
88© 2018 KPMG LLP, a UK limited liability partnership and a member firm of the KPMG network of independent member firms affiliated with KPMG International Cooperative (“KPMG International”), a Swiss entity. All rights reserved.
Document Classification: KPMG Confidential
Option 4
Balancing power
provider
Wholesale marketC
ON
TRAC
TUAL
OVE
RVI
EWTE
CH
NO
LOG
IES
There are two elements to this option.
The first element consists of a 3rd party owned and operated solar + onshore wind + storage private wire with a connection to the network to ensure security of supply.
The second element of this option consists of a contract with a balancing power provider. In this case, the balancing power provider could be an electricity supplier or trader, whose main role in this arrangement is to manage imbalance in HS2 supply from the private wire generation and provide DSR services from battery storage.
The capacity of the private wire assets will meet HS2’s total electricity demand.
Battery Storage could be utilised to help balance the supply to HS2 and generate revenues from performing balancing services to the grid.
100% 3rd party owned and operated private wire with a balancing power provider from 2026
3rd party owned and operated assets under a private wire
structure
Generation units(solar, onshore
wind, battery storage)
Solar
Battery storage
Up to 2,300 MW if all coming from solar
Onshore wind Up to 780 MW if all coming from onshore wind
Imbalance of supply & DSRBalancing contract for any
additional electricity required
IN PRACTICE, IT WILL BE A COMBINATION OF ALL TECHNOLOGIES ABOVE TO MEET THE NEEDS OF HS2
Short-listed options

89© 2018 KPMG LLP, a UK limited liability partnership and a member firm of the KPMG network of independent member firms affiliated with KPMG International Cooperative (“KPMG International”), a Swiss entity. All rights reserved.
Document Classification: KPMG Confidential
Evaluation of Option 4Evaluation criteria
Assessment: Overall assessment
Security of supply
• The back up connections to the network will provide the required level of security of supply, i.e. thesame level as a PPA and EC4T does
• Onsite battery storage increases reliability over the traditional supply from the network.
Provides the necessary security of supply
Deliverability• Onsite generation assets such as solar panels (<1 MW) can be procured and installed in less than
6 months. However, the consenting , planning and construction period for onshore wind can last upto 4-8 years.
Private wire element carries some deliverability risks
Cost certainty • Intermittent renewable sources run on minimal marginal costs, hence ensuring cost stability. It meets the criterion
Cost optimisation
• One of the advantages of the private wire structure is that the final electricity price incurs limitednetwork and policy charges.
It is likely to have lower cost than EC4T
Carbon reduction
• The private wire element is based on 100% renewable sources. For the balancing power, REGOcertificates can be obtained which ensures that even the balancing power is coming from lowcarbon sources (e.g. battery storage).
Meets HS2’s carbon reduction targets
Optimise commercial risk
• For the private wire element, the technology choices of solar and onshore wind are alreadycommercially proven technologies with significant capacity deployed in the market. Battery storageis expected to become commercially viable in the next 5 years, i.e. it will become a proventechnology. The commercial risk for these technologies can only arise if a non-proven developer ischosen for the development and operation.
It meets the criterion subject to choosing an established 3rd party developer
Capex affordability • 3rd party owned and operated private wire structure does not have any capex requirement for HS2 Meets capex
affordability criterion.
Short-listed options
The evaluation of Option 4 is presented in the table below.

90© 2018 KPMG LLP, a UK limited liability partnership and a member firm of the KPMG network of independent member firms affiliated with KPMG International Cooperative (“KPMG International”), a Swiss entity. All rights reserved.
Document Classification: KPMG Confidential
Summary of evaluationsShort-listed options
Evaluation criteria
Option 0Traditional supply
contract
Option 1100% renewable
sleeved corporate PPA
Option 2Private wire for station and sleeved PPA for
traction
Option 3Sleeved PPA for Phase 1 + 2b, PPA and private
wire for phase 2b
Option 4100% 3rd party owned and operated private
wire
Security of supply
Provides the necessary security of supply
Provides the necessary security of supply
Provides the necessary security of supply
Provides the necessary security of supply
Provides the necessary security of supply
Deliverability Meets the deliverabilitycriterion
Meets the deliverabilitycriterion
Meets the deliverabilitycriterion
For Phase 2, detailed technical and cost studies are required to identify deliverability of private-wire
Private wire element carries some deliverability risks
Cost certainty
Contract price can be fixed for up to 3 years; however, wholesale cost is very uncertain in long term
Fixed price PPA meetsthe criterion It meets the criterion It meets the criterion It meets the criterion
Cost optimisation
Traditional supply contract is likely to have higher cost than the other options
Renewable PPA is likely to have lower cost than EC4T in the long term
It is likely to have lower cost than EC4T
It is likely to have lower cost than EC4T
It is likely to have lower cost than EC4T
Carbon reduction
Does not meet HS2’s carbon reduction targets; however, it could meet the criterion with the combination of green tariff and REGOcertificates
Meets HS2’s carbon reduction targets
Meets HS2’s carbon reduction targets
Meets HS2’s carbon reduction targets
Meets HS2’s carbon reduction targets subject to the generation mix of the balancing power
Optimise commercial risk
Meets the commercial risk criterion
It meets the criterion subject to choosing an established PPA provider
It meets the criterion subject to choosing an established PPA provider and 3rd party developer
It meets the criterion subject to choosing an established PPA provider and 3rd party developer
It meets the criterion subject to choosing an established 3rd party developer
Capex affordability
Meets capex affordabilitycriterion.
Meets capex affordabilitycriterion.
Meets capex affordabilitycriterion.
Meets capex affordabilitycriterion.
Meets capex affordabilitycriterion.

91© 2018 KPMG LLP, a UK limited liability partnership and a member firm of the KPMG network of independent member firms affiliated with KPMG International Cooperative (“KPMG International”), a Swiss entity. All rights reserved.
Document Classification: KPMG Confidential
Comparative analysis of the options
02468
10Cost optimisation
Cost certainty
Carbon reduction
DeliverabilitySecurity of supply
Optimisecommercial risk
Capex affordability
Option 4
02468
10Cost optimisation
Cost certainty
Carbon reduction
DeliverabilitySecurity of supply
Optimisecommercial risk
Capexaffordability
Option 3
02468
10Cost optimisation
Cost certainty
Carbon reduction
DeliverabilitySecurity of supply
Optimisecommercial risk
Capexaffordability
Option 2
02468
10Cost optimisation
Cost certainty
Carbon reduction
DeliverabilitySecurity of supply
Optimisecommercial risk
Capexaffordability
Option 1
• Option 1 provides significantly more cost certainty and contributes to carbon reduction more than the EC4T framework. The extent of cost optimisation will depend on the technology chosen.
• Option 3 caries slightly more commercial risk due to the proposed private wire arrangements. Having said this, cost certainty, cost optimisation and carbon reduction all exceed the EC4T base case.
• Option 4 is considered to undeliverable during Phase I, due to the long lead times. Further, the carbon reduction benefits associated with the other three options do not materialise here.
• Option 2 is comparatively similar to both option 2 and the EC4T framework. Like with option 1, the level of cost optimisation will depend on the chosen technology.
EC4T assessment
Option assessment
Short-listed options
The strategic options have been compared to the EC4T contract as a base case through the evaluation criteria, the diagrams demonstrate the result of the comparison.
1 - low, 10 - high

92© 2018 KPMG LLP, a UK limited liability partnership and a member firm of the KPMG network of independent member firms affiliated with KPMG International Cooperative (“KPMG International”), a Swiss entity. All rights reserved.
Document Classification: KPMG Confidential
Other considerations
BASELINEEC4T
OPTION 2
OPTION 3
OPTION 4
OPTION 5
• Does not demonstrate innovation and also does not provide any additionality for HS2• Does not necessarily provide additional carbon reduction other than the UK national targets• Does not necessarily provide the best value for money
OPTION 1• Corporate PPA providers require long term commitments from the contractor (10 year plus) that locks
down HS2’s position in the market, not leaving space for HS2 to benefit from lower market prices• Corporate PPA provider can assign certain assets to HS2 (e.g. part of offshore wind farm) which can
create good reputation for HS2
• Having separate electricity supply arrangements for stations captures the different physical aspects of HS2’s assets (traction vs stations)
• Provides the highest alignment to HS2’s physical connection plans, i.e. using the connections to the transmission network for Phase 1 + 2a and enables HS2 to develop private wire generation for Phase 2b
• Optimal level of private wire has to be set from a technical and cost balance perspective
• Current advantage of private wire might disappear as Ofgem is currently consulting on the charging mechanisms with a focus on the behind the meter generators
• There are additional complexity and risks associated with the contractual arrangements underpinning the private wire supply deal (e.g. ownership of connection points, minimum offtake, termination)
• HS2 has already spent £76m on connection for Phase 1, this cost has to be considered
• Provides alignment to HS2’s connection plans; however, the limitation around maximising the private wire option has to be taken into account
Short-listed options

93© 2018 KPMG LLP, a UK limited liability partnership and a member firm of the KPMG network of independent member firms affiliated with KPMG International Cooperative (“KPMG International”), a Swiss entity. All rights reserved.
Document Classification: KPMG Confidential
There are different pricing elements applicable for different contractual structuresTraditional supply contracts and PPAs attract the same cost elements, the difference is in the wholesale cost, i.e. whether it is wholesale market price or the generation cost of a specific asset assigned to the PPA. The private wire solution connected tothe distribution network has the benefit of being partially exempted from transmission and policy charges.
Generation cost
Balancingcharges
Transmissioncharges Losses Distribution
charges Policy charges Supplier margin
Description
The cost of generating the
electricity which is influenced by the
technological generation mix on
the market
Balancing Services Use of System charges
(BSUoS) and Balancing charges
are paid for the costs of managing
the system
Transmission Network Use of System
(TNUoS) is the cost of electricity
transmission paid to National Grid
Losses in the transmission and
distribution system
Distribution Network Use of System
(DNUoS) is the costof electricity
distribution paid to the distribution
network operator (DNO)
All the policy charges set by the
Government: Renewables
Obligations, CfD, Capacity Market, Small Scale FITs,
Hydro levy (AAHEDC)
Fee to cover the supplier’s costs
and profits
Supply contract
Wholesale market cost Applicable Applicable Applicable
Not applicable for HS2 given the
connection is to the transmission network
Applicable Applicable
PPAGeneration cost of specific asset assigned to PPA
Applicable Applicable Applicable
Not applicable for HS2 given the
connection is to the transmission network
Applicable Applicable
Private wire Generation cost of specific asset
Not applicable, as not connected to the transmission
network
Not applicable, as not connected to the
transmission network
Reduced charge if connected to the distribution
network
Applicable if connected to the
distribution networkNot applicable Applicable
69% 11% 7% 13%EC4T breakdown c.1%
Short-listed options

94© 2018 KPMG LLP, a UK limited liability partnership and a member firm of the KPMG network of independent member firms affiliated with KPMG International Cooperative (“KPMG International”), a Swiss entity. All rights reserved.
Document Classification: KPMG Confidential
Cost estimates - OverviewThe relative order of options in prices changes significantly over the time horizon of HS2’s operation.
Offshore wind PPA
Solar PPA
Onshore wind PPA
Solar private wire
EC4T
Onshore wind private wire
Wholesale price
Phase 1 + 2a operation
starts
Phase 2 operation
starts
Key variables
The future of network and policy charges
Wholesale price forecast
1
2
Key assumptions:1. Wholesale price forecast is from Poyry (Q4 2016, mid curve)2. Technology cost estimates are from BEIS LCOE forecasts (November 2016)3. Network and policy charges are kept constant throughout the period
Short-listed options
35.0
45.0
55.0
65.0
75.0
85.0
95.0
105.0
115.0
125.0
135.0
£/M
Wh

95© 2018 KPMG LLP, a UK limited liability partnership and a member firm of the KPMG network of independent member firms affiliated with KPMG International Cooperative (“KPMG International”), a Swiss entity. All rights reserved.
Document Classification: KPMG Confidential
Cost estimates for the strategic optionsThe different strategic options are likely to have varying cost implications based on the contractual structure chosen and the technology used for generation. High level annual cost estimates are provided for the strategic options below. Details of the calculations are set out on the next two slides.
Notes for the cost estimates
1. The cost estimates for different electricity options depend on the chosen contractual structure and the generation source used for the supply.
2. +- 10% is applied to each of the price estimates given that the timeframe (2027) creates uncertainty around wholesale costs and non-generation charges.
3. No additional margin or premium for REGOs or for price certainty have been assumed.
4. All prices are on 2016 basis.
5. PPA based in existing offshore wind farm assumes a 5% discount on the forecast for wholesale market price given that with a long term contract the provider can hedge for the movement in the wholesale price.
6. PPA based on new offshore wind farm – the wholesale price for offshore wind generation in 2026 is approximated with using the latest the CfDauction prices (Hornsea II, £57.5/MWh, operation starts in 2022/23).
7. The on-site generation for stations is assumed to come from the combination of solar PVs and battery storage. The cost estimates only reflects the generation cost of solar given that the scale of battery storage required for each station is site specific and the different battery storage technologies are going through a rapid cost reduction.
8. Distribution connected generation is subject to limited network and policy charges; however, this benefit is likely to disappear in the near future. For the on-site generation cost estimates, a 50% discount in non-generation charges were assumed.
-
50
100
150
200
250
300
Option 0 Option 1 Option 2 Option 3 Option 4
£m
Cost estimates for the strategic options(2033, Phase 2b)
Short-listed options
-
20
40
60
80
100
120
Option 0 Option 1 Option 2 Option 3 Option 4
£m
Cost estiamtes for the strategic options (2027)

96© 2018 KPMG LLP, a UK limited liability partnership and a member firm of the KPMG network of independent member firms affiliated with KPMG International Cooperative (“KPMG International”), a Swiss entity. All rights reserved.
Document Classification: KPMG Confidential
Cost estimates for the strategic options – Phase 1+2a
Phase 1 +2a(2027) Description
Assumptions
Total(£m)Wholesale cost
(£/MWh)
Non-generation costs (Network
and Policy charges)(£/MWh)
Volume(TWh)
Option 0 EC4T – Traditional supply contract price is based on Poyry wholesale cost forecast £62 / MWh £22 /MWh 1.2 TWh £90-111m
Option 1 Offshore renewable PPA – based on average cost for existing and new assets £58 / MWh £22 /MWh 1.2 TWh £86-106m
Option 2
Traction demand: Offshore renewable PPA –based on average cost forecast for existing
and new assets
Stations: on-site solar generation based on forecasted solar generation cost
£58 / MWh for offshore PPA
£65 / MWh for large scale solar PV
£22 /MWh for PPA
£11/MWh for on-site generation
1.16 TWh for traction assets
0.04 TWh for stations
£86-105m
Option 3
Traction demand: Offshore renewable PPA –based on average cost forecast for existing
and new assets
Stations: on-site solar generation based on forecasted solar generation cost
£58 / MWh for offshore PPA
£65 / MWh for large scale solar PV
£22 /MWh for PPA
£11/MWh for on-site generation
1.16 TWh for traction assets
0.04 TWh for stations
£86-105m
Option 4
On-site generation is coming from onshore wind farm
10% of balancing power is procured from the wholesale market
£62 / MWh for onshore wind
£62 / MWh for balancing power
£11 /MWh for on-site generation
£22/MWh for the balancing power
1.08 TWh for on-site generation
0.12 TWh for balancing power
£80-98m
Short-listed options
Details of the cost estimate for Phase 1+2a are set out in the table below.

97© 2018 KPMG LLP, a UK limited liability partnership and a member firm of the KPMG network of independent member firms affiliated with KPMG International Cooperative (“KPMG International”), a Swiss entity. All rights reserved.
Document Classification: KPMG Confidential
Cost estimates for the strategic options – Phase 2b
Phase 2b(2033) Description
Assumptions
Total(£m)Wholesale cost
(£/MWh)
Non-generation costs (Network
and Policy charges)(£/MWh)
Volume(TWh)
Option 0EC4T – Traditional supply contract price
is based on Poyry wholesale cost forecast
£64 / MWh £22 /MWh 2.6 TWh £200-245m
Option 1 Offshore renewable PPA – based on cost forecast for new assets £57 / MWh £22 /MWh 2.6 TWh £185-226m
Option 2
Traction demand: Offshore renewable PPA – based on cost forecast for new
assets
Stations: on-site solar generation based on forecasted solar generation cost
£57 / MWh for offshore PPA
£61 / MWh for large scale solar
PV
£22 /MWh forPPA
£11/MWh for on-site generation
2.54 TWh for traction assets
0.06 TWh for stations
£184-225m
Option 3
70% of electricity is supplied through PPA (offshore wind)
30% of electricity demand is met by on-site generation (onshore wind)
£57 / MWh for offshore PPA
£60 / MWh for onshore wind
£22 /MWh forPPA
£11/MWh for on-site generation
1.82 TWh for PPA
0.78 TWh for on-site generation
£179-219m
Option 4
On-site generation is coming fromonshore wind farm
10% of balancing power is procured from the wholesale market
£60 / MWh for onshore wind
£64 / MWh for balancing power
£11 /MWh for on-site generation
£22/MWh for the balancing power
2.34 TWh for on-site generation
0.26 TWh for balancing power
£170-207m
Short-listed options
Details of the cost estimate for Phase 2 are set out in the table below.

98© 2018 KPMG LLP, a UK limited liability partnership and a member firm of the KPMG network of independent member firms affiliated with KPMG International Cooperative (“KPMG International”), a Swiss entity. All rights reserved.
Document Classification: KPMG Confidential
Carbon emission estimates
0
20
40
60
80
100
120
140
160
2026 2031 2036 2041 2046
gCO
2e/k
Wh
HS2 has set ambitious carbon emission targets which can only be met by 100% renewable electricity supply beyond 2046.
Sources:1. UK government projections up to 2035 (2015), Government Impact Assessment (2013) for figures beyond 20352. HS23. Calculated figures assuming 10% of the UK transmission grid emission from the balancing power
UK transmission grid targets = EC4T
HS2 targets
Renewable PPA or private wire with 10%
balancing power provided from the
grid
Short-listed options
Government estimatesThe orange line shows the Government estimates for the level of carbon emissions from the UK transmission grid. The reduction in emissions is a result of Government's commitments to decrease the proportion of electricity generated from unabated fossil fuels.
HS2 TargetsHS2 has more aggressive carbon reduction targets than the Government projections. The targets set by HS2 assume reducing carbon emissions from 2026 onwards, reducing to zero by 2046. These targets could only be met by consuming electricity that has been generated by 100% renewable sources beyond 2046.

99© 2018 KPMG LLP, a UK limited liability partnership and a member firm of the KPMG network of independent member firms affiliated with KPMG International Cooperative (“KPMG International”), a Swiss entity. All rights reserved.
Document Classification: KPMG Confidential
Carbon emission estimates for the strategic options –Phase 1+2a
Phase 1 + 2a
(2027)Description Assumption gCO2e/k
Wh
Annual demand(TWh)
Total emission (tonnes of
CO2e)
Option 0 EC4T
The electricity supplied through a traditional supply contract has the same emission level as the UK transmission
network
The level of emission can be reduced by purchasing REGO certificates
145 1.2 175,000
Option 1 100% renewable sleeved corporate PPA from 2026 All electricity is generated from zero emission renewable sources 0 1.2 0
Option 2100% 3rd party owned and operated private wire (onsite) for stations, and 100% renewable sleeved corporate PPA for the traction assets from 2026.
All electricity is generated from zero emission renewable sources 0 1.2 0
Option 3
100% 3rd party owned and operated private wire (onsite) for stations, and 100% renewable sleeved corporate PPA for the traction assets from 2026and maximise 3rd party owned and operated private wire for Phase 2 based on HS2’s risk appetite.
All electricity is generated from zero emission renewable sources 0 1.2 0
Option 4 100% 3rd party owned and operated private wire with a balancing power provider from 2026.
The balancing power (c10% of total demand) has the same emission as the UK
transmission network
The level of emission can be reduced by purchasing REGO certificates
14.5 1.2 17,400
HS2 target - - 86 1.2 103,200
Short-listed options
Details of the carbon emission estimate for Phase 1+2a (2027) are set out in the table below.

100© 2018 KPMG LLP, a UK limited liability partnership and a member firm of the KPMG network of independent member firms affiliated with KPMG International Cooperative (“KPMG International”), a Swiss entity. All rights reserved.
Document Classification: KPMG Confidential
Carbon emission estimates for the strategic options –Phase 2b
Phase 2b(2033) Description Assumption gCO2e/k
Wh
Annual demand(TWh)
Total emission (tonnes of
CO2e)
Option 0 EC4T
The electricity supplied through a traditional supply contract has the same emission level as the UK transmission
network
The level of emission can be reduced by purchasing REGO certificates
79 2.6 205,400
Option 1 100% renewable sleeved corporate PPA from 2026 All electricity is generated from zero emission renewable sources 0 2.6 0
Option 2100% 3rd party owned and operated private wire (onsite) for stations, and 100% renewable sleeved corporate PPA for the traction assets from 2026.
All electricity is generated from zero emission renewable sources 0 2.6 0
Option 3
100% 3rd party owned and operated private wire (onsite) for stations, and 100% renewable sleeved corporate PPA for the traction assets from 2026and maximise 3rd party owned and operated private wire for Phase 2 based on HS2’s risk appetite.
All electricity is generated from zero emission renewable sources 0 2.6 0
Option 4 100% 3rd party owned and operated private wire with a balancing power provider from 2026.
The balancing power (c10% of total demand) has the same emission as the UK
transmission network
The level of emission can be reduced by purchasing REGO certificates
7.9 2.6 20,40
HS2 target - - 40 2.6 104,000
Short-listed options
Details of the carbon emission estimate for Phase 2 (2033) are set out in the table below.

101© 2018 KPMG LLP, a UK limited liability partnership and a member firm of the KPMG network of independent member firms affiliated with KPMG International Cooperative (“KPMG International”), a Swiss entity. All rights reserved.
Document Classification: KPMG Confidential
The preferred option
Reasons for selecting the preferred option• Under this option, the analysis suggests that HS2 could meet its electricity
demand in Phase 1 + 2a of the project, through a sleeved corporate PPA arrangement. The opportunity for a 3rd party owned and operated private wire solution could then be investigated and the depending on HS2’s risk appetite, maximum capacity could be developed ready for deployment in Phase 2, in 2033.
• This option provides the highest alignment to HS2’s physical connection plans, i.e. using the connections to the transmission network for Phase 1 + 2a and enables HS2 to develop private wire generation for Phase 2b.
• HS2 already has a connection agreement in place with National Grid, and its important that the benefits associated with this agreement are realised. HS2 has already spent £76m on connection for Phase 1, this cost has been considered in selecting the preferred option.
• The corporate PPA provider can assign certain assets to HS2 (e.g. part of offshore wind farm) which can create good reputation for HS2. The generation assets can either come from an existing portfolio or from newly built assets. In both cases, it can be argued that HS2’s commitment creates additionality. Additionality is not necessary limited to new projects. It could be that where a developer has a limited amount of capital available for development, the re-financing of existing assets to free up capital for further developments is critical
• Transitioning to a private wire based solution in Phase 2 would provide HS2 with the time necessary to develop and construct an optimum solution. It will be important for the optimal level of private wire to be determined from both a technical and cost balance perspective in order for the benefits to be maximised.
• The capacity of the private wire assets will be determined by the maximum risk that HS2 is willing to take on the private wire development. Regardless of the capacity, we envisage that the electricity generated under the private wire solution would be made up of solar or onshore wind combined with DSR and battery storage solutions.
• There are a number of further points that will need consideration should this option be progressed. For example, technical feasibility of private solution should be considered carefully given HS2’s technical constraints.
Description Justification
Phase 1 + 2a
3rd party owned and operated on-site
generation for Stations should be maximised;
whilst all traction electricity would be met
through a 100% renewable sleeved PPA.
For Phase 1 +2a, the transmission network
connection points have been identified, traction
power systems have been designed, and to change them at this stage would
introduce risks. Furthermore, the time that
would be required to identify the sites for
renewable generation for traction and the subsequent consenting timeframes, is
also deemed to be high-risk for Phase 1 + 2a.
Phase 2b
Maximise 3rd party owned and operated private wire for Phase
2b based on HS2’s risk appetite and the rest of the demand to be met
through PPA.
Detailed technical and cost studies will be required to identify
potential sites and to assess the amount of traction electricity that could be sourced from
such private wire connections.
For Phase 2b traction assets, HS2 has the
opportunity to explore the private-wire options since no connection plans have
been decided yet.
HS2 will also need to review imminent energy policy
changes to ensure that the case for private wire connections remains
strong.
Based on the evaluation of the strategic options, and taking into account the other considerations regarding the options, Option 3 is recommended to be taken forward as the preferred option. The table below provides a detailed description of Option 3 alongside with the justification why it has been chosen to be the preferred option. This recommendation is subject to market and regulatory developments.
Short-listed options

9. Risks and opportunities

103© 2018 KPMG LLP, a UK limited liability partnership and a member firm of the KPMG network of independent member firms affiliated with KPMG International Cooperative (“KPMG International”), a Swiss entity. All rights reserved.
Document Classification: KPMG Confidential
SummaryKey considerations
There are numerous factors that can have an impact on the final outcome of HS2’s electricity strategy. These factors are likely to change over time andthe changes can significantly affect the choices for HS2. Therefore, these factors are suggested to be re-assessed regularly by HS2 and the evaluationof power options to be re-performed in every 1-2 years in order to keep the options up to date all the time.
A summary of the identified factors are set out in the table below.
Factors Why and how does it impact HS2’s decision? Examples
Availabletechnologies
Innovation creates competition amongst the technologies and new technologies emerge on the market in every couple of years.The list of future technologies are likely to be different from the current technological landscape, ie HS2 is likely to have a different set of choices in couple of years than at the moment.
The history of battery storage shows a good example on how new technologies emerge on the market and with technical innovation resulting cost reduction, the technology becomes commercially viable and competitive with other technologies.
Cost of technologies
Cost of renewable technologies are rapidly falling which means that cost estimates for technologies might not be accurate in the long term. The change in technological costs can reshape the ranking order of the technologies.
The Contract for Difference Auction Round 2 delivered a dramatic reduction in costs for offshore wind, strike prices have fallen by 50% since the first Round in 2105.
Government and regulatory policies
Governmental and regulatory policies can have a major impact on the energy market and its competitive landscape. Policies are usually set for long term (ie 5-10 years); however, with the energy market being in a transition (eg falling technology costs, decentralisation, decarbonisation), new policies and regulation are expected to be set in most of the energy market areas in the next couple of years.
Ofgem is currently consulting on charging mechanism for transmission and distribution (for both generation and demand (Significant Code Review). Ofgem is expected to conclude on it in 3 years time. The outcome is likely to have a major impact on network costs and the competitiveness of onsite generation.
HS2 technical constraints
HS2’s technical abilities (constraints) set the boundaries for different technologies and hence help to define the right proportion of each technologies/contractual arrangements in the final mixture of electricity strategy. These abilities (constraints) are likely to be different by phases and also can evolve over time (eg buying a land).
The size and location of own land can limit the technologies and contractual arrangements for the power options. If, for example, HS2 cannot purchase its own land, then it could put challenges on an own build generation capacity development.

104© 2018 KPMG LLP, a UK limited liability partnership and a member firm of the KPMG network of independent member firms affiliated with KPMG International Cooperative (“KPMG International”), a Swiss entity. All rights reserved.
Document Classification: KPMG Confidential
Summary of soft market testingWe have set out a list of market players to contact with regards the electricity options for HS2. The status of the soft market engagement is summarised below and initial feedback from Orsted (previously known as Dong) and EDF is summarised on the next slide.
Company Comments and key rationale Key contact Status
• Orsted can provide green PPAs, behind the meter solutions and power consumption management
Meeting held on 8 December joined the call
• Centrica can provide green PPAs, behind the meter solutions and power consumption management
Approached, date formeeting to be set up
• EDF is the current provider of Network Rail’s power supply, might be interested in providing PPA
Meeting held on 1 December
• RWE is the electricity provider for the German Rail operator
Meeting held on 29 January joined the call
• National Grid Ventures might be interested in private wire opportunities
Approached, date formeeting to be set up
• UKPN might be interested in private wire opportunities
Approached, date formeeting to be set up
• Open Energi is a virtual power plant company offering its own technology to large I&C customers to help manage their on-site generation assets.
Initial conversation held, 2nd
conversation to be set up
• Lightsource can provide behind the meter solutions
Approached, date for meeting to be set up
Gen
erat
ors
Net
wor
ksTe
chno
logy
pr
ovid
ers
Key considerations
EIR Reg 13EIR Reg 13
EIR Reg 13EIR Reg 13
EIR Reg 13
EIR Reg 13
EIR Reg 13
EIR Reg 13
EIR Reg 13
EIR Reg 13
EIR Reg 13

105© 2018 KPMG LLP, a UK limited liability partnership and a member firm of the KPMG network of independent member firms affiliated with KPMG International Cooperative (“KPMG International”), a Swiss entity. All rights reserved.
Document Classification: KPMG Confidential
Feedback from market participants validates the deliverability of the electricity optionsThe table below summarises the alignment of HS2’s electricity options with market feedback.
Option Description Feedback
Option 0 Traditional supply contract with REGOs (similar to EC4T)EDF can provide ‘green’ and ‘blue’ supply contractOrsted can provide ‘green’ supply with REGO certificates from specific wind farms
Option 1 100% renewable sleeved corporate PPA from 2026.
EDF can offer 100% renewable PPA in this scale (i.e. the balancing power is provided from renewable as well)Orsted can offer 100% renewable PPA either on their existing asset portfolio or on a new wind farm
Option 2 100% 3rd party owned and operated private wire (onsite) for stations, and 100% renewable sleeved corporate PPA for the traction assets from 2026.
Both EDF and Orsted can offer renewable PPAEDF provides behind the meter solutions, including decentralised energy (DE), DSR, metering, trade
Option 3 Maximise 3rd party owned and operated private wire based on HS2’s risk appetite (40-60%), and procure the rest from renewable sleeved corporate PPA from 2026.
Both EDF and Orsted can offer renewable PPA in this scaleEDF provides behind the meter solutions, including decentralised energy (DE), DSR, metering, trade
Option 4 100% 3rd party owned and operated private wire with a balancing power provider from 2026. n.a.
Option 5 Combination of Option 1 - 4, with gradual movement from Option 1 - 4 over time. n.a.
Key considerations

106© 2018 KPMG LLP, a UK limited liability partnership and a member firm of the KPMG network of independent member firms affiliated with KPMG International Cooperative (“KPMG International”), a Swiss entity. All rights reserved.
Document Classification: KPMG Confidential
HS2’s demand raises interest in the marketInitial feedback from market participants suggests that the 100% of HS2’s demand can be sourced from renewables.
Criteria / question
Does theproduct exist in HS2’s scale?
• They can offer renewable PPA in this scale
• They can also offer a mix of supply contract and PPA
• They can offer renewable PPA in this scale
• They can also offer a mix of supply contract and PPA
Deliverability of timeframe
• Deliverability of electricity in time is not an issue
• Negotiations should happen 1 year prior to operational start if it is only a supply contract
• Longer timeframe for a PPA negotiation
• Deliverability is not an issue, currently 8 operational wind farm, 4 more under construction and a large pipeline of projects is in place for the next decade
Generation mix / supply source
• They can offer 100% renewable PPA where the balancing power is also sourced from renewable sources. The pricing for this option would not be significantly different from a c.90% renewable PPA
• They can offer a mix of ‘green’ and ‘blue’ (nuclear) sources which also satisfies the carbon reduction criterion but might not meet additionality
• They can offer 3 types of products:
1. Renewable supply with REGOs
2. PPA on existing/planned wind farm
3. PPA on new wind farm supporting investment decision
Each option has different cost and timing implications.
(See details in the Appendix)
Other considerations
• They predict that the growth of renewable capacity will not follow the demand for green electricity driven by large business customers, i.e. additionality will be required to meet HS2’s demand and criteria
• They provide energy services for customers, including decentralised energy (DE), DSR, metering, trade. They drew the attention to the complication of connection specifications and metering configurations of behind the meter solutions (they have recently seen project going ‘’crazily’’ bad)
• Offshore wind costs has witnessed dramatic reduction in the last 2 years (strike price in CfD auction halved between 2015 and 2017). Further cost reduction is expected in the next decade.
• They suggest to set up a framework agreement with them in 2018/20 which sets out the key objectives and principles and the mix of sources/products can be refined under the framework later
Key considerations
Roadmap10.

108© 2018 KPMG LLP, a UK limited liability partnership and a member firm of the KPMG network of independent member firms affiliated with KPMG International Cooperative (“KPMG International”), a Swiss entity. All rights reserved.
Document Classification: KPMG Confidential
Delivering option 3 - Roadmap (1)
Year Key milestones Implications for HS2 HS2 Action
2018-19
• Market engagement with PPA provider and developers for private financing.
• Site identification and technical feasibility studies for private wire generation
• Engagement with DfTand BEIS to ensureHS2 are aligned with sponsor departments
• Soft engagement with private finance providers will helpto inform available private finance structures; any changein private finance structures will require a reassessmentof options based on HMT and DfT’s willingness increaseHS2 capex budget.
• Soft engagement with PPA providers will help informinitial views on the key developers in the market and theirtrack records, pipeline projects as well as the availableproducts (e.g. cost implications), enabling HS2 to refineviews on the deliverability of the corporate PPA.
• The site identification exercise will determine the initialapportionment of private wire generation feasibility usinginitial estimates (4 acres/MW for solar PV, 0.75 acre/MWfor onshore wind and 1-5 acre/MW for battery storage).
• Appoint technical advisors for feasibility assessment for the identified technologies, which could include: Land availability; Availability of connections; Terrain and topography, etc.
• Begin survey for suitable sites where private wire generation assets could be built.
• Identification of market participants (both in the PPA market and the private wire market).
• Conduct soft engagement with private finance providers sleeved renewable PPA providers.
• Agree on an interpretation of Additionality
2019-21
• Start selection process for sleeved renewable PPA providers (PQQ)
• Down–select the developers and balancing powerproviders which meet HS2’s deliverability and riskappetite, ensuring that the selection criteria is technologyagnostic.
• Set out PQQ to PPA providers.
• Formal invitation to tender (ITT).
• Finalise proportion of electricity procured from sleevedrenewable PPA.
• The total procurement should be adjusted for the likelyconsents received for private wire generation that cancommission in Phase II.
• Start assessment process of ITT submissions.• HS2 to confirm developer and technology of
choice based on: Cost Deliverability (consented plants) Risk appetite (e.g. HS2 may have to
decide between a fixed cost vs floatingcost contract, the former having a lowerrisk but likely to come at a premium.
In delivering option 3, there are a number of key activities and milestones that HS2 and its stakeholders will have to undertake. The following three slides sets out these milestones, the implications for HS2, and the key actions that HS2 will be required to take.
Roadmap

109© 2018 KPMG LLP, a UK limited liability partnership and a member firm of the KPMG network of independent member firms affiliated with KPMG International Cooperative (“KPMG International”), a Swiss entity. All rights reserved.
Document Classification: KPMG Confidential
Delivering option 3 - Roadmap (2)Year Key milestones Implications for HS2 HS2 Action
2021-22
• Finalise framework agreementwith PPA provider regarding new asset development where applicable.
• Any investment decisions by the developerbeyond 2021-22 will risk deliverability by2026-27.
• HS2 to agree framework agreement with PPAprovider.
2023-24• Construction of new
generation asset for PPA provider.
2025-26
• Commissioning / testing of PPA generation assets.
• Reconfirmation of available sites and technical feasibility studies for private wire generation.
• The technical feasibility exercise will helpascertain an initial view of maximum andminimum apportionment of private wiregeneration.
• Soft engagement with private financeproviders will help to inform availableprivate finance structures and the cost oftechnologies.
• Soft engagement with developers for privatefinancing (second round).
2026-27
Launch of HS2 Phase I
• Start selection process for 3rd
party private wire generation providers.
• Sufficient time needs to be allocated to theselection process to ensure competitionbetween providers to guarantee best valuefor HS2.
• Depending on the private wire solution, HS2may have to consider procuring balancingpower from a utility or a supplier.
• Set out PQQ to developers, utilities and potentialinvestors.
• Formal invitation to tender 3rd
party private wire generation provider
• Set out a tender and review bids for least cost options for consented capacity.
• HS2 to decide on private wire developer based on: Cost Deliverability Commercial risk of the developers.
Roadmap

110© 2018 KPMG LLP, a UK limited liability partnership and a member firm of the KPMG network of independent member firms affiliated with KPMG International Cooperative (“KPMG International”), a Swiss entity. All rights reserved.
Document Classification: KPMG Confidential
Delivering option 3 - Roadmap (3)Year Key milestones Implications for HS2 HS2 Action
2027-28
• Pre-Application for consenting process for technologies for private wire generation.
• Submit the final application for Development Consent Orders (DCO) for private wire generation.
• Finalise proportion of electricity to becommissioned via private wire.
• Development Consent Orders (DCO) arerequired for deployment above 50MW ofinstalled capacity which can take up to 2-5years. Any submissions beyond 2026-27will risk deliverability by 2032-33.
• Less than 50MW of installed capacityrequires local planning permission whichcan take 6 months – 3 years.
• Finalise the decision on land requirement, basedon technical feasibility study and existingconnections to traction and non-traction assetsto initiate the consenting process
• Work with private wire developer to ensuretimely submission of DCO.
2028-29 • Construction phase
2031-32 • Commissioning / testing
2032-33 Launch of HS2 Phase II
2018 2020 2022 2024 2026 2028 2030 2032
Launch of HS2 Phase II
Launch of HS2 Phase I
ConstructionCommissioning
Planning and consenting
Selection process & ITT
Market engagement
Site identification and feasibility studies
Selection process & ITT
Finalise framework agreement
Construction
Commissioning
PPA milestones
Private wire milestones
HS2 Phase launches
HS2 Roadmap Timeline
Roadmap

111© 2018 KPMG LLP, a UK limited liability partnership and a member firm of the KPMG network of independent member firms affiliated with KPMG International Cooperative (“KPMG International”), a Swiss entity. All rights reserved.
Document Classification: KPMG Confidential
EC4T RoadmapYear Key milestones Implications for HS2 HS2 Action
2021-22
• Soft engagement with supplier(s) of the traditional generation option (e.g. EDF provides the EC4T contract for other TOCs at present).
• Soft engagement with suppliers will help toinform available contracts and potential costimplications.
• Conduct soft engagement withtraditional electricity supply providers.
2022-23
• Issue an ITT for “traditional” supply / Start selection process for Option 2 for 2025
• Get binding bids and commercial structures from utilities and compare against EC4T contract.
• Sufficient time needs to be allocated to theselection process to ensure competition betweenproviders to guarantee best value for HS2.
• Down-select the longlist of suppliers based on acriteria, which could include amongst otherthings; cost, carbon reduction, cost certainty etc.
• Start assessment process of ITTsubmissions
2024-25 • Commissioning / testing
2027 Launch of HS2 Phase 1 + 2a
2028-29
• Soft engagement with supplier(s) of the traditional generation option (e.g. EDF provides the EC4T contract for other TOCs at present).
• HS2 may be able to leverage Phase I supplycontract to achieve further cost reductions.
• More generating capacity will be required overPhase II. This could affect the number ofpotential suppliers who are able to meet HS2’selectricity needs.
• Conduct soft engagement withtraditional electricity supply providers.
2029-30
• Issue an ITT for “traditional” supply / Start selection process for Option 2 for 2025
• Get binding bids and commercial structures from utilities and compare against EC4T contract.
• Sufficient time needs to be allocated to theselection process to ensure competition betweenproviders to guarantee best value for HS2.
• Down-select the longlist of suppliers based on acriteria, which could include amongst otherthings; cost, carbon reduction, cost certainty etc.
• Start assessment process of ITTsubmissions
2031-32 • Commissioning / testing
2033 Launch of HS2 Phase 2
Roadmap

Appendix11.

Additionality11.1

114© 2018 KPMG LLP, a UK limited liability partnership and a member firm of the KPMG network of independent member firms affiliated with KPMG International Cooperative (“KPMG International”), a Swiss entity. All rights reserved.
Document Classification: KPMG Confidential
Definition of AdditionalityThe concept of Additionality in the electricity sector is complex and as an industry there is not a widely accepted definition to rely upon.
This is in part because all electricity is identical and electrons used by demand customers can not be traced back to their source of generation. Therefore use of renewable electricity generation on a shared distribution grid is determined contractually.
Ofgem set out the key principal of additionality when referring to green tariff as follows:
“Additionality: When consumers buy a tariff based on renewable supply, they expect that they are benefitting the environment by supporting renewable generation. Additionality means that this benefit happens as a direct result of the consumer buying the tariff, and not just because of subsidies or obligations.”
The Center of Rosource Solutions (CRS) defines additionality with respect to Greenhouse Gases (GHGs) as follows:
“a project or activity that reduces GHGs [that] would not have happened without the offset buyer or collective buyers in the market. In a business-as-usual scenario …. the project would not have taken place.” https://resource-solutions.org/wp-content/uploads/2016/03/RECs-and-Additionality.pdf
When considering additionality with respect to investment in renewables, it could be argued that additionality should be defined by the environmental benefit occuring as a direct result of the investment.
It could be argued that additionality is not necessary limited to new projects. It could be that where a developer has a limited amount of capital available for development, the re-financing of existing assets to free up capital for further developments is critical to create additional assets into the system and therefore without that investment those future assets would not be developed.
Two proposed interpretation of additionality with respect to investment in renewable energy are:
- The investment should be direct in delivering new renewable/low carbon projects;
- The investment can be in existing renewable/low carbon projects to free up capital for new renewable/low carbon projects.
It is recommended that HS2 agree on an interpretation of additionality in the early stages of implementing their electricity strategy.

Electricity Market Trends
11.2

116© 2018 KPMG LLP, a UK limited liability partnership and a member firm of the KPMG network of independent member firms affiliated with KPMG International Cooperative (“KPMG International”), a Swiss entity. All rights reserved.
Document Classification: KPMG Confidential
Current GB electricity market trends
2005 20302016Net imports
2%
Coal33%
Nuclear20%
Renewables4%
Gas 39%
Other2%
Net imports6% Coal
6%
Nuclear18%
Renewables25%
Gas 44%
Other1%
Net imports18%
Coal0%
Nuclear24%Renewables
38%
Gas 19%
Other1%
Source: BEIS 2016 Updated Energy & Emissions Projections and DUKES
The electricity mix for the GB market has changed significantly over the last 10+ years and is likely to change further in the next few decades. The penetration of renewables in increasing alongside a greater reliance of imported energy using the GB interconnectors and the volume of fossil fuel generated electricity will significantly reduce.

Intermittent vs. non intermittent
11.3

118© 2018 KPMG LLP, a UK limited liability partnership and a member firm of the KPMG network of independent member firms affiliated with KPMG International Cooperative (“KPMG International”), a Swiss entity. All rights reserved.
Document Classification: KPMG Confidential
Intermittent vs. non intermittentThere are a number of different technologies used in the generation of electricity. These can broadly be split into two categories; intermittent and non-intermittent. The extent to which a technology is intermittent has implications for security ofsupply, and this must be borne in mind by HS2.
Intermittent generation
• Intermittent electricity generation refers to sources of electricity that cannot be altered in response to a command, and exhibit uncontrolled increases or decreases in output.
• Examples of intermittent generation include wind power, solar power, wave power or tidal. These technologies can only generate electricity when their energy source is available, i.e. when the sun is shining or when the wind is blowing.
• Intermittent generation cannot be relied on to generate most of their maximum electricity output at periods of high demand. This creates a number of challenges in operating and balancing the national grid.
Non-intermittent generation
• Non-intermittent sources of electricity generation refers to controllable technologies that can be ‘turned-up’ or ‘turned-down’ is response to instructions from power station operators.
• Different forms on non-intermittent generation have varying levels of flexibility. Nuclear, for example, cannot be turned up or down quickly, and as such acts as baseload generation, maintaining output regardless of demand (see below).
• Gas generation on the other hand is a flexible source of generation, able to increase its output in a short period of time. It is for this reason that gas is often used to meet peak demand.
0
5
10
15
20
25
30
35
nuclear coal ccgt wind solar
04/09/2017 05/09/2017 06/09/2017 07/09/2017 08/09/2017 09/09/2017 10/09/2017
Source: National Grid
UK generation load profile in the first week of September 2017 (GW)
Nuclear generation is non-intermittent but inflexible and acts as the ‘baseload’ .
Gas generation is non-intermittent and flexible, and is used to turned up during the day time peaks
Wind and solar are intermittent generation – solar only generates during the day when the sun is shining and wind output varies considerably throughout the day.

Key Assumptions
11.4
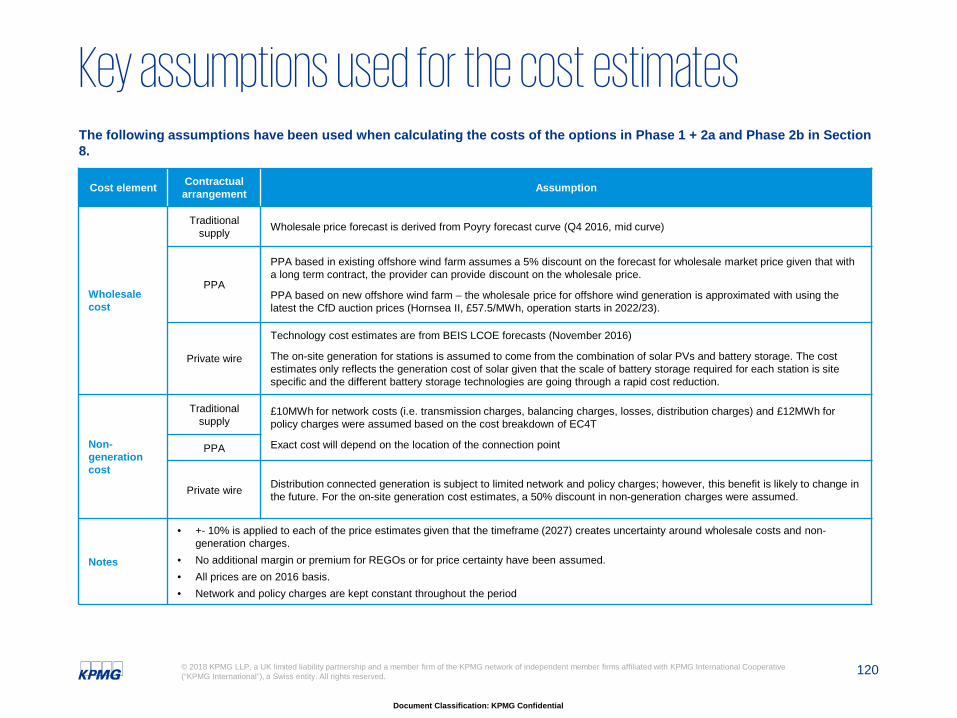
120© 2018 KPMG LLP, a UK limited liability partnership and a member firm of the KPMG network of independent member firms affiliated with KPMG International Cooperative (“KPMG International”), a Swiss entity. All rights reserved.
Document Classification: KPMG Confidential
Key assumptions used for the cost estimates
Cost element Contractual arrangement Assumption
Wholesale cost
Traditional supply Wholesale price forecast is derived from Poyry forecast curve (Q4 2016, mid curve)
PPA
PPA based in existing offshore wind farm assumes a 5% discount on the forecast for wholesale market price given that with a long term contract, the provider can provide discount on the wholesale price.
PPA based on new offshore wind farm – the wholesale price for offshore wind generation is approximated with using the latest the CfD auction prices (Hornsea II, £57.5/MWh, operation starts in 2022/23).
Private wire
Technology cost estimates are from BEIS LCOE forecasts (November 2016)
The on-site generation for stations is assumed to come from the combination of solar PVs and battery storage. The cost estimates only reflects the generation cost of solar given that the scale of battery storage required for each station is site specific and the different battery storage technologies are going through a rapid cost reduction.
Non-generationcost
Traditional supply
£10MWh for network costs (i.e. transmission charges, balancing charges, losses, distribution charges) and £12MWh for policy charges were assumed based on the cost breakdown of EC4T
Exact cost will depend on the location of the connection pointPPA
Private wire Distribution connected generation is subject to limited network and policy charges; however, this benefit is likely to change inthe future. For the on-site generation cost estimates, a 50% discount in non-generation charges were assumed.
Notes
• +- 10% is applied to each of the price estimates given that the timeframe (2027) creates uncertainty around wholesale costs and non-generation charges.
• No additional margin or premium for REGOs or for price certainty have been assumed.• All prices are on 2016 basis.• Network and policy charges are kept constant throughout the period
The following assumptions have been used when calculating the costs of the options in Phase 1 + 2a and Phase 2b in Section 8.

121© 2018 KPMG LLP, a UK limited liability partnership and a member firm of the KPMG network of independent member firms affiliated with KPMG International Cooperative (“KPMG International”), a Swiss entity. All rights reserved.
Document Classification: KPMG Confidential
Key assumptions underpinning the electricity options
Technology Load Factor(%)
Implied capacity required to meet HS2 power demand (MW)
Implied landrequirement(km2 / soccer fields)
LCOE(£/MWh)
Consentingprocess(years)
Construction period
2020 2025 2030 <50MW >50MW
Solar 11%
2,300MW(largest operational solar farm is 72MW in the UK)
Over 11,000 acres (8,500 football fields)
59-80 55-76 52-73 <1 2-4 3months -2 years
Onshore Wind 32%
780MW(largest operational onshore wind farm is 350MW in the UK)
Over 26,000 acres (19,000 football fields)
47-76 46-74 45-72 2- 5 4-5 2-3 years
Offshore wind 48%
520MW(largest operational offshore wind farm is 630MW in the UK)
N.A. 70-119 50-60 50-55 5 3 years
Notes:Calculation of capacity required is based on the following formula:
𝐶𝐶𝐶𝐶𝐶𝐶𝐶𝐶𝐶𝐶𝐶𝐶𝐶𝐶𝐶𝐶 𝑀𝑀𝑀𝑀 =𝐷𝐷𝐷𝐷𝐷𝐷𝐶𝐶𝐷𝐷𝐷𝐷 (𝑀𝑀𝑀𝑀𝑀)
(𝐻𝐻𝐻𝐻𝐻𝐻𝐻𝐻𝐻𝐻 𝐶𝐶𝐷𝐷 𝐶𝐶 𝐶𝐶𝐷𝐷𝐶𝐶𝐻𝐻(𝑀𝐻𝐻𝐻𝐻) ∗ 𝐿𝐿𝐻𝐻𝐶𝐶𝐷𝐷 𝐹𝐹𝐶𝐶𝐶𝐶𝐶𝐶𝐻𝐻𝐻𝐻 (%))Assumed Demand for HS2 is 2.2TWhSources:1. BEIS Electricity Generation Costs (November 2016)2. National Infrastructure Planning (The Process)3. Solar Trade4. Green Alternatives and National Energy Strategy: The Facts behind the Headlines
The following assumptions have been used when calculating the costs of the options in Phase 1 + 2a and Phase 2b in Section 8.
Case Studies11.5

123© 2018 KPMG LLP, a UK limited liability partnership and a member firm of the KPMG network of independent member firms affiliated with KPMG International Cooperative (“KPMG International”), a Swiss entity. All rights reserved.
Document Classification: KPMG Confidential
Deutsche Bahn – Case study
Source: DB website
Deutshce Bahn
• Deutsche Bahn (DB) is the national rail operator in Germany. Running over 40,000 trains daily, on more than 33,000km of network, Deutsche Bahn is one of the largest railway operator and infrastructure owner in Europe.
DB2020+ strategy
• DB has developed a company wide corporate strategy, DB2020+. One of the primary goals of the DB2020+ strategy is to reduce the company's global CO₂ emissions to 0 by 2050. One way that DB plans to meet that aim is to increase the share of renewable energy sources in its traction mix.
• By 2020 DB plans to increase the share of renewable energy used to power traction to 45 percent. At the end of 2015, renewables accounted for 42 percent of the entire traction current mix.
• DB are well on their way to achieving this target having increased the share of renewables from under 20% in 2010 to over 40 in 2016 (see charts below right).
• In developing its power supply strategy, DB is cognizant of three ‘essential challenges of power supply’;
RWE supply contract
• In 2011, DB signed a 15 year electricity supply contract with one of the country’s largest electricity producers, RWE Innology. This was a key milestone in working towards the DB2020+ strategy.
• Under this agreement, between 2014 and 2028, RWE is supplying DB with c.900 GWh of electricity per year, with electricity generated from renewable sources. This equates to c.8% of Germany’s electric traction power demand, and is enough to run about one third of DB's long distance trains for a year.
• RWE supplies DB with electricity generated from 14 of its hydroelectric plants located on the Rhine, Mosel, Saar, Ruhr and Rur rivers in Germany.
• RWE guarantees that the electricity supplied is from the hydroelectric plants through the implementation of certified proofs of origin.
• The supply contract with RWE is one of a number of long-term agreements with electricity generators that DB has in place to meet its energy demands and its DB2020+ strategy.
• Economic efficiency – optimise procurement strategy, developing and enhancing instruments like portfolio and risk management.
• Security of supply – develop a reliable generation and distribution system in order to secure reliability of supply.
• Environmental protection – save CO2 emissions and increased use of renewables.
2044
100
0%
20%
40%
60%
80%
100%
2010 2015 2050 (forecast)
Traction power generated from renewables (%)
Renewables Non-renewables

124© 2018 KPMG LLP, a UK limited liability partnership and a member firm of the KPMG network of independent member firms affiliated with KPMG International Cooperative (“KPMG International”), a Swiss entity. All rights reserved.
Document Classification: KPMG Confidential
Case study – ‘Riding Sunbeams’KPMG attended the launch event of the feasibility study of exploring the potential for solar to directly power the UK rail, tube and tram systems.
The project
Applicability to HS2
• 10:10 Climate Action group has spent the past nine months working alongside researchers from Imperial College London on a technical feasibility study to assess if and how solar can be used to power trains on DC networks in a way that makes commercial sense for all parties.
• Solar PV could be connected directly to electrified railways to supply electricity to the trains, with no need to connect to thegrid. However, this has not yet been done anywhere in the world.
• The study has focused on DC traction systems, partly due to the nature of the decentralised renewable energy generation. Solar PV arrays typically output current power at between 600 and 800 volts whereas rail networks that use DC traction power typically operate at 750 volts. This means that the costs of power electronics needed to connect solar to DC traction networks should be competitive with typical grid connection costs, also offers reduced losses from avoiding AC to DC conversion.
• The viability of solar connected to the rail system depends on the profile of the traction demand. Each substation on the 25 kV overhead catenary system provides power to approximately 60 km of track. For a frequent rail services there is likely to always be a train within the 60 km range. For any small time periods with no traction demand, the generation will either need to be exported back to the 400 kV transmission network, stored until a train enters the section or the generation curtailed.
• Connecting distributed renewable energy generators to AC railway traction systems remains a promising possibility, particularly where connections can be integrated during new electrification works. AC traction substations usually cover a large length of the track and could connect large solar farms (or even wind generation).
Source: 10:10 Climate Action, Imperial College London, Innovate UK, Community Energy South, Turbo Power Systems: Riding Sunbeams, Powering our railways with solar PV

Overview of the available technologies
11.6

126© 2018 KPMG LLP, a UK limited liability partnership and a member firm of the KPMG network of independent member firms affiliated with KPMG International Cooperative (“KPMG International”), a Swiss entity. All rights reserved.
Document Classification: KPMG Confidential
Solar (1)Solar energy is generated through the use of photovoltaics (PV) to convert solar energy to electricity. In 2016 the UK was placed 6th globally in terms of solar installed capacity and generated 3.4% of its electricity using solar electricity.
• The UK has seen a rapid uptake of solar deployment since 2010, dueto the cost of solar installation falling a lot faster than the demand-ledsubsidy schemes with over 12 GW of installed capacity in 2017.
• To curb the subsidy spend, the Government introduced measures in2015 to reduce the deployment of subsidy- driven solar. The subsidiesavailable include Small-scale FiTs (<5MW) although these have beenconstrained lately; ROs for new-build solar are no longer available, andgiven solar’s classification as a ‘proven’ technology, it is not eligible tobid in the ongoing CfD Round 2 auction. Broadly, it appears that therewill be limited government financial support for solar generation goingforward.
• While the subsidy cuts have reduced the pace of deployment, solardeployment still continues to increase in the GB market. This isbecause the costs to install both small and large-scale solar capacitycontinues to fall, improving the economics of future installations andenabling it to be deployed without subsidies.
• The cost of solar is expected to reach grid-parity* by the end of thedecade for large scale/ground mounted solar.
• Given these falling costs, we have recently seen the first subsidy freesolar project in the UK.**
• However, the intermittent (or non-dispatchable) nature of thetechnology, can add to system balancing costs. For this purpose, manydevelopers such as Anesco are looking at solar + storage solutions.
Source: BEIS, KPMG analysis
Source: KPMG analysis
Installed solar capacity (GW)
*Grid parity (or socket parity) occurs when an alternative energy source can generate electricityat a levelised cost of electricity (LCOE) that is less than or equal to the price of purchasingelectricity from the electricity system.
**Anesco have succeeded at deploying the first zero-subsidy solar farm in the UK. Clayhill solarfarm, located in Milton Keynes, was officially opened on 26 September 2017. Anesco’s teamnavigated a range of technical and commercial complexities to achieve a subsidy-freedevelopment at Clayhill.
Initial feasibility analysis – potential technologies
Large scale solar, LCOE range (£/MWh)
40
50
60
70
80
90
2020 2025 2030
£/M
Wh

127© 2018 KPMG LLP, a UK limited liability partnership and a member firm of the KPMG network of independent member firms affiliated with KPMG International Cooperative (“KPMG International”), a Swiss entity. All rights reserved.
Document Classification: KPMG Confidential
Onshore wind farms are collections of turbines which convert mechanical energy from wind into electricity. The UK is considered to be one of the best locations in the world for onshore wind generation.
Onshore wind (1)
Onshore wind installed capacity• Currently there is over 11GW of onshore wind capacity installed in
the UK, driven by subsidy mechanisms for the technology.
• However, the lack of political support for the technology hasresulted in no new subsidies being made available for onshorewind, which has contributed to slower growth in recent years.
• At a local level, onshore wind projects have faced challenges inrelation to securing planning permission due to communitiesregarding wind turbines as “eyesores”, even though theGovernment views onshore wind as viable solution which wouldbring down consumers’ energy bills.
• Without further government support, and with challenges at thelocal level, the landscape for further onshore wind developmentcould be challenging.
• However, developers of onshore wind technology have pointedtowards falling costs. Whilst no subsidies have been granted foronshore wind in the UK since the last CfD round in February 2015(clearing at £80/MWh), clearing prices in continental Europe, inparticular the German auction in August 2017, where 1GW ofcapacity was awarded contracts at an average price of €42.8/MWh,demonstrate the continued reduction in costs for the technology.
• However, given the intermittent nature of the technology, onshorewind can result in higher system balancing costs. For this purpose,many developers such as Falck renewables and Vattenfall arelooking at onshore wind + storage solutions.
Source: KPMG analysis, DUKES
Initial feasibility analysis – potential technologies
Onshore wind >5MW, LCOE range (£/MWh)
30
40
50
60
70
80
2020 2025 2030
£/M
Wh
Source: KPMG analysis, BEIS

128© 2018 KPMG LLP, a UK limited liability partnership and a member firm of the KPMG network of independent member firms affiliated with KPMG International Cooperative (“KPMG International”), a Swiss entity. All rights reserved.
Document Classification: KPMG Confidential
5060708090
100110120130
2020 2025 2030
£/M
Wh
Offshore wind energy refers to wind farms that are located at sea, usually on the continental shelf, to harvest wind energy to generate electricity. The higher, and more consistent, wind speeds that are available offshore, compared to onshore, allows offshore wind to have a higher output and load factor potential.
Offshore wind (1)
• The uptake of offshore wind capacity installed has been supportedby subsidies and technology cost reductions. Current capacity isc.5GW with a further 5GW under construction and to becommissioned by 2020.
• The Contract for Different (CfD) round in 2017 procured anadditional 3GW of offshore wind which is due to be commissionedby 2023 at a strike price of £57.50/MWh.
• Government has indicated that “up to” £557m of additional fundingwill be made available for future CfD rounds, with the next auctionexpected to take place in Spring 2019.
• Offshore wind costs have been declining rapidly from £114.39/MWhand £119.89/MWh in the February 2015 CfD auction (for deliveryyears 2017/18 and 2018/19 respectively) to £74.75/MWh and£57.50/MWh in the September 2017 auction (for delivery years2021/22 and 2022/23 respectively).
• Similar to the German market, it is likely that offshore wind farmswill be able to operate on a zero-subsidy basis within the nextdecade, and the Government has expressed its intention for futureoffshore wind capacity to come forward subsidy free.
-2468
101214161820
2012 2013 2014 2015 2016
Installed capacity (GW) Generation (TWh)
Source: KPMG analysis, DUKES
Offshore wind CfD round clearing price
Initial feasibility analysis – potential technologies
Offshore wind round 3, LCOE range (£/MWh)
Source: KPMG analysis, BEIS
Offshore wind installed capacity and generation

129© 2018 KPMG LLP, a UK limited liability partnership and a member firm of the KPMG network of independent member firms affiliated with KPMG International Cooperative (“KPMG International”), a Swiss entity. All rights reserved.
Document Classification: KPMG Confidential
Energy from Waste (EfW) comprises several technologies, including landfill waste and gas, sewage, biomass, anaerobic digestion and advanced conversion technology (ACT).
Energy from Waste, EfW (1)
• There is currently 5.6GW of EfW installed capacity on the GB electricity system.
• 157MW of EfW (including ACT) won contracts in the first CfD Auction (2015), for delivery in 2017-19.
• The EU Landfill Directive, which sets targets for the proportion of waste sent to landfill, in combination with financial incentives from Government (Private Finance Initiative, ROs, CfDs), have driven historic investment in EfW.
• Certain established technologies, which include several energy from waste methods (with or without CHP) have been excluded from the current CfD auction (Round 2); it is only open to ‘fuelled technologies’, ACT, AD and biomass CHP.
• The cost of feedstock (the fuel that is burned in EfW generation) results in higher marginal costs compared to wind or solar, although developers receive gate fees for removing waste. The net effect is unlikely to lead to the level of cost reductions currently associated with the other intermittent renewable technologies considered in this assessment.
• In line with that, BEIS estimates that the LCOE of EfW is likely to fall over the next decade. There is a large range between the high and low estimates, and this is assumed to be a result of the wide variation in fuel costs associated with EfW plants.
Source: KPMG analysis, DUKES
Energy from Waste, Capacity forecast (GW)
Initial feasibility analysis – potential technologies
Energy from Waste, LCOE range (£/MWh)
Source: KPMG analysis, BEIS
0102030405060708090
2020 2025 2030
£/M
Wh

130© 2018 KPMG LLP, a UK limited liability partnership and a member firm of the KPMG network of independent member firms affiliated with KPMG International Cooperative (“KPMG International”), a Swiss entity. All rights reserved.
Document Classification: KPMG Confidential
Gas fired power plants can help meet baseload electricity demand, however the demand for them has reduced in recent years. Despite this, baseload gas offers a cleaner alternative to coal fired generation that is currently being phased out.
Gas Baseload (1)
• New Combined Cycle Gas Turbines (CCGTs) have not fared well in the UKmarket as of late. The need for new gas plants has been decliningconsistently while the generation from gas plants is being squeezed out byprojected growth in renewables, nuclear and interconnectors.
• Regardless, the Government is aware of the large requirement for new buildflexible generation by 2030, which could include 10GW of new build gasgeneration in the 2020’s.
• This estimate however is driven by an assumption of high dependency oninterconnection (15GW) and new nuclear (9GW) by 2030. If these are notdelivered, this could lead to a higher requirement for flexible gas generation(>10GW) to ensure security of supply.
• Furthermore, there appears to be a policy shift in favour of CCGTs. Ofgem’smove to revoke the lucrative triad benefit (which has favoured connectedpeaker economics to date) has equalised the capacity market.
• Given that, there are a number of CCGT projects in the pipeline whichwould be launched given an appropriate capacity price. Financially, thereare a number of drivers and challenges for building a new CCGT.
‒ First, the project needs to earn sufficient margin on the wholesalemarket margins.
‒ Second, the project requires sufficient capacity margin, which is drivenby UK capacity market pricing, adjusted for CCGT derating factors.
‒ Third, the project requires sufficient margins from bidding units into theBalancing Mechanism and through providing other ancillary services.
• Going forward, there are a number of risks associated with CCGT projects,given their long asset lives (20 years+). CCGTs are still likely to face stiffcompetition from renewables, which are increasingly cost effective (see right– where LCOE of CCGT increases over the next decade as subsidies areremoved).
• The ‘shape’ of electricity consumption may also change due to thedeployment of electric cars and demand side response measures, whichmay erode peak price shape.
0
10
20
30
40
2013
2014
2015
2016
2017
2018
2019
2020
2021
2022
2023
2024
2025
2026
2027
2028
2029
2030
2031
2032
2033
2034
2035C
umul
ativ
e ne
w b
uild
(GW
) 2013 Projections2014 Projections2015 Projections2016 Projections
CCGTs, forecasted cumulative new build by year
Initial feasibility analysis – potential technologies
Gas Baseload (CCGT H Class), LCOE range (£/MWh)
Source: KPMG analysis, BEIS
40
50
60
70
80
90
100
110
2020 2025 2030
£/M
Wh

131© 2018 KPMG LLP, a UK limited liability partnership and a member firm of the KPMG network of independent member firms affiliated with KPMG International Cooperative (“KPMG International”), a Swiss entity. All rights reserved.
Document Classification: KPMG Confidential
As suggested by their name, gas peaking plants are gas fired power plants that generally run only at periods of high demand, known as peak demand. Peak load power plants are dispatched in combination with base load power plants, which supply a dependable and consistent amount of electricity, to meet the minimum demand.
Due to the high marginal costs and the nature of their operation, Gas peaking plant were not considered in this analysis.
Gas peaking (1)
• Historically, investment for peaking purposes have been dominated by large,grid connected CCGTs. However, the last couple of years have shown a surgein distributed connected gas peakers as a source of new capacity, in particularin the UK market (with 3.5GW successful in UK capacity auctions to date). Thisis driven by the cost advantage and flexibility of gas-fired distribution connectedreciprocating engines.
• In addition, there is a favourable policy shift towards gas and diesel peakers:policies such as the Capacity Market and the Triad revenues have successfullyincentivised investment in small-scale diesel and gas engine capacity in themarket.
• However, some short-term regulatory uncertainty currently exists (e.g. review ofembedded benefits and new rules governing diesel generation). TheDepartment of Business, Energy and Industrial Strategy (BEIS), Ofgem, andsome industry players believe that embedded benefits, specifically Triadpayments, have created an unlevelled playing field between distribution-connected and transmission-connected generators in the UK.
• Furthermore, a consultation on Air Quality by Defra has been introduced todeter new build diesel generation from coming on the system as it is carbonintensive. However, these reforms have been unable to deter 1.3GW ofembedded generation from securing Capacity Market agreements. The Defraconsultation was able to deter diesel generation from participating the auction.
• From a commercial perspective, peaker margins can be broken down intocapacity margins, energy margins, revenue from balancing services andembedded benefits (although this is currently being eroded by policy reforms).
• The key margin component for gas peakers is capacity margins, anduncertainty can be reduced by securing long term capacity agreements.
0
0.5
1
1.5
2
CM 2014 CM 2015 CM2016
GW
Capacity Market New-build DE
Small-scale engine + Battery
Small-scale engine
Battery
Initial feasibility analysis – potential technologies
Gas peaking, LCOE range (£/MWh)
0
100
200
300
400
500
2020 2025 2030

132© 2018 KPMG LLP, a UK limited liability partnership and a member firm of the KPMG network of independent member firms affiliated with KPMG International Cooperative (“KPMG International”), a Swiss entity. All rights reserved.
Document Classification: KPMG Confidential
Demand Side Response (DSR) (1)DSR covers services which would enable HS2 to turn down or shift their demand in real time i.e. DSR could smooth HS2’s demand – generation profile, optimising HS2’s usage profile while simultaneously providing revenue opportunities.
DSR contracts awarded, by Capacity Market delivery year• The DSR market is growing, with 1.4GW of DSR awardedcontracts in the 2017 T-4 Capacity Market auction. The abilityto provide balancing services, in conjunction with advancedtechnology and new business models, is likely to increaseuptake.
• DSR currently benefits from a number of revenue sourcesincluding Capacity Market revenues, balancing servicerevenues and embedded benefits.
• National Grid estimates that there is currently 1.3GW of ‘turn-down’ DSR on the GB system, mainly provided by largeindustrial and commercial users to reduce their cost of energyat peak times in the winter. However, in the future that couldincrease to 4.5GW by 2030.
• The provision of DSR will be technology-driven and emergingtechnology companies with new business models couldpresent viable commercial options e.g. Flextricity, KiwiPower.
• In recent years, a large number of corporates have takenadvantage of the potential revenue streams associated withDSR, such as Network Rail, TfL, Google etc.
Initial feasibility analysis – potential technologies
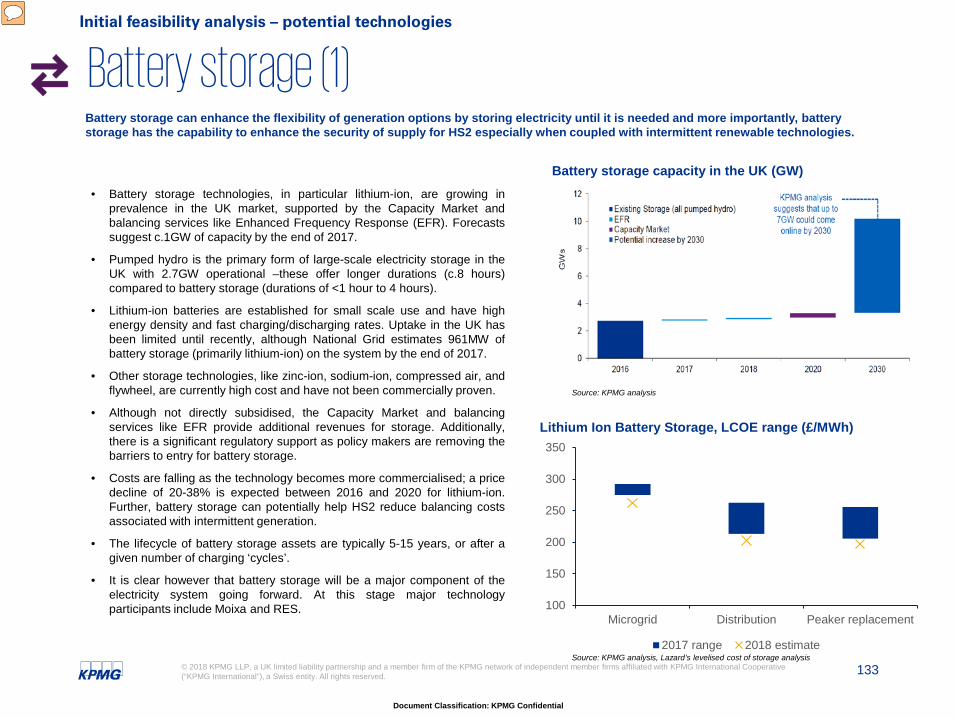
133© 2018 KPMG LLP, a UK limited liability partnership and a member firm of the KPMG network of independent member firms affiliated with KPMG International Cooperative (“KPMG International”), a Swiss entity. All rights reserved.
Document Classification: KPMG Confidential
Battery storage (1)Battery storage can enhance the flexibility of generation options by storing electricity until it is needed and more importantly, battery storage has the capability to enhance the security of supply for HS2 especially when coupled with intermittent renewable technologies.
Source: KPMG analysis
Battery storage capacity in the UK (GW)• Battery storage technologies, in particular lithium-ion, are growing in
prevalence in the UK market, supported by the Capacity Market andbalancing services like Enhanced Frequency Response (EFR). Forecastssuggest c.1GW of capacity by the end of 2017.
• Pumped hydro is the primary form of large-scale electricity storage in theUK with 2.7GW operational –these offer longer durations (c.8 hours)compared to battery storage (durations of <1 hour to 4 hours).
• Lithium-ion batteries are established for small scale use and have highenergy density and fast charging/discharging rates. Uptake in the UK hasbeen limited until recently, although National Grid estimates 961MW ofbattery storage (primarily lithium-ion) on the system by the end of 2017.
• Other storage technologies, like zinc-ion, sodium-ion, compressed air, andflywheel, are currently high cost and have not been commercially proven.
• Although not directly subsidised, the Capacity Market and balancingservices like EFR provide additional revenues for storage. Additionally,there is a significant regulatory support as policy makers are removing thebarriers to entry for battery storage.
• Costs are falling as the technology becomes more commercialised; a pricedecline of 20-38% is expected between 2016 and 2020 for lithium-ion.Further, battery storage can potentially help HS2 reduce balancing costsassociated with intermittent generation.
• The lifecycle of battery storage assets are typically 5-15 years, or after agiven number of charging ‘cycles’.
• It is clear however that battery storage will be a major component of theelectricity system going forward. At this stage major technologyparticipants include Moixa and RES.
Initial feasibility analysis – potential technologies
100
150
200
250
300
350
Microgrid Distribution Peaker replacement
2017 range 2018 estimate
Lithium Ion Battery Storage, LCOE range (£/MWh)
Source: KPMG analysis, Lazard’s levelised cost of storage analysis

Document Classification: KPMG Confidential
© 2018 KPMG LLP, a UK limited liability partnership and a member firm of the KPMG network of independent member firms affiliated with KPMG International Cooperative (“KPMG International”), a Swiss entity. All rights reserved.
The KPMG name and logo are registered trademarks or trademarks of KPMG International.