hsbc equity factsheet oct · after the interest rate cut decision by the reserve bank of india...
TRANSCRIPT
The AssetFactsheet – October 2015

Index
Fund Manager Commentary
HSBC Equity Fund
HSBC India Opportunities Fund
HSBC Midcap Equity Fund
HSBC Infrastructure Equity Fund
HSBC Tax Saver Equity Fund
HSBC Dividend Yield Equity Fund
HSBC Emerging Markets Fund
HSBC Brazil Fund
HSBC Managed Solutions India - Growth
HSBC Managed Solutions India - Moderate
HSBC Managed Solutions India - Conservative
Fund Managers - Equity
Comparative Performance of Equity Schemes
HSBC MIP - Savings Plan
HSBC MIP - Regular Plan
HSBC Income Fund - Investment Plan
HSBC Income Fund - Short Term Plan
HSBC Floating Rate Fund - Long Term Plan
HSBC Cash Fund
HSBC Gilt Fund
HSBC Ultra Short Term Bond Fund
HSBC Flexi Debt Fund
Fund Managers - MIP & Debt
Comparative Performance of MIP & Debt Schemes
HSBC Dynamic Fund
HSBCAsia Pacific (Ex Japan) Dividend Yield Fund
HSBC Global Consumer Opportunities Fund
SIP Performance of Equity Schemes
Section II - How to read Factsheet
01
05
06
07
08
09
10
11
12
13
14
15
16
17
19
21
25
30
31
32
33
34
35
36
37
38
39
40
43
18

Economic Indicator
The Consumer Price Index (CPI) inched up as base effect waned off
Index of Industrial Production (IIP) registers sequential pick-up
The CPI inflation release for the month of September 2015 came as per expectation at 4.4% against 3.7% in previous month. Base effect has
normalized from September 2014 resulting in pick-up. However, sequential momentum in food prices remained favorable. It largely reflects
pro-active measures taken by government in managing supply chain issues as food prices would have inched up on lower than average
rainfall in last couple of years. Core inflation remained flat at 5.5%.
The Wholesale Price index (WPI) inflation remained in a deflationary state making it the 11th consecutive month of (YoY) decline at -4.5% vs.
-5% inAugust 2015.
Industrial production for the month of August 2015 rose sharply to 6.4% against 4.1% in July 2015. Though there was favorable base effect,
IIP exhibited sequential uptick as well. Growth largely came from capital goods signifying underlying industrial growth recovery and
consumer durables implying growth in discretionary demand.
Source: Bloomberg; Central Statistical Organization (CSO)
Source: Bloomberg; Central Statistical Organization (CSO)
Government is walking tight rope on fiscal front. Though, overall fiscal deficit for April – September 2015 was lower at 68.1% of budgeted estimate against
85.6% last year, growth in direct taxes continue to remain a worry. Higher indirect taxes and lower oil subsidy likely to compensate a bit for shortfall in direct
taxes. Further, government may bring down dis-investment target to INR 300 billion against INR 695 billion given during budget presentations. We may see
some curtailment in Plan capital expenditure which continues in top gear to provide boost to economy to adhere fiscal targets.
India's trade deficit for September 2015 narrowed to ~USD 10.5 billion vs. USD 12.5 billion of deficit in August 2015 but the overall trade data continued to be
muted. Decline in exports at 24.3% (YoY) vs. -20.7% inAugust 2015, increased mainly on account of sharp dip in petroleum products exports. The imports saw
a sharper decline during the month at 25.4% (YoY) vs. -9.9% in August 2015 and this was led by decline in crude oil imports while non-oil imports also
experienced a double digit decline during the month (YoY)
Foreign Institutional Investors (FII) segment net inflows returned to the positive territory after 2 months of net outflows. The FIIs net bought equities worth
~USD 780 million during the month and this took their year-to-date (YTD) net inflow tally to ~USD 4.4 billion. The Domestic Institutional Investors (DII) helped
with net outflows to the tune of USD 219 million due to net selling from the insurers (~USD 669 million), while the MF segment continued to see inflows and
notched up ~USD 450 million of net buying during the month.
Trade number improves on back of slide in Gold imports
Data on Institutional Flows:
Government's fiscal deficit continues on-course
External
Fund Manager Commentary
01
0
1
2
3
4
5
6
7
8
9
10
Jan
-14
Feb
-14
Mar
-14
Ap
r-1
4
May
-14
Jun
-14
Jul-
14
Au
g-1
4
Sep
-14
Oct
-14
No
v-1
4
De
c-1
4
Jan
-15
Feb
-15
Mar
-15
Ap
r-1
5
May
-15
Jun
-15
Jul-
15
Au
g-1
5
Sep
-15
CPI Inflation (%)
Consumer Price Index (CPI)
-4.0%
-2.0%
0.0%
2.0%
4.0%
6.0%
8.0%
Jan
/14
Feb
/14
Ma
r/1
4
Ap
r/1
4
Ma
y/1
4
Jun
/14
Jul/
14
Se
p/1
4
Oct
/14
No
v/1
4
De
c/1
4
Jan
/15
Feb
/15
Ap
r/1
5
Ma
y/1
5
Jun
/15
Jul/
15
Au
g/1
5
Index of Industrial Production (IIP)
IIP YoY Growth (New Series; base 2004- 05)
Global Economic Scenario
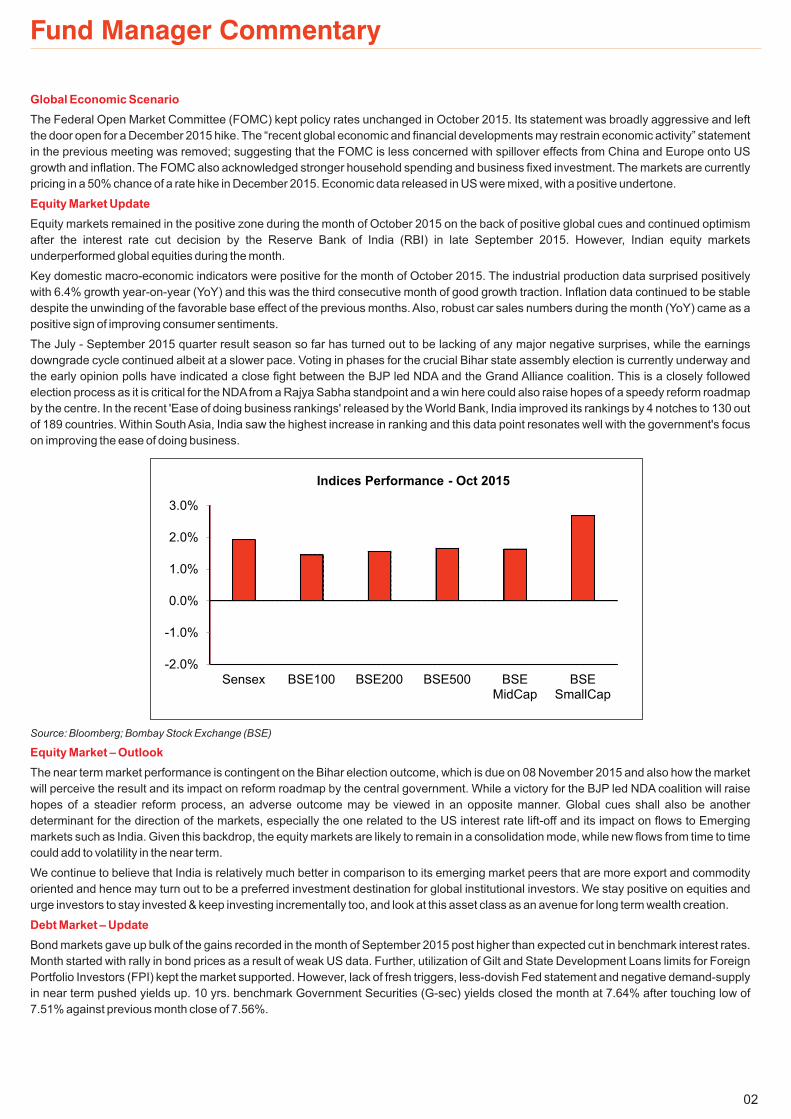
Equity Market Update
Equity Market – Outlook
Debt Market – Update
The Federal Open Market Committee (FOMC) kept policy rates unchanged in October 2015. Its statement was broadly aggressive and left
the door open for a December 2015 hike. The “recent global economic and financial developments may restrain economic activity” statement
in the previous meeting was removed; suggesting that the FOMC is less concerned with spillover effects from China and Europe onto US
growth and inflation. The FOMC also acknowledged stronger household spending and business fixed investment. The markets are currently
pricing in a 50% chance of a rate hike in December 2015. Economic data released in US were mixed, with a positive undertone.
Equity markets remained in the positive zone during the month of October 2015 on the back of positive global cues and continued optimism
after the interest rate cut decision by the Reserve Bank of India (RBI) in late September 2015. However, Indian equity markets
underperformed global equities during the month.
Key domestic macro-economic indicators were positive for the month of October 2015. The industrial production data surprised positively
with 6.4% growth year-on-year (YoY) and this was the third consecutive month of good growth traction. Inflation data continued to be stable
despite the unwinding of the favorable base effect of the previous months. Also, robust car sales numbers during the month (YoY) came as a
positive sign of improving consumer sentiments.
The July - September 2015 quarter result season so far has turned out to be lacking of any major negative surprises, while the earnings
downgrade cycle continued albeit at a slower pace. Voting in phases for the crucial Bihar state assembly election is currently underway and
the early opinion polls have indicated a close fight between the BJP led NDA and the Grand Alliance coalition. This is a closely followed
election process as it is critical for the NDAfrom a Rajya Sabha standpoint and a win here could also raise hopes of a speedy reform roadmap
by the centre. In the recent 'Ease of doing business rankings' released by the World Bank, India improved its rankings by 4 notches to 130 out
of 189 countries. Within South Asia, India saw the highest increase in ranking and this data point resonates well with the government's focus
on improving the ease of doing business.
The near term market performance is contingent on the Bihar election outcome, which is due on 08 November 2015 and also how the market
will perceive the result and its impact on reform roadmap by the central government. While a victory for the BJP led NDA coalition will raise
hopes of a steadier reform process, an adverse outcome may be viewed in an opposite manner. Global cues shall also be another
determinant for the direction of the markets, especially the one related to the US interest rate lift-off and its impact on flows to Emerging
markets such as India. Given this backdrop, the equity markets are likely to remain in a consolidation mode, while new flows from time to time
could add to volatility in the near term.
We continue to believe that India is relatively much better in comparison to its emerging market peers that are more export and commodity
oriented and hence may turn out to be a preferred investment destination for global institutional investors. We stay positive on equities and
urge investors to stay invested & keep investing incrementally too, and look at this asset class as an avenue for long term wealth creation.
Bond markets gave up bulk of the gains recorded in the month of September 2015 post higher than expected cut in benchmark interest rates.
Month started with rally in bond prices as a result of weak US data. Further, utilization of Gilt and State Development Loans limits for Foreign
Portfolio Investors (FPI) kept the market supported. However, lack of fresh triggers, less-dovish Fed statement and negative demand-supply
in near term pushed yields up. 10 yrs. benchmark Government Securities (G-sec) yields closed the month at 7.64% after touching low of
7.51% against previous month close of 7.56%.
Source: Bloomberg; Bombay Stock Exchange (BSE)
Fund Manager Commentary
02
-2.0%
-1.0%
0.0%
1.0%
2.0%
3.0%
Sensex BSE100 BSE200 BSE500 BSEMidCap
BSESmallCap
Indices Performance - Oct 2015

03
Source: Reserve Bank of India (RBI)
Corporate bond curve witnessed compression of spreads due to positive demand-supply equation on back of FPI and end-
investors demand.
Overnight and money market rates remained supportive as the Reserve Bank of India (RBI) continued to pro-actively manage
liquidity. During the month, currency in circulation increased ahead of festive season as per expectation.
Economic growth with eye on the inflation target is the focus of the RBI now. With credit growth still in single digit and with capital
infusion by the government, it is imperative for banks to pass on the rate reduction to borrowers. This may help build some
demand and expand capacities in the long run. This coupled with softer commodity prices may result in further easing in
inflation outlook paving way for future rate cuts.
Policy rates being reduced by 125 basis points (bps) during the current calendar year, emphasis will now shift to reduction in
other rates in the economy viz. small savings rate and bank lending rates that have not reduced commensurately. With lower
inflation, in the immediate term, the RBI can afford to focus on the medium term inflation target. This entails more
accommodative policy and to be data dependent to build up the supply side rather than just curbing demand. Effectively, with
growth pressures being transmitted across boundaries, central banks are being forced to focus on stimulating domestic growth
in the absence of demand support from external markets.
With overnight at 6.75%, current level of gilts still presents good value. Demand supply equation is negative in near term which
presents good opportunity to lock-in higher yields. With ample liquidity and credit offtake at its low, it makes sense for investors
to continue to invest in duration.
Debt Market – Outlook
Source: Bloomberg, for all data except where mentioned otherwise
Fund Manager Commentary
4.00%
5.00%
6.00%
7.00%
8.00%
9.00%
10.00%
Ju
l/0
7
Ja
n/0
8
Au
g/0
8
Fe
b/0
9
Se
p/0
9
Ap
r/1
0
Oct/
10
Ma
y/1
1
No
v/1
1
Ju
n/1
2
De
c/1
2
Ju
l/1
3
Fe
b/1
4
Au
g/1
4
Ma
r/1
5
Oct/
15
Repo Rate Movement
Repo Rate

04
Fund Manager Commentary
Consumer Discretionary
Consumer Staples
Energy
Financials
Healthcare
Industrials
Information Technology
Materials
Telecommunication
Utilities
Sectors HSBCEquityFund
HSBC IndiaOpportunities
Fund
HSBCMidcap
Equity Fund #
Overweight Underweight Neutral
# The S&P BSE Midcap Index was reconstituted in mid of April ’2015 and hence the relative sector positioning of the fund vs. the benchmark has changed.
Review: HSBC Equity FundBeing underweight consumer staples helped performance while being overweight consumer discretionary, information technology and
underweight energy, industrials, utilities hurt performance.
Review: HSBC India Opportunities FundBeing underweight consumer staples helped performance while being overweight consumer discretionary, industrials, information
technology and underweight energy, utilities hurt performance.
Review: HSBC Midcap Equity FundBeing underweight consumer staples, healthcare helped performance while being overweight consumer discretionary, industrials and
underweight financials, telecommunication, utilities hurt performance.
Review: HSBC Infrastructure Equity Fund
Currently focusing on the following themes :
1. Economic Reforms (22.4%) which includes Financial sector reform– 10% and Oil & Gas Sector deregulation sub theme- 12.4% and
2. Infrastructure (60.7%) which includes Power- 12.1%, Construction– 30.9% and Logistics- 17.7%. Well diversified exposure across
sectors encompassing the above themes.
Review: HSBC Dynamic FundThe cash levels and sector allocation in the fund are likely to change depending on the market conditions and technical factors.
Review: HSBC MIP Regular and Savings PlansOur current exposure is 14.00% in HMIP Regular and 22.58% in HMIP Savings plan. Currently it is more biased towards large caps
than mid or small caps.

HSBC Equity Fund (HEF)An Open Ended Diversified Equity Scheme
Investment Objective: Aims to generate long term capital growth from an actively managed portfolio of equity and equityrelated securities.
05
FUND DETAILS
Weighted Average Monthly Total Expenses ratios(Annualized)
Portfolio Turnover
Regular 2.37%
Direct Plan 1.67%
0.84
Excludes service tax on Investment Management fees of 0.20%of Total NetAssets.
Asset Allocation
Auto 6.85%AutoAncillaries 1.41%Banks 26.24%Cement 1.72%Construction 2.16%Construction Project 3.00%Consumer Non Durables 6.17%Finance 5.41%Minerals/Mining 2.50%Pesticides 2.28%Petroleum Products 3.78%Pharmaceuticals 8.26%Services 1.90%Software 16.83%Telecom - Services 2.48%Textile Products 2.55%Other Equity Investments 3.48%Reverse Repos/CBLOs 2.54%Net CurrentAssets 0.44%Total NetAssets 100.00%
Statistical ratios disclosed as per monthly returns of the last 3years.
@ Effective from March 1, 2013 for prospective investments.
**Risk free rate: 6.79% (FIMMDA-NSE Mibor) as on October 30,2015)
Upon payment of dividend, the NAV per unit falls to the extent of payout and statutory levy, if any. Face value: 10 per unit.`
FUND PORTFOLIO
Auto
Auto Ancillaries
Banks
Cement
Construction
Construction Project
Consumer Non Durables
Finance
Minerals/Mining
Pesticides
Petroleum Products
Pharmaceuticals
Services
Software
Telecom - Services
Textile Products
Other Equity Investments 2,452.93 3.48%
Cash Equivalents
Reverse Repos 1,178.68 1.67%
CBLO 611.39 0.87%
Net Current Assets 331.06 0.44%
Total Net Assets as on 31-Oct-2015 70,510.53 100.00%
Tata Motors 3,272.08 4.64%
Maruti Suzuki India 1,557.15 2.21%
MRF 993.79 1.41%
HDFC Bank 6,047.80 8.58%
ICICI Bank 4,432.00 6.29%
Yes Bank 3,338.06 4.73%
Axis Bank 2,852.40 4.05%
Indusind Bank 1,823.80 2.59%
Ultratech Cement 1,212.16 1.72%
J.Kumar Infraprojects 1,522.10 2.16%
Larsen & Toubro 2,116.13 3.00%
I T C 3,346.50 4.75%
Hindustan Unilever 1,000.81 1.42%
HDFC 2,513.70 3.56%
Bajaj Finance 1,305.59 1.85%
Coal India 1,759.45 2.50%
UPL 1,608.95 2.28%
Reliance Industries 1,895.40 2.69%
Hindustan Petroleum Corporation 768.45 1.09%
Sun Pharmaceutical Industries 2,223.88 3.15%
Divi's Laboratories 1,384.62 1.96%
Glenmark Pharmaceuticals 1,189.80 1.69%
Dr. Reddy's Laboratories 1,027.18 1.46%
Aditya Birla Nuvo 1,341.70 1.90%
Infosys 5,109.53 7.25%
Tata Consultancy Services 2,869.48 4.07%
HCL Technologies 2,615.10 3.71%
Tech Mahindra 1,267.00 1.80%
Bharti Airtel 1,745.25 2.48%
Welspun India 1,796.63 2.55%
IssuerMarket Value
( in Lacs)`
% to NetAssets
Dividend DeclarationRecord Date / periodof dividend declared
Dividend ( per unit)Non-Institutional
` Dividend ( per unit)Institutional
` NAV ( ) per unit(cum dividend)
`
HSBC Equity Fund - Dividend
19-Nov-10 2.00000 2.00000 29.3244
22-Feb-13 2.50000 2.50000 26.1962
27-Jun-14 2.50000 2.50000 31.2065
HSBC Equity Fund - Dividend - Direct Plan
22-Feb-13 2.50000 2.50000 26.2505
27-Jun-14 2.50000 2.50000 31.5845
Date of Allotment
Benchmark
NAV (Growth)(as on 30.10.15)
Monthly Average AUM
(In Lakhs)
Fund Manager
SIP
Minimum
Application Amount
Exit Load
Standard Deviation
R-Squared
Beta (Slope)
Sharpe Ratio**
per unit
@
Statistical Ratios
10-Dec-02
S&P BSE 200
144.6260
70,387.02
Neelotpal Sahai
Available
10,000
1,000 p.m.(SIP)
Nil
4.11%
`
`
`
0.9598
0.9960
0.1271
Investors understand that their principalwill be at Moderately High risk
Riskometer
Mod
erately Moderate
Low
Hig
h
Low
High
LOW HIGH
Moderately
This product is suitable forinvestors who are seeking*:
• To create wealth over longterm
• Investment in equity andequity related securities
HSBC Equity Fund (HEF)
* Investors should consult their financial advisers if in doubt aboutwhether the product is suitable for them.

HSBC India Opportunities Fund (HIOF)
This product is suitable for investors who are seeking*:
�
�
�
Overnight liquidity over short term
Investment in Money Market Instruments
Low riskLOW RISK
(BLUE)
Note: Risk is represented as -
*Investors should consult their financial advisers if in doubt whether the product issuitable for them
06
FUND DETAILS
Weighted Average Monthly Total Expenses ratios(Annualized)
Portfolio Turnover
Regular 2.42%
Direct Plan 1.72%
0.51
Excludes service tax on Investment Management fees of 0.20%of Total NetAssets.
Asset Allocation
Auto 7.11%AutoAncillaries 2.55%Banks 25.06%Cement 1.04%Chemicals 1.55%Construction 5.12%Construction Project 4.00%Consumer Non Durables 4.93%Ferrous Metals 1.16%Finance 2.56%Industrial Products 1.71%Minerals/Mining 1.74%Pesticides 1.87%Petroleum Products 2.57%Pharmaceuticals 8.78%Software 15.55%Telecom - Services 2.52%Textile Products 5.68%Other Equity Investments 3.51%Reverse Repos/CBLOs 1.08%Net CurrentAssets -0.09%Total NetAssets 100.00%
Statistical ratios disclosed as per monthly returns of the last 3years.
@ Effective from March 1, 2013 for prospective investments.
**Risk free rate: 6.79% (FIMMDA-NSE Mibor) as on October 30,2015)
Upon payment of dividend, the NAV per unit falls to the extent of payout and statutory levy, if any. Face value: 10 per unit.`
FUND PORTFOLIO
Auto
Auto Ancillaries
Banks
Cement
Chemicals
Construction
Construction Project
Consumer Non Durables
Ferrous Metals
Finance
Industrial Products
Minerals/Mining
Pesticides
Petroleum Products
Pharmaceuticals
Software
Telecom - Services
Textile Products
Other Equity Investments 1,936.73 3.51%
Cash Equivalents
Reverse Repos 391.75 0.71%
CBLO 203.21 0.37%
Net Current Assets -52.90 -0.09%
Total Net Assets as on 31-Oct-2015 55,297.93 100.00%
Tata Motors 1,751.52 3.17%
Eicher Motors 1,419.40 2.57%
Maruti Suzuki India 756.33 1.37%
Apollo Tyres 855.25 1.55%
Motherson Sumi Systems 553.39 1.00%
HDFC Bank 4,123.50 7.46%
ICICI Bank 3,324.00 6.01%
Yes Bank 2,579.41 4.66%
Axis Bank 2,234.38 4.04%
Indusind Bank 1,595.83 2.89%
Ultratech Cement 577.22 1.04%
Vinati Organics 859.00 1.55%
IRB Infrastructure Developers 738.15 1.33%
Ahluwalia Contracts (India) 738.15 1.33%
KNR Constructions 730.44 1.32%
MBL Infrastructures 629.55 1.14%
Larsen & Toubro 1,622.36 2.93%
Power Mech Projects 591.35 1.07%
I T C 2,007.90 3.63%
Hindustan Unilever 720.59 1.30%
Jindal Steel & Power 641.20 1.16%
Bajaj Finance 783.35 1.42%
HDFC 628.43 1.14%
Supreme Industries 945.08 1.71%
Coal India 959.70 1.74%
UPL 1,034.33 1.87%
Reliance Industries 1,421.55 2.57%
Glenmark Pharmaceuticals 1,239.38 2.24%
Torrent Pharmaceuticals 1,155.86 2.09%
IPCA Laboratories 973.94 1.76%
Divi's Laboratories 865.39 1.56%
Aurobindo Pharma 626.96 1.13%
Infosys 3,576.67 6.47%
Tata Consultancy Services 2,120.92 3.84%
HCL Technologies 2,092.08 3.78%
Tech Mahindra 808.73 1.46%
Bharti Airtel 1,396.20 2.52%
Welspun India 1,616.96 2.92%
Arvind 832.50 1.51%
Indian Terrain Fashions 692.23 1.25%
IssuerMarket Value
( in Lacs)`
% to NetAssets
Dividend DeclarationRecord Date / periodof dividend declared
Dividend ( per unit)Non-Institutional
` Dividend ( per unit)Institutional
` NAV ( ) per unit(cum dividend)
`
HSBC India Opportunities Fund - Dividend
HSBC India Opportunities Fund - Dividend Direct Plan
04-Feb-13 1.50000 1.50000 17.7319
27-Jun-14 1.50000 1.50000 23.2323
17-Mar-15 2.70000 2.70000 27.0820
04-Feb-13 1.50000 1.50000 17.7519
27-Jun-14 1.50000 1.50000 23.5020
17-Mar-15 1.50000 1.50000 27.5575
An Open Ended Flexi-Cap Equity Scheme
Investment Objective: Seeks long term capital growth through investments across all market capitalisations, including small,mid and large cap stocks. It aims to be predominantly invested in equity & equity related securities. However it could move asignificant portion of its assets towards fixed income securities if the fund manager becomes negative on equity markets.
Date of Allotment
Benchmark
NAV (Growth)(as on 30.10.15)
Fund Manager
SIP
Minimum
Application Amount
Exit Load
Standard Deviation
R-Squared
Beta (Slope)
Sharpe Ratio**
per unit
Monthly Average AUM
(In Lakhs)
@
Statistical Ratios
24-Feb-04
S&P BSE 500
61.6431
56,002.42
Neelotpal Sahai
Available
10,000
1,000 p.m.(SIP)
Nil
4.41%
0.9312
1.0358
0.2380
`
`
`
Investors understand that their principalwill be at Moderately High risk
Riskometer
Mod
erately Moderate
Low
Hig
h
Low
High
LOW HIGH
Moderately
This product is suitable forinvestors who are seeking*:
• To create wealth over longterm
• Invests in equity and equityrelated securities acrossmarket capitalisations
HSBC India Opportunities Fund (HIOF)
* Investors should consult their financial advisers if in doubt aboutwhether the product is suitable for them.

HSBC Midcap Equity Fund (HMEF)
This product is suitable for investors who are seeking*:
�
�
�
Overnight liquidity over short term
Investment in Money Market Instruments
Low riskLOW RISK
(BLUE)
Note: Risk is represented as -
*Investors should consult their financial advisers if in doubt whether the product issuitable for them
07
FUND DETAILS
Weighted Average Monthly Total Expenses ratios(Annualized)
Portfolio Turnover
Regular 2.49%
Direct Plan 1.79%
0.50
Excludes service tax on Investment Management fees of 0.21%of Total NetAssets.
Asset Allocation
Statistical ratios disclosed as per monthly returns of the last 3years.
@ Effective from March 1, 2013 for prospective investments.
**Risk free rate: 6.79% (FIMMDA-NSE Mibor) as on October 30,2015)
Upon payment of dividend, the NAV per unit falls to the extent of payout and statutory levy, if any. Face value: 10 per unit.`
FUND PORTFOLIO
Auto
Auto Ancillaries
Banks
Chemicals
Construction
Construction Project
Consumer Durables
Consumer Non Durables
Finance
Industrial Capital Goods
Industrial Products
Media & Entertainment
Pesticides
Petroleum Products
Pharmaceuticals
Power
Software
Textile Products
Textiles - Synthetic
Transportation
Other Equity Investments 2,934.00 7.09%
Cash Equivalents
Reverse Repos 491.39 1.19%
CBLO 254.89 0.61%
Net Current Assets -4.70 -0.04%
Total Net Assets as on 31-Oct-2015 41,456.62 100.00%
VST Tillers Tractors 709.32 1.71%
Apollo Tyres 1,060.51 2.56%
Ceat 951.76 2.30%
Sundram Fasteners 488.68 1.18%
Suprajit Engineering 463.69 1.12%
Yes Bank 591.75 1.43%
Vinati Organics 1,349.37 3.25%
Navin Fluorine International 426.04 1.03%
IRB Infrastructure Developers 760.29 1.83%
National Buildings Construction Corp 645.91 1.56%
Ahluwalia Contracts (India) 501.31 1.21%
Power Mech Projects 1,123.57 2.71%
Mirza International 1,577.13 3.80%
CCL Products (India) 1,445.26 3.49%
Kaveri Seed Company 424.49 1.02%
Motilal Oswal Financial Services 1,448.41 3.49%
Cholamandalam Investment & Fin Co. 1,405.82 3.39%
Dewan Housing Finance Corporation 1,173.46 2.83%
Indiabulls Housing Finance 976.35 2.36%
Sanghvi Movers 1,365.99 3.29%
Inox Wind 1,048.08 2.53%
BEML 668.73 1.61%
Ramkrishna Forgings 1,059.63 2.56%
Finolex Industries 701.80 1.69%
Jagran Prakashan 784.13 1.89%
Hindustan Media Ventures 719.65 1.74%
UPL 1,498.62 3.61%
PI Industries 954.31 2.30%
Hindustan Petroleum Corporation 1,083.51 2.61%
Gulf Oil Lubricants India 931.57 2.25%
Aurobindo Pharma 1,342.65 3.24%
Wockhardt 958.02 2.31%
Torrent Pharmaceuticals 755.16 1.82%
Kalpataru Power Transmission 620.13 1.50%
Sonata Software 943.45 2.28%
Welspun India 1,586.09 3.83%
Arvind 666.00 1.61%
Indian Terrain Fashions 510.66 1.23%
Sarla Performance Fibers 724.19 1.75%
Adani Ports & Special Economic Zone 711.00 1.72%
Gateway Distriparks 624.55 1.51%
IssuerMarket Value
( in Lacs)`
% to NetAssets
Dividend DeclarationRecord Date / periodof dividend declared
Dividend ( per unit)Non-Institutional
` Dividend ( per unit)Institutional
` NAV ( ) per unit(cum dividend)
`
HSBC Midcap Equity Fund - Dividend
24-Mar-08 0.75 0.75 13.3797
11-Dec-09 1.00 1.00 13.8927
19-Nov-10 2.00 2.00 15.4864
An Open Ended Diversified Equity Scheme
Investment Objective: Seeks to generate long term capital growth from an actively managed portfolio of equity and equityrelated securities primarily being midcap stocks. However, it could move a portion of its assets towards fixed income securitiesif the fund manager becomes negative on the Indian equity markets.
Date of Allotment
Benchmark
NAV (Growth)(as on 30.10.15)
Fund Manager
SIP
Minimum
Application Amount
Exit Load
Standard Deviation
R-Squared
Beta (Slope)
Sharpe Ratio**
per unit
Monthly Average AUM
(In Lakhs)
@
Statistical Ratios
19-May-05
S&P BSE Midcap
38.5186
42,210.28
Dhiraj Sachdev
Available
10,000
1,000 p.m.(SIP)
Nil
6.33%
0.8404
1.0996
0.2451
`
`
`
Investors understand that their principalwill be at Moderately High risk
Riskometer
Mod
erately Moderate
Low
Hig
h
Low
High
LOW HIGH
Moderately
This product is suitable forinvestors who are seeking*:• To create wealth over long
term• Invests in predominantly mid
cap equity and equity relatedsecurities
HSBC Midcap Equity Fund (HMEF)
* Investors should consult their financial advisers if in doubt aboutwhether the product is suitable for them.
Auto 1.71%AutoAncillaries 7.16%Banks 1.43%Chemicals 4.28%Construction 4.60%Construction Project 2.71%Consumer Durables 3.80%Consumer Non Durables 4.51%Finance 12.07%Industrial Capital Goods 7.43%Industrial Products 4.25%Media & Entertainment 3.63%Pesticides 5.91%Petroleum Products 4.86%Pharmaceuticals 7.37%Power 1.50%Software 2.28%Textile Products 6.67%Textiles - Synthetic 1.75%Transportation 3.23%Other Equity Investments 7.09%Reverse Repos/CBLOs 1.80%Net CurrentAssets -0.04%Total NetAssets 100.00%
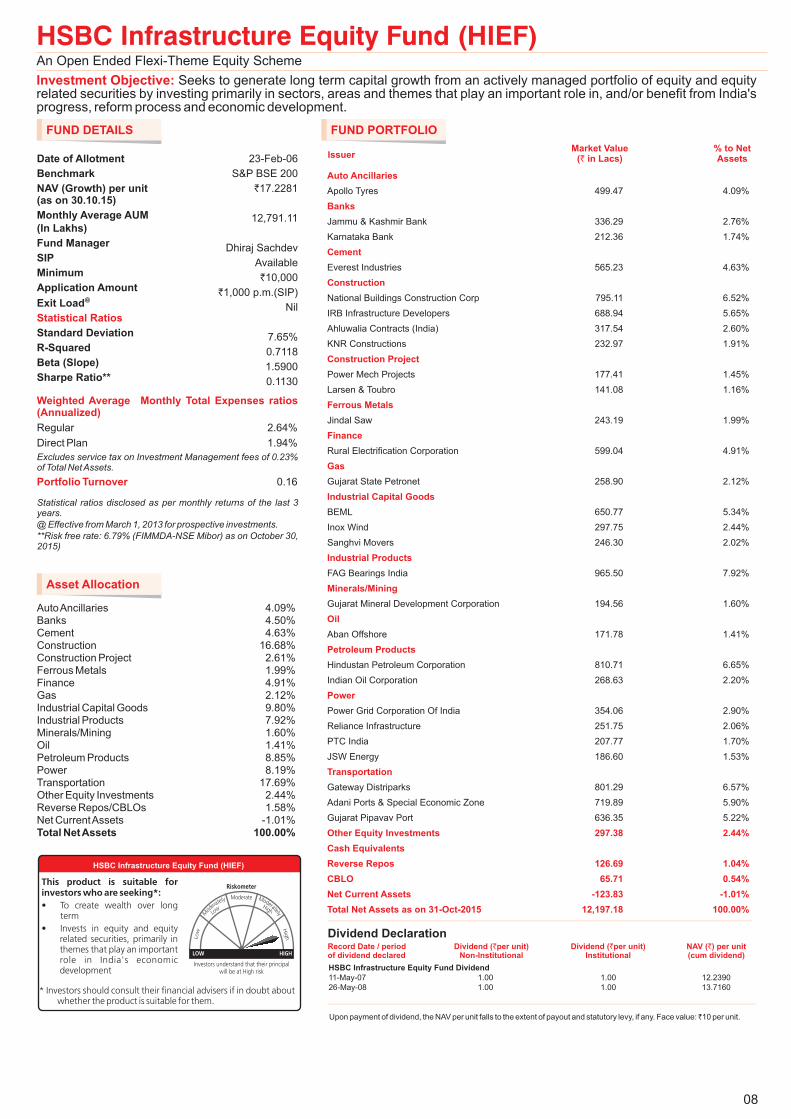
HSBC Infrastructure Equity Fund (HIEF)
This product is suitable for investors who are seeking*:
�
�
�
Overnight liquidity over short term
Investment in Money Market Instruments
Low riskLOW RISK
(BLUE)
Note: Risk is represented as -
*Investors should consult their financial advisers if in doubt whether the product issuitable for them
08
FUND DETAILS
Date of Allotment
Benchmark
NAV (Growth)(as on 30.10.15)
Fund Manager
SIP
Minimum
Application Amount
Exit Load
Standard Deviation
R-Squared
Beta (Slope)
Sharpe Ratio**
per unit
Monthly Average AUM
(In Lakhs)
@
Statistical Ratios
23-Feb-06
S&P BSE 200
17.2281
12,791.11
Dhiraj Sachdev
Available
10,000
1,000 p.m.(SIP)
Nil
7.65%
0.7118
1.5900
0.1130
`
`
`
Weighted Average Monthly Total Expenses ratios(Annualized)
Portfolio Turnover
Regular 2.64%
Direct Plan 1.94%
0.16
Excludes service tax on Investment Management fees of 0.23%of Total NetAssets.
Asset Allocation
AutoAncillaries 4.09%Banks 4.50%Cement 4.63%Construction 16.68%Construction Project 2.61%Ferrous Metals 1.99%Finance 4.91%Gas 2.12%Industrial Capital Goods 9.80%Industrial Products 7.92%Minerals/Mining 1.60%Oil 1.41%Petroleum Products 8.85%Power 8.19%Transportation 17.69%Other Equity Investments 2.44%Reverse Repos/CBLOs 1.58%Net CurrentAssets -1.01%Total NetAssets 100.00%
Statistical ratios disclosed as per monthly returns of the last 3years.
@ Effective from March 1, 2013 for prospective investments.
**Risk free rate: 6.79% (FIMMDA-NSE Mibor) as on October 30,2015)
Upon payment of dividend, the NAV per unit falls to the extent of payout and statutory levy, if any. Face value: 10 per unit.`
FUND PORTFOLIO
Auto Ancillaries
Banks
Cement
Construction
Construction Project
Ferrous Metals
Finance
Gas
Industrial Capital Goods
Industrial Products
Minerals/Mining
Oil
Petroleum Products
Power
Transportation
Other Equity Investments 297.38 2.44%
Cash Equivalents
Reverse Repos 126.69 1.04%
CBLO 65.71 0.54%
Net Current Assets -123.83 -1.01%
Total Net Assets as on 31-Oct-2015 12,197.18 100.00%
Apollo Tyres 499.47 4.09%
Jammu & Kashmir Bank 336.29 2.76%
Karnataka Bank 212.36 1.74%
Everest Industries 565.23 4.63%
National Buildings Construction Corp 795.11 6.52%
IRB Infrastructure Developers 688.94 5.65%
Ahluwalia Contracts (India) 317.54 2.60%
KNR Constructions 232.97 1.91%
Power Mech Projects 177.41 1.45%
Larsen & Toubro 141.08 1.16%
Jindal Saw 243.19 1.99%
Rural Electrification Corporation 599.04 4.91%
Gujarat State Petronet 258.90 2.12%
BEML 650.77 5.34%
Inox Wind 297.75 2.44%
Sanghvi Movers 246.30 2.02%
FAG Bearings India 965.50 7.92%
Gujarat Mineral Development Corporation 194.56 1.60%
Aban Offshore 171.78 1.41%
Hindustan Petroleum Corporation 810.71 6.65%
Indian Oil Corporation 268.63 2.20%
Power Grid Corporation Of India 354.06 2.90%
Reliance Infrastructure 251.75 2.06%
PTC India 207.77 1.70%
JSW Energy 186.60 1.53%
Gateway Distriparks 801.29 6.57%
Adani Ports & Special Economic Zone 719.89 5.90%
Gujarat Pipavav Port 636.35 5.22%
IssuerMarket Value
( in Lacs)`
% to NetAssets
Dividend DeclarationRecord Date / periodof dividend declared
Dividend ( per unit)Non-Institutional
` Dividend ( per unit)Institutional
` NAV ( ) per unit(cum dividend)
`
HSBC Infrastructure Equity Fund Dividend
11-May-07 1.00 1.00 12.2390
26-May-08 1.00 1.00 13.7160
An Open Ended Flexi-Theme Equity Scheme
Investment Objective: Seeks to generate long term capital growth from an actively managed portfolio of equity and equityrelated securities by investing primarily in sectors, areas and themes that play an important role in, and/or benefit from India'sprogress, reform process and economic development.
Investors understand that their principalwill be at High risk
Riskometer
Mod
erately Moderate
Low
Hig
h
Low
High
LOW HIGH
Moderately
This product is suitable forinvestors who are seeking*:
• To create wealth over longterm
• Invests in equity and equityrelated securities, primarily inthemes that play an importantrole in India's economicdevelopment
HSBC Infrastructure Equity Fund (HIEF)
* Investors should consult their financial advisers if in doubt aboutwhether the product is suitable for them.

HSBC Tax Saver Equity Fund (HTSF)
09
FUND DETAILS
Date of Allotment
Benchmark
NAV (Growth)(as on 30.10.15)
Fund Manager
SIP
Minimum
Application Amount
Exit Load
Standard Deviation
R-Squared
Beta (Slope)
Sharpe Ratio**
per unit
Monthly Average AUM
(In Lakhs)
@
Statistical Ratios
05-Jan-07
S&P BSE 200
26.6802
18,213.92
Aditya Khemani
Available
500
(Lumpsum & SIP)
Nil
4.61%
0.9044
1.0815
0.2252
`
`
Weighted Average Monthly Total Expenses ratios(Annualized)
Portfolio Turnover
Regular 2.58%
Direct Plan 1.88%
0.53
Excludes service tax on Investment Management fees of 0.23%of Total NetAssets.
Asset Allocation
Auto 5.92%AutoAncillaries 3.96%Banks 25.17%Cement 4.13%Construction Project 2.88%Consumer Non Durables 5.40%Finance 4.54%Industrial Capital Goods 2.26%Industrial Products 1.93%Minerals/Mining 1.34%Non - Ferrous Metals 2.07%Oil 1.63%Pesticides 1.16%Petroleum Products 1.41%Pharmaceuticals 6.41%Services 2.25%Software 11.68%Textile Products 9.14%Transportation 4.05%Other Equity Investments 0.94%Reverse Repos/CBLOs 2.13%Net CurrentAssets -0.40%
Total NetAssets 100.00%
Statistical ratios disclosed as per monthly returns of the last 3years.
@ Effective from March 1, 2013 for prospective investments.
**Risk free rate: 6.79% (FIMMDA-NSE Mibor) as on October 30,2015)
Upon payment of dividend, the NAV per unit falls to the extent of payout and statutory levy, if any. Face value: 10 per unit.`
FUND PORTFOLIO
Auto
Auto Ancillaries
Banks
Cement
Construction Project
Consumer Non Durables
Finance
Industrial Capital Goods
Industrial Products
Minerals/Mining
Non - Ferrous Metals
Oil
Pesticides
Petroleum Products
Pharmaceuticals
Services
Software
Textile Products
Transportation
Other Equity Investments 167.83 0.94%
Cash Equivalents
Reverse Repos 249.94 1.40%
CBLO 129.65 0.73%
Net Current Assets -73.98 -0.40%
Total Net Assets as on 31-Oct-2015 17,858.57 100.00%
Tata Motors 539.92 3.02%
Maruti Suzuki India 517.55 2.90%
MRF 416.59 2.33%
Apollo Tyres 290.79 1.63%
HDFC Bank 1,275.54 7.14%
ICICI Bank 826.85 4.63%
Axis Bank 777.28 4.35%
Indusind Bank 638.33 3.57%
Federal Bank 353.78 1.98%
Jammu & Kashmir Bank 328.64 1.84%
State Bank of India 296.31 1.66%
The Ramco Cements 395.88 2.22%
Ultratech Cement 340.56 1.91%
Larsen & Toubro 513.51 2.88%
I T C 555.85 3.11%
Kaveri Seed Company 409.33 2.29%
LIC Housing Finance 433.87 2.43%
HDFC 377.06 2.11%
Crompton Greaves 403.68 2.26%
Finolex Industries 344.64 1.93%
Coal India 239.93 1.34%
Hindustan Zinc 369.78 2.07%
Oil & Natural Gas Corporation 291.40 1.63%
UPL 206.87 1.16%
Reliance Industries 251.14 1.41%
IPCA Laboratories 497.67 2.79%
Sun Pharmaceutical Industries 364.72 2.04%
Dr. Reddy's Laboratories 282.47 1.58%
Aditya Birla Nuvo 402.51 2.25%
Infosys 996.93 5.58%
Tata Consultancy Services 741.07 4.15%
HCL Technologies 348.68 1.95%
Welspun India 545.71 3.06%
SRF 407.27 2.28%
Arvind 380.18 2.13%
Indian Terrain Fashions 298.62 1.67%
Gateway Distriparks 380.59 2.13%
Adani Ports & Special Economic Zone 343.65 1.92%
IssuerMarket Value
( in Lacs)`
% to NetAssets
Dividend DeclarationRecord Date / periodof dividend declared
Dividend ( per unit)Non-Institutional
` Dividend ( per unit)Institutional
` NAV ( ) per unit(cum dividend)
`
HSBC Tax Saver Equity Fund Dividend
HSBC Tax Saver Equity Fund Dividend Direct
19-Feb-10 1.00000 1.00000 12.8713
17-Oct-14 1.50000 1.50000 22.1053
17-Mar-15 2.50000 2.50000 23.9029
17-Oct-14 1.50000 1.50000 22.4083
17-Mar-15 2.50000 2.50000 24.3256
An Open Ended Equity Linked Savings Scheme (ELSS)
Investment Objective: Aims to provide long term capital appreciation by investing in a diversified portfolio of equity & equityrelated instruments of companies across various sectors and industries, with no capitalisation bias. The Fund may also investin fixed income securities.
Investors understand that their principalwill be at Moderately High risk
Riskometer
Mod
erately Moderate
Low
Hig
h
Low
High
LOW HIGH
Moderately
This product is suitable forinvestors who are seeking*:• To create wealth over long
term• Invests in equity and equity
related securities with nomarket capitilastion bias
HSBC Tax Saver Equity Fund (HTSF)
* Investors should consult their financial advisers if in doubt aboutwhether the product is suitable for them.

HSBC Dynamic Fund (HDF)
10
FUND DETAILS
Date of Allotment
Benchmark
NAV (Growth)(as on 30.10.15)
Fund Managers
SIP
Minimum
Application Amount
Exit Load
Standard Deviation
R-Squared
Beta (Slope)
Sharpe Ratio**
per unit
Monthly Average AUM
(In Lakhs)
@
Statistical Ratios
24-Sep-07
S&P BSE 200
13.5044
5,845.89
Neelotpal Sahai
(for Equity portion)
Sanjay Shah
(for Fixed Income portion)
Available
10,000
1,000 p.m.(SIP)
Nil
`
`
`
3.13%
0.9357
0.7474
0.0878
Weighted Average Monthly Total Expenses ratios(Annualized)
Portfolio Turnover
Regular 2.69%
Direct Plan 1.99%
Excludes service tax on Investment Management fees of 0.24%of Total NetAssets.
0.80
Asset Allocation
Auto 8.22%Banks 17.11%Cement 1.50%Construction Project 4.77%Consumer Non Durables 8.68%Finance 5.23%Minerals/Mining 1.77%Pesticides 2.07%Petroleum Products 4.60%Pharmaceuticals 7.07%Power 2.23%Software 10.37%Telecom - Services 1.94%Transportation 1.62%Other Equity Investments 0.99%Reverse Repos/CBLOs 22.62%Net CurrentAssets -0.79%Total NetAssets 100.00%
Statistical ratios disclosed as per monthly returns of the last 3years.
@ Effective from March 1, 2013 for prospective investments.
**Risk free rate: 6.79% (FIMMDA-NSE Mibor) as on October 30,2015)
FUND PORTFOLIO
IssuerMarket Value
( in Lacs)`
% to NetAssets
An Open Ended Scheme
Investment Objective: To provide long term capital appreciation by allocating funds in equity and equity related instruments. It
also has the flexibility to move, entirely if required, into debt instruments in times that the view on equity markets seems negative.
Auto
Banks
Cement
Construction Project
Consumer Non Durables
Finance
Minerals/Mining
Pesticides
Petroleum Products
Pharmaceuticals
Power
Software
Telecom - Services
Transportation
Other Equity Investments 57.32 0.99%
Cash Equivalents
Reverse Repos 859.35 14.90%
CBLO 445.75 7.73%
Net Current Assets -45.36 -0.79%
Total Net Assets as on 31-Oct-2015 5,769.36 100.00%
Tata Motors 300.26 5.20%
Maruti Suzuki India 88.98 1.54%
Hero Motocorp 85.19 1.48%
HDFC Bank 395.86 6.86%
ICICI Bank 249.30 4.32%
Axis Bank 190.16 3.30%
Yes Bank 151.73 2.63%
Ultratech Cement 86.58 1.50%
Larsen & Toubro 275.10 4.77%
I T C 281.11 4.87%
Hindustan Unilever 120.10 2.08%
Asian Paints 99.68 1.73%
HDFC 301.64 5.23%
Coal India 102.37 1.77%
UPL 119.52 2.07%
Reliance Industries 265.36 4.60%
Glenmark Pharmaceuticals 158.64 2.75%
Sun Pharmaceutical Industries 155.67 2.70%
Cipla 93.21 1.62%
Power Grid Corporation Of India 128.75 2.23%
Infosys 336.09 5.83%
Tata Consultancy Services 189.64 3.29%
HCL Technologies 72.35 1.25%
Bharti Airtel 111.70 1.94%
Adani Ports & Special Economic Zone 93.32 1.62%
Investors understand that their principalwill be at Moderately High risk
Riskometer
Mod
erately Moderate
Low
Hig
h
Low
High
LOW HIGH
Moderately
This product is suitable forinvestors who are seeking*:
• To create wealth over longterm
• Invests in equity and equityrelated securities and in debtinstruments when view onequity markets is negative
HSBC Dynamic Fund (HDF)
* Investors should consult their financial advisers if in doubt aboutwhether the product is suitable for them.

HSBC Dividend Yield Equity Fund (HDYEF)
This product is suitable for investors who are seeking*:
�
�
�
Overnight liquidity over short term
Investment in Money Market Instruments
Low riskLOW RISK
(BLUE)
Note: Risk is represented as -
*Investors should consult their financial advisers if in doubt whether the product issuitable for them
11
FUND DETAILS
Date of Allotment
Benchmark
NAV (Growth)(as on 30.10.15)
Fund Managers
SIP
Minimum
Application Amount
Exit Load
Standard Deviation
R-Squared
Beta (Slope)
Sharpe Ratio**
per unit
Monthly Average AUM
(In Lakhs)
@
Statistical Ratios
21-Mar-07
S&P BSE 200
15.7917
4,320.37
Gautam Bhupal &
Amaresh Mishra
Available
10,000
1,000 p.m.(SIP)
Nil
4.20%
0.9548
1.0151
0.1221
`
`
`
Weighted Average Monthly Total Expenses ratios(Annualized)
Portfolio Turnover
Regular 2.34%
Direct Plan 1.64%
0.29
Excludes service tax on Investment Management fees of 0.19%of Total NetAssets.
Asset Allocation
Auto 6.88%
AutoAncillaries 2.89%
Banks 21.19%
Cement 1.65%
Chemicals 1.45%
Construction 2.31%
Construction Project 3.44%
Consumer Non Durables 8.03%
Finance 2.72%
Minerals/Mining 4.99%
Non - Ferrous Metals 2.60%
Oil 2.71%
Petroleum Products 4.00%
Pharmaceuticals 4.36%
Power 2.98%
Software 19.87%
Textile Products 2.95%
Other Equity Investments 1.78%
Reverse Repos/CBLOs 3.53%
Net CurrentAssets -0.33%
Total NetAssets 100.00%
Statistical ratios disclosed as per monthly returns of the last 3years.
@ Effective from March 1, 2013 for prospective investments.
**Risk free rate: 6.79% (FIMMDA-NSE Mibor) as on October 30,2015)
FUND PORTFOLIO
IssuerMarket Value
( in Lacs)`
% to NetAssets
An Open Ended Equity Scheme
Investment Objective: To provide long-term capital growth from a diversified portfolio of equity and equity related
instruments. The focus would be to invest in stocks of companies facing "out-of-ordinary" conditions.
Auto
Auto Ancillaries
Banks
Cement
Chemicals
Construction
Construction Project
Consumer Non Durables
Finance
Minerals/Mining
Non - Ferrous Metals
Oil
Petroleum Products
Pharmaceuticals
Power
Software
Textile Products
Other Equity Investments 75.08 1.78%
Cash Equivalents
Reverse Repos 98.30 2.32%
CBLO 50.99 1.20%
Net Current Assets -13.78 -0.33%
Total Net Assets as on 31-Oct-2015 4,232.55 100.00%
Hero Motocorp 130.36 3.08%
Maruti Suzuki India 97.21 2.30%
Tata Motors 63.33 1.50%
MRF 122.43 2.89%
ICICI Bank 327.14 7.73%
Axis Bank 166.39 3.93%
HDFC Bank 153.94 3.64%
Karur Vysya Bank 139.56 3.30%
Jammu & Kashmir Bank 60.03 1.42%
IDFC Bank 49.39 1.17%
ACC 69.67 1.65%
Tata Chemicals 61.27 1.45%
IRB Infrastructure Developers 97.93 2.31%
Larsen & Toubro 145.66 3.44%
I T C 258.06 6.10%
Hindustan Unilever 81.69 1.93%
Indiabulls Housing Finance 115.29 2.72%
Coal India 211.13 4.99%
Hindustan Zinc 110.16 2.60%
Oil & Natural Gas Corporation 114.83 2.71%
Bharat Petroleum Corporation 121.95 2.88%
Reliance Industries 47.39 1.12%
Lupin 104.66 2.47%
Sun Pharmaceutical Industries 80.06 1.89%
NTPC 126.16 2.98%
Infosys 311.23 7.35%
Tata Consultancy Services 212.09 5.01%
Wipro 125.45 2.96%
Eclerx Services 109.65 2.59%
HCL Technologies 82.81 1.96%
Welspun India 125.05 2.95%
Investors understand that their principalwill be at Moderately High risk
Riskometer
Mod
erately Moderate
Low
Hig
h
Low
High
LOW HIGH
Moderately
This product is suitable forinvestors who are seeking*:• To create wealth over long
term• Invests in equity and equity
r e l a t e d s e c u r i t i e s o fcompanies facing "out-of-ordinary" conditions
HSBC Dividend Yield Equity Fund (HDYEF)
* Investors should consult their financial advisers if in doubt aboutwhether the product is suitable for them.

HSBC Emerging Markets Fund (HEMF)
This product is suitable for investors who are seeking*:
�
�
�
Overnight liquidity over short term
Investment in Money Market Instruments
Low riskLOW RISK
(BLUE)
Note: Risk is represented as -
*Investors should consult their financial advisers if in doubt whether the product issuitable for them
12
FUND DETAILS
Weighted Average Monthly Total Expenses ratios(Annualized)
Regular 2.69%
Direct Plan 1.99%
(inclusive of underlying scheme's expenses)
Excludes service tax on Investment Management fees of 0.12%of Total NetAssets.
Asset Allocation
Overseas Mutual Fund 98.43%
Reverse Repos/CBLOs 1.96%
Net CurrentAssets -0.39%
Total NetAssets 100.00%
Statistical ratios disclosed as per monthly returns of the last 3years.
@ Effective from March 1, 2013 for prospective investments.
**Risk free rate: 6.79% (FIMMDA-NSE Mibor) as on October 30,2015)
Upon payment of dividend, the NAV per unit falls to the extent of payout and statutory levy, if any. Face value: 10 per unit.`
FUND PORTFOLIO
Overseas Mutual Fund
HSBC GIF Glob Emerg Mkts Eq S1 Dis 893.17 98.43%
Cash Equivalents
Reverse Repos 11.70 1.29%
CBLO 6.07 0.67%
Net Current Assets -3.56 -0.39%
Total Net Assets as on 31-Oct-2015 907.38 100.00%
IssuerMarket Value
( in Lacs)`
% to NetAssets
An Open Ended Scheme
Investment Objective: To provide long term capital appreciation by investing in India and in the emerging markets, in equityand equity related instruments, share classes and units/securities issued by overseas mutual funds or unit trusts. The fund mayalso invest a limited proportion in domestic debt and money market instruments.
Date of Allotment
Benchmark
NAV (Growth)(as on 30.10.15)
Fund Manager
SIP
Minimum
Application Amount
Exit Load
Standard Deviation
R-Squared
Beta (Slope)
Sharpe Ratio**
per unit
Monthly Average AUM
(In Lakhs)
@
Statistical Ratios
17-Mar-08
MSCI EmergingMarkets Index
10.2846
904.34
Anitha Rangan(Dedicated fund
manager foroverseas
investments)
Available
10,000
1,000 p.m.(SIP)
Nil
0.14%
0.6350
1.1220
-0.0930
`
`
` Dividend DeclarationRecord Date / periodof dividend declared
Dividend ( per unit)Non-Institutional
` Dividend ( per unit)Institutional
` NAV ( ) per unit(cum dividend)
`
HSBC - Emerging Market Fund - Dividend
HSBC - Emerging Market Fund - Dividend - Direct Plan
27-Jun-14 0.50000 0.50000 11.5335
27-Jun-14 0.50000 0.50000 11.6656
Investors understand that their principalwill be at High risk
Riskometer
Mod
erately Moderate
Low
Hig
h
Low
High
LOW HIGH
Moderately
This product is suitable forinvestors who are seeking*:
• To create wealth over longterm
• Investment in equity andequity related securities ofEmerging economies
HSBC Emerging Markets Fund (HEMF)
* Investors should consult their financial advisers if in doubt aboutwhether the product is suitable for them.

HSBC Asia Pacific (Ex Japan)Dividend Yield Fund (HAPDF)
This product is suitable for investors who are seeking*:
�
�
�
Overnight liquidity over short term
Investment in Money Market Instruments
Low riskLOW RISK
(BLUE)
Note: Risk is represented as -
*Investors should consult their financial advisers if in doubt whether the product issuitable for them
13
FUND DETAILS
Weighted Average Monthly Total Expenses ratios(Annualized)
Regular 2.29%
Direct Plan 1.59%
(inclusive of underlying scheme's expenses)
Excludes service tax on Investment Management fees of 0.09%of Total NetAssets.
Asset Allocation
Overseas Mutual Fund 97.98%
Reverse Repos/CBLOs 2.59%
Net CurrentAssets -0.57%
Total NetAssets 100.00%
@ Effective from March 1, 2013 for prospective investments.
FUND PORTFOLIO
Overseas Mutual Fund
HSBC GIF ASIA PACIFIC EX JAPAN EQ HD-S9D 2,003.41 97.98%
Cash Equivalents
Reverse Repos 34.83 1.70%
CBLO 18.06 0.88%
Net Current Assets -11.55 -0.57%
Total Net Assets as on 31-Oct-2015 2,044.76 100.00%
IssuerMarket Value
( in Lacs)`
% to NetAssets
An Open Ended Fund of Funds Scheme
Investment Objective: The primary investment objective of the Scheme is to provide long term capital appreciation byinvesting predominantly in units of HSBC Global Investment Funds (HGIF) Asia Pacific Ex Japan Equity High Dividend Fund(HEHDF). The Scheme may also invest a certain proportion of its corpus in money market instruments and / or units of liquidmutual fund schemes, in order to meet liquidity requirements from time to time. However, there is no assurance that theinvestment objective of the Scheme will be achieved.
Date of Allotment
Benchmark
NAV (Growth)(as on 30.10.15)
Fund Manager
SIP
Minimum
Application Amount
Exit Load
per unit
Monthly Average AUM
(In Lakhs)
@
24-Feb-14
MSCI AC Asia Pacific
ex Japan
9.8621
2,099.05
Anitha Rangan (foroverseas investments),
Sanjay Shah (forinvestments in Indian
Market)
Available
10,000
1,000 p.m.(SIP)
Nil
`
`
`
Investors understand that their principalwill be at High risk
RiskometerRiskometer
Mod
erately
Mod
erately ModerateModerate
Low
Low
Hig
hH
igh
Low
Low
HighHigh
LOWLOW HIGHHIGH
Moderately
Moderately
This product is suitable forinvestors who are seeking*:
• To create wealth over longterm
• Investment in equity and equityrelated securities of Asia Pacificcountries (excluding Japan)through fund of funds route
HSBC Asia Pacific (Ex Japan)Dividend Yield Fund (HAPDF)
* Investors should consult their financial advisers if in doubt aboutwhether the product is suitable for them.
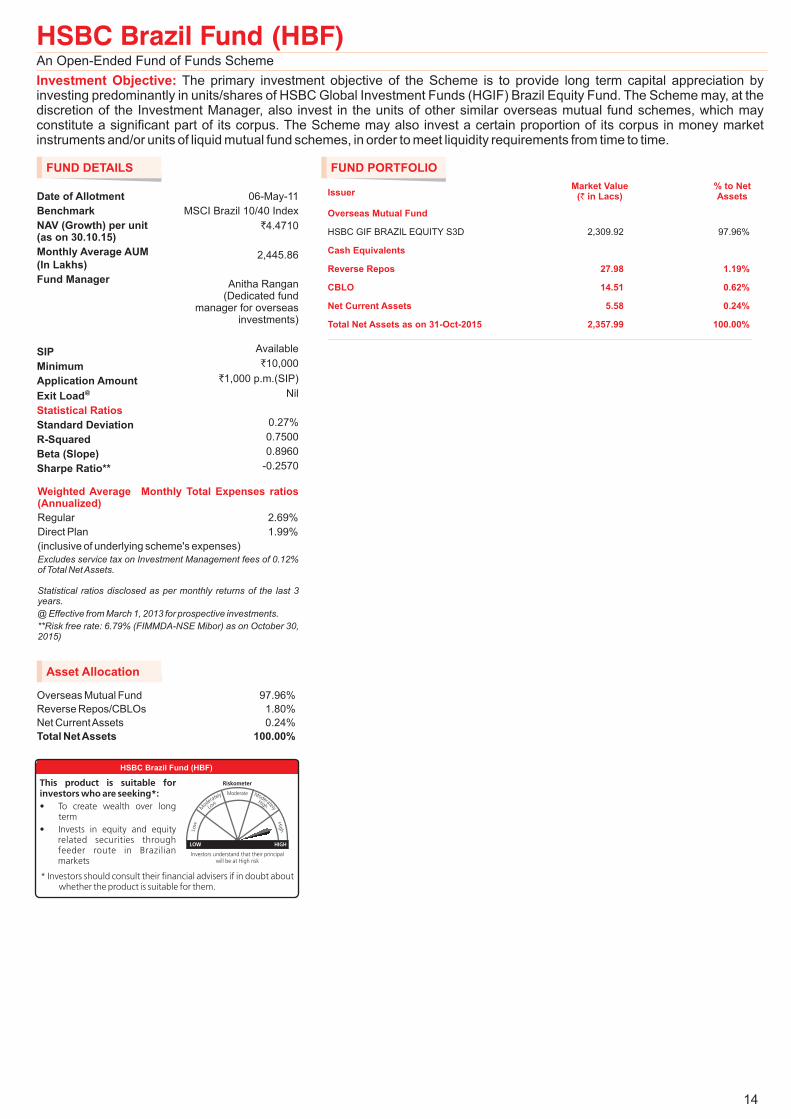
HSBC Brazil Fund (HBF)
This product is suitable for investors who are seeking*:
�
�
�
Overnight liquidity over short term
Investment in Money Market Instruments
Low riskLOW RISK
(BLUE)
Note: Risk is represented as -
*Investors should consult their financial advisers if in doubt whether the product issuitable for them
14
FUND DETAILS
Weighted Average Monthly Total Expenses ratios(Annualized)
Regular 2.69%
Direct Plan 1.99%
(inclusive of underlying scheme's expenses)
Excludes service tax on Investment Management fees of 0.12%of Total NetAssets.
Asset Allocation
Overseas Mutual Fund 97.96%
Reverse Repos/CBLOs 1.80%
Net CurrentAssets 0.24%
Total NetAssets 100.00%
Statistical ratios disclosed as per monthly returns of the last 3years.
@ Effective from March 1, 2013 for prospective investments.
**Risk free rate: 6.79% (FIMMDA-NSE Mibor) as on October 30,2015)
FUND PORTFOLIO
Overseas Mutual Fund
HSBC GIF BRAZIL EQUITY S3D 2,309.92 97.96%
Cash Equivalents
Reverse Repos 27.98 1.19%
CBLO 14.51 0.62%
Net Current Assets 5.58 0.24%
Total Net Assets as on 31-Oct-2015 2,357.99 100.00%
IssuerMarket Value
( in Lacs)`
% to NetAssets
An Open-Ended Fund of Funds Scheme
Investment Objective: The primary investment objective of the Scheme is to provide long term capital appreciation byinvesting predominantly in units/shares of HSBC Global Investment Funds (HGIF) Brazil Equity Fund. The Scheme may, at thediscretion of the Investment Manager, also invest in the units of other similar overseas mutual fund schemes, which mayconstitute a significant part of its corpus. The Scheme may also invest a certain proportion of its corpus in money marketinstruments and/or units of liquid mutual fund schemes, in order to meet liquidity requirements from time to time.
Date of Allotment
Benchmark
NAV (Growth)(as on 30.10.15)
Fund Manager
SIP
Minimum
Application Amount
Exit Load
Standard Deviation
R-Squared
Beta (Slope)
Sharpe Ratio**
per unit
Monthly Average AUM
(In Lakhs)
@
Statistical Ratios
06-May-11
MSCI Brazil 10/40 Index
4.4710
2,445.86
Anitha Rangan(Dedicated fund
manager for overseasinvestments)
Available
10,000
1,000 p.m.(SIP)
Nil
0.27%
0.7500
0.8960
-0.2570
`
`
`
Investors understand that their principalwill be at High risk
Riskometer
Mod
erately Moderate
Low
Hig
h
Low
High
LOW HIGH
Moderately
This product is suitable forinvestors who are seeking*:
• To create wealth over longterm
• Invests in equity and equityrelated securities throughfeeder route in Brazilianmarkets
HSBC Brazil Fund (HBF)
* Investors should consult their financial advisers if in doubt aboutwhether the product is suitable for them.

HSBC Managed Solutions India - Growth (HMSG)
This product is suitable for investors who are seeking*:
�
�
�
Overnight liquidity over short term
Investment in Money Market Instruments
Low riskLOW RISK
(BLUE)
Note: Risk is represented as -
*Investors should consult their financial advisers if in doubt whether the product issuitable for them
15
FUND DETAILS
Weighted Average Monthly Total Expenses ratios(Annualized)
Regular 2.29%
Direct Plan 2.02%
(inclusive of underlying scheme's expenses)
Excludes service tax on Investment Management fees of 0.00%of Total Net Assets and of 0.20% on the underlying scheme's inwhich the fund of fund invests.
Asset Allocation
Mutual Fund 98.63%
Reverse Repos/CBLOs 1.29%
Net CurrentAssets 0.08%
Total NetAssets 100.00%
@ Effective from March 1, 2013 for prospective investments.
FUND PORTFOLIO
Mutual Fund
HSBC Equity Fund - Growth Direct 7,287.57 54.03%
HSBC Midcap Equity Fund - Growth Direct 2,415.54 17.91%
HSBC Income Fund Inv Plan Growth Direct 1,383.04 10.25%
HSBC Flexi Debt Fund Growth Direct 1,114.50 8.26%
HSBC Income Fund Short Term - Growth Direct 1,102.91 8.18%
Cash Equivalents
Reverse Repos 114.70 0.85%
CBLO 59.50 0.44%
Net Current Assets 9.35 0.08%
Total Net Assets as on 31-Oct-2015 13,487.10 100.00%
IssuerMarket Value
( in Lacs)`
% to NetAssets
An Open Ended Fund of Funds Scheme
Investment Objective: The objective of the Plan is to provide long term total return primarily by seeking capital appreciationthrough an active asset allocation with diversification commensurate with the risk profile of investments by investingpredominantly in units of equity mutual funds as well as in a basket of debt mutual funds gold exchange traded funds (ETFs) andother ETFs, offshore mutual funds and money market instruments.
Date of Allotment
Benchmark
NAV (Growth)(as on 30.10.15)
Fund Managers
SIP
Minimum
Application Amount
Exit Load
per unit
Monthly Average AUM
(In Lakhs)
@
30-Apr-14
Composite Index constituting80% of S&P BSE 200 Index
and 20% of CRISILBond Index
12.7394
13,548.94
Anitha Rangan (DedicatedFund Manager for investments
in foreign securities)
Gautam Bhupal (For managinginvestments in Indian Market –
Equity Portion)
Sanjay Shah (For managinginvestments in Indian Market –
Fixed Income Portion)
Available
5,000
1,000 p.m.(SIP)
Nil
Composite
`
`
`
Investors understand that their principalwill be at Moderately High risk
Riskometer
M
oderately Moderate
Low
Hig
h
Low
High
LOW HIGH
Moderately
This product is suitable forinvestors who are seeking*:
• To create wealth over long term
• Investing predominantly in unitsof equity mutual funds as well asin a basket of debt mutual funds,gold & exchange traded funds,offshore mutual funds andmoney market instruments.
HSBC Managed Solutions India - Growth
* Investors should consult their financial advisers if in doubt aboutwhether the product is suitable for them.

HSBC Managed Solutions India - Moderate (HMSM)
This product is suitable for investors who are seeking*:
�
�
�
Overnight liquidity over short term
Investment in Money Market Instruments
Low riskLOW RISK
(BLUE)
Note: Risk is represented as -
*Investors should consult their financial advisers if in doubt whether the product issuitable for them
16
FUND DETAILS
Weighted Average Monthly Total Expenses ratios(Annualized)
Regular 2.09%
Direct Plan 1.84%
(inclusive of underlying scheme's expenses)
Excludes service tax on Investment Management fees of 0.00%of Total Net Assets and of 0.16% on the underlying scheme's inwhich the fund of fund invests.
Asset Allocation
Mutual Fund 98.88%
Reverse Repos/CBLOs 1.64%
Net CurrentAssets -0.52%
Total NetAssets 100.00%
@ Effective from March 1, 2013 for prospective investments.
FUND PORTFOLIO
Mutual Fund
HSBC Equity Fund - Growth Direct 8,764.49 36.86%
Income Fund Short Term - Growth Direct 5,777.43 24.30%
Flexi Debt Fund Growth Direct 4,087.45 17.19%
Midcap Equity Fund - Growth Direct 2,915.58 12.26%
Income Fund Inv Plan Growth Direct 1,966.22 8.27%
HSBC
HSBC
HSBC
HSBC
Cash Equivalents
Reverse Repos 256.69 1.08%
CBLO 133.15 0.56%
Net Current Assets -124.60 -0.52%
Total Net Assets as on 31-Oct-2015 23,776.41 100.00%
IssuerMarket Value
( in Lacs)`
% to NetAssets
An Open Ended Fund of Funds Scheme
Investment Objective: The objective of the fund is to provide long term total return aimed at capital appreciation and providingincome through an active asset allocation with diversification commensurate with the risk profile of investments by investing in abasket of debt mutual funds, equity mutual funds, gold ETFs and other ETFs, offshore mutual funds and money marketinstruments.
Date of Allotment
Benchmark
NAV (Growth)(as on 30.10.15)
Fund Managers
SIP
Minimum
Application Amount
Exit Load
per unit
Monthly Average AUM
(In Lakhs)
@
30-Apr-14
CRISIL Balanced Fund Index
12.4355
24,106.99
Anitha Rangan (DedicatedFund Manager for investments
in foreign securities)Gautam Bhupal (For managinginvestments in Indian Market –
Equity Portion)
Sanjay Shah (For managinginvestments in Indian Market –
Fixed Income Portion)
Available
5,000
1,000 p.m.(SIP)
Nil
`
`
`
Investors understand that their principalwill be at Moderately High risk
Riskometer
Mod
erately Moderate
Low
Hig
h
Low
High
LOW HIGH
Moderately
This product is suitable forinvestors who are seeking*:
• To create wealth and provideincome over the long term
• Investments in a basket of debtmutual funds, equity mutualfunds, gold & exchange tradedfunds, offshore mutual fundsand money market instruments.
HSBC Managed Solutions India - Moderate
* Investors should consult their financial advisers if in doubt aboutwhether the product is suitable for them.

HSBC Managed Solutions India - Conservative (HMSC)
This product is suitable for investors who are seeking*:
�
�
�
Overnight liquidity over short term
Investment in Money Market Instruments
Low riskLOW RISK
(BLUE)
Note: Risk is represented as -
*Investors should consult their financial advisers if in doubt whether the product issuitable for them
17
FUND DETAILS
Weighted Average Monthly Total Expenses ratios(Annualized)
Regular 1.65%
Direct Plan 1.40%
(inclusive of underlying scheme's expenses)
Excludes service tax on Investment Management fees of 0.00%of Total Net Assets and of 0.11% on the underlying scheme's inwhich the fund of fund invests.
Asset Allocation
Mutual Fund 97.84%
Reverse Repos/CBLOs 1.53%
Net CurrentAssets 0.63%
Total NetAssets 100.00%
@ Effective from March 1, 2013 for prospective investments.
FUND PORTFOLIO
Mutual Fund
HSBC Income Fund Short Term - Growth Direct 13,578.09 42.33%
HSBC Flexi Debt Fund Growth Direct 10,783.78 33.62%
HSBC Equity Fund - Growth Direct 3,354.27 10.46%
HSBC Income Fund Inv Plan Growth Direct 1,953.82 6.09%
HSBC Midcap Equity Fund - Growth Direct 933.15 2.91%
HDFC Income Fund Direct Plan - Growth 780.14 2.43%
Cash Equivalents
Reverse Repos 323.54 1.01%
CBLO 167.82 0.52%
Net Current Assets 203.66 0.63%
Total Net Assets as on 31-Oct-2015 32,078.27 100.00%
IssuerMarket Value
( in Lacs)`
% to NetAssets
An Open Ended Fund of Funds Scheme
Investment Objective: The objective of the Plan is to provide long term total return aimed at providing income through an active
asset allocation with diversification commensurate with the risk profile of investments by predominantly investing in units of debt
mutual funds as well as in a basket of equity mutual funds, gold ETFs and other ETFs and money market instruments.
Date of Allotment
Benchmark
NAV (Growth)(as on 30.10.15)
Fund Managers
SIP
Minimum
Application Amount
Exit Load
per unit
Monthly Average AUM
(In Lakhs)
@
30-Apr-14
Composite Index constitutingof 90% into CRISIL Composite
Bond Index and 10% of S&PBSE 200 Index
11.8303
31,973.19
Anitha Rangan (DedicatedFund Manager for investments
in foreign securities)(For managing
investments in Indian Market –Equity Portion)
Sanjay Shah (For managinginvestments in Indian Market –
Fixed Income Portion)
Available
5,000
1,000 p.m.(SIP)
Nil
`
Gautam Bhupal
`
`
This product is suitable forinvestors who are seeking*:• To create wealth over long term• Investing predominantly in
units of debt mutual funds aswell as in a basket of equitymutual funds, gold & otherexchange traded funds andmoney market instruments.
Investors understand that their principalwill be at Moderate risk
Riskometer
Mod
erately Moderate
Low
Hig
h
Low
High
LOW HIGH
Moderately
HSBC Managed Solutions India - Conservative
* Investors should consult their financial advisers if in doubt aboutwhether the product is suitable for them.

HSBC Global Consumer Opportunities Fund -(HGCOF)
Benefiting from China’sGrowing Consumption Power
18
FUND DETAILS
Weighted Average Monthly Total Expenses ratios(Annualized)
Regular 2.34%
Direct Plan 1.64%
(inclusive of underlying scheme's expenses)
Excludes service tax on Investment Management fees of 0.10%of Total Net Assets and of 0.00% on the underlying scheme's inwhich the fund of fund invests.
Asset Allocation
Overseas Mutual Fund 98.25%
Reverse Repos/CBLOs 1.94%
Net CurrentAssets -0.19%
Total NetAssets 100.00%
@ Effective from March 1, 2013 for prospective investments.
FUND PORTFOLIO
Overseas Mutual Fund
HSBC GIF-CHINA CONSUMER OPP S5 CAP 1,498.68 98.25%
Cash Equivalents
Reverse Repos 19.52 1.28%
CBLO 10.13 0.66%
Net Current Assets -2.94 -0.19%
Total Net Assets as on 31-Oct-2015 1,525.39 100.00%
IssuerMarket Value
( in Lacs)`
% to NetAssets
An Open-Ended Fund of Funds Scheme
Investment Objective: The primary investment objective of the scheme is to provide long term capital appreciation by investing
predominantly in units of HSBC Global Investment Funds (HGIF) China Consumer Opportunities Fund (Underlying scheme).
The Scheme may, also invest a certain proportion of its corpus in money market instruments and / or units of liquid mutual fund
schemes, in order to meet liquidity requirements from time to time.
Date of Allotment
Benchmark
NAV (Growth)(as on 30.10.15)
Fund Managers
SIP
Minimum
Application Amount
Exit Load
per unit
Monthly Average AUM
(In Lakhs)
@
23-Feb-15
MSCI AC World Index
9.8553
1,505.23
Anitha Rangan (DedicatedFund Manager) & Sanjay Shah
(for investments in IndianMarket)
Available
1,000 p.m.(SIP)
Nil
`
`
`
5,000
Investors understand that their principalwill be at High risk
Riskometer
M
oderately Moderate
Low
Hig
h
Low
High
LOW HIGH
Moderately
This product is suitable forinvestors who are seeking*:• To create wealth over long term• Investment in equity and equity
related securities around theworld focusing on growingconsumer behaviour of Chinathrough feeder route
HSBC Global Consumer Opportunities Fund - Benefiting fromChina’s Growing Consumption Power (HGCOF)
* Investors should consult their financial advisers if in doubt aboutwhether the product is suitable for them.
This product is suitable for investors who are seeking*:
�
�
�
Overnight liquidity over short term
Investment in Money Market Instruments
Low riskLOW RISK
(BLUE)
Note: Risk is represented as -
*Investors should consult their financial advisers if in doubt whether the product issuitable for them
19
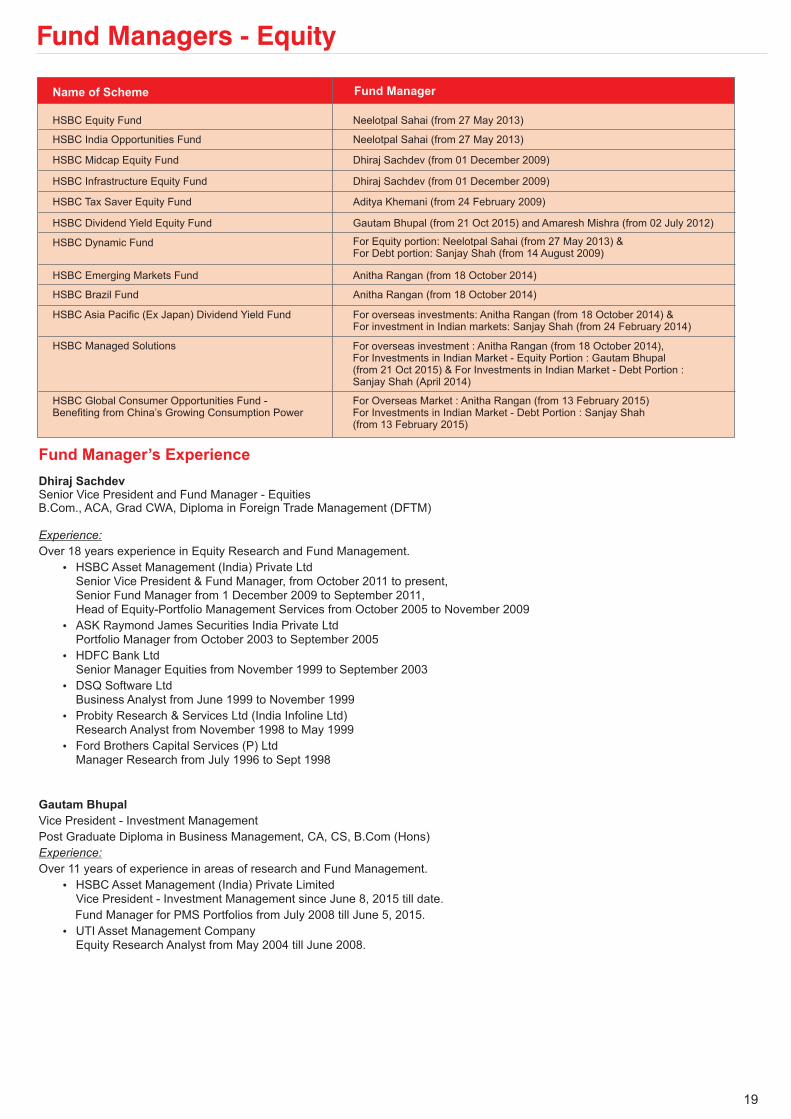
HSBC Equity Fund
HSBC India Opportunities Fund
HSBC Midcap Equity Fund
HSBC Infrastructure Equity Fund
HSBC Tax Saver Equity Fund
HSBC Dividend Yield Equity Fund
HSBC Dynamic Fund
HSBC Emerging Markets Fund
HSBC Brazil Fund
HSBC Asia Pacific (Ex Japan) Dividend Yield Fund
HSBC Managed Solutions
HSBC Global Consumer Opportunities Fund -Benefiting from China’s Growing Consumption Power
Neelotpal Sahai (from 27 May 2013)
Neelotpal Sahai (from 27 May 2013)
Dhiraj Sachdev (from 01 December 2009)
Dhiraj Sachdev (from 01 December 2009)
Aditya Khemani (from 24 February 2009)
Gautam Bhupal and Amaresh Mishra (from 02 July 2012)(from 21 Oct 2015)
For Equity portion: Neelotpal Sahai (from 27 May 2013) &For Debt portion: Sanjay Shah (from 14 August 2009)
Anitha Rangan (from 18 October 2014)
Anitha Rangan (from 18 October 2014)
For overseas investments: Anitha Rangan (from 18 October 2014) &For investment in Indian markets: Sanjay Shah (from 24 February 2014)
For overseas investment : Anitha Rangan (from 18 October 2014),For Investments in Indian Market - Equity Portion :
& For Investments in Indian Market - Debt Portion :Sanjay Shah (April 2014)
Gautam Bhupal(from 21 Oct 2015)
For Overseas Market : Anitha Rangan (from 13 February 2015)For Investments in Indian Market - Debt Portion : Sanjay Shah(from 13 February 2015)
Name of Scheme Fund Manager
Fund Manager’s Experience
Dhiraj SachdevSenior Vice President and Fund Manager - EquitiesB.Com., ACA, Grad CWA, Diploma in Foreign Trade Management (DFTM)
Experience:
Over 18 years experience in Equity Research and Fund Management.
HSBC Asset Management (India) Private LtdSenior Vice President & Fund Manager, from October 2011 to present,Senior Fund Manager from 1 December 2009 to September 2011,Head of Equity-Portfolio Management Services from October 2005 to November 2009
ASK Raymond James Securities India Private LtdPortfolio Manager from October 2003 to September 2005
HDFC Bank LtdSenior Manager Equities from November 1999 to September 2003
DSQ Software LtdBusiness Analyst from June 1999 to November 1999
Probity Research & Services Ltd (India Infoline Ltd)Research Analyst from November 1998 to May 1999
Ford Brothers Capital Services (P) LtdManager Research from July 1996 to Sept 1998
�
�
�
�
�
�
Gautam Bhupal
Vice President - Investment Management
Post Graduate Diploma in Business Management, CA, CS, B.Com (Hons)
Over 11 years of experience in areas of research and Fund Management.
HSBC Asset Management (India) Private LimitedVice President - June 8, 2015 till date.
Fund Manager for PMS Portfolios from July 2008 till June 5, 2015.
UTI Asset Management CompanyEquity Research Analyst from May 2004 till June 2008.
Experience:
�
�
Investment Management since
Fund Managers - Equity
This product is suitable for investors who are seeking*:
�
�
�
Overnight liquidity over short term
Investment in Money Market Instruments
Low riskLOW RISK
(BLUE)
Note: Risk is represented as -
*Investors should consult their financial advisers if in doubt whether the product issuitable for them
20
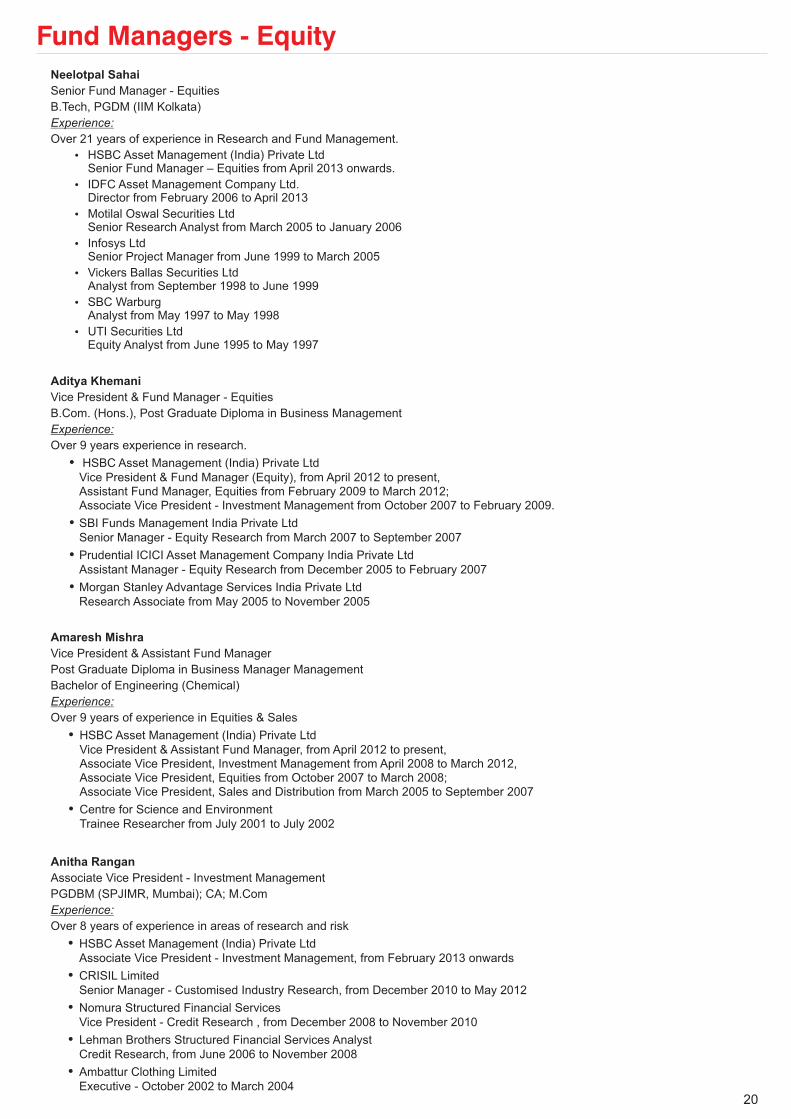
Neelotpal Sahai
Senior Fund Manager - Equities
B.Tech, PGDM (IIM Kolkata)
Over 21 years of experience in Research and Fund Management.
HSBC Asset Management (India) Private LtdSenior Fund Manager – Equities from April 2013 onwards.
IDFC Asset Management Company Ltd.Director from February 2006 to April 2013
Motilal Oswal Securities LtdSenior Research Analyst from March 2005 to January 2006
Infosys LtdSenior Project Manager from June 1999 to March 2005
Vickers Ballas Securities LtdAnalyst from September 1998 to June 1999
SBC WarburgAnalyst from May 1997 to May 1998
UTI Securities LtdEquity Analyst from June 1995 to May 1997
Experience:
�
�
�
�
�
�
�
Aditya Khemani
Vice President & Fund Manager - Equities
B.Com. (Hons.), Post Graduate Diploma in Business Management
Over 9 years experience in research.
HSBC Asset Management (India) Private Ltd
Vice President & Fund Manager (Equity), from April 2012 to present,Assistant Fund Manager, Equities from February 2009 to March 2012;Associate Vice President - Investment Management from October 2007 to February 2009.
SBI Funds Management India Private Ltd
Senior Manager - Equity Research from March 2007 to September 2007
Prudential ICICI Asset Management Company India Private Ltd
Assistant Manager - Equity Research from December 2005 to February 2007
Morgan Stanley Advantage Services India Private Ltd
Research Associate from May 2005 to November 2005
Experience:
�
�
�
�
Amaresh Mishra
Vice President & Assistant Fund Manager
Post Graduate Diploma in Business Manager Management
Bachelor of Engineering (Chemical)
Over 9 years of experience in Equities & Sales
HSBC Asset Management (India) Private Ltd
Vice President & Assistant Fund Manager, from April 2012 to present,Associate Vice President, Investment Management from April 2008 to March 2012,Associate Vice President, Equities from October 2007 to March 2008;Associate Vice President, Sales and Distribution from March 2005 to September 2007
Centre for Science and Environment
Trainee Researcher from July 2001 to July 2002
Experience:
�
�
Anitha Rangan
Associate Vice President - Investment Management
PGDBM (SPJIMR, Mumbai); CA; M.Com
Over 8 years of experience in areas of research and risk
HSBC Asset Management (India) Private Ltd
Associate Vice President - Investment Management, from February 2013 onwards
CRISIL Limited
Senior Manager - Customised Industry Research, from December 2010 to May 2012
Nomura Structured Financial Services
Vice President - Credit Research , from December 2008 to November 2010
Lehman Brothers Structured Financial Services Analyst
Credit Research, from June 2006 to November 2008
Ambattur Clothing Limited
Executive - October 2002 to March 2004
Experience:
�
�
�
�
�
Fund Managers - Equity
Funds Managed by Neelotpal Sahai.
HSBC Equity Fund Date of Inception : 10 Dec 02
Scheme Name & Benchmarks Oct 14 -Sept 15
Oct 13 -Sept 14
Oct 12 -Sept 13
SinceInception
HSBC Equity Fund - Growth
S&P BSE 200 (Scheme Benchmark)
CNX Nifty (Standard Benchmark)
10,000, if invested in HEF, would have become
10,000, if invested in S&P BSE 200, would have become
10,000, if invested in CNX Nifty, would have become
`
`
`
3.91% 39.29% -3.13% 23.16%
3.35% 41.56% -1.54% 18.40%
0.04% 37.80% 0.29% 17.00%
10,391 13,929 9,687 1,45,124
10,335 14,156 9,846 87,474
10,004 13,780 10,029 75,051
` ` ` `
` ` ` `
` ` ` `
HSBC India Opportunities Fund
HSBC Dynamic Fund
Date of Inception : 24 Feb 04
Date of Inception : 24 Sep 07
Scheme Name & Benchmarks
Scheme Name & Benchmarks
Oct 14 -Sept 15
Oct 14 -Sept 15
Oct 13 -Sept 14
Oct 13 -Sept 14
Oct 12 -Sept 13
Oct 12 -Sept 13
SinceInception
SinceInception
HSBC India Opportunities Fund - Growth
S&P BSE 500 (Scheme Benchmark)
CNX Nifty (Standard Benchmark)
10,000, if invested in HIOF, would have become
10,000, if invested in S&P BSE 500, would have become
10,000, if invested in CNX Nifty, would have become
`
`
`
HSBC Dynamic Fund - Growth
S&P BSE 200 (Scheme Benchmark)
CNX Nifty (Standard Benchmark)
10,000, if invested in HDF, would have become
10,000, if invested in S&P BSE 200, would have become
10,000, if invested in CNX Nifty, would have become
`
`
`
6.18% 66.02% -5.84% 16.98%
3.47% 44.01% -3.06% 14.17%
0.04% 37.80% 0.29% 13.54%
10,618 16,602 9,416 61,727
10,347 14,401 9,694 46,580
10,004 13,780 10,029 43,658
` ` ` `
` ` ` `
` ` ` `
2.97% 32.09% -5.21% 3.64%
3.35% 41.56% -1.54% 6.19%
0.04% 37.80% 0.29% 6.13%
10,297 13,209 9,479 13,321
10,335 14,156 9,846 16,190
10,004 13,780 10,029 16,119
` ` ` `
` ` ` `
` ` ` `
Past performance may or may not be sustained in the future. Refer note below.
Past performance may or may not be sustained in the future. Refer note below.
Fund Managed by Neelotpal Sahai (for Equity portion)Sanjay Shah (for Fixed Income portion)
Past performance may or may not be sustained in the future. Refer note below.
Data for the period October to September has been considered in all cases, except for ‘Since Inception’ returns. ‘Since Inception’ (%) returns are compounded annualised,other % returns are simple annualised. ‘Since inception’ returns are calculated on 10 invested at inception. Standard benchmark is prescribed by SEBI and is used for
comparison purposes. Returns on 10,000 are point-to-point returns for the specific time period, invested at the start of the period. The returns provided above have beenrounded off and hence there may be minor differences between point-to-point returns vis-a-vis returns indicated above.
`
`
Comparative Performance of Equity Schemes
Funds Managed by - Anitha Rangan.
HSBC Emerging Markets Fund Date of Inception : 17 Mar 08
Scheme Name & Benchmarks Oct 14 -Sept 15
Oct 13 -Sept 14
Oct 12 -Sept 13
SinceInception
HSBC Emerging Markets Fund - Growth
MSCI Emerging Market Index (Scheme Benchmark)
CNX Nifty (Standard Benchmark)
10,000, if invested in HMEF, would have become
10,000, if invested in MSCI Emerging Market Index, would have become
10,000, if invested in CNX Nifty, would have become
`
`
`
-16.55% -1.38% 18.01% -0.58%
-8.70% 5.68% 4.57% 0.17%
0.04% 37.80% 0.29% 7.83%
8,345 9,862 11,801 9,572
9,130 10,568 10,457 10,125
10,004 13,780 10,029 17,656
` ` ` `
` ` ` `
` ` ` `
Past performance may or may not be sustained in the future. Refer note below.
21

HSBC Brazil Fund
HSBC Asia Pacific (Ex Japan) DividendYield Fund
Date Of Inception : 06 May 11
Date of Inception : 24 Feb 14
Scheme Name & Benchmarks
Scheme Name & Benchmarks
Oct 14 -Sept 15
Oct 14 - Sept 15
Oct 13 -Sept 14
Oct 12 -Sept 13
SinceInception
Since Inception
HSBC Brazil Fund - Growth
MSCI Brazil 10/40 Index (Scheme Benchmark)
CNX Nifty (Standard Benchmark)
10,000, if invested in HBF, would have become
10,000, if invested in MSCI Brazil 10/40 Index, would have become
10,000, if invested in CNX Nifty, would have become
`
`
`
HSBC Asia Pacific (Ex Japan) Dividend Yield Fund - Growth
MSCI AC Asia Pacific ex Japan (Scheme Benchmark)
CNX Nifty (Standard Benchmark)
10,000, if invested in HAPDF, would have become
10,000, if invested in MSCI AC Asia Pacific ex Japan, would have become
10,000, if invested in CNX Nifty, would have become
`
`
`
-47.70% -13.31% 5.10% -17.34%
-47.52% -8.87% -9.86% -22.47%
0.04% 37.80% 0.29% 8.49%
5,230 8,669 10,510 2,71,433
5,248 9,113 9,014 8,23,948
10,004 13,780 10,029 2,435
` ` ` `
` ` ` `
` ` ` `
-11.25% -4.69%
-16.85% -9.18%
0.04% 17.00%
8,875 9,260
8,315 8,573
10,004 12,855
` `
` `
` `
Past performance may or may not be sustained in the future. Refer note below
Past performance may or may not be sustained in the future. Refer note below.
Data for the period October to September has been considered in all cases, except for ‘Since Inception’ returns. ‘Since Inception’ (%) returns are compoundedannualised, other % returns are simple annualised. ‘Since inception’ returns are calculated on 10 invested at inception. Standard benchmark is prescribed bySEBI and is used for comparison purposes. Returns on 10,000 are point-to-point returns for the specific time period, invested at the start of the period. Thereturns provided above have been rounded off and hence there may be minor differences between point-to-point returns vis-a-vis returns indicated above.
`
`
Comparative Performance of Equity Schemes
Fund Managed by Gautam Bhupal and Amaresh Mishra.
HSBC Dividend Yield Equity Fund Date of Inception : 21 Mar 07
Scheme Name & Benchmarks Oct 14 -Sept 15
Oct 13 -Sept 14
Oct 12 -Sept 13
SinceInception
HSBC Dividend Yield Equity Fund - Growth
S&P BSE 200 (Scheme Benchmark)
CNX Nifty (Standard Benchmark)
10,000, if invested in HUOF, would have become
10,000, if invested in S&P BSE 200, would have become
10,000, if invested in CNX Nifty, would have become
`
`
`
2.39% 50.15% -8.23% 5.51%
3.35% 41.56% -1.54% 9.55%
0.04% 37.80% 0.29% 9.15%
10,239 15,015 9,177 15,807
10,335 14,156 9,846 21,780
10,004 13,780 10,029 21,120
` ` ` `
` ` ` `
` ` ` `
Past performance may or may not be sustained in the future. Refer note below.
22
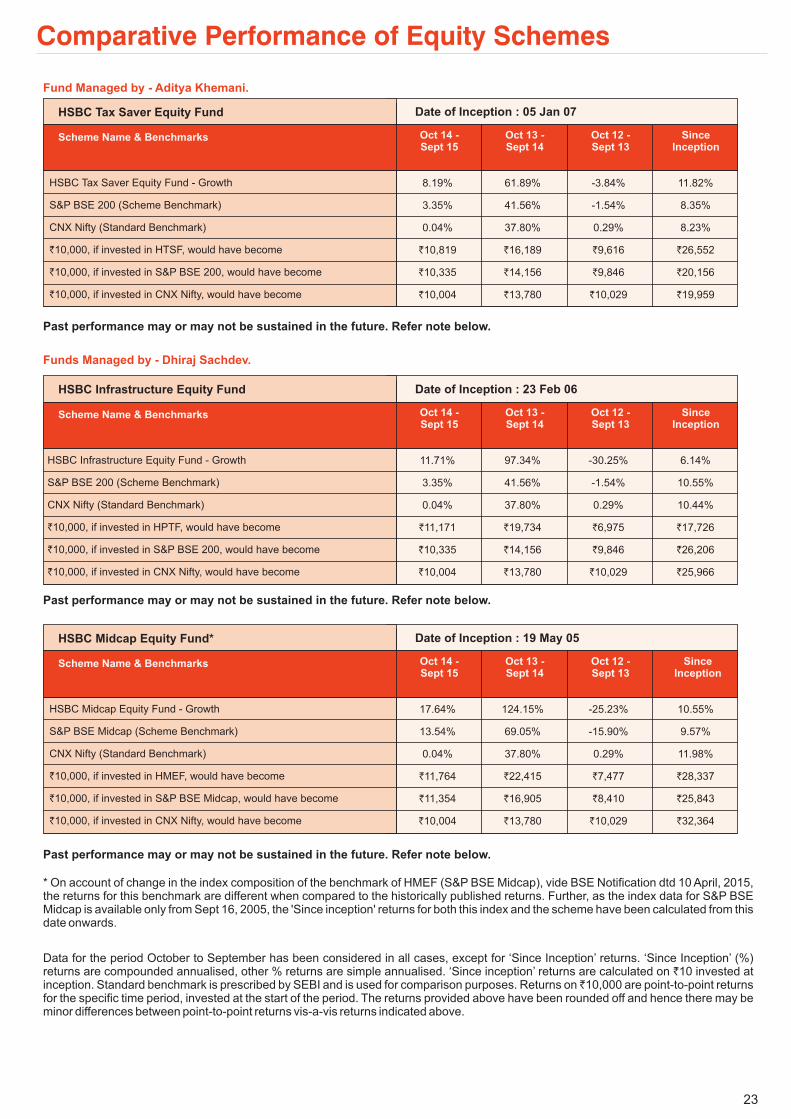
HSBC Tax Saver Equity Fund Date of Inception : 05 Jan 07
Scheme Name & Benchmarks Oct 14 -Sept 15
Oct 13 -Sept 14
Oct 12 -Sept 13
SinceInception
HSBC Tax Saver Equity Fund - Growth
S&P BSE 200 (Scheme Benchmark)
CNX Nifty (Standard Benchmark)
10,000, if invested in HTSF, would have become
10,000, if invested in S&P BSE 200, would have become
10,000, if invested in CNX Nifty, would have become
`
`
`
8.19% 61.89% -3.84% 11.82%
3.35% 41.56% -1.54% 8.35%
0.04% 37.80% 0.29% 8.23%
10,819 16,189 9,616 26,552
10,335 14,156 9,846 20,156
10,004 13,780 10,029 19,959
` ` ` `
` ` ` `
` ` ` `
Fund Managed by - Aditya Khemani.
Past performance may or may not be sustained in the future. Refer note below.
* On account of change in the index composition of the benchmark of HMEF (S&P BSE Midcap), vide BSE Notification dtd 10 April, 2015,the returns for this benchmark are different when compared to the historically published returns. Further, as the index data for S&P BSEMidcap is available only from Sept 16, 2005, the 'Since inception' returns for both this index and the scheme have been calculated from thisdate onwards.
Comparative Performance of Equity Schemes
Funds Managed by - Dhiraj Sachdev.
HSBC Infrastructure Equity Fund Date of Inception : 23 Feb 06
Scheme Name & Benchmarks Oct 14 -Sept 15
Oct 13 -Sept 14
Oct 12 -Sept 13
SinceInception
HSBC Infrastructure Equity Fund - Growth
S&P BSE 200 (Scheme Benchmark)
CNX Nifty (Standard Benchmark)
10,000, if invested in HPTF, would have become
10,000, if invested in S&P BSE 200, would have become
10,000, if invested in CNX Nifty, would have become
`
`
`
11.71% 97.34% -30.25% 6.14%
3.35% 41.56% -1.54% 10.55%
0.04% 37.80% 0.29% 10.44%
11,171 19,734 6,975 17,726
10,335 14,156 9,846 26,206
10,004 13,780 10,029 25,966
` ` ` `
` ` ` `
` ` ` `
HSBC Midcap Equity Fund* Date of Inception : 19 May 05
Scheme Name & Benchmarks Oct 14 -Sept 15
Oct 13 -Sept 14
Oct 12 -Sept 13
SinceInception
HSBC Midcap Equity Fund - Growth
S&P BSE Midcap (Scheme Benchmark)
CNX Nifty (Standard Benchmark)
10,000, if invested in HMEF, would have become
10,000, if invested in S&P BSE Midcap, would have become
10,000, if invested in CNX Nifty, would have become
`
`
`
17.64% 124.15% -25.23% 10.55%
13.54% 69.05% -15.90% 9.57%
0.04% 37.80% 0.29% 11.98%
11,764 22,415 7,477 28,337
11,354 16,905 8,410 25,843
10,004 13,780 10,029 32,364
` ` ` `
` ` ` `
` ` ` `
Past performance may or may not be sustained in the future. Refer note below.
Past performance may or may not be sustained in the future. Refer note below.
23
Data for the period October to September has been considered in all cases, except for ‘Since Inception’ returns. ‘Since Inception’ (%)returns are compounded annualised, other % returns are simple annualised. ‘Since inception’ returns are calculated on 10 invested atinception. Standard benchmark is prescribed by SEBI and is used for comparison purposes. Returns on 10,000 are point-to-point returnsfor the specific time period, invested at the start of the period. The returns provided above have been rounded off and hence there may beminor differences between point-to-point returns vis-a-vis returns indicated above.
`
`

HSBC Managed Solutions - Growth
HSBC Managed Solutions - Moderate - Growth
HSBC Managed Solutions - Conservative - Growth
Date of Inception : 30 Apr 14
Date of Inception : 30 Apr 14
Date of Inception : 30 Apr 14
Scheme Name & Benchmarks
Scheme Name & Benchmarks
Scheme Name & Benchmarks
Oct 14 -Sept 15
Oct 14 -Sept 15
Oct 14 -Sept 15
SinceInception
SinceInception
SinceInception
HSBC Managed Solutions - Growth - Growth
Customised Benchmark Index Fund (Scheme Benchmark)*
CNX Nifty (Standard Benchmark)
Crisil 10 Year Gilt Index (Standard Benchmark)
10,000, if invested in HMSG, would have become
10,000, if invested in Customised Benchmark Index, would have become
10,000, if invested in CNX Nifty, would have become
10,000, if invested in Crisil 10 Year Gilt Index, would have become
`
`
`
`
HSBC Managed Solutions - Moderate - Growth
Crisil Balanced Fund Index (Scheme Benchmark)
CNX Nifty (Standard Benchmark)
Crisil 10 Year Gilt Index (Standard Benchmark)
10,000, if invested in HMSM, would have become
10,000, if invested in Crisil Balanced Fund Index, would have become
10,000, if invested in CNX Nifty, would have become
10,000, if invested in Crisil 10 Year Gilt Index, would have become
`
`
`
`
HSBC Managed Solutions - Conservative - Growth
Customised Benchmark Index Fund (Scheme Benchmark)*
CNX Nifty (Standard Benchmark)
Crisil 10 Year Gilt Index (Standard Benchmark)
10,000, if invested in HMSC, would have become
10,000, if invested in Customised Benchmark Index, would have become
10,000, if invested in CNX Nifty, would have become
10,000, if invested in Crisil 10 Year Gilt Index, would have become
`
`
`
`
8.98% 18.52%
5.17% 15.99%
0.04% 12.84%
13.49% 12.78%
10,898 12,733
10,517 12,348
10,004 11,874
11,349 11,866
` `
` `
` `
` `
10.05% 16.47%
4.51% 13.05%
0.04% 12.84%
13.49% 12.78%
11,005 12,421
10,451 11,905
10,004 11,874
11,349 11,866
` `
` `
` `
` `
10.66% 12.32%
11.54% 13.04%
0.04% 12.84%
13.49% 12.78%
11,066 11,797
11,154 11,904
10,004 11,874
11,349 11,866
` `
` `
` `
` `
Fund Managed by Gautam Bhupal (for Equity portion)Sanjay Shah (for Fixed Income portion), Anitha Rangan (For overseas investment)
Past performance may or may not be sustained in the future. Refer note below.
Past performance may or may not be sustained in the future. Refer note below.
Past performance may or may not be sustained in the future. Refer note below.
*Composite index of S&P BSE 200 (80%) and Crisil Composite Bond Fund Index (20%).
*Composite index of Crisil Composite Bond Fund Index (90%) and S&P BSE 200 (10%).
Comparative Performance of Equity Schemes
24
Data for the period October to September has been considered in all cases, except for ‘Since Inception’ returns. ‘Since Inception’ (%)returns are compounded annualised, other % returns are simple annualised. ‘Since inception’ returns are calculated on 10 invested atinception. Standard benchmark is prescribed by SEBI and is used for comparison purposes. Returns on 10,000 are point-to-point returnsfor the specific time period, invested at the start of the period. The returns provided above have been rounded off and hence there may beminor differences between point-to-point returns vis-a-vis returns indicated above.
`
`

25
HSBC Equity Fund
HSBC India Opportunities Fund
HSBC Dynamic Fund
Date of Inception : 10 Dec 02
Date of Inception : 24 Feb 04
Date of Inception : 24 Sep 07
Scheme Name & Benchmarks
Scheme Name & Benchmarks
Scheme Name & Benchmarks
1Year
1Year
1Year
3Years
3Years
3Years
5Years
5Years
5Years
SinceInception
SinceInception
SinceInception
Total amount invested ( )
Market Value as on Sept. 30, 2015 ( )
Scheme Returns (%)
Scheme Benchmark ( )
Scheme Benchmark Returns (%)
Standard Benchmark ( )
Standard Benchmark Returns (%)
`
`
`
`
S&P BSE 200 -
S&P BSE 200 -
CNX NIFTY -
CNX NIFTY -
Total amount invested ( )
Scheme Returns (%)
Scheme Benchmark ( )
Scheme Benchmark Returns (%)
Standard Benchmark ( )
Standard Benchmark Returns (%)
`
`
`
`
Market Value as on Sept. 30, 2015 ( )
S&P BSE 500 -
S&P BSE 500 -
CNX NIFTY -
CNX NIFTY -
Total amount invested ( )
Scheme Returns (%)
Scheme Benchmark ( )
Scheme Benchmark Returns (%)
Standard Benchmark ( )
Standard Benchmark Returns (%)
`
`
`
`
Market Value as on Sept. 30, 2015 ( )
S&P BSE 200 -
S&P BSE 200 -
CNX NIFTY -
CNX NIFTY -
120000 360000 600000 1530000
115457.10 432092.45 783963.98 4252021.25
-6.97 12.24 10.65 14.95
115248.64 437058.59 801868.26 3830052.97
-7.29 13.03 11.56 13.48
113490.72 420797.16 774864.46 3686493.49
-9.94 10.42 10.18 12.94
120000 360000 600000 1390000
115282.32 487774.15 919586.51 3322626.44
-7.24 20.79 17.12 14.20
115539.54 440509.35 804695.15 2840420.10
-6.85 13.58 11.70 11.73
113490.72 420797.16 774864.46 2785493.44
-9.94 10.42 10.18 11.42
120000 360000 600000 960000
116407.1 417774.87 741135.37 1291631.98
-5.53 9.93 8.39 7.27
115248.64 437058.59 801868.26 1481579.69
-7.29 13.03 11.56 10.60
113490.72 420797.16 774864.46 1431548.61
-9.94 10.42 10.18 9.77
The Fund offers flexible and convenient Systematic Investment Plan (SIP) facility. To illustrate the advantages of SIP investments, this is how your investments would havegrown if you had invested say 10,000 systematically on the first Business Day of every month over a period of time in the Growth Option of Respective Scheme.
The returns are calculated by XIRR approach assuming investment of 10000/- on the 1st working day of every month. XIRR helps in calculating return on investments givenan initial and final value and a series of cash inflows and outflows with correct allowance for the time impact of the transactions. Data as on September 30, 2015.
`
`
SIP Performance of Equity Schemes
Returns shown for Regular Plan - Growth Option
Past performance may or may not be sustained in the future. Refer note below
Past performance may or may not be sustained in the future. Refer note below
Past performance may or may not be sustained in the future. Refer note below

SIP Performance of Equity Schemes
26
HSBC Brazil Fund Date Of Inception : 06 May 11
Scheme Name & Benchmarks 1Year
3Years
5Years
SinceInception
Total amount invested ( )
Market Value as on Sept. 30, 2015 ( )
Scheme Returns (%)
Scheme Benchmark ( )
Scheme Benchmark Returns (%)
Standard Benchmark ( )
Standard Benchmark Returns (%)
`
`
`
`
MSCI Brazil 10/40 Index -
MSCI Brazil 10/40 Index -
CNX NIFTY -
CNX NIFTY -
120000 360000 NA 520000
78782.78 191381.69 NA 265595.42
-56.72 -37.04 NA -29.31
78164.19 191053.51 NA 249128.78
-57.44 -37.13 NA -31.99
113490.72 420797.16 NA 666034.17
-9.94 10.42 NA 11.42
HSBC Asia Pacific (Ex Japan) Dividend Yield Fund Date of Inception : 24 Feb 14
Scheme Name & Benchmarks 1Year
3Years
5Years
SinceInception
Total amount invested ( )
Scheme Returns (%)
Scheme Benchmark ( )
Scheme Benchmark Returns (%)
Standard Benchmark ( )
Standard Benchmark Returns (%)
`
`
`
`
Market Value as on Sept. 30, 2015 ( )
MSCI AC Asia Pacific ex Japan -
MSCI AC Asia Pacific ex Japan -
CNX NIFTY -
CNX NIFTY -
120000 NA NA 190000
105975.74 NA NA 168538.72
-21.06 NA NA -13.72
100151.38 NA NA 156545.88
-29.55 NA NA -21.55
113490.72 NA NA 191532.80
-9.94 NA NA 0.97
HSBC Emerging Markets Fund Date of Inception : 17 Mar 08
Scheme Name & Benchmarks 1Year
3Years
5Years
SinceInception
Total amount invested ( )
Scheme Returns (%)
Scheme Benchmark ( )
Scheme Benchmark Returns (%)
Standard Benchmark ( )
Standard Benchmark Returns (%)
`
`
`
`
Market Value as on Sept. 30, 2015 ( )
MSCI Emerging Market Index -
MSCI Emerging Market Index -
CNX NIFTY -
CNX NIFTY -
120000 360000 600000 900000
101202.74 311035.41 544229.19 893183.49
-27.87 -9.30 -3.83 -0.20
107148.84 334566.12 570549.98 928509.48
-19.38 -4.72 -1.98 0.82
113490.72 420797.16 774864.46 1344829.33
-9.94 10.42 10.18 10.50
The Fund offers flexible and convenient Systematic Investment Plan (SIP) facility. To illustrate the advantages of SIP investments, this is how your investments would havegrown if you had invested say 10,000 systematically on the first Business Day of every month over a period of time in the Growth Option of Respective Scheme.
The returns are calculated by XIRR approach assuming investment of 10000/- on the 1st working day of every month. XIRR helps in calculating return on investments givenan initial and final value and a series of cash inflows and outflows with correct allowance for the time impact of the transactions. Data as on September 30, 2015.
`
`
Returns shown for Regular Plan - Growth Option
Past performance may or may not be sustained in the future. Refer note below
Past performance may or may not be sustained in the future. Refer note below
Past performance may or may not be sustained in the future. Refer note below
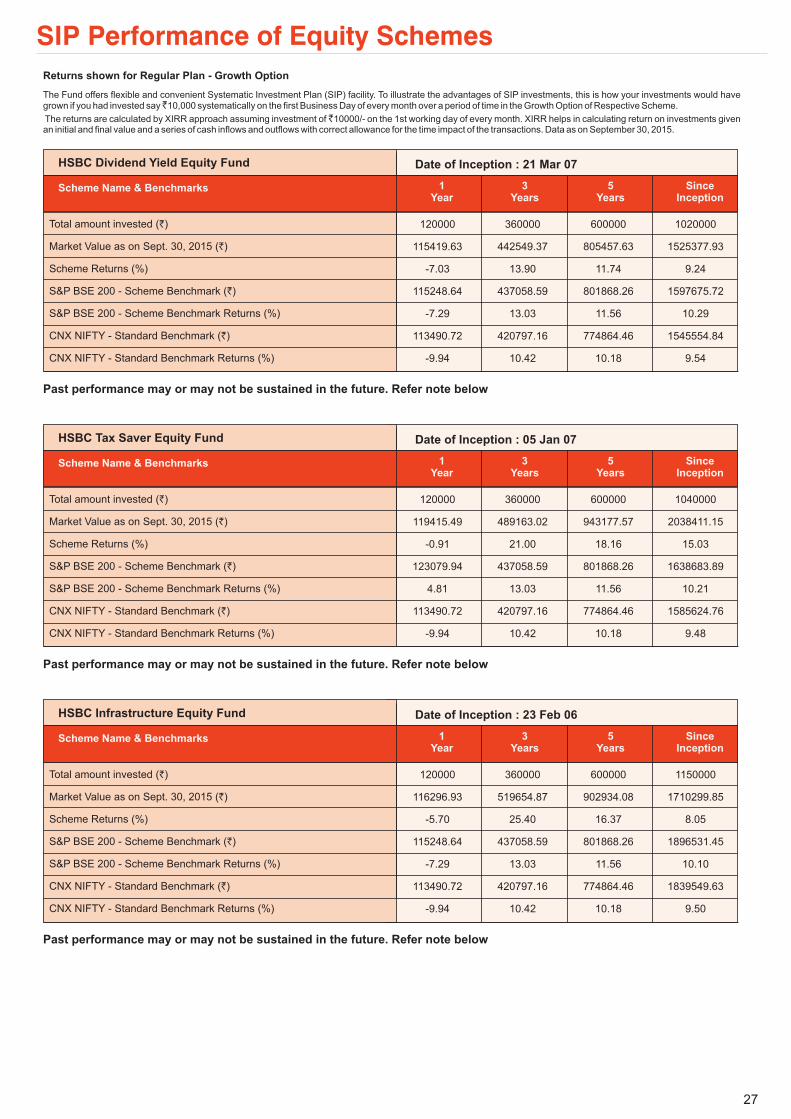
SIP Performance of Equity Schemes
27
HSBC Tax Saver Equity Fund Date of Inception : 05 Jan 07
Scheme Name & Benchmarks 1Year
3Years
5Years
SinceInception
Total amount invested ( )
Market Value as on Sept. 30, 2015 ( )
Scheme Returns (%)
Scheme Benchmark ( )
Scheme Benchmark Returns (%)
Standard Benchmark ( )
Standard Benchmark Returns (%)
`
`
`
`
S&P BSE 200 -
S&P BSE 200 -
CNX NIFTY -
CNX NIFTY -
120000 360000 600000 1040000
119415.49 489163.02 943177.57 2038411.15
-0.91 21.00 18.16 15.03
123079.94 437058.59 801868.26 1638683.89
4.81 13.03 11.56 10.21
113490.72 420797.16 774864.46 1585624.76
-9.94 10.42 10.18 9.48
HSBC Infrastructure Equity Fund Date of Inception : 23 Feb 06
Scheme Name & Benchmarks 1Year
3Years
5Years
SinceInception
Total amount invested ( )
Scheme Returns (%)
Scheme Benchmark ( )
Scheme Benchmark Returns (%)
Standard Benchmark ( )
Standard Benchmark Returns (%)
`
`
`
`
Market Value as on Sept. 30, 2015 ( )
S&P BSE 200 -
S&P BSE 200 -
CNX NIFTY -
CNX NIFTY -
120000 360000 600000 1150000
116296.93 519654.87 902934.08 1710299.85
-5.70 25.40 16.37 8.05
115248.64 437058.59 801868.26 1896531.45
-7.29 13.03 11.56 10.10
113490.72 420797.16 774864.46 1839549.63
-9.94 10.42 10.18 9.50
HSBC Dividend Yield Equity Fund Date of Inception : 21 Mar 07
Scheme Name & Benchmarks 1Year
3Years
5Years
SinceInception
Total amount invested ( )
Scheme Returns (%)
Scheme Benchmark ( )
Scheme Benchmark Returns (%)
Standard Benchmark ( )
Standard Benchmark Returns (%)
`
`
`
`
Market Value as on Sept. 30, 2015 ( )
S&P BSE 200 -
S&P BSE 200 -
CNX NIFTY -
CNX NIFTY -
120000 360000 600000 1020000
115419.63 442549.37 805457.63 1525377.93
-7.03 13.90 11.74 9.24
115248.64 437058.59 801868.26 1597675.72
-7.29 13.03 11.56 10.29
113490.72 420797.16 774864.46 1545554.84
-9.94 10.42 10.18 9.54
The Fund offers flexible and convenient Systematic Investment Plan (SIP) facility. To illustrate the advantages of SIP investments, this is how your investments would havegrown if you had invested say 10,000 systematically on the first Business Day of every month over a period of time in the Growth Option of Respective Scheme.
The returns are calculated by XIRR approach assuming investment of 10000/- on the 1st working day of every month. XIRR helps in calculating return on investments givenan initial and final value and a series of cash inflows and outflows with correct allowance for the time impact of the transactions. Data as on September 30, 2015.
`
`
Returns shown for Regular Plan - Growth Option
Past performance may or may not be sustained in the future. Refer note below
Past performance may or may not be sustained in the future. Refer note below
Past performance may or may not be sustained in the future. Refer note below

SIP Performance of Equity Schemes
28
HSBC Managed Solutions - Growth Date of Inception : 30 Apr 14
Scheme Name & Benchmarks 1Year
3Years
5Years
SinceInception
Total amount invested ( )
Market Value as on Sept. 30, 2015 ( )
Scheme Returns (%)
Scheme Benchmark ( )
Scheme Benchmark Returns (%)
Standard Benchmark ( )
Standard Benchmark Returns (%)
`
`
`
`
Customised Benchmark Index* -
Customised Benchmark Index -
CNX NIFTY -
CNX NIFTY -
120000 NA NA 170000
120139.48 NA NA 177169.09
0.22 NA NA 5.67
117556.07 NA NA
-3.70 NA NA
113490.72 NA NA 166929.32
-9.94 NA NA -2.42
173375.76
2.66
HSBC Managed Solutions - Moderate - Growth Date of Inception : 30 Apr 14
Scheme Name & Benchmarks 1Year
3Years
5Years
SinceInception
Total amount invested ( )
Scheme Returns (%)
Scheme Benchmark ( )
Scheme Benchmark Returns (%)
Standard Benchmark ( )
Standard Benchmark Returns (%)
`
`
`
`
Market Value as on Sept. 30, 2015 ( )
Crisil Balanced Fund Index -
Crisil Balanced Fund Index -
CNX NIFTY -
CNX NIFTY -
120000 NA NA 170000
122098.60 NA NA 179263.18
3.28 NA NA 7.33
118316.04 NA NA
-2.59 NA NA
113490.72 NA NA 166929.32
-9.94 NA NA -2.42
173523.61
2.77
HSBC Midcap Equity Fund Date of Inception : 19 May 05
Scheme Name & Benchmarks 1Year
3Years
5Years
SinceInception
Total amount invested ( )
Scheme Returns (%)
Scheme Benchmark ( )
Scheme Benchmark Returns (%)
Standard Benchmark ( )
Standard Benchmark Returns (%)
`
`
`
`
Market Value as on Sept. 30, 2015 ( )
S&P BSE Midcap -
S&P BSE Midcap -
CNX NIFTY -
CNX NIFTY -
120000 360000 600000 1240000
124314.94 606727.36 1100728.41 2575069.49
6.76 37.09 24.54 13.52
123079.94 508088.07 904494.32 2251891.39
4.81 23.75 16.44 11.10
113490.72 420797.16 774864.46 2128655.39
-9.94 10.42 10.18 10.07
The Fund offers flexible and convenient Systematic Investment Plan (SIP) facility. To illustrate the advantages of SIP investments, this is how your investments would havegrown if you had invested say 10,000 systematically on the first Business Day of every month over a period of time in the Growth Option of Respective Scheme.
The returns are calculated by XIRR approach assuming investment of 10000/- on the 1st working day of every month. XIRR helps in calculating return on investments givenan initial and final value and a series of cash inflows and outflows with correct allowance for the time impact of the transactions. Data as on September 30, 2015.
`
`
Returns shown for Regular Plan - Growth Option
Past performance may or may not be sustained in the future. Refer note below
Past performance may or may not be sustained in the future. Refer note below
*Composite index of S&P BSE200 (80%) and Crisil Composite Bond Fund Index (20%).
Past performance may or may not be sustained in the future. Refer note below

SIP Performance of Equity Schemes
29
HSBC Managed Solutions - Conservative - Growth Date of Inception : 30 Apr 14
Scheme Name & Benchmarks 1Year
3Years
5Years
SinceInception
Total amount invested ( )
Scheme Returns (%)
Scheme Benchmark ( )
Scheme Benchmark Returns (%)
Standard Benchmark ( )
Standard Benchmark Returns (%)
`
`
`
`
Market Value as on Sept. 30, 2015 ( )
Customised Benchmark Index* -
Customised Benchmark Index -
CNX NIFTY -
CNX NIFTY -
120000 NA NA 170000
124749.27 NA NA 181569.20
7.47 NA NA 9.16
125632.11 NA NA
8.86 NA NA
113490.72 NA NA 166929.32
-9.94 NA NA -2.42
183154.61
10.36
The Fund offers flexible and convenient Systematic Investment Plan (SIP) facility. To illustrate the advantages of SIP investments, this is how your investments would havegrown if you had invested say 10,000 systematically on the first Business Day of every month over a period of time in the Growth Option of Respective Scheme.
The returns are calculated by XIRR approach assuming investment of 10000/- on the 1st working day of every month. XIRR helps in calculating return on investments givenan initial and final value and a series of cash inflows and outflows with correct allowance for the time impact of the transactions. Data as on September 30, 2015.
`
`
Returns shown for Regular Plan - Growth Option
Past performance may or may not be sustained in the future. Refer note below
*Composite index of Crisil Composite Bond Fund Index (90%) and S&P BSE200 (10%).

HSBC MIP - Savings Plan (HMIP-S)An Open Ended Fund with Regular & Savings Plans. Monthly income is not assured and is subject to availability of distributable surplus.
Investment Objective: Seeks to generate reasonable returns through investments in Debt and Money Market Instruments. Thesecondary objective of the scheme is to invest in equity and equity related instruments to seek capital appreciation.
30
FUND DETAILS
Date of Allotment
Benchmark
NAV (Growth)
(as on 30.10.15)
Average Maturity ofPortfolio
Modified Duration
of Portfolio
Fund Managers
SIPMinimum ApplicationAmountGrowthQuarterly DividendMonthly DividendSIP
Exit Load
per unit
Monthly Average AUM(In Lakhs)
@
Weighted Average Monthly Total Expenses ratios(Annualized)
Regular 2.30%
Direct Plan 1.80%Excludes service tax on Investment Management fees of 0.22%of Total NetAssets.
Asset Allocation
Government Securities 45.65%
Equity 22.58%
Corporate/ PSU Debt 19.23%
Cash Equivalents 5.39%
Money Market Instruments 4.14%
Net CurrentAssets 3.01%
Total NetAssets 100.00%
@ Effective from March 1, 2013 for prospective investments.
FUND PORTFOLIO
Money Market Instruments
Corporate/ PSU Debt
EQUITY
Government Securities
Cash EquivalentsCBLO 433.84 1.84%Reverse Repos 836.37 3.55%Net Current Assets 710.08 3.01%Total Net Assets as on 31-Oct-2015 23,566.06 100.00%
Certificate of Deposit
Corporate Bonds / Debentures
Equities
Canara Bank 974.94 4.14% CRISIL A1+
Rural Electrification Corporation 1,061.21 4.50% CARE AAAPower Finance Corporation 1,006.33 4.27% CRISIL AAAIndia Infradebt 704.58 2.99% CRISIL AAAPower Grid Corporation of India 620.05 2.63% CRISIL AAAPower Finance Corporation 510.50 2.17% CRISIL AAALIC Housing Finance 508.12 2.16% CRISIL AAAPower Finance Corporation 120.57 0.51% CRISIL AAA
HDFC Bank 404.65 1.72%Tata Consultancy Services 254.51 1.08%Maruti Suzuki India 246.92 1.05%Infosys 227.09 0.96%ICICI Bank 213.98 0.91%Axis Bank 210.60 0.89%IndusInd Bank 186.94 0.79%LIC Housing Finance 182.32 0.77%Welspun India 178.07 0.76%Larsen & Toubro 176.34 0.75%ITC 175.69 0.75%Crompton Greaves 168.78 0.72%Gateway Distriparks 160.25 0.68%The Ramco Cements 159.62 0.68%Ultratech Cement 152.96 0.65%IPCA Laboratories 145.70 0.62%Sun Pharmaceuticals Ind 137.88 0.59%Power Mech Projects 133.05 0.56%SRF 132.23 0.56%Kaveri Seed Company 116.23 0.49%Housing Development Finance Corp 113.12 0.48%Aditya Birla Nuvo 112.21 0.48%Tech Mahindra 107.83 0.46%Apollo Tyres 107.76 0.46%Tata Motors 103.94 0.44%Adani Ports & Special Economic Zone 103.69 0.44%Coal India 102.37 0.43%The Federal Bank 101.99 0.43%Arvind 97.13 0.41%State Bank of India 85.34 0.36%Finolex Industries 81.47 0.35%MRF 79.50 0.34%Karur Vysya Bank 78.20 0.33%Hindustan Zinc 70.97 0.30%Oil & Natural Gas Corp 67.91 0.29%Dr. Reddy's Laboratories 59.92 0.25%The Jammu & Kashmir Bank 49.92 0.21%Hindustan Dorr-Oliver 31.28 0.13%Arvind Infrastructure Ltd 2.14 0.01%
8.40% GOVT OF INDIA RED 28-07-2024 2,324.02 9.86% SOVEREIGN7.95% GOVT OF INDIA RED 28-08-2032 2,077.51 8.82% SOVEREIGN7.88% GOVT OF INDIA RED 19-03-2030 1,924.95 8.17% SOVEREIGN8.24% GOVT OF INDIA RED 10-11-2033 1,809.04 7.68% SOVEREIGN8.60% GOVT OF INDIA RED 02-06-2028 1,352.98 5.74% SOVEREIGN8.17% GOVT OF INDIA RED 01-12-2044 507.42 2.15% SOVEREIGN7.68% GOVT OF INDIA RED 15-12-2023 420.25 1.78% SOVEREIGN7.72% GOVT OF INDIA RED 25-05-2025 342.81 1.45% SOVEREIGN
IssuerMarket Value
( in Lacs)`
% to NetAssets
Dividend DeclarationRecord Date / periodof dividend declared
Dividend ( per unit)Non-Institutional
` Dividend ( per unit)Institutional
` NAV ( ) per unit(cum dividend)
`
HSBC MIP - Savings Plan - Monthly Dividend
HSBC MIP - Savings Plan - Monthly Dividend - Direct Plan
HSBC MIP - Savings Plan - Quarterly Dividend
HSBC MIP - Savings Plan - Quarterly Dividend - Direct Plan
25-Aug-15 0.06862 0.06357 13.4408
28-Sep-15 0.06862 0.06357 13.4288
25-Aug-15 0.06862 0.06357 14.3237
28-Sep-15 0.06862 0.06357 14.3238
25-Mar-15 0.20324 0.18848 13.9286
25-Jun-15 0.20946 0.19406 13.6268
25-Mar-15 0.21050 0.19521 14.5619
25-Jun-15 0.20946 0.19406 14.2677
26-Oct-15 0.06862 0.06357 13.5832
26-Oct-15 0.06862 0.06357 14.5003
28-Sep-15 0.19501 0.18067 13.5141
28-Sep-15 0.19501 0.18067 14.1812
Rating24-Feb-04
CRISIL MIP Blended Index
29.7438
7.85 years
4.58 years
23,335.31
Aditya Khemani(for Equity portion) Sanjay
Shah (for Debt portion)
Available
10,00010,00025,000
1,000 p.m.Nil
`
`
`
`
`
Rating Profile
Sovereign 45.65%
AAAand equivalents 23.37%
Equity 22.58%
Reverse Repos/ CBLOs 5.39%
Net CurrentAssets 3.01%
Total NetAssets 100.00%
Upon payment of dividend, the NAV per unit falls to the extent of payout and statutory levy, if any. Face value: 10 per unit.`
Investors understand that their principalwill be at Moderately High risk
Riskometer
Mod
erately Moderate
Low
Hig
h
Low
High
LOW HIGH
Moderately
HSBC MIP - Savings Plan (HMIP-S)
This product is suitable forinvestors who are seeking*:
• Regular Income over mediumterm
• Investment in fixed income(debt and money marketinstruments) as well as equityand equity related securities
* Investors should consult their financial advisers if in doubtabout whether the product is suitable for them.

HSBC MIP - Regular Plan (HMIP-R)An Open Ended Fund with Regular & Savings Plans. Monthly income is not assured and is subject to availability of distributable surplus.
Investment Objective: Seeks to generate reasonable returns through investments in Debt and Money Market Instruments. Thesecondary objective of the scheme is to invest in equity and equity related instruments to seek capital appreciation.
31
FUND DETAILS
Date of Allotment
Benchmark
NAV (Growth)
(as on 30.10.15)
Average Maturity ofPortfolio
Modified Duration
of Portfolio
Fund Managers
SIP
Minimum ApplicationAmount
Growth
Quarterly Dividend
Monthly Dividend
SIP
Exit Load
per unit
Monthly Average AUM(In Lakhs)
@
Weighted Average Monthly Total Expenses ratios(Annualized)
Regular 2.29%
Direct Plan 1.79%
Excludes service tax on Investment Management fees of 0.22%of Total NetAssets.
Asset Allocation
Government Securities 48.18%
Corporate/ PSU Debt 28.77%
Equity 14.00%
Money Market Instruments 5.21%
Net CurrentAssets 2.78%
Cash Equivalents 1.06%
Total NetAssets 100.00%
@ Effective from March 1, 2013 for prospective investments.
FUND PORTFOLIO
Money Market Instruments
Corporate/ PSU Debt
EQUITY
Government Securities
Cash Equivalents
CBLO 33.80 0.36%
Reverse Repos 65.17 0.70%
Net Current Assets 265.01 2.78%
Total Net Assets as on 31-Oct-2015 9,359.86 100.00%
Certificate of Deposit
Corporate Bonds / Debentures
Equities
Canara Bank 487.47 5.21% CRISIL A1+
Power Finance Corporation 510.50 5.45% CRISIL AAA
LIC Housing Finance 508.12 5.43% CRISIL AAA
Power Finance Corporation 503.16 5.38% CRISIL AAA
Rural Electrification Corporation 454.80 4.86% CARE AAA
Power Grid Corporation of India 413.37 4.42% CRISIL AAA
India Infradebt 301.96 3.23% CRISIL AAA
Tata Consultancy Services 77.35 0.83%
Maruti Suzuki India 74.16 0.79%
HDFC Bank 69.27 0.74%
Axis Bank 64.18 0.69%
ICICI Bank 63.85 0.68%
LIC Housing Finance 57.58 0.62%
Larsen & Toubro 53.61 0.57%
ITC 53.54 0.57%
IPCA Laboratories 52.20 0.56%
Dr. Reddy's Laboratories 51.36 0.55%
Welspun India 50.26 0.54%
Ultratech Cement 43.29 0.46%
Sun Pharmaceuticals Ind 42.70 0.46%
Arvind 41.63 0.44%
Aditya Birla Nuvo 36.41 0.39%
Power Mech Projects 35.48 0.38%
Crompton Greaves 34.80 0.37%
Tech Mahindra 33.43 0.36%
Gateway Distriparks 33.39 0.36%
SRF 33.06 0.35%
The Federal Bank 32.55 0.35%
Kaveri Seed Company 31.33 0.33%
Tata Motors 30.80 0.33%
Apollo Tyres 30.79 0.33%
MRF 29.81 0.32%
Adani Ports & Special Economic Zone 29.63 0.32%
State Bank of India 26.08 0.28%
Finolex Industries 25.07 0.27%
The Jammu & Kashmir Bank 23.30 0.25%
Oil & Natural Gas Corp 20.99 0.22%
Hindustan Zinc 16.70 0.18%
Hindustan Dorr-Oliver 9.38 0.10%
Arvind Infrastructure Ltd 0.92 0.01%
7.88% GOVT OF INDIA RED 19-03-2030 1,048.14 11.20% SOVEREIGN
7.95% GOVT OF INDIA RED 28-08-2032 996.40 10.65% SOVEREIGN
8.24% GOVT OF INDIA RED 10-11-2033 958.95 10.25% SOVEREIGN
8.40% GOVT OF INDIA RED 28-07-2024 508.38 5.43% SOVEREIGN
8.17% GOVT OF INDIA RED 01-12-2044 486.71 5.20% SOVEREIGN
8.60% GOVT OF INDIA RED 02-06-2028 290.68 3.11% SOVEREIGN
7.68% GOVT OF INDIA RED 15-12-2023 168.10 1.80% SOVEREIGN
7.72% GOVT OF INDIA RED 25-05-2025 50.26 0.54% SOVEREIGN
IssuerMarket Value
( in Lacs)`
% to NetAssets
Dividend DeclarationRecord Date / periodof dividend declared
Dividend ( per unit)Non-Institutional
` Dividend ( per unit)Institutional
` NAV ( ) per unit(cum dividend)
`
HSBC MIP - Regular Plan - Monthly Dividend
HSBC MIP - Regular Plan - Monthly Dividend - Direct Plan
HSBC MIP - Regular Plan - Quarterly Dividend
25-Aug-15 0.05778 0.05353 11.7746
28-Sep-15 0.05778 0.05353 11.7826
25-Mar-15 0.18147 0.16829 12.4116
25-Jun-15 0.18057 0.16729 12.1560
26-Oct-15 0.05778 0.05353 11.8929
31-Jan-14 0.05065 0.04851 10.9791
28-Feb-14 0.05065 0.04851 11.0079
28-Sep-15 0.18057 0.16729 12.1257
Rating24-Feb-04
CRISIL MIP Blended Index
25.0545
9.54 years
5.35 years
9,417.19
Aditya Khemani
(for Equity portion) SanjayShah (for Debt portion)
Available
10,000
10,000
25,000
1,000 p.m.
Nil
`
`
`
`
`
Rating Profile
Sovereign 48.18%
AAAand equivalents 33.98%
Equity 14.00%
Net CurrentAssets 2.78%
Reverse Repos/ CBLOs 1.06%
Total NetAssets 100.00%
Upon payment of dividend, the NAV per unit falls to the extent of payout and statutory levy, if any.Face value: 10 per unit.`
Investors understand that their principalwill be at Moderate risk
Riskometer
Mod
erately Moderate
Low
Hig
h
Low
High
LOW HIGH
Moderately
This product is suitable forinvestors who are seeking*:
• Regular Income over mediumterm
• Investment in fixed income(debt and money marketinstruments) as well as equityand equity related securities
HSBC MIP - Regular Plan (HMIP-R)
* Investors should consult their financial advisers if in doubt aboutwhether the product is suitable for them.
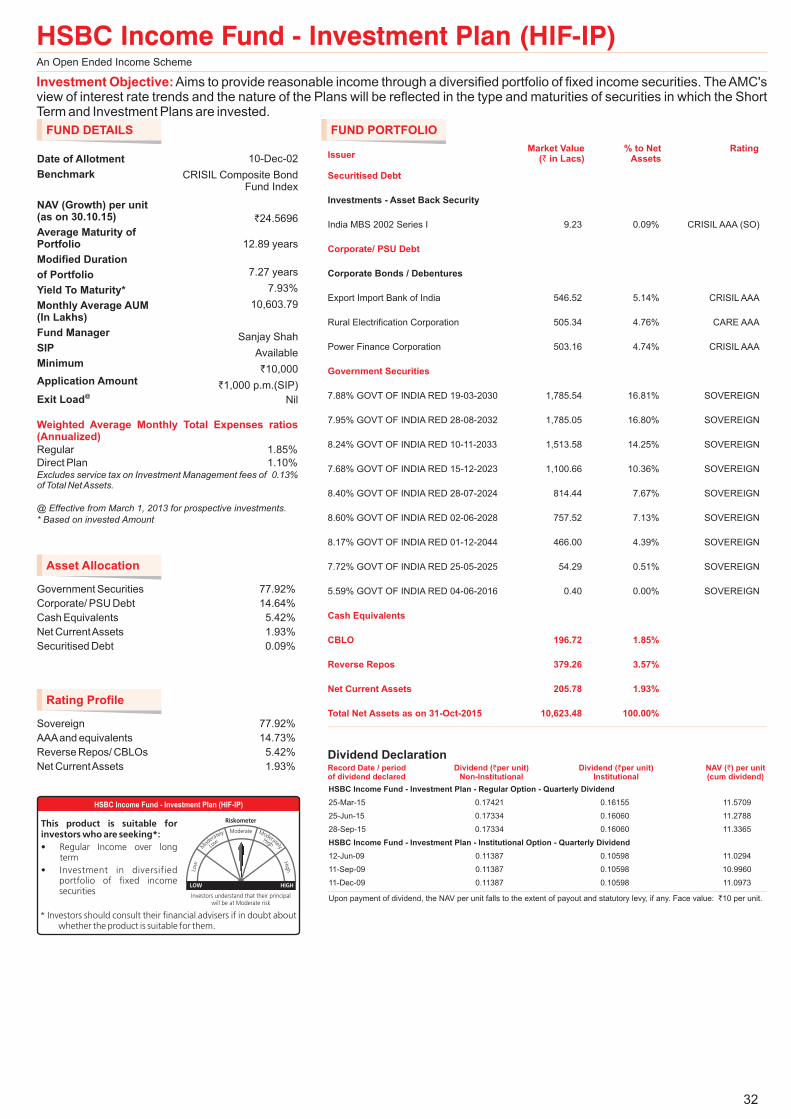
This product is suitable for investors who are seeking*:
�
�
�
Overnight liquidity over short term
Investment in Money Market Instruments
Low riskLOW RISK
(BLUE)
Note: Risk is represented as -
*Investors should consult their financial advisers if in doubt whether the product issuitable for them
HSBC Income Fund - Investment Plan (HIF-IP)An Open Ended Income Scheme
Investment Objective: Aims to provide reasonable income through a diversified portfolio of fixed income securities. The AMC'sview of interest rate trends and the nature of the Plans will be reflected in the type and maturities of securities in which the ShortTerm and Investment Plans are invested.
32
FUND DETAILS
Date of Allotment
Benchmark
NAV (Growth)(as on 30.10.15)
Average Maturity ofPortfolio
Modified Duration
of Portfolio
Yield To Maturity*
Fund Manager
SIP
Minimum
Application Amount
Exit Load
per unit
Monthly Average AUM(In Lakhs)
@
Weighted Average Monthly Total Expenses ratios(Annualized)
Regular 1.85%
Direct Plan 1.10%Excludes service tax on Investment Management fees of 0.13%of Total NetAssets.
Asset Allocation
Government Securities 77.92%
Corporate/ PSU Debt 14.64%
Cash Equivalents 5.42%
Net CurrentAssets 1.93%
Securitised Debt 0.09%
@ Effective from March 1, 2013 for prospective investments.
* Based on invested Amount
FUND PORTFOLIO
Securitised Debt
Corporate/ PSU Debt
Government Securities
Cash Equivalents
CBLO 196.72 1.85%
Reverse Repos 379.26 3.57%
Net Current Assets 205.78 1.93%
Total Net Assets as on 31-Oct-2015 10,623.48 100.00%
Investments - Asset Back Security
Corporate Bonds / Debentures
India MBS 2002 Series I 9.23 0.09% CRISIL AAA (SO)
Export Import Bank of India 546.52 5.14% CRISIL AAA
Rural Electrification Corporation 505.34 4.76% CARE AAA
Power Finance Corporation 503.16 4.74% CRISIL AAA
7.88% GOVT OF INDIA RED 19-03-2030 1,785.54 16.81% SOVEREIGN
7.95% GOVT OF INDIA RED 28-08-2032 1,785.05 16.80% SOVEREIGN
8.24% GOVT OF INDIA RED 10-11-2033 1,513.58 14.25% SOVEREIGN
7.68% GOVT OF INDIA RED 15-12-2023 1,100.66 10.36% SOVEREIGN
8.40% GOVT OF INDIA RED 28-07-2024 814.44 7.67% SOVEREIGN
8.60% GOVT OF INDIA RED 02-06-2028 757.52 7.13% SOVEREIGN
8.17% GOVT OF INDIA RED 01-12-2044 466.00 4.39% SOVEREIGN
7.72% GOVT OF INDIA RED 25-05-2025 54.29 0.51% SOVEREIGN
5.59% GOVT OF INDIA RED 04-06-2016 0.40 0.00% SOVEREIGN
IssuerMarket Value
( in Lacs)`
% to NetAssets
Rating10-Dec-02
CRISIL Composite BondFund Index
24.5696
12.89 years
7.27 years
7.93%
10,603.79
Sanjay Shah
Available
10,000
1,000 p.m.(SIP)
Nil
`
`
`
Rating Profile
Sovereign 77.92%
AAAand equivalents 14.73%
Reverse Repos/ CBLOs 5.42%
Net CurrentAssets 1.93%Dividend DeclarationRecord Date / periodof dividend declared
Dividend ( per unit)Non-Institutional
` Dividend ( per unit)Institutional
` NAV ( ) per unit(cum dividend)
`
HSBC Income Fund - Investment Plan - Regular Option - Quarterly Dividend
HSBC Income Fund - Investment Plan - Institutional Option - Quarterly Dividend
25-Mar-15 0.17421 0.16155 11.5709
25-Jun-15 0.17334 0.16060 11.2788
28-Sep-15 0.17334 0.16060 11.3365
12-Jun-09 0.11387 0.10598 11.0294
11-Sep-09 0.11387 0.10598 10.9960
11-Dec-09 0.11387 0.10598 11.0973
Upon payment of dividend, the NAV per unit falls to the extent of payout and statutory levy, if any. Face value: 10 per unit.`Investors understand that their principal
will be at Moderate risk
Riskometer
Mod
erately Moderate
Low
Hig
h
Low
High
LOW HIGH
Moderately
This product is suitable forinvestors who are seeking*:
• Regular Income over longterm
• Investment in diversifiedportfolio of fixed incomesecurities
HSBC Income Fund - Investment Plan (HIF-IP)
* Investors should consult their financial advisers if in doubt aboutwhether the product is suitable for them.
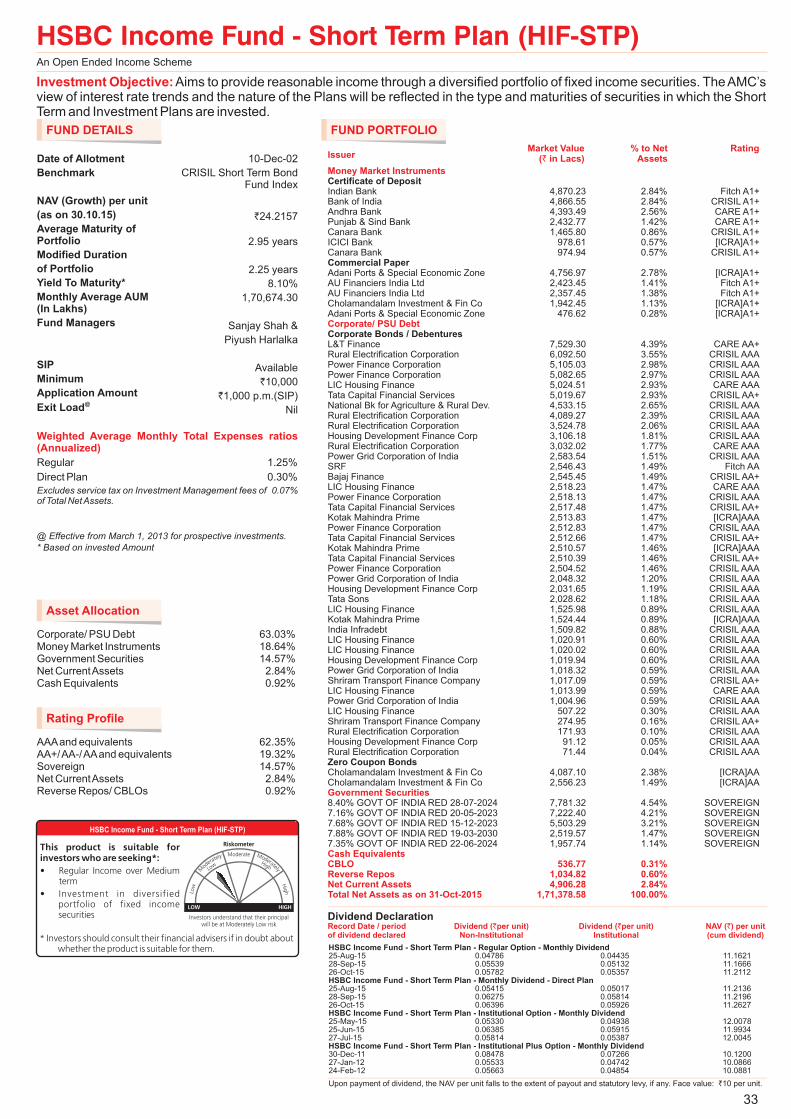
HSBC Income Fund - Short Term Plan (HIF-STP)An Open Ended Income Scheme
Investment Objective:Aims to provide reasonable income through a diversified portfolio of fixed income securities. TheAMC’sview of interest rate trends and the nature of the Plans will be reflected in the type and maturities of securities in which the ShortTerm and Investment Plans are invested.
33
FUND DETAILS
Date of Allotment
Benchmark
NAV (Growth)
(as on 30.10.15)
Average Maturity ofPortfolio
Modified Duration
of Portfolio
Yield To Maturity*
Fund Managers
SIP
Minimum
Application Amount
Exit Load
per unit
Monthly Average AUM(In Lakhs)
@
Weighted Average Monthly Total Expenses ratios(Annualized)
Regular 1.25%
Direct Plan 0.30%
Excludes service tax on Investment Management fees of 0.07%of Total NetAssets.
Asset Allocation
Corporate/ PSU Debt 63.03%Money Market Instruments 18.64%Government Securities 14.57%Net CurrentAssets 2.84%Cash Equivalents 0.92%
@ Effective from March 1, 2013 for prospective investments.
* Based on invested Amount
FUND PORTFOLIO
Money Market Instruments
Corporate/ PSU Debt
Government Securities
Cash EquivalentsCBLO 536.77 0.31%Reverse Repos 1,034.82 0.60%Net Current Assets 4,906.28 2.84%Total Net Assets as on 31-Oct-2015 1,71,378.58 100.00%
Indian Bank 4,870.23 2.84% Fitch A1+Bank of India 4,866.55 2.84% CRISIL A1+Andhra Bank 4,393.49 2.56% CARE A1+Punjab & Sind Bank 2,432.77 1.42% CARE A1+Canara Bank 1,465.80 0.86% CRISIL A1+ICICI Bank 978.61 0.57% [ICRA]A1+Canara Bank 974.94 0.57% CRISIL A1+
Adani Ports & Special Economic Zone 4,756.97 2.78% [ICRA]A1+AU Financiers India Ltd 2,423.45 1.41% Fitch A1+AU Financiers India Ltd 2,357.45 1.38% Fitch A1+Cholamandalam Investment & Fin Co 1,942.45 1.13% [ICRA]A1+Adani Ports & Special Economic Zone 476.62 0.28% [ICRA]A1+
L&T Finance 7,529.30 4.39% CARE AA+Rural Electrification Corporation 6,092.50 3.55% CRISIL AAAPower Finance Corporation 5,105.03 2.98% CRISIL AAAPower Finance Corporation 5,082.65 2.97% CRISIL AAALIC Housing Finance 5,024.51 2.93% CARE AAATata Capital Financial Services 5,019.67 2.93% CRISIL AA+National Bk for Agriculture & Rural Dev. 4,533.15 2.65% CRISIL AAARural Electrification Corporation 4,089.27 2.39% CRISIL AAARural Electrification Corporation 3,524.78 2.06% CRISIL AAAHousing Development Finance Corp 3,106.18 1.81% CRISIL AAARural Electrification Corporation 3,032.02 1.77% CARE AAAPower Grid Corporation of India 2,583.54 1.51% CRISIL AAASRF 2,546.43 1.49% Fitch AABajaj Finance 2,545.45 1.49% CRISIL AA+LIC Housing Finance 2,518.23 1.47% CARE AAAPower Finance Corporation 2,518.13 1.47% CRISIL AAATata Capital Financial Services 2,517.48 1.47% CRISIL AA+Kotak Mahindra Prime 2,513.83 1.47% [ICRA]AAAPower Finance Corporation 2,512.83 1.47% CRISIL AAATata Capital Financial Services 2,512.66 1.47% CRISIL AA+Kotak Mahindra Prime 2,510.57 1.46% [ICRA]AAATata Capital Financial Services 2,510.39 1.46% CRISIL AA+Power Finance Corporation 2,504.52 1.46% CRISIL AAAPower Grid Corporation of India 2,048.32 1.20% CRISIL AAAHousing Development Finance Corp 2,031.65 1.19% CRISIL AAATata Sons 2,028.62 1.18% CRISIL AAALIC Housing Finance 1,525.98 0.89% CRISIL AAAKotak Mahindra Prime 1,524.44 0.89% [ICRA]AAAIndia Infradebt 1,509.82 0.88% CRISIL AAALIC Housing Finance 1,020.91 0.60% CRISIL AAALIC Housing Finance 1,020.02 0.60% CRISIL AAAHousing Development Finance Corp 1,019.94 0.60% CRISIL AAAPower Grid Corporation of India 1,018.32 0.59% CRISIL AAAShriram Transport Finance Company 1,017.09 0.59% CRISIL AA+LIC Housing Finance 1,013.99 0.59% CARE AAAPower Grid Corporation of India 1,004.96 0.59% CRISIL AAALIC Housing Finance 507.22 0.30% CRISIL AAAShriram Transport Finance Company 274.95 0.16% CRISIL AA+Rural Electrification Corporation 171.93 0.10% CRISIL AAAHousing Development Finance Corp 91.12 0.05% CRISIL AAARural Electrification Corporation 71.44 0.04% CRISIL AAA
Cholamandalam Investment & Fin Co 4,087.10 2.38% [ICRA]AACholamandalam Investment & Fin Co 2,556.23 1.49% [ICRA]AA
8.40% GOVT OF INDIA RED 28-07-2024 7,781.32 4.54% SOVEREIGN7.16% GOVT OF INDIA RED 20-05-2023 7,222.40 4.21% SOVEREIGN7.68% GOVT OF INDIA RED 15-12-2023 5,503.29 3.21% SOVEREIGN7.88% GOVT OF INDIA RED 19-03-2030 2,519.57 1.47% SOVEREIGN7.35% GOVT OF INDIA RED 22-06-2024 1,957.74 1.14% SOVEREIGN
Certificate of Deposit
Commercial Paper
Corporate Bonds / Debentures
Zero Coupon Bonds
IssuerMarket Value
( in Lacs)`
% to NetAssets
Rating10-Dec-02
CRISIL Short Term BondFund Index
24.2157
2.95 years
2.25 years
8.10%
1,70,674.30
Sanjay Shah &
Piyush Harlalka
Available
10,000
1,000 p.m.(SIP)
Nil
`
`
`
Rating Profile
AAAand equivalents 62.35%AA+/AA-/AAand equivalents 19.32%Sovereign 14.57%Net CurrentAssets 2.84%Reverse Repos/ CBLOs 0.92%
Dividend DeclarationRecord Date / periodof dividend declared
Dividend ( per unit)Non-Institutional
` Dividend ( per unit)Institutional
` NAV ( ) per unit(cum dividend)
`
HSBC Income Fund - Short Term Plan - Regular Option - Monthly Dividend
HSBC Income Fund - Short Term Plan - Monthly Dividend - Direct Plan
HSBC Income Fund - Short Term Plan - Institutional Option - Monthly Dividend
HSBC Income Fund - Short Term Plan - Institutional Plus Option - Monthly Dividend
25-Aug-15 0.04786 0.04435 11.162128-Sep-15 0.05539 0.05132 11.1666
25-Aug-15 0.05415 0.05017 11.213628-Sep-15 0.06275 0.05814 11.2196
25-May-15 0.05330 0.04938 12.007825-Jun-15 0.06385 0.05915 11.9934
26-Oct-15 0.05782 0.05357 11.2112
26-Oct-15 0.06396 0.05926 11.2627
27-Jul-15 0.05814 0.05387 12.0045
30-Dec-11 0.08478 0.07266 10.120027-Jan-12 0.05533 0.04742 10.086624-Feb-12 0.05663 0.04854 10.0881
Upon payment of dividend, the NAV per unit falls to the extent of payout and statutory levy, if any. Face value: 10 per unit.`
Investors understand that their principalwill be at Moderately Low risk
Riskometer
Mod
erately Moderate
Low
Hig
h
Low
High
LOW HIGH
Moderately
This product is suitable forinvestors who are seeking*:
• Regular Income over Mediumterm
• Investment in diversifiedportfolio of fixed incomesecurities
HSBC Income Fund - Short Term Plan (HIF-STP)
* Investors should consult their financial advisers if in doubt aboutwhether the product is suitable for them.

HSBC Floating Rate Fund - Long Term Plan (HFRF-LTP)An Open Ended Income Scheme
Investment Objective: Seeks to generate a reasonable return with commensurate risk through investments in floating rate debtinstruments and fixed rate debt instruments swapped for floating rate returns. The Scheme may also invest in fixed rate moneymarket and debt instruments.
34
FUND DETAILS
Date of Allotment
Benchmark
NAV (Growth)(as on 30.10.15)
Average Maturity ofPortfolio
Modified Duration ofPortfolio
Yield To Maturity*
Fund Managers
SIP
Minimum
Application Amount
Sub Options
Exit Load
per unit
Monthly Average AUM(In Lakhs)
@
Weighted Average Monthly Total Expenses ratios(Annualized)
Regular 0.75%
Direct Plan 0.20%
Excludes service tax on Investment Management fees of 0.01%of Total NetAssets.
Asset Allocation
Money Market Instruments 58.85%Cash Equivalents 41.31%Net CurrentAssets -0.16%
@ Effective from March 1, 2013 for prospective investments.
* Based on invested Amount
FUND PORTFOLIO
Money Market Instruments
Cash Equivalents
CBLO 851.13 14.11%
Reverse Repos 1,640.85 27.20%
Net Current Assets -9.57 -0.16%
Total Net Assets as on 31-Oct-2015 6,033.06 100.00%
Certificate of Deposit
Commercial Paper
UCO Bank 730.29 12.10% CRISIL A1+
Indian Bank 681.83 11.30% Fitch A1+
Canara Bank 681.79 11.30% CRISIL A1+
Edelweiss Financial Services 494.51 8.20% CRISIL A1+
Cholamandalam Investment & Fin Co 485.61 8.05% [ICRA]A1+
Adani Ports & Special Economic Zone 476.62 7.90% [ICRA]A1+
IssuerMarket Value
( in Lacs)`
% to NetAssets
Rating16-Nov-04
CRISIL Liquid Fund Index
22.8047
0.22 years
0.22 years
7.32%
5,870.16
Kapil Punjabi &
Piyush Harlalka
Available
10,000
1,000 p.m.(SIP)
Growth, Daily Dividend,Reinvestment Weekly
Dividend, Reinvestment,Monthly Dividend (Payout &
Reinvestment)
Nil
`
`
`
Rating Profile
AAAand equivalents 58.85%Reverse Repos/ CBLOs 41.31%Net CurrentAssets -0.16%
Dividend DeclarationRecord Date / periodof dividend declared
Dividend ( per unit)Non-Institutional
` Dividend ( per unit)Institutional
` NAV ( ) per unit(cum dividend)
`
HSBC Floating Rate Fund - Long Term Plan - Regular Option - Monthly Dividend
HSBC Floating Rate Fund - Long Term Plan - Monthly Dividend - Direct Plan
HSBC Floating Rate Fund - Long Term Plan - Institutional Option - Monthly Dividend
25-Aug-15 0.04279 0.03965 10.0593
28-Sep-15 0.04124 0.03821 10.0571
25-Aug-15 0.05085 0.04711 10.0759
28-Sep-15 0.04861 0.04503 10.0729
26-Oct-15 0.04037 0.03740 10.0559
26-Oct-15 0.04659 0.04316 10.0700
25-Apr-14 0.05133 0.04916 10.5356
25-Aug-14 0.06294 0.06028 10.7639
25-Sep-14 0.17600 0.16856 10.7615
Upon payment of dividend, the NAV per unit falls to the extent of payout and statutory levy, if any. Face value: 10 per unit.`
Investors understand that their principalwill be at Moderately Low risk
Riskometer
Modera
tely Moderate
Low
Hig
h
Low
High
LOW HIGH
Moderately
This product is suitable forinvestors who are seeking*:
• Liquidity over short term
• Investment in floating rate andfixed rate Debt and MoneyMarket Instruments
HSBC Floating Rate Fund - Long Term Plan (HFRF-LTP)
* Investors should consult their financial advisers if in doubt aboutwhether the product is suitable for them.
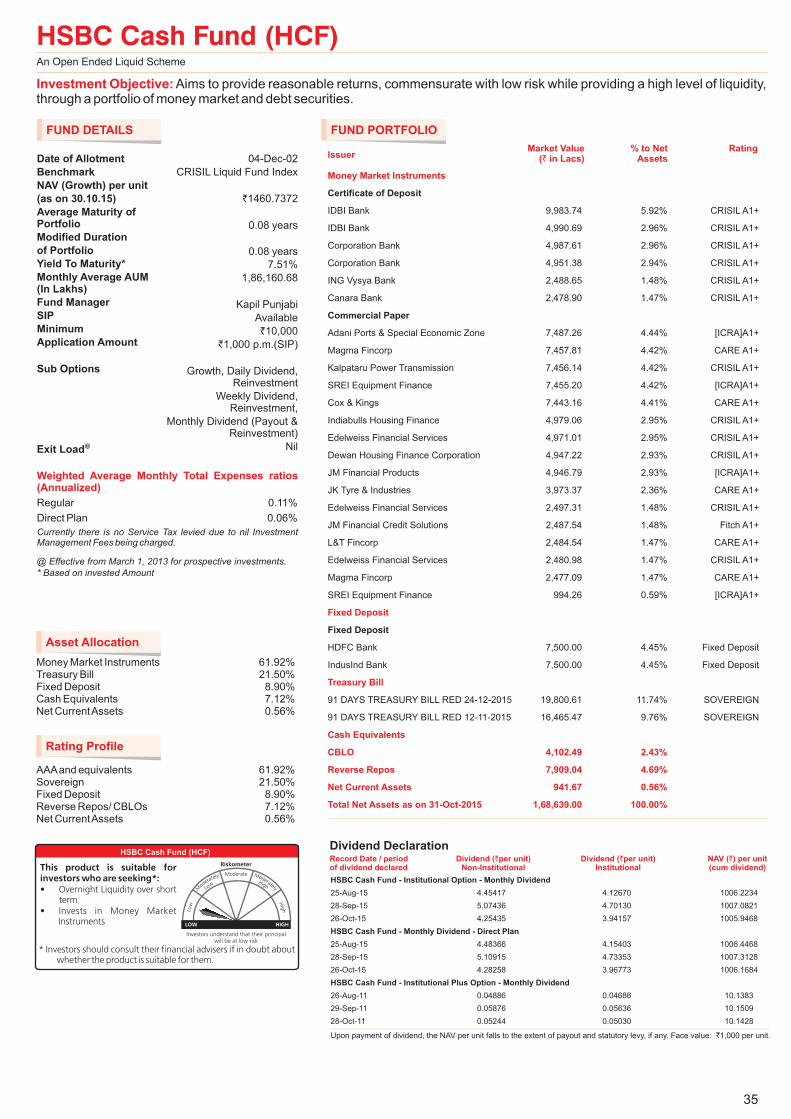
This product is suitable for investors who are seeking*:
�
�
�
Overnight liquidity over short term
Investment in Money Market Instruments
Low riskLOW RISK
(BLUE)
Note: Risk is represented as -
*Investors should consult their financial advisers if in doubt whether the product issuitable for them
HSBC Cash Fund (HCF)An Open Ended Liquid Scheme
Investment Objective: Aims to provide reasonable returns, commensurate with low risk while providing a high level of liquidity,through a portfolio of money market and debt securities.
FUND DETAILS
Date of Allotment
Benchmark
NAV (Growth)
(as on 30.10.15)
Average Maturity ofPortfolio
Modified Duration
of Portfolio
Yield To Maturity*
Fund Manager
SIP
Minimum
Application Amount
Sub Options
Exit Load
per unit
Monthly Average AUM(In Lakhs)
@
Asset Allocation
Money Market Instruments 61.92%Treasury Bill 21.50%Fixed Deposit 8.90%Cash Equivalents 7.12%Net CurrentAssets 0.56%
@ Effective from March 1, 2013 for prospective investments.
* Based on invested Amount
FUND PORTFOLIO
Money Market Instruments
Fixed Deposit
Treasury Bill
Cash Equivalents
CBLO 4,102.49 2.43%
Reverse Repos 7,909.04 4.69%
Net Current Assets 941.67 0.56%
Total Net Assets as on 31-Oct-2015 1,68,639.00 100.00%
IDBI Bank 9,983.74 5.92% CRISIL A1+
IDBI Bank 4,990.69 2.96% CRISIL A1+
Corporation Bank 4,987.61 2.96% CRISIL A1+
Corporation Bank 4,951.38 2.94% CRISIL A1+
ING Vysya Bank 2,488.65 1.48% CRISIL A1+
Canara Bank 2,478.90 1.47% CRISIL A1+
Adani Ports & Special Economic Zone 7,487.26 4.44% [ICRA]A1+
Magma Fincorp 7,457.81 4.42% CARE A1+
Kalpataru Power Transmission 7,456.14 4.42% CRISIL A1+
SREI Equipment Finance 7,455.20 4.42% [ICRA]A1+
Cox & Kings 7,443.16 4.41% CARE A1+
Indiabulls Housing Finance 4,979.06 2.95% CRISIL A1+
Edelweiss Financial Services 4,971.01 2.95% CRISIL A1+
Dewan Housing Finance Corporation 4,947.22 2.93% CRISIL A1+
JM Financial Products 4,946.79 2.93% [ICRA]A1+
JK Tyre & Industries 3,973.37 2.36% CARE A1+
Edelweiss Financial Services 2,497.31 1.48% CRISIL A1+
JM Financial Credit Solutions 2,487.54 1.48% Fitch A1+
L&T Fincorp 2,484.54 1.47% CARE A1+
Edelweiss Financial Services 2,480.98 1.47% CRISIL A1+
Magma Fincorp 2,477.09 1.47% CARE A1+
SREI Equipment Finance 994.26 0.59% [ICRA]A1+
HDFC Bank 7,500.00 4.45% Fixed Deposit
IndusInd Bank 7,500.00 4.45% Fixed Deposit
91 DAYS TREASURY BILL RED 24-12-2015 19,800.61 11.74% SOVEREIGN
91 DAYS TREASURY BILL RED 12-11-2015 16,465.47 9.76% SOVEREIGN
Certificate of Deposit
Commercial Paper
Fixed Deposit
IssuerMarket Value
( in Lacs)`
% to NetAssets
Rating04-Dec-02
CRISIL Liquid Fund Index
1460.7372
0.08 years
0.08 years
7.51%
1,86,160.68
Kapil Punjabi
Available
10,000
1,000 p.m.(SIP)
Growth, Daily Dividend,Reinvestment
Weekly Dividend,Reinvestment,
Monthly Dividend (Payout &Reinvestment)
Nil
`
`
`
Rating Profile
AAAand equivalents 61.92%Sovereign 21.50%Fixed Deposit 8.90%Reverse Repos/ CBLOs 7.12%Net CurrentAssets 0.56%
Dividend DeclarationRecord Date / periodof dividend declared
Dividend ( per unit)Non-Institutional
` Dividend ( per unit)Institutional
` NAV ( ) per unit(cum dividend)
`
HSBC Cash Fund - Institutional Option - Monthly Dividend
HSBC Cash Fund - Monthly Dividend - Direct Plan
HSBC Cash Fund - Institutional Plus Option - Monthly Dividend
25-Aug-15 4.45417 4.12670 1006.2234
28-Sep-15 5.07436 4.70130 1007.0821
25-Aug-15 4.48366 4.15403 1006.4468
28-Sep-15 5.10915 4.73353 1007.3128
26-Oct-15 4.25435 3.94157 1005.9468
26-Oct-15 4.28258 3.96773 1006.1684
26-Aug-11 0.04886 0.04686 10.1383
29-Sep-11 0.05876 0.05636 10.1509
28-Oct-11 0.05244 0.05030 10.1428
Upon payment of dividend, the NAV per unit falls to the extent of payout and statutory levy, if any. Face value: 1,000 per unit.`
Weighted Average Monthly Total Expenses ratios(Annualized)
Regular 0.11%
Direct Plan 0.06%
Currently there is no Service Tax levied due to nil InvestmentManagement Fees being charged.
Investors understand that their principalwill be at low risk
Riskometer
M
oderately Moderate
Low
Hig
h
Low
High
LOW HIGH
Moderately
This product is suitable forinvestors who are seeking*:• Overnight Liquidity over short
term• Invests in Money Market
Instruments
HSBC Cash Fund (HCF)
35
* Investors should consult their financial advisers if in doubt aboutwhether the product is suitable for them.

This product is suitable for investors who are seeking*:
�
�
�
Overnight liquidity over short term
Investment in Money Market Instruments
Low riskLOW RISK
(BLUE)
Note: Risk is represented as -
*Investors should consult their financial advisers if in doubt whether the product issuitable for them
HSBC Gilt Fund (HGF)An Open Ended Gilt Scheme
Investment Objective: Aims to generate reasonable returns through investments in Government Securities of variousmaturities. The AMC's view of interest rate trends and the nature of the plans will be reflected in the maturities of securities inwhich the Plans are invested.
36
FUND DETAILS
Date of Allotment
Benchmark
NAV (Growth)(as on 30.10.15)
Average Maturity ofPortfolio
Modified Durationof Portfolio
Yield To Maturity*
Fund Managers
SIP
Minimum
Application Amount
Exit Load
per unit
Monthly Average AUM(In Lakhs)
@
Asset Allocation
Government Securities 86.32%
Cash Equivalents 11.63%
Net CurrentAssets 2.05%
@ Effective from March 1, 2013 for prospective investments.
* Based on invested Amount
FUND PORTFOLIO
Government Securities
Cash Equivalents
CBLO 11.24 3.97%
Reverse Repos 21.67 7.66%
Net Current Assets 5.79 2.05%
Total Net Assets as on 31-Oct-2015 283.04 100.00%
7.88% GOVT OF INDIA RED 19-03-2030 70.55 24.92% SOVEREIGN
8.24% GOVT OF INDIA RED 10-11-2033 57.02 20.14% SOVEREIGN
8.17% GOVT OF INDIA RED 01-12-2044 51.78 18.29% SOVEREIGN
7.95% GOVT OF INDIA RED 28-08-2032 47.40 16.75% SOVEREIGN
8.60% GOVT OF INDIA RED 02-06-2028 17.60 6.22% SOVEREIGN
IssuerMarket Value
( in Lacs)`
% to NetAssets
Rating05-Dec-03
I-Sec Composite Index
18.5387
16.48 years
8.16 years
7.87%
283.18
Sanjay Shah
Available
10,000
1,000 p.m.(SIP)
Nil
`
`
`
Rating Profile
Sovereign 86.32%
Reverse Repos/ CBLOs 11.63%
Net CurrentAssets 2.05%
Dividend DeclarationRecord Date / periodof dividend declared
Dividend ( per unit)Non-Institutional
` Dividend ( per unit)Institutional
` NAV ( ) per unit(cum dividend)
`
HSBC Gilt Fund - Monthly Dividend
31-Oct-08 0.06136 0.05711 10.8077
28-Nov-08 0.04193 0.03903 10.7855
26-Dec-08 0.03400 0.03164 10.7764
Upon payment of dividend, the NAV per unit falls to the extent of payout and statutory levy, if any. Face value: 10 per unit.`
Weighted Average Monthly Total Expenses ratios(Annualized)
Regular 1.00%
Direct Plan 0.50%
Excludes service tax on Investment Management fees of 0.04%of Total NetAssets.
Investors understand that their principalwill be at Moderate risk
Riskometer
Mod
erately Moderate
Low
Hig
h
Low
High
LOW HIGH
Moderately
This product is suitable forinvestors who are seeking*:
• Regular Income over longterm
• Investment in GovernmentSecurities
HSBC Gilt Fund (HGF)
* Investors should consult their financial advisers if in doubt aboutwhether the product is suitable for them.
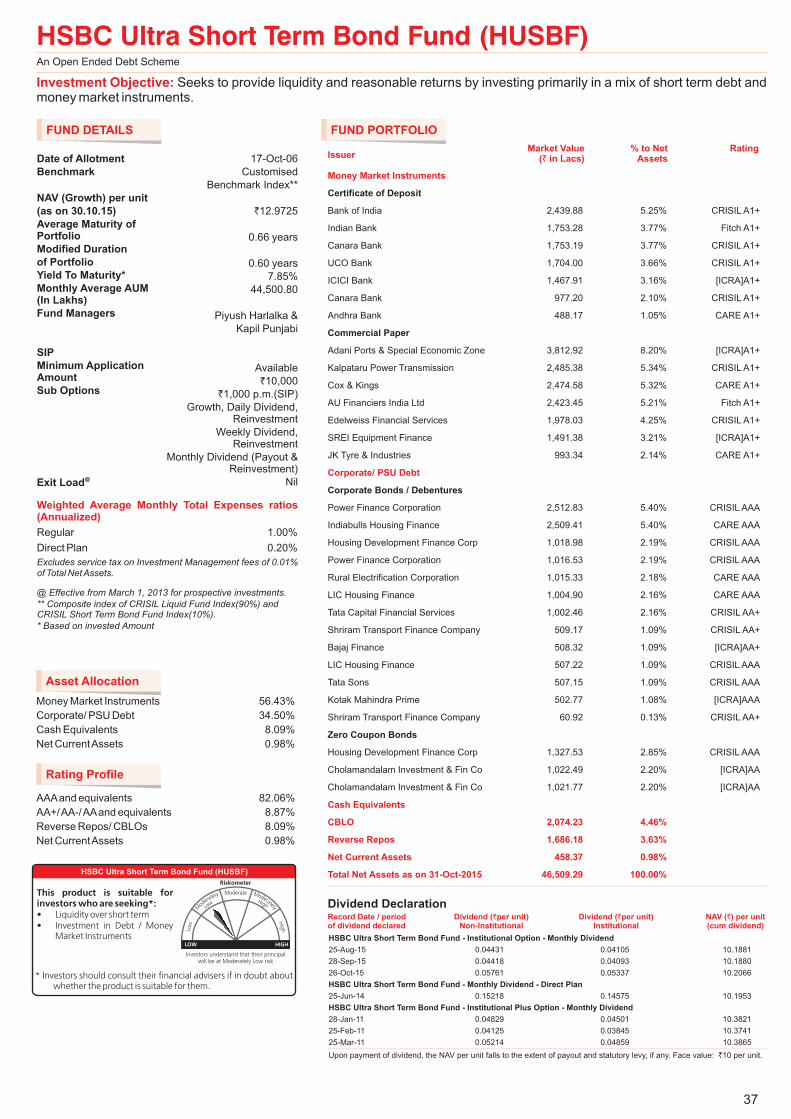
This product is suitable for investors who are seeking*:
�
�
�
Overnight liquidity over short term
Investment in Money Market Instruments
Low riskLOW RISK
(BLUE)
Note: Risk is represented as -
*Investors should consult their financial advisers if in doubt whether the product issuitable for them
HSBC Ultra Short Term Bond Fund (HUSBF)An Open Ended Debt Scheme
Investment Objective: Seeks to provide liquidity and reasonable returns by investing primarily in a mix of short term debt andmoney market instruments.
37
FUND DETAILS
Date of Allotment
Benchmark
NAV (Growth)
(as on 30.10.15)
Average Maturity ofPortfolio
Modified Duration
of Portfolio
Yield To Maturity*
Fund Managers
SIP
Minimum ApplicationAmount
Sub Options
Exit Load
per unit
Monthly Average AUM(In Lakhs)
@
Asset Allocation
Money Market Instruments 56.43%
Corporate/ PSU Debt 34.50%
Cash Equivalents 8.09%
Net CurrentAssets 0.98%
@ Effective from March 1, 2013 for prospective investments.
** Composite index of CRISIL Liquid Fund Index(90%) andCRISIL Short Term Bond Fund Index(10%).
* Based on invested Amount
FUND PORTFOLIO
Money Market Instruments
Corporate/ PSU Debt
Cash Equivalents
CBLO 2,074.23 4.46%
Reverse Repos 1,686.18 3.63%
Net Current Assets 458.37 0.98%
Total Net Assets as on 31-Oct-2015 46,509.29 100.00%
Bank of India 2,439.88 5.25% CRISIL A1+
Indian Bank 1,753.28 3.77% Fitch A1+
Canara Bank 1,753.19 3.77% CRISIL A1+
UCO Bank 1,704.00 3.66% CRISIL A1+
ICICI Bank 1,467.91 3.16% [ICRA]A1+
Canara Bank 977.20 2.10% CRISIL A1+
Andhra Bank 488.17 1.05% CARE A1+
Adani Ports & Special Economic Zone 3,812.92 8.20% [ICRA]A1+
Kalpataru Power Transmission 2,485.38 5.34% CRISIL A1+
Cox & Kings 2,474.58 5.32% CARE A1+
AU Financiers India Ltd 2,423.45 5.21% Fitch A1+
Edelweiss Financial Services 1,978.03 4.25% CRISIL A1+
SREI Equipment Finance 1,491.38 3.21% [ICRA]A1+
JK Tyre & Industries 993.34 2.14% CARE A1+
Power Finance Corporation 2,512.83 5.40% CRISIL AAA
Indiabulls Housing Finance 2,509.41 5.40% CARE AAA
Housing Development Finance Corp 1,018.98 2.19% CRISIL AAA
Power Finance Corporation 1,016.53 2.19% CRISIL AAA
Rural Electrification Corporation 1,015.33 2.18% CARE AAA
LIC Housing Finance 1,004.90 2.16% CARE AAA
Tata Capital Financial Services 1,002.46 2.16% CRISIL AA+
Shriram Transport Finance Company 509.17 1.09% CRISIL AA+
Bajaj Finance 508.32 1.09% [ICRA]AA+
LIC Housing Finance 507.22 1.09% CRISIL AAA
Tata Sons 507.15 1.09% CRISIL AAA
Kotak Mahindra Prime 502.77 1.08% [ICRA]AAA
Shriram Transport Finance Company 60.92 0.13% CRISIL AA+
Housing Development Finance Corp 1,327.53 2.85% CRISIL AAA
Cholamandalam Investment & Fin Co 1,022.49 2.20% [ICRA]AA
Cholamandalam Investment & Fin Co 1,021.77 2.20% [ICRA]AA
Certificate of Deposit
Commercial Paper
Corporate Bonds / Debentures
Zero Coupon Bonds
IssuerMarket Value
( in Lacs)`
% to NetAssets
Rating17-Oct-06
Customised
Benchmark Index**
12.9725
0.66 years
0.60 years
7.85%
44,500.80
Piyush Harlalka &
Kapil Punjabi
Available
10,000
1,000 p.m.(SIP)
Growth, Daily Dividend,Reinvestment
Weekly Dividend,Reinvestment
Monthly Dividend (Payout &Reinvestment)
Nil
`
`
`
Rating Profile
AAAand equivalents 82.06%
AA+/AA-/AAand equivalents 8.87%
Reverse Repos/ CBLOs 8.09%
Net CurrentAssets 0.98%
Dividend DeclarationRecord Date / periodof dividend declared
Dividend ( per unit)Non-Institutional
` Dividend ( per unit)Institutional
` NAV ( ) per unit(cum dividend)
`
HSBC Ultra Short Term Bond Fund - Institutional Option - Monthly Dividend
HSBC Ultra Short Term Bond Fund - Monthly Dividend - Direct Plan
HSBC Ultra Short Term Bond Fund - Institutional Plus Option - Monthly Dividend
25-Aug-15 0.04431 0.04105 10.1881
28-Sep-15 0.04418 0.04093 10.1880
26-Oct-15 0.05761 0.05337 10.2066
25-Jun-14 0.15218 0.14575 10.1953
28-Jan-11 0.04829 0.04501 10.3821
25-Feb-11 0.04125 0.03845 10.3741
25-Mar-11 0.05214 0.04859 10.3865
Upon payment of dividend, the NAV per unit falls to the extent of payout and statutory levy, if any. Face value: 10 per unit.`
Weighted Average Monthly Total Expenses ratios(Annualized)
Regular 1.00%
Direct Plan 0.20%
Excludes service tax on Investment Management fees of 0.01%of Total NetAssets.
Investors understand that their principalwill be at Moderately Low risk
Riskometer
Modera
tely Moderate
Low
Hig
h
Low
High
LOW HIGH
Moderately
This product is suitable forinvestors who are seeking*:• Liquidity over short term• Investment in Debt / Money
Market Instruments
HSBC Ultra Short Term Bond Fund (HUSBF)
* Investors should consult their financial advisers if in doubt aboutwhether the product is suitable for them.

HSBC Flexi Debt Fund (HFDF)An Open Ended Debt Scheme
Investment Objective: Seeks to deliver returns in the form of interest income and capital gains, along with high liquidity,commensurate with the current view on the markets and the interest rate cycle, through active investment in debt and moneymarket instruments.
38
FUND DETAILS
Date of Allotment
Benchmark
NAV (Growth)(as on 30.10.15)
Average Maturity ofPortfolio
Modified Duration
of Portfolio
Yield To Maturity*
Fund Manager
SIP
Minimum
Application Amount
Exit Load
per unit
Monthly Average AUM(In Lakhs)
@
Asset Allocation
Government Securities 84.49%
Corporate/ PSU Debt 9.73%
Net CurrentAssets 3.34%
Cash Equivalents 2.44%
@ Effective from March 1, 2013 for prospective investments.
* Based on invested Amount
FUND PORTFOLIO
Corporate/ PSU Debt
Government Securities
Cash Equivalents
CBLO 476.34 0.83%
Reverse Repos 918.32 1.61%
Net Current Assets 1,903.19 3.34%
Total Net Assets as on 31-Oct-2015 57,086.08 100.00%
Rural Electrification Corporation 5,053.37 8.85% CARE AAA
Power Grid Corporation of India 502.11 0.88% CRISIL AAA
8.24% GOVT OF INDIA RED 10-11-2033 10,175.22 17.82% SOVEREIGN
7.88% GOVT OF INDIA RED 19-03-2030 9,784.33 17.14% SOVEREIGN
7.95% GOVT OF INDIA RED 28-08-2032 9,212.66 16.14% SOVEREIGN
8.40% GOVT OF INDIA RED 28-07-2024 7,247.00 12.69% SOVEREIGN
7.68% GOVT OF INDIA RED 15-12-2023 6,816.08 11.94% SOVEREIGN
8.17% GOVT OF INDIA RED 01-12-2044 2,630.29 4.61% SOVEREIGN
8.60% GOVT OF INDIA RED 02-06-2028 1,809.24 3.17% SOVEREIGN
7.72% GOVT OF INDIA RED 25-05-2025 557.94 0.98% SOVEREIGN
Corporate Bonds / Debentures
IssuerMarket Value
( in Lacs)`
% to NetAssets
Rating05-Oct-07
CRISIL Composite BondFund Index
19.9671
13.69 years
7.69 years
7.95%
56,264.25
Sanjay Shah
Available
10,000
1,000 p.m.(SIP)
Nil
`
`
`
Rating Profile
Sovereign 84.49%
AAAand equivalents 9.73%
Net CurrentAssets 3.34%
Reverse Repos/ CBLOs 2.44%
Dividend DeclarationRecord Date / periodof dividend declared
Dividend ( per unit)Non-Institutional
` Dividend ( per unit)Institutional
` NAV ( ) per unit(cum dividend)
`
HSBC Flexi Debt Fund - Regular Option - Monthly Dividend
HSBC Flexi Debt Fund - Institutional Option - Monthly Dividend
HSBC Flexi Debt Fund - Monthly Dividend - Direct Plan
HSBC Flexi Debt Fund - Regular Option - Quarterly Dividend
HSBC Flexi Debt Fund - Institutional Option - Quarterly Dividend
HSBC Flexi Debt Fund - Quarterly Dividend - Direct Plan
HSBC Flexi Debt Fund - Regular Option - Half Yearly Dividend
HSBC Flexi Debt Fund - Institutional Option - Half-yearly Dividend
HSBC Flexi Debt Fund - Half-yearly Dividend - Direct Plan
26-Apr-13 0.05836 0.04973 10.4949
31-May-13 0.11214 0.10740 10.6718
28-Jun-13 0.03263 0.03125 10.4175
28-Sep-15 0.18057 0.16729 11.9644
28-Sep-15 0.18057 0.16729 11.9326
28-Sep-15 0.18057 0.16729 12.2248
14-Sep-12 0.35236 0.30201 11.4315
15-Mar-13 0.35236 0.30201 11.6629
15-Mar-13 0.35236 0.30201 10.9757
25-Sep-14 0.31171 0.29853 11.2593
25-Mar-15 0.34842 0.32311 11.8530
25-Aug-15 0.05470 0.05068 10.6611
28-Sep-15 0.09176 0.08501 10.7123
26-Oct-15 0.10868 0.10069 10.7355
25-Aug-15 0.06760 0.06263 10.8080
28-Sep-15 0.09852 0.09127 10.8504
26-Oct-15 0.11441 0.10600 10.8719
25-Mar-15 0.18147 0.16829 12.2052
25-Jun-15 0.18057 0.16729 11.8869
25-Mar-15 0.18147 0.16829 12.1590
25-Jun-15 0.18057 0.16729 11.8484
25-Mar-15 0.18147 0.16829 12.3982
25-Jun-15 0.18057 0.16729 12.1094
25-Mar-15 0.37019 0.34330 12.5368
28-Sep-15 0.36113 0.33458 12.3102
28-Sep-15 0.36113 0.33458 11.6860
Upon payment of dividend, the NAV per unit falls to the extent of payout and statutory levy, if any. Face value: 10 per unit.`
Weighted Average Monthly Total Expenses ratios(Annualized)
Regular 1.60%Direct Plan 0.85%
Excludes service tax on Investment Management fees of 0.10%of Total NetAssets.
Investors understand that their principalwill be at Moderate risk
Riskometer
Mod
erately Moderate
Low
Hig
h
Low
High
LOW HIGH
Moderately
This product is suitable forinvestors who are seeking*:
• Regular Income over longterm
• Investment in Debt / MoneyMarket Instruments
HSBC Flexi Debt Fund (HFDF)
* Investors should consult their financial advisers if in doubt aboutwhether the product is suitable for them.
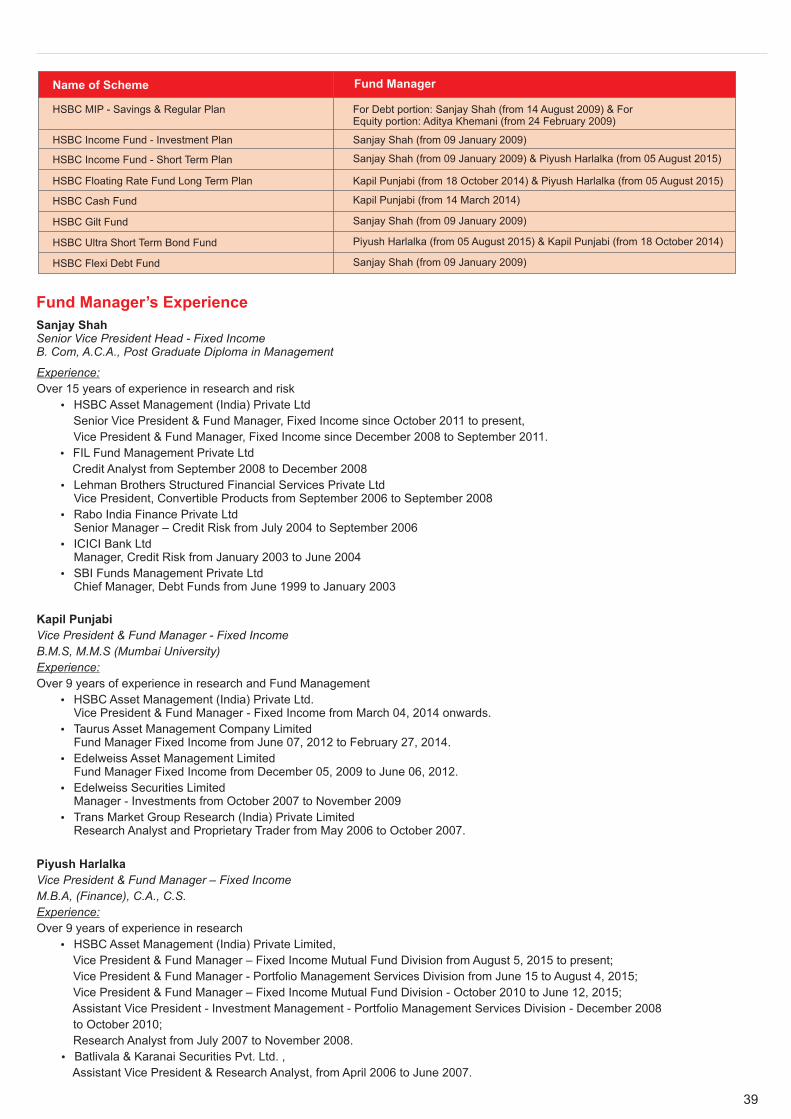
39
HSBC MIP - Savings & Regular Plan
HSBC Income Fund - Investment Plan
HSBC Income Fund - Short Term Plan
HSBC Floating Rate Fund Long Term Plan
HSBC Cash Fund
HSBC Gilt Fund
HSBC Ultra Short Term Bond Fund
HSBC Flexi Debt Fund
For Debt portion: Sanjay Shah (from 14 August 2009) & ForEquity portion: Aditya Khemani (from 24 February 2009)
Sanjay Shah (from 09 January 2009)
Sanjay Shah (from 09 January 2009) & Piyush Harlalka (from 05 August 2015)
Kapil Punjabi (from 18 October 2014) & Piyush Harlalka (from 05 August 2015)
Kapil Punjabi (from 14 March 2014)
Sanjay Shah (from 09 January 2009)
Piyush Harlalka (from 05 August 2015) & Kapil Punjabi (from 18 October 2014)
Sanjay Shah (from 09 January 2009)
Name of Scheme Fund Manager
Fund Manager’s Experience
Sanjay ShahSenior Vice President Head - Fixed IncomeB. Com, A.C.A., Post Graduate Diploma in Management
Experience:
Over 15 years of experience in research and risk
HSBC Asset Management (India) Private Ltd
Senior Vice President & Fund Manager, Fixed Income since October 2011 to present,
Vice President & Fund Manager, Fixed Income since December 2008 to September 2011.
FIL Fund Management Private Ltd
Credit Analyst from September 2008 to December 2008
Lehman Brothers Structured Financial Services Private LtdVice President, Convertible Products from September 2006 to September 2008
Rabo India Finance Private LtdSenior Manager – Credit Risk from July 2004 to September 2006
ICICI Bank LtdManager, Credit Risk from January 2003 to June 2004
SBI Funds Management Private LtdChief Manager, Debt Funds from June 1999 to January 2003
�
�
�
�
�
�
Kapil Punjabi
Vice President & Fund Manager - Fixed Income
B.M.S, M.M.S (Mumbai University)
Experience:
Over 9 years of experience in research and Fund Management
HSBC Asset Management (India) Private Ltd.Vice President & Fund Manager - Fixed Income from March 04, 2014 onwards.
Taurus Asset Management Company LimitedFund Manager Fixed Income from June 07, 2012 to February 27, 2014.
Edelweiss Asset Management LimitedFund Manager Fixed Income from December 05, 2009 to June 06, 2012.
Edelweiss Securities LimitedManager - Investments from October 2007 to November 2009
Trans Market Group Research (India) Private LimitedResearch Analyst and Proprietary Trader from May 2006 to October 2007.
�
�
�
�
�
Piyush Harlalka
Vice President & Fund Manager – Fixed Income
M.B.A, (Finance), C.A., C.S.
Experience:
Over 9 years of experience in research
HSBC Asset Management (India) Private Limited,
Vice President & Fund Manager – Fixed Income Mutual Fund Division from August 5, 2015 to present;
Vice President & Fund Manager - Portfolio Management Services Division from June 15 to August 4, 2015;
Vice President & Fund Manager – Fixed Income Mutual Fund Division - October 2010 to June 12, 2015;
Assistant Vice President - Investment Management - Portfolio Management Services Division - December 2008
to October 2010;
Research Analyst from July 2007 to November 2008.
Batlivala & Karanai Securities Pvt. Ltd. ,
Assistant Vice President & Research Analyst, from April 2006 to June 2007.
�
�

Funds Managed by - Sanjay Shah (for Debt portion) &Aditya Khemani (for Equity portion)
Funds Managed by - Sanjay Shah.
HSBC MIP - Regular Plan
HSBC MIP - Savings Plan
HSBC Gilt Fund
Date of Inception : 24 Feb 04
Date of Inception : 24 Feb 04
Date of Inception : 05 Dec 03
Scheme Name & Benchmarks
Scheme Name & Benchmarks
Scheme Name & Benchmarks
Oct 14 -Sept 15
Oct 14 -Sept 15
Oct 14 -Sept 15
Oct 13 -Sept 14
Oct 13 -Sept 14
Oct 13 -Sept 14
Oct 12 -Sept 13
Oct 12 -Sept 13
Oct 12 -Sept 13
SinceInception
SinceInception
SinceInception
HSBC MIP - Regular Plan - Growth
Crisil MIP Blended Index (Scheme Benchmark)
Crisil 1 Year T-Bill Index (Standard Benchmark)
Crisil 10 Year Gilt Index (Standard Benchmark)
10,000, if invested in HMIP - R, would have become
10,000, if invested in Crisil MIP Blended Index, would have become
10,000, if invested in Crisil 1 Year T-Bill Index, would have become
10,000, if invested in Crisil 10 Year Gilt Index, would have become
`
`
`
`
HSBC MIP - Savings Plan - Growth
Crisil MIP Blended Index (Scheme Benchmark)
Crisil 1 Year T-Bill Index (Standard Benchmark)
Crisil 10 Year Gilt Index (Standard Benchmark)
10,000, if invested in HMIP - S, would have become
10,000, if invested in Crisil MIP Blended Index, would have become
10,000, if invested in Crisil 1 Year T-Bill Index, would have become
10,000, if invested in Crisil 10 Year Gilt Index, would have become
`
`
`
`
HSBC Gilt Fund - Growth
I-Sec Composite Bond Fund Index (Scheme Benchmark)
Crisil 10 Year Gilt Index (Standard Benchmark)
10,000, if invested in HGF, would have become
10,000, if invested in I-Sec Composite Bond Fund Index, would have become
10,000, if invested in Crisil 10 Year Gilt Index, would have become
`
`
`
10.44% 14.53% 3.43% 8.22%
10.67% 15.20% 3.11% 7.83%
8.83% 8.21% 5.63% 5.85%
13.49% 6.58% 2.45% 5.24%
11,044 11,453 10,343 25,006
11,067 11,520 10,311 23,988
10,883 10,821 10,563 19,353
11,349 10,658 10,245 18,097
` ` ` `
` ` ` `
` ` ` `
` ` ` `
10.58% 19.30% 3.33% 9.83%
10.67% 15.20% 3.11% 7.83%
8.83% 8.21% 5.63% 5.85%
13.49% 6.58% 2.45% 5.24%
11,058 11,930 10,333 29,698
11,067 11,520 10,311 23,988
10,883 10,821 10,563 19,353
11,349 10,658 10,245 18,097
` ` ` `
` ` ` `
` ` ` `
` ` ` `
13.20% 8.23% 4.96% 5.35%
13.27% 10.90% 4.86% 7.32%
13.49% 6.58% 2.45% 5.21%
11,320 10,823 10,496 18,524
11,327 11,090 10,486 23,070
11,349 10,658 10,245 18,246
` ` ` `
` ` ` `
` ` ` `
Past performance may or may not be sustained in the future. Refer note below.
Past performance may or may not be sustained in the future. Refer note below.
Past performance may or may not be sustained in the future. Refer note below.
Data for the period October to September has been considered in all cases, except for ‘Since Inception’ returns. ‘Since Inception’ (%) returnsare compounded annualised, other % returns are simple annualised. ‘Since inception’ returns are calculated on 10 invested at inception.Standard benchmark is prescribed by SEBI and is used for comparison purposes. Returns on 10,000 are point-to-point returns for thespecific time period, invested at the start of the period. The returns provided above have been rounded off and hence there may be minordifferences between point-to-point returns vis-a-vis returns indicated above.
`
`
Comparative Performance of Debt Schemes
40
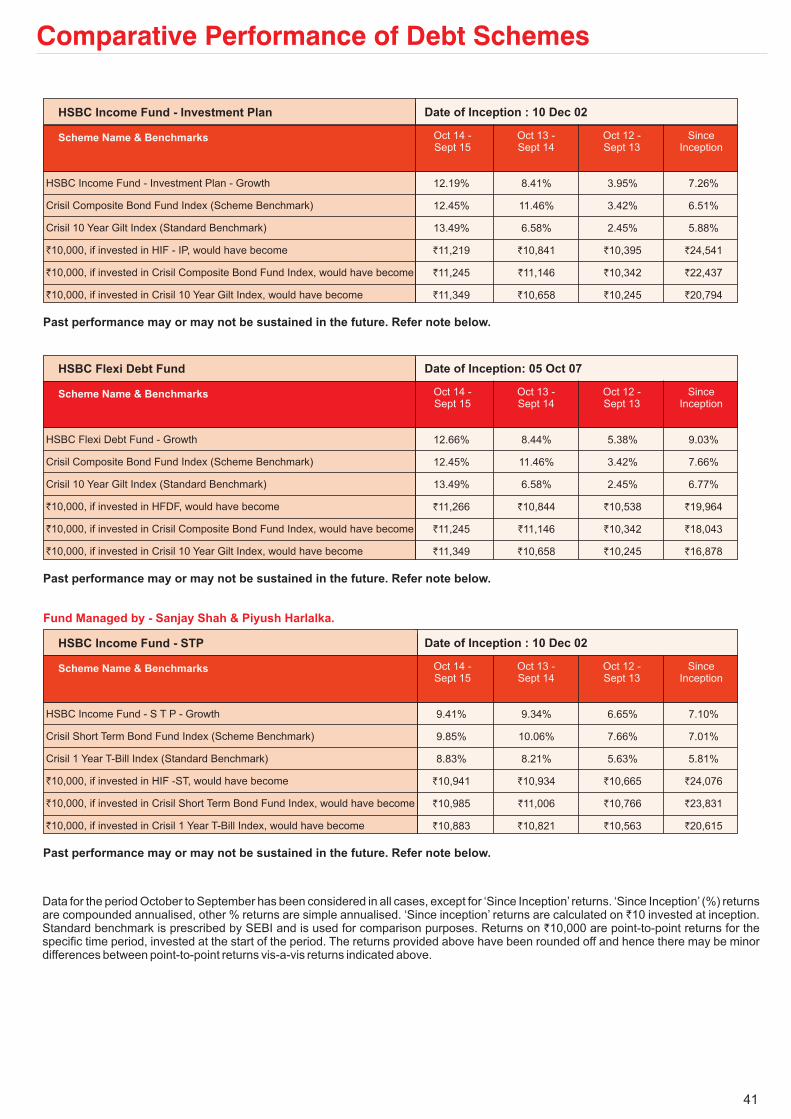
Data for the period October to September has been considered in all cases, except for ‘Since Inception’ returns. ‘Since Inception’ (%) returnsare compounded annualised, other % returns are simple annualised. ‘Since inception’ returns are calculated on 10 invested at inception.Standard benchmark is prescribed by SEBI and is used for comparison purposes. Returns on 10,000 are point-to-point returns for thespecific time period, invested at the start of the period. The returns provided above have been rounded off and hence there may be minordifferences between point-to-point returns vis-a-vis returns indicated above.
`
`
HSBC Income Fund - Investment Plan
HSBC Flexi Debt Fund
Date of Inception : 10 Dec 02
Date of Inception: 05 Oct 07
Scheme Name & Benchmarks
Scheme Name & Benchmarks
Oct 14 -Sept 15
Oct 14 -Sept 15
Oct 13 -Sept 14
Oct 13 -Sept 14
Oct 12 -Sept 13
Oct 12 -Sept 13
SinceInception
SinceInception
HSBC Income Fund - Investment Plan - Growth
Crisil Composite Bond Fund Index (Scheme Benchmark)
Crisil 10 Year Gilt Index (Standard Benchmark)
10,000, if invested in HIF - IP, would have become
10,000, if invested in Crisil Composite Bond Fund Index, would have become
10,000, if invested in Crisil 10 Year Gilt Index, would have become
`
`
`
HSBC Flexi Debt Fund - Growth
Crisil Composite Bond Fund Index (Scheme Benchmark)
Crisil 10 Year Gilt Index (Standard Benchmark)
10,000, if invested in HFDF, would have become
10,000, if invested in Crisil Composite Bond Fund Index, would have become
10,000, if invested in Crisil 10 Year Gilt Index, would have become
`
`
`
12.19% 8.41% 3.95% 7.26%
12.45% 11.46% 3.42% 6.51%
13.49% 6.58% 2.45% 5.88%
11,219 10,841 10,395 24,541
11,245 11,146 10,342 22,437
11,349 10,658 10,245 20,794
` ` ` `
` ` ` `
` ` ` `
12.66% 8.44% 5.38% 9.03%
12.45% 11.46% 3.42% 7.66%
13.49% 6.58% 2.45% 6.77%
11,266 10,844 10,538 19,964
11,245 11,146 10,342 18,043
11,349 10,658 10,245 16,878
` ` ` `
` ` ` `
` ` ` `
Past performance may or may not be sustained in the future. Refer note below.
Past performance may or may not be sustained in the future. Refer note below.
Comparative Performance of Debt Schemes
41
HSBC Income Fund - STP Date of Inception : 10 Dec 02
Scheme Name & Benchmarks Oct 14 -Sept 15
Oct 13 -Sept 14
Oct 12 -Sept 13
SinceInception
HSBC Income Fund - S T P - Growth
Crisil Short Term Bond Fund Index (Scheme Benchmark)
Crisil 1 Year T-Bill Index (Standard Benchmark)
10,000, if invested in HIF -ST, would have become
10,000, if invested in Crisil Short Term Bond Fund Index, would have become
10,000, if invested in Crisil 1 Year T-Bill Index, would have become
`
`
`
9.41% 9.34% 6.65% 7.10%
9.85% 10.06% 7.66% 7.01%
8.83% 8.21% 5.63% 5.81%
10,941 10,934 10,665 24,076
10,985 11,006 10,766 23,831
10,883 10,821 10,563 20,615
` ` ` `
` ` ` `
` ` ` `
Past performance may or may not be sustained in the future. Refer note below.
Fund Managed by - Sanjay Shah & Piyush Harlalka.

HSBC Cash Fund@
Date of Inception: 04 Dec 02
Scheme Name & Benchmarks Oct 14 -Sept 15
Oct 13 -Sept 14
Oct 12 -Sept 13
SinceInception
HSBC Cash Fund - Growth
Crisil Liquid Fund Index (SchemeBenchmark)
Crisil 91 Day T-Bill Index (StandardBenchmark)
`
`
`
10,000, if invested in HCF, would havebecome
10,000, if invested in Crisil Liquid FundIndex, would have become
10,000, if invested in Crisil 91 Day T-BillIndex, would have become
HSBC FRF - LTP - Regular Plan
HSBC Ultra Short Term Bond Fund$
Date of Inception : 16 Nov 04
Date of Inception :17 Oct 06
Scheme Name & Benchmarks
Scheme Name & Benchmarks
Oct 14 -Sept 15
Oct 14 -Sept 15
Oct 13 -Sept 14
Oct 13 -Sept 14
Oct 12 -Sept 13
Oct 12 -Sept 13
SinceInception
SinceInception
HSBC FRF - LTP - Growth
Crisil Liquid Fund Index (Scheme Benchmark)
Crisil 1 Year T-Bill Index (Standard Benchmark)
10,000, if invested HFRF - LTP, would have become
10,000, if invested in Crisil Liquid Fund Index, would have become
10,000, if invested in Crisil 1 Year T-Bill Index, would have become
`
`
`
HSBC Ultra Short Term Bond Fund - Growth
Customised Benchmark Index Fund (Scheme Benchmark)*
Crisil 1 Year T-Bill Index (Standard Benchmark)
10,000, if invested in HUSTBF, would have become
10,000, if invested in Customised Benchmark Index, would have become
10,000, if invested in Crisil 1 Year T-Bill Index, would have become
`
`
`
8.51% 9.07% 8.73% 7.81%
8.53% 9.48% 8.52% 7.20%
8.83% 8.21% 5.63% 6.08%
10,851 10,907 10,873 22,654
10,853 10,948 10,852 21,316
10,883 10,821 10,563 18,997
` ` ` `
` ` ` `
` ` ` `
8.67% 9.40% 8.43% 8.85%
8.66% 9.54% 8.44% 8.90%
8.83% 8.21% 5.63% 7.61%
10,867 10,940 10,843 21,192
10,866 10,954 10,844 21,271
10,883 10,821 10,563 19,143
` ` ` `
` ` ` `
` ` ` `
Past performance may or may not be sustained in the future. Refer note below.
Past performance may or may not be sustained in the future. Refer note below.
Last 7 Daysas on 30
Sept 2015
Last 15 Daysas on 30
Sept 2015
Last 30 Daysas on 30
Sept 2015
8.44% 7.95% 7.74% 8.58% 9.32% 8.98% 8.91%
11.04% 9.55% 8.20% 8.53% 9.48% 8.52% 8.75%
12.05% 9.62% 8.39% 8.44% 9.37% 7.80% 8.38%
10,016 10,033 10,064 10,858 10,932 10,898 14,522
10,021 10,039 10,067 10,853 10,948 10,852 14,432
10,023 10,040 10,069 10,844 10,937 10,780 14,219
` ` ` ` ` ` `
` ` ` ` ` ` `
` ` ` ` ` ` `
Past performance may or may not be sustained in the future. Refer note below.
# Pursuant to SEBI circular dated Sept 13, 2012, certain Plans / Options within the schemes have been discontinued to comply with a single plan structure.Since there was no continuous NAV history available for the surviving Plan prior to 19 May 2011, returns since the said date have been considered forcalculating performance. The inception date of HSBC Cash Fund however is 4 December 2002.
Data for the period October to September has been considered in all cases, except for ‘Since Inception’ returns. ‘Since Inception’ (%) returns are compoundedannualised, other % returns are simple annualised. ‘Since inception’ returns are calculated on 10 invested at inception. Standard benchmark is prescribed bySEBI and is used for comparison purposes. Returns on 10,000 are point-to-point returns for the specific time period, invested at the start of the period. Thereturns provided above have been rounded off and hence there may be minor differences between point-to-point returns vis-a-vis returns indicated above.
`
`
Comparative Performance of Debt Schemes
42
Fund Managed by - Piyush Harlalka & Kapil Punjabi.
* Composite index of CRISILLiquid Fund Index (90%) and CRISILShort Term Bond Fund Index (10%).$ Pursuant to SEBI circular dated Sept. 13, 2012, certain Plans / Options within the schemes have been discontinued to comply with a single planstructure.Since there was no continuous NAV history available for the surviving Plan prior to 1 October 2012, returns since the said date have been consideredfor calculating performance. The inception date of HSBC Ultra Short Term Bond Fund however is 17 October 2006.
Fund Managed by - Kapil Punjabi.
Fund Managed by - Kapil Punjabi & Piyush Harlalka.

Fund Manager
ApplicationAmount for Fresh Subscription
MinimumAdditionalAmount
Yield to Maturity
SIP
NAV
Benchmark
Entry Load
Exit Load
Modified Duration
Standard Deviation
Sharpe Ratio
Beta
AUM
Holdings
Nature of Scheme
Rating Profile
An employee of the asset management company such as a mutual fund or life insurer, who manages investments of the scheme. He isusually part of a larger team of fund managers and research analysts.
This is the minimum investment amount for a new investor in a mutual fund scheme,
This is the minimum investment amount for an existing investor in a mutual fund scheme.
The Yield to Maturity or the YTM is the rate of return anticipated on a bond if held until maturity. YTM is expressed as an annual rate. The YTMfactors in the bond's current market price, par value, coupon interest rate and time to maturity.
SIP or systematic investment plan works on the principle of making periodic investments of a fixed sum. It works similar to a recurring bankdeposit. For instance, an investor may opt for an SIP that invests 500 every 15 of the month in an equity fund for a period of three years.
The NAV or the net asset value is the total asset value per unit of the mutual fund after deducting all related and permissible expenses. TheNAV is calculated at the end of every business day. It is the value at which the investor enters or exits the mutual fund.
Agroup of securities, usually a market index, whose performance is used as a standard or benchmark to measure investment performance ofmutual funds, among other investments. Some typical benchmarks include the Nifty, Sensex, BSE200, BSE500, 10-Year Gsec.
Amutual fund may have a sales charge or load at the time of entry and/or exit to compensate the distributor/agent. Entry load is charged at thetime an investor purchases the units of a mutual fund. The entry load is added to the prevailing NAV at the time of investment. For instance, ifthe NAV is 100 and the entry load is 1%, the investor will enter the fund at 101.
Exit load is charged at the time an investor redeems the units of a mutual fund. The exit load is deducted from the prevailing NAV at the time ofredemption. For instance, if the NAV is Rs 100 and the exit load is 1%, the redemption price would be 99 per unit.
Modified duration is the price sensitivity and the percentage change in price for a unit change in yield.
Standard deviation is a statistical measure of the range of an investment's performance. When a mutual fund has a high standard deviation,its means its range of performance is wide, implying greater volatility.
The Sharpe Ratio, named after its founder, the Nobel Laureate William Sharpe, is a measure of risk-adjusted returns. It is calculated usingstandard deviation and excess return to determine reward per unit of risk.
Beta is a measure of an investment's volatility vis-a-vis the market. Beta of less than 1 means that the security will be less volatile than themarket.Abeta of greater than 1 implies that the security's price will be more volatile than the market.
AUM or assets under management refers to the recent I updated cumulative market value of investments managed by a mutual fund or anyinvestment firm.
The holdings or the portfolio is a mutual fund's latest or updated reported statement of investments/securities. These are usually displayed interms of percentage to net assets or the rupee value or both. The objective is to give investors an idea of where their money is being investedby the fund manager.
The investment objective and underlying investments determine the nature of the mutual fund scheme. For instance, a mutual fund that aimsat generating capital appreciation by investing in stock markets is an equity fund or growth fund. Likewise, a mutual fund that aims at capitalpreservation by investing in debt markets is a debt fund or income fund. Each of these categories may have sub-categories.
Mutual funds invest in securities after evaluating their creditworthiness as disclosed by the ratings. A depiction of the mutual fund in variousinvestments based on their ratings becomes the rating profile of the fund. Typically, this is a feature of debt funds.
`
`
th
`
`
Note: SEBI, vide circular dated June 30, 2009 has abolished entry loan and mandated that the upfront commission to distributors will be paid by the investor directly to thedistributor, based on his assessment of various factors including the services rendered by the distributor.
Section II - How to read Factsheet
43

All returns have been sourced from MutualFundsIndia Explorer software unless otherwise stated. With regard to equity
schemes (including the equity component of MIPs), Fund performance is calculated on a total return basis (i.e. it includes
dividends re-invested) while the benchmark is calculated on a price return basis (i.e. it does not consider dividends re-
invested).
This document has been prepared by HSBCAsset Management (India) Private Ltd (HSBC) for information purposes only and
should not be construed as an offer or solicitation of an offer for purchase of any of the funds of HSBC Mutual Fund. All
information contained in this document (including that sourced from third parties), is obtained from sources HSBC, the third
party believes to be reliable but which it has not independently verified and HSBC, the third party makes no guarantee,
representation or warranty and accepts no responsibility or liability as to the accuracy or completeness of such information.
The information and opinions contained within the document are based upon publicly available information and rates of
taxation applicable at the time of publication, which are subject to change from time to time. Expressions of opinion are those of
HSBC only and are subject to change without notice. It does not have regard to specific investment objectives, financial
situation and the particular needs of any specific person who may receive this document. Investors should seek financial
advice regarding the appropriateness of investing in any securities or investment strategies that may have been discussed or
recommended in this report and should understand that the views regarding future prospects may or may not be realized.
Neither this document nor the units of HSBC Mutual Fund have been registered in any jurisdiction. The distribution of this
document in certain jurisdictions may be restricted or totally prohibited and accordingly, persons who come into possession of
this document are required to inform themselves about, and to observe, any such restrictions. Mutual fund investments are
subject to market risks. Please read the Scheme Information Document carefully before investing.
Investors should not invest in the Scheme solely based on the information provided in this document and should read the
Combined Scheme Information Document and, Statement of Additional Information of the Fund for details. This document
does not constitute an offering document.
No part of this publication may be reproduced, stored in a retrieval system, or transmitted, on any form or by any means,
electronic, mechanical, photocopying, recording, or otherwise, without the prior written permission of HSBC Asset
Management (India) Private Ltd.
Mutual Fund investments are subject to market risks, read all scheme related documents carefully.
HSBCAsset Management (India) Private Limited,
16, V.N. Road, Fort, Mumbai-400001
Email: [email protected]
Website: www.assetmanagement.hsbc.com/in
Statutory Details & Disclaimers