hsbc holdings plc€¦ · · 2013-04-02hsbc holdings plc capital and risk ... hong kong, new...
TRANSCRIPT

HSBC Holdings plc Capital and Risk Management Pillar 3 Disclosures at 31 December 2012

Purpose
This document comprises HSBC’s Pillar 3 disclosures on capital and risk management at 31 December 2012. It has two principal purposes:
• to meet the regulatory disclosure requirements under the rules of the United Kingdom (‘UK’) Financial Services Authority (‘FSA’) set out in BIPRU, the Prudential Sourcebook for Banks, Building Societies and Investment Firms, Chapter 11; and
• to provide further information useful to readers of these disclosures on the capital and risk profile of the HSBC Group.
Additional relevant information may be found in the HSBC Holdings plc Annual Report and Accounts 2012. Who we are
HSBC is one of the world’s largest banking and financial services organisations, with around 6,600 offices in both established and faster-growing markets. We aim to be where the economic growth is, connecting customers to opportunities, enabling businesses to thrive and economies to prosper, and ultimately helping people to fulfil their hopes and realise their ambitions.
We serve around 58 million customers through our four global businesses: Retail Banking and Wealth Management (‘RBWM’), Commercial Banking (‘CMB’), Global Banking and Markets (‘GB&M’) and Global Private Banking. Our network covers 81 countries and territories in six geographical regions: Europe, Hong Kong, Rest of Asia-Pacific, Middle East and North Africa (‘MENA’), North America and Latin America. Our aim is to be acknowledged as the world’s leading international bank.
Listed on the London, Hong Kong, New York, Paris and Bermuda stock exchanges, shares in HSBC Holdings plc are held by about 220,000 shareholders in 129 countries and territories.
Certain defined terms
Unless the context requires otherwise, ‘HSBC Holdings’ means HSBC Holdings plc and ‘HSBC’, the ‘Group’, ‘we’, ‘us’ and ‘our’ refers to HSBC Holdings together with its subsidiaries. Within this document the Hong Kong Special Administrative Region of the People’s Republic of China is referred to as ‘Hong Kong’. When used in the terms ‘shareholders’ equity’ and ‘total shareholders’ equity’, ‘shareholders’ means holders of HSBC Holdings ordinary shares and those preference shares classified as equity. The abbreviations ‘US$m’ and ‘US$bn’ represent millions and billions (thousands of millions) of US dollars, respectively.
Cautionary statement regarding forward-looking statements
The Capital and Risk Management Pillar 3 Disclosures at 31 December 2012 (‘Pillar 3 Disclosures 2012’) contain certain forward-looking statements with respect to HSBC’s financial condition, results of operations and business.
Statements that are not historical facts, including statements about HSBC’s beliefs and expectations, are forward-looking statements. Words such as ‘expects’, ‘anticipates’, ‘intends’, ‘plans’, ‘believes’, ‘seeks’, ‘estimates’, ‘potential’ and ‘reasonably possible’, variations of these words and similar expressions are intended to identify forward-looking statements. These statements are based on current plans, estimates and projections, and therefore undue reliance should not be placed on them. Forward-looking statements speak only as of the date they are made. HSBC makes no commitment to revise or update any forward-looking statements to reflect events or circumstances occurring or existing after the date of any forward-looking statements.
Written and/or oral forward-looking statements may also be made in the periodic reports to the US Securities and Exchange Commission, summary financial statements to shareholders, proxy statements, offering circulars and prospectuses, press releases and other written materials, and in oral statements made by HSBC’s Directors, officers or employees to third parties, including financial analysts.
Forward-looking statements involve inherent risks and uncertainties. Readers are cautioned that a number of factors could cause actual results to differ, in some instances materially, from those anticipated or implied in any forward-looking statement. These factors include changes in general economic conditions in the markets in which we operate, changes in government policy and regulation and factors specific to HSBC.

H S B C H O L D I N G S P L C
Capital and Risk Management Pillar 3 Disclosures at 31 December 2012
Page 1
Contents
Introduction Key regulatory metrics ................................................... 2 Regulatory framework for disclosures ........................... 4 Pillar 3 Disclosures 2012 ................................................ 4 Future developments ...................................................... 5 Comparison with the Annual Report and Accounts 2012 5
Capital and risk Capital management ....................................................... 8 Regulatory capital ........................................................... 8 Calculation of capital requirements ................................ 10 Scope of Basel Pillar 1 approaches ................................ 12 Pillar 2 and ICAAP ......................................................... 14 Basel III and CRD IV ..................................................... 16 Risk management ........................................................... 19 Risk analytics and model governance ............................ 20
Credit risk Overview and responsibilities ........................................ 21 Credit risk management .................................................. 21 Credit risk models governance ....................................... 22 Application of the IRB approach ................................... 29 Model performance ........................................................ 39 Risk mitigation under IRB approaches ........................... 43 Application of the standardised approach ...................... 46 Counterparty credit risk .................................................. 48 Securitisation .................................................................. 52
Market risk Overview and objectives ................................................ 58 Organisation and responsibilities ................................... 58 Measurement and monitoring ......................................... 59 Managed risk positions ................................................... 60
Operational risk Overview and objectives ................................................ 61 Organisation and responsibilities ................................... 62 Measurement and monitoring ......................................... 62
Other risks Pension risk ..................................................................... 63 Non-trading book interest rate risk ................................. 63 Non-trading book exposures in equities ......................... 64
Remuneration HSBC Group Remuneration Committee ........................ 66 HSBC reward strategy .................................................... 66 Overview of remuneration .............................................. 67 Group variable pay pool determination .......................... 67
Appendices I Simplified organisation chart for regulatory
purposes .................................................................. 72 II Risk management framework – risk types ............. 73
III Supplementary Basel III disclosures ...................... 76 IV References to Annual Report and Accounts 2012 . 79 V Glossary .................................................................. 80
VI Contacts ................................................................... 88
Tables 1 Pillar 1 overview ............................................................ 2 2 Reconciliation of balance sheets - financial accounting
to regulatory scope of consolidation ......................... 6 3 Composition of regulatory capital ................................. 9 4 RWAs - by risk type and geographical region .............. 10 5 RWAs - by global business and geographical region .... 11 6 Credit risk and counterparty credit risk - by model
approach and exposure class ..................................... 13 7 Estimated impact of CRD IV (end point)....................... 17 8 Estimated leverage ratio ................................................. 19 9 Credit risk - summary .................................................... 23
10 Credit risk exposure - by geographical region .............. 24 11 Credit risk exposure - RWAs and RWA density by
geographical region ........................................................ 25 12 Credit risk exposure - by industry sector ....................... 26 13 Credit risk exposure - by residual maturity ................... 28 14 Wholesale IRB exposure – by obligor grade.................. 32 15 Retail IRB exposures secured on real estate property ... 36 16 Retail IRB exposure - by internal PD grade .................. 36 17 Retail IRB exposure - by geographical region .............. 37 18 IRB models - estimated and actual values (wholesale) . 40 19 IRB models - corporate PD models performance by
CRR grade ................................................................. 40 20 IRB advanced models - estimated and actual values
(retail) ........................................................................ 41 21 IRB EL and impairment charges - by exposure class ... 42 22 IRB EL and impairment charges - by region ................. 43 23 IRB exposure - credit risk mitigation ............................ 45 24 Standardised exposure - credit risk mitigation .............. 47 25 Standardised exposure - by credit quality step .............. 47 26 CCR exposure - credit derivative transactions .............. 49 27 CCR - net derivative credit exposure ............................ 49 28 CCR - by exposure class, product and method ............. 50 29 CCR - by exposure class, product and region ............... 51 30 CCR - RWA by exposure class, product and region ..... 51 31 CCR - RWA density by exposure class, product and
region ......................................................................... 52 32 Securitisation exposure - by approach ........................... 54 33 Securitisation - movement in the year ........................... 55 34 Securitisation - by trading and non-trading book .......... 56 35 Securitisation - asset values and impairment charges ... 56 36 Securitisation - by risk weighting .................................. 57 37 Market risk ..................................................................... 58 38 Operational risk .............................................................. 61 39 Non-trading book equity investments ............................ 64 40 Aggregate remuneration expenditure ............................ 64 41 Remuneration - fixed and variable amounts - Group .... 65 42 Remuneration - fixed and variable amounts - UK ........ 65 43 Deferred remuneration ................................................... 65 44 Sign-on and severance payments ................................... 66 45 Code staff remuneration by band ................................... 66 46 2012 Long-term scorecard and performance outcome .. 70 47 Composition of regulatory capital on a Basel III basis . 76

H S B C H O L D I N G S P L C
Capital and Risk Management Pillar 3 Disclosures at 31 December 2012 (continued)
Page 2
Introduction
Key regulatory metrics
Core tier 1 capital
US$138.8bn – up 13%
2011: US$122.4bn 2010: US$116.1bn
Core tier 1 ratio
12.3%
2011: 10.1% 2010: 10.5%
Total RWAs
US$1,124bn – down 7%
2011: US$1,210bn 2010: US$1,103bn
Tier 1 capital
US$151.0bn – up 8%
2011: US$139.5bn 2010: US$133.2bn
Tier 1 ratio
13.4%
2011: 11.5% 2010: 12.1%
Credit risk EAD
US$2,171bn – down 1%
2011: US$2,183bn 2010: US$1,999bn
Total regulatory capital
US$180.8bn – up 6%
2011: US$170.3bn 2010: US$167.6bn
Total capital ratio
16.1%
2011: 14.1% 2010: 15.2%
Credit risk RWA density
41%
2011: 44% 2010: 45%
Estimated CRD IV CET1 capital
US$115.5bn
Estimated CRD IV CET1 ratio1
9.0%
Estimated CRD IV RWAs
US$1,289.2bn
Table 1: Pillar 1 overview RWAs Capital required2
2012 2011 2012 2011 US$bn US$bn US$bn US$bn
Credit risk ................................................... 898.4 958.2 – down 6% 71.9 76.7 – down 6% Standardised approach ................................ 374.5 372.1 30.0 29.8 IRB foundation approach ........................... 10.3 8.5 0.8 0.7 IRB advanced approach .............................. 513.6 577.6 41.1 46.2
Counterparty credit risk3 ............................. 48.3 53.8 – down 10% 3.9 4.3 – down 9% Standardised approach ................................ 2.6 3.2 0.2 0.3 IRB approach .............................................. 45.7 50.6 3.7 4.0
Market risk .................................................. 54.9 73.2 – down 25% 4.4 5.9 – down 25% Operational risk .......................................... 122.3 124.3 – down 2% 9.8 9.9 – down 1% Total ............................................................ 1,123.9 1,209.5 – down 7% 90.0 96.8 – down 7%
Of which: Run-off portfolios ................................... 145.7 181.6 11.7 14.5 Legacy credit in GB&M ......................... 38.6 50.0 3.1 4.0 US CML and Other4 ............................... 107.1 131.6 8.6 10.5 Card and Retail Services5 ....................... 6.9 52.1 0.6 4.2
1 The estimated CRD IV CETI ratio: this is the ratio estimated by applying our interpretation of the CRD IV draft July 2011 text post transition period (end point CRD IV) to our balance sheet position at 31 December 2012.
2 ‘Capital required’, here and in all tables where the term is used, represents the Pillar 1 capital charge calculated at 8% of RWAs. 3 For a breakdown of counterparty credit risk exposure and RWAs by internal model and mark-to-market methods, see table 28 on
page 50. 4 Other includes treasury services related to the US Consumer and Mortgage Lending business and commercial operations in run-off. 5 Operational risk RWAs, under the standardised approach, are calculated using an average of the last three years’ revenues. For
business disposals, the operational risk RWAs are not released immediately on disposal, but diminish over a period of time. The RWAs for the Card and Retail Services business at 31 December 2012 represent the remaining operational risk RWAs for the business.

H S B C H O L D I N G S P L C
Capital and Risk Management Pillar 3 Disclosures at 31 December 2012 (continued)
Page 3
RWAs by risk type RWAs by global business
Operational risk11% (2011: 10%)
Market risk 5% (2011: 6%)
Counterparty credit risk 4% (2011: 5%)
Credit risk 80% (2011: 79%)
Other 2% (2011: 2%)
Global Private Banking 2%(2011: 2%)
Retail Banking and Wealth Management 25%(2011: 29%)
Commercial Banking 35%(2011: 32%)
Global Bankingand Markets 36%
(2011: 35%)
RWAs by geographical region Credit risk RWAs by Basel approach
Europe 28% (2011: 28%)
Latin America 9% (2011: 8%)
Rest of Asia-Pacific 26% (2011: 23%)
North America 22%(2011: 28%)
Middle East andNorth Africa 5%
(2011: 5%)
Hong Kong 10% (2011: 8%)
IRB advancedapproach 57% (2011: 60%)
IRB foundationapproach 1% (2011: 1%)
Standardisedapproach 42%
(2011: 39%)
Credit risk EAD by industry sector EL and loan impairment charges (IRB only)
International trade and services 7%(2011: 7%)
Non-customer assets 4%(2011: 3%)
Other commercial6% (2011: 5%)
Financial 33%(2011: 32%)
Personal 25%(2011: 28%)
Manufacturing 8% (2011: 8%)
Government andpublic administration 8%
(2011: 9%)
Property and otherbusiness activities 9%(2011: 8%)
26.3
20.919.5
10.78.7
4.8
0
5
10
15
20
25
30
2010 2011 2012
US$bn
Expected loss (at 1 January)Impairment charge (for the year ended 31 December)
Verification
Whilst the Pillar 3 Disclosures 2012 are not required to be externally audited, the document has been verified internally in accordance with the Group’s policies on disclosure and its financial reporting and governance processes. Controls comparable to those for the Annual Report and Accounts have been applied to confirm compliance with FSA Handbook rules in BIPRU 11 and consistency with HSBC’s governance, business model and other disclosures.
Frequency
We publish comprehensive Pillar 3 disclosures annually on the HSBC internet site www.hsbc.com, simultaneously with the release of our Annual Report and Accounts. Our interim reports and management statements include relevant summarised regulatory capital information complementing the financial and risk information presented there.

H S B C H O L D I N G S P L C
Capital and Risk Management Pillar 3 Disclosures at 31 December 2012 (continued)
Page 4
Regulatory framework for disclosures
The UK FSA supervises HSBC on a consolidated basis, and therefore receives information on the capital adequacy of, and sets capital requirements for, the Group as a whole. Individual banking subsidiaries are directly regulated by their local banking supervisors, who set and monitor their local capital adequacy requirements. In most jurisdictions, non-banking financial subsidiaries are also subject to the supervision and capital requirements of local regulatory authorities.
We calculate capital at a Group level for current reporting purposes using the Basel II framework of the Basel Committee on Banking Supervision (‘Basel Committee’), as implemented by the European Union (‘EU’) in the Capital Requirements Directive, as amended, and subsequently by the FSA in its rulebooks for the UK banking industry. The regulators of Group banking entities outside the EU are at different stages of implementation of Basel II and local regulation may still be on a Basel I basis.
The Basel II framework has been updated by the Basel Committee in Basel III, due to take legal effect in the EU through a Directive and a Regulation which together (‘CRD IV’) will supersede earlier Directives. Significant matters within the scope of CRD IV include the quality and quantity of regulatory capital, counterparty credit risk, liquidity and funding, capital buffers and leverage. The new requirements are to be phased in, with many areas subject to the development of technical standards by the European Banking Authority (‘EBA’).
At the time of writing, these proposals have reached an advanced stage within the European legislative process but remain subject to agreement between the European Commission, Parliament and Council. Moreover, the effective date of their implementation is uncertain.
Our approach to managing Group capital has been to ensure that we exceed current regulatory requirements and are well placed to meet expected future requirements. Within the remit of Pillar 2, the FSA has now set the Group a target common equity tier 1 (‘CET1’) ratio calculated on a Basel III end point basis, to be achieved by December 2013: the ‘Capital Resources Floor’ (‘CRF’). In effect, this accelerates our implementation date of Basel III. We currently manage our capital position to meet an internal target CET1 ratio in the range 9.5%-10.5% by 31 December 2013 and review this on an ongoing basis.
Pillar 3 Disclosures 2012
Basel II is structured around three ‘pillars’. The Pillar 1 minimum capital requirements and Pillar 2 supervisory review process are complemented by Pillar 3: market discipline. The aim of Pillar 3 is to produce disclosures which allow market participants to assess the scope of application by banks of the Basel framework and the rules in their jurisdiction, their capital condition, risk exposures and risk assessment processes, and hence their capital adequacy. Pillar 3 requires all material risks to be disclosed, enabling a comprehensive view of a bank’s risk profile.
The Pillar 3 Disclosures 2012 comprise all information required under Pillar 3 in the UK, both quantitative and qualitative, and are prepared at the HSBC Group consolidated level. Where disclosure has been withheld as proprietary or non-material, as the rules permit, we comment as appropriate. The FSA also allows certain Pillar 3 requirements to be satisfied by inclusion within the financial statements.
Where we adopt this approach, references are provided to the relevant pages of the Annual Report and Accounts 2012.
We continue to engage constructively in the work of the UK authorities and industry associations to improve the transparency and comparability of UK banks’ Pillar 3 disclosures. We also take due account of other regulatory assessments, such as reviews by the EBA of best practice in historical disclosures. Our 2012 disclosures furthermore reflect our implementation of the recommendations of the Enhanced Disclosure Task Force (‘EDTF’).
An introduction to the EDTF and to HSBC’s implementation of its recommendations are given on page 12 of the Annual Report and Accounts 2012.
Reflecting the way we now manage capital, we are making various disclosures at 2012 year-end of our estimated capital position on an end point CRD IV basis with regard to both the supply of, and the demand for, capital. These disclosures are clearly distinguished from those made under the regulatory rules currently in place.
We also make certain disclosures in line with FSA requirements for UK banks on the composition of capital and leverage in a Basel III/ CRD IV environment.
H S B C H O L D I N G S P L C
Capital and Risk Management Pillar 3 Disclosures at 31 December 2012 (continued)
Page 5
The principal changes to our Pillar 3 Disclosures 2012, compared with the prior year, are:
• new capital disclosures: − a comparison of the differing scope of our financial
accounting and regulatory balance sheets; − a table setting out the pro forma estimated impact of end
point Basel III/CRD IV rules on our core tier 1 ratio (CET1 under Basel III);
− at FSA request, tables estimating on a pro forma basis the composition of first year transitional CRD IV capital and an end point leverage ratio;
• more granular risk disclosures: − credit and counterparty credit risk weighted assets
(‘RWAs’) and RWA density, by exposure class and geography;
− portfolio quality distribution by key Basel II risk metrics; − model backtesting data for significant exposure classes
and portfolios; − additional supporting commentaries; and
• greater clarity and focus: − enhancement of market risk and counterparty credit risk
disclosures; − policy and reference detail in Appendices; − clearer delineation of our approaches to Pillar 1 and
Pillar 2 capital requirements; − presentational improvements to assist the reader.
Future developments
One of the most significant future developments is the expected finalisation of the draft CRD IV rules. The timing of this, and the implementation dates, remain unclear at the time of publication.
Separately, the FSA will introduce new capital measures in 2013 for UK banks:
• Sovereign Loss Given Defaults (‘LGD’s) are to be subject to a floor of 45%, effective in HSBC’s case for reporting from 31 March 2013; we estimate the RWA impact at US$19.0bn.
• the FSA requires a move to the supervisory slotting approach for UK commercial income-producing real estate portfolios. For HSBC, this will roll out across the relevant business during 2013.
• a framework will be applied when assessing low-default wholesale portfolios, imposing LGD and exposure at default (‘EAD’) floors based on the foundation approach in the case of portfolios with fewer than 20 events of default per country.
We continue to assess the potential impact of these measures.
A number of other major regulatory initiatives have material implications for banks’ future capital requirements. These include assessment against global systemically important bank (‘G-SIB’) criteria and legislation on the structural reform of banks proposed by the UK Government following the report of the Independent Commission on Banking.
The Government also proposes to make the Financial Policy Committee (‘FPC’) responsible for decisions on applying the countercyclical capital buffer, a Basel III global requirement, to certain UK firms, if it judges that systemic risks threaten UK financial stability, and to protect the banking sector from future potential losses.
The FPC would also gain powers over sectoral capital requirements (‘SCR’), a more targeted tool directed at three broad sectors judged to pose cyclical and potentially systemic risks. These are: residential mortgages, commercial property and other financial institutions, as well as more granular sub-sectors of these if the need arose, whether in the banking or trading books, and irrespective of the domicile of the ultimate borrower.
The aggregate impact of these potential buffer requirements cannot be precisely estimated at present, but further details of these topics can be found in the discussion of macro-prudential and regulatory risks on page 16 of this report, and under ‘Capital – Future Developments’ on page 291 of the Annual Report and Accounts 2012.
Comparison with the Annual Report and Accounts 2012
Basis of consolidation
The basis of consolidation for the purpose of financial accounting under International Financial Reporting Standards (‘IFRSs’), described on page 384 of the Annual Report and Accounts 2012, differs from that used for regulatory purposes. Table 2 below provides a reconciliation of the financial accounting balance sheet to the regulatory balance sheet on an IFRSs basis.
It is the regulatory balance sheet, and not the financial accounting balance sheet, which forms the basis for the calculation of regulatory capital requirements. The alphabetic references in this table link to the corresponding references in table 3: ‘Composition of Regulatory Capital’ on page 9, identifying those balances which form part of that calculation.

H S B C H O L D I N G S P L C
Capital and Risk Management Pillar 3 Disclosures at 31 December 2012 (continued)
Page 6
Table 2: Reconciliation of balance sheets – financial accounting to regulatory scope of consolidation
At 31 December 2012
Ref
Accounting balance sheet
Deconsol- idation of insurance/ other entities
Consolidation of banking associates
Regulatory balance sheet
US$bn US$bn US$bn US$bn Assets Trading assets ................................................................................. 408.8 (0.1) 1.5 410.2 Loans and advances to customers .................................................. 997.6 (11.9) 119.7 1,105.4
– of which: impairment allowances on IRB portfolios ............... i (10.3) – – (10.3)– impairment allowances on STD portfolios ............................... k (5.9) – (2.7) (8.6)
Financial investments ..................................................................... 421.1 (50.3) 33.1 403.9 Capital invested in insurance and other entities ............................. – 8.4 – 8.4 Interests in associates and joint ventures ....................................... 17.8 – (17.1) 0.7
– of which: positive goodwill on acquisition .............................. h 0.7 – (0.6) 0.1
Goodwill and intangible assets ....................................................... h 29.9 (5.0) 0.6 25.5 Other assets ..................................................................................... 817.3 (34.7) 82.5 865.1
– of which: goodwill and intangible assets of disposal groups held for sale h 0.1 (0.1) – –
– retirement benefit assets ........................................................... g 2.8 – – 2.8– impairment allowances on asset held for sale .......................... (0.7) – – (0.7)
of which: – IRB portfolios ..................................................................... i (0.7) – – (0.7)– STD portfolios .................................................................... k – – – –
Total assets .................................................................................... 2,692.5 (93.6) 220.3 2,819.2 Liabilities Deposits by banks ........................................................................... 107.4 (0.2) 51.3 158.5 Customer accounts .......................................................................... 1,340.0 (0.7) 158.6 1,497.9 Trading liabilities ............................................................................ 304.6 (0.1) 0.1 304.6 Financial liabilities designated at fair value ................................... 87.7 (12.4) – 75.3
of which: term subordinated debt included in tier 2 capital ........ m 16.9 – – 16.9– hybrid capital securities included in tier 1 capital..................... j 4.7 – – 4.7
Debt securities in issue ................................................................... 119.5 (11.4) 1.9 110.0 Retirement benefit liabilities .......................................................... g 3.9 – 0.1 4.0 Subordinated liabilities ................................................................... 29.5 – 2.9 32.4
of which: hybrid capital securities included in tier 1 capital ...... j 2.8 – – 2.8– perpetual subordinated debt included in tier 2 capital ............. l 2.8 – – 2.8– term subordinated debt included in tier 2 capital ..................... m 23.9 – – 23.9
Other liabilities ............................................................................... 516.8 (67.6) 5.4 454.6 of which contingent liabilities and contractual commitments ... 0.3 – – 0.3
of which: – credit related provisions on IRB portfolios ........................ i 0.3 – – 0.3– credit related provisions on STD portfolios ....................... k – – – –
Total shareholders’ equity .............................................................. a 175.2 (0.6) – 174.6
of which: other equity instruments included in tier 1 capital ...... c,j 5.9 – – 5.9– preference share premium included in tier 1 capital ................ b 1.4 – – 1.4
Non-controlling interests ................................................................ d 7.9 (0.6) – 7.3 of which: non-cumulative preference shares issued by
subsidiaries included in tier 1 capital ...................................... e 2.4 – – 2.4– non controlling interests included in tier 2 capital,
cumulative preferred stock ...................................................... f 0.3 – – 0.3– non-controlling interests attributable to holders of ordinary
shares in subsidiaries included in tier 2 capital ............ …….. f,m 0.2 – – 0.2
Total liabilities and equity ........................................................... 2,692.5 (93.6) 220.3 2,819.2

H S B C H O L D I N G S P L C
Capital and Risk Management Pillar 3 Disclosures at 31 December 2012 (continued)
Page 7
Structure of the regulatory group
HSBC’s organisation is that of a financial holding company whose major subsidiaries are almost entirely wholly-owned banking entities. A simplified organisation chart showing the difference between the accounting and regulatory consolidation groups is included at Appendix I to this report.
Interests in associates are equity accounted in the financial accounting consolidation, whereas their exposures are proportionally consolidated for regulatory purposes. Subsidiaries and associates engaged in insurance and non-financial activities are excluded from the regulatory consolidation and deducted from regulatory capital. The regulatory consolidation does not include SPEs where significant risk has been transferred to third parties. Exposures to these SPEs are risk-weighted as securitisation positions for regulatory purposes.
The capital invested in our insurance business that is deducted from regulatory capital was US$10.1bn at 31 December 2012 of which US$8.4bn is shown as ‘Capital invested in insurance and other entities’ in the column ‘Deconsolidation of insurance/other entities’ in the table above. The remainder of the balance related to regulatory adjustments to the insurance capital. The principal insurance entities comprising this balance are shown below.
The deconsolidation of SPEs connected to securitisation activity and other entities mainly impacts the adjustments to ‘Loans and advances to customers’, ‘financial investments’ and ‘debt securities in issue’. Further details about the use of SPEs in the Group’s securitisation programme are shown on page 502 in the Annual Report and Accounts 2012 and on page 52 of this report.
Principal insurance entities excluded from the regulatory consolidation HSBC Life (UK) Ltd HSBC Assurances Vie (France) HSBC Insurance (Asia) Ltd HSBC Life (International) Ltd Hang Seng Insurance Company Ltd HSBC Insurance (Singapore) Ltd HSBC Life Insurance Company Ltd HSBC Amanah Takaful (Malaysia) SB HSBC Seguros (Brasil) S.A. HSBC Vida e Previdência (Brasil) S.A. HSBC Seguros de Retiro (Argentina) S.A. HSBC Seguros de Vida (Argentina) S.A. HSBC Seguros S.A. (Mexico) HSBC Insurance Company of Delaware Household Life Insurance Company of Delaware
Principal SPEs excluded from the regulatory consolidation Regency Assets Ltd Mazarin Funding Ltd Barion Funding Ltd Malachite Funding Ltd Bryant Park Funding LLC Turquoise Receivables Trustee Ltd Performance Trust HSBC Bank Mexico Mortgage Trust 1
The principal associates in the regulatory consolidation at 31 December 2012 are shown below, representing almost 100% of our associates’ total assets consolidated for regulatory purposes at that date.
Principal associates of HSBC consolidated for regulatory purposes Bank of Communications Co., Limited Industrial Bank Co., Limited1 The Saudi British Bank Yantai Bank Co., Limited Vietnam Technological and Commercial Joint Stock Bank
1 On 7 January 2013, Industrial Bank Co. Ltd completed a private placement of additional share capital to a number of third parties, thereby diluting the Group’s equity holding. As a result of this and other factors, the Group ceased to account for the investment as an associate from that date.
Links to information on significant subsidiaries are available on our investor relations website page www.hsbc.com/investor-relations/financial-results.
Basis of measurement
The Pillar 3 Disclosures 2012 have been prepared in accordance with regulatory capital adequacy concepts and rules, while the Annual Report and Accounts 2012 is prepared in accordance with IFRSs. Therefore, some information in the Pillar 3 Disclosures 2012 is not directly comparable with the financial information in the Annual Report and Accounts 2012. The most significant difference relates to loans and advances to customers and banks as follows:
Regulatory position Credit exposures are defined as the amount at risk in the event of a default that is estimated by the Group under specified Basel II parameters which include, among others, the likelihood of future drawings of committed credit lines.
IFRSs position Loans and advances to customers/banks measured under IFRSs in the Annual Report and Accounts 2012 are reported at the balance sheet date and therefore do not reflect the likelihood of future drawings of committed credit lines.
H S B C H O L D I N G S P L C
Capital and Risk Management Pillar 3 Disclosures at 31 December 2012 (continued)
Page 8
Capital and Risk
Capital management
Our approach to capital management is driven by our strategic and organisational requirements, taking into account the regulatory, economic and commercial environment in which we operate. We aim to maintain a strong capital base to support the risks inherent in our business and invest in accordance with our six filters framework, exceeding both consolidated and local regulatory capital requirements at all times.
Our capital management process is set out in the annual Group capital plan, which is approved by the Board. HSBC Holdings is the primary provider of equity capital to its subsidiaries and also provides them with non-equity capital where necessary. These investments are substantially funded by HSBC Holdings’ own capital issuance and profit retention. As part of its capital management process, HSBC Holdings seeks to maintain a balance between the composition of its capital and its investment in subsidiaries.
Each subsidiary manages its own capital to support its planned business growth and meet its local regulatory requirements within the context of the Group capital plan. Capital generated by subsidiaries in excess of planned requirements is returned to HSBC Holdings, normally by way of dividends, in accordance with the Group’s capital plan. During 2011 and 2012, none of the Group’s subsidiaries experienced significant restrictions on paying dividends or repaying loans and advances.
At 31 December 2012, there were no known material impediments to the prompt payment of dividends by our subsidiaries or repayment of intra-group loans and advances when due. None of our subsidiaries which are not included in the regulatory consolidation has capital resources below their minimum regulatory requirement.
For further details of our approach to capital management, please see page 293 of the Annual Report and Accounts 2012.
Regulatory capital
For regulatory purposes, our capital base is divided into three main categories, namely core tier 1, tier 1 and tier 2, depending on the degree of permanency and loss absorbency exhibited:
Categories of capital: • core tier 1 capital comprises shareholders’ equity and
related non-controlling interests. The book values of goodwill and intangible assets are deducted from core tier 1 capital, and other regulatory adjustments are made for items reflected in shareholders’ equity which are treated differently for the purposes of capital adequacy;
• other tier 1 capital includes qualifying capital instruments such as non-cumulative perpetual preference shares and hybrid capital securities; and
• tier 2 capital comprises qualifying subordinated loan capital, related non-controlling interests, allowable collective impairment allowances and unrealised gains arising on the fair valuation of equity instruments held as available for sale (‘AFS’). Tier 2 capital also includes reserves arising from the revaluation of properties.
To ensure the overall quality of the capital base, the FSA’s rules set restrictions on the amount of hybrid capital instruments that can be included in tier 1 capital relative to core tier 1 capital, and limit overall tier 2 capital to no more than tier 1 capital. We complied with the FSA’s capital adequacy requirements throughout 2011 and 2012.
The eligibility requirements in the UK for non-equity instruments under Basel III rules remained unclear, so we did not issue any such capital securities during 2012.
All capital securities included in the capital base of HSBC have been issued in accordance with the rules and guidance in the FSA’s General Prudential Sourcebook (‘GENPRU’). The main features of capital securities issued by the Group, categorised by tier 1 and tier 2 capital, are set out on pages 480, 494 and 495 of the Annual Report and Accounts 2012. The values disclosed there are the IFRSs balance sheet carrying amounts, however, not the amounts that these instruments contribute to regulatory capital. For example, the IFRSs accounting and the regulatory treatments differ in their approaches to issuance costs or regulatory amortisation.
The composition of capital under the current regulatory requirement is provided in the table below. The alphabetic references link back to table 2: ‘Reconciliation of balance sheets – financial accounting to regulatory scope of consolidation’, which shows where these items are presented in the respective balance sheets. Not all items are reconcilable, due to regulatory adjustments that are applied, for example to non-core capital instruments before they can be included in the Group’s regulatory capital base.

H S B C H O L D I N G S P L C
Capital and Risk Management Pillar 3 Disclosures at 31 December 2012 (continued)
Page 9
Table 3: Composition of regulatory capital
At 31 December 2012 2011 Ref1 US$bn US$bn Tier 1 capital Shareholders’ equity ...................................................................................................................... 167.3 154.1
Shareholders’ equity per balance sheet2 .................................................................................... a 175.2 158.7Preference share premium ......................................................................................................... b (1.4) (1.4)Other equity instruments ........................................................................................................... c (5.9) (5.9)Deconsolidation of special purpose entities3 ............................................................................ a (0.6) 2.7
Non-controlling interests ............................................................................................................... 4.4 4.0 Non-controlling interests per balance sheet .............................................................................. d 7.9 7.4Preference share non-controlling interests ................................................................................ e (2.4) (2.4)Non-controlling interests transferred to tier 2 capital ............................................................... f (0.5) (0.5)Non-controlling interests in deconsolidated subsidiaries ......................................................... d (0.6) (0.5)
Regulatory adjustments to the accounting basis ........................................................................... (2.4) (4.4)Unrealised losses on available-for-sale debt securities4 ........................................................... 1.2 2.2Own credit spread ...................................................................................................................... 0.1 (3.6)Defined benefit pension fund adjustment5 ................................................................................ g (0.4) (0.4)Reserves arising from revaluation of property and unrealised gains on
available-for-sale equities .........................................................................................................
(3.3) (2.7)Cash flow hedging reserve ........................................................................................................ – 0.1
Deductions ..................................................................................................................................... (30.5) (31.3)Goodwill and intangible assets ................................................................................................. h (25.7) (27.5)50% of securitisation positions ................................................................................................. (1.8) (1.2)50% of tax credit adjustment for expected losses ..................................................................... 0.1 0.250% of excess of expected losses over impairment allowances ............................................... i (3.1) (2.8)
Core tier 1 capital ........................................................................................................................ 138.8 122.4 Other tier 1 capital before deductions ........................................................................................... 17.3 17.9
Preference share premium ......................................................................................................... b 1.4 1.4Preference share non-controlling interests ................................................................................ e 2.4 2.4Hybrid capital securities ............................................................................................................ j 13.5 14.1
Deductions ..................................................................................................................................... (5.1) (0.8)Unconsolidated investments6 .................................................................................................... (5.2) (1.0)50% of tax credit adjustment for expected losses ..................................................................... 0.1 0.2
Tier 1 capital ................................................................................................................................ 151.0 139.5 Tier 2 capital Total qualifying tier 2 capital before deductions .......................................................................... 48.2 48.7
Reserves arising from revaluation of property and unrealised gains on available-for-sale equities .........................................................................................................
3.3 2.7
Collective impairment allowances ............................................................................................ k 2.7 2.7Perpetual subordinated debt ...................................................................................................... l 2.8 2.8Term subordinated debt ............................................................................................................. m 39.1 40.2Non-controlling interests in tier 2 capital ................................................................................. f 0.3 0.3
Total deductions other than from tier 1 capital (18.4) (17.9)Unconsolidated investments6 .................................................................................................... (13.5) (13.9)50% of securitisation positions ................................................................................................. (1.8) (1.2)50% of excess of expected losses over impairment allowances ............................................... i (3.1) (2.8)
Total regulatory capital .............................................................................................................. 180.8 170.3
For footnotes, see page 10.
H S B C H O L D I N G S P L C
Capital and Risk Management Pillar 3 Disclosures at 31 December 2012 (continued)
Page 10
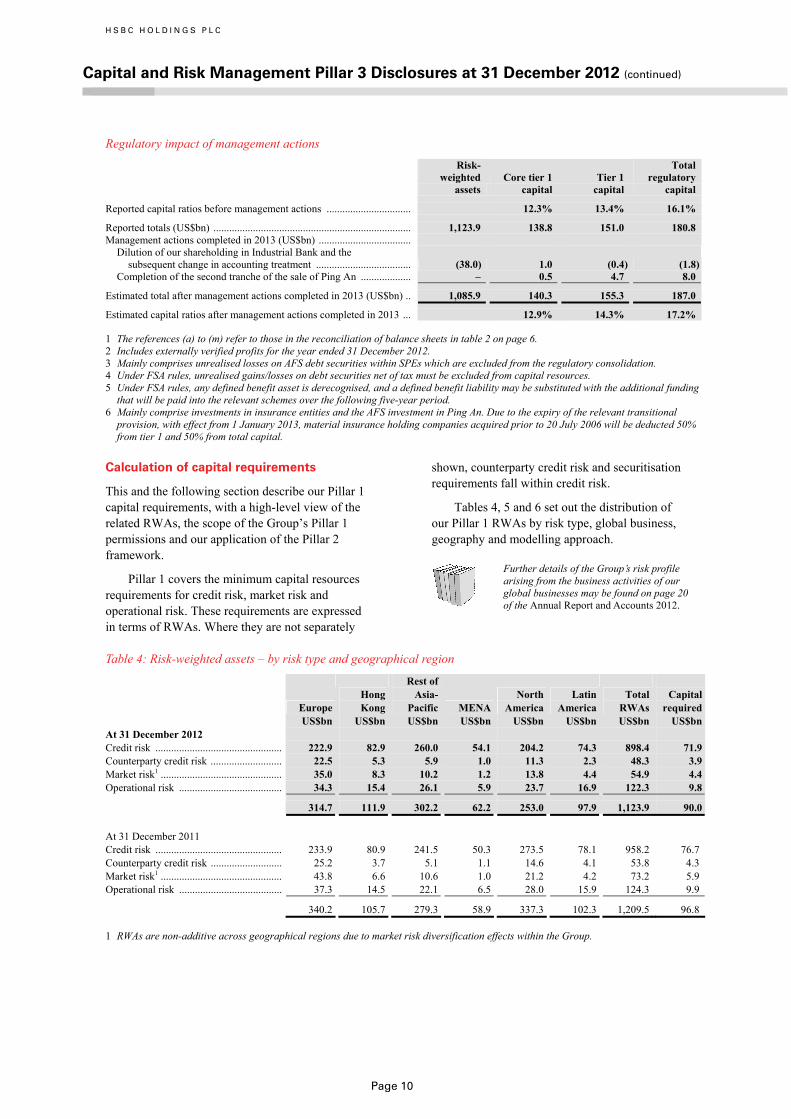
Regulatory impact of management actions
Risk- weighted assets
Core tier 1 capital
Tier 1 capital
Total regulatory capital
Reported capital ratios before management actions ................................ 12.3% 13.4% 16.1%
Reported totals (US$bn) ........................................................................... 1,123.9 138.8 151.0 180.8 Management actions completed in 2013 (US$bn) ...................................
Dilution of our shareholding in Industrial Bank and the subsequent change in accounting treatment .................................... (38.0) 1.0 (0.4) (1.8)
Completion of the second tranche of the sale of Ping An ................... – 0.5 4.7 8.0
Estimated total after management actions completed in 2013 (US$bn) .. 1,085.9 140.3 155.3 187.0
Estimated capital ratios after management actions completed in 2013 ... 12.9% 14.3% 17.2%
1 The references (a) to (m) refer to those in the reconciliation of balance sheets in table 2 on page 6. 2 Includes externally verified profits for the year ended 31 December 2012. 3 Mainly comprises unrealised losses on AFS debt securities within SPEs which are excluded from the regulatory consolidation. 4 Under FSA rules, unrealised gains/losses on debt securities net of tax must be excluded from capital resources. 5 Under FSA rules, any defined benefit asset is derecognised, and a defined benefit liability may be substituted with the additional funding
that will be paid into the relevant schemes over the following five-year period. 6 Mainly comprise investments in insurance entities and the AFS investment in Ping An. Due to the expiry of the relevant transitional
provision, with effect from 1 January 2013, material insurance holding companies acquired prior to 20 July 2006 will be deducted 50% from tier 1 and 50% from total capital.
Calculation of capital requirements
This and the following section describe our Pillar 1 capital requirements, with a high-level view of the related RWAs, the scope of the Group’s Pillar 1 permissions and our application of the Pillar 2 framework.
Pillar 1 covers the minimum capital resources requirements for credit risk, market risk and operational risk. These requirements are expressed in terms of RWAs. Where they are not separately
shown, counterparty credit risk and securitisation requirements fall within credit risk.
Tables 4, 5 and 6 set out the distribution of our Pillar 1 RWAs by risk type, global business, geography and modelling approach.
Further details of the Group’s risk profile arising from the business activities of our global businesses may be found on page 20 of the Annual Report and Accounts 2012.
Table 4: Risk-weighted assets – by risk type and geographical region
Europe Hong Kong
Rest of Asia- Pacific MENA
North America
Latin America
Total RWAs
Capital required
US$bn US$bn US$bn US$bn US$bn US$bn US$bn US$bnAt 31 December 2012 Credit risk ................................................ 222.9 82.9 260.0 54.1 204.2 74.3 898.4 71.9Counterparty credit risk ........................... 22.5 5.3 5.9 1.0 11.3 2.3 48.3 3.9Market risk1 .............................................. 35.0 8.3 10.2 1.2 13.8 4.4 54.9 4.4Operational risk ....................................... 34.3 15.4 26.1 5.9 23.7 16.9 122.3 9.8
314.7 111.9 302.2 62.2 253.0 97.9 1,123.9 90.0 At 31 December 2011 Credit risk ................................................ 233.9 80.9 241.5 50.3 273.5 78.1 958.2 76.7 Counterparty credit risk ........................... 25.2 3.7 5.1 1.1 14.6 4.1 53.8 4.3 Market risk1 .............................................. 43.8 6.6 10.6 1.0 21.2 4.2 73.2 5.9 Operational risk ....................................... 37.3 14.5 22.1 6.5 28.0 15.9 124.3 9.9
340.2 105.7 279.3 58.9 337.3 102.3 1,209.5 96.8
1 RWAs are non-additive across geographical regions due to market risk diversification effects within the Group.

H S B C H O L D I N G S P L C
Capital and Risk Management Pillar 3 Disclosures at 31 December 2012 (continued)
Page 11
Table 5: Risk-weighted assets – by global business and geographical region
Europe Hong Kong
Rest of Asia- Pacific MENA
North America
Latin America
Total RWAs
Capital required
US$bn US$bn US$bn US$bn US$bn US$bn US$bn US$bnAt 31 December 2012 Retail Banking and Wealth
Management ........................................ 49.4 18.6 33.0 7.6 140.7 27.3 276.6 22.1
Commercial Banking ............................... 88.7 41.7 155.9 27.6 46.5 36.6 397.0 31.8Global Banking and Markets1 ................. 158.5 42.5 102.3 24.8 59.2 33.8 403.1 32.3Global Private Banking ........................... 13.3 2.2 1.3 0.4 4.3 0.2 21.7 1.8Other2 ....................................................... 4.8 6.9 9.7 1.8 2.3 – 25.5 2.0
314.7 111.9 302.2 62.2 253.0 97.9 1,123.9 90.0
At 31 December 2011 Retail Banking and Wealth
Management ........................................ 49.9 17.3 32.5 8.1 214.7 28.7 351.2 28.1
Commercial Banking ............................... 88.3 38.8 147.6 26.2 43.5 38.5 382.9 30.6Global Banking and Markets1 ................. 182.0 40.3 85.3 23.0 72.1 34.5 423.0 33.9Global Private Banking ........................... 15.0 2.1 1.5 0.2 3.3 0.4 22.5 1.8Other2 ....................................................... 5.0 7.2 12.4 1.4 3.7 0.2 29.9 2.4
340.2 105.7 279.3 58.9 337.3 102.3 1,209.5 96.8
1 RWAs are non-additive across geographical regions due to market risk diversification effects within the Group. 2 Includes the results of certain property transactions, unallocated investment activities, centrally held investment companies, movements
in fair value of own debt, central support costs with associated recoveries, HSBC’s holding company and financing operations.
RWA planning
Pre-tax return on RWAs is an operational metric by which the global businesses are managed on a day-to-day basis. The metric combines return on equity and regulatory capital efficiency objectives. Top-down RWA targets, approved annually by the Group Management Board (‘GMB’), are established for our global businesses and regions in accordance with the Group’s strategic direction and risk appetite. Targets are set early in the annual planning process and inform the plan.
Business performance against the targets is monitored through reporting to the HSBC Holdings Asset and Liability Committee. The management of capital deductions is also addressed in the RWA monitoring framework through notional charges for these items, enabling a more holistic approach to performance measurement. A range of analysis is employed in the RWA monitoring framework to identify the key drivers of movements in the position, such as book size and book quality. Particular attention is paid to identifying and segmenting items within the day-to-day control of the business and those items that are driven by changes in risk models or regulatory methodology.
Movements in RWAs in 2012
The following commentary accompanies tables 4 and 5 above. RWAs fell in 2012 by US$86bn to US$1,124bn due to a combination of management actions and business movements mainly impacting
credit risk and market risk. The US$60bn decrease in credit risk RWAs was primarily attributable to the sale of the US Card and Retail Services business in RBWM North America in April 2012, with an effect of US$39bn. The first tranche of the sale of the Group’s stake in Ping An Insurance (Group) Company of China Limited (‘Ping An’), and the subsequent accounting reclassification of the remaining holding from an associate to an available-for-sale (‘AFS’) investment, resulted in a year-on-year reduction in credit risk RWAs of US$21bn, mainly in CMB, through relief from the requirement for proportional consolidation of associates.
We continued to manage the residual balances in the US Consumer Mortgage and Lending (‘CML’) and Other portfolio, yielding a reduction in credit risk RWAs of US$25bn. This was partly driven by a refinement in risk metrics through recalibration with more recent data observations. Other drivers of reductions included improved credit quality and the progression of assets into default as a result of the challenging conditions in the US mortgage market. As assets approach and go into default, capital requirements are increasingly reflected in an expected loss (‘EL’) deduction from capital, rather than a direct RWA impact. Further reductions were from a combination of run-off and write-offs.
The reductions achieved through management actions were partly offset by business movements. Our associates in mainland China (excluding Ping An) had an increase in credit risk RWAs of US$30bn,

H S B C H O L D I N G S P L C
Capital and Risk Management Pillar 3 Disclosures at 31 December 2012 (continued)
Page 12
primarily a result of loan growth in Bank of Communications and Industrial Bank, mainly in CMB and GB&M. Credit growth in Rest of Asia-Pacific and Hong Kong, with related RWA growth of US$9.3bn (excluding associates) and US$2.0bn respectively, was driven by higher levels of term lending and trade loans as well as off-balance sheet trade finance products.
In Europe, there was a US$11bn reduction in credit risk RWAs as a result of a number of drivers. In GB&M and CMB there was reduced lending to corporate customers in selected Eurozone countries, partially offset by increased lending and improved credit quality in the top CMB markets in Europe. Further drivers were rating agency actions on ABSs, where downgrades are reflected in reduced RWAs and increased capital deductions for securitisation positions: see ‘Composition of regulatory capital’ on page 9). In addition, there was an update in the regulatory treatment of European Economic Area (‘EEA’) central bank exposures to include them in the standardised approach. European retail RWAs reduced mainly as a result of reductions in regulatory exposures for credit card portfolios and an improvement in mortgage portfolio quality. In MENA and Latin America, the main credit risk RWA movements were from mergers and acquisitions, including in Oman and UAE, and disposals in Costa Rica, Honduras and El Salvador.
Counterparty credit risk (‘CCR’) RWAs fell US$4.9bn mainly in GB&M during the year, primarily due to the increased application of
counterparty netting within the calculation and counterparty data refinement which allowed us to apply lower potential future exposure add-on factors. There were additional reductions in North America, due to a decrease in the GB&M legacy credit business and from maturing trades, and in Latin America due to reduced repo activity with central banks and lower exposure on derivative transactions.
Market Risk RWAs fell by US$18bn during the period, with the main driver being a reduction in risk levels of US$11bn, primarily as a result of decreasing internal Value at Risk (‘VAR’) due to reductions in exposure and improved market conditions. The factors impacting the reductions in VAR also resulted in reductions in the levels of stressed VAR. The impact was partly offset by a US$4.0bn increase in the incremental risk charge (‘IRC’) as a result of a recalibration of the sovereign correlation matrix. Further reductions of US$2.4bn were due to a lower VAR multiplier applied in France. Market risk RWA movements for portfolios out of scope of modelled approaches showed a reduction of US$8.0bn. This was mainly driven by management actions by GB&M to reduce legacy positions in North America.
Operational risk RWAs remained stable in 2012, being calculated on a three-year average of revenues.
Scope of Basel Pillar 1 approaches
The scope of permissible Basel approaches, and those that HSBC has adopted, are described below.
Risk category Scope of permissible approaches Approach adopted by HSBC
Credit risk Basel II applies three approaches of increasing sophistication to the calculation of Pillar 1 credit risk capital requirements. The most basic level, the standardised approach, requires banks to use external credit ratings to determine the risk weightings applied to rated counterparties. Other counterparties are grouped into broad categories and standardised risk weightings are applied to these categories. The next level, the IRB foundation approach, allows banks to calculate their credit risk capital requirements on the basis of their internal assessment of a counterparty’s probability of default (‘PD’), but subjects their quantified estimates of EAD and LGD to standard supervisory parameters. Finally, the IRB advanced approach allows banks to use their own internal assessment in both determining PD and quantifying EAD and LGD.
For consolidated Group reporting, we have adopted the IRB advanced approach for the majority of our business. Some portfolios remain on the standardised or foundation approaches under Basel II, pending the issuance of local regulations or model approval, or under exemptions from IRB treatment. Further information on our IRB roll-out plan may be found on page 29.
Counterparty credit risk Three approaches to calculating counterparty credit risk and determining exposure values are defined by Basel II: standardised, mark-to-market and internal model method (‘IMM’). These exposure values are used to determine capital requirements under one of the credit risk approaches; standardised, IRB foundation and IRB advanced.
We use the mark-to-market and IMM approaches for counterparty credit risk. Our aim is to increase the proportion of positions on IMM over time.

H S B C H O L D I N G S P L C
Capital and Risk Management Pillar 3 Disclosures at 31 December 2012 (continued)
Page 13
Risk category Scope of permissible approaches Approach adopted by HSBC
Equity
Equity exposures can be assessed under standardised or IRB approaches.
Most equity exposures within the Group are treated under the standardised approach. Our IRB equity exposures are treated under the simple risk weight approach.
Securitisation
Basel II specifies two methods for calculating credit risk requirements for securitisation positions in the non-trading book: the standardised approach and the IRB approach, which incorporates the Ratings Based Approach (‘RBM’), the Internal Assessment Approach (‘IAA’) and the Supervisory Formula Method (‘SFM’)
For the majority of the securitisation non-trading book positions we use the IRB approach, and within this principally the RBM, with lesser amounts on IAA and SFM. We also use the standardised approach for an immaterial amount of trading book positions.
Market risk
Market risk capital requirements can be determined under either the standard rules or the internal models approach. The latter involves the use of internal VAR models to measure market risks and determine the appropriate capital requirement. The IRC and comprehensive risk measure (‘CRM’) also apply.
The market risk capital requirement is measured using internal market risk models, where approved by the FSA, or the FSA standard rules. Our internal market risk models comprise VAR, stressed VAR, IRC and, in respect of correlation trading, the CRM.
Operational risk
Basel II allows for firms to calculate their operational risk capital requirement under the basic indicator approach, the standardised approach or the advanced measurement approach.
We have adopted the standardised approach in determining our operational risk capital requirement. Our medium term aim is to seek FSA approval to adopt the advanced measurement approach.
Table 6: Credit risk and counterparty credit risk – by model approach1 and exposure class
Total Standardised Foundation Advanced Total Capital EAD EAD RWAs EAD RWAs EAD RWAs RWAs required US$bn US$bn US$bn US$bn US$bn US$bn US$bn US$bn US$bn At 31 December 2012 Credit risk .......................................... 2,170.9 681.5 374.5 19.4 10.3 1,470.0 513.6 898.4 71.9 Counterparty credit risk ................. 141.4 5.8 2.6 3.5 1.8 132.1 43.9 48.3 3.9
2,312.3 687.3 377.1 22.9 12.1 1,602.1 557.5 946.7 75.8 Central governments and
central banks .............................. 545.1 179.6 0.9 – – 365.5 37.7 38.6 3.1 Institutions ..................................... 258.0 58.0 19.4 – – 200.0 43.1 62.5 5.0 Corporates ...................................... 813.1 257.6 239.9 22.9 12.1 532.6 278.5 530.5 42.5 Retail
Secured on real estate property . 362.7 45.3 24.0 – – 317.4 130.8 154.8 12.4 Qualifying revolving credit ....... 64.0 – – – – 64.0 16.2 16.2 1.3 SMEs ......................................... 13.1 – – – – 13.1 6.8 6.8 0.5 Other retail ................................. 113.0 52.9 40.1 – – 60.1 17.2 57.3 4.6
Equity ............................................. 3.1 2.8 2.8 – – 0.3 0.9 3.7 0.3 Securitisation positions .................. 49.1 – – – – 49.1 26.3 26.3 2.1 Other .............................................. 91.1 91.1 50.0 – – – – 50.0 4.0
2,312.3 687.3 377.1 22.9 12.1 1,602.1 557.5 946.7 75.8
Market risk ..................................... 54.9 4.4 Operational risk ............................. 122.3 9.8
1,123.9 90.0

H S B C H O L D I N G S P L C
Capital and Risk Management Pillar 3 Disclosures at 31 December 2012 (continued)
Page 14
Total Standardised Foundation Advanced Total Capital EAD EAD RWAs EAD RWAs EAD RWAs RWAs required US$bn US$bn US$bn US$bn US$bn US$bn US$bn US$bn US$bn At 31 December 2011 Credit risk ........................................... 2,183.1 591.2 372.1 16.5 8.5 1,575.4 577.6 958.2 76.7 Counterparty credit risk ................. 145.8 6.3 3.2 4.3 2.0 135.2 48.6 53.8 4.3
2,328.9 597.5 375.3 20.8 10.5 1,710.6 626.2 1,012.0 81.0 Central governments and
central banks .............................. 529.5 107.0 1.3 – – 422.5 42.0 43.3 3.5 Institutions ..................................... 251.4 42.0 14.0 – – 209.4 43.0 57.0 4.6 Corporates ...................................... 775.6 253.9 237.1 20.8 10.5 500.9 272.3 519.9 41.6 Retail
Secured on real estate property . 347.1 47.1 25.6 – – 300.0 153.6 179.2 14.3 Qualifying revolving credit ....... 142.6 – – – – 142.6 55.5 55.5 4.4 SMEs ......................................... 13.0 – – – – 13.0 7.0 7.0 0.6 Other retail ................................. 118.5 55.5 41.9 – – 63.0 23.0 64.9 5.2
Equity ............................................. 6.9 6.5 8.4 – – 0.4 1.6 10.0 0.8 Securitisation positions .................. 58.8 – – – – 58.8 28.2 28.2 2.3 Other .............................................. 85.5 85.5 47.0 – – – – 47.0 3.8
2,328.9 597.5 375.3 20.8 10.5 1,710.6 626.2 1,012.0 81.0 Market risk .................................... 73.2 5.9 Operational risk ............................. 124.3 9.9
1209.5 96.8
1 For further information on the approaches used, see page 29 for credit risk, page 48 for CCR, page 58 for market risk and page 61 for operational risk.
Key points • The proportion of portfolios on the IRB approach has reduced from 74% at 31 December 2011 to 70% at 31 December 2012 on an
exposure basis and from 63% to 60% on an RWA basis. This is driven by a combination of changes in regulatory approach, management actions, movement in legacy portfolios and business growth.
• For the change in the proportion of IRB in terms of exposures, the key driver was the change in regulatory methodology for the exposures to central banks in EEA member states, which moved US$79.7bn from IRB to standardised approach, at low risk weightings.
• Exposures secured on real estate property increased by US15.6bn, mainly due to high quality asset growth in the UK and Hong Kong mortgage portfolios, partially offset by the continued run-off of US mortgage portfolios.
• The RWA impact of the run-off together with the North American model recalibration resulted in a reduction in RWAs in the ‘Secured on real estate’ exposure class.
• The decrease in the ‘Qualifying revolving credit’ exposure of US$78.6bn was primarily attributable to the sale of the US Card and Retail Services business in North America in April 2012.
• Standardised exposure to corporates increased by US$3.7bn, mainly driven by an increase in lending in our Chinese associates of US$20.4bn, which was partially offset by a reduction in exposure of US$16.6bn due to the first tranche of the sale of our investment in Ping An.
• The increase in IRB advanced approach corporate exposures of US$31.7bn relates to high quality lending growth in North America, Hong Kong and Rest of Asia-Pacific. The less than proportionate increase in RWAs is a result of an increase in portfolio quality.
Pillar 2 and ICAAP
Pillar 2
The processes of internal capital adequacy assessment and supervisory review, known as Pillar 2, lead to final determination by the FSA of Individual Capital Guidance (‘ICG’) and any Capital Planning Buffer (‘CPB’) that may be required.
Within Pillar 2, Pillar 2A considers, in addition to the minimum capital requirements for Pillar 1 risks described above, any supplementary requirements for those risks and in addition any requirements for risk categories not captured by Pillar 1. Such categories include principally: pension risk, insurance risk, non-
trading book interest rate risk, structural foreign exchange risk, and concentration risks. Pillar 2A also estimates capital needed to compensate for any shortcomings in management, governance or controls, and to guard against unexpected losses while these deficiencies are addressed.
Pillar 2B considers the capital buffer a firm would require in order to remain above its ICG in adverse circumstances that may be largely outside the firm's normal and direct control, for example during a period of severe but plausible downturn stress, when asset values and the firm’s capital surplus may become strained. This is quantified via any CPB requirement the FSA may consider necessary. The

H S B C H O L D I N G S P L C
Capital and Risk Management Pillar 3 Disclosures at 31 December 2012 (continued)
Page 15
assessment of this is informed by stress tests and a rounded judgement of a firm’s business model, also taking into account a firm’s options and capacity to protect its capital position under stress, for instance through internal capital generation.
Complementing the above, in 2012 the FSA first advised the Group of a minimum level of capitalisation in the form of a CRF, expressed as a CET1 capital requirement calculated as a capital ratio on a Basel III end point basis, to be achieved by December 2013.
Internal capital adequacy assessment
Through the Internal Capital Adequacy Assessment Process (‘ICAAP’), GMB examines the Group’s risk profile from both regulatory and economic capital viewpoints, aiming to ensure that capital resources:
• remain sufficient to support our risk profile and outstanding commitments;
• exceed the formal regulatory minimum CRF target and CPB requirements by an agreed margin;
• allow the bank to remain adequately capitalised in the event of a severe economic downturn stress scenario; and
• remain consistent with our strategic and operational goals and our shareholder and investor expectations.
The minimum regulatory capital that we are required to hold is determined by the rules and guidance established by the FSA for the consolidated Group and by local regulators for individual Group companies. These capital requirements are a primary influence shaping the business planning process, in which top-down RWA targets are established for our global businesses and cascaded to lower levels in accordance with the Group’s strategic direction and risk appetite.
Economic capital is the internally calculated capital requirement which we deem necessary to support the risks to which we are exposed. The economic capital assessment is a more risk-sensitive measure than the regulatory minimum, as it covers a wider range of risks and takes account of the substantial diversification of risk accruing from our operations. Both the regulatory and the economic capital assessments rely upon the use of models that are integrated into our management of risk. Our economic capital models are calibrated to quantify the level of capital that is sufficient to absorb potential losses over a one-year time horizon to a 99.95% level of confidence for our banking activities, and to a
99.5% level of confidence for our insurance activities and pension risks.
Preserving our strong capital position remains a priority, and the level of integration of our risk and capital management helps to optimise our response to business demand for regulatory and economic capital. Risks that are explicitly assessed through economic capital, and those that are not, are compared in Appendix II.
Top and emerging risks
A list of our top and emerging risks is regularly evaluated to assess the impact of these risks on our core capital position. This evaluation extends to a number of risks not technically within the scope of the list, but which are identified as presenting risks to capital due to their potential to impact the Group’s risk-weighted asset and/or capital supply position. The downside or upside scenarios are assessed against the Group’s capital management objectives and mitigating actions assigned to senior management as necessary.
Stress testing
Stress testing and scenario analysis are central to the monitoring of top and emerging risks, helping us to understand the sensitivities of the core assumptions in our capital plans to the adverse effect of extreme but plausible events. Stress testing allows us to formulate our response and mitigate risk in advance of conditions exhibiting the stresses identified in the scenarios.
Actual market stresses which occurred throughout the financial system in recent years have been used to inform our capital planning process and enhance the stress scenarios we employ. In addition to our internal stress tests, others are undertaken at the request of regulators using their prescribed assumptions, and by the regulators themselves. We take into account the results of all such stress testing when assessing our internal and regulatory capital requirements.
The Stress Testing and Economic Capital Committee, which reports to the Risk Management Meeting (‘RMM’) exercises governance, oversight and approval authority over ICAAP and economic capital models.
Further details of the Group’s stress testing activities, areas of special interest and top and emerging risks are given on pages 127, 128 and 130 of the Annual Report and Accounts 2012, respectively.

H S B C H O L D I N G S P L C
Capital and Risk Management Pillar 3 Disclosures at 31 December 2012 (continued)
Page 16
Basel III and CRD IV
In July 2011, the European Commission published proposals for a new Regulation and Directive, known collectively as CRD IV, to give effect to the Basel III framework in the EU. The majority of the Basel III proposals are in the Regulation, removing national discretion. However, capital buffers such as those for countercyclical purposes and capital conservation are in the Directive and so subject to transposition into national law by member states.
During 2012, the EBA issued a number of consultations on the draft regulatory technical standards which will form part of the Regulation. Further consultative documents are expected during 2013 and beyond, and we will continue to assess the effect on HSBC. The CRD IV legislation is in draft and remains subject to agreement by the European Parliament, Council and Commission; the timing of implementation remains uncertain.
Impact of Basel III and CRD IV on the capital position
The CRD IV rule changes introduce a revised definition of regulatory capital focused on CET1 as the predominant form of going concern capital, to be held by banks in greater amounts. This higher tier of capital is subject to increased capital deductions and new regulatory adjustments. The new rules also introduce increased RWA requirements, mainly for counterparty credit risk.
The Basel III rules and the current draft CRD IV set out a minimum CET1 requirement of 4.5%, and an additional CET1 capital conservation buffer requirement of 2.5%, to become fully effective from 1 January 2019. The G-SIB buffer set alongside the Basel III framework is expected to require that we hold an additional 2.5% CET1 by the same date. This was the level of G-SIB charge determined in the most recent interim assessment of HSBC, in November 2012, with the first definitive assessment to be made in 2014.
Therefore, the total CET1 requirements that we estimated we would need to meet by January 2019 translated into an estimated baseline minimum CET1 ratio of 9.5%. More recently, however, the FSA’s
advice to us of a CRF effectively accelerates our compliance with Basel III.
The draft CRD IV also provides for a counter-cyclical capital buffer to be phased in, and proposes national regulator discretion to require a higher countercyclical buffer and/or to accelerate the timing of its introduction.
In January 2013, the interim FPC outlined draft powers on the use of such macro-prudential tools. First, a counter-cyclical capital buffer, in order to protect the banking sector from future potential losses if the FPC judged that a threat to financial stability had arisen in the UK. Second, supplementary to the above, capital buffers for specific customer sectors or more granular segments of those sectors.
The effect of such macro-prudential requirements cannot be precisely estimated at present, given the draft status of the rules and the fact that such buffers are likely to vary depending on the macro-prudential environment, but they could potentially give rise to significant further CET1 requirements by 1 January 2019.
Following the FSA’s setting of a CRF, and in order to manage our transition to Basel III under CRD IV, we show in the table below the possible effects of these rules on our capital position. We have estimated our pro-forma CET1 ratio by applying our interpretation of the CRD IV draft July 2011 text post the transition period (end point CRD IV) to our balance sheet position at 31 December 2012.
In managing our capital position to meet our internal CET1 target, we consider management actions resulting from our six filters strategy that we either have already taken, or would take if the CRD IV rules were to be finalised in their July 2011 form. These are reflected in the table under ‘management actions’. Other management actions could also be taken, dependent upon the finalised rules and timing of their implementation but, as such, have not been included.
The application of the CRD IV rules on this basis would translate into an estimated CET1 ratio of 9.0% before management actions and 10.3% after such actions.

H S B C H O L D I N G S P L C
Capital and Risk Management Pillar 3 Disclosures at 31 December 2012 (continued)
Page 17
Table 7: Estimated impact of CRD IV end point rules applied to the 31 December 2012 position
At 31 December 2012
RWAs US$bn
Capital US$bn
Reported core tier 1 capital under the current regime .................................................................................... 138.8
Regulatory adjustments applied to core tier 1 in respect of amounts subject to CRD IV treatment Investments in own shares through the holding of composite products of which HSBC is a component
(exchange traded funds, derivatives, and index stock) ..........................................................................
(1.3)Surplus non-controlling interest disallowed in CET1 ............................................................................... (2.3)Removal of filters under current regime – Unrealised gains/(losses) on available-for-sale debt securities ............................................................. (1.2)– Unrealised gains on available-for-sale equities ...................................................................................... 2.1 – Reserves arising from revaluation of property ...................................................................................... 1.2 – Defined benefit pension fund liabilities ................................................................................................. (1.6)Excess of expected losses over impairment allowances deducted 100% from CET1 .............................. (3.1)Removal of 50% of tax credit adjustment for expected losses .................................................................. (0.1)Securitisation positions risk-weighted under CRD IV ............................................................................... 1.8 Deferred tax liabilities on intangibles ........................................................................................................ 0.3 Deferred tax assets that rely on future profitability (excluding those arising from temporary
differences) .............................................................................................................................................
(0.5)Additional valuation adjustment (referred to as PVA) .............................................................................. (1.7)Debit valuation adjustment ........................................................................................................................ (0.4)Individually immaterial holdings in CET 1 capital of banks, financial institutions and insurance in
aggregate above 10% of HSBC CET1 ..................................................................................................
(6.0)Deductions under threshold approach
Amount exceeding the 10% threshold: – Significant investments in CET1 capital of banks, financial institutions and insurance .................. (6.7)
Amount in aggregate exceeding the 15% threshold: – Significant investments in CET1 capital of banks, financial institutions and insurance .................. (2.3)– Deferred tax assets ............................................................................................................................. (1.5)
Estimated CET1 capital under CRD IV .................................................................................................... 115.5
Reported total RWAs ..................................................................................................................................... 1,123.9
Changes to capital requirements introduced by CRD IV Credit valuation adjustment ....................................................................................................................... 60.4 Counterparty credit risk (other than credit valuation adjustment) ............................................................. 25.7 Amounts in aggregate below 15% threshold and therefore subject to 250% risk weight ......................... 43.3 Securitisation positions and free deliveries risk-weighted under CRD IV ............................................... 44.5 Investments in commercial entities now risk-weighted ............................................................................ 0.4 Deferred tax assets moved to threshold deduction under CRD IV ............................................................ (9.0)
Estimated total RWAs under CRD IV ....................................................................................................... 1,289.2
Estimated CET1 ratio .................................................................................................................................. 9.0%
Estimated regulatory impact of management actions Management actions completed in 2013:
Dilution of our shareholding in Industrial Bank and the subsequent change in accounting treatment .... (38.8) (2.2)Completion of the second tranche of the sale of Ping An ......................................................................... 3.5 9.4
Estimated total after management actions completed in 2013 ....................................................................... 1,253.9 122.7
Estimated CET1 ratio after management actions completed in 2013 .................................................... 9.8%
Planned short-term management actions if rules are finalised in their current form: Mitigation of immaterial holdings1 ............................................................................................................ 2.6 7.0
Estimated total after planned management actions ........................................................................................ 1,256.5 129.7
Estimated CET1 ratio after planned management actions ...................................................................... 10.3%
1 This management action potentially arises only under rules on a CRD IV basis and has therefore not been included in Table 3, which is drawn up on the basis of the current rules.
The table above presents a reconciliation of our reported core tier 1 capital and RWAs position at 31 December 2012 to the pro-forma estimated CET1 capital and estimated RWAs based on our
interpretation of the July 2011 draft CRD IV regulation, supplemented by guidance provided by the FSA and our expectation of how these draft rules will be updated following EU negotiation. A detailed
H S B C H O L D I N G S P L C
Capital and Risk Management Pillar 3 Disclosures at 31 December 2012 (continued)
Page 18
basis of preparation can be found in the Annual Report and Accounts 2012 in the Appendix to Capital on page 298. CRD IV is not yet in law and its provisions are subject to ongoing negotiation and amendment; the finalised rules could result in a materially different impact on CET1 and RWAs.
The largest impact on our CET1 capital is the deduction of unconsolidated significant investments in banks, financial institutions and insurance entities of US$9.0bn (shown as US$6.7bn and US$2.3bn in table 7 above). This results from a re-allocation of current deductions to the CET1 tier of capital and from new rules for calculating the amounts to be deducted.
In addition to the above, the regulatory treatment applied to immaterial unconsolidated investments in banks, financial institutions and insurance entities, whereby a maturity restriction does not recognise the netting of long and short positions when the short position has a residual maturity of less than one year, even though these positions are hedged from a market risk perspective, results in an estimated deduction of US$6.0bn. The effect on capital is exacerbated by the impact on the threshold for other deductions.
If the rules were to be finalised in their current form, the holdings of such positions would generate a disproportionate capital cost and potentially the relevant business could be curtailed, closed or our hedging adjusted to negate the impact.
Capital management initiatives and management actions adopted by the Group in accordance with our six filters strategic framework have already contributed to mitigating the impact of the future rules. In 2012, this included the continuing run-off of capital-intensive portfolios including the US CML and the GB&M legacy credit portfolios, and the sale of the Card and Retail Services business. Furthermore, post year-end we sold our remaining investment in Ping An and reduced our percentage holding in Industrial Bank following a private placement by the company.
Whilst the effect of the future CRD IV rules is shown above on an end point basis, the rules allow for a transition period of six years to phase in the new deductions and regulatory adjustments. On a CRD IV first year transitional basis, if applied to our year end 2012 position, our CET1 ratio would be 11.5% before management actions.
As our CRF is calculated on a Basel III basis, we currently manage our capital position to meet an internal target CET1 ratio on a Basel III end point basis of 9.5% to 10.5% at year end 2013. We aim to
manage our capital position to ensure that it exceeds current regulatory requirements and that we are well placed to meet expected future requirements, reviewing our capital target ratios on an ongoing basis and reflecting any changes in the regulatory environment as they develop.
Supplementary Basel III disclosures
In the autumn of 2012, the FSA wrote to large firms setting out the disclosures at 2012 year-end which they required, using prescribed bases of preparation, on the estimated composition of regulatory capital and a leverage ratio under Basel III/CRD IV rules.
Composition of capital
A table of the estimated composition of regulatory capital under CRD IV rules on a first year transitional basis and the basis of preparation for this, including qualifications to be noted when assessing it, are set out in Appendix III.
Leverage ratio
The leverage ratio was introduced into the Basel III framework as a non risk-based backstop limit, to supplement risk-based capital requirements. It aims to constrain the build-up of excess leverage in the banking sector, introducing additional safeguards against model risk and measurement errors. The ratio is a volume-based measure calculated as Basel III tier 1 capital divided by total on- and off-balance sheet exposures.
Basel III provided for a transitional period for the introduction of this ratio, comprising a supervisory monitoring period to start in 2011 and a parallel run period from January 2013 to January 2017. During the parallel run, a minimum ratio of 3% would apply, with further calibration to be carried out in the first half of 2017 with a view to migrating to a Pillar 1 requirement from 1 January 2018. It was foreseen that the ratio should be publicly disclosed with effect from January 2015. This timeline has been adopted in the draft CRD IV legislation.
Monitoring of leverage has been part of HSBC’s regulatory reporting to the FSA since December 2010, but in the absence of final European rules and legislation the 3% ratio is not currently a requirement and the CRD IV timing of disclosure remains uncertain. However, accelerating the EU regulatory timeline, the FSA has required major UK banks to disclose an estimated leverage ratio at 2012 year-end, using a hybrid of Basel III and CRD IV rules as detailed in the ‘Leverage ratio basis of preparation’ in Appendix III. Our estimated Basel III/CRD IV end point leverage ratio on that basis was as follows:

H S B C H O L D I N G S P L C
Capital and Risk Management Pillar 3 Disclosures at 31 December 2012 (continued)
Page 19
Table 8: Estimated leverage ratio
At 31 Dec 2012 US$bn
Tier 1 capital under CRD IV (end point) ....... 115.8 Exposures after regulatory adjustments ……. 2,760.1
Estimated leverage ratio (end point) .............. 4.2%
The above excludes those tier 1 capital instruments which will be ineligible for inclusion in regulatory capital after the Basel III transitional period has fully elapsed. If we were to calculate by adding back those instruments, the effect would be to increase estimated end point tier 1 capital by US$17.3bn and the leverage ratio by some 60 basis points at 31 December 2012.
Risk management
Overview
All our activities involve to varying degrees the measurement, evaluation, acceptance and management of risks. As risk is not static, our risk profile continually alters as a result of change in the scope and impact of a wide range of factors, from geopolitical to transactional. Our risk management framework is designed for the continuous monitoring of the risk environment and an integrated evaluation of risks and their interactions.
The objective of risk management, shared across the organisation, is to support Group strategies to build sustainable, profitable businesses in the long-term interests of our shareholders and other stakeholders. We aim to ensure that risk management is embedded in how we run our business.
Risk management is embedded through: • a historically strong risk culture, with personal
accountability for decisions; • a formal governance structure, with a clear, well understood
framework of risk ownership, standards and policy; • the alignment of risk and business objectives, with
integration of risk appetite into business planning and capital management; and
• an independent and expert global risk function (‘Global Risk’).
Risk culture
HSBC has long recognised the importance of a strong risk culture, the fostering of which is a key responsibility of senior executives. Our global standards set the tone from the top, and are central to our approach to balancing risk and reward. All employees are accountable for identifying, assessing and managing risks within the scope of their assigned responsibilities. We have a system
of personal, not collective, authorities for lending decisions. Personal accountability, reinforced by our HSBC Values, helps sustain a disciplined and constructive culture of risk management and control throughout HSBC. This is reinforced by our approach to remuneration, which is discussed further on page 64 of this report.
Risk governance and risk appetite
Our risk governance structure and approach to risk appetite are set out in the report of the Group Risk Committee (‘GRC’) on page 323 and 325 of the Annual Report and Accounts 2012. This structure was augmented by the establishment on 18 January 2013 of the Financial System Vulnerabilities Committee, details of which are set out on page 328 of the Annual Report and Accounts 2012.
Risk management objectives are integrated into the performance scorecards of the heads of regions, global businesses and key functions from the GMB down, and cascaded through the organisation. The objectives of Global Risk are also aligned through this process with strategic business objectives.
Risk appetite is a key component of our management of risk. Our approach is designed to reinforce the integration of risk considerations into key business goals and planning processes. The risk appetite statement, which is approved annually by the Board under advice from the GRC, and whose implementation is overseen by the GMB, describes the quantum and types of risks that we are prepared to take in executing our strategy.
Diversification is an important aspect of our management of risk. Geographical diversification of our lending portfolio across the regions, together with our broad range of global businesses and products, supports our strategies for growth in faster-growing markets and those with international connectivity. It also ensures that we are not overly dependent upon particular countries or markets to generate income and growth. Diversification models are developed, in conjunction with the business, within Global Risk’s quantitative analytics discipline.
An established framework of risk ownership and documented standards, policy and procedures, supports effective risk management and internal control systems.
Further details on the risk appetite framework may be found on page 325 of the Annual Report and Accounts 2012.
H S B C H O L D I N G S P L C
Capital and Risk Management Pillar 3 Disclosures at 31 December 2012 (continued)
Page 20
Global Risk
Headed by the Group Chief Risk Officer (‘GCRO’), Global Risk is mandated to provide an expert, integrated and independent assessment of risks Group-wide.
Global Risk: • supports our regions and global businesses in the
development and achievement of strategic objectives; • partners the business in risk appetite planning and operation; • carries out central approvals, controls, risk systems
leadership and the analysis and reporting of management information;
• fosters development of Global Risk, a conservative but constructive Group risk culture;
• addresses risk issues in dealings with external stakeholders including regulators and analysts; and
• in addition to ‘business as usual’ operations, engages with business development activities such as new product approval and post-implementation review, and acquisition due diligence.
Risk measurement and reporting systems
The purpose of our risk measurement and reporting systems is to ensure that, as far as possible, risks are comprehensively captured with all the attributes necessary to support well-founded decisions, that those attributes are accurately assessed and that information is delivered in a timely way for those risks to be successfully managed and mitigated.
Risk measurement and reporting systems are also subject to a governance framework designed, to ensure that their build and implementation are fit for purpose and that they are functioning properly. Risk information technology (‘IT’) systems development is a key responsibility of the risk function globally, while the development and operation of risk rating and management systems and processes are ultimately subject to the oversight of the Board.
We invest significant resources in IT systems and processes in order to maintain and improve our risk management capabilities. Group policy promotes the deployment of preferred technology where practicable. Group standards govern the procurement and operation of systems used in our subsidiaries to process risk information within business lines and risk functions.
Risk measurement, monitoring and reporting structures deployed at Group Head Office level are replicated in global businesses and major operating
subsidiaries through a common operating model for integrated risk management and control. This model sets out the respective responsibilities of Head Office, regional and country level risk functions in respect of such matters as risk governance and oversight, compliance risks, approval authorities and lending guidelines, global and local scorecards, management information and reporting, and relations with third parties including regulators, rating agencies and auditors.
Risk analytics and model governance
Global Risk manages a number of analytics disciplines supporting rating and scoring models for different risk types and business segments, economic capital and stress testing. It formulates technical responses to industry developments and regulatory policy in the field of risk analytics, develops HSBC’s global risk models, and oversees local model development and use around the Group in progress toward our implementation targets for the IRB advanced approach.
Model governance is under the general oversight of Group Model Oversight Committee (‘Group MOC’). Group MOC is supported by specific global functional MOCs for Wholesale Credit and Market Risk (‘WCMR’) and RBWM, and has regional and entity-level counterparts with comparable terms of reference. This replaces the previous Group Credit Risk Analytics Oversight Committee structure. The Group MOC meets bi-monthly and reports to Risk Management Meeting (‘RMM’). It is chaired by the risk function, and its membership is drawn from Risk, Finance and global businesses.
Its primary responsibilities are to bring a strategic approach to model-related issues across the Group and to oversee the governance of our risk rating models, their consistency and approval, and the Basel framework. Through its oversight of the functional WCMR and RBWM MOCs, it identifies emerging risks for all aspects of the risk rating system, ensuring that model risk is managed within our Risk Appetite Statement, and formally advises RMM on any material model-related issues.
The development and use of data and models to meet local requirements are the responsibility of regional and/or local entities under the governance of their own management, subject to overall Group policy and oversight.

H S B C H O L D I N G S P L C
Capital and Risk Management Pillar 3 Disclosures at 31 December 2012 (continued)
Page 21
Credit risk
Overview and responsibilities
Credit risk represents our largest regulatory capital requirement.
The principal objectives of our credit risk management function are: • to maintain across HSBC a strong culture of responsible
lending, and a robust credit risk policy and control framework;
• to both partner and challenge our businesses in defining, implementing and continually re-evaluating our credit risk appetite under actual and stress scenario conditions; and
• to ensure there is independent, expert scrutiny of credit risks, their costs and their mitigation.
The credit risk functions within WCMR and RBWM are the constituent parts of Global Risk that support the GCRO in overseeing credit risks at the highest level. For this, their major duties comprise: undertaking independent reviews of large and high-risk credit proposals, large exposure policy and reporting oversight of our wholesale and retail credit risk management disciplines, ownership of our credit policy and credit systems programmes, portfolio management oversight and reporting on risk matters to senior executive management and to regulators.
These credit risk functions work closely with other parts of Global Risk, for example: with Security and Fraud Risk on enhancement of protection against retail product fraud, with Operational Risk on the internal control framework and with Risk Strategy on developing our economic capital model, risk appetite process and stress testing.
The credit responsibilities of Global Risk are described on page 252 of the Annual Report and Accounts 2012.
Group-wide, the credit risk functions comprise a network of credit risk management offices reporting within regional, integrated risk functions. They fulfil an essential role as independent risk control units distinct from business line management in providing an objective scrutiny of risk rating assessments, credit proposals for approval and other risk matters.
We operate through a hierarchy of personal credit limit approval authorities, not committee structures. Risk officers of individual operating companies, acting under authorities delegated by their boards and executive bodies within local and Group standards, are accountable for their recommendations and credit approval decisions. Each operating company is responsible for the quality and performance of its credit portfolios,
and for monitoring and controlling all credit risks in those portfolios in accordance with Group standards.
Above certain risk-based thresholds established in line with authorities delegated by the Board, Head Office concurrence must be provided for locally-approved facilities before they are extended to the customer. Moreover, risk proposals in certain portfolios – sovereign obligors, banks, some non-bank financial institutions and intra-Group exposures – are approved centrally in Global Risk to facilitate efficient control and the reporting of regulatory large and cross-border exposures.
Credit risk management
Our exposure to credit risk arises from a wide range of customer and product types, and the risk rating systems in place to measure and monitor these risks are correspondingly diverse. Each major subsidiary typically has some exposures across this range, and requirements may differ according to jurisdictions in which it operates.
Credit risk exposures are generally measured and managed in portfolios of either customer types or product categories. Risk rating systems are designed to assess the default propensity of, and loss severity associated with, distinct customers who are typically managed as individual relationships or, in the case of retail business, exposures on a product portfolio basis.
Risk rating systems for retail exposures are generally quantitative in nature, applying techniques such as behavioural analysis across product portfolios comprising large numbers of homogeneous transactions. Rating systems for individually managed relationships typically use customer financial statements and market data analysis, but also qualitative elements and a final subjective overlay to better reflect any idiosyncratic elements of the customer’s risk profile, see ‘Application of the IRB Approach’ on page 29.
Whatever the nature of the exposure, a fundamental principle of our policy and approach is that analytical risk rating systems and scorecards are all valuable tools at the disposal of management, informing judgemental decisions for which individual approvers are ultimately accountable.
In the case of automated decision-making processes, as used in retail credit origination where risk decisions may be taken ‘at the point of sale’ with no management intervention, that accountability rests with those responsible for the parameters built into those processes/systems and the governance and controls surrounding their use.

H S B C H O L D I N G S P L C
Capital and Risk Management Pillar 3 Disclosures at 31 December 2012 (continued)
Page 22
The credit process provides for at least an annual review of facility limits granted. Review may be more frequent, as required by circumstances, such as the emergence of adverse risk factors, and any consequent amendments to risk ratings must be promptly implemented.
We constantly seek to improve the quality of our risk management. For central management and reporting purposes, Group IT systems are deployed to process credit risk data efficiently and consistently. A central database is used, which covers substantially all our direct lending exposures and holds the output of risk rating systems Group-wide. This continues to be enhanced in order to deliver, at an increasingly granular level, comprehensive management information in support of business strategy, as well as solutions to evolving regulatory reporting requirements, such as the European common reporting requirements.
Group standards govern the process through which risk rating systems are initially developed, judged fit for purpose, approved and implemented; the conditions under which analytical risk model outcomes can be overridden by decision-takers; and the process of model performance monitoring and reporting. The emphasis is on an effective dialogue between business line and risk management, suitable independence of decision-takers, and a good understanding and robust challenge on the part of senior management.
Like other facets of risk management, analytical risk rating systems are not static and are subject to review and modification in the light of the changing environment, the greater availability and quality of data and any deficiencies identified through internal and external regulatory review. Structured processes and metrics are in place to capture relevant data and feed this into continuous model improvement. See also the comments on ‘Model performance’ on page 39.
Credit risk models governance
All new or materially changed IRB models require FSA approval, as set out in more detail on page 29 below. Throughout HSBC, such models fall directly under the remit of the global functional MOCs.
The global functional MOCs are responsible for defining the thresholds above which models require their approval, supporting both internal governance
and the FSA approval process, for example if they cover exposures generating credit risk capital requirements exceeding a prescribed threshold or are otherwise deemed material on grounds of risk, portfolio size, or business type.
WCMR MOC requires all credit risk models for which it is responsible to be submitted to it for approval, while RBWM MOC applies different thresholds depending on model type.
The RBWM MOC model materiality thresholds are: • IRB models exceeding, or estimated to exceed, US$2bn in
RWAs; • application models with annual proposed value of new
business sourced through the model exceeding US$2bn for secured lending and US$0.5bn for unsecured lending;
• behavioural models with managed total exposure exceeding US$2bn for secured lending and US$1bn for unsecured lending; and
• provisioning models with impairment change impact exceeding US$0.1bn. All models which require Global Functional MOC approval must first go through the local governance processes.
Global Risk utilises HSBC standards for the development, validation, independent review, approval, implementation and performance monitoring of credit risk rating models, and oversight of respective local standards for local models. All models must be reviewed at least annually, or more frequently as the need arises.
Compliance with HSBC standards is subject to examination both by risk oversight and review from within the risk function itself, and by internal audit. While the standards set out minimum general requirements, Global Risk has discretion to approve dispensations exceptionally, and fosters best practice between offices.
The following pages set out credit risk exposure values, RWAs and regulatory capital requirements calculated at 8% of RWAs. Table 10 presents exposure values analysed across geographical regions. Exposure values are allocated to a region based on the country of incorporation of the HSBC subsidiary or associate where the exposure was originated. In table 12, allocation to industry sectors is based on the sectoral classification of the lender, rather than any guarantor, if applicable. Table 13 shows exposures by period outstanding from the reporting date to the maturity date. The full exposure value is allocated to a residual maturity band based on the contractual end date.

H S B C H O L D I N G S P L C
Capital and Risk Management Pillar 3 Disclosures at 31 December 2012 (continued)
Page 23
Key points • In general, standardised RWA densities show a greater consistency across regions and exposure classes than advanced IRB, as the
advanced IRB approach reflects the relative risks of the different portfolios to a greater extent. • RWA densities for retail lending secured on real estate property are higher in North America due to challenging conditions in the US
mortgage market and extended foreclosure timelines. • RWA densities are lower in the home markets because of the resilience of the residential property sector in those markets which
warrants the application of lower LGDs to our exposures. • Central government RWA densities are higher in MENA reflecting the recent political upheaval and in Latin America due to economic
uncertainty in the region. • The RWA density for the US cards business sold in the year was higher than our other credit card portfolios, and so the sale contributed
towards the overall reduction. • The residual maturity profile of the book lengthened slightly during the year mainly due to the increased mortgage lending, which tends
to have a longer term than other exposures, in Europe and Hong Kong and other Asia-Pacific sites.
Table 9: Credit risk – summary
At 31 December 2012 At 31 December 2011
Exposure
value
Averageexposure
value RWAsCapital
requiredExposure
value
Average exposure
value RWAs
Capital required
US$bn US$bn US$bn US$bn US$bn US$bn US$bn US$bn Credit risk analysis by
exposure class IRB advanced approach .............. 1,470.0 1,551.2 513.6 41.1 1,575.4 1,532.9 577.6 46.2
Retail: – secured on real estate
property ............................. 317.4 310.7 130.8 10.5 300.0 298.5 153.6 12.3– qualifying revolving retail 64.0 95.6 16.2 1.3 142.6 143.9 55.5 4.4– SMEs1 ............................... 13.1 13.1 6.8 0.5 13.0 13.4 7.0 0.6– other retail ......................... 60.1 60.3 17.2 1.4 63.0 67.0 23.0 1.8
Total retail ................................ 454.6 479.7 171.0 13.7 518.6 522.8 239.1 19.1Central governments and
central banks ......................... 355.8 407.4 36.8 2.9 408.0 343.8 40.3 3.2Institutions ............................... 131.1 141.5 27.0 2.2 145.4 169.1 27.7 2.2Corporates ................................ 479.1 465.0 251.6 20.1 444.2 435.0 240.7 19.3Equity ....................................... 0.3 0.4 0.9 0.1 0.4 0.2 1.6 0.1Securitisation positions2 ........... 49.1 57.2 26.3 2.1 58.8 62.0 28.2 2.3
IRB foundation approach ........... 19.4 17.7 10.3 0.8 16.5 11.4 8.5 0.7 Corporates ................................ 19.4 17.7 10.3 0.8 16.5 11.4 8.5 0.7
Standardised approach ................ 681.5 630.2 374.5 30.0 591.2 563.0 372.1 29.8 Central governments and
central banks ......................... 177.4 117.1 0.9 0.1 104.6 91.9 1.3 0.1Institutions ............................... 57.5 56.4 19.4 1.6 41.9 42.5 14.0 1.1Corporates ................................ 254.5 259.9 237.3 19.0 250.1 230.9 233.9 18.7Retail ........................................ 52.9 53.9 40.1 3.2 55.5 55.8 41.9 3.4Secured on real estate property 45.3 47.4 24.0 1.9 47.1 42.4 25.6 2.0Past due items .......................... 4.4 4.3 6.0 0.5 4.0 4.0 5.3 0.4Regional governments or
local authorities ..................... 1.2 1.2 1.0 0.1 1.0 1.5 0.8 0.1Equity ....................................... 2.8 5.7 2.8 0.2 6.5 6.4 8.4 0.7Other items3 ............................. 85.5 84.3 43.0 3.4 80.5 87.6 40.9 3.3
2,170.9 2,199.1 898.4 71.9 2,183.1 2,107.3 958.2 76.7
1 The FSA allows exposures to small and medium-sized enterprises (‘SME’s) to be treated under the Retail IRB approach, where the total amount owed to the Group by the counterparty is less than EUR 1m and the customer is not managed individually as a corporate counterparty.
2 Excludes trading book securitisation positions and positions deducted from regulatory capital (that would be risk-weighted at 1,250%). 3 Primarily includes such items as fixed assets, prepayments, accruals and Hong Kong Government certificates of indebtedness.

H S B C H O L D I N G S P L C
Capital and Risk Management Pillar 3 Disclosures at 31 December 2012 (continued)
Page 24
Table 10: Credit risk exposure - by geographical region
Exposure value
Europe
Hong Kong
Rest of Asia- Pacific MENA
North America
Latin America Total
RWAs
RWA density
US$bn US$bn US$bn US$bn US$bn US$bn US$bn US$bn % At 31 December 2012 IRB advanced approach .................... 495.0 323.6 263.5 26.1 331.4 30.4 1,470.0 513.6 35
Retail: – secured on real estate property .. 148.6 50.6 35.2 – 83.0 – 317.4 130.8 41 – qualifying revolving retail ......... 34.4 23.6 – – 6.0 – 64.0 16.2 25 – SMEs1 ........................................ 11.6 0.8 – – 0.7 – 13.1 6.8 52 – other retail .................................. 39.0 11.1 2.9 – 7.1 – 60.1 17.2 29
Total retail: 233.6 86.1 38.1 – 96.8 – 454.6 171.0 38 Central governments and central
banks ........................................ 44.5 89.6 75.5 19.6 100.6 26.0 355.8 36.8 10 Institutions .................................... 25.9 37.3 38.5 6.4 18.6 4.4 131.1 27.0 21 Corporates ..................................... 146.4 110.1 111.1 0.1 111.4 – 479.1 251.6 53 Equity ........................................... 0.3 – – – – – 0.3 0.9 370 Securitisation positions2 ............... 44.3 0.5 0.3 – 4.0 – 49.1 26.3 54
IRB foundation approach ................. 13.4 – – 6.0 – – 19.4 10.3 53 Corporates .................................... 13.4 – – 6.0 – – 19.4 10.3 53
Standardised approach ...................... 223.8 42.7 274.0 49.1 19.4 72.5 681.5 374.5 55 Central governments and central
banks ........................................ 130.1 0.4 44.0 2.7 0.1 0.1 177.4 0.9 1 Institutions .................................... 3.0 0.1 52.0 2.4 – – 57.5 19.4 34 Corporates .................................... 50.3 3.6 127.3 32.7 2.5 38.1 254.5 237.3 93 Retail ............................................ 7.6 1.9 16.5 5.2 2.8 18.9 52.9 40.1 76 Secured on real estate property .... 9.8 2.4 22.5 2.8 2.2 5.6 45.3 24.0 53 Past due items ............................... 0.6 0.1 0.2 1.2 0.4 1.9 4.4 6.0 136 Regional governments or local
authorities ................................. – – – 0.1 – 1.1 1.2 1.0 86 Equity ........................................... 0.4 0.9 0.1 – 1.4 – 2.8 2.8 100 Other items3 .................................. 22.0 33.3 11.4 2.0 10.0 6.8 85.5 43.0 50
732.2 366.3 537.5 81.2 350.8 102.9 2,170.9 898.4 41
At 31 December 2011 IRB advanced approach .................... 557.8 300.2 240.9 25.3 413.3 37.9 1,575.4 577.6 37
Central governments and central banks ........................................ 109.5 71.5 75.4 18.4 98.5 34.7 408.0 40.3 10
Institutions .................................... 32.8 48.3 35.2 6.7 19.2 3.2 145.4 27.7 19 Corporates ..................................... 145.9 101.7 94.8 0.2 101.6 – 444.2 240.7 54 Retail ............................................ 214.8 77.8 35.1 – 190.9 – 518.6 239.1 46 Equity ........................................... 0.4 – – – – – 0.4 1.6 370 Securitisation positions2 ............... 54.4 0.9 0.4 – 3.1 – 58.8 28.2 48
IRB foundation approach ................. 12.7 – – 3.8 – – 16.5 8.5 52 Corporates .................................... 12.7 – – 3.8 – – 16.5 8.5 52
Standardised approach ...................... 150.8 42.9 255.6 43.4 21.9 76.6 591.2 372.1 63 Central governments and central
banks ........................................ 54.1 0.7 47.5 1.9 – 0.4 104.6 1.3 1 Institutions .................................... 4.0 0.4 35.9 1.6 – – 41.9 14.0 33 Corporates .................................... 53.8 2.4 121.6 30.3 2.5 39.5 250.1 233.9 94 Retail ............................................ 6.0 2.4 17.4 4.2 3.4 22.1 55.5 41.9 75 Secured on real estate property .... 10.4 2.8 23.2 2.4 2.7 5.6 47.1 25.6 54 Past due items ............................... 0.7 – 0.3 1.2 0.1 1.7 4.0 5.3 133 Regional governments or local
authorities ................................. – – – 0.2 – 0.8 1.0 0.8 80 Equity ........................................... 3.2 0.9 0.6 0.1 1.6 0.1 6.5 8.4 129 Other items3 .................................. 18.6 33.3 9.1 1.5 11.6 6.4 80.5 40.9 51
721.3 343.1 496.5 72.5 435.2 114.5 2,183.1 958.2 44
For footnotes, see page 23.
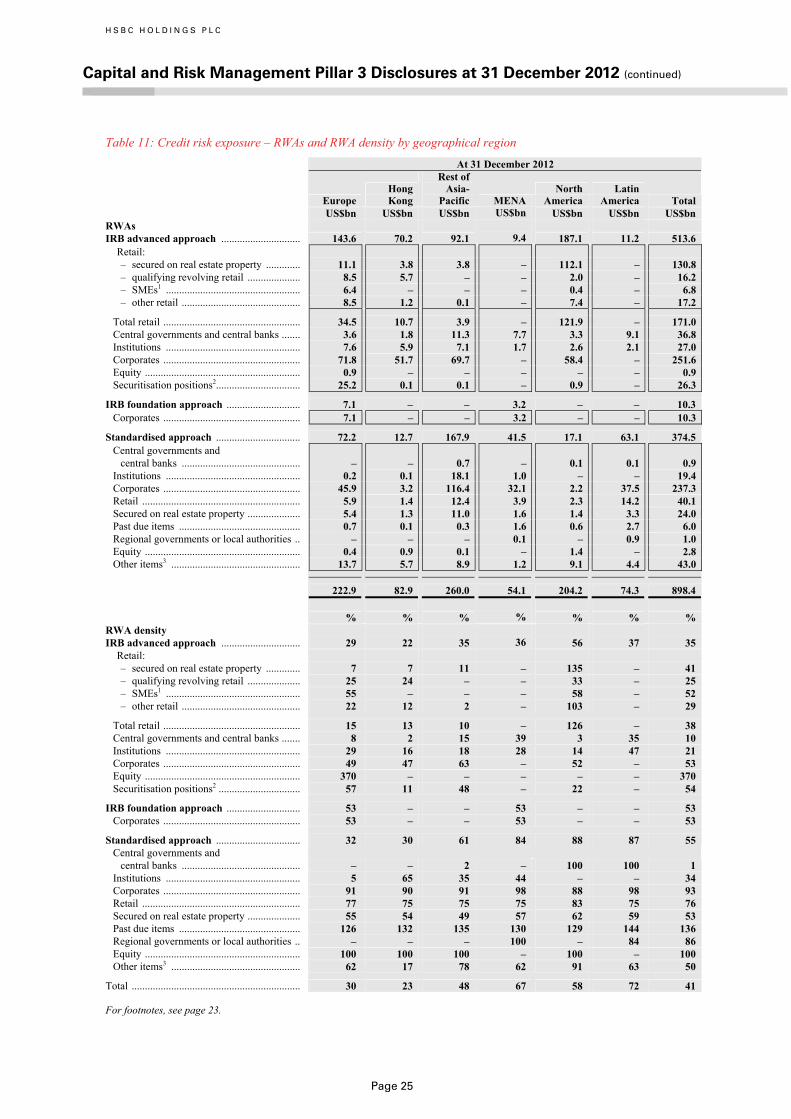
H S B C H O L D I N G S P L C
Capital and Risk Management Pillar 3 Disclosures at 31 December 2012 (continued)
Page 25
Table 11: Credit risk exposure – RWAs and RWA density by geographical region
At 31 December 2012
Europe Hong Kong
Rest of Asia- Pacific MENA
North America
Latin America Total
US$bn US$bn US$bn US$bn US$bn US$bn US$bn RWAs IRB advanced approach .............................. 143.6 70.2 92.1 9.4 187.1 11.2 513.6
Retail: – secured on real estate property ............. 11.1 3.8 3.8 – 112.1 – 130.8– qualifying revolving retail .................... 8.5 5.7 – – 2.0 – 16.2– SMEs1 ................................................... 6.4 – – – 0.4 – 6.8– other retail ............................................. 8.5 1.2 0.1 – 7.4 – 17.2
Total retail .................................................... 34.5 10.7 3.9 – 121.9 – 171.0Central governments and central banks ....... 3.6 1.8 11.3 7.7 3.3 9.1 36.8Institutions ................................................... 7.6 5.9 7.1 1.7 2.6 2.1 27.0Corporates .................................................... 71.8 51.7 69.7 – 58.4 – 251.6Equity ........................................................... 0.9 – – – – – 0.9Securitisation positions2................................ 25.2 0.1 0.1 – 0.9 – 26.3
IRB foundation approach ............................ 7.1 – – 3.2 – – 10.3 Corporates .................................................... 7.1 – – 3.2 – – 10.3
Standardised approach ................................ 72.2 12.7 167.9 41.5 17.1 63.1 374.5 Central governments and
central banks ............................................. – – 0.7 – 0.1 0.1 0.9Institutions ................................................... 0.2 0.1 18.1 1.0 – – 19.4Corporates .................................................... 45.9 3.2 116.4 32.1 2.2 37.5 237.3Retail ............................................................ 5.9 1.4 12.4 3.9 2.3 14.2 40.1Secured on real estate property .................... 5.4 1.3 11.0 1.6 1.4 3.3 24.0Past due items .............................................. 0.7 0.1 0.3 1.6 0.6 2.7 6.0Regional governments or local authorities .. – – – 0.1 – 0.9 1.0Equity ........................................................... 0.4 0.9 0.1 – 1.4 – 2.8Other items3 ................................................. 13.7 5.7 8.9 1.2 9.1 4.4 43.0
222.9 82.9 260.0 54.1 204.2 74.3 898.4 % % % % % % % RWA density IRB advanced approach .............................. 29 22 35 36 56 37 35
Retail: – secured on real estate property ............. 7 7 11 – 135 – 41 – qualifying revolving retail .................... 25 24 – – 33 – 25 – SMEs1 ................................................... 55 – – – 58 – 52 – other retail ............................................. 22 12 2 – 103 – 29
Total retail .................................................... 15 13 10 – 126 – 38 Central governments and central banks ....... 8 2 15 39 3 35 10 Institutions ................................................... 29 16 18 28 14 47 21 Corporates .................................................... 49 47 63 – 52 – 53 Equity ........................................................... 370 – – – – – 370 Securitisation positions2 ............................... 57 11 48 – 22 – 54
IRB foundation approach ............................ 53 – – 53 – – 53 Corporates .................................................... 53 – – 53 – – 53
Standardised approach ................................ 32 30 61 84 88 87 55 Central governments and
central banks ............................................. – – 2 – 100 100 1 Institutions ................................................... 5 65 35 44 – – 34 Corporates .................................................... 91 90 91 98 88 98 93 Retail ............................................................ 77 75 75 75 83 75 76 Secured on real estate property .................... 55 54 49 57 62 59 53 Past due items .............................................. 126 132 135 130 129 144 136 Regional governments or local authorities .. – – – 100 – 84 86 Equity ........................................................... 100 100 100 – 100 – 100 Other items3 ................................................. 62 17 78 62 91 63 50
Total ................................................................ 30 23 48 67 58 72 41
For footnotes, see page 23.

H S B C H O L D I N G S
Capital and Risk Management Pillar 3 Disclosures at 31 December 2012 (continued)
Page 26
Tabl
e 12
: Cre
dit r
isk
expo
sure
- by
indu
stry
sect
or
E
xpos
ure
valu
e
Pe
rson
al
Man
u-fa
ctur
ing
Inte
r-na
tiona
ltr
ade
and
serv
ices
Prop
erty
and
othe
rbu
sine
ssac
tiviti
es
Gov
ernm
ent
and
publ
icad
min
-is
trat
ion
Oth
erco
mm
erci
al
Fina
ncia
l
Non
-cu
stom
eras
sets
T
otal
US$
bn
US$
bn
US$
bn
US$
bn
US$
bn
US$
bn
US$
bn
US$
bn
US$
bn
At 3
1 D
ecem
ber
2012
IRB
adv
ance
d ap
proa
ch .
......
......
......
......
......
......
.....
443.
6 11
5.0
103.
6 12
6.9
98.5
70
.0
512.
4 –
1,47
0.0
Ret
ail:
– se
cure
d on
real
est
ate
prop
erty
.....
......
......
......
.....
317.
4–
––
––
––
317.
4–
qual
ifyin
g re
volv
ing
reta
il ...
......
......
......
......
......
.. 64
.0–
––
––
––
64.0
– SM
Es1 ..
......
......
......
......
......
......
......
......
......
......
....
–0.
82.
46.
80.
71.
60.
8–
13.1
– ot
her r
etai
l ...
......
......
......
......
......
......
......
......
......
.. 60
.1–
––
––
––
60.1
Tota
l ret
ail
......
......
......
......
......
......
......
......
......
......
.. 44
1.5
0.8
2.4
6.8
0.7
1.6
0.8
–45
4.6
Cen
tral g
over
nmen
ts a
nd c
entra
l ban
ks ..
......
......
...
––
––
77.3
0.2
278.
3–
355.
8In
stitu
tions
.....
......
......
......
......
......
......
......
......
......
...
–0.
1–
–1.
0–
130.
0–
131.
1C
orpo
rate
s ...
......
......
......
......
......
......
......
......
......
.....
2.1
114.
110
1.2
120.
119
.568
.253
.9–
479.
1Eq
uity
....
......
......
......
......
......
......
......
......
......
......
.....
––
––
––
0.3
–0.
3Se
curit
isat
ion
posi
tions
2 .....
......
......
......
......
......
......
–
––
––
–49
.1–
49.1
IRB
foun
datio
n ap
proa
ch ..
......
......
......
......
......
......
.. –
6.4
4.2
1.9
0.6
3.4
2.9
– 19
.4
Cor
pora
tes
......
......
......
......
......
......
......
......
......
......
......
. –
6.4
4.2
1.9
0.6
3.4
2.9
–19
.4
Stan
dard
ised
app
roac
h ...
......
......
......
......
......
......
.....
90.3
60
.3
56.3
58
.9
75.5
51
.3
208.
0 80
.9
681.
5 C
entra
l gov
ernm
ents
and
cen
tral b
anks
.....
......
......
–
––
–46
.6–
130.
8–
177.
4In
stitu
tions
.....
......
......
......
......
......
......
......
......
......
...
––
––
––
57.5
–57
.5C
orpo
rate
s ...
......
......
......
......
......
......
......
......
......
.....
2.8
59.0
53.2
52.0
24.7
48.5
14.3
–25
4.5
Ret
ail
......
......
......
......
......
......
......
......
......
......
......
....
45.6
1.1
2.5
1.4
1.2
0.8
0.3
–52
.9Se
cure
d on
real
est
ate
prop
erty
.....
......
......
......
......
. 39
.1–
–4.
8–
1.3
0.1
–45
.3Pa
st d
ue it
ems
......
......
......
......
......
......
......
......
......
...
2.8
0.2
0.5
0.3
0.1
0.4
0.1
–4.
4R
egio
nal g
over
nmen
ts o
r loc
al a
utho
ritie
s ...
......
...
––
––
1.0
–0.
2–
1.2
Equi
ty .
......
......
......
......
......
......
......
......
......
......
......
.. –
––
0.2
–0.
22.
4–
2.8
Oth
er it
ems3 ..
......
......
......
......
......
......
......
......
......
....
––
0.1
0.2
1.9
0.1
2.3
80.9
85.5
53
3.9
181.
7 16
4.1
187.
7 17
4.6
124.
7 72
3.3
80.9
2,
170.
9

H S B C H O L D I N G S
Capital and Risk Management Pillar 3 Disclosures at 31 December 2012 (continued)
Page 27
Ex
posu
re v
alue
Pe
rson
al
Man
u-
fact
urin
g
In
ter-
na
tiona
l tra
de a
nd
serv
ices
Prop
erty
an
d ot
her
busi
ness
ac
tiviti
es
Gov
ernm
ent
and
publ
ic
adm
in-
istra
tion
Oth
er
com
mer
cial
Fi
nanc
ial
Non
- c
usto
mer
a
sset
s To
tal
U
S$bn
U
S$bn
U
S$bn
U
S$bn
U
S$bn
U
S$bn
U
S$bn
U
S$bn
U
S$bn
At 3
1 D
ecem
ber 2
011
IR
B a
dvan
ced
appr
oach
.....
......
......
......
......
......
......
......
507.
5 10
9.1
97.0
12
1.8
121.
1 60
.5
558.
4 –
1,57
5.4
Cen
tral g
over
nmen
ts a
nd c
entra
l ban
ks .
......
......
.....
––
––
102.
30.
230
5.5
–40
8.0
Inst
itutio
ns .
......
......
......
......
......
......
......
......
......
......
..–
––
– 0.
7–
144.
7–
145.
4 C
orpo
rate
s ...
......
......
......
......
......
......
......
......
......
......
.1.
910
8.1
94.4
115.
1 17
.458
.748
.6–
444.
2 R
etai
l ....
......
......
......
......
......
......
......
......
......
......
......
..50
5.6
1.0
2.6
6.7
0.7
1.6
0.4
–51
8.6
Equi
ty ..
......
......
......
......
......
......
......
......
......
......
......
...–
––
– –
–0.
4–
0.4
Secu
ritis
atio
n po
sitio
ns2 .
......
......
......
......
......
......
.....
––
––
––
58.8
–58
.8
IRB
foun
datio
n ap
proa
ch ..
......
......
......
......
......
......
......
.–
5.9
3.6
1.7
0.6
2.9
1.8
– 16
.5
Cor
pora
tes
......
......
......
......
......
......
......
......
......
......
......
..–
5.9
3.6
1.7
0.6
2.9
1.8
–16
.5
Stan
dard
ised
app
roac
h ...
......
......
......
......
......
......
......
....
88.9
62
.8
58.2
52
.5
82.1
51
.9
119.
4 75
.4
591.
2 C
entra
l gov
ernm
ents
and
cen
tral b
anks
....
......
......
..–
––
– 52
.6–
52.0
–10
4.6
Inst
itutio
ns .
......
......
......
......
......
......
......
......
......
......
..–
––
– –
–41
.9–
41.9
C
orpo
rate
s ...
......
......
......
......
......
......
......
......
......
......
.2.
660
.754
.142
.1
25.5
49.3
15.8
–25
0.1
Ret
ail .
......
......
......
......
......
......
......
......
......
......
......
.....
45.4
1.6
3.6
1.7
1.3
1.2
0.7
–55
.5
Secu
red
on re
al e
stat
e pr
oper
ty .
......
......
......
......
......
38.8
––
7.3
–0.
90.
1–
47.1
Pa
st d
ue it
ems
......
......
......
......
......
......
......
......
......
....
2.1
0.3
0.4
0.6
0.1
0.3
0.2
–4.
0 R
egio
nal g
over
nmen
ts o
r loc
al a
utho
ritie
s ...
......
.....
––
––
0.8
–0.
2–
1.0
Equi
ty ..
......
......
......
......
......
......
......
......
......
......
......
...–
0.1
0.1
0.8
–0.
25.
3–
6.5
Oth
er it
ems3 .
......
......
......
......
......
......
......
......
......
......
–0.
1–
– 1.
8–
3.2
75.4
80.5
59
6.4
177.
8 15
8.8
176.
0 20
3.8
115.
3 67
9.6
75.4
2,
183.
1
For f
ootn
otes
see
page
23.

H S B C H O L D I N G S P L C
Capital and Risk Management Pillar 3 Disclosures at 31 December 2012 (continued)
Page 28
Table 13: Credit risk exposure - by residual maturity
Exposure value
Less than 1 year
Between 1 and 5 years
More than 5 years Undated
Total
RWAs US$bn US$bn US$bn US$bn US$bn US$bn At 31 December 2012 IRB advanced approach .............................. 647.2 385.3 437.1 0.4 1,470.0 513.6
Retail: – secured on real estate property ................ 3.1 6.1 308.2 – 317.4 130.8 – qualifying revolving retail ....................... 64.0 – – – 64.0 16.2 – SMEs1 ...................................................... 1.4 7.3 4.4 – 13.1 6.8 – other retail ................................................ 8.5 39.2 12.4 – 60.1 17.2
Total retail .................................................. 77.0 52.6 325.0 – 454.6 171.0 Central governments and central banks ..... 213.5 100.4 41.9 – 355.8 36.8 Institutions .................................................. 103.6 26.5 0.9 0.1 131.1 27.0 Corporates .................................................. 218.9 203.2 57.0 – 479.1 251.6 Equity ......................................................... – – – 0.3 0.3 0.9 Securitisation positions2 ............................. 34.2 2.6 12.3 – 49.1 26.3
IRB foundation approach ............................ 10.2 7.8 1.4 – 19.4 10.3 Corporates .................................................. 10.2 7.8 1.4 – 19.4 10.3
Standardised approach ................................ 180.4 352.1 62.7 86.3 681.5 374.5 Central governments and central banks ..... 88.5 83.5 5.4 – 177.4 0.9 Institutions .................................................. 0.7 56.3 0.5 – 57.5 19.4 Corporates .................................................. 64.7 175.2 14.5 0.1 254.5 237.3 Retail .......................................................... 19.8 28.7 4.4 – 52.9 40.1 Secured on real estate property .................. 3.0 6.6 35.7 – 45.3 24.0 Past due items ............................................. 3.0 0.8 0.6 – 4.4 6.0 Regional governments or local authorities 0.7 0.1 0.4 – 1.2 1.0 Equity ......................................................... – – – 2.8 2.8 2.8 Other items3 ................................................ – 0.9 1.2 83.4 85.5 43.0
837.8 745.2 501.2 86.7 2,170.9 898.4
At 31 December 2011 IRB advanced approach .................................. 765.1 399.8 410.0 0.5 1,575.4 577.6
Central governments and central banks ..... 273.3 93.5 41.2 – 408.0 40.3 Institutions .................................................. 111.6 32.2 1.5 0.1 145.4 27.7 Corporates .................................................. 186.9 207.0 50.3 – 444.2 240.7 Retail .......................................................... 153.5 64.0 301.1 – 518.6 239.1 Equity ......................................................... – – – 0.4 0.4 1.6 Securitisation positions2 ............................. 39.8 3.1 15.9 – 58.8 28.2
IRB foundation approach ............................... 10.5 5.3 0.7 – 16.5 8.5 Corporates .................................................. 10.5 5.3 0.7 – 16.5 8.5
Standardised approach .................................... 105.9 327.4 72.8 85.1 591.2 372.1 Central governments and central banks ..... 8.9 81.6 14.1 – 104.6 1.3 Institutions .................................................. 3.7 38.1 0.1 – 41.9 14.0 Corporates .................................................. 65.0 166.9 18.0 0.2 250.1 233.9 Retail .......................................................... 22.3 28.4 4.8 – 55.5 41.9 Secured on real estate property .................. 2.6 10.5 34.0 – 47.1 25.6 Past due items ............................................. 2.8 0.9 0.3 – 4.0 5.3 Regional governments or local authorities 0.4 0.2 0.4 – 1.0 0.8 Equity ......................................................... – – – 6.5 6.5 8.4 Other items3 ................................................ 0.2 0.8 1.1 78.4 80.5 40.9
881.5 732.5 483.5 85.6 2,183.1 958.2
For footnotes see page 23.
H S B C H O L D I N G S P L C
Capital and Risk Management Pillar 3 Disclosures at 31 December 2012 (continued)
Page 29
Application of the IRB approach
The narrative explanations that follow relate to the IRB approaches: advanced and foundation IRB for distinct customers and advanced IRB for the portfolio-managed retail business. Details of our use of the standardised approach can be found on page 46.
Our Group IRB credit risk rating framework incorporates obligor propensity to default expressed in PD, and loss severity in the event of default expressed in EAD and LGD. These measures are used to calculate regulatory EL and capital requirements. They are also used with other inputs to inform rating assessments for the purpose of credit approval and many other management decisions.
Use of internal estimates • PDs, LGD, and EADs developed internally for regulatory
capital are also used for other purposes. For example: • credit approval and monitoring: IRB models are used in the
assessment of customer and portfolio risk in lending decisions;
• risk appetite: IRB measures are an important element in identifying risk exposure at customer, sector, and portfolio level;
• pricing: IRB parameters are used in wholesale pricing tools for new transactions and reviews; and
• economic capital and portfolio management: IRB parameters are used in the economic capital model that has been implemented across HSBC.
Roll-out of the IRB approach
We have adopted the Basel II advanced approach for the majority of our business. At the end of 2012, portfolios in much of Europe, Hong Kong, Rest of Asia-Pacific and North America were on advanced IRB approaches. Others remain on the standardised or foundation approaches pending the definition of local regulations or model approval, or under exemptions or exclusion from IRB treatment. Under our Basel II IRB roll-out plans, a number of our Group companies and portfolios are in transition to advanced IRB approaches.
Under the advanced IRB approach, banks are allowed to develop their own empirical models to quantify required capital for credit risk. All such models developed by us, and any material changes to those models, must be approved by the FSA, subject to de minimis exceptions. Material changes are those that individually have a high impact, or where a number of small changes in aggregate have a high impact. The FSA approves quantitative and qualitative materiality thresholds for these model changes, and requires us to obtain prior approval before implementation.
In October 2012, to increase the effectiveness of this process, the FSA introduced an annual review of IRB usage, focusing on the proportion of total credit risk assets for which IRB approaches are used.
Banks have experienced difficulties in adopting advanced IRB in some cases, for example in portfolios which have very low levels of default, such that the PD, LGD and EAD cannot be assessed to a sufficiently high degree of confidence due to a lack of default or loss data. Difficulties may also arise in the case of portfolios in countries where the manner of the local regulator’s implementation of Basel II makes it difficult to demonstrate the regulatory ‘use test’ while using models that satisfy the FSA’s criteria. While recognising the complexity of adopting IRB in some situations, we are committed to working constructively with our regulators to achieve acceptable roll-out plans.
The wholesale risk rating system
This section sets out a description of how we build and operate our credit risk analytical models, and use IRB metrics, in wholesale customer business.
PDs for wholesale customer segments, that is central governments and central banks, financial institutions and corporate customers, and for certain individually assessed personal customers, are estimated using a Customer Risk Rating (‘CRR’) master scale of 23 grades. Of these, 21 are non-default grades representing varying degrees of strength of financial condition, and two are default grades.
The score generated by a credit risk rating model for the obligor is mapped to a corresponding PD and master-scale CRR. The CRR is then reviewed by a credit approver who, taking into account all relevant information, such as most recent events and market data, where available, makes the final decision on the rating. The rating assigned therefore reflects the approver’s overall view of the obligor’s credit standing and propensity to default.
The finally assigned CRR determines the applicable master-scale PD range from which the reference PD, generally the arithmetical mid-point, is used in the regulatory capital calculation.
Reviewing the initial model score, relationship managers may propose a different CRR from that indicated, where they believe this more appropriate. Such amendments may only be made through an override process and must be approved by the Credit function. Overrides for each model are recorded, and override levels are reviewed, as part of the model management process.

H S B C H O L D I N G S P L C
Capital and Risk Management Pillar 3 Disclosures at 31 December 2012 (continued)
Page 30
The CRR is assigned at borrower level, which means that separate exposures to the same obligor are generally subject to a single, consistent obligor rating. The impact of unfunded risk mitigants is considered for IRB approaches on page 43 and for the standardised approach on page 46.
If an obligor is in default on any material credit obligation to the Group, all of the obligor’s facilities from the Group are considered to be in default.
Under the IRB approach, obligors are grouped into grades that have similar PD or anticipated default frequency. The anticipated default frequency may be estimated using all relevant information at the relevant date (‘Point-in-time’ or ‘PIT’ rating system), or be free of the effects of the credit cycle (‘Through-the-cycle’ or ‘TTC’ rating system).
We generally utilise a hybrid approach of PIT and TTC. That is, while models are calibrated to long-run default rates, obligor ratings are reviewed annually, or more frequently if necessary to reflect change in their circumstances and/or their economic operating environment.
Thus, over the economic cycle, a cycle will also appear in CRR migration. The influence of longer-term economic cycle factors implied by the model’s calibration, combined with the effect of ongoing credit review, will result in long-term PDs generally above the actual default frequency during benign economic periods, but not changing so fast in a downturn. In practice, under a hybrid approach, ratings tend to be more volatile than would be the case in a pure TTC system, but less volatile than in a pure PIT one.
Moreover, our policy requires approvers to downgrade ratings on expectations, but to upgrade them only on performance. Therefore, ratings will typically migrate during a downturn in response to higher perceived risks, but be upgraded more slowly in an upswing. This leads to expected defaults overall typically exceeding actual defaults.
For EAD and LGD estimation, operating entities are permitted, subject to overview by Group Risk, to use their own modelling approaches for those parameters to suit conditions in their jurisdictions. Group Risk provides co-ordination, benchmarks, and the sharing and promotion of best practice on EAD and LGD estimation.
EAD is estimated to a 12-month forward time horizon and represents the current exposure plus an estimate for future increases in exposure taking into account such factors as available but undrawn facilities, and the realisation of contingent exposures post-default.
LGD is based on the effects of facility and collateral structure on outcomes post-default. This includes such factors as the type of client, the facility seniority, the type and value of collateral, past recovery experience and priority under law. It is expressed as a percentage of EAD.
Wholesale models
To determine credit ratings for the different types of wholesale obligor, many different models and scorecards are used for PD, LGD, and EAD; there are over one hundred wholesale IRB models in use or under development within HSBC. These models may be differentiated by region, customer segment and/or customer size. For example, PD models are differentiated for all of our key customer segments, including sovereigns, financial institutions, large, medium and small sized corporates.
Global PD models have been developed for asset classes or clearly identifiable segments of asset classes where the customer relationship is managed globally, for example sovereign financial institutions and the largest corporate clients, typically those which operate internationally.
Local PD models, specific to a particular country, region, or sector, are developed for other obligors. This includes corporate clients when they show distinct characteristics in common in a particular geography.
The two major drivers of model methodology are the nature of the portfolio and the availability of internal or external data on historical defaults and risk factors. For some historically low-default portfolios, a model will rely more heavily on external data and/ the input of an expert panel. By contrast, where sufficient data is available, models are built on a statistical basis, although the input of expert judgement may still form an important part of the overall model development methodology.
• The sovereigns portfolio is low default, and the global PD model in use is a constrained expert judgement model, which uses a combination of expert judgement and quantitative analysis. The model inputs include macro-economic and political factors. The output is a hybrid PD.
• The banks portfolio has characteristics similar to the sovereign portfolio. The global PD model for banks uses the similar combination of expert judgement and statistical analysis. The model inputs include balance sheet information, country risk factors and qualitative data. The output is a hybrid PD.

H S B C H O L D I N G S P L C
Capital and Risk Management Pillar 3 Disclosures at 31 December 2012 (continued)
Page 31
• The Global Large Corporate Scorecard is a global PD model used to rate large corporates (often multinational companies) with a minimum annual turnover of US$0.7bn. Even though the portfolio is low-default, the model is statistically based and calibrated on 15 years of data. The inputs include balance sheet information, market data, macroeconomic indicators and qualitative factors. The output is a hybrid PD.
• Corporates that fall below the large corporate threshold are rated through local mid-market PD models, which reflect regional circumstances. The most material Corporate PD models are the UK mid-market PD model, and the Hong Kong and Rest of Asia-Pacific mid-market models. These models use balance sheet data, behavioural data and qualitative information to derive a hybrid PD.
Most LGD and EAD models are developed according to local circumstances taking into account legal and procedural differences in the recovery and workout processes. However, our approach to EAD and LGD also encompasses global models for central governments and central banks, and for institutions, as exposures to these customer types are managed centrally by Global Risk.
Local models for the corporate exposure class are developed using various data inputs, including collateral information and geography (for LGD) and product type (for EAD). The most material corporate models are the UK, Hong Kong and Rest of Asia-Pacific models, which are both developed using more than 10 years’ worth of data. The LGD models are calibrated to a period of credit stress or downturn
in economic conditions. The global LGD models for sovereigns and for banks reflect the expected increase in observed losses during an economic downturn period.
None of the EAD models are calibrated for a downturn, as analysis shows that utilisation decreases during a downturn because credit stress is accompanied by more intensive limit monitoring and facility reduction.
The graph and table 14 below set out IRB exposures by obligor grade for central governments and central banks, institutions and corporates, all of which are assessed using our 23-grade CRR master scale. We benchmark the master scale against the ratings of external rating agencies. Each CRR band is associated with an external rating grade by reference to long-run default rates for that grade, represented by the average of issuer-weighted historical default rates.
The correspondence between the agency long-run default rates and the PD ranges of our master scale is obtained by matching a smoothed curve based on those default rates with our master scale reference PDs. This association between internal and external ratings is indicative and may vary over time. In these tables, the ratings of Standard and Poor’s (‘S&P’) are cited for illustration purposes, though we also benchmark against other agencies’ ratings in an equivalent manner.
For further details of the Group’s approach to credit quality classification, please see the definition of ‘obligor grade’ in the glossary, and also page 253 of the Annual Report and Accounts 2012.
Exposure by CRR band (US$bn)
0
20
40
60
80
100
120
0.1 1.1 1.2 2.1 2.2 3.1 3.2 3.3 4.1 4.2 4.3 5.1 5.2 5.3 >6.0
CRR Band
Central governments and central banks
Institutions
Corporates
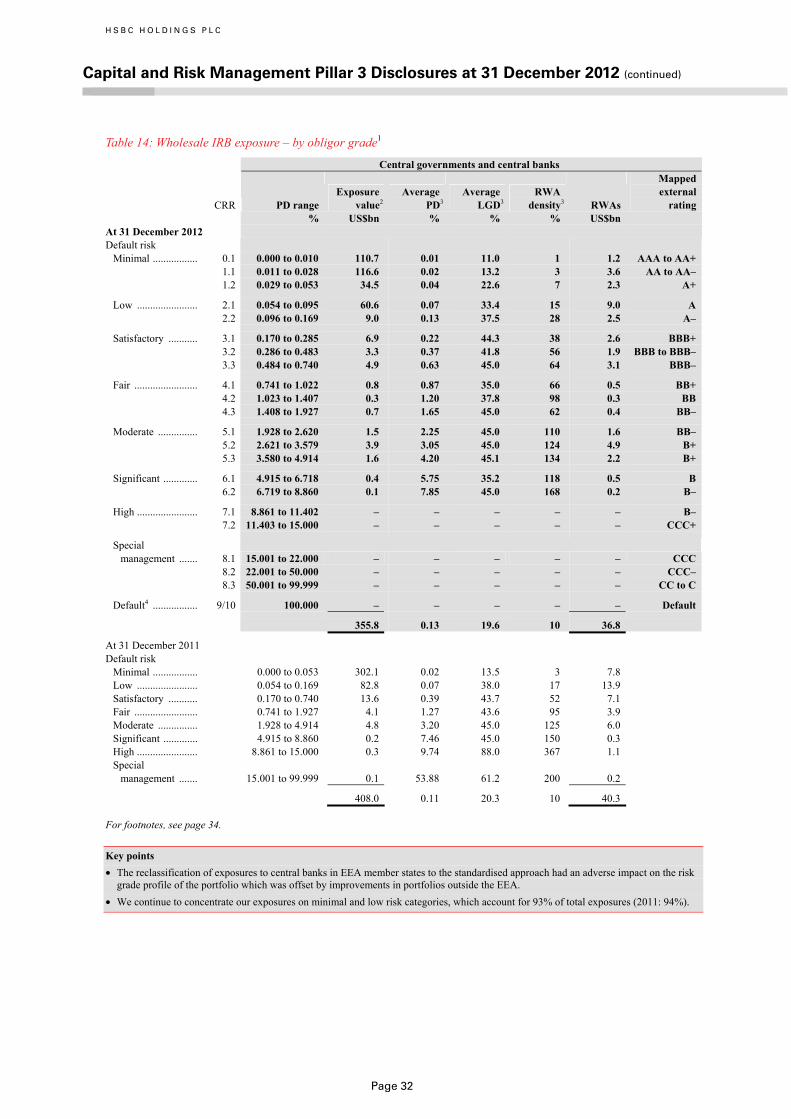
H S B C H O L D I N G S P L C
Capital and Risk Management Pillar 3 Disclosures at 31 December 2012 (continued)
Page 32
Table 14: Wholesale IRB exposure – by obligor grade1
Central governments and central banks
CRR PD range
Exposure value2
Average PD3
Average LGD3
RWA density3
RWAs
Mapped external rating
% US$bn % % % US$bn At 31 December 2012 Default risk
Minimal ................. 0.1 0.000 to 0.010 110.7 0.01 11.0 1 1.2 AAA to AA+ 1.1 0.011 to 0.028 116.6 0.02 13.2 3 3.6 AA to AA– 1.2 0.029 to 0.053 34.5 0.04 22.6 7 2.3 A+
Low ....................... 2.1 0.054 to 0.095 60.6 0.07 33.4 15 9.0 A 2.2 0.096 to 0.169 9.0 0.13 37.5 28 2.5 A–
Satisfactory ........... 3.1 0.170 to 0.285 6.9 0.22 44.3 38 2.6 BBB+ 3.2 0.286 to 0.483 3.3 0.37 41.8 56 1.9 BBB to BBB– 3.3 0.484 to 0.740 4.9 0.63 45.0 64 3.1 BBB–
Fair ........................ 4.1 0.741 to 1.022 0.8 0.87 35.0 66 0.5 BB+ 4.2 1.023 to 1.407 0.3 1.20 37.8 98 0.3 BB 4.3 1.408 to 1.927 0.7 1.65 45.0 62 0.4 BB–
Moderate ............... 5.1 1.928 to 2.620 1.5 2.25 45.0 110 1.6 BB– 5.2 2.621 to 3.579 3.9 3.05 45.0 124 4.9 B+ 5.3 3.580 to 4.914 1.6 4.20 45.1 134 2.2 B+
Significant ............. 6.1 4.915 to 6.718 0.4 5.75 35.2 118 0.5 B 6.2 6.719 to 8.860 0.1 7.85 45.0 168 0.2 B–
High ....................... 7.1 8.861 to 11.402 – – – – – B– 7.2 11.403 to 15.000 – – – – – CCC+
Special management ....... 8.1 15.001 to 22.000 – – – – – CCC
8.2 22.001 to 50.000 – – – – – CCC– 8.3 50.001 to 99.999 – – – – – CC to C
Default4 ................. 9/10 100.000 – – – – – Default
355.8 0.13 19.6 10 36.8
At 31 December 2011 Default risk
Minimal ................. 0.000 to 0.053 302.1 0.02 13.5 3 7.8 Low ....................... 0.054 to 0.169 82.8 0.07 38.0 17 13.9 Satisfactory ........... 0.170 to 0.740 13.6 0.39 43.7 52 7.1 Fair ........................ 0.741 to 1.927 4.1 1.27 43.6 95 3.9 Moderate ............... 1.928 to 4.914 4.8 3.20 45.0 125 6.0 Significant ............. 4.915 to 8.860 0.2 7.46 45.0 150 0.3 High ....................... 8.861 to 15.000 0.3 9.74 88.0 367 1.1 Special
management ....... 15.001 to 99.999 0.1 53.88 61.2 200 0.2
408.0 0.11 20.3 10 40.3
For footnotes, see page 34. Key points • The reclassification of exposures to central banks in EEA member states to the standardised approach had an adverse impact on the risk
grade profile of the portfolio which was offset by improvements in portfolios outside the EEA. • We continue to concentrate our exposures on minimal and low risk categories, which account for 93% of total exposures (2011: 94%).

H S B C H O L D I N G S P L C
Capital and Risk Management Pillar 3 Disclosures at 31 December 2012 (continued)
Page 33
Table 14: Wholesale IRB exposure – by obligor grade1 (continued)
Institutions
CRR PD range
Exposure value2
Average PD3
Average LGD3
RWA density3
RWAs
Mapped external rating
% US$bn % % % US$bn At 31 December 2012 Default risk
Minimal ................. 0.1 0.000 to 0.010 5.5 0.03 17.3 5 0.3 AAA to AA+ 1.1 0.011 to 0.028 12.2 0.03 27.0 6 0.7 AA to AA– 1.2 0.029 to 0.053 17.0 0.04 25.7 8 1.3 A+
Low ....................... 2.1 0.054 to 0.095 45.0 0.07 34.2 12 5.4 A 2.2 0.096 to 0.169 26.3 0.13 33.1 19 5.1 A–
Satisfactory ........... 3.1 0.170 to 0.285 8.3 0.22 35.0 28 2.3 BBB+ 3.2 0.286 to 0.483 6.6 0.37 35.2 37 2.4 BBB to BBB– 3.3 0.484 to 0.740 2.2 0.63 34.5 53 1.2 BBB–
Fair ........................ 4.1 0.741 to 1.022 2.5 0.87 36.3 62 1.6 BB+ 4.2 1.023 to 1.407 2.0 1.20 37.5 72 1.4 BB 4.3 1.408 to 1.927 0.5 1.65 43.0 93 0.5 BB–
Moderate ............... 5.1 1.928 to 2.620 0.2 2.25 45.0 105 0.2 BB– 5.2 2.621 to 3.579 0.7 3.05 49.8 131 0.9 B+ 5.3 3.580 to 4.914 0.4 4.20 55.2 156 0.6 B+
Significant ............. 6.1 4.915 to 6.718 0.5 5.75 67.8 221 1.1 B 6.2 6.719 to 8.860 0.2 7.85 56.7 216 0.5 B–
High ....................... 7.1 8.861 to 11.402 0.5 10.00 38.2 156 0.8 B– 7.2 11.403 to 15.000 0.3 13.00 48.8 211 0.6 CCC+
Special management ....... 8.1 15.001 to 22.000 – – – – – CCC
8.2 22.001 to 50.000 – – – – – CCC– 8.3 50.001 to 99.999 0.1 75.00 50.7 134 0.1 CC to C
Default4 ................. 9/10 100.000 0.1 100.00 60.8 – – Default
131.1 0.39 32.1 21 27.0
At 31 December 2011 Default risk
Minimal ................. 0.000 to 0.053 37.1 0.03 28.6 7 2.5 Low ....................... 0.054 to 0.169 82.9 0.09 32.8 14 11.6 Satisfactory ........... 0.170 to 0.740 18.1 0.29 34.5 33 5.9 Fair ........................ 0.741 to 1.927 4.8 1.10 39.5 73 3.5 Moderate ............... 1.928 to 4.914 0.9 3.18 45.6 122 1.1 Significant ............. 4.915 to 8.860 0.6 5.95 50.1 183 1.1 High ....................... 8.861 to 15.000 0.6 11.50 62.0 283 1.7 Special
management ....... 15.001 to 99.999 0.2 74.69 45.6 150 0.3 Default4 ................. 100.00 0.2 100.00 70.0 – –
145.4 0.46 32.5 19 27.7
For footnotes, see page 34.
Key points • The overall reduction in exposures is mainly in Europe and Hong Kong and results from a general decrease in the volume of placements
with institutions. • This reduction is primarily in minimal and low risk categories, which have decreased from 83% of the total to 81%. As a consequence,
RWA density has increased from 19% to 21%.

H S B C H O L D I N G S P L C
Capital and Risk Management Pillar 3 Disclosures at 31 December 2012 (continued)
Page 34
Table 14: Wholesale IRB exposure – by obligor grade1 (continued)
Corporates5
CRR PD range
Exposure value2
Average PD3
Average LGD3
RWA density3
RWAs
Mapped external rating
% US$bn % % % US$bn At 31 December 2012 Default risk
Minimal ................. 0.16 0.000 to 0.010 – – – – – 1.1 0.011 to 0.028 11.9 0.03 38.3 14 1.6 AAA to AA– 1.2 0.029 to 0.053 30.9 0.04 40.7 14 4.5 A+
Low ....................... 2.1 0.054 to 0.095 55.2 0.07 40.6 20 11.1 A 2.2 0.096 to 0.169 65.5 0.13 41.7 31 20.2 A–
Satisfactory ........... 3.1 0.170 to 0.285 62.9 0.22 37.5 39 24.5 BBB+ 3.2 0.286 to 0.483 55.4 0.37 37.8 49 27.2 BBB to BBB– 3.3 0.484 to 0.740 47.1 0.63 35.2 61 28.5 BBB–
Fair ........................ 4.1 0.741 to 1.022 36.5 0.87 36.9 71 25.9 BB+ 4.2 1.023 to 1.407 27.7 1.20 35.7 78 21.5 BB 4.3 1.408 to 1.927 26.3 1.65 36.0 85 22.4 BB–
Moderate ............... 5.1 1.928 to 2.620 23.3 2.25 32.6 89 20.8 BB– 5.2 2.621 to 3.579 13.1 3.05 36.7 107 14.1 B+ 5.3 3.580 to 4.914 8.1 4.20 34.0 112 9.1 B+
Significant ............. 6.1 4.915 to 6.718 4.2 5.75 30.9 113 4.8 B 6.2 6.719 to 8.860 2.5 7.85 36.7 151 3.8 B–
High ....................... 7.1 8.861 to 11.402 3.3 10.00 32.9 150 5.0 B– 7.2 11.403 to 15.000 0.8 13.00 32.4 161 1.3 CCC+
Special management ....... 8.1 15.001 to 22.000 1.0 19.00 36.6 196 1.9 CCC
8.2 22.001 to 50.000 0.4 36.00 33.1 187 0.8 CCC– 8.3 50.001 to 99.999 0.3 75.00 32.2 102 0.4 CC toC
Default4 ................. 9/10 100.000 6.0 100.00 38.2 35 2.0 Default
482.4 2.19 37.8 52 251.4
At 31 December 2011 Default risk
Minimal ................. 0.000 to 0.053 42.9 0.04 40.5 14 6.0 Low ....................... 0.054 to 0.169 99.4 0.10 41.6 26 25.8 Satisfactory ........... 0.170 to 0.740 151.5 0.39 39.4 49 74.5 Fair ........................ 0.741 to 1.927 73.9 1.20 37.4 79 58.1 Moderate ............... 1.928 to 4.914 42.9 2.93 35.6 101 43.3 Significant ............. 4.915 to 8.860 8.8 6.57 33.9 122 10.7 High ....................... 8.861 to 15.000 4.5 10.70 36.6 171 7.7 Special
management ....... 15.001 to 99.999 2.7 32.41 36.3 181 4.9 Default4 ................. 100.00 6.3 100.00 40.7 33 2.1
432.9 2.57 39.2 54 233.1
1 See glossary for definition of obligor grade. 2 Central governments and central banks exposure value includes US$1.5bn (2011: US$2.4bn) in undrawn commitments, institutions
exposure value includes US$14.3bn (2011: US$ 14.9bn) and corporates exposure value includes US$277.6bn (2011: US$260.2bn). 3 Average PD, average LGD and RWA density percentages represent an exposure weighted average. 4 There is a requirement to hold additional capital for unexpected losses on defaulted exposures where LGD exceeds best estimate of EL.
As a result, in some cases, RWAs arise for exposures in default. 5 Excludes specialised lending exposures subject to the supervisory slotting approach. 6 The top band of the wholesale CRR master scale is not available to entities in the corporates exposure class, but restricted to the
strongest central governments, central banks and institutions. Key points • The increase in exposures relates primarily to organic growth in North America, Hong Kong and Rest of Asia-Pacific in the higher
quality categories (low, satisfactory and fair).

H S B C H O L D I N G S P L C
Capital and Risk Management Pillar 3 Disclosures at 31 December 2012 (continued)
Page 35
Retail risk rating systems
Owing to the different country-level portfolio performance characteristics and loss history, there are no global models for our retail portfolios. Our retail models are developed at a local level, based on portfolio behaviour and observed defaults. In the Group overall, we maintain over 800 retail behavioural or risk predictive scorecards and models. Of these, just under 300 are used with our regulator’s approval under our IRB permission, the remainder being application or behavioural scorecards.
We classify approximately 20% by number of the retail IRB model population as constituting individually material models. Within this group, the six individual PD models for which we disclose performance data in table 20 below represented approximately 57% of total retail IRB RWAs of US$171bn at year-end 2012. The majority of this was attributable to the four residential mortgage models included in table 15 below, representing our most material retail asset class.
All newly adopted IRB models for retail portfolios, irrespective of size, require FSA approval. For changes to existing IRB models, an FSA approval process applies to all but a list of de minimis exemptions representing an immaterial percentage of total Group credit risk RWAs. This approval process sets various quantitative and qualitative thresholds to ensure that all significant model changes go forward for approval.
When developing retail models, segmentation based on risk characteristics is often adopted to enhance the models’ discrimination and accuracy. The majority of our retail models are designed for a particular product or group of products in a specific country.We have developed and issued global internal model governance, development, validation and monitoring standards to ensure that locally developed models adhere, as far as possible, to consistent global standards. These permit specific variances in model approach, depending on local regulatory, legal or data requirements, which are used to determine and predict the risks in these portfolios.
Our models incorporate conservatism where required under regulatory rules. Additional levels of conservatism, varying from region to region, may arise from a methodological choice of ours or from a specific regulatory intervention, depending on the local assessment of the risk factors by us and the regulatory authorities. Regulators may additionally impose ‘floor’ values for various metrics, to achieve the objective that, in practice, modelled outputs and capital requirements calculated from them remain conservative even in benign economic conditions.
Our PD models are developed using statistical estimation based on a minimum of five years of historical data. The modelling approach is typically inherently TTC or, where a PIT approach is predominantly used, as in the UK, this becomes effectively TTC through the application of a regulatory uplift or buffer.
Our retail EAD models are also developed using at least five years of historical observations and typically adopt one of two approaches:
• for closed-end products without the facility for additional drawdowns, EAD is estimated as the outstanding balance of accounts at the time of observation; or
• EAD for products with the facility for additional drawdowns is estimated as the outstanding balance of accounts at the time of observation plus a Credit Conversion Factor (‘CCF’) applied to the undrawn portion of the facility.
Our approach to LGD estimates has more variation, particularly in respect of the downturn period calculation that they generally include. UK mortgage models use a regulatory-defined downturn based on a minimum 40% decline in house prices from peak to trough. In Hong Kong, the downturn LGD for the mortgage model is defined to be the period in 2003-4 when Hong Kong experienced the Severe Acute Respiratory Syndrome and historical default rates and property price declines were at their most severe.
The most material US mortgage models derive LGD based on defaults that occurred in the period 2003-2008, which includes the relatively benign years prior to 2007. To reflect more recent data, during 2012 we completed a recalibration based on defaults that occurred in 2005-2009, given that two years’ loss experience post default is used to determine LGD. We then applied an uplift to the modelled parameters for risk management and reporting purposes, as explained in more detail under ‘Model performance’ on page 39.
Table 15 below sets out exposures, RWA, RWA density and Basel metrics for our most material mortgage models in three major markets. Tables 16 and 17 show IRB exposures by exposure sub-class and portfolio quality bands: first at Group level by internal PD band, then by geographic region using a composite EL measure. In table 16, band seven has lower RWAs because, as assets approach and go into default, our capital requirements are increasingly reflected in an EL deduction from capital, rather than a direct RWA impact.

H S B C H O L D I N G S P L C
Capital and Risk Management Pillar 3 Disclosures at 31 December 2012 (continued)
Page 36
Table 15: Retail IRB exposures secured on real estate property At 31 December 2012 Exposure RWA value PD LGD density RWAs US$bn % % % US$bn
Total retail IRB: secured on real estate property ............ 317.4 4.751 23.51 411 130.8 Of which:
– US residential mortgages2 ........................................ 35.1 26.99 64.7 215 75.4 – UK residential mortgages3 ....................................... 101.1 1.69 12.7 8 7.7 – Hong Kong residential mortgages3 .......................... 50.6 0.77 10.1 8 3.8
1 The PD, LGD and RWA density percentages for ‘Total retail IRB’ represent an exposure weighted average. 2 Comprises the US Consumer Lending and Mortgage Services Real Estate First Lien portfolios. The PD and LGD are presented without
the quantitative adjustment described on page 41. 3 UK excludes the First Direct division of HSBC Bank plc. Hong Kong includes the Hong Kong Area Management Office and Hang Seng
Bank.
Table 16: Retail IRB exposure – by internal PD grade At 31 December 2012 PD range Exposure value Average PD1 Average LGD1 RWA density1 RWAs % US$bn % % % US$bn Secured on real estate
property
Band 1 ............................ 0.000 to 0.483 211.1 0.12 15.0 5 10.3 Band 2 ............................ 0.484 to 1.022 41.7 0.66 23.5 26 10.9 Band 3 ............................ 1.023 to 4.914 34.6 2.32 43.4 112 38.7 Band 4 ............................ 4.915 to 8.860 6.5 5.88 64.7 297 19.3 Band 5 ............................ 8.861 to 15.000 5.1 12.30 54.0 314 16.0 Band 6 ............................ 15.001 to 50.000 7.1 26.07 62.8 441 31.2 Band 7 ............................ 50.001 to 100.000 11.3 96.07 58.5 39 4.4
317.4 4.75 23.5 41 130.8 Qualifying revolving
retail exposures
Band 1 ............................ 0.000 to 0.483 44.3 0.12 92.0 6 2.8 Band 2 ............................ 0.484 to 1.022 6.3 0.70 91.7 28 1.8 Band 3 ............................ 1.023 to 4.914 10.0 2.19 89.4 63 6.3 Band 4 ............................ 4.915 to 8.860 1.9 6.69 87.5 135 2.5 Band 5 ............................ 8.861 to 15.000 0.5 11.10 85.7 178 1.0 Band 6 ............................ 15.001 to 50.000 0.5 26.81 87.6 257 1.3 Band 7 ............................ 50.001 to 100.000 0.5 87.67 79.8 108 0.5
64.0 1.62 91.2 25 16.2 SMEs Band 1 ............................ 0.000 to 0.483 1.6 0.20 45.1 22 0.3 Band 2 ............................ 0.484 to 1.022 1.6 0.82 37.4 36 0.6 Band 3 ............................ 1.023 to 4.914 6.2 2.62 41.0 58 3.5 Band 4 ............................ 4.915 to 8.860 1.7 6.81 37.4 62 1.1 Band 5 ............................ 8.861 to 15.000 0.5 11.15 49.0 93 0.5 Band 6 ............................ 15.001 to 50.000 0.5 25.39 48.1 124 0.7 Band 7 ............................ 50.001 to 100.000 1.0 99.42 33.9 8 0.1
13.1 11.53 40.7 52 6.8 Other retail Band 1 ............................ 0.000 to 0.483 30.6 0.17 14.6 7 2.1 Band 2 ............................ 0.484 to 1.022 8.7 0.70 28.6 25 2.2 Band 3 ............................ 1.023 to 4.914 16.2 2.00 32.8 45 7.2 Band 4 ............................ 4.915 to 8.860 1.5 6.95 58.8 97 1.4 Band 5 ............................ 8.861 to 15.000 1.1 11.71 69.9 134 1.5 Band 6 ............................ 15.001 to 50.000 1.0 27.70 64.7 168 1.7 Band 7 ............................ 50.001 to 100.000 1.0 91.02 61.8 103 1.1
60.1 3.12 25.3 29 17.2 Total retail Band 1 ............................ 0.000 to 0.483 287.6 0.13 27.0 5 15.5 Band 2 ............................ 0.484 to 1.022 58.3 0.67 32.0 27 15.5 Band 3 ............................ 1.023 to 4.914 67.0 2.25 47.5 83 55.7 Band 4 ............................ 4.915 to 8.860 11.6 6.29 63.6 211 24.3 Band 5 ............................ 8.861 to 15.000 7.2 12.03 58.4 260 19.0 Band 6 ............................ 15.001 to 50.000 9.1 26.25 63.5 382 34.9 Band 7 ............................ 50.001 to 100.000 13.8 95.67 57.6 44 6.1
454.6 4.29 33.8 38 171.0
1 Average PD, average LGD and RWA density percentages represent an exposure weighted average.
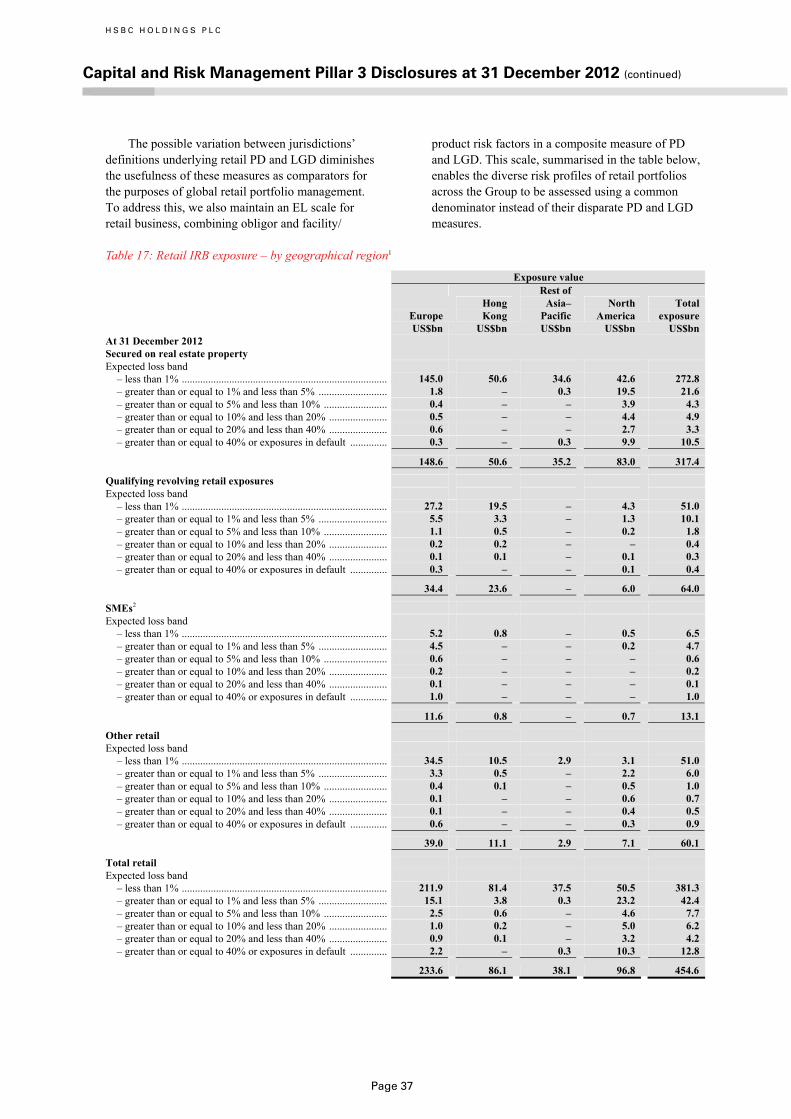
H S B C H O L D I N G S P L C
Capital and Risk Management Pillar 3 Disclosures at 31 December 2012 (continued)
Page 37
The possible variation between jurisdictions’ definitions underlying retail PD and LGD diminishes the usefulness of these measures as comparators for the purposes of global retail portfolio management. To address this, we also maintain an EL scale for retail business, combining obligor and facility/
product risk factors in a composite measure of PD and LGD. This scale, summarised in the table below, enables the diverse risk profiles of retail portfolios across the Group to be assessed using a common denominator instead of their disparate PD and LGD measures.
Table 17: Retail IRB exposure – by geographical region1
Exposure value
Europe
Hong Kong
Rest of Asia– Pacific
North America
Total exposure
US$bn US$bn US$bn US$bn US$bn At 31 December 2012 Secured on real estate property Expected loss band
– less than 1% .............................................................................. 145.0 50.6 34.6 42.6 272.8 – greater than or equal to 1% and less than 5% .......................... 1.8 – 0.3 19.5 21.6 – greater than or equal to 5% and less than 10% ........................ 0.4 – – 3.9 4.3 – greater than or equal to 10% and less than 20% ...................... 0.5 – – 4.4 4.9 – greater than or equal to 20% and less than 40% ...................... 0.6 – – 2.7 3.3 – greater than or equal to 40% or exposures in default .............. 0.3 – 0.3 9.9 10.5
148.6 50.6 35.2 83.0 317.4
Qualifying revolving retail exposures Expected loss band
– less than 1% .............................................................................. 27.2 19.5 – 4.3 51.0 – greater than or equal to 1% and less than 5% .......................... 5.5 3.3 – 1.3 10.1 – greater than or equal to 5% and less than 10% ........................ 1.1 0.5 – 0.2 1.8 – greater than or equal to 10% and less than 20% ...................... 0.2 0.2 – – 0.4 – greater than or equal to 20% and less than 40% ...................... 0.1 0.1 – 0.1 0.3 – greater than or equal to 40% or exposures in default .............. 0.3 – – 0.1 0.4
34.4 23.6 – 6.0 64.0
SMEs2 Expected loss band
– less than 1% .............................................................................. 5.2 0.8 – 0.5 6.5 – greater than or equal to 1% and less than 5% .......................... 4.5 – – 0.2 4.7 – greater than or equal to 5% and less than 10% ........................ 0.6 – – – 0.6 – greater than or equal to 10% and less than 20% ...................... 0.2 – – – 0.2 – greater than or equal to 20% and less than 40% ...................... 0.1 – – – 0.1 – greater than or equal to 40% or exposures in default .............. 1.0 – – – 1.0
11.6 0.8 – 0.7 13.1
Other retail Expected loss band
– less than 1% .............................................................................. 34.5 10.5 2.9 3.1 51.0 – greater than or equal to 1% and less than 5% .......................... 3.3 0.5 – 2.2 6.0 – greater than or equal to 5% and less than 10% ........................ 0.4 0.1 – 0.5 1.0 – greater than or equal to 10% and less than 20% ...................... 0.1 – – 0.6 0.7 – greater than or equal to 20% and less than 40% ...................... 0.1 – – 0.4 0.5 – greater than or equal to 40% or exposures in default .............. 0.6 – – 0.3 0.9
39.0 11.1 2.9 7.1 60.1
Total retail Expected loss band
– less than 1% .............................................................................. 211.9 81.4 37.5 50.5 381.3 – greater than or equal to 1% and less than 5% .......................... 15.1 3.8 0.3 23.2 42.4 – greater than or equal to 5% and less than 10% ........................ 2.5 0.6 – 4.6 7.7 – greater than or equal to 10% and less than 20% ...................... 1.0 0.2 – 5.0 6.2 – greater than or equal to 20% and less than 40% ...................... 0.9 0.1 – 3.2 4.2 – greater than or equal to 40% or exposures in default .............. 2.2 – 0.3 10.3 12.8
233.6 86.1 38.1 96.8 454.6
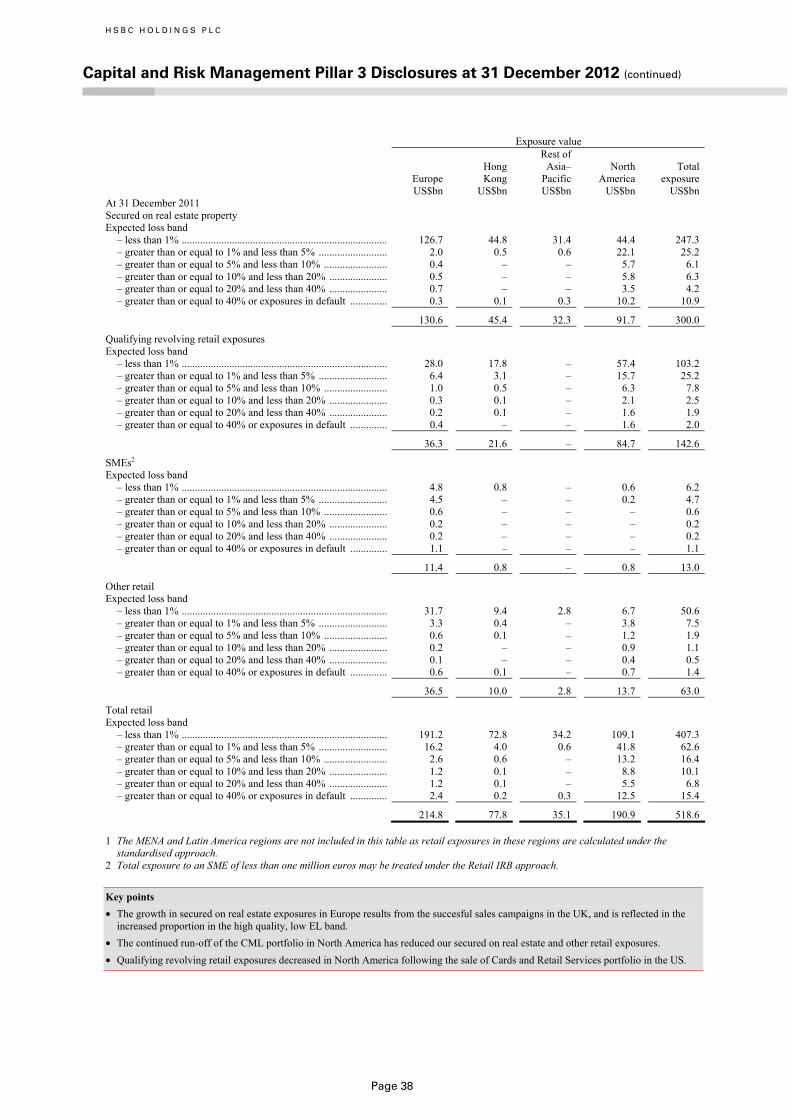
H S B C H O L D I N G S P L C
Capital and Risk Management Pillar 3 Disclosures at 31 December 2012 (continued)
Page 38
Exposure value
Europe
Hong Kong
Rest of Asia– Pacific
North America
Total exposure
US$bn US$bn US$bn US$bn US$bn At 31 December 2011 Secured on real estate property Expected loss band
– less than 1% .............................................................................. 126.7 44.8 31.4 44.4 247.3 – greater than or equal to 1% and less than 5% .......................... 2.0 0.5 0.6 22.1 25.2 – greater than or equal to 5% and less than 10% ........................ 0.4 – – 5.7 6.1 – greater than or equal to 10% and less than 20% ...................... 0.5 – – 5.8 6.3 – greater than or equal to 20% and less than 40% ...................... 0.7 – – 3.5 4.2 – greater than or equal to 40% or exposures in default .............. 0.3 0.1 0.3 10.2 10.9
130.6 45.4 32.3 91.7 300.0
Qualifying revolving retail exposures Expected loss band
– less than 1% .............................................................................. 28.0 17.8 – 57.4 103.2 – greater than or equal to 1% and less than 5% .......................... 6.4 3.1 – 15.7 25.2 – greater than or equal to 5% and less than 10% ........................ 1.0 0.5 – 6.3 7.8 – greater than or equal to 10% and less than 20% ...................... 0.3 0.1 – 2.1 2.5 – greater than or equal to 20% and less than 40% ...................... 0.2 0.1 – 1.6 1.9 – greater than or equal to 40% or exposures in default .............. 0.4 – – 1.6 2.0
36.3 21.6 – 84.7 142.6
SMEs2 Expected loss band
– less than 1% .............................................................................. 4.8 0.8 – 0.6 6.2 – greater than or equal to 1% and less than 5% .......................... 4.5 – – 0.2 4.7 – greater than or equal to 5% and less than 10% ........................ 0.6 – – – 0.6 – greater than or equal to 10% and less than 20% ...................... 0.2 – – – 0.2 – greater than or equal to 20% and less than 40% ...................... 0.2 – – – 0.2 – greater than or equal to 40% or exposures in default .............. 1.1 – – – 1.1
11.4 0.8 – 0.8 13.0
Other retail Expected loss band
– less than 1% .............................................................................. 31.7 9.4 2.8 6.7 50.6 – greater than or equal to 1% and less than 5% .......................... 3.3 0.4 – 3.8 7.5 – greater than or equal to 5% and less than 10% ........................ 0.6 0.1 – 1.2 1.9 – greater than or equal to 10% and less than 20% ...................... 0.2 – – 0.9 1.1 – greater than or equal to 20% and less than 40% ...................... 0.1 – – 0.4 0.5 – greater than or equal to 40% or exposures in default .............. 0.6 0.1 – 0.7 1.4
36.5 10.0 2.8 13.7 63.0
Total retail Expected loss band
– less than 1% .............................................................................. 191.2 72.8 34.2 109.1 407.3 – greater than or equal to 1% and less than 5% .......................... 16.2 4.0 0.6 41.8 62.6 – greater than or equal to 5% and less than 10% ........................ 2.6 0.6 – 13.2 16.4 – greater than or equal to 10% and less than 20% ...................... 1.2 0.1 – 8.8 10.1 – greater than or equal to 20% and less than 40% ...................... 1.2 0.1 – 5.5 6.8 – greater than or equal to 40% or exposures in default .............. 2.4 0.2 0.3 12.5 15.4
214.8 77.8 35.1 190.9 518.6
1 The MENA and Latin America regions are not included in this table as retail exposures in these regions are calculated under the standardised approach.
2 Total exposure to an SME of less than one million euros may be treated under the Retail IRB approach.
Key points • The growth in secured on real estate exposures in Europe results from the succesful sales campaigns in the UK, and is reflected in the
increased proportion in the high quality, low EL band. • The continued run-off of the CML portfolio in North America has reduced our secured on real estate and other retail exposures. • Qualifying revolving retail exposures decreased in North America following the sale of Cards and Retail Services portfolio in the US.

H S B C H O L D I N G S P L C
Capital and Risk Management Pillar 3 Disclosures at 31 December 2012 (continued)
Page 39
Model performance
Model validation within HSBC is subject to global internal standards. All material models whose outputs are used in calculations of IRB capital requirements fall under this governance framework. These arrangements are designed to support a comprehensive quantitative and qualitative process within a cycle of model monitoring and validation that includes:
• investigation of model stability;
• model performance measured through testing the model’s outputs against actual outcomes, and
• model use within the business, e.g. user input data quality, override activity, and the assessment of results from key controls around the usage of the rating system as a whole within the overall credit process.
The purpose of periodic monitoring and validation is therefore:
• to determine that the model continues to produce accurate outputs, suitable for the intended purposes;
• to confirm that the model remains conceptually sound, that the model design is still appropriate and the assumptions made at development remain valid;
• to ensure that the model is used for its intended purpose and for appropriate exposures only (use test); and
• to prompt corrective actions when the model outputs move away from the expected levels.
Models are validated against a series of metrics and triggers approved by the governance committee. The metrics and quantitative checks for periodic validation include a review of the data inputs and overall population stability, and an assessment of the model’s discriminatory power or rank order capability, its calibration accuracy, and its performance against available benchmarks. The qualitative checks include and reconfirm all elements assessed at design phase, including the model’s conceptual soundness.
The results of periodic in-depth validation must be presented to a model governing committee at least annually. A subset of the key performance metrics is produced and reviewed as part of the ongoing monitoring process.
A large number of models are used within the Group, and data at individual model level is, in most
cases, immaterial in the context of the Group overall. We therefore disclose data covering most wholesale models and several of our most material retail models. The tables below show estimated values at the beginning of the relevant observation periods, and subsequent actual experienced values, for key Basel II metrics, for wholesale models in Tables 18 and 19, and for retail models in Table 20. The detailed basis of preparation of each table is set out in footnotes.
Wholesale credit models
For wholesale portfolios, we disclose performance for models covering sovereign obligors, banks and corporates. As explained on page 30, we operate global models for the first two of these customer groups. In the case of corporates, we have aggregated data on models covering a customer population ranging from large multinational companies to medium-sized and smaller corporates. The PD analysis for this group includes mainly advanced IRB exposures but also a small element of foundation IRB.
In Table 18 below, the data for sovereigns and banks are based on such a small number of defaults that the comparison of estimated with actual results, even where these are available, is not fully reflective of a model’s performance. To mitigate this characteristic of low-default portfolios, additional analysis is carried out on these models at annual validation. This analysis shows that they discriminate risk well and are conservatively calibrated. The latter reflects both a prudent modelling approach and the conservatism required by regulations. There are as yet no significant explicit regulatory floors within our wholesale models, though this will change in 2013 with the introduction by the FSA of floors for sovereign LGD and other low default portfolios - see comments on page 5 on LGD and EAD floors.
The basis of preparation of this table has been enhanced, compared with the prior year, with more meaningful back-testing comparators. For back-testing purposes, a customer’s CRR/PD is observed at a point in time and then their default or non-default status in the following one-year period is recorded against that PD grade. The PD presentation here is expressed for all exposure classes on an obligor count basis, as model performance is judged on this basis in validation. LGD refers to observed losses for the defaulted population, being the appropriate focus of an assessment of the models’ performance.
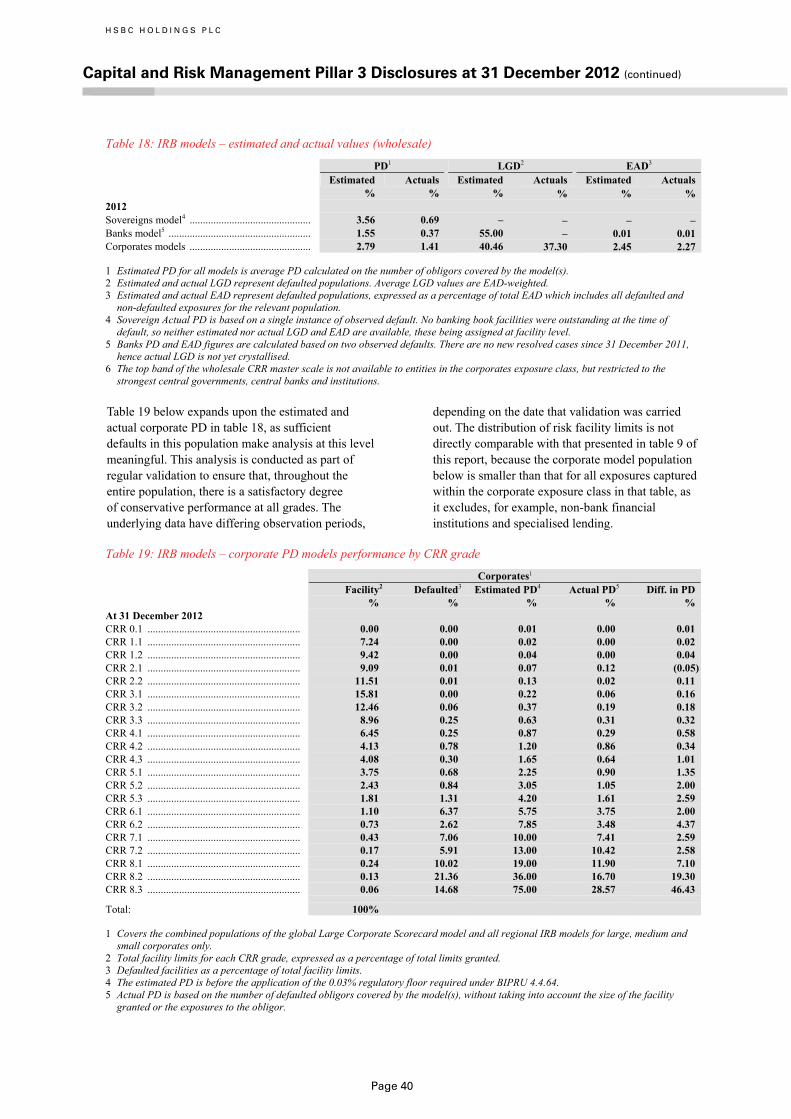
H S B C H O L D I N G S P L C
Capital and Risk Management Pillar 3 Disclosures at 31 December 2012 (continued)
Page 40
Table 18: IRB models – estimated and actual values (wholesale)
PD1 LGD2 EAD3 Estimated Actuals Estimated Actuals Estimated Actuals % % % % % % 2012 Sovereigns model4 .............................................. 3.56 0.69 – – – – Banks model5 ...................................................... 1.55 0.37 55.00 – 0.01 0.01 Corporates models .............................................. 2.79 1.41 40.46 37.30 2.45 2.27
1 Estimated PD for all models is average PD calculated on the number of obligors covered by the model(s). 2 Estimated and actual LGD represent defaulted populations. Average LGD values are EAD-weighted. 3 Estimated and actual EAD represent defaulted populations, expressed as a percentage of total EAD which includes all defaulted and
non-defaulted exposures for the relevant population. 4 Sovereign Actual PD is based on a single instance of observed default. No banking book facilities were outstanding at the time of
default, so neither estimated nor actual LGD and EAD are available, these being assigned at facility level. 5 Banks PD and EAD figures are calculated based on two observed defaults. There are no new resolved cases since 31 December 2011,
hence actual LGD is not yet crystallised. 6 The top band of the wholesale CRR master scale is not available to entities in the corporates exposure class, but restricted to the
strongest central governments, central banks and institutions.
Table 19 below expands upon the estimated and actual corporate PD in table 18, as sufficient defaults in this population make analysis at this level meaningful. This analysis is conducted as part of regular validation to ensure that, throughout the entire population, there is a satisfactory degree of conservative performance at all grades. The underlying data have differing observation periods,
depending on the date that validation was carried out. The distribution of risk facility limits is not directly comparable with that presented in table 9 of this report, because the corporate model population below is smaller than that for all exposures captured within the corporate exposure class in that table, as it excludes, for example, non-bank financial institutions and specialised lending.
Table 19: IRB models – corporate PD models performance by CRR grade
Corporates1 Facility2 Defaulted3 Estimated PD4 Actual PD5 Diff. in PD % % % % % At 31 December 2012 CRR 0.1 .......................................................... 0.00 0.00 0.01 0.00 0.01 CRR 1.1 .......................................................... 7.24 0.00 0.02 0.00 0.02 CRR 1.2 .......................................................... 9.42 0.00 0.04 0.00 0.04 CRR 2.1 .......................................................... 9.09 0.01 0.07 0.12 (0.05)CRR 2.2 .......................................................... 11.51 0.01 0.13 0.02 0.11 CRR 3.1 .......................................................... 15.81 0.00 0.22 0.06 0.16 CRR 3.2 .......................................................... 12.46 0.06 0.37 0.19 0.18 CRR 3.3 .......................................................... 8.96 0.25 0.63 0.31 0.32 CRR 4.1 .......................................................... 6.45 0.25 0.87 0.29 0.58 CRR 4.2 .......................................................... 4.13 0.78 1.20 0.86 0.34 CRR 4.3 .......................................................... 4.08 0.30 1.65 0.64 1.01 CRR 5.1 .......................................................... 3.75 0.68 2.25 0.90 1.35 CRR 5.2 .......................................................... 2.43 0.84 3.05 1.05 2.00 CRR 5.3 .......................................................... 1.81 1.31 4.20 1.61 2.59 CRR 6.1 .......................................................... 1.10 6.37 5.75 3.75 2.00 CRR 6.2 .......................................................... 0.73 2.62 7.85 3.48 4.37 CRR 7.1 .......................................................... 0.43 7.06 10.00 7.41 2.59 CRR 7.2 .......................................................... 0.17 5.91 13.00 10.42 2.58 CRR 8.1 .......................................................... 0.24 10.02 19.00 11.90 7.10 CRR 8.2 .......................................................... 0.13 21.36 36.00 16.70 19.30 CRR 8.3 .......................................................... 0.06 14.68 75.00 28.57 46.43
Total: 100%
1 Covers the combined populations of the global Large Corporate Scorecard model and all regional IRB models for large, medium and small corporates only.
2 Total facility limits for each CRR grade, expressed as a percentage of total limits granted. 3 Defaulted facilities as a percentage of total facility limits. 4 The estimated PD is before the application of the 0.03% regulatory floor required under BIPRU 4.4.64. 5 Actual PD is based on the number of defaulted obligors covered by the model(s), without taking into account the size of the facility
granted or the exposures to the obligor.
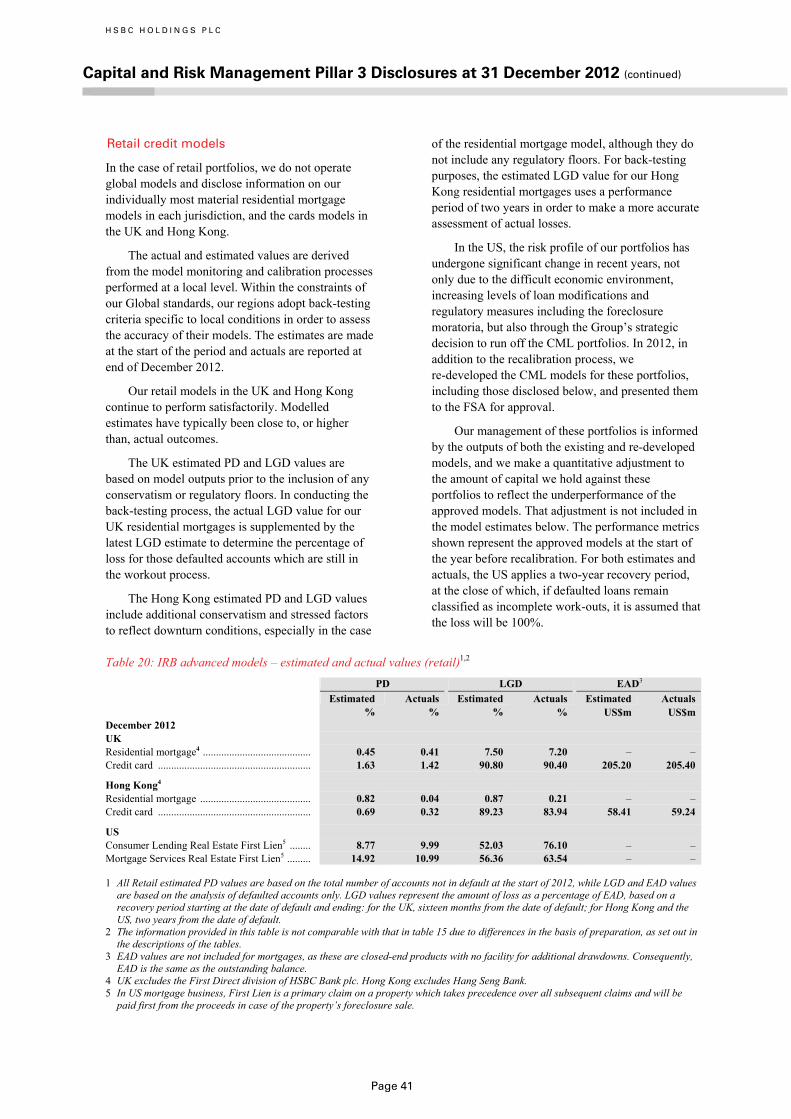
H S B C H O L D I N G S P L C
Capital and Risk Management Pillar 3 Disclosures at 31 December 2012 (continued)
Page 41
Retail credit models
In the case of retail portfolios, we do not operate global models and disclose information on our individually most material residential mortgage models in each jurisdiction, and the cards models in the UK and Hong Kong.
The actual and estimated values are derived from the model monitoring and calibration processes performed at a local level. Within the constraints of our Global standards, our regions adopt back-testing criteria specific to local conditions in order to assess the accuracy of their models. The estimates are made at the start of the period and actuals are reported at end of December 2012.
Our retail models in the UK and Hong Kong continue to perform satisfactorily. Modelled estimates have typically been close to, or higher than, actual outcomes.
The UK estimated PD and LGD values are based on model outputs prior to the inclusion of any conservatism or regulatory floors. In conducting the back-testing process, the actual LGD value for our UK residential mortgages is supplemented by the latest LGD estimate to determine the percentage of loss for those defaulted accounts which are still in the workout process.
The Hong Kong estimated PD and LGD values include additional conservatism and stressed factors to reflect downturn conditions, especially in the case
of the residential mortgage model, although they do not include any regulatory floors. For back-testing purposes, the estimated LGD value for our Hong Kong residential mortgages uses a performance period of two years in order to make a more accurate assessment of actual losses.
In the US, the risk profile of our portfolios has undergone significant change in recent years, not only due to the difficult economic environment, increasing levels of loan modifications and regulatory measures including the foreclosure moratoria, but also through the Group’s strategic decision to run off the CML portfolios. In 2012, in addition to the recalibration process, we re-developed the CML models for these portfolios, including those disclosed below, and presented them to the FSA for approval.
Our management of these portfolios is informed by the outputs of both the existing and re-developed models, and we make a quantitative adjustment to the amount of capital we hold against these portfolios to reflect the underperformance of the approved models. That adjustment is not included in the model estimates below. The performance metrics shown represent the approved models at the start of the year before recalibration. For both estimates and actuals, the US applies a two-year recovery period, at the close of which, if defaulted loans remain classified as incomplete work-outs, it is assumed that the loss will be 100%.
Table 20: IRB advanced models – estimated and actual values (retail)1,2
PD LGD EAD3 Estimated Actuals Estimated Actuals Estimated Actuals % % % % US$m US$m December 2012 UK Residential mortgage4 ......................................... 0.45 0.41 7.50 7.20 – – Credit card .......................................................... 1.63 1.42 90.80 90.40 205.20 205.40
Hong Kong4 Residential mortgage .......................................... 0.82 0.04 0.87 0.21 – – Credit card .......................................................... 0.69 0.32 89.23 83.94 58.41 59.24
US Consumer Lending Real Estate First Lien5 ........ 8.77 9.99 52.03 76.10 – – Mortgage Services Real Estate First Lien5 ......... 14.92 10.99 56.36 63.54 – –
1 All Retail estimated PD values are based on the total number of accounts not in default at the start of 2012, while LGD and EAD values are based on the analysis of defaulted accounts only. LGD values represent the amount of loss as a percentage of EAD, based on a recovery period starting at the date of default and ending: for the UK, sixteen months from the date of default; for Hong Kong and the US, two years from the date of default.
2 The information provided in this table is not comparable with that in table 15 due to differences in the basis of preparation, as set out in the descriptions of the tables.
3 EAD values are not included for mortgages, as these are closed-end products with no facility for additional drawdowns. Consequently, EAD is the same as the outstanding balance.
4 UK excludes the First Direct division of HSBC Bank plc. Hong Kong excludes Hang Seng Bank. 5 In US mortgage business, First Lien is a primary claim on a property which takes precedence over all subsequent claims and will be
paid first from the proceeds in case of the property’s foreclosure sale.

H S B C H O L D I N G S P L C
Capital and Risk Management Pillar 3 Disclosures at 31 December 2012 (continued)
Page 42
EL and impairment
We analyse credit loss experience in order to assess the performance of our risk measurement and control processes, and to inform our understanding of the implications for risk and capital management of dynamic changes occurring in the risk profile of our exposures.
This analysis includes comparison of the EL calculated in the use of IRB risk rating models, which influences the regulatory capital calculation, with other reported measures of loss within financial statements prepared under IFRSs. The excess of EL over impairment allowances is treated as a capital deduction in the composition of regulatory capital.
The disclosures below set out:
• commentary on aspects of the relationship between regulatory EL and impairments recognised in our financial statements; and
• tables of EL and impairment charges by exposure class (within Retail IRB, also by sub-class) and by region.
When comparing regulatory EL with measures of impairment under IFRSs, it is necessary to take into account differences in the definition and scope of each. The following are examples of matters that can give rise to material differences in the way economic, business and methodological drivers are reflected quantitatively in the accounting and regulatory measures of loss.
Tables 21 and 22 set out, for IRB credit exposures, the EL and the actual loss experience reflected in impairment charges. Impairment charges represent a movement in the impairment allowance balance during the year, reflecting loss events which occured during the financial year and changes in estimates of losses arising on events which occurred prior to the current year. EL represents the one-year
Examples of differences in definition and scope between EL and impairment allowances • EL is based on exposure values that incorporate expected
future drawings of committed credit lines, while impairment allowances are recognised in respect of financial assets recognised on the balance sheet and in respect of committed credit lines where a loss is probable;
• EL is generally based on TTC estimates of PD over a one-year future horizon, determined via statistical analysis of historical default experience. Impairment allowances are recognised for losses that have been incurred at the balance sheet date;
• In the majority of cases, EL is based on economic downturn estimates of LGD, while impairment allowances are measured using estimated future cash flows as at the balance sheet date;
• EL incorporates LGD, which may discount recoveries at a different rate from the Effective Interest Rate employed in discounted cash flow analysis for impairment;
• LGDs typically include all costs associated with recovery, whereas the measurement of impairment considers only the costs of obtaining and selling collateral;
• The LGD and EAD used for the EL calculation in the Foundation IRB approach is set by regulations and may differ significantly from the assumptions about estimated cash flows used to calculate impairment allowances;
• For EL, certain exposures are subject to regulatory minimum thresholds for one or more parameters, whereas impairments under IFRSs are determined using management’s judgement about estimated future cashflows; and
• In the case of EL, to meet regulatory prudential standards, HSBC’s model philosophy favours the incorporation of conservative estimation to accommodate undertainty, for instance where modelling portfolios with limited data. Under IFRSs, uncertainty is considered when forming management’s estimated of future cash flows, using balanced and neutral judgement.
regulatory expected loss accumulated in the book and calculated at a point in time.
The figures for impairment charges shown below are prepared on an accounting consolidation basis, but are not significantly different from those calculated on a regulatory consolidation basis.
Table 21: IRB expected loss and impairment charges – by exposure class1
Expected loss at 1 January
Impairment charge for
Expected loss at 1 January
Impairment charge for
2012 2012 2011 2011 US$bn US$bn US$bn US$bn IRB exposure classes Central governments and central banks ....................................... 0.2 – 0.1 – Institutions .................................................................................... 0.3 – 0.3 – Corporates ..................................................................................... 4.5 1.3 4.8 1.3 Retail ............................................................................................. 14.5 3.5 15.7 7.4
– secured on real estate property ............................................. 8.6 2.4 8.4 4.9 – qualifying revolving retail .................................................... 3.6 0.6 4.3 1.9 – SMEs .................................................................................... 0.8 – 0.8 – – other retail ............................................................................ 1.5 0.5 2.2 0.6
19.5 4.8 20.9 8.7
1 Excludes securitisation exposures because EL is not calculated for this exposure class.

H S B C H O L D I N G S P L C
Capital and Risk Management Pillar 3 Disclosures at 31 December 2012 (continued)
Page 43
Table 22: IRB expected loss and impairment charges – by geographical region1
Expected loss at 1 January
Impairment charge for
Expected loss at 1 January
Impairment charge for
2012 2012 20111 2011 US$bn US$bn US$bn US$bn
Europe ........................................................................................... 4.8 1.3 5.6 1.6 Hong Kong ................................................................................... 0.8 0.1 0.9 0.2 Rest of Asia-Pacific ...................................................................... 0.9 0.1 1.0 – MENA ........................................................................................... 0.3 0.1 0.1 – North America .............................................................................. 12.7 3.2 13.2 6.9 Latin America ............................................................................... – – 0.1 –
19.5 4.8 20.9 8.7
1 Excludes securitisation exposures because EL is not calculated for this exposure class.
Key points • The majority of EL at 1 January 2012 and of impairment charges for the year ended 31 December 2012, as for the previous reported
period, related to our retail exposures in North America. The EL for North America primarily reflects the accumulated EL in the defaulted book. It decreased by US$0.5bn or 4% at 1 January 2012 compared with 1 January 2011 in line with the continued run-off of the CML portfolios.
• The fall in the impairment charge in North America reflects the continuing run-off of the CML portfolio, the sale of our Card and Retail Services business and improved portfolio characteristics.
At 31 December 2012, total EL remained high
at US$17.4bn (2011: US$19.5bn), while impairment allowances related to the IRB exposure classes (not shown above) were US$11.2bn (2011: US$13.9bn).
The excess of EL over impairment allowances was therefore US$6.2bn (2011: US$5.6bn) as shown in table 3 on page 9 against alphabetic reference ‘i’. This represented a greater charge to capital in 2012 than in 2011, principally due to the EL in North America lagging improvements in the current performance of the related portfolios.
The drivers of the impairment allowances and charges for 2012 in North America, including delinquency experience and loss severities, are extensively discussed on pages 151 and 171 of the Annual Report and Accounts 2012.
Other movements in EL and impairment charges in 2012 were less significant. In Europe, both the impairment charge and EL fell, despite the generally difficult economic environment. Both impairment charges and EL in other regions were relatively low.
Full details of the Group’s impaired loans and advances, past due but not impaired assets and impairment allowances and charges are set out from page 155 of the Annual Report and Accounts 2012.
Our approach for determining impairment allowances is explained on page 389 of the Annual Report and Accounts 2012.
Risk mitigation under IRB approaches
Our approach when granting credit facilities is to do so on the basis of capacity to repay rather than place primary reliance on credit risk mitigants. Depending on a customer’s standing and the type of product, facilities may be provided unsecured. Mitigation of credit risk is nevertheless a key aspect of effective risk management and, in a diversified financial services organisation such as HSBC, takes many forms.
Our general policy is to promote the use of credit risk mitigation, justified by commercial prudence and good practice as well as capital efficiency. Specific, detailed policies cover the acceptability, structuring and terms of various types of business with regard to the availability of credit risk mitigation, for example in the form of collateral security. These policies, together with the determination of suitable valuation parameters, are subject to regular review to ensure that they are supported by empirical evidence and continue to fulfil their intended purpose.
We have safeguards designed to ensure exposures to providers or types of risk mitigation do not become excessive in relation to the Group’s capital resources.
Physical collateral
The most common method of mitigating credit risk is to take collateral. Usually, in our residential and commercial real estate businesses a mortgage over the property is taken to help secure claims. Physical collateral is also taken in various forms of specialised lending and leasing transactions where income from the physical assets that are financed is

H S B C H O L D I N G S P L C
Capital and Risk Management Pillar 3 Disclosures at 31 December 2012 (continued)
Page 44
also the principal source of facility repayment. In the commercial and industrial sectors, charges are created over business assets such as premises, stock and debtors. Loans to private banking clients may be made against a pledge of eligible marketable securities, cash or real estate. Facilities to SMEs are commonly granted against guarantees given by their owners and/or directors. Guarantees from third parties can arise where the Group extends facilities without the benefit of any alternative form of security, e.g. where it issues a bid or performance bond in favour of a non-customer at the request of another bank.
Further information regarding collateral held over Residential and Commercial Real Estate (‘CRE’) properties is provided from page 163 of the Annual Report and Accounts 2012.
Financial collateral
In the institutional sector, trading facilities are supported by charges over financial instruments such as cash, debt securities and equities. Financial collateral in the form of marketable securities is used in much of the Group’s over-the-counter (‘OTC’) derivatives activities and in securities financing transactions (‘SFT’s) such as repos, reverse repos, securities lending and borrowing. Netting is used extensively and is a prominent feature of market standard documentation. Further information regarding collateral held for trading exposures can be found on page 48.
Other forms of collateral
Our Global Banking and Markets business utilises credit risk mitigation to manage the credit risk of its portfolios, with the goal of reducing concentrations in individual names, sectors or portfolios. The techniques in use include credit default swap (‘CDS’) purchases, structured credit notes and securitisation structures. Buying credit protection creates credit exposure against the protection provider, which is monitored as part of the overall credit exposure to the relevant protection provider. Where applicable the transaction is entered into directly with a central clearing house counterparty, otherwise our exposure to CDS protection providers is diversified among mainly banking counterparties with strong credit ratings.
Policy and procedures
Policies and procedures govern the protection of our position from the outset of a customer relationship, for instance in requiring standard terms and conditions or specifically agreed documentation
permitting the offset of credit balances against debt obligations, and through controls over the integrity, current valuation and, if necessary, realisation of collateral security.
Valuing collateral
Valuation strategies are established to monitor collateral mitigants to ensure that they will continue to provide the anticipated secure secondary repayment source. Where collateral is subject to high volatility, valuation is frequent; where stable, less so. Market trading activities such as collateralised OTC derivatives and SFTs typically carry out daily valuations in support of margining arrangements. In the residential mortgage business, Group policy prescribes re-valuation at intervals of up to three years, or more frequently as the need arises, for example where market conditions are subject to significant change. Residential property collateral values are determined through a combination of professional appraisals, house price indices or statistical analysis.
Local market conditions determine the frequency of valuation for CRE. Revaluations are sought where, for example, as part of the regular credit assessment of the obligor, material concerns arise in relation to the performance of the collateral. CRE revaluation also occurs commonly in circumstances where an obligor’s credit quality has declined sufficiently to cause concern that the principal payment source may not fully meet the obligation. Where such concerns exist the revaluation method selected will depend upon the loan to value relationship, the direction in which the local CRE market has moved since last valuation, and most importantly the specific characteristics of the underlying commercial real estate which is of concern.
Risk mitigation under the IRB approach
Within an IRB approach, risk mitigants are considered in two broad categories: first, those which reduce the intrinsic PD of an obligor and therefore operate as determinants of PD; and second, those which affect the estimated recoverability of obligations and require adjustment of LGD or, in certain circumstances, EAD.
The first typically include full parental guarantees – where one obligor within a group of companies guarantees another. This is usually factored into the estimate of the latter’s PD, as it is assumed that the guarantor’s performance materially informs the PD of the guaranteed entity. PD estimates are also subject to supplementary

H S B C H O L D I N G S P L C
Capital and Risk Management Pillar 3 Disclosures at 31 December 2012 (continued)
Page 45
methodologies in respect of a ‘sovereign ceiling’, constraining the risk ratings assigned to obligors in countries of higher risk, and where only partial parental support exists. In addition, in certain jurisdictions, certain types of third party guarantee are recognised through substitution of the obligor’s PD by the guarantor’s PD.
In the second category, LGD estimates are affected by a wider range of collateral including cash, charges over real estate property, fixed assets, trade goods, receivables and floating charges such as mortgage debentures. Unfunded mitigants, such as third party guarantees, are also taken into consideration in LGD estimates where there is evidence they reduce loss expectation.
The creditworthiness of providers of unfunded credit risk mitigation is taken into consideration as part of the guarantor’s risk profile when, for example, assessing the risk of other exposures such as direct lending to the guarantor. Internal limits for such contingent exposure are approved in the same way as direct exposures.
EAD and LGD values, in the case of individually assessed exposures, are determined by reference to regionally approved internal risk parameters based on the nature of the exposure. For retail portfolios, credit risk mitigation data is incorporated into the internal risk parameters for exposures and feeds into the calculation of the EL band value summarising both customer delinquency and product or facility risk. Credit and credit risk mitigation data form inputs submitted by all Group offices to centralised databases and processing, including performance of calculations to apply the relevant Basel II rules and approach. A range of
collateral recognition approaches are applied to IRB capital treatments:
• unfunded protection, which includes credit derivatives and guarantees, is reflected through adjustment or determination of PD, or LGD. Under the IRB advanced approach, recognition may be through PD (as a significant factor in grade determination) or LGD, or both;
• eligible financial collateral under the IRB advanced approach is taken into account in LGD models. Under the IRB foundation approach, regulatory LGD values are adjusted. The adjustment to LGD is based on the degree to which the exposure value would be adjusted notionally if the Financial Collateral Comprehensive Method (‘FCCM’) were applied; and
• for all other types of collateral, including real estate, the LGD for exposures calculated under the IRB advanced approach will be calculated by models. For IRB foundation, base regulatory LGDs are adjusted depending on the value and type of the asset taken as collateral relative to the exposure. The types of eligible mitigant recognised under the IRB foundation approach are more limited.
The table below sets out for IRB exposures the exposure value and the effective value of credit risk mitigation expressed as the exposure value covered by the credit risk mitigant.
Further information on credit risk mitigation may be found on page 163 of the Annual Report and Accounts 2012.
Table 23: IRB exposure – credit risk mitigation
At 31 December 2012 At 31 December 2011
Exposure value covered by credit derivatives or guarantees
Exposure value
Exposure value covered by credit derivatives or guarantees
Exposure value
US$bn US$bn US$bn US$bn Exposures under the IRB advanced approach Central governments and central banks .................................... – 355.8 0.3 408.0 Institutions ................................................................................. 1.9 131.1 6.2 145.4 Corporates .................................................................................. 43.8 479.1 50.0 444.2 Retail .......................................................................................... 29.7 454.6 29.5 518.6 Equity ......................................................................................... – 0.3 – 0.4 Securitisation positions .............................................................. – 49.1 – 58.8
1,470.0 1,575.4
Exposures under the IRB foundation approach Corporates1 ................................................................................. 0.2 19.4 0.2 16.5
1 The value of exposures under the IRB foundation approach covered by eligible financial and other collateral was US$0.6bn (2011: US$0.2bn).

H S B C H O L D I N G S P L C
Capital and Risk Management Pillar 3 Disclosures at 31 December 2012 (continued)
Page 46
Application of the standardised approach
The standardised approach is applied where exposures do not qualify for use of an IRB approach and/or where an exemption from IRB has been granted. The standardised approach requires banks to use risk assessments prepared by External Credit Assessment Institutions (‘ECAI’s) or Export Credit Agencies to determine the risk weightings applied to rated counterparties.
ECAI risk assessments are used within the Group as part of the determination of risk weightings for the following classes of exposure: • Central governments and central banks; • Institutions; • Corporates; • Securitisation positions; • Short-term claims on institutions and corporates; • Regional governments and local authorities; and • Multilateral development banks.
We have nominated three FSA-recognised ECAIs for this purpose – Moody’s Investors Service (‘Moody’s’), S&P and Fitch Group (‘Fitch’). We have not nominated any Export Credit Agencies.
Credit quality step
Moody’s assessments
S&P’s assessments
Fitch’s assessments
1 Aaa to Aa3 AAA to AA– AAA to AA– 2 A1 to A3 A+ to A– A+ to A– 3 Baa1 to Baa3 BBB+ to BBB– BBB+ to BBB– 4 Ba1 to Ba3 BB+ to BB– BB+ to BB– 5 B1 to B3 B+ to B– B+ to B– 6 Caa1
and below CCC+ and below
CCC+ and below
Data files of external ratings from the nominated
ECAIs are matched with customer records in our centralised credit database.
When calculating the risk-weighted value of an exposure using ECAI risk assessments, risk systems identify the customer in question and look up the available ratings in the central database according to the FSA’s rating selection rules. The systems then apply the FSA’s prescribed credit quality step mapping to derive from the rating the relevant risk weight.
All other exposure classes are assigned risk weightings as prescribed in the FSA’s rulebook.
Exposures to, or guaranteed by, central governments and central banks of EEA States are risk-weighted at 0% using the Standardised approach, provided they would be eligible under that approach for a 0% risk weighting.
Associates’ exposures are calculated under the standardised approach and, at 31 December 2012, represented approximately 18% (2011: 16%) of Group credit risk RWAs. The increase is mainly caused by an increase in corporate lending and lending to institutions in our Chinese associates, partly offset by the partial sale of our investment in Ping An, see page 8 of the Annual Report and Accounts 2012. For accounting purposes, Ping An was previously treated as an associate. The regulatory treatment was to deduct the insurance business from capital and to partially consolidate and risk-weight their banking subsidiary. Following the partial sale, the whole investment in Ping An, including the insurance business and the banking subsidiary, is treated as a material holding and deducted from capital.
Risk mitigation under the standardised approach
Where credit risk mitigation is available in the form of an eligible guarantee, non-financial collateral, or credit derivatives, the exposure is divided into covered and uncovered portions. The covered portion, which is determined after applying an appropriate ‘haircut’ for currency and maturity mismatch (and for omission of restructuring clauses for credit derivatives, where appropriate) to the amount of the protection provided, attracts the risk weight of the protection provider. The uncovered portion attracts the risk weight of the obligor. For exposures fully or partially covered by eligible financial collateral, the value of the exposure is adjusted under the FCCM using supervisory volatility adjustments, including those arising from currency mismatch, which are determined by the specific type of collateral (and, in the case of eligible debt securities, their credit quality) and its liquidation period. The adjusted exposure value is subject to the risk weight of the obligor.
Table 24 sets out the credit risk mitigation for exposures under the standardised approach, expressed as the exposure value covered by the credit risk mitigant, and table 25 sets out the distribution of standardised exposures across credit quality steps. This analysis excludes regional governments or local authorities, short-term claims, securitisation positions, collective investment undertakings and multilateral development banks, as these exposures continue to be immaterial as a percentage of total standardised exposures. Also excluded, because the credit quality step methodology does not apply, are retail, equity, past due items and exposures secured on real estate property.
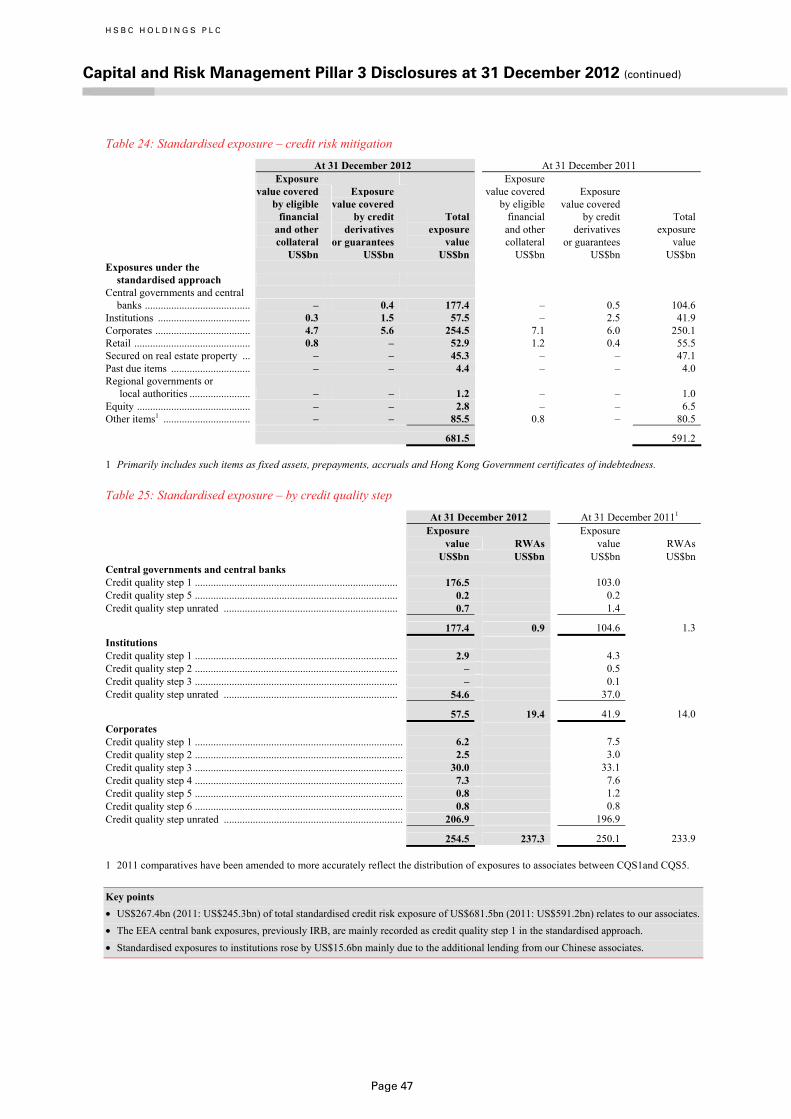
H S B C H O L D I N G S P L C
Capital and Risk Management Pillar 3 Disclosures at 31 December 2012 (continued)
Page 47
Table 24: Standardised exposure – credit risk mitigation
At 31 December 2012 At 31 December 2011
Exposure value covered by eligible financial and other collateral
Exposurevalue covered by credit derivativesor guarantees
Total exposure value
Exposure value covered by eligible financial and other collateral
Exposure value covered by credit derivatives or guarantees
Total exposure value
US$bn US$bn US$bn US$bn US$bn US$bn Exposures under the
standardised approach
Central governments and central
banks ........................................ – 0.4 177.4
– 0.5 104.6 Institutions ................................... 0.3 1.5 57.5 – 2.5 41.9 Corporates .................................... 4.7 5.6 254.5 7.1 6.0 250.1 Retail ............................................ 0.8 – 52.9 1.2 0.4 55.5 Secured on real estate property ... – – 45.3 – – 47.1 Past due items .............................. – – 4.4 – – 4.0 Regional governments or
local authorities ....................... – – 1.2
– – 1.0 Equity ........................................... – – 2.8 – – 6.5 Other items1 ................................. – – 85.5 0.8 – 80.5
681.5 591.2
1 Primarily includes such items as fixed assets, prepayments, accruals and Hong Kong Government certificates of indebtedness.
Table 25: Standardised exposure – by credit quality step
At 31 December 2012 At 31 December 20111
Exposure value
RWAs
Exposure value
RWAs
US$bn US$bn US$bn US$bn Central governments and central banks Credit quality step 1 ............................................................................. 176.5 103.0 Credit quality step 5 ............................................................................. 0.2 0.2 Credit quality step unrated .................................................................. 0.7 1.4
177.4 0.9 104.6 1.3 Institutions Credit quality step 1 ............................................................................. 2.9 4.3 Credit quality step 2 ............................................................................. – 0.5 Credit quality step 3 ............................................................................. – 0.1 Credit quality step unrated .................................................................. 54.6 37.0
57.5 19.4 41.9 14.0 Corporates Credit quality step 1 ............................................................................... 6.2 7.5 Credit quality step 2 ............................................................................... 2.5 3.0 Credit quality step 3 ............................................................................... 30.0 33.1 Credit quality step 4 ............................................................................... 7.3 7.6 Credit quality step 5 ............................................................................... 0.8 1.2 Credit quality step 6 ............................................................................... 0.8 0.8 Credit quality step unrated .................................................................... 206.9 196.9
254.5 237.3 250.1 233.9
1 2011 comparatives have been amended to more accurately reflect the distribution of exposures to associates between CQS1and CQS5.
Key points • US$267.4bn (2011: US$245.3bn) of total standardised credit risk exposure of US$681.5bn (2011: US$591.2bn) relates to our associates. • The EEA central bank exposures, previously IRB, are mainly recorded as credit quality step 1 in the standardised approach. • Standardised exposures to institutions rose by US$15.6bn mainly due to the additional lending from our Chinese associates.

H S B C H O L D I N G S P L C
Capital and Risk Management Pillar 3 Disclosures at 31 December 2012 (continued)
Page 48
Counterparty credit risk
Counterparty credit risk arises for OTC derivatives and SFTs. It is calculated in both the trading and non-trading books, and is the risk that a counterparty to a transaction may default before completing the satisfactory settlement of the transaction. An economic loss occurs if the transaction or portfolio of transactions with the counterparty has a positive economic value at the time of default.
As stated on page 12, there are three approaches under Basel II to calculating exposure values for counterparty credit risk: the standardised, the mark-to-market and the IMM. Exposure values calculated under these methods are used to determine RWAs using one of the credit risk approaches. Across the Group, we use both the mark-to-market method and the IMM for counterparty credit risk. Under the IMM, the EAD is calculated by multiplying the effective expected positive exposure with a multiplier called ‘alpha’. Alpha accounts for several portfolio features that increase the EL in the event of default above that indicated by effective expected positive exposure: co-variance of exposures, correlation between exposures and default, concentration risk and model risk. It also accounts for the level of volatility/correlation that might coincide with a downturn. The default alpha value of 1.4 is used. Limits for counterparty credit risk exposures are assigned within the overall credit process for distinct customer limit approval. The measure used for counterparty credit risk management – both limits and utilisations – is the 95th percentile of potential future exposure.
The credit risk function assigns a limit against each counterparty to cover derivatives exposure which may arise as a result of a counterparty default. The magnitude of this limit will depend on the overall risk appetite and type of derivatives trading undertaken with the counterparty. Risk is then assessed against each counterparty using models which consider volatility, trade maturity and the counterparty legal documentation.
The models and methodologies used in the calculation of counterparty risk are approved by the Counterparty Risk Methodology Committee, a sub-committee of Group MOC. In line with the IMM governance standards, models are subject to independent review when they are first developed and thereafter annual review.
Credit valuation adjustment
The credit valuation adjustment (‘CVA’) is an adjustment to the value of OTC derivative transaction contracts to reflect, within fair value, the possibility that the counterparty may default, and we may not receive the full market value of the transactions. We calculate a separate CVA for each HSBC legal entity, and within each entity for each counterparty to which the entity has exposure. The adjustment aims to calculate the potential loss arising from the portfolio of derivative transactions against each third party, based upon a modelled expected positive exposure profile, including allowance for credit risk mitigants such as netting agreements and Credit Support Annexes (‘CSA’s).
Further details of our CVA methodology may be found on page 56 of the Annual Report and Accounts 2012.
Collateral arrangements
It is our policy to revalue all traded transactions and associated collateral positions on a daily basis. An independent Collateral Management function manages the collateral process, which includes pledging and receiving collateral, and investigating disputes and non-receipts.
Eligible collateral types are controlled under a policy which ensures the collateral agreed to be taken exhibits characteristics such as price transparency, price stability, liquidity, enforceability, independence, reusability and eligibility for regulatory purposes. A valuation ‘haircut’ policy reflects the fact that collateral may fall in value between the date the collateral was called and the date of liquidation or enforcement. At least 95% of collateral held as credit risk mitigation under CSAs is either cash or government securities.
Credit ratings downgrade
The Credit Rating Downgrade clause in a Master Agreement or the Credit Rating Downgrade Threshold clause in the CSA are designed to trigger a series of events which may include the requirement to pay or increase collateral, the termination of transactions by the non-affected party, or assignment by the affected party, if the credit rating of the affected party falls below a specified level.
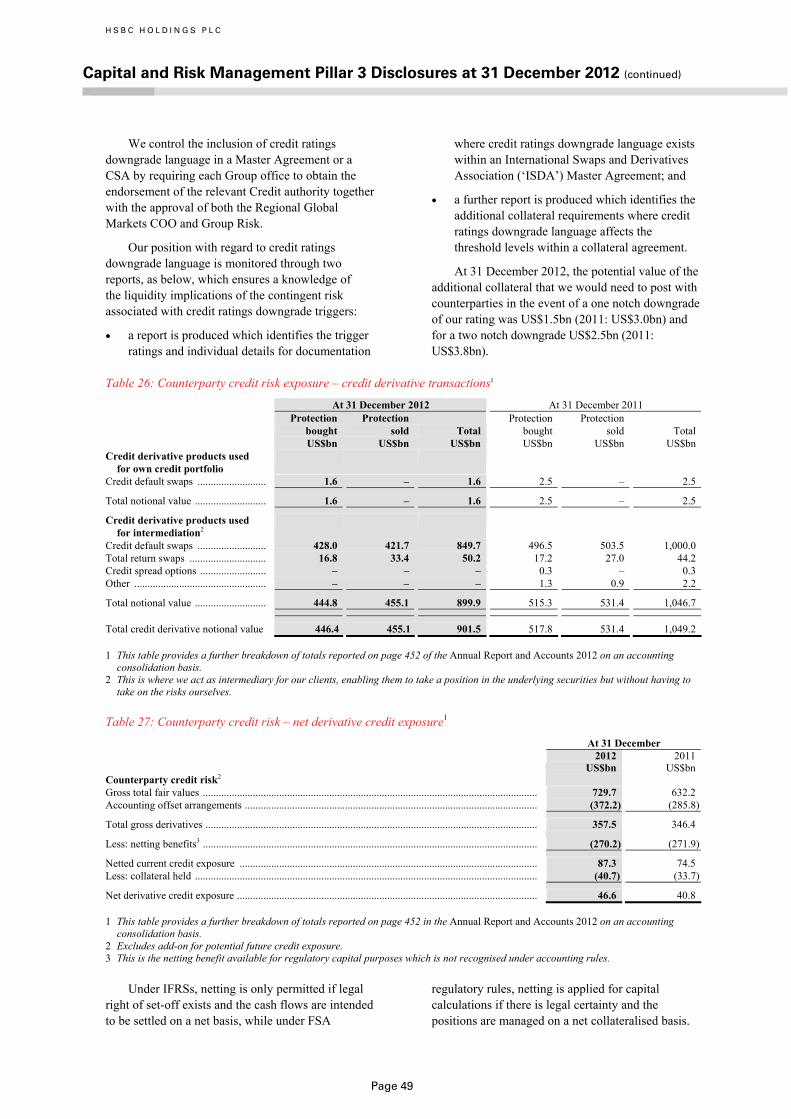
H S B C H O L D I N G S P L C
Capital and Risk Management Pillar 3 Disclosures at 31 December 2012 (continued)
Page 49
We control the inclusion of credit ratings downgrade language in a Master Agreement or a CSA by requiring each Group office to obtain the endorsement of the relevant Credit authority together with the approval of both the Regional Global Markets COO and Group Risk.
Our position with regard to credit ratings downgrade language is monitored through two reports, as below, which ensures a knowledge of the liquidity implications of the contingent risk associated with credit ratings downgrade triggers:
• a report is produced which identifies the trigger ratings and individual details for documentation
where credit ratings downgrade language exists within an International Swaps and Derivatives Association (‘ISDA’) Master Agreement; and
• a further report is produced which identifies the additional collateral requirements where credit ratings downgrade language affects the threshold levels within a collateral agreement.
At 31 December 2012, the potential value of the additional collateral that we would need to post with counterparties in the event of a one notch downgrade of our rating was US$1.5bn (2011: US$3.0bn) and for a two notch downgrade US$2.5bn (2011: US$3.8bn).
Table 26: Counterparty credit risk exposure – credit derivative transactions1
At 31 December 2012 At 31 December 2011
Protection bought
Protection sold Total
Protection bought
Protection sold Total
US$bn US$bn US$bn US$bn US$bn US$bn Credit derivative products used
for own credit portfolio
Credit default swaps .......................... 1.6 – 1.6 2.5 – 2.5
Total notional value ........................... 1.6 – 1.6 2.5 – 2.5
Credit derivative products used for intermediation2
Credit default swaps .......................... 428.0 421.7 849.7 496.5 503.5 1,000.0 Total return swaps ............................. 16.8 33.4 50.2 17.2 27.0 44.2 Credit spread options ......................... – – – 0.3 – 0.3 Other .................................................. – – – 1.3 0.9 2.2
Total notional value ........................... 444.8 455.1 899.9 515.3 531.4 1,046.7
Total credit derivative notional value 446.4 455.1 901.5 517.8 531.4 1,049.2
1 This table provides a further breakdown of totals reported on page 452 of the Annual Report and Accounts 2012 on an accounting consolidation basis.
2 This is where we act as intermediary for our clients, enabling them to take a position in the underlying securities but without having to take on the risks ourselves.
Table 27: Counterparty credit risk – net derivative credit exposure1
At 31 December 2012 2011 US$bn US$bn Counterparty credit risk2 Gross total fair values ............................................................................................................................... 729.7 632.2 Accounting offset arrangements ............................................................................................................... (372.2) (285.8)
Total gross derivatives .............................................................................................................................. 357.5 346.4
Less: netting benefits3 ............................................................................................................................... (270.2) (271.9)
Netted current credit exposure ................................................................................................................. 87.3 74.5 Less: collateral held .................................................................................................................................. (40.7) (33.7)
Net derivative credit exposure .................................................................................................................. 46.6 40.8
1 This table provides a further breakdown of totals reported on page 452 in the Annual Report and Accounts 2012 on an accounting consolidation basis.
2 Excludes add-on for potential future credit exposure. 3 This is the netting benefit available for regulatory capital purposes which is not recognised under accounting rules.
Under IFRSs, netting is only permitted if legal right of set-off exists and the cash flows are intended to be settled on a net basis, while under FSA
regulatory rules, netting is applied for capital calculations if there is legal certainty and the positions are managed on a net collateralised basis.

H S B C H O L D I N G S P L C
Capital and Risk Management Pillar 3 Disclosures at 31 December 2012 (continued)
Page 50
As a consequence, we recognise greater netting under the FSA rules as it reflects the close out provisions that would result in the default of a counterparty, rather than just those transactions that are actually settled net in the normal course of business.
The difference in total value of exposures between table 27 and table 28 reflects the difference in the basis of accounting and regulatory consolidations, and also the inclusion of the adjustment for potential future credit exposures in the regulatory figures in table 28.
Table 28: Counterparty credit risk exposure – by exposure class, product and method
IMM Mark-to-market method Total counterparty credit risk Exposure Exposure Exposure value RWAs value RWAs value RWAs US$bn US$bn US$bn US$bn US$bn US$bn At 31 December 2012 By exposure class IRB advanced approach .......... 24.9 10.0 107.2 33.9 132.1 43.9
Central governments and central banks ...................... 2.8 0.3 6.9
0.6 9.7 0.9
Institutions .............................. 4.8 1.6 64.1 14.5 68.9 16.1Corporates .............................. 17.3 8.1 36.2 18.8 53.5 26.9
IRB foundation approach ........ – – 3.5 1.8 3.5 1.8 Corporates .............................. – – 3.5 1.8 3.5 1.8
Standardised approach ............ – – 5.8 2.6 5.8 2.6 Central governments and
central banks ...................... – – 2.2
– 2.2 –Institutions .............................. – – 0.5 – 0.5 –Corporates .............................. – – 3.1 2.6 3.1 2.6
24.9 10.0 116.5 38.3 141.4 48.3
By product OTC derivatives ........................... 24.9 10.0 85.3 33.6 110.2 43.6 Securities financing transactions .... – – 23.8 2.9 23.8 2.9 Other1 ........................................... – – 7.4 1.8 7.4 1.8
24.9 10.0 116.5 38.3 141.4 48.3 At 31 December 2011 By exposure class IRB advanced approach ............... 25.3 10.2 109.9 38.4 135.2 48.6
Central governments and central banks ....................... 2.9 0.2 11.6
1.5 14.5 1.7
Institutions ............................... 5.9 2.4 58.1 12.9 64.0 15.3Corporates ............................... 16.5 7.6 40.2 24.0 56.7 31.6
IRB foundation approach ............ – – 4.3 2.0 4.3 2.0 Corporates ............................... – – 4.3 2.0 4.3 2.0
Standardised approach ................. – – 6.3 3.2 6.3 3.2 Central governments and
central banks ....................... – – 2.4
– 2.4 –Institutions ............................... – – 0.1 – 0.1 –Corporates ............................... – – 3.8 3.2 3.8 3.2
25.3 10.2 120.5 43.6 145.8 53.8
By product OTC derivatives ........................... 25.3 10.2 95.2 38.7 120.5 48.9 Securities financing transactions .... – – 24.0 3.7 24.0 3.7 Other1 ........................................... – – 1.3 1.2 1.3 1.2
25.3 10.2 120.5 43.6 145.8 53.8
1 Includes free deliveries not deducted from regulatory capital.

H S B C H O L D I N G S P L C
Capital and Risk Management Pillar 3 Disclosures at 31 December 2012 (continued)
Page 51
The following three tables set out the exposure values, RWAs and RWA density of counterparty
credit risk exposures across the regions.
Table 29: Counterparty credit risk exposure – by exposure class, product and geographical region Exposure value Europe
Hong Kong
Rest of Asia-Pacific MENA
North America
Latin America Total
US$bn US$bn US$bn US$bn US$bn US$bn US$bnAt 31 December 2012 By exposure class IRB advanced approach .................. 65.9 19.9 15.6 0.8 27.4 2.5 132.1
Central governments and central banks .............................. 6.8 0.5 1.1 – 0.3 1.0 9.7
Institutions ..................................... 32.6 13.9 7.6 0.8 12.5 1.5 68.9 Corporates ...................................... 26.5 5.5 6.9 – 14.6 – 53.5
IRB foundation approach ............... 3.2 – – 0.3 – – 3.5 Corporates ..................................... 3.2 – – 0.3 – – 3.5
Standardised approach .................... 2.2 – – 2.0 – 1.6 5.8 Central governments and
central banks ............................. 0.9 – – 1.3 – – 2.2 Institutions ..................................... 0.4 – – 0.1 – – 0.5 Corporates ..................................... 0.9 – – 0.6 – 1.6 3.1
71.3 19.9 15.6 3.1 27.4 4.1 141.4 By product OTC derivatives ............................... 52.0 14.0 15.1 1.2 25.1 2.8 110.2 Securities financing transactions ........ 17.7 0.1 0.5 1.9 2.3 1.3 23.8 Other ................................................ 1.6 5.8 – – – – 7.4
71.3 19.9 15.6 3.1 27.4 4.1 141.4 Table 30: Counterparty credit risk – RWA by exposure class, product and geographical region RWA
Europe Hong Kong
Rest of Asia-
Pacific MENA North America
Latin America Total
US$bn US$bn US$bn US$bn US$bn US$bn US$bnAt 31 December 2012 By exposure class IRB advanced approach ................ 20.4 5.3 5.9 0.2 11.3 0.8 43.9
Central governments and central banks ........................... 0.5 0.1 0.1 – 0.1 0.1 0.9
Institutions ................................... 9.4 2.1 1.5 0.2 2.2 0.7 16.1 Corporates ................................... 10.5 3.1 4.3 – 9.0 – 26.9
IRB foundation approach ............. 1.6 – – 0.2 – – 1.8 Corporates ................................... 1.6 – – 0.2 – – 1.8
Standardised approach ................. 0.5 – – 0.6 – 1.5 2.6 Central governments and
central banks ........................... – – – – – – – Institutions .................................... – – – – – – – Corporates .................................... 0.5 – – 0.6 – 1.5 2.6
22.5 5.3 5.9 1.0 11.3 2.3 48.3 By product OTC derivatives ............................... 19.6 4.4 5.7 0.9 10.9 2.1 43.6 Securities financing transactions ........ 1.9 0.1 0.2 0.1 0.4 0.2 2.9 Other ................................................ 1.0 0.8 – – – – 1.8
22.5 5.3 5.9 1.0 11.3 2.3 48.3
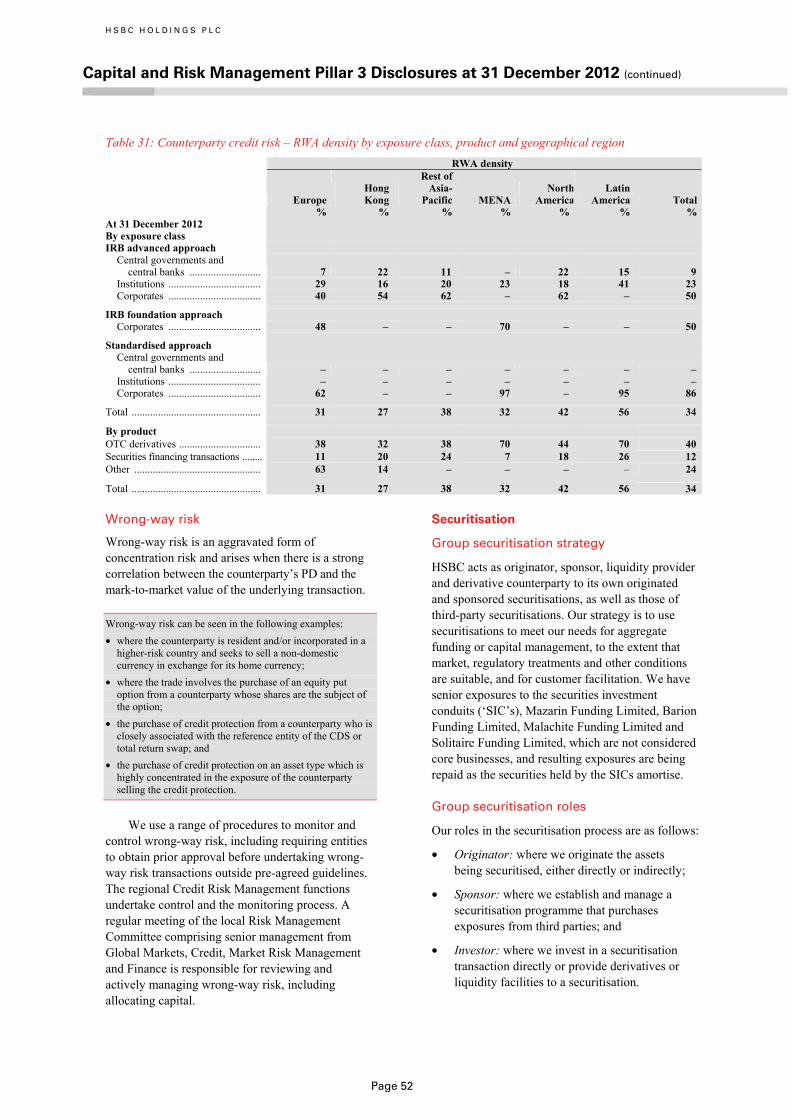
H S B C H O L D I N G S P L C
Capital and Risk Management Pillar 3 Disclosures at 31 December 2012 (continued)
Page 52
Table 31: Counterparty credit risk – RWA density by exposure class, product and geographical region RWA density
Europe Hong Kong
Rest of Asia-
Pacific MENA North America
Latin America Total
% % % % % % %At 31 December 2012 By exposure class IRB advanced approach
Central governments and central banks ........................... 7 22 11 – 22 15 9
Institutions ................................... 29 16 20 23 18 41 23 Corporates ................................... 40 54 62 – 62 – 50
IRB foundation approach Corporates ................................... 48 – – 70 – – 50
Standardised approach Central governments and
central banks ........................... – – – – – – – Institutions ................................... – – – – – – – Corporates ................................... 62 – – 97 – 95 86
Total ................................................. 31 27 38 32 42 56 34
By product OTC derivatives ............................... 38 32 38 70 44 70 40 Securities financing transactions ........ 11 20 24 7 18 26 12 Other ................................................ 63 14 – – – – 24
Total ................................................. 31 27 38 32 42 56 34 Wrong-way risk
Wrong-way risk is an aggravated form of concentration risk and arises when there is a strong correlation between the counterparty’s PD and the mark-to-market value of the underlying transaction.
Wrong-way risk can be seen in the following examples: • where the counterparty is resident and/or incorporated in a
higher-risk country and seeks to sell a non-domestic currency in exchange for its home currency;
• where the trade involves the purchase of an equity put option from a counterparty whose shares are the subject of the option;
• the purchase of credit protection from a counterparty who is closely associated with the reference entity of the CDS or total return swap; and
• the purchase of credit protection on an asset type which is highly concentrated in the exposure of the counterparty selling the credit protection.
We use a range of procedures to monitor and control wrong-way risk, including requiring entities to obtain prior approval before undertaking wrong-way risk transactions outside pre-agreed guidelines. The regional Credit Risk Management functions undertake control and the monitoring process. A regular meeting of the local Risk Management Committee comprising senior management from Global Markets, Credit, Market Risk Management and Finance is responsible for reviewing and actively managing wrong-way risk, including allocating capital.
Securitisation
Group securitisation strategy
HSBC acts as originator, sponsor, liquidity provider and derivative counterparty to its own originated and sponsored securitisations, as well as those of third-party securitisations. Our strategy is to use securitisations to meet our needs for aggregate funding or capital management, to the extent that market, regulatory treatments and other conditions are suitable, and for customer facilitation. We have senior exposures to the securities investment conduits (‘SIC’s), Mazarin Funding Limited, Barion Funding Limited, Malachite Funding Limited and Solitaire Funding Limited, which are not considered core businesses, and resulting exposures are being repaid as the securities held by the SICs amortise.
Group securitisation roles
Our roles in the securitisation process are as follows:
• Originator: where we originate the assets being securitised, either directly or indirectly;
• Sponsor: where we establish and manage a securitisation programme that purchases exposures from third parties; and
• Investor: where we invest in a securitisation transaction directly or provide derivatives or liquidity facilities to a securitisation.

H S B C H O L D I N G S P L C
Capital and Risk Management Pillar 3 Disclosures at 31 December 2012 (continued)
Page 53
HSBC as originator
We use SPEs to securitise customer loans and advances and other debt that we have originated, in order to diversify our sources of funding for asset origination and for capital efficiency purposes. In such cases, we transfer the loans and advances to the SPEs for cash, and the SPEs issue debt securities to investors to fund the cash purchases. This activity is conducted in a number of regions and across a number of asset classes. We also act as a derivative counterparty. Credit enhancements to the underlying assets may be used to obtain investment grade ratings on the senior debt issued by the SPEs. The majority of these securitisations are consolidated for accounting purposes. We have also established multi-seller conduit securitisation programmes for the purpose of providing access to flexible market-based sources of finance for our clients to finance discrete pools of third-party originated trade and vehicle finance loan receivables.
In addition, we use SPEs to mitigate the capital absorbed by some of our customer loans and advances we have originated. Credit derivatives are used to transfer the credit risk associated with such customer loans and advances to an SPE, using securitisations commonly known as synthetic securitisations by which the SPE writes CDS protection to HSBC. These SPEs are consolidated for accounting purposes when we are exposed to the majority of risks and rewards of ownership.
HSBC as sponsor
We are sponsor to a number of types of securitisation entity, including:
• two active multi-seller conduit vehicles which were established to provide finance to clients – Regency Assets Limited in Europe and Bryant Park Funding LLC in the US – to which we provide senior liquidity facilities and programme-wide credit enhancement; and
• four SICs established to provide tailored investments to third party clients, backed primarily by senior tranches of securitisations and securities issued by financial institutions. Solitaire Funding Limited and Mazarin Funding Limited are asset-backed commercial paper conduits to which we provide transaction-specific liquidity facilities; Barion Funding Limited and Malachite Funding Limited are vehicles to which we provide senior term funding. We also provide a first loss letter of credit to Solitaire Funding Limited. The performance of our exposure to these vehicles
is primarily subject to the credit risk of the underlying securities.
Further details of these entities may be found on page 504 of the Annual Report and Accounts 2012.
HSBC as investor
We have exposure to third-party securitisations across a wide range of sectors in the form of investments, liquidity facilities and as a derivative counterparty. These are primarily legacy exposures that are expected to be held to maturity.
These securitisation positions are managed by a dedicated team that uses a combination of market standard systems and third party data providers to monitor performance data and manage market and credit risks.
In the case of re-securitisation positions, similar processes are conducted in respect of the underlying securitisations.
Valuation of securitisation positions
The valuation process of our investments in securitisation exposures primarily focuses on quotations from third parties, observed trade levels and calibrated valuations from market standard models. This process did not change in 2012.
Further details may be found on page 184 of the Annual Report and Accounts 2012.
We perform hedging in respect of our sponsored SICs interest rate and currency exposures. Credit risk is hedged by credit default swaps in respect of some securitisation positions.
Securitisation accounting treatment
For accounting purposes, we consolidate SPEs when the substance of the relationship indicates that we control them. In assessing control, all relevant factors are considered, including qualitative and quantitative aspects.
Full details of these assessments may be found on page 384 of the Annual Report and Accounts 2012.
We reassess the required consolidation whenever there is a change in the substance of the relationship between HSBC and an SPE, for example, when the nature of our involvement or the governing rules, contractual arrangements or capital structure of the SPE change.

H S B C H O L D I N G S P L C
Capital and Risk Management Pillar 3 Disclosures at 31 December 2012 (continued)
Page 54
The transfer of assets to an SPE may give rise to the full or partial derecognition of the financial assets concerned. Only in the event that derecognition is achieved are sales and any resultant gains on sales recognised in the financial statements. In a traditional securitisation, assets are sold to an SPE and no gain or loss on sale is recognised at inception.
Full derecognition occurs when we transfer our contractual right to receive cash flows from the financial assets, or retain the right but assume an obligation to pass on the cash flows from the assets, and transfer substantially all the risks and rewards of ownership. The risks include credit, interest rate, currency, prepayment and other price risks.
Partial derecognition occurs when we sell or otherwise transfer financial assets in such a way that some but not substantially all of the risks and rewards of ownership are transferred but control is retained. These financial assets are recognised on the balance sheet to the extent of our continuing involvement.
A small portion of financial assets that do not qualify for derecognition relate to loans, credit cards, debt securities and trade receivables that have been securitised under arrangements by which we retain a continuing involvement in such transferred assets. Continuing involvement may entail retaining the rights to future cash flows arising from the assets after investors have received their contractual terms (for example, interest rate strips); providing subordinated interest; liquidity support; continuing to service the underlying asset; or entering into derivative transactions with the securitisation
vehicles. As such, we continue to be exposed to risks associated with these transactions.
Where assets have been derecognised in whole or in part, the rights and obligations that we retain from our continuing involvement in securitisations are initially recorded as an allocation of the fair value of the financial asset between the part that is derecognised and the part that continues to be recognised on the date of transfer.
Securitisation regulatory treatment
For regulatory purposes, where significant risk in SPEs has been transferred to third parties, these SPEs are not consolidated but exposure to them, including derivatives or liquidity facilities, is risk-weighted as securitisation positions. Of the US$2.2bn (2011: US$5.1bn) of unrealised losses on available-for-sale (‘AFS’) asset-backed securities disclosed in the Annual Report and Accounts 2012, US$0.8bn (2011: US$2.7bn) relates to assets within SPEs that are not consolidated for regulatory purposes. The remainder is subject to the FSA’s prudential filter that removes unrealised gains and losses on AFS debt securities from capital and also adjusts the exposure value of the positions by the same amount before the relevant risk weighting is applied.
Analysis of securitisation exposures
Securitisation exposures analysed below are on a regulatory consolidated basis and include those deducted from capital, rather than risk-weighted.
Table 32: Securitisation exposure – by approach
31 December 2012 31 December 2011
Trading book
Non-trading book Total
Trading book
Non-trading book Total
US$bn US$bn US$bn US$bn US$bn US$bn
IRB approach ..................................... 2.7 52.5 55.2 25.9 61.1 87.0 Ratings based ..................................... 2.7 38.2 40.9 9.6 46.0 55.6Internal assessment approach ............ – 13.9 13.9 – 14.7 14.7Supervisory method ........................... – 0.4 0.4 16.3 0.4 16.7
Standardised ....................................... – 0.1 0.1 – 0.1 0.1
2.7 52.6 55.3 25.9 61.2 87.1
The movement in the year represents any purchase or sale of securitisation assets, the repayment of capital on amortising or maturing securitisation assets, the inclusion of trading book assets when their credit ratings fall below investment grade and the revaluation of these assets. Movements
in the year also reflect the re-assessment of assets no longer treated under the securitisation framework. When assets within re-securitisations are re-securitised to achieve a more granular rating, there is no change in the exposure value, and so no movement in the year is reported.
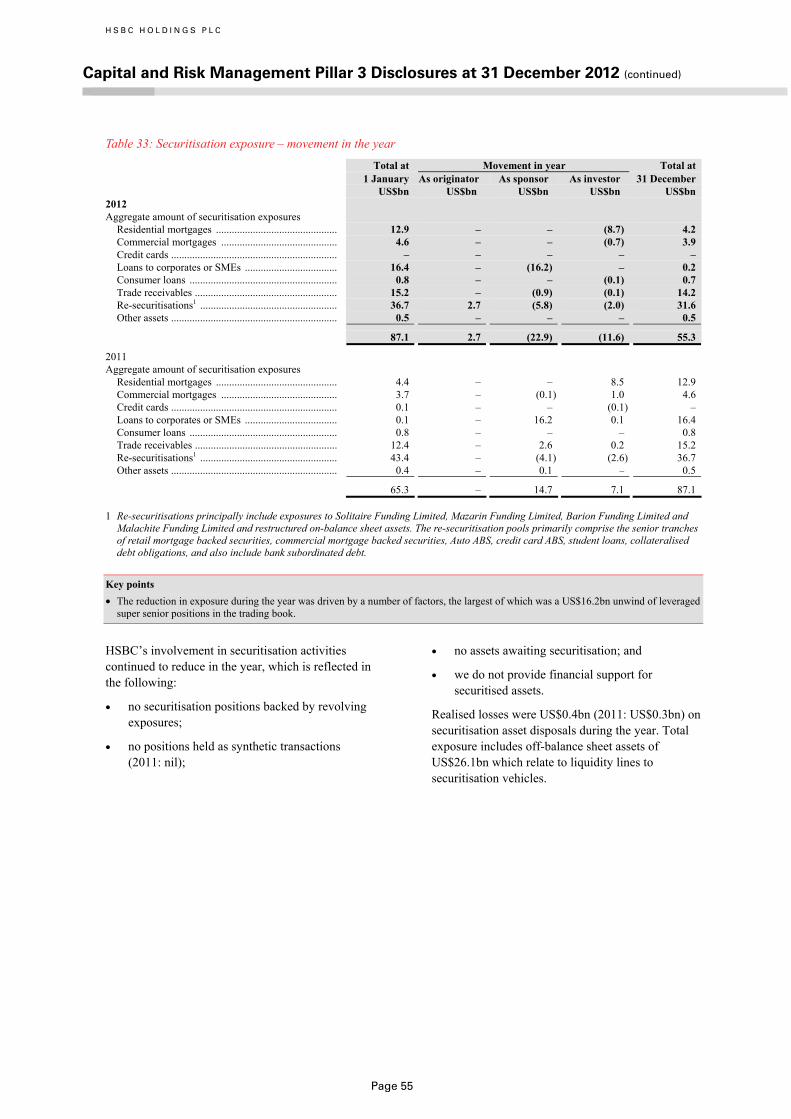
H S B C H O L D I N G S P L C
Capital and Risk Management Pillar 3 Disclosures at 31 December 2012 (continued)
Page 55
Table 33: Securitisation exposure – movement in the year
Total at Movement in year Total at 1 January As originator As sponsor As investor 31 December US$bn US$bn US$bn US$bn US$bn 2012 Aggregate amount of securitisation exposures
Residential mortgages .............................................. 12.9 – – (8.7) 4.2 Commercial mortgages ............................................ 4.6 – – (0.7) 3.9 Credit cards ............................................................... – – – – – Loans to corporates or SMEs ................................... 16.4 – (16.2) – 0.2 Consumer loans ........................................................ 0.8 – – (0.1) 0.7 Trade receivables ...................................................... 15.2 – (0.9) (0.1) 14.2 Re-securitisations1 .................................................... 36.7 2.7 (5.8) (2.0) 31.6 Other assets ............................................................... 0.5 – – – 0.5
87.1 2.7 (22.9) (11.6) 55.3
2011 Aggregate amount of securitisation exposures
Residential mortgages .............................................. 4.4 – – 8.5 12.9 Commercial mortgages ............................................ 3.7 – (0.1) 1.0 4.6 Credit cards ............................................................... 0.1 – – (0.1) – Loans to corporates or SMEs ................................... 0.1 – 16.2 0.1 16.4 Consumer loans ........................................................ 0.8 – – – 0.8 Trade receivables ...................................................... 12.4 – 2.6 0.2 15.2 Re-securitisations1 .................................................... 43.4 – (4.1) (2.6) 36.7 Other assets ............................................................... 0.4 – 0.1 – 0.5
65.3 – 14.7 7.1 87.1
1 Re-securitisations principally include exposures to Solitaire Funding Limited, Mazarin Funding Limited, Barion Funding Limited and Malachite Funding Limited and restructured on-balance sheet assets. The re-securitisation pools primarily comprise the senior tranches of retail mortgage backed securities, commercial mortgage backed securities, Auto ABS, credit card ABS, student loans, collateralised debt obligations, and also include bank subordinated debt.
Key points • The reduction in exposure during the year was driven by a number of factors, the largest of which was a US$16.2bn unwind of leveraged
super senior positions in the trading book.
HSBC’s involvement in securitisation activities continued to reduce in the year, which is reflected in the following:
• no securitisation positions backed by revolving exposures;
• no positions held as synthetic transactions (2011: nil);
• no assets awaiting securitisation; and
• we do not provide financial support for securitised assets.
Realised losses were US$0.4bn (2011: US$0.3bn) on securitisation asset disposals during the year. Total exposure includes off-balance sheet assets of US$26.1bn which relate to liquidity lines to securitisation vehicles.
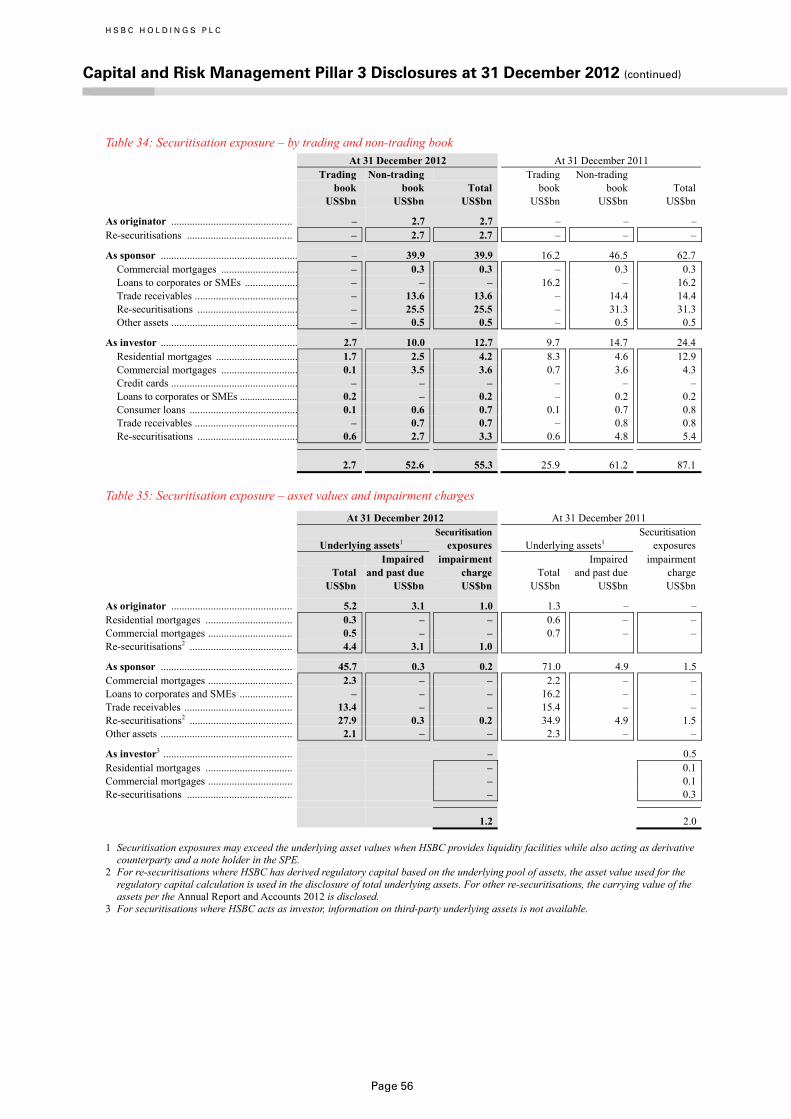
H S B C H O L D I N G S P L C
Capital and Risk Management Pillar 3 Disclosures at 31 December 2012 (continued)
Page 56
Table 34: Securitisation exposure – by trading and non-trading book At 31 December 2012 At 31 December 2011 Trading Non-trading Trading Non-trading book book Total book book Total US$bn US$bn US$bn US$bn US$bn US$bn
As originator .............................................. – 2.7 2.7 – – –Re-securitisations ........................................ – 2.7 2.7 – – –
As sponsor .................................................... – 39.9 39.9 16.2 46.5 62.7 Commercial mortgages ............................. – 0.3 0.3 – 0.3 0.3Loans to corporates or SMEs .................... – – – 16.2 – 16.2Trade receivables ....................................... – 13.6 13.6 – 14.4 14.4Re-securitisations ...................................... – 25.5 25.5 – 31.3 31.3Other assets ................................................ – 0.5 0.5 – 0.5 0.5
As investor .................................................... 2.7 10.0 12.7 9.7 14.7 24.4 Residential mortgages ............................... 1.7 2.5 4.2 8.3 4.6 12.9Commercial mortgages ............................. 0.1 3.5 3.6 0.7 3.6 4.3Credit cards ................................................ – – – – – –Loans to corporates or SMEs ....................... 0.2 – 0.2 – 0.2 0.2Consumer loans ......................................... 0.1 0.6 0.7 0.1 0.7 0.8Trade receivables ....................................... – 0.7 0.7 – 0.8 0.8Re-securitisations ...................................... 0.6 2.7 3.3 0.6 4.8 5.4
2.7 52.6 55.3 25.9 61.2 87.1 Table 35: Securitisation exposure – asset values and impairment charges
At 31 December 2012 At 31 December 2011 Securitisation Securitisation Underlying assets1 exposures Underlying assets1 exposures Impaired impairment Impaired impairment Total and past due charge Total and past due charge US$bn US$bn US$bn US$bn US$bn US$bn
As originator .............................................. 5.2 3.1 1.0 1.3 – –Residential mortgages ................................. 0.3 – – 0.6 – –Commercial mortgages ................................ 0.5 – – 0.7 – –Re-securitisations2 ....................................... 4.4 3.1 1.0
As sponsor .................................................. 45.7 0.3 0.2 71.0 4.9 1.5Commercial mortgages ................................ 2.3 – – 2.2 – –Loans to corporates and SMEs .................... – – – 16.2 – –Trade receivables ......................................... 13.4 – – 15.4 – –Re-securitisations2 ....................................... 27.9 0.3 0.2 34.9 4.9 1.5Other assets .................................................. 2.1 – – 2.3 – –
As investor3 ................................................. – 0.5Residential mortgages ................................. – 0.1Commercial mortgages ................................ – 0.1Re-securitisations ........................................ – 0.3
1.2 2.0
1 Securitisation exposures may exceed the underlying asset values when HSBC provides liquidity facilities while also acting as derivative counterparty and a note holder in the SPE.
2 For re-securitisations where HSBC has derived regulatory capital based on the underlying pool of assets, the asset value used for the regulatory capital calculation is used in the disclosure of total underlying assets. For other re-securitisations, the carrying value of the assets per the Annual Report and Accounts 2012 is disclosed.
3 For securitisations where HSBC acts as investor, information on third-party underlying assets is not available.

H S B C H O L D I N G S P L C
Capital and Risk Management Pillar 3 Disclosures at 31 December 2012 (continued)
Page 57
Table 36: Securitisation exposure – by risk weighting
Exposure value1 Capital required Trading book Non-trading book2 Trading book3 Non-trading book S4 R5 S4 R5 S4 R5 S4 R5
US$bn US$bn US$bn US$bn US$bn US$bn US$bn US$bn 2012 Long-term category – risk weights – less than or equal to 10% .............................. 0.9 – 19.1 – – – 0.1 – – > 10% and ≤ 20% ......................................... 0.2 – 3.7 1.4 – – 0.1 – – > 20% and ≤ 50% ......................................... 0.8 0.4 1.0 17.6 – – – 0.6 – > 50% and ≤ 100% ....................................... – – 1.8 0.8 – – 0.1 0.1 – > 100% and ≤ 650% ..................................... 0.1 0.2 0.7 2.9 – 0.1 0.3 0.8 – > 650% and < 1,250% .................................. – – – 0.1 – – – 0.1 Deductions from capital .................................. 0.1 – 2.0 1.5 0.1 – 2.0 1.5
2.1 0.6 28.3 24.3 0.1 0.1 2.6 3.1
2011 Long-term category – risk weights – less than or equal to 10% .............................. 8.3 – 21.8 – 0.1 – 0.1 0.0 – > 10% and ≤ 20% ......................................... – – 5.0 2.0 – – 0.1 0.0 – > 20% and ≤ 50% ......................................... 16.4 0.4 1.3 21.2 0.3 – – 0.7 – > 50% and ≤ 100% ....................................... – – 2.5 0.4 – – 0.1 0.0 – > 100% and ≤ 650% ..................................... 0.6 0.2 1.2 3.3 0.1 – 0.4 0.9 – > 650% and < 1,250% .................................. – – – 0.1 – – – 0.0 Deductions from capital .................................. – – 1.3 1.1 – – 1.3 1.1
25.3 0.6 33.1 28.1 0.5 – 2.0 2.7
1 There are no short-term category exposures at 31 December 2012 (2011: nil). 2 Non-trading book figures for 31 December 2011 and 2012 include US$0.1bn exposures treated under the Standardised approach. 3 Trading book securitisation capital requirements included under the market risk disclosures were US$0.1bn (2011: US$0.5bn). 4 Securitisation. 5 Re-securitisation. The total exposure value for re-securitisations differs from that in tables 33 and 34 reflecting the look through
treatment used for deriving RWAs on Solitaire’s liquidity facility. Key points • The downward migration in the ratings on third party securitisation investments occurred mostly in respect of Student Loan ABS
positions in 2012.

H S B C H O L D I N G S P L C
Capital and Risk Management Pillar 3 Disclosures at 31 December 2012 (continued)
Page 58
Market risk
Overview and objectives
We separate exposures to market risk into trading and non-trading portfolios. Trading portfolios include positions arising from market-making, from position-taking and others designated as marked-to-market. Non-trading portfolios include positions that primarily arise from the interest rate management of our retail and CMB assets and liabilities, financial investments designated as available for sale and those held to maturity.
Where appropriate, we apply similar risk management policies and measurement techniques to both trading and non-trading portfolios. Our objective is to manage and control market risk exposures in order to optimise return on risk while maintaining a market profile consistent with our status as one of the world’s largest banking and financial services organisations.
Organisation and responsibilities
The management of market risk is undertaken mainly in Global Markets using risk limits approved
by the GMB. Limits are set for portfolios, products and risk types. Market liquidity is an important factor taken into account when setting limits.
Global Risk is responsible for our market risk management policies and measurement techniques. Each major operating entity has an independent market risk management and control function which is responsible for measuring market risk exposures in accordance with the policies defined by Global Risk, and for monitoring and reporting exposures against the prescribed limits on a daily basis.
Each operating entity is required to assess the market risks arising on each product in its business and it is responsible for ensuring that market risk exposures remain within the limits specified for that entity. The nature of the hedging and risk mitigation strategies performed across the Group corresponds to the market risk management instruments available within each operating jurisdiction. These strategies range from the use of traditional market instruments, such as interest rate swaps, to more sophisticated hedging strategies to address a combination of risk factors arising at portfolio level.
Table 37: Market risk At 31 December 2012 At 31 December 2011
Capitalrequired RWAs
Capital required
RWAs
US$bn US$bn US$bn US$bn At 31 December 2012 Internal model based .............................................................................. 3.6 44.5 4.4 54.7
VAR ...................................................................................................... 0.6 7.6 0.9 11.3Stressed VAR ....................................................................................... 0.9 11.0 1.6 19.2Incremental risk charge ........................................................................ 0.9 11.1 0.4 5.2Comprehensive risk measure ............................................................... 0.3 3.4 0.5 6.0Other VAR and stressed VAR 1 ............................................................................................. 0.9 11.4 1.0 13.0
FSA standard rules ................................................................................. 0.8 10.4 1.5 18.5 Interest rate position risk....................................................................... 0.6 7.0 0.8 8.3Foreign exchange position risk ............................................................ 0.1 1.4 0.1 1.7Equity position risk .............................................................................. – 0.1 0.1 1.7Commodity position risk ...................................................................... – 0.1 – 0.3Collective investment undertaking ....................................................... – – – 0.4Securitisations ...................................................................................... 0.1 1.8 0.5 6.1
4.4 54.9 5.9 73.2
1 These are results from countries which cannot be included in the consolidated results because regulatory permission to do so has not been received, and which must therefore be aggregated rather than consolidated.
Key points • Market risk RWAs have decreased US$18bn during the period, particularly VAR and Stressed VAR, mainly due to reduced risk levels
as a result of a reduction in exposure and improvement in market conditions. • The reduction has been partly offset by an increase in IRC, of which US$4bn is the result of recalibrations to the sovereign correlation
matrix. • The reduction in the standard rules securitisation RWAs was largely the result of the unwinding of legacy positions.

H S B C H O L D I N G S P L C
Capital and Risk Management Pillar 3 Disclosures at 31 December 2012 (continued)
Page 59
Measurement and monitoring
Market Risk across the portfolio is measured, monitored and limited using a range of techniques including sensitivity analysis, VAR, stressed VAR, ICR, CRM and stress testing.
The remainder of this section primarily addresses market risks in the trading book, except that foreign exchange position risk and commodity position risk relate to both trading and non-trading books. Other non-trading book market risks are covered under ‘Other risks’ on page 63.
Further information on Market Risk may be found on page 218 of the Annual Report and Accounts 2012.
Sensitivity analysis
We use sensitivity measures to monitor the market risk positions within each risk type; for interest rate risk, for example, the present value of a basis point movement in interest rates. Sensitivity limits are set for portfolios, products and risk types, with the depth of the market being one of the principal factors in determining the level of limits set.
VAR and stressed VAR
VAR is a technique that estimates the potential losses on risk positions in the trading portfolio as a result of movements in market rates and prices over a specified time horizon and to a given level of confidence.
Both the VAR and stressed VAR models we use are based predominantly on historical simulation. These models derive realistic future scenarios from past series of recorded market rates and prices, taking into account inter-relationships between different markets and factors such as interest and foreign exchange rates. The models also incorporate the effect of option features embedded in the underlying exposures.
The historical simulation models used incorporate the following features:
• historical market rates and prices are calculated with reference to foreign exchange and interest rates, commodity prices, equity prices and the associated volatilities;
• potential market movements are calculated with reference to data from the past two years, whereas stressed VAR is based on a continuous one-year period of stress for the trading portfolio; and
• VAR measures are calculated to a 99% confidence level and use a one-day holding period scaled to 10 days, whereas stressed VAR uses a 10-day holding period.
The nature of the VAR models means that an increase in observed market volatility will lead to an increase in VAR even without any changes in the underlying positions. Our VAR models also capture significant basis risk, for example CDS versus bond basis risk.
Results are calculated on a consolidated basis for most regions, producing diversification benefits across risk types for general and specific risks. However, the results of certain countries are aggregated rather than consolidated because regulatory approval has not yet been granted for them to be included in the consolidated results.
We routinely validate the accuracy of our VAR models by backtesting the actual daily profit and loss results, adjusted to remove non-modelled items such as fees and commissions, against the corresponding VAR numbers.
Backtesting is an important measure of the effectiveness of our VAR models. It may reveal potential miscalibration in the VAR model, for example where P&L movements had frequently exceeded the value predicted by the model.
We expect on average to see losses in excess of VAR for 1% of the time over a one-year period. Comparing this to the actual number of excesses over this period can therefore be used to gauge how well the models are performing. A high level of exceptions may lead to a recalibration of the VAR model. In 2012, there were no exceptions at the Group level.
Although a valuable guide to risk, VAR should always be viewed in the context of its limitations, for example:
• the use of historical data as a proxy for estimating future events may not encompass all potential events, particularly those which are extreme in nature;
• the use of a holding period assumes that all positions can be liquidated or the risks offset during that period. This may not fully reflect the market risk arising at times of severe illiquidity, when the holding period may be insufficient to liquidate or hedge all positions fully;
• the use of a 99% confidence level by definition does not take into account losses that might occur beyond this level of confidence;
• VAR is calculated on the basis of exposures outstanding at close of business and therefore does not necessarily reflect intra-day exposures; and
• VAR is unlikely to reflect loss potential on exposures that only arise under conditions of significant market movement.

H S B C H O L D I N G S P L C
Capital and Risk Management Pillar 3 Disclosures at 31 December 2012 (continued)
Page 60
From a capital perspective, these limitations are somewhat mitigated by the addition of stressed VAR, which by definition incorporates 10-day scenarios on a period of stress. Furthermore, a Risk-Not-In-VAR framework is used to identify and quantify risks not readily captured in VAR, such as a lack of market liquidity and basis risk.
Basel 2.5 introduced, via the IRC and Comprehensive Risk Measure detailed below, longer capital and liquidity horizons. Capital add-ons also exist to capture event risk including foreign exchange risk on pegged currencies and concentration risk associated with large equity holdings.
Incremental Risk Charge
The IRC measures the default and migration risk of issuers of traded instruments. It is computed using Monte-Carlo simulation and employing a multi-factor Gaussian Copula model.
The IRC model is calibrated to the 99.9th percentile loss over a one-year capital horizon. Risk factors covered by it include credit migration, default, product basis, concentration, hedge mismatch, recovery rate and liquidity.
Liquidity horizons are assessed based on a combination of factors including issuer type, currency and size of exposure, and are floored to three months.
The IRC is a standalone charge generating no diversification benefit with other charges.
Comprehensive Risk Measure
The CRM is used to measure all price risks emanating from the correlation trading portfolio within the bank. This model is calibrated to the same soundness standard as the IRC above, and the risk factors covered include credit migration, default, credit spread, correlation, recovery rate and basis risks.
It also reflects the impact of liquidity, concentration and hedging. In accordance with Basel 2.5, this measure is subject to a minimum capital requirement of 8% of RWA calculated under the standard rules for the portfolio.
The CRM is a standalone charge generating no diversification benefit with other charges.
Stress testing
The risk management framework is augmented with stress testing to evaluate the potential impact on portfolio values of more extreme (but nonetheless
realistic) events or movements in a set of financial variables. In such abnormal scenarios, losses can be much greater than those predicted by VAR modelling. A set of broad stress scenarios is used, as well as scenarios tailored to specific businesses and geographic areas.
The scenarios applied at portfolio and consolidated levels are as follows:
• single risk factor stress scenarios consider the impact of any single risk factor or set of factors that are unlikely to be captured within the VAR models, such as the break of a currency peg;
• technical scenarios, which consider the largest movement in each risk factor without considering any underlying market correlation;
• hypothetical scenarios, which consider potential macroeconomic events, for example a mainland China slowdown or the effects of a sovereign debt default, including wider contagion effects;
• historical scenarios, which incorporate historical observations of market movements during previous periods of stress, which would not be captured within VAR, for example, Black Monday 1987 for equities, the 1997 Asian crisis and the 2007 global financial crisis; and
• reverse stress test scenarios, which identify scenarios which are beyond normal business conditions and could result in significant losses due to contagion and systemic implications.
Stress testing is also used as a tool for managing basis risk.
Managed risk positions
Interest rate position risk
Interest rate position risk arises within the trading portfolios principally from mismatches, as a result of interest rate changes, between the future yield on assets and their funding cost.
• This is measured, where practical, on a daily basis. We use a range of tools to monitor and limit interest rate risk exposures. These include the present value of a basis point movement in interest rates, VAR, stress testing and sensitivity analysis.
• Through our management of market risk in non-trading portfolios, we mitigate the effect of prospective interest rate movements which could reduce future net interest income, while balancing the cost of such hedging activities on the current net revenue stream. Further
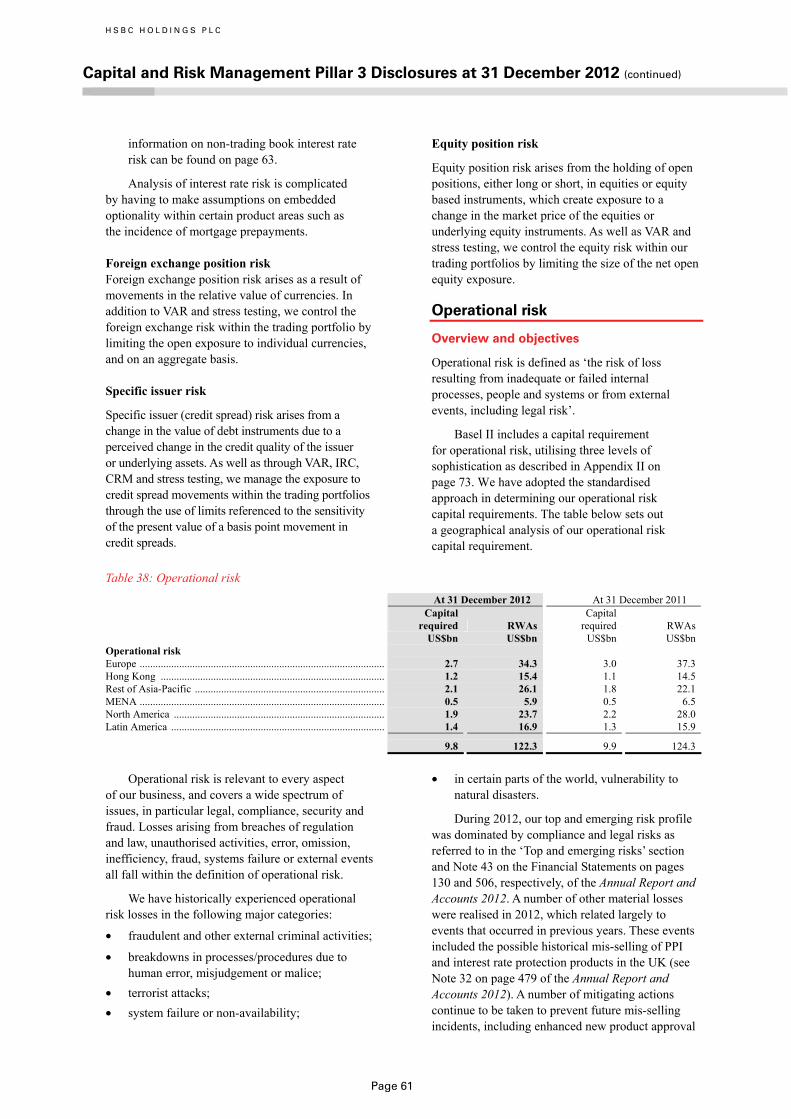
H S B C H O L D I N G S P L C
Capital and Risk Management Pillar 3 Disclosures at 31 December 2012 (continued)
Page 61
information on non-trading book interest rate risk can be found on page 63.
Analysis of interest rate risk is complicated by having to make assumptions on embedded optionality within certain product areas such as the incidence of mortgage prepayments.
Foreign exchange position risk Foreign exchange position risk arises as a result of movements in the relative value of currencies. In addition to VAR and stress testing, we control the foreign exchange risk within the trading portfolio by limiting the open exposure to individual currencies, and on an aggregate basis.
Specific issuer risk
Specific issuer (credit spread) risk arises from a change in the value of debt instruments due to a perceived change in the credit quality of the issuer or underlying assets. As well as through VAR, IRC, CRM and stress testing, we manage the exposure to credit spread movements within the trading portfolios through the use of limits referenced to the sensitivity of the present value of a basis point movement in credit spreads.
Equity position risk
Equity position risk arises from the holding of open positions, either long or short, in equities or equity based instruments, which create exposure to a change in the market price of the equities or underlying equity instruments. As well as VAR and stress testing, we control the equity risk within our trading portfolios by limiting the size of the net open equity exposure.
Operational risk
Overview and objectives
Operational risk is defined as ‘the risk of loss resulting from inadequate or failed internal processes, people and systems or from external events, including legal risk’.
Basel II includes a capital requirement for operational risk, utilising three levels of sophistication as described in Appendix II on page 73. We have adopted the standardised approach in determining our operational risk capital requirements. The table below sets out a geographical analysis of our operational risk capital requirement.
Table 38: Operational risk
At 31 December 2012 At 31 December 2011
Capital
required RWAs Capital
required
RWAs US$bn US$bn US$bn US$bn Operational risk Europe ............................................................................................. 2.7 34.3 3.0 37.3 Hong Kong ..................................................................................... 1.2 15.4 1.1 14.5 Rest of Asia-Pacific ........................................................................ 2.1 26.1 1.8 22.1 MENA ............................................................................................. 0.5 5.9 0.5 6.5 North America ................................................................................ 1.9 23.7 2.2 28.0 Latin America ................................................................................. 1.4 16.9 1.3 15.9
9.8 122.3 9.9 124.3
Operational risk is relevant to every aspect of our business, and covers a wide spectrum of issues, in particular legal, compliance, security and fraud. Losses arising from breaches of regulation and law, unauthorised activities, error, omission, inefficiency, fraud, systems failure or external events all fall within the definition of operational risk.
We have historically experienced operational risk losses in the following major categories:
• fraudulent and other external criminal activities;
• breakdowns in processes/procedures due to human error, misjudgement or malice;
• terrorist attacks; • system failure or non-availability;
• in certain parts of the world, vulnerability to natural disasters.
During 2012, our top and emerging risk profile was dominated by compliance and legal risks as referred to in the ‘Top and emerging risks’ section and Note 43 on the Financial Statements on pages 130 and 506, respectively, of the Annual Report and Accounts 2012. A number of other material losses were realised in 2012, which related largely to events that occurred in previous years. These events included the possible historical mis-selling of PPI and interest rate protection products in the UK (see Note 32 on page 479 of the Annual Report and Accounts 2012). A number of mitigating actions continue to be taken to prevent future mis-selling incidents, including enhanced new product approval

H S B C H O L D I N G S P L C
Capital and Risk Management Pillar 3 Disclosures at 31 December 2012 (continued)
Page 62
processes. Furthermore, it is our medium-term aim to move to the advanced measurement approach for our operational risk capital requirement calculation.
We recognise that operational risk losses can be incurred for a wide variety of reasons, including rare but extreme events.
The objective of our operational risk management is to manage and control operational risk in a cost-effective manner within targeted levels of operational risk consistent with our risk appetite, as defined by GMB.
Organisation and responsibilities
Responsibility for minimising operational risk management lies primarily with HSBC’s management and staff. Each regional, global business, country, business unit and functional head is required to maintain oversight over operational risk and internal control, covering all businesses and operational activities for which they are responsible.
The Group Operational Risk function and the Operational Risk Management Framework (‘ORMF’) assist business management in discharging their responsibilities.
The ORMF defines minimum standards and processes, and the governance structure for operational risk and internal control across the Group. Inherent to the ORMF is a ‘Three lines of defence’ model to the management of risk. The first line of defence is every employee at HSBC, the second consists of the Global Functions and the third is Internal Audit.
More details on the ‘Three lines of defence’ model and our ORMF may be found on page 227 of the Annual Report and Accounts 2012.
The Global Operational Risk and Control
Committee, which reports to RMM, meets at least quarterly to discuss key risk issues and review the effective implementation of the ORMF.
Operational risk is organised as a specific risk discipline within Global Risk. The Group Operational Risk function reports to the GCRO and supports the Global Operational Risk and Control Committee. It is responsible for establishing and maintaining the ORMF, monitoring the level of operational losses and the effectiveness of the control environment. It is also responsible for operational risk reporting at Group level, including preparation of reports for consideration by RMM and GRC.
Measurement and monitoring
We have codified our ORMF in a high level standard, supplemented by detailed policies. These policies explain our approach to identifying, assessing, monitoring and controlling operational risk and give guidance on mitigating action to be taken when weaknesses are identified. In 2012, we continued to enhance our ORMF policies and procedures, including the implementation of a Top Risk analysis process to improve the quantification and management of material risks through scenario analysis. This provides a top down, forward-looking view of risks to help determine whether they are being effectively managed within our risk appetite or whether further management action is required.
In each of our subsidiaries, business managers are responsible for maintaining an acceptable level of internal control, commensurate with the scale and nature of operations. They are responsible for identifying and assessing risks, designing controls and monitoring the effectiveness of these controls. The ORMF helps managers to fulfil these responsibilities by defining a standard risk assessment methodology and providing a tool for the systematic reporting of operational loss data.
Operational risk and control assessment approach
Operational risk and control assessments are performed by individual business units and functions. The risk and control assessment process is designed to provide business areas and functions with a forward looking view of operational risks and an assessment of the effectiveness of controls, and a tracking mechanism for action plans so that they can proactively manage operational risks within acceptable levels. Risk and control assessments are reviewed and updated at least annually.
Appropriate means of mitigation and controls are considered. These include:
• making specific changes to strengthen the internal control environment;
• investigating whether cost-effective insurance cover is available to mitigate the risk; and
• other means of protecting us from loss.
Recording
We use a centralised database to record the results of our operational risk management process. Operational risk and control assessments, as described above, are input and maintained by business units. Business management and Business

H S B C H O L D I N G S P L C
Capital and Risk Management Pillar 3 Disclosures at 31 December 2012 (continued)
Page 63
Risk and Control Managers monitor and follow up the progress of documented action plans.
Operational risk loss reporting
To ensure that operational risk losses are consistently reported and monitored at Group level, all Group companies are required to report individual losses when the net loss is expected to exceed US$10,000 and to aggregate all other operational risk losses under US$10,000. Losses are entered into the Operational Risk IT system and are reported to the Group Operational Risk function on a quarterly basis.
Other risks
Pension risk
Pension risk arises from the potential for a deficit in a defined benefit plan to arise from a number of factors, including:
• investments delivering a return below that required to provide the projected plan benefits. This could arise, for example, when there is a fall in the market value of equities, or when increases in long-term interest rates cause a fall in the value of fixed income securities held;
• the prevailing economic environment leading to corporate failures, thus triggering write-downs in asset values (both equity and debt);
• a change in either interest rates or inflation which causes an increase in the value of the scheme liabilities; and
• scheme members living longer than expected (known as longevity risk).
Pension risk is assessed by way of an economic capital model that takes into account potential variations in these factors, using VAR methodology.
We operate a number of pension plans throughout the world. Some of them are defined benefit plans, of which the largest is the HSBC Bank (UK) Pension Scheme. In order to fund the benefits associated with these plans, sponsoring Group companies (and in some instances, employees) make regular contributions in accordance with advice from actuaries and in consultation with the scheme’s trustees (where relevant). In situations where a funding deficit emerges, sponsoring Group companies agree to make additional contributions to the plans, to address the deficit over an appropriate repayment period.
Further details of such payments may be found in Note 7 on page 415 of the Annual Report and Accounts 2012.
The defined benefit plans invest these contributions in a range of investments designed to meet their long-term liabilities.
Non-trading book interest rate risk
Non-trading book interest rate risk, as defined on page 74, arises principally from mismatches between the future yield on assets and their funding cost, as a result of interest rate changes.
Asset, Liability & Capital Management (‘ALCM’) is responsible for measuring and controlling non-trading interest rate risk under the supervision of the RMM. Its primary responsibilities are:
• to define the rules governing the transfer of interest rate risk from the commercial bank to Balance Sheet Management (‘BSM’);
• to ensure that all market interest rate risk that can be hedged is effectively transferred from the global businesses to BSM; and
• to define the rules and metrics for monitoring the residual interest rate risk in the global businesses.
The different types of non-trading interest rate risk and the controls which the Group uses to quantify and limit its exposure to these risks can be categorised as follows:
• risk which is transferred to BSM and managed by BSM within a defined risk mandate;
• risk which remains outside BSM because it cannot be hedged or which arises due to our behaviouralised transfer pricing assumptions. This risk will be captured by our net interest income or Economic Value of Equity (‘EVE’) sensitivity and corresponding limits are part of our global and regional risk appetite statements for non-trading interest rate risk. A typical example would be margin compression created by unusually low rates in key currencies;
• basis risk which is transferred to BSM when it can be hedged. Any residual basis risk remaining in the global businesses is reported to ALCO. A typical example would be a managed rate savings product transfer-priced using a Libor-based interest rate curve; and
• model risks which cannot be captured by net interest income or EVE sensitivity, but are controlled by our stress testing framework. A

H S B C H O L D I N G S P L C
Capital and Risk Management Pillar 3 Disclosures at 31 December 2012 (continued)
Page 64
typical example would be prepayment risk on residential mortgages or pipeline risk.
Details of the Group’s monitoring of the sensitivity of projected net interest income under varying interest rate scenarios may be found on page 223 of the Annual Report and Accounts 2012.
Non-trading book exposures in equities
Our non-trading equities exposures are reviewed by RMM at least annually. At 31 December 2012, on a regulatory consolidation basis, we had equity investments in the non-trading book of US$14.0bn (2011: US$7.7bn). These consist of investments held for the following purposes:
Table 39: Non-trading book equity investments
At 31 December 2012 At 31 December 2011 Available Designated Available Designated for sale1 at fair value Total for sale at fair value Total US$bn US$bn US$bn US$bn US$bn US$bn
Strategic investments ................... 10.0 0.1 10.1 3.3 0.2 3.5 Private equity investments ........... 2.9 0.1 3.0 3.0 0.1 3.1 Business facilitation2 ................... 1.1 – 1.1 1.1 – 1.1
14.0 0.2 14.2 7.4 0.3 7.7
1 This includes the investment in Ping An of US$8.2bn. This was classified as ‘held for sale’ and measured at fair value in accordance with the measurement rules for AFS securities for accounting purposes.
2 Includes holdings in government-sponsored enterprises and local stock exchanges.
We make investments in private equity primarily through managed funds that are subject to limits on the amount of investment. We risk assess potential new commitments to ensure that industry and geographical concentrations remain within acceptable levels for the portfolio as a whole, and perform regular reviews to substantiate the valuation of the investments within the portfolio.
Exchange traded investments amounted to US$0.5bn (2011: US$0.5bn), with the remainder being unlisted. These investments are held at fair value in line with market prices.
On a regulatory consolidation basis, the net gain from disposal of equity securities amounted to US$0.8bn (2011: US$0.4bn), while impairment of AFS equities amounted to US$0.4bn (2011: US$0.2bn). Unrealised gains on AFS equities included in tier 2 capital equated to US$2.1bn (2011: US$1.5bn).
Details of our accounting policy for AFS equity investments and the valuation of financial instruments may be found on pages 395 and 388, respectively, of the Annual Report and Accounts 2012. A detailed description of the valuation techniques applied to private equity may be found on page 442 of the Annual Report and Accounts 2012.
Remuneration
The following tables show the remuneration awards made by HSBC in respect of 2012 and subsequent paragraphs provide information on decision-making policies for remuneration and links between pay and performance. These disclosures reflect the requirements of the FSA’s Policy Statement PS10/21 ‘Implementing CRD III requirements on the disclosure of remuneration’ issued in December 2010.
Table 40: Aggregate remuneration expenditure
Global business aligned Retail
Bankingand Wealth
Management Commercial
Banking,3
GlobalBanking and
Markets
GlobalPrivate
Banking
Non-global business
aligned Total US$m US$m US$m US$m US$m US$m Aggregate remuneration expenditure
(Code Staff)1,2 2012 ...................................................... 41.8 21.0 293.1 32.2 141.0 529.1 2011 ...................................................... 46.4 6.7 248.1 32.1 175.0 508.3
1 Code Staff is defined in the Glossary. 2 Includes salary and incentives awarded in respect of performance year 2012 and 2011 (including deferred component) and any pension
or benefits outside of policy. 3 Commerical Banking aggregate remuneration spend has increased significantly in 2012 as a result of additional employees being
identified as Code Staff in CMB for 2012.

H S B C H O L D I N G S P L C
Capital and Risk Management Pillar 3 Disclosures at 31 December 2012 (continued)
Page 65
Table 41: Remuneration – fixed and variable amounts – Groupwide 2012 2011
Seniormanage-
ment
Code Staff(non-senior
manage-ment) Total
Senior manage-
ment
Code Staff (non-senior
manage- ment) Total
Number of Code Staff ........................................... 50 264 314 59 261 320
US$m US$m US$m US$m US$m US$m Fixed Cash based ............................................................. 43.5 101.2 144.7 49.6 99.3 148.9
Total fixed .............................................................. 43.5 101.2 144.7 49.6 99.3 148.9
Variable1 Cash ....................................................................... 15.1 60.2 75.3 11.8 29.8 41.6 Non-deferred shares2 ............................................. 14.6 57.0 71.6 25.8 73.3 99.1 Deferred cash ......................................................... 20.9 80.4 101.3 16.3 40.3 56.6 Deferred shares ...................................................... 53.7 82.4 136.1 67.5 94.6 162.1
Total variable pay .................................................. 104.3 280.0 384.3 121.4 238.0 359.4
1 Variable pay in respect of performance year 2012 and 2011. 2 Vested shares, subject to a 6-month retention period. For UK based employees in 2011. 50% of the vested shares awarded are subject to
a 6-month retention period. For 2012, 100% will be subject to a 6-month retention period. Table 42: Remuneration – fixed and variable amounts – UK based 2012 2011
Seniormanage-
ment
Code Staff(non-senior
manage-ment) Total
Senior manage-
ment
Code Staff (non-senior
manage- ment) Total
Number of Code Staff ........................................... 23 168 191 23 182 205
US$m US$m US$m US$m US$m US$m Total Fixed ............................................................. 23.5 57.2 80.7 23.0 61.2 84.2
Total Variable Pay1 ................................................ 58.7 123.9 182.6 56.1 105.0 161.1
1 Variable pay in respect of performance year 2012 and 2011.
Table 43: Deferred remuneration
The table is based on activities during the calendar year and not the performance year as disclosed in Tables 41 and 42. 2012 2011
Seniormanage-
ment
Code Staff(non-senior
manage-ment) Total
Senior manage-
ment
Code Staff (non-senior
manage- ment) Total
US$m US$m US$m US$m US$m US$m Deferred remuneration at 31 December Outstanding, unvested1 .......................................... 199.8 402.0 601.8 199.5 434.6 634.1
Awarded during financial year2 ............................. 98.0 173.4 271.4 70.2 131.1 201.3 Paid out3 ................................................................. 155.2 393.6 548.8 85.0 109.6 194.6 Reduced through clawback ................................... 0.7 – 0.7 0.8 – 0.8
1 Value of deferred cash and shares unvested at 31 December 2012 and 31 December 2011. 2 Value of deferred cash and shares awarded during 2011 and 2012 with share price taken at 31 December of respective year. 3 Value of vested shares and cash during 2012 and 2011. Share price taken at day of vesting.

H S B C H O L D I N G S P L C
Capital and Risk Management Pillar 3 Disclosures at 31 December 2012 (continued)
Page 66
Table 44: Sign-on and severance payments
2012 2011
Seniormanage-
ment
Code Staff(non-senior
manage-ment) Total
Senior manage-
ment
Code Staff (non-senior
manage- ment) Total
Sign-on payments Made during year (US$m) .................................... 3.0 – 3.0 – 3.5 3.5 Number of beneficiaries ....................................... 1 – 1 – 1 1
Severance payments Made during year (US$m) .................................... – 2.1 2.1 0.4 1.3 1.7 Number of beneficiaries ....................................... – 2 2 1 1 2 Highest such award to single person (US$m) ...... – 2.0 2.0 0.4 1.3 1.7 Table 45: Code staff remuneration by band
Number of Code Staff 2012 Number of Code Staff 2011
Seniormanage-
ment
Code Staff(non-senior
manage-ment) Total
Senior manage-
ment
Code Staff (non-senior
manage- ment) Total
US$0 – US$1,000,000 .......................................... 5 129 134 5 145 150 US$1,000,001 – US$2,000,000 ............................ 17 60 77 20 54 74 US$2,000,001 – US$3,000,000 ............................ 8 38 46 12 33 45 US$3,000,001 – US$4,000,000 ............................ 10 23 33 8 14 22 US$4,000,001 – US$5,000,000 ............................ 4 11 15 8 11 19 US$5,000,001 – US$6,000,000 ............................ 3 2 5 3 4 7 US$6,000,001 – US$7,000,000 ............................ 1 – 1 1 – 1 US$7,000,001 – US$8,000,000 ............................ – 1 1 – – – US$9,000,001 – US$10,000,000 .......................... 1 – 1 – – – US$11,000,001 – US$12,000,000 ........................ 1 – 1 2 – 2 HSBC Group Remuneration Committee
Within the authority delegated by the Board, the Group Remuneration Committee (the ‘Committee’) is responsible for approving the Group’s remuneration policy. The Committee also determines the remuneration of Directors, senior employees, employees in positions of significant influence and employees whose activities have or could have an impact on our risk profile and in doing so takes into account the pay and conditions across our Group. No Directors are involved in deciding their own remuneration.
The members of the Committee during 2012 were J L Thornton (Chairman), J D Coombe, W S H Laidlaw and G Morgan (retired as a Director on 25 May 2012). R Fassbind was appointed a member of the Committee on 1 March 2013.
There were eight meetings of the Committee during 2012. Following each meeting, the Committee reports to the Board on its activities. The Committee has decided not to use advisers except in exceptional circumstances. During 2012 Freshfields Brukhaus Deringer were engaged to provide legal advice in connection with the clawback process.
During the year, the Group Chief Executive provided regular briefings to the Committee and
the Committee received advice from the Group Managing Director, Group Head of Human Resources and Corporate Sustainability, A Almeida, the Group Head of Performance and Reward, T Roberts and the Group Chief Risk Officer, M M Moses, all of whom provided advice as part of their executive role as employees of HSBC. The Committee also received advice and feedback from the GRC on risk-related matters relevant to remuneration and the alignment of remuneration with risk appetite.
HSBC reward strategy
The quality and commitment of our human capital is fundamental to our success and accordingly the Board aims to attract, retain and motivate the very best people. As trust and relationships are vital in our business, our goal is to recruit those who are committed to maintaining a long-term career with the organisation.
HSBC’s reward strategy supports this objective through balancing of both short-term and sustainable performance. Our reward strategy aims to reward success, not failure, and be properly aligned with our risk framework and risk outcomes. Further, a portion of variable pay for all Code Staff and other senior contributors is deferred which enables us to confirm
H S B C H O L D I N G S P L C
Capital and Risk Management Pillar 3 Disclosures at 31 December 2012 (continued)
Page 67
that our pay decisions were made on the basis of accurate performance and risk data. To the extent that the bank discovers any issues with either an individual’s compliance with our policies and risk profile or any material issues with overall results (such as restatement), our clawback policy enables the bank to recover all or a portion of deferred pay during the subsequent years. The strategy is applicable to all HSBC UK, foreign subsidiaries and branches.
In order to ensure alignment between remuneration and our business strategy, individual remuneration is determined through assessment of performance delivered against both annual and long-term objectives summarised in performance scorecards as well as adherence to the HSBC Values of being ‘open, connected and dependable’ and acting with ‘courageous integrity’. Altogether, performance is judged, not only on what is achieved over the short and long-term, but also on how it is achieved, as the latter contributes to the sustainability of the organisation.
The financial and non-financial measures incorporated in the annual and long-term scorecards are carefully considered to ensure alignment with the long-term strategy of the Group.
Overview of remuneration
In order to simplify remuneration, elements are limited to the following:
• Fixed pay; • Benefits; • Annual incentive; and • The Group Performance Share Plan (‘GPSP’).
The GPSP was developed to incentivise senior executives to deliver sustainable long-term business performance. A key feature of the GPSP is that participants are required to hold the awards, once they have vested, until retirement, thereby enhancing the alignment of interest between the senior executives of the Group and shareholders. Further information may be found on page 351 of the Annual Report and Accounts 2012.
Executive Directors, Group Managing Directors and Group General Managers participate in both performance-related plans, namely the annual incentive and the GPSP. Other employees across the Group are only eligible to participate in annual incentive arrangements. Both the annual incentive and long-term incentive awards are funded from a single annual variable pay pool from which individual awards are considered. Funding of the Group’s annual variable pay pool is determined in
the context of Group profitability, capital strength and shareholder returns. This approach ensures that performance-related awards for any Global Business, Global Function, geography, or level of staff are considered in a holistic fashion.
Group variable pay pool determination
The Committee considers many factors in determining the Group’s variable pay pool funding.
The variable pay pool takes into account the performance of the Group which is considered within the context of our risk appetite statement. This helps to ensure that the variable pay pool is shaped by risk considerations. The risk appetite statement describes and measures the amount and types of risk that HSBC is prepared to take in executing its strategy. It shapes the integrated approach to business, risk and capital management and supports achievement of the Group’s objectives. The GCRO regularly updates the Committee on the Group’s performance against the Risk Appetite Statement.
The Committee uses these updates when considering remuneration to ensure that return, risk and remuneration are aligned. The risk appetite statement for 2012 was approved by the Board and was cascaded across global businesses and regions.
We use a counter cyclical funding methodology which is categorised by both a floor and a ceiling and the payout ratio reduces as performance increases to avoid pro-cyclicality risk. The floor recognises that franchise protection is typically required irrespective of performance levels. The ceiling recognises that at higher levels of performance it is possible to limit reward as it is not necessary to continue to increase the variable pay pool and thereby limiting the risk of inappropriate behaviour to drive financial performance.
In addition, our funding methodology considers the relationship between capital, dividends and variable pay to ensure that the distribution of post-tax profits between these three elements is considered appropriate. It is deemed fundamental to the Group that a majority of post-tax profit should be allocated to capital and shareholders, particularly when a strong performance is delivered.
On a pro forma basis, attributable profits for 2012 (excluding movements in the fair value of own debt and before variable pay distributions) are allocated in the proportions shown in the chart below (retained earnings: 60%, dividends: 29% and variable pay: 11%).

H S B C H O L D I N G S P L C
Capital and Risk Management Pillar 3 Disclosures at 31 December 2012 (continued)
Page 68
2012 pro forma post-tax profits allocation
Retainedearnings/
capital 60%(2011: 50%)
Dividends¹ 29%(2011: 35%)
Variable pay² 11%(2011: 15%)
1 Inclusive of dividends to holders of other equity instruments
and net of scrip issuance. 2 Total variable pay pool for 2012 net of tax and portion to be
delivered by the award of HSBC Shares.
Finally, the commercial requirements to remain competitive in the market and overall affordability are considered.
Individual awards
Individual awards are based on the achievement of both financial and non-financial objectives. These objectives, which are aligned with the Group’s strategy, are detailed in participants’ annual performance scorecards and the collective long-term performance scorecard of participants in the GPSP. Performance is then measured and reviewed against these objectives on a regular basis.
Overall performance under both scorecards is judged on outcomes but most importantly, adherence to the HSBC Values is a prerequisite before any individual can be considered for any variable pay. In other words adherence with the values acts as a gating item. These values are key to the running of a sound, sustainable bank. Specifically, most senior employees had a separate values rating for 2012 which directly influenced their overall performance rating and, accordingly, their variable pay.
In addition, the global Risk and Compliance functions carry out annual reviews for senior executives and risk takers (defined as HSBC Code Staff). These reviews determine whether there are any instances of non-compliance with Risk and Compliance procedures and expected behaviour. Instances of non-compliance are escalated to senior management for consideration in variable pay decisions, clawback and ongoing employment. Group-wide thematic reviews of risk are also carried out to determine if there are any transgressions which could affect the amount of current year variable pay or any instances where clawback of
previously awarded variable pay is required. Risk and Compliance input is a critical part of the assessment process in determining the performance of HSBC Code Staff (which includes the executive Directors) and in ensuring that their individual remuneration has been appropriately assessed with regard to risk.
We require a proportion of variable pay awards above certain thresholds to be deferred into awards of HSBC shares. This is to ensure that the Group’s interests and those of our employees are aligned with those of our shareholders, that our approach to risk management supports the interests of all stakeholders and that remuneration is consistent with effective risk management.
All variable pay and incentive schemes are required to adhere to a set of policy principles and approval standards (as defined in the Global Standards Manual), which require the approval of the Finance, Risk, Legal, Compliance and HR functions. The Finance function validates the achievement of relevant financial metrics (e.g. the definition of profitability from which incentive funding is derived). The performance and hence remuneration of control function staff is assessed according to a performance scorecard of objectives specific to the functional role they undertake which is independent of the businesses they oversee. Remuneration is carefully benchmarked against the market and internally to ensure that it is set at an appropriate level.
In considering individual awards, a comparison of the pay and employment conditions of our employees, Directors and senior executives is considered by the Committee.
Clawback
In order to reward genuine performance and not failure, individual awards are made on the basis of a risk adjusted view of both financial and non-financial performance. However, if the assessment of performance subsequently proves to be inaccurate or incorrect, the unvested deferred awards made since 2010 can be clawed back by the Committee.
Clawback has been exercised by the Committee during 2012 and 2013 principally in respect of the US regulatory and law enforcement fines and penalties.

H S B C H O L D I N G S P L C
Capital and Risk Management Pillar 3 Disclosures at 31 December 2012 (continued)
Page 69
Code Staff criteria
The following groups of staff have been identified as meeting the FSA’s criteria for Code Staff:
• Senior Management whose roles are judged as falling within the FSA Code Staff definition (including executive board Directors, Group Managing Directors and Group General Managers);
• Staff performing a Significant Influence Function within HSBC Bank plc (including non-executive Directors (‘NEDs’);
• Executive, Management and Operating Committee members (excluding specific roles
that do not have a significant risk impact) of GPB, GB&M, Global Banking, Global Markets (including regional committees), CMB and RBWM.
• High earners who have a material impact on the risk profile of the Group.
The categories above cover all senior level management across the Group as well as those responsible for the operational management of the GB&M businesses and GPB. All heads of major GB&M businesses are included as well as the heads of all significant Global Markets products.
Structure of remuneration
Eligibility Description Purpose and relevant features
Senior Management
Other Code Staff excluding
NEDs NEDs Fixed Pay • Takes account of experience and personal contribution to the
individual’s role. Fees • Fees are regularly reviewed and compared with other large
international companies of comparable complexity. Annual Incentive • Drives and rewards performance against annual financial and non-
financial measures and adherence to HSBC Values which are consistent with the medium to long-term strategy.
• Maximum award is three times fixed pay for executive Directors. • For 2012 awards for executive Directors, Group Managing Directors
and Group General Managers, all of whom are Code Staff, the incentive is delivered 50% in cash and 50% in shares. 40% to 60% of variable remuneration is deferred for a period of 5 years and vesting will be subject to satisfactory completion of the Deferred Prosecution Agreement.
• For other Code Staff, 40% to 60% of variable remuneration is deferred over a period of 3 years, in line with the FSA requirements. 50% of both the deferred and non-deferred components will be in the form of restricted shares with the remaining 50% as cash. Vesting of deferred awards, both cash and shares, will be annually over a three-year period with 33% vesting on the first anniversary of grant, 33% on the second anniversary and 34% on the third anniversary. Deferred and non-deferred share awards will be subject to a six month retention period following vesting. Any Code Staff employee with total remuneration of no more than £500,000 (or local currency equivalent) and variable remuneration which is no more than 33% of total remuneration will not be subject to the Code Staff deferral policy but will be subject to the Group minimum deferral policy. During the vesting period, the Committee has the power to claw back part or all of the award.
• The award is non-pensionable.
GPSP • Incentivises sustainable long-term performance and alignment with shareholder interests.
• Maximum award is six times fixed pay (a reduction from the maximum of seven times under the previous long-term incentive plan).
• The award is non-pensionable. • Award levels are determined by considering performance up to the
date of grant against enduring performance measures set out in the long-term performance scorecard.
• The award is subject to a five-year vesting period during which the Committee has the authority to claw back part or all of the award.
• On vesting the net of tax shares must be retained until the participant retires.

H S B C H O L D I N G S P L C
Capital and Risk Management Pillar 3 Disclosures at 31 December 2012 (continued)
Page 70
Group Performance Share Plan
Performance measurement/assessment
Awards to be granted in 2013 in respect of 2012 were assessed against the 2012 long-term scorecard detailed below:
Table 46: 2012 Long-term scorecard and performance outcome
Measure Long-term target range Weighting
Actual 2012 Performance Outcome
Return on equity .............................................................................. 12% - 15% 15% 8.4%1 – Cost efficiency ratio ....................................................................... 48% - 52% 15% 62.8%1 – Capital strength ............................................................................... >10% 15% 12.3%1 15% Dividends (payout ratio) ................................................................. 40% - 60% 15% 55.2%1 15% Strategy ........................................................................................... Judgement 20% Judgement 15%
Brand equity ...................................................................................
Top 3 rating and improve US$bn value 5%
Top 3 rating but drop in value2 –
Compliance and reputation ............................................................. Judgement 10% Not met – People and values ........................................................................... Judgement 5% Judgement 3.75%
Performance outcome .................................................................. 100% 48.75% Committee Discretion ................................................................... 40%
1 As reported in the Annual Report and Accounts 2012. 2 Based on results from The 2013 Brand Finance® Banking 500 Survey.
Awards to be granted in 2013 in respect of 2012 were assessed against the 2012 long-term scorecard produced above.
The performance assessment under the 2012 long-term scorecard took into account achievements under both financial and non-financial objectives both of which were set within the context of the risk appetite and strategic direction agreed by the Board.
Notwithstanding the detail or extent of performance delivery against the objectives, an individual’s eligibility for a GPSP award requires confirmation of adherence to HSBC Values which acts in effect as a gating mechanism to GPSP participation. Within the GPSP, the weighting between financial and non-financial measures in respect of 2012 was set at 60% and 40% respectively.
In aggregate in respect of the objectives set for 2012, and in light of the significance of the legal and regulatory fines and penalties incurred in 2012, an overall performance outcome of 40% (2011:50%) of the scorecard was judged to have been achieved; this outcome applies to all eligible participants in the GPSP. A summary of the assessment and rationale for the conclusions is set out below. Figures in parentheses reflect the available opportunity under the Plan.
Financial (60% weighting – achieved 30%)
The opportunity of 60% was equally split in 2012 between Capital Strength, Dividend Progression, Return on Equity and Cost Efficiency ratio (‘CER’).
While the annual assessment looked at point in time achievement of the same performance elements, under the long term plan consideration was given to progress made towards stated targets where these had not been met in the short term and to the sustainability of positive short term performance.
With regard to Capital Strength, the Committee considered favourably the steps taken to meet the Basel III targets in the accelerated timetable being required by the Group’s lead regulator. In addition to achieved and planned operating profit generation, the Committee noted favourably the extensive capital generated from business disposals, both from gains realised on sale and from release of risk weighted assets. Further support for a positive view of performance accrued from actions noted as having been taken to reduce the capital drag from legacy assets and exit portfolios and from steps being taken to mitigate the impact of the more onerous capital requirements arising from regulatory changes yet to take effect. Having reviewed these factors the Committee awarded the full opportunity (15%).
On Dividend Progression, the Committee noted favourably the capacity to maintain a progressive policy, subject to performance, reflected in the Group’s capital position, its distributable reserves, its cash position and its planning assumptions. The Committee also noted external commentary on dividend paying capacity and regulatory interactions around the Group’s capital position. Having considered these factors the Committee awarded the full opportunity (15%).
H S B C H O L D I N G S P L C
Capital and Risk Management Pillar 3 Disclosures at 31 December 2012 (continued)
Page 71
As noted in the assessment of the annual performance awards, the Group has not yet reached its target Return on Equity of 12-15%. The Committee deliberated on the benefits arising from the considerable restructuring and reshaping of the business which has been undertaken under the Group’s Six Filters framework, the delivery of sustainable cost savings ahead of target, the growth being achieved from investment in faster growing markets and the progress made in run-off of the exit portfolios and in reducing legacy underperforming assets. The Committee also reflected on the additional costs that would be incurred and revenues foregone from the programme of strengthening controls and compliance which is underway and from applying global standards in all markets. There was also note made of the continuing uncertainties from an incomplete regulatory reform agenda, from contingent legal risks and of the continuing significant customer redress costs from legacy activities being borne. As a consequence the Committee felt unable to make any award under this opportunity (15%).
Similarly under the CER element of the scorecard, despite good progress on sustainable cost savings the CER remains well above the target range of 48-52%. The Committee noted that a major element of the underperformance relates to legal and regulatory fines and penalties and customer redress costs which it cannot view as non-recurring. As a consequence the Committee judged that no award could be made under this opportunity (15%)
Non-financial (40% weighting – achieved 18.75%)
Half the opportunity in this section related to the execution of strategic priorities laid down by the Board (20%). In assessing performance the Committee noted but looked beyond the short-term deliverables of targeted disposals and investments to review the frameworks being established to improve capital deployment, establish and enforce
Global Standards, improve cost efficiency while maintaining strong operational and risk controls and enhance global business co-operation and integration. The Committee concluded that it would be an appropriate reflection of management achievement to award 75% of the available opportunity, namely 15%.
A separate but connected appraisal was made of the human aspect of long term strategy delivery where the Committee looked at recruitment of key personnel to fill critical roles, succession planning, values training and enforcement and the retention, motivation and collegiality of the senior management team in what had been a stressed environment. Once again the Committee awarded 75% of the available opportunity of 5%, adding 3.75% to the scorecard.
With regard to Compliance and Reputation (10%) given the legal and regulatory fines and penalties incurred in 2012 and the continuation of significant further customer redress costs in the UK, the Committee concluded no award could be contemplated.
This conclusion was followed through when assessing Brand Equity (5%) which technically scored 50% of the available opportunity as HSBC maintained a top three ranking in its peer group. The Committee used its discretion to reduce this award to nil in light of the reputational damage incurred from the US legal and regulatory fines and penalties.
This performance assessment resulted in an overall score of 48.75%. Notwithstanding this, taking into account the significance of the legal and regulatory fines and penalties incurred in 2012 the Committee determined that the initial performance outcome should be reduced further to give a final performance outcome for 2012 of 40%.
Vesting period
Five-year vesting period with the requirement to hold the awards until retirement.
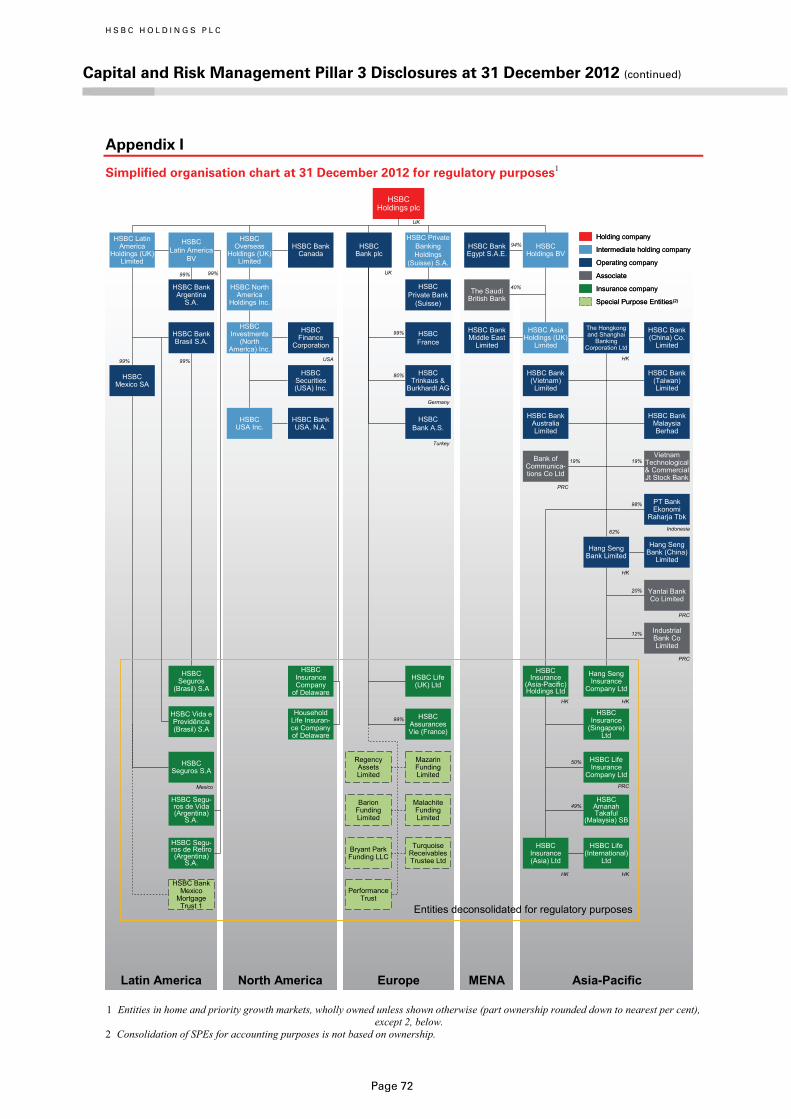
H S B C H O L D I N G S P L C
Capital and Risk Management Pillar 3 Disclosures at 31 December 2012 (continued)
Page 72
Appendix I
Simplified organisation chart at 31 December 2012 for regulatory purposes1
EuropeLatin America North America MENA Asia-Pacific
HSBCHoldings plc
Germany
HSBC Securities (USA) Inc.
HSBC Trinkaus &
Burkhardt AG
HSBC Bank (Taiwan) Limited
HSBCBank plc
HSBCLatin America
BV
HSBC Bank Canada
HSBC Private Banking Holdings
(Suisse) S.A.
HSBCHoldings BV
HSBC BankEgypt S.A.E.
HSBC Overseas
Holdings (UK) Limited
HSBC BankUSA, N.A.
HSBC Bank Malaysia Berhad
HSBCUSA Inc.
HSBC Latin America
Holdings (UK) Limited
HSBC Bank Argentina
S.A.
HSBCPrivate Bank
(Suisse)
The SaudiBritish Bank
HSBC North America
Holdings Inc.
HSBC Bank Brasil S.A.
HSBC Finance
CorporationHSBCFrance
HSBC Bank (China) Co.
Limited
HSBC BankMiddle East
Limited
The Hongkongand Shanghai
Banking Corporation Ltd
HSBC Investments
(North America) Inc.
USA
UK
94%
40%
HK
99%
UK
HSBC Bank (Vietnam) Limited
HSBC Bank Australia Limited
HSBC Asia Holdings (UK)
Limited
HSBCBank A.S.
80%
Turkey
99%
HSBCMexico SA
99%
Bank of Communica-tions Co Ltd
PT Bank Ekonomi
Raharja Tbk
Hang SengBank (China)
Limited
62%
HK
Hang SengBank Limited
98%
Indonesia
VietnamTechnological & Commercial Jt Stock Bank
19%19%
Hang SengInsurance
Company Ltd
Yantai Bank Co Limited
Industrial Bank Co Limited
HSBC Life Insurance
Company Ltd
HSBC Insurance
(Singapore) Ltd
HSBC Life (International)
Ltd
HSBC AmanahTakaful
(Malaysia) SB
HSBC Insurance
(Asia-Pacific) Holdings Ltd
HSBC Insurance (Asia) Ltd
HSBC Assurances Vie (France)
HSBC Life (UK) Ltd
HSBC Seguros
(Brasil) S.A
99%
12%
20%
50%
49%
Holding companyHolding company
Intermediate holding companyIntermediate holding company
AssociateAssociate
Insurance companyInsurance company
Operating companyOperating company
Special Purpose Entities(2)Special Purpose Entities(2)
HSBC Seguros S.A
HSBC Segu-ros de Retiro(Argentina)
S.A.
HSBC Bank Mexico
Mortgage Trust 1
99%
HSBC Insurance Company
of Delaware
Household Life Insuran-ce Companyof Delaware
MazarinFunding Limited
PRC
PRC
PRC
HK HK
PRC
HK HK
Regency Assets Limited
MalachiteFundingLimited
BarionFundingLimited
TurquoiseReceivablesTrustee Ltd
Bryant ParkFunding LLC
Performance Trust
Mexico
Entities deconsolidated for regulatory purposes
99%
HSBC Vida e Previdência(Brasil) S.A
HSBC Segu-ros de Vida (Argentina)
S.A.
1 Entities in home and priority growth markets, wholly owned unless shown otherwise (part ownership rounded down to nearest per cent), except 2, below.
2 Consolidation of SPEs for accounting purposes is not based on ownership.

H S B C H O L D I N G S P L C
Capital and Risk Management Pillar 3 Disclosures at 31 December 2012 (continued)
Page 73
Appendix II
Risk management framework – risk types
Risks assessed via capital
Credit (including counterparty credit), market and operational risk
Credit risk is the risk of financial loss if a customer or counterparty fails to meet a payment obligation under a contract. It arises principally from direct lending, trade finance and leasing business, but also from off-balance sheet products such as guarantees and derivatives, and from the Group’s holdings of debt and other securities.
Basel II applies three approaches of increasing sophistication to the calculation of Pillar 1 credit risk capital requirements. The most basic level, the standardised approach, requires banks to use external credit ratings to determine the risk weightings applied to rated counterparties. Other counterparties are grouped into broad categories and standardised risk weightings are applied to these categories. The next level, the IRB foundation approach, allows banks to calculate their credit risk capital requirements on the basis of their internal assessment of a counterparty’s PD, but estimates of EAD and LGD are subject to standard supervisory parameters. Finally, the IRB advanced approach allows banks to use their own internal assessment in both determining PD and quantifying EAD and LGD.
The capital resources requirement, which is intended to cover unexpected losses, is derived from a formula specified in the regulatory rules, which incorporates PD, LGD, EAD and other variables such as maturity and correlation. Expected losses under the IRB approaches are calculated by multiplying PD by EAD and LGD. Expected losses are deducted from capital to the extent that they exceed total accounting impairment allowances.
Counterparty credit risk, in both the trading and non-trading books, is the risk that the counterparty to a transaction may default before completing the satisfactory settlement of the transaction. Three approaches to calculating counterparty credit risk and determining exposure values are defined by Basel II: standardised, mark-to-market and IMM. These exposure values are used to determine capital requirements under one of the credit risk approaches; standardised, IRB foundation and IRB advanced.
Securitisation positions are held in both the trading and non-trading books. To calculate the credit risk capital requirements for securitisation positions in the non-trading book, Basel II specifies two
approaches: standardised and IRB. Both approaches rely on the mapping of rating agency credit ratings to risk weights, which range between 7% and 1,250%. When positions qualify for 1,250%, they are then not risk-weighted but deducted instead from capital.
Within the IRB approach, we use the ratings-based method for the majority of our non-trading book securitisation positions, and the IAA for unrated liquidity facilities and programme-wide enhancements for asset-backed securitisations.
The majority of securitisation positions in the trading book are treated for capital purposes as if they are held in the non-trading book under the standardised or IRB approaches. Other traded securitisation positions, known as correlation trading, are treated under an internal model approach approved by the FSA.
Market risk is the risk that movements in market risk factors, including foreign exchange, commodity prices, interest rates, credit spread and equity prices will reduce our income or the value of our portfolios.
The market risk capital requirement is measured using internal market risk models, where approved by the FSA, or the FSA standard rules. Our internal market risk models comprise VAR, stressed VAR, IRC and correlation trading under the CRM.
Basel II includes capital requirements for operational risk, again utilising three levels of sophistication. The capital required under the basic indicator approach is a simple percentage of gross revenues, whereas under the standardised approach, it is one of three different percentages of total operating income less insurance premiums allocated to each of eight defined business lines. Both these approaches use an average of the last three financial years’ revenues. Finally, the advanced measurement approach uses banks’ own statistical analysis and modelling of operational risk data to determine capital requirements.
We assess economic capital requirements for these risk types by utilising the embedded operational infrastructure used for the Pillar 1 capital calculation, together with an additional suite of models that take into account, in particular:
• the increased level of confidence required to meet our strategic goals (99.95%); and
• internal assessments of diversification of risks within our portfolios and, similarly, any concentrations of risk that arise.

H S B C H O L D I N G S P L C
Capital and Risk Management Pillar 3 Disclosures at 31 December 2012 (continued)
Page 74
Non-trading book interest rate risk
Interest rate risk in non-trading portfolios arises principally from mismatches between the future yield on assets and their funding cost as a result of interest rate changes. Analysis of this risk is complicated by having to make assumptions on embedded optionality within certain product areas, such as the incidence of mortgage prepayments, and from behavioural assumptions regarding the economic duration of liabilities which are contractually repayable on demand, such as current accounts.
The economic capital requirement for non-trading interest rate risk under Pillar 2 is measured by EVE sensitivity. EVE sensitivity considers all re-pricing mismatches assuming a run-off of the current balance sheet, and quantifies the larger loss in economic value of the Group’s net asset position (including off balance sheet positions) under a +/- 200bps shock to interest rates.
Insurance risk
We operate an integrated bancassurance model which provides wealth and protection insurance products principally for customers with whom we have a banking relationship. Insurance products are sold through all global businesses, predominantly by RBWM and CMB, through our branches and direct channels worldwide.
The insurance contracts we sell largely relate to the underlying needs of our banking customers, which we can identify from our point-of-sale contacts and customer knowledge. The majority of sales are of savings and investment products and term and credit life contracts. By focusing largely on personal and SME lines of business we are able to optimise volumes and diversify individual insurance risks.
Where we have operational scale and risk appetite, mostly in life insurance, these insurance products are manufactured by HSBC subsidiaries. Manufacturing insurance allows us to retain the risks and rewards associated with writing insurance contracts as part of the underwriting profit, investment income and distribution commission are kept within the Group.
Where we do not have the risk appetite or operational scale to be an effective insurance manufacturer, we engage through a handful of leading external insurance companies in order to provide insurance products to our customers through our banking network and direct channels. These arrangements are generally structured with our
exclusive strategic partners and earn the Group a combination of commissions, fees and profit-share.
We distribute insurance products in all of our geographical regions. We have core life insurance manufacturing entities, the majority of which are direct subsidiaries of legal banking entities, in seven countries (Argentina, Brazil, Mexico, France, UK, Hong Kong and Singapore). Our life insurance manufacturing entities in the US are held-for-sale at 31 December 2012.
We continue to make progress in the implementation of a risk-based capital methodology for our insurance businesses. During 2012, the risk-based methodology has continued to develop with particular emphasis on analysing the movements in economic surplus and capital requirements over accounting periods. The use of this metric in regular reporting has become more widespread and is embedded within new risk management packs.
Pension risk
Pension risk arises from the potential for a deficit to emerge in a defined-benefit pension plan. This risk is assessed using an economical capital model, using VAR methodology, which takes into account possible variations in the factors underlying such a deficit.
Residual risk
Residual risk is, primarily, the risk that mitigation techniques prove less effective than expected. This category also includes risks that arise from specific reputational or business events that give rise to exposures not deemed to be included in the major risk categories. We conduct economic capital assessments of such risks on a regular, forward-looking basis to ensure that their impact is adequately covered by our capital base.
Structural foreign exchange risk
Structural foreign exchange risks arise from our net investments in subsidiaries, branches and associates, the functional currencies of which are other than the US dollar. Unrealised gains or losses due to revaluations of structural foreign exchange exposures are reflected in reserves, whereas other unrealised gains or losses arising from revaluations of foreign exchange positions are reflected in the income statement.
Our structural foreign exchange exposures are managed with the primary objective of ensuring, where practical, that our consolidated capital ratios and the capital ratios of the individual banking
H S B C H O L D I N G S P L C
Capital and Risk Management Pillar 3 Disclosures at 31 December 2012 (continued)
Page 75
subsidiaries are largely protected from the effect of changes in exchange rates. This is usually achieved by ensuring that, for each subsidiary bank, the ratio of structural exposures in a given currency to RWAs denominated in that currency is broadly equal to the capital ratio of the subsidiary in question. We evaluate residual structural foreign exchange exposures using an expected shortfall method. Details of our structural FX exposures are provided on page 268 of the Annual Report and Accounts 2012.
Risks not explicitly assessed via capital
Liquidity risk
We use cash-flow stress testing as part of our control processes to assess liquidity risk. We do not manage liquidity through the explicit allocation of capital as, in common with standard industry practice, this is not considered to be an appropriate or adequate mechanism for managing these risks. However, we recognise that a strong capital base can help to mitigate liquidity risk both by providing a capital buffer to allow an entity to raise funds and deploy them in liquid positions, and by serving to reduce the credit risk taken by providers of funds to the Group.
Reputational risk
As a banking group, our good reputation depends upon the way in which we conduct our business, but it can also be affected by the way in which clients, to whom we provide financial services, conduct themselves. The safeguarding of our reputation is paramount and is the responsibility of all members of staff, supported by a global risk management structure, underpinned by relevant policies and practices, readily available guidance and regular training. A fresh emphasis in 2011 on values made these more explicit, to ensure we meet the expectations of society, customers, regulators and investors.
Sustainability risk
Sustainability risks arise from the provision of financial services to companies or projects which run counter to the needs of sustainable development; in effect, this risk arises when the environmental and social effects outweigh economic benefits.
Sustainability risk is implicitly covered for economic capital purposes in credit risk, where risks associated with lending to certain categories of customers and industries are embedded.
Business risk
The FSA specifies that banks, as part of their internal assessment of capital adequacy process, should review their exposure to business risk.
Business risk is the potential negative impact on profits and capital from the Group not meeting our strategic objectives, as a result of unforeseen changes in the business and regulatory environment, exposure to economic cycles and technological changes.
We manage and mitigate business risk through our business planning and stress testing processes, so that our business model and planned activities are resourced and capitalised consistent with the commercial, economic and risk environment in which the Group operates, and that any potential vulnerabilities of our business plans are identified at an early stage so that mitigating actions can be taken.
Dilution risk
Dilution risk is the risk that an amount receivable is reduced through cash or non-cash credit to the obligor, and arises mainly from factoring and invoice discounting transactions.
Where there is recourse to the seller, we treat these transactions as loans secured by the collateral of the debts purchased and do not report dilution risk for them. For our non recourse portfolio, we do not report any dilution risk as we obtain an indemnity from the seller which indemnifies us against this risk. Moreover, factoring transactions involve lending at a discount to the face-value of the receivables which provides protection against dilution risk.
Details of our management of these risks may be found on the following pages of the Annual Report and Accounts 2012: liquidity and funding 203, structural foreign exchange 268, reputational 246 and sustainability 249.

H S B C H O L D I N G S P L C
Capital and Risk Management Pillar 3 Disclosures at 31 December 2012 (continued)
Page 76
Appendix III
Supplementary Basel III disclosures
Table 47: Composition of regulatory capital on a Basel III basis
At 31 December 2012
Amounts subject to pre-CRR treatment or CRR prescribed residual amount
US$bn US$bn Common equity tier 1 (CET1) capital: instruments and reserves
Capital instruments and the related share premium accounts .................................................................. 17.9 Retained earnings ..................................................................................................................................... 118.4 Accumulated other comprehensive income (and other reserves) ............................................................ 29.1 Minority interests (amount allowed in consolidated CET1 ) ................................................................... 4.4 (2.3)Independently reviewed interim net profits net of any foreseeable charge or dividend ......................... 1.9
Common equity tier 1 (CET1) capital before regulatory adjustments .................................................... 171.7 (2.3) Common equity tier 1 (CET1) capital: regulatory adjustments ....................................................... (4.7) (49.2)
Additional value adjustments ................................................................................................................... (1.1) (0.6)Intangible assets (net of related deferred tax liability) ............................................................................. – (25.4)Deferred tax assets that rely on future profitability excluding those arising from temporary differences
(net of related tax liability) ................................................................................................................... –
(0.5)Negative amounts resulting from the calculation of expected loss amounts ........................................... – (6.2)Gains or losses on liabilities valued at fair value resulting from changes in own
credit standing ...................................................................................................................................... (0.3)
– Defined-benefit pension fund assets ........................................................................................................ (2.0) – Direct and indirect holdings of own CET1 instruments .......................................................................... (1.3) – Direct and indirect holdings of the CET1 instruments of relevant entities where we do not have a
significant investment in those entities (amount above the 10% threshold and net of eligible short positions)1 ............................................................................................................................................. –
(6.0)Direct and indirect holdings of the CET1 instruments of relevant entities where we have a significant
investment in those entities (amount above the 10% threshold and net of eligible short positions) .. –
(6.7)Amount exceeding the 15% threshold ..................................................................................................... – (3.8)
of which: direct and indirect holdings of the CET1 instruments of relevant entities where we have a significant investment in those entities ............................................................................................ –
(2.3)
of which: deferred tax assets arising from temporary differences ...................................................... – (1.5)
Regulatory adjustments applied to common equity tier 1 in respect of amounts subject to pre-CRR treatment
Regulatory adjustments relating to unrealised gains and losses .............................................................. (2.1) 2.1 of which: unrealised gains on available-for-sale debt instruments ..................................................... 1.2 (1.2)of which: unrealised gains on available-for-sale equity instruments .................................................. (2.1) 2.1 of which: reserves arising from revaluation of property ..................................................................... (1.2) 1.2
Amounts to be deducted from or added to common equity tier 1 capital with regard to additional filters and deductions required pre-CRR ........................................................................................................ 1.6 (1.6)of which: defined benefit pension fund ............................................................................................... 1.6 (1.6)
Qualifying additional tier 1 deductions that exceed the AT1 capital ...................................................... (18.3) 18.3
Total regulatory adjustments to common equity tier 1 (CET1) ............................................................... (23.5) (30.4)
Common equity tier 1 (CET1) capital .................................................................................................. 148.2 (32.7) Additional tier 1 capital (AT1): instruments
Amount of qualifying items and the related share premium accounts subject to phase out from AT1 ............................................................................................................................. 11.9
(11.9)
Qualifying tier 1 capital included in consolidated AT1 capital issued by subsidiaries and held by third parties ....................................................................................................................... 3.7
(3.3)
of which: instruments issued by subsidiaries subject to phase out ...................................................... 3.7 (3.7)
Additional tier 1 (AT1) capital before regulatory adjustments ................................................................ 15.6 (15.2)

H S B C H O L D I N G S P L C
Capital and Risk Management Pillar 3 Disclosures at 31 December 2012 (continued)
Page 77
At 31 December 2012
Amounts subject to pre-CRR treatment or CRR prescribed residual amount
US$bn US$bn Additional tier 1 (AT1) capital: regulatory adjustments
Regulatory adjustments applied to additional tier 1 capital in respect of amounts subject to pre-CRR treatment and transitional treatments subject to phase-out
Residual amounts deducted from additional tier 1 capital with regard to deduction from common equity tier 1 capital during the transitional period ....................................................... (33.9) 33.8
Direct and indirect holdings of the CET1 instruments of relevant entities where we do not have a significant investment in those entities (amount above the 10% threshold and net of eligible short positions) .............................................................................................................................................. (1.6)
1.5 Direct and indirect holdings of the CET1 instruments of relevant entities where we have a significant
investment in those entities (amount above the 10% threshold and net of eligible short positions) .. (3.1)
3.1 Direct and indirect holdings of the CET1 instruments of relevant entities where we have a significant
investment in those entities (amounts above the 15% threshold and net of eligible short positions) . (0.7)
0.7 Intangible assets (net of deferred tax liability) ......................................................................................... (25.4) 25.4 Negative amounts resulting from the calculation of expected loss amounts ........................................... (3.1) 3.1
Qualifying additional tier 1 deductions that exceed the AT1 capital ...................................................... 18.3 (18.3)
Total regulatory adjustments to additional tier 1 (AT1) capital .............................................................. (15.6) 15.5
Additional tier 1 (AT1) capital .............................................................................................................. - 0.3
Tier 1 capital (T1 = CET1 + AT1) ........................................................................................................ 148.2 (32.4) Tier 2 (T2) capital: instruments and provisions
Amount of qualifying items and the related share premium accounts subject to phase out from tier 2 ............................................................................................................................................. 16.8
(16.8)
Qualifying own funds instruments included in consolidated tier 2 capital issued by subsidiaries and held by third parties ................................................................................................... 18.4
(18.0)
of which: instruments issued by subsidiaries subject to phase out ...................................................... 18.4 (18.4)Credit Risk adjustments ............................................................................................................................ 2.7 -
Tier 2 (T2) capital before regulatory adjustments ................................................................................... 37.9 (34.8) Tier 2 (T2) capital: regulatory adjustments
Regulatory adjustments applied to tier 2 capital in respect of amounts subject to pre-CRR treatment and transitional treatments subject to phase-out
Residual amounts deducted from tier 2 capital with regard to deduction from common equity tier 1 capital during the transitional period ................................................................................................... (8.5) 8.0
Direct and indirect holdings of the CET1 instruments of relevant entities where we do not have a significant investment in those entities (amount above the 10% threshold and net of eligible short positions) .............................................................................................................................................. (1.6)
1.1 Direct and indirect holdings of the CET1 instruments of relevant entities where we have a significant
investment in those entities (amount above the 10% threshold and net of eligible short positions) .. (3.1)
3.1 Direct and indirect holdings of the CET1 instruments of relevant entities where we have a significant
investment in those entities (amounts above the 15% threshold and net of eligible short positions) . (0.7)
0.7 Negative amounts resulting from the calculation of expected loss amounts ........................................... (3.1) 3.1
Amount to be deducted from or added to tier 2 capital with regard to additional filters and deductions required pre-CRR ................................................................................................................................. 3.3 (3.3)of which: unrealised gains on available-for-sale equity instruments .................................................. 2.1 (2.1)of which: reserves arising from revaluation of property ..................................................................... 1.2 (1.2)
Total regulatory adjustments to tier 2 (T2) capital .................................................................................. (5.2) 4.7
Tier 2 (T2) capital ................................................................................................................................... 32.7 (30.1)
Total capital (TC = T1 + T2) ................................................................................................................. 180.9 (62.5)
1 CRD IV rules are unfinalised and subject to ongoing negotiation. If the rules were to be finalised in their current form, the holdings of such positions would generate a disproportionate capital cost and potentially the relevant business could be curtailed, closed or our hedging adjusted to negate the impact.

H S B C H O L D I N G S P L C
Capital and Risk Management Pillar 3 Disclosures at 31 December 2012 (continued)
Page 78
Basis of preparation
The disclosure in Appendix III has been produced to meet an FSA requirement set out in a letter to major UK banks in October 2012. Banks were asked to provide detailed estimates of the composition of their regulatory capital calculated under the draft CRD IV text of July 2011 on a first-year transitional basis, i.e. applying the draft CRD IV rules to the balance sheet position at 31 December 2012 as if banks were at the start of year 1 in the transition period.
The disclosure is required in the format prescribed in Annex VI ‘Transitional Own Fund disclosure template’ to the EBA consultation paper ‘Draft Implementing Technical Standards on Disclosure for Own Funds by Institutions’ (EBA/CP/2012/04 of 7 June 2012). Where appropriate, additional line items have been included, to accommodate certain amounts not captured by the template. We have also provided additional information in the second column for completion, to facilitate the reading of the end-point (full impact) capital resources position which results from adding the two columns together.
The FSA indicated that where the draft CRD IV provides for a range of transitional percentages, banks should use the supplementary guidance ‘CRD IV transitional provisions on capital resources’, published by the FSA on 26 October, 2012.
It should be noted that during the CRD IV transitional period, the residual amounts of items not yet subject to the new rules in full would receive the capital treatment prescribed under the CRD IV transitional provisions which, with a few exceptions, do not allow for current national treatments to continue to be applied.
However, the draft CRD IV allows for national regulators to accelerate the transition on an item by item basis and the FSA have indicated they would exercise that discretion in relation to these items only: deferred tax assets not arising from timing differences (10% of the total amount to be deducted from CET1), investment in own shares (100% deducted from CET1), and interim losses (100% deducted from CET1).
The basis of preparation above is consistent with that used for our other disclosures in this document in the calculation of our estimated position under Basel III/CRD IV rules.
At the time of writing, CRD IV has not become law and its provisions are subject to ongoing negotiation and amendment. In addition, formal Implementing Technical Standards (‘ITS’) due for issue by the EBA need to be drafted and finalised, and
therefore CRD IV rules are subject to significant interpretation as a result.
Moreover, pending receipt of final legal text we have not definitively upgraded the models and systems that we use to calculate capital numbers in a CRD IV environment, which as a consequence are subject to change and estimation.
Leverage ratio: basis of preparation
The FSA requires major UK banks to make group consolidated leverage ratio disclosures at 31 December 2012, using a hybrid of Basel III and CRD IV. As the CRD IV rules have not been finalised by policy-makers and the Basel III transitional arrangements for parallel run and calibration continue to apply, Table 8 presents our estimated leverage ratio, based on the approach prescribed by the FSA in their letter dated 4 December 2012.
The estimated tier 1 capital figure is based on an ‘end point Basel III’ definition of tier 1 capital applicable from 1 January 2022, applying the draft CRD IV rules.
For further information on the basis of preparation of CRD IV end point regulatory capital, please refer to page 298 of the Annual Report and Accounts 2012.
The total exposures are calculated according to the Basel III rules text, the instructions for the Basel III Quantitative Impact Study, its related Frequently Asked Questions and the FSA’s guidance on the methodologies used there. They are based on financial accounting on- and off-balance exposures, adjusted as follows:
• Basel II regulatory nettings allowed for derivatives and SFTs, excluding cross-product nettings;
• inclusion of Future Potential Exposures add-on for derivatives;
• off-balance sheet items included in full, except for commitments that are unconditionally cancellable at any time by HSBC without prior notice, where only 10% of the exposures are included;
• exclusion of items deducted from the calculation of end-point tier 1 capital; and
• for investments in banking associates that are equity accounted in the financial accounting consolidation but proportionally consolidated for regulatory purposes, the accounting treatment is used.

H S B C H O L D I N G S P L C
Capital and Risk Management Pillar 3 Disclosures at 31 December 2012 (continued)
Page 79
Appendix IV
References to Annual Report and Accounts 2012
This document includes a number of references to the Annual Report and Accounts 2012 on subjects where additional information may be found, as follows:
Page in this document
Page(s) in ARA
4 HSBC’s implementation of EDTF recommendations ............................................................................... 12 5 Future developments (and details on potential buffer requirements) ........................................................ 291 5 Basis of consolidation for financial accounting purposes .......................................................................... 384 7 The use of SPEs in the Group’s securitisation programme ....................................................................... 502 8 Our approach to capital management ......................................................................................................... 293 8 Main features of capital securities issued by the Group ............................................................................ 480, 494, 495 10 The Group’s risk profile arising from the business activities of our global businesses ............................ 20 15 The Group’s stress testing activities, areas of special interest and top and emerging risks ...................... 127, 128, 130 18 Detailed basis of preparation of impact of Basel III and CRD IV on our capital position ....................... 298 19 Risk governance structure and approach to risk appetite ........................................................................... 323, 325 19 Details of the Financial System Vulnerabilities Committee ...................................................................... 328 19 The risk appetite framework ....................................................................................................................... 325 21 Credit responsibilities of Global Risk ........................................................................................................ 252 31 Details of the Group’s approach to credit quality classification ................................................................ 253 43 Drivers of the impairment allowances in North America .......................................................................... 151, 171 43 Details of the Group’s impaired loans and advances, past due but not impaired assets and impairment
allowances and charges .......................................................................................................................... 155 43 Our approach for determining impairment allowances .............................................................................. 389 44 Collateral held over Residential and Commercial Real Estate properties ................................................. 163 45 Information on credit risk mitigation ......................................................................................................... 163 46 Information about the part sale of our investment in Ping An ................................................................... 8 48 Details of our credit valuation adjustment methodology ........................................................................... 56 49 Credit derivative transactions ..................................................................................................................... 452 49 Net derivative credit exposure .................................................................................................................... 452 53 Entities used in securitisations .................................................................................................................... 504 53 Valuation of securitisation positions .......................................................................................................... 184 53 Assessing control over SPEs ...................................................................................................................... 384 59 Further information on market risk ............................................................................................................ 218 61 Compliance and legal risks ......................................................................................................................... 130, 506 61 Information on the possible historical mis-selling of PPI and interest rate protection products in
the UK .................................................................................................................................................... 479 62 Operational risk – the ‘Three lines of defence’ model and our ORMF ..................................................... 227 63 Pension risk – details of contributions to defined benefit plans ................................................................ 415 64 The Group’s monitoring of the sensitivity of projected net interest income under varying interest rate
scenarios ................................................................................................................................................. 223 64 Accounting policy for AFS equity investments and valuation of financial instruments ........................... 388, 395 64 Valuation techniques applied to private equity .......................................................................................... 442 67 The Group Performance Share Plan ........................................................................................................... 351 75 Structural foreign exchange exposures ....................................................................................................... 268 75 Liquidity and funding, structural foreign exchange, reputational and sustainability risk ......................... 203, 246, 249, 268 78 Basis of preparation of CRD IV end point regulatory capital ................................................................... 298

H S B C H O L D I N G S P L C
Capital and Risk Management Pillar 3 Disclosures at 31 December 2012 (continued)
Page 80
Appendix V
Glossary Term Definition
A Arrears Customers are said to be in arrears (or in a state of delinquency) when they are behind in
fulfilling their obligations, with the result that an outstanding loan is unpaid or overdue. When a customer is in arrears, the total outstanding loans on which payments are overdue are described as delinquent.
Asset-backed securities (‘ABS’s)
Securities that represent an interest in an underlying pool of referenced assets. The referenced pool can comprise any assets which attract a set of associated cash flows but are commonly pools of residential or commercial mortgages.
Available-for-sale (‘AFS’) financial assets
Those non-derivative financial assets that are designated as available for sale or are not classified as a) loans and receivables b) held-to-maturity investments or c) financial assets at fair value through profit or loss.
B
Back-testing A statistical technique used to monitor and assess the accuracy of a model, and how that model would have performed had it been applied in the past.
Basel Committee Basel Committee on Banking Supervision. Basel II The capital adequacy framework issued by the Basel Committee on Banking Supervision in
June 2006 in the form of the ‘International Convergence of Capital Measurement and Capital Standards’, amended by subsequent changes to the capital requirements for market risk and re-securitisations, commonly known as Basel 2.5, which took effect in December 2011.
Basel 2.5 The update to the Basel framework which includes changes to capital and disclosure requirements for securitisation and market risk.
Basel III In December 2010, the Basel Committee issued ‘Basel III rules: a global regulatory framework for more resilient banks and banking systems’ and ‘International framework for liquidity risk measurement, standards and monitoring’. Together these documents present the Basel Committee’s reforms to strengthen global capital and liquidity rules with the goal of promoting a more resilient banking sector. In June 2011, the Basel Committee issued a revision to the former document setting out the finalised capital treatment for counterparty credit risk in bilateral trades. The Basel III requirements will be phased in starting on 1 January 2013 with full implementation by 1 January 2019.
Basis risk The risk that prices of offsetting financial instruments in a hedging strategy will not move in entirely opposite directions from each other. There is therefore a risk that the imperfect correlation between the instruments used for the hedging strategy produces an overall gain or loss.
BIPRU Prudential sourcebook for Banks, Building Societies and Investment Firms
C
Capital conservation buffer A capital buffer, prescribed by regulators under Basel III, and designed to ensure banks build up capital buffers outside periods of stress which can be drawn down as losses are incurred. Should a bank’s capital levels fall within the capital conservation buffer range, capital distributions will be constrained by the regulators.
Capital planning buffer (‘CPB’) A capital buffer, prescribed by the FSA under Basel II, and designed to ensure banks build up capital buffers outside periods of stress which can be drawn down as losses are incurred. Should a bank’s capital levels fall within the capital planning buffer range, a period of heightened regulatory interaction would be triggered.
Capital required Capital required represents the Pillar 1 capital charge calculated at 8% of RWAs. Capital requirements directive (‘CRD’) A capital adequacy legislative package issued by the European Commission and adopted by
member states. The first CRD legislative package gave effect to the Basel II proposals in the EU and came into force on 20 July 2006. CRD II, which came into force on 31 December 2010, subsequently updated the requirements for capital instruments, large exposure, liquidity risk and securitisation. A further CRD III amendment updated market risk capital and additional securitisation requirements and came into force on 31 December 2011.
CRD IV package comprises a recast Capital Requirements Directive and a new Capital Requirements Regulation. The package implements the Basel III capital proposals together with transitional arrangements for some of its requirements. CRD IV proposals are in draft and yet to have legal effect.
Code Staff Senior management, risk takers, staff engaged in control functions, and any employee whose total remuneration takes them into the same remuneration bracket as senior management and risk takers and whose professional activities have a material impact on the firm’s risk profile.

H S B C H O L D I N G S P L C
Capital and Risk Management Pillar 3 Disclosures at 31 December 2012 (continued)
Page 81
Term Definition
Commercial paper An unsecured, short-term debt instrument issued by a corporation, typically for the financing of accounts receivable, inventories and meeting short-term liabilities. The debt is usually issued at a discount, reflecting prevailing market interest rates.
Commercial real estate Any real estate, comprising buildings or land, intended to generate a profit, either from capital gain or rental income.
Common equity tier 1 capital (‘CET1’) The highest quality form of regulatory capital under Basel III that comprises common shares issued and related share premium, retained earnings and other reserves excluding the cash flow hedging reserve, less specified regulatory adjustments.
Comprehensive risk measure (‘CRM’) The comprehensive risk measure model covers all positions that are part of the correlation trading portfolio. Comprehensive risk measure covers all price risks including spread, default and migration. Like incremental risk charge, it is calibrated to a 99.9 percentile loss and a one-year capital horizon to generate a capital add-on to VAR.
Conduits HSBC sponsors and manages multi-seller conduits and SICs. The multi-seller conduits hold interests in diversified pools of third-party assets such as vehicle loans, trade receivables and credit card receivables funded through the issuance of short-dated commercial paper and supported by a liquidity facility. The SICs hold predominantly asset-backed securities referencing such items as commercial and residential mortgages, vehicle loans and credit card receivables funded through the issuance of both long-term and short-term debt.
Consumer Mortgage and Lending (‘CML’)
In the US, the CML portfolio consists of our Consumer Lending and Mortgage Services businesses, which are in run-off.
The Consumer Lending business offered secured and unsecured loan products, such as first and second lien mortgage loans, open-ended home equity loans and personal non-credit card loans through branch locations and direct mail. The majority of the mortgage lending products were for refinancing and debt consolidation rather than home purchases. In the first quarter of 2009, we discontinued all originations by our Consumer Lending business.
Prior to the first quarter of 2007, when we ceased new purchase activity, the Mortgage Services business purchased non-conforming first and second lien real estate secured loans from unaffiliated third parties. The business also included the operations of Decision One Mortgage Company (‘Decision One’), which historically originated mortgage loans sourced by independent mortgage brokers and sold these to secondary market purchasers. Decision One ceased originations in September 2007.
Core tier 1 capital The highest quality form of regulatory capital under Basel II that comprises total shareholders’ equity and related non-controlling interests, less goodwill and intangible assets and certain other regulatory adjustments.
Core tier 1 ratio Core tier 1 capital as a percentage of risk weighted assets. Countercyclical capital buffer A capital buffer, prescribed by regulators under Basel III, which aims to ensure that capital
requirements take account of the macro-financial environment in which banks operate. This will provide the banking sector with additional capital to protect it against potential future losses, when excess credit growth in the financial system as a whole is associated with an increase in system-wide risk.
Counterparty credit risk (‘CCR’) Counterparty credit risk, in both the trading and non-trading books, is the risk that the counterparty to a transaction may default before completing the satisfactory settlement of the transaction.
Credit default swap (‘CDS’) A derivative contract whereby a buyer pays a fee to a seller in return for receiving a payment in the event of a defined credit event (e.g. bankruptcy, payment default on a reference asset or assets, or downgrades by a rating agency) on an underlying obligation (which may or may not be held by the buyer).
Credit enhancements Facilities used to enhance the creditworthiness of financial obligations and cover losses due to asset default.
Credit quality step A step in the FSA credit quality assessment scale which is based on the credit ratings of ECAIs. It is used to assign risk weights under the standardised approach.
Credit risk Risk of financial loss if a customer or counterparty fails to meet an obligation under a contract. It arises mainly from direct lending, trade finance and leasing business, but also from products such as guarantees, derivatives and debt securities.
Credit risk mitigation A technique to reduce the credit risk associated with an exposure by application of credit risk mitigants such as collateral, guarantees and credit protection.
Credit spread option A derivative that transfers risk from one party to another. The buyer pays an initial premium in exchange for potential cash flows if the credit spread changes from its current level.
Credit Support Annex (‘CSA’) A legal document that regulates credit support (collateral) for OTC derivative transactions between two parties.
Credit valuation adjustment (‘CVA’) An adjustment to the valuation of OTC derivative contracts to reflect the creditworthiness of OTC derivative counterparties.
Customer risk rating (‘CRR’) An internal scale of 23 grades measuring obligor PD.

H S B C H O L D I N G S P L C
Capital and Risk Management Pillar 3 Disclosures at 31 December 2012 (continued)
Page 82
Term Definition
D
Debit valuation adjustment (‘DVA’) An adjustment made by an entity to the valuation of OTC derivative liabilities to reflect within fair value the entity’s own credit risk.
Delinquency See ‘Arrears’. Debt securities Financial assets on the Group’s balance sheet representing certificates of indebtedness of
credit institutions, public bodies or other undertakings, excluding those issued by central banks.
E
Economic capital The internally calculated capital requirement which is deemed necessary by HSBC to support the risks to which it is exposed.
Equity risk The risk arising from positions, either long or short, in equities or equity-based instruments, which create exposure to a change in the market price of the equities or equity instruments.
EU European Union. Expected loss (‘EL’) A regulatory calculation of the amount expected to be lost on an exposure using a 12-month
time horizon and downturn loss estimates. EL is calculated by multiplying the PD (a percentage) by the EAD (an amount) and LGD (a percentage).
Exposure A claim, contingent claim or position which carries a risk of financial loss. Exposure at default (‘EAD’) The amount expected to be outstanding after any credit risk mitigation, if and when the
counterparty defaults. EAD reflects drawn balances as well as allowance for undrawn amounts of commitments and contingent exposures.
Exposure value Exposure at default. External Credit Assessment Institutions
(‘ECAI’) ECAIs include external credit rating agencies such as Standard & Poor’s, Moody’s and Fitch.
F Fair value Fair value is the amount for which an asset could be exchanged, or a liability settled, between
knowledgeable, willing parties in an arm’s length transaction. Financial collateral comprehensive
method This method applies a volatility adjustment (or ‘haircut’) to the value of the collateral to allow
for the fact that the collateral taken may fall in value when it comes to taking control of the collateral and selling it. This adjusted collateral value is then subtracted from the exposure to create an ‘adjusted exposure’. Firms on the standardised approach will then apply the risk weight of the borrower to the adjusted exposure value, while firms using foundation IRB make a formulaic adjustment to the LGD number which has a similar effect. To calculate these ‘haircuts’, the firm can use either a table of supervisory numbers or its own numbers if it meets certain requirements.
Fitch Fitch Group. Five filters An internal measure designed to improve capital deployment across the Group. This examines
the strategic relevance of each business in each country, in terms of connectivity and economic development, and the current returns, in terms of profitability, cost efficiency and liquidity.
Forbearance A term generally applied to arrangements provided to support borrowers experiencing temporary financial difficulty. Such arrangements include reduced or nil payments, term extensions, transfers to interest only and the capitalisation of arrears.
FSA Financial Services Authority (UK). FSA Standard rules The method prescribed by the FSA for calculating market risk capital requirements in the
absence of VAR model approval.
G GCRO Group Chief Risk Officer. GENPRU The FSA’s rules, as set out in the General Prudential Sourcebook. Global Markets HSBC’s treasury and capital markets services in Global Banking and Markets. Global Systemically Important Bank (‘G-SIB’)
In parallel with the Basel III proposals, the Basel Committee issued a consultative document in July 2011, ‘Global systemically important banks: assessment methodology and the additional loss absorbency requirement’. In November 2011, it published its rules and the Financial Stability Board (‘FSB’) issued the initial list of global systemically important banks (‘G-SIB’s). This list, which included HSBC and 28 other major banks from around the world, will be re-assessed periodically through annual re-scoring of the individual banks and a triennial review of the methodology.

H S B C H O L D I N G S P L C
Capital and Risk Management Pillar 3 Disclosures at 31 December 2012 (continued)
Page 83
Term Definition
The requirements, initially for those banks identified in November 2014 as G-SIBs, will be phased in from 1 January 2016, becoming fully effective on 1 January 2019. National regulators have discretion to introduce higher thresholds than the minima. In November 2012, the FSB published a revised list of G-SIBs and their current assessment of the appropriate capital charge. HSBC was assigned an add-on of 2.5%.
GMB Group Management Board. GRC Group Risk Committee. Group HSBC Holdings together with its subsidiary undertakings. Government-sponsored enterprises
(‘GSEs’) A group of financial services enterprises created by the US Congress. Their function is to
reduce the cost of capital for certain borrowing sectors of the economy, and to make them more efficient and transparent. Examples in the residential mortgage borrowing segment are Freddie Mac and Fannie Mae. GSEs carry the implicit backing, but are not direct obligations, of the US Government.
H Haircut A discount applied by management when determining the amount at which an asset can be
realised. The discount takes into account the method of realisation including the extent to which an active market for the asset exists. With respect to credit risk mitigation, a downward adjustment to collateral value to reflect any currency or maturity mismatches between the credit risk mitigant and the underlying exposure to which it is being applied. Also a valuation adjustment to reflect any fall in value between the date the collateral was called and the date of liquidation or enforcement.
Held-to-maturity An accounting classification for investments acquired with the intention and ability of being held until they mature.
Hong Kong The Hong Kong Special Administrative Region of the People’s Republic of China. HSBC HSBC Holdings together with its subsidiary undertakings. HSBC Bank HSBC Bank plc, formerly Midland Bank plc. HSBC Holdings HSBC Holdings plc, the parent company of HSBC.
I
IFRSs International Financial Reporting Standards. Impaired loans Loans where the Group does not expect to collect all the contractual cash flows or expects to
collect them later than they are contractually due. Impairment allowances Management’s best estimate of losses incurred in the loan portfolios at the balance sheet date. Incremental risk charge (‘IRC’) The IRC model captures the potential distribution of profit and loss due to default and
migration for a portfolio of credit positions. For credit positions held on the trading book, and subject to specific interest rate risk VAR for regulatory capital, an IRC based on the 99.9th percentile of the IRC distribution, over a one-year capital horizon, is used as a capital add-on to VAR.
Institutions Under the standardised approach, Institutions comprise credit institutions or investment firms. Under the IRB approach, Institutions also include regional governments and local authorities, public sector entities and multilateral development banks.
Insurance risk A risk, other than financial risk, transferred from the holder of a contract to the insurance provider. The principal insurance risk is that, over time, the combined cost of claims, administration and acquisition of the contract may exceed the aggregate amount of premiums received and investment income.
Interest rate risk (‘IRR’) Exposure to adverse movements in interest rates. Accepting this risk is a normal part of banking and can be an important source of profitability and shareholder value.
Internal Assessment Approach (‘IAA’)
One of three calculation methods defined under the IRB approach to securitisations. The IAA is limited to exposures arising from asset-backed commercial paper programmes, mainly related to liquidity facilities and credit enhancement. Eligible ECAI rating methodology is applied to each asset class in order to derive the equivalent rating level for each transaction. This methodology is verified by the internal Credit function as part of the approval process for each new transaction. The performance of each underlying asset portfolio is monitored to confirm that the applicable equivalent rating level still applies and is independently verified.
Internal Capital Adequacy Assessment Process (‘ICAAP’)
The Group’s own assessment of the levels of capital that it needs to hold through an examination of its risk profile from regulatory and economic capital viewpoints.
Internal Model Method (‘IMM’) One of three approaches defined by Basel II to determine exposure values for counterparty credit risk.
Internal ratings-based approach (‘IRB’)
A method of calculating credit risk capital requirements using internal, rather than supervisory, estimates of risk parameters.
Invested capital Equity capital invested in HSBC by its shareholders, adjusted for certain reserves and goodwill previously amortised or written off.

H S B C H O L D I N G S P L C
Capital and Risk Management Pillar 3 Disclosures at 31 December 2012 (continued)
Page 84
Term Definition
IRB advanced approach (‘AIRB’) A method of calculating credit risk capital requirements using internal PD, LGD and EAD models.
IRB foundation approach (‘FIRB’) A method of calculating credit risk capital requirements using internal PD models but with supervisory estimates of LGD and conversion factors for the calculation of EAD.
ISDA International Swaps and Derivatives Association. ISDA Master agreement Standardised contract developed by ISDA used as an umbrella contract under which bilateral
derivatives contracts are entered into.
L
Leverage ratio A measure, prescribed by regulators under Basel III, which is the ratio of tier 1 capital to total exposures. Total exposures include on-balance sheet items, off-balance sheet items and derivatives, and should generally follow the accounting measure of exposure. This supplementary measure to the risk-based capital requirements is intended to constrain the build-up of excess leverage in the banking sector.
Libor London Interbank Offer rate. Liquidity risk The risk that HSBC does not have sufficient financial resources to meet its obligations as they
fall due, or will have to do so at an excessive cost. This risk arises from mismatches in the timing of cash flows.
Loss given default (‘LGD’) The estimated ratio (percentage) of the loss on an exposure to the amount outstanding at default (EAD) upon default of a counterparty.
M
Market risk The risk that movements in market risk factors, including foreign exchange rates and commodity prices, interest rates, credit spreads and equity prices will reduce income or portfolio values.
Mark-to-market approach One of three approaches defined by Basel II to determine exposure values for counterparty credit risk.
MENA The Middle East and North Africa. Model validation The process of assessing how well a credit risk model performs using a predefined set of
criteria including the discriminatory power of the model, the appropriateness of the inputs, and expert opinion.
Moody’s Moody’s Investor Service.
N Net interest income The amount of interest received or receivable on assets net of interest paid or payable on
liabilities.
O Obligor grade Obligor grades, summarising a more granular underlying counterparty risk rating scale for
estimates of PD, are defined as follows: • ‘Minimal Default Risk’: The strongest credit risk, with a negligible PD. • ‘Low Default Risk’: A strong credit risk, with a low PD. • ‘Satisfactory Default Risk’: A good credit risk, with a satisfactory PD. • ‘Fair Default Risk’: The risk of default remains fair, but identified weaknesses may
warrant more regular monitoring. • ‘Moderate Default Risk’: The overall position will not be causing any immediate
concern, but more regular monitoring will be necessary as a result of sensitivities to external events that give rise to the possibility of risk of default increasing.
• ‘Significant Default Risk’: Performance may be limited by one or more troublesome aspects, known deterioration, or the prospect of worsening financial status. More regular monitoring required.
• ‘High Default Risk’: Continued deterioration in financial status, that requires frequent monitoring and ongoing assessment. The PD is of concern but the borrower currently has the capacity to meet its financial commitments.
• ‘Special Management’: The PD is of increasing concern and the borrower’s capacity to fully meet its financial commitments is becoming increasingly less likely.
• ‘Default’: A default is considered to have occurred with regard to a particular obligor when either or both of the following events has taken place: the Group considers that the obligor is unlikely to pay its credit obligations in full, without recourse by the Group to actions such as realising security; or the obligor is past due more than 90 days, (90 days to 180 days for retail), on any material credit obligation to the Group.

H S B C H O L D I N G S P L C
Capital and Risk Management Pillar 3 Disclosures at 31 December 2012 (continued)
Page 85
Term Definition
Operational risk The risk of loss resulting from inadequate or failed internal processes, people and systems, or from external events, including legal risk.
ORMF Operational Risk Management Framework. Over-the-counter (‘OTC’) A bilateral transaction (e.g. derivatives) that is not exchange traded and that is valued using
valuation models.
P
Pillar 1 Minimum capital requirements - the part of the Basel Accord setting out the calculation of regulatory capital for credit, market, and operational risk.
Pillar 2 The supervisory review process - the part of the Basel Accord which sets out the process by which a bank should review its overall capital adequacy and the processes under which the supervisors evaluate how well financial institutions are assessing their risks and take appropriate actions in response to the assessments.
Pillar 3 Market discipline - the part of the Basel Accord, which sets out the disclosure requirements for banks to publish certain details of their risks, capital and risk management, with the aim of strengthening market discipline.
Point-in-time (‘PIT’) Estimates of PD (or other measures) generally covering a short time horizon (usually a 12 month period) and that are sensitive to changes in the economic cycle. This differs from a TTC basis which uses long run average economic and risk data to reduce such sensitivity.
Private equity investments Equity securities in operating companies not quoted on a public exchange, often involving the investment of capital in private companies or the acquisition of a public company that results in its delisting.
Probability of default (‘PD’) The probability that an obligor will default within a one-year time horizon.
Q
Qualifying revolving retail exposures
Retail IRB exposures that are revolving, unsecured, and, to the extent they are not drawn, immediately and unconditionally cancellable, such as credit cards.
R
Ratings Based Method (‘RBM’) One of three calculation methods defined under the IRB approach to securitisations. The approach uses risk weightings based on ECAI ratings, the granularity of the underlying pool and the seniority of the position and whether it is a re-securitisation.
Reference PD HSBC’s master CRR scale has been constructed using a set of PD points, falling at regular intervals along an exponential PD curve and determining the boundaries of 23 CRR bands. Reference PDs have been determined, which for most bands fall mid-way between that band’s boundary PD points. The determination of the bands and corresponding reference PDs takes into account the need to avoid concentration in any one band, and to ensure effective mapping to risk management portfolio quality scales.
Regulatory capital The capital which HSBC holds, determined in accordance with rules established by the FSA for the consolidated Group and by local regulators for individual Group companies.
Re-securitisation A securitisation of a securitisation exposure, where the risk associated with an underlying pool of exposures is tranched and at least one of the underlying exposures is a securitisation exposure.
Residential Mortgaged Backed Securities (‘RMBSs’)
A type of security whose cash flows come from residential debt such as mortgages, home-equity loans and subprime mortgages.
Residual maturity The period outstanding from the reporting date to the maturity or end date of an exposure. Restricted Shares Awards that define the number of HSBC Holdings ordinary shares to which the employee will
become entitled, generally between one and three years from the date of the award, and normally subject to the individual remaining in employment. The shares to which the employee becomes entitled may be subject to retention requirement.
Retail Internal Ratings Based (‘Retail IRB’) approach
Retail exposures that are treated under the IRB approach.
Return on equity Profit attributable to ordinary shareholders divided by average invested capital. Risk appetite An assessment of the types and quantum of risks to which HSBC wishes to be exposed. Risk-weighted assets (‘RWAs’) Calculated by assigning a degree of risk expressed as a percentage (risk weight) to an exposure
value in accordance with the applicable Standardised or IRB approach rules. RMM Risk Management Meeting of the GMB. Run-off portfolios Legacy credit in GB&M, the US CML portfolio and other US run-off portfolios, including the
treasury services related to the US CML businesses and commercial operations in run-off. Origination of new business in the run-off portfolios has been discontinued and balances are being managed down through attrition and sale.

H S B C H O L D I N G S P L C
Capital and Risk Management Pillar 3 Disclosures at 31 December 2012 (continued)
Page 86
Term Definition
RWA density The average risk weight, expressed as a percentage of RWAs divided by exposure value, based on those RWA and exposure value numbers before they are rounded to the nearest US$0.1bn for presentation purposes.
S
S&P Standard and Poor’s Rating Group. Securitisation A transaction or scheme whereby the credit risk associated with an exposure, or pool of
exposures, is tranched and where payments to investors in the transaction or scheme are dependent upon the performance of the exposure or pool of exposures.
A traditional securitisation involves the transfer of the exposures being securitised to an SPE which issues securities. In a synthetic securitisation, the tranching is achieved by the use of credit derivatives and the exposures are not removed from the balance sheet of the originator.
Securities Financing Transactions (‘SFT’)
The act of loaning a stock, derivative, or other security to an investor or firm.
SIC Securities Investment Conduit, see Conduit. Significant Influence Function FSA registered role, recognised as being a control function role. SME Small and Medium-sized Enterprises. Sovereign exposures Exposures to governments, ministries, departments of governments, embassies, consulates and
exposures on account of cash balances and deposits with central banks. Specialised lending exposure Specialised lending exposures are defined by the FSA as exposures to an entity which was
created specifically to finance and/or operate physical assets, where the contractual arrangements give the lender a substantial degree of control over the assets and the income that they generate and the primary source of repayment of the obligation is the income generated by the assets being financed, rather than the independent capacity of a broader commercial enterprise.
Special Purpose Entity (‘SPE’) A corporation, trust or other non-bank entity, established for a narrowly defined purpose, including for carrying on securitisation activities. The structure of the SPE and its activities are intended to isolate its obligations from those of the originator and the holders of the beneficial interests in the securitisation.
Specific issuer risk Specific issuer (credit spread) risk arises from a change in the value of debt instruments due to a perceived change in the credit quality of the issuer or underlying assets.
Standardised approach (‘STD’) In relation to credit risk, a method for calculating credit risk capital requirements using ECAI ratings and supervisory risk weights.
In relation to operational risk, a method of calculating the operational capital requirement by the application of a supervisory defined percentage charge to the gross income of eight specified business lines.
Stressed VAR Stressed VAR is the measure of VAR using a specific, continuous one-year period of stress of the trading portfolio.
Subordinated liabilities Liabilities which rank after the claims of other creditors of the issuer in the event of insolvency or liquidation.
Supervisory Formula Method (‘SFM’)
An alternative Ratings Based Method to be used primarily on sponsored securitisations. It is used to calculate the capital requirements of exposures to a securitisation as a function of the collateral pool and contractual properties of the tranche or tranches retained.
Supervisory slotting approach A method for calculating capital requirements for Specialised lending exposures where the internal rating of the obligor is mapped to one of five supervisory categories, each associated with a specific supervisory risk weight.
T
Through-the-cycle (‘TTC’) A rating methodology which seeks to take cyclical volatility out of the estimation of default risk by assessing a borrower's performance over the business cycle.
Tier 1 capital A component of regulatory capital, comprising core tier 1 capital and other tier 1 capital. Other tier 1 capital includes qualifying capital instruments such as non-cumulative perpetual preference shares and hybrid capital securities.
Tier 1 capital ratio The ratio expresses tier 1 capital as a percentage of risk weighted assets. Tier 2 capital A component of regulatory capital, comprising qualifying subordinated loan capital, related non-
controlling interests, allowable collective impairment allowances and unrealised gains arising on the fair valuation of equity instruments held as available-for-sale. Tier 2 capital also includes reserves arising from the revaluation of properties.
Total return swap A credit derivative transaction that swaps the total return on a financial instrument (cash flows and capital gains and losses), for a guaranteed interest rate, such as an inter-bank rate, plus a margin.

H S B C H O L D I N G S P L C
Capital and Risk Management Pillar 3 Disclosures at 31 December 2012 (continued)
Page 87
Term Definition
Trading book Positions in financial instruments and commodities held either with intent to trade or in order to hedge other elements of the trading book. To be eligible for trading book capital treatment, financial instruments must either be free of any restrictive covenants on their tradability or able to be hedged completely.
U UK United Kingdom. US United States of America.
V Value at risk (‘VAR’) A measure of the loss that could occur on risk positions as a result of adverse movements in
market risk factors (e.g. rates, prices, volatilities) over a specified time horizon and to a given level of confidence.
W Wrong-way risk An adverse correlation between the counterparty’s PD and the mark-to-market value of the
underlying transaction.

H S B C H O L D I N G S P L C
Capital and Risk Management Pillar 3 Disclosures at 31 December 2012 (continued)
Page 88
Appendix VI
Contacts
London Hong Kong Media enquiries to: Media enquiries to: Patrick Humphris Gareth Hewett Telephone: +44(0)20 7992 1631 Telephone: +852 2822 4929 Investor relations enquiries to: Investor relations enquiries to: Guy Lewis Hugh Pye Senior Manager Investor Relations Head of Investor Relations (Asia) Telephone: +44 (0)20 7992 1938 Telephone: +852 2822 4908 Chicago Paris Media enquiries to: Media enquiries to: Diane Bergan Sophie Ricord Telephone +1 224 880 8055 Telephone: +33 1 40 70 33 05 Investor relations enquiries to: Investor relations enquiries to: Cliff Mizialko Marc Cuchet Senior Vice President SEC Reporting Telephone +33 1 41 02 41 91 and Investor Relations Telephone: +1 224 880 8008

HSBC Holdings plc8 Canada SquareLondon E14 5HQUnited KingdomTelephone: 44 020 7991 8888www.hsbc.com