hsbc holdings plc€¦ · connecting customers to opportunities hsbc aims to be where the growth...
TRANSCRIPT

HSBC Holdings plcStrategic Report 2017

Connecting customers to opportunitiesHSBC aims to be where the growth is, enabling
business to thrive and economies to prosper, and
ultimately helping people to fulfil their hopes and
realise their ambitions.
Our cover imageGuangzhou is one of China’s largest and most dynamic cities. It is the capital of Guangdong Province and lies at the heart of China’s Pearl River Delta (PRD), one of the country’s fastest growing economic regions. The PRD in recent years has transformed from being the exporting factory floor of the world into a global leader in digital commerce and innovation. HSBC has had a presence in China for more than 150 years. China is an important part of the Group’s strategy and we have branches across the PRD. In December 2017 HSBC Qianhai Securities Limited, the first joint venture securities company in mainland China to be majority-owned by a foreign bank, opened for business in the PRD.
Inside front cover imageDubai financial district.
Our photo competition winnersThis report showcases five images taken by our employees around the world. The images were selected from more than 2,100 submissions to a Group-wide photography competition. Launched in June 2017, HSBC NOW Photo is an ongoing project that encourages employees to capture and share the diverse world around them with a camera.
ww
Contents
This Strategic Report was approved by the Board on 20 February 2018.
Mark E Tucker Group Chairman
2 Highlights4 Group Chairman’s Statement 7 Group Chief Executive’s Review
10 Our strategy12 Strategic actions
14 Reported results15 Adjusted performance17 Balance sheet and capital17 Delivery against Group
financial targets
18 Retail Banking and Wealth Management
19 Commercial Banking20 Global Banking and Markets21 Global Private Banking21 Corporate Centre
22 Customers24 Our employees25 Other26 Sustainable finance27 Task Force on Climate-related
Financial Disclosures
28 Managing risk28 Top and emerging risks
30 Remuneration principles30 Embedding our values in our
remuneration framework31 How we set our variable pay pool31 Remuneration for our
executive Directors
32 Footnotes
33 Status of the Strategic Report 201733 Copies of the Annual Report and
Accounts 201734 Shareholder enquiries and
communications36 Report of the auditors36 Certain defined terms36 Photography
Overview
Strategy
Financial overview
Global businesses
How we do business
Risk overview
Remuneration
Footnotes
Supplementary information
Our valuesOur values define who we are as an organisation and make us distinctive.
DependableWe are dependable, standing firm for what is right and delivering on commitments.
OpenWe are open to different ideas and cultures, and value diverse perspectives.
ConnectedWe are connected to our customers, communities, regulators and each other, caring about individuals and their progress.
As a reminderReporting currencyWe use US dollars.
Adjusted measuresWe supplement our IFRS figures with adjusted measures used by management internally. These measures are highlighted with the following symbol:
Further explanation may be found on page 32 of the Annual Report and Accounts 2017.
HSBC Holdings plc Strategic Report 2017 1

Strategic Report
HighlightsOur international network, universal banking model
and capital strength deliver long-term value for
customers and shareholders.
Group
Strategy execution About HSBC
(2016: $7.1bn)
$17.2bn
(2016: $857bn)
$871bn
(2016: $18.9bn)
$21.0bn(2016: $48.0bn)
$51.4bn
(2016: 13.6%)
14.5%
For year ended 31 Dec 2017
At 31 Dec 2017
(2016: $2,375bn)
$2,522bn
18.8
18.9
21.0
Adjusted profit before tax ($bn)
2017
2016
201518.9
7.1
17.2
Reported profit before tax($bn)
2017
2016
2015
1,103
857
871
Reported risk-weighted assets($bn)
2017
2016
2015 11.9
13.6
14.5
Common equity tier 1 ratio(%)
2017
2016
2015 2,410
2,375
2,522
Total assets($bn)
2017
2016
2015
59.8
48.0
51.4
Reported revenue($bn)
2017
2016
2015
–Delivered growth from our international network with
a 6% increase in transaction banking product revenue
and a 13% rise in revenue synergies between global
businesses compared with 2016.
–Achieved annualised run-rate savings of $6.1bn since
our Investor Update in 2015, while continuing to invest
in growth, and regulatory programmes and compliance;
2017 exit run-rate in line with 2014 cost base.
–Exceeded our risk-weighted assets (‘RWAs’) reduction
target; extracting a total of $338bn of RWAs from the
business since the start of 2015.
–Pivot to Asia generating returns and driving over 75%
of Group reported and adjusted profit in 2017.
–Delivered a return on equity of 5.9% in 2017, up from
0.8% in 2016. We will continue to invest for growth
and manage our capital efficiently to achieve our
medium-term ROE target of >10%.
* Full-time equivalent staff
We employ
229,000people around the world*.
We have
200,000shareholders in
131 countries and territories.
Around
38 millioncustomers bank with us.
Today, HSBC has around
3,900offices in 67 countries
and territories worldwide.
2 HSBC Holdings plc Strategic Report 2017
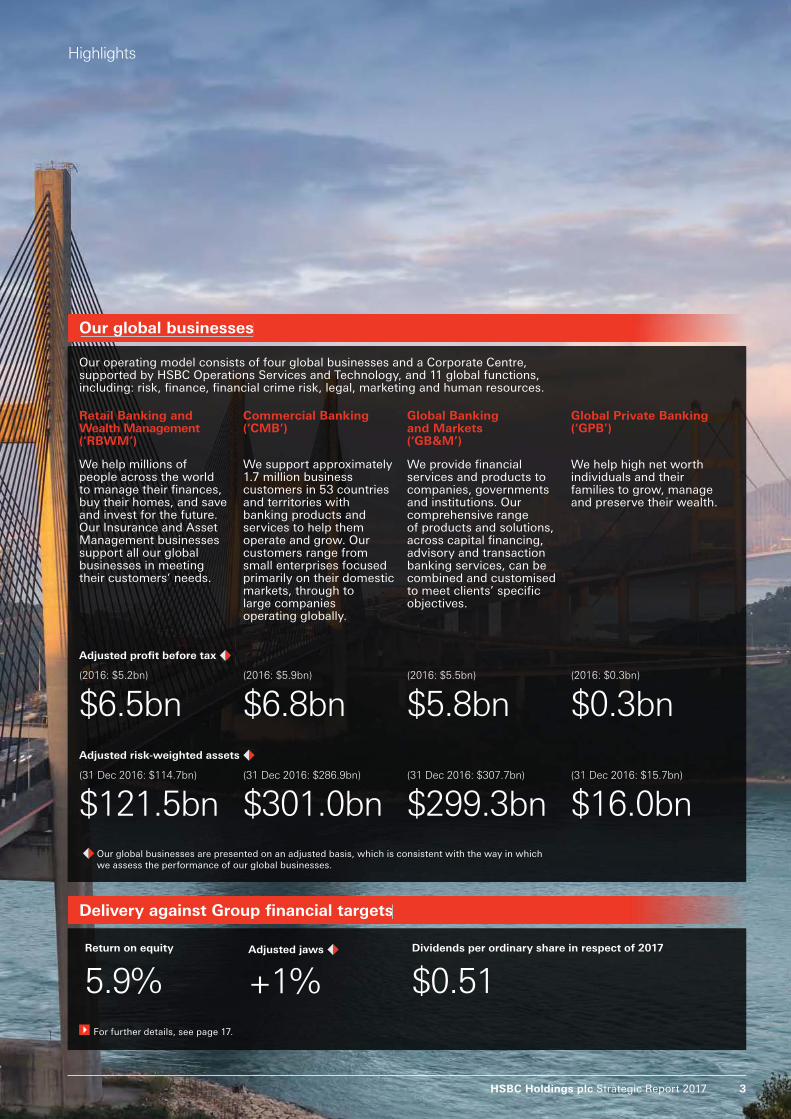
Our global businesses
Retail Banking and Wealth Management (‘RBWM’)
Commercial Banking (‘CMB’)
Global Banking and Markets (‘GB&M’)
Global Private Banking (‘GPB’)
We help millions of people across the world to manage their finances, buy their homes, and save and invest for the future. Our Insurance and Asset Management businesses support all our global businesses in meeting their customers’ needs.
We support approximately 1.7 million business customers in 53 countries and territories with banking products and services to help them operate and grow. Our customers range from small enterprises focused primarily on their domestic markets, through to large companies operating globally.
We provide financial services and products to companies, governments and institutions. Our comprehensive range of products and solutions, across capital financing, advisory and transaction banking services, can be combined and customised to meet clients’ specific objectives.
We help high net worth individuals and their families to grow, manage and preserve their wealth.
Adjusted profit before tax
(2016: $5.2bn) (2016: $5.9bn) (2016: $5.5bn) (2016: $0.3bn)
$6.5bn $6.8bn $5.8bn $0.3bn
Adjusted risk-weighted assets
(31 Dec 2016: $114.7bn) (31 Dec 2016: $286.9bn) (31 Dec 2016: $307.7bn) (31 Dec 2016: $15.7bn)
$121.5bn $301.0bn $299.3bn $16.0bn
Delivery against Group financial targets
Return on equity
5.9%
Adjusted jaws
+1%
Dividends per ordinary share in respect of 2017
$0.51
For further details, see page 17.
Highlights
Our global businesses are presented on an adjusted basis, which is consistent with the way in which we assess the performance of our global businesses.
Our operating model consists of four global businesses and a Corporate Centre, supported by HSBC Operations Services and Technology, and 11 global functions, including: risk, finance, financial crime risk, legal, marketing and human resources.
HSBC Holdings plc Strategic Report 2017 3

Group Chairman’s StatementWith an international network covering 90% of global trade
flows and a leading presence in the world’s fastest growing
region, we are in a prime position to help our customers
capitalise on broad-based global growth.
Board changes
As I start my first full year as Group Chairman,
I am very grateful to my predecessor, Douglas
Flint, and to Stuart Gulliver for ensuring a smooth
handover. They steered HSBC through challenging
waters during and after the global financial crisis,
and renewed HSBC’s reputation as one of the
world’s strongest and safest international banks.
They have passed on a strong legacy.
My first responsibility as Group Chairman was
to appoint a successor to Stuart who would be
capable of building on his achievements while
further enhancing the qualities that make HSBC
unique. With an exceptional record of managing
a diverse range of international businesses and
a deep understanding of HSBC’s heritage and
culture, John Flint was clearly the outstanding
candidate. The Board and I look forward to working
closely with John and his management team.
2017 also saw other Board changes as we said
goodbye to Rachel Lomax, Sam Laidlaw and Paul
Walsh. All three provided valuable service and wise
counsel to the Board and I thank them warmly for
their advice and support. I am especially grateful
to Rachel for her excellent work as the Senior
Independent Director and to Sam for his thoughtful
leadership of the Nomination Committee.
Our 2017 results demonstrate both the strength
and the potential of the Group. A large increase
in reported profit before tax reflected both a
healthy business and the non-recurrence of
significant items from 2016. All of our global
businesses grew adjusted profits and our three
main global businesses generated improved
adjusted revenue.
Strong revenue growth more than covered the cost
of business investment, and increased lending laid
a foundation for future performance. Asia again
contributed a substantial proportion of the Group’s
profits, particularly in Commercial Banking and
Retail Banking and Wealth Management. Together,
this delivered an adjusted Group profit before tax
of $21bn, up 11% on 2016.
This performance has enabled us to approve an
unchanged fourth interim dividend of $0.21.
This brings the total dividend for 2017 to $0.51,
representing a total shareholder return of 24%
for 2017.
Strategic Report
4 HSBC Holdings plc Strategic Report 2017
Mark E Tucker Group Chairman
The year ahead
The Board is focused on sustaining resilience by
enhancing reputation and performance. We will
further develop our strategy to deliver value to
all of our stakeholders within a governance
framework that provides stability, prudence
and effective oversight.
‘As a well-diversified business underpinned
by historically stable revenue generation and
significant capital strength, HSBC is well
equipped to manage the risks and uncertainty
inherent in today’s world.’
Group Chairman’s Statement
We expect the world’s major economies to show
reasonable growth in 2018, helped by relatively
low unemployment, recovering consumer
confidence and improving trade. Fears of a
hard landing in China have receded, and
markets across Asia look set for a strong year.
The anticipated conclusion of large regional
trade agreements in 2018, mostly involving
Asian nations, also provides cause for optimism.
With an international network covering 90% of
global trade flows and a leading presence in the
world’s fastest growing region, we are in a prime
position to help our customers capitalise on
this broad-based global growth.
While we are optimistic about the prospects for
the global economy, rising international tensions,
the threat of protectionism and a lack of inclusive
growth all have the potential to disrupt economic
activity. We continue to model and anticipate a
wide range of scenarios as part of our day-to-day
risk management, to cover unlikely but not
impossible events. As a well-diversified business
underpinned by historically stable revenue
generation and significant capital strength,
HSBC is well equipped to manage the risks
and uncertainty inherent in today’s world.
HSBC Holdings plc Strategic Report 2017 5
Strategic Report | Group Chairman’s Statement
Transparency and disclosure
Last year, we published a range of environmental,
social and governance (‘ESG’) metrics to enable
investors and customers to assess our non-
financial performance. The data we disclose will
continue to evolve as we learn more about what
our stakeholders find useful and improve our
ability to collect the necessary information.
We will publish our next ESG Update on our
website in April 2018.
We are also making our first disclosure under the
terms of the Financial Stability Board’s Task Force
on Climate-related Financial Disclosures. This
can be found on page 27. As one of the world’s
largest international banks, we take seriously
our responsibility to help develop a voluntary,
consistent and comparable system of climate-
related financial disclosure. We intend to continue
to expand and improve the quality and specificity
of these disclosures, and to encourage all those
who work with us to do the same. Mark E TuckerGroup Chairman20 February 2018
Supporting our people
It is important not just to achieve good results,
but to do so in a way that treats all of our
stakeholders – employees, customers, regulators
and shareholders – in a fair and transparent way.
We are committed to holding ourselves to account
in meeting that aim, and to being accountable to
our stakeholders for our actions.
As part of this commitment, the Board and I are
determined to ensure that HSBC remains a place
where all our people have the opportunity to
fulfil their potential in a nurturing environment
that encourages the right behaviour. Our
stakeholders expect honesty and integrity and
we will continue to promote a culture in which
people do the right thing.
My special thanks are due on behalf of the Board
to each of the 229,000 people who work for HSBC
around the world. In my short time as Group
Chairman I have been enormously impressed by
the effort, energies and ability of our people in
each country I have visited. These results are a
testament to their hard work and dedication.
‘It is important not just to achieve good results,
but to do so in a way that treats all of our
stakeholders in a fair and transparent way.’
6 HSBC Holdings plc Strategic Report 2017

Group Chief Executive’s Review
Group Chief Executive’s ReviewHSBC is simpler, stronger and more secure than it
was in 2011, and better able to connect customers to
opportunities in the world’s fastest growing regions.
Business performance
Retail Banking and Wealth Management had
an excellent 2017, with strong adjusted revenue
increases across a number of business lines.
In Retail Banking, interest rate rises helped to
grow revenue as our robust balance sheet and
capital strength continued to attract deposits,
particularly in Hong Kong. We continued to grow
lending in our target markets, especially Hong
Kong, the UK and Mexico. Wealth Management
benefited from improving customer investment
appetite, strong product sales across all
categories and the impact of market movements
on our life insurance manufacturing businesses.
Commercial Banking adjusted revenue grew well
on the back of an outstanding performance in
Global Liquidity and Cash Management. Higher
lending volumes helped Credit and Lending
overcome the impact of narrower spreads. Global
Trade and Receivables Finance revenue stabilised
after a difficult 2016 and we increased our share
of major markets, including trade finance in
Hong Kong and receivables finance in the UK.
HSBC was voted market leader for trade finance
in Euromoney’s annual trade finance survey in
January 2018.
Global Banking and Markets grew adjusted
revenue, driven particularly by strong growth
in Global Liquidity and Cash Management,
and Securities Services. Growth in the first three
quarters of the year in Markets and Banking
enabled both to withstand the effects of subdued
market activity in the fourth quarter.
Global Private Banking adjusted revenue reflected
the impact of historical repositioning, but was
stable over the course of 2017. The business grew
adjusted revenue by 10% in its target markets.
Our strong revenue generation meant that the
Group achieved positive adjusted jaws in 2017.
We accelerated investment to grow the
business, particularly in Retail Banking and
Wealth Management, which contributed to an
increase in adjusted costs. Performance-related
compensation also grew in line with profit
before tax.
2017 was an important year for HSBC. We
completed the transformation programme that
we started in 2015, maximising the benefits of
our network and increasing our competitive
advantages. By the end of the year we had
exceeded our risk-weighted asset and cost-saving
targets, rebuilt our Mexico business, delivered
revenue growth from our international network
in excess of global economic growth, and
accelerated investment in our operations in Asia.
We also opened new businesses and launched
products that considerably strengthen the service
that we offer our international clients.
These achievements, and the work that preceded
them, were a critical factor in delivering a strong
financial performance in 2017. The strength of our
three main global businesses generated significant
increases in both reported and adjusted Group
profit before tax (‘PBT’), while reported PBT also
benefited from the non-recurrence of a number
of large significant items from 2016. Adjusted PBT
and adjusted revenue were up in four out of five
regions. We grew adjusted revenue faster than
adjusted costs, and continued to increase our
market share in strategic product areas.
Stuart Gulliver Group Chief Executive
HSBC Holdings plc Strategic Report 2017 7
Our international network is now much better
able to connect customers to opportunities and
delivering revenue growth above that of the global
economy. 53% of client revenue now comes from
international clients, up from 50% in 2015. Global
Liquidity and Cash Management in particular is
now a major component of the bank’s success,
and Global Trade and Receivables Finance has
extended its leadership of the global trade
finance market.
The Group’s business mix is more oriented towards
Asia, improving our ability to channel the economic
and social changes taking place within the world’s
fastest growing region. Asia contributes a larger
proportion of the Group’s profits than in 2015,
reflecting regional investment in growing our
loan book, building our insurance and asset
management businesses, and connecting
customers to opportunities within the region.
We continued to expand our presence in mainland
China with the launch of new retail banking
products and increased lending in the Pearl River
Delta. In December we launched HSBC Qianhai
Securities, the first securities joint venture in
mainland China to be majority-owned by an
international bank. This allows us to offer our
clients increased access to China’s rapidly
expanding capital markets and provides an
unprecedented opportunity to establish and grow
a securities business in mainland China with strong
international standards. This underlines our status
as the leading international bank in mainland China.
We won a number of significant new business
mandates related to the China-led Belt and Road
Initiative in 2017, and opened new China desks in
Poland, Luxembourg, Thailand and Macau to
capture further opportunities. We now have a
total of 24 China desks aimed at supporting
Chinese businesses with global outbound
ambitions, 20 of which are along the ‘Belt and
Road’ routes. In November we were named
‘Best Bank for Belt and Road’ at the FinanceAsia
Achievement Awards 2017.
Strategic Report | Group Chief Executive's Review
Adjusted loan impairment charges were
significantly lower than 2016, mainly due
to improved conditions in the oil and gas
industry in North America.
Our strong common equity tier one ratio of 14.5%
included the effect of recent changes in US tax
legislation, which reduced our capital position by
9 basis points. It also included the impact of our
most recent $2bn share buy-back. In 2017, we
returned a total of $3bn to shareholders through
share buy-backs and paid more in dividends
than any other European or American bank.
We achieved this while maintaining one of the
strongest capital ratios in the industry.
Strategic actions
The strength of our business is due in large part
to the strategic actions that we first announced in
June 2015. This programme concluded at the end
of 2017 with eight out of ten actions completed on
time and on target (see pages 12 to 13).
HSBC is much more capital efficient and capable
of producing stronger returns for investors as a
consequence of these actions. Our cost-reduction
programmes have enabled us to absorb the cost of
growing the business and protecting HSBC from
financial crime, while improving the efficiency and
security of our processes.
Our previously underperforming Mexico business
is increasingly profitable and well positioned for
further growth. Whilst our US business remains
a work in progress, it is a valuable source of
business for other regions and continues to make
important progress. We also completed the run-off
of our legacy US consumer and mortgage lending
portfolio, bringing an end to a difficult chapter
in HSBC’s recent history.
‘We have delivered excellent value to
shareholders through a total shareholder return
of 70.3% from 2011 to the end of 2017.’
8 HSBC Holdings plc Strategic Report 2017

Fighting financial crime
For the past five years, we have been weaving
Global Standards into the fabric of HSBC. The
investment that we have made in our financial
crime risk management capabilities has
considerably strengthened our ability to protect
the integrity of the financial system. We have
assembled a highly expert team which is helping
to shape the debate about our industry’s role in
the fight against financial crime. We have made
great strides in building a compliance function fit
for the many evolving challenges we face, and
built partnerships to combat financial crime with
regulatory and law enforcement authorities
around the world.
The expiration in December of the five-year
deferred prosecution agreement that we entered
into with the US Department of Justice in 2012
(‘AML DPA’) was an important milestone for HSBC.
Nevertheless, exiting the AML DPA was a product
rather than the focus of the essential work that we
have done to transform our compliance capabilities
and protect the financial system. This work will
continue as we seek to ensure that the changes
we have made are effective and sustainable.
Combating financial crime is a never-ending
exercise and will be a constant focus for the
Group’s management.
Thank you
As I prepare to pass on the stewardship of HSBC
to my successor, I am proud of our achievements
of the last seven and a half years. After the most
extensive transformation programme in HSBC’s
153 year history, HSBC is simpler, stronger and
more secure than it was in 2011, and better able
to connect customers to opportunities in the
world’s fastest growing regions. We have also
delivered excellent value to shareholders through
a higher share price, $64.7bn in declared
dividends and $5.5bn in share buy-backs,
representing a total shareholder return of 70.3%
from 2011 to the end of 2017.
I am pleased to be handing over to such a
capable successor as John Flint, whose
intimate knowledge of HSBC and its culture
will be a considerable asset to the bank and its
clients. I am grateful to my colleagues on the
Group Management Board for their support
since 2011, and to Douglas Flint and Mark Tucker
for their backing.
Finally, my sincere thanks go to all of my HSBC
colleagues around the world, past and present,
whose hard work and commitment are the
foundation of the bank’s success. It has been my
privilege to work with them for the last 38 years.
Stuart GulliverGroup Chief Executive20 February 2018
Group Chief Executive's Review
‘My sincere thanks go to all of my HSBC
colleagues around the world, past and present,
whose hard work and commitment are the
foundation of the bank’s success.’
HSBC Holdings plc Strategic Report 2017 9

Our strategyWe have developed a long-term strategy that
reflects our purpose and enables us to capture
value from our international network.
Develop our international networkTo serve enterprises across geographies and facilitate
international trade and capital flows, thereby helping our
clients to grow their business.
Value of the network and our strategy
Access to global growth opportunitiesOur unparalleled network covers countries accounting for approximately 90% of global GDP, trade and capital flows. We have a leading presence in large and fast-growing economies.
Our network covers all of the world’s 30 largest trade corridors forecast for 2030. These top 30 corridors are expected to have a compound annual growth rate well in excess of GDP growth expectations from 2016 to 2030.
Lower risk profile and volatility from our geographically diversified universal banking modelWe operate a balanced universal banking model across both wholesale and retail businesses and we are geographically diversified. This has resulted in a lower risk profile and lower earnings volatility compared to our global peers. Our business model has remained resilient through business cycles, and it helps ensure stable funding and liquidity.
Strong capital and funding baseCET1 ratio of 14.5% supported by increased shareholders’ equity to meet new regulatory requirements since the end of 2010.
Four interconnected, global businesses share balance sheets and liquidity in addition to strong commercial links.
Stable shareholder returnsIndustry leading dividend – approximately $65bn declared from 2011 to 2017 – as well as circa $5.5bn of share repurchases.
Invest in wealth and retail businesses with local scaleTo make the most of global social mobility, wealth creation
and long-term demographic changes in our select retail
banking and wealth management markets.
Two-pronged long-term strategy
Strategic Report
10 HSBC Holdings plc Strategic Report 2017
*The scenario assumes a 66% probability of keeping the mean global surface temperature
rise throughout the 21st century to below 2°C above pre-industrialised levels.
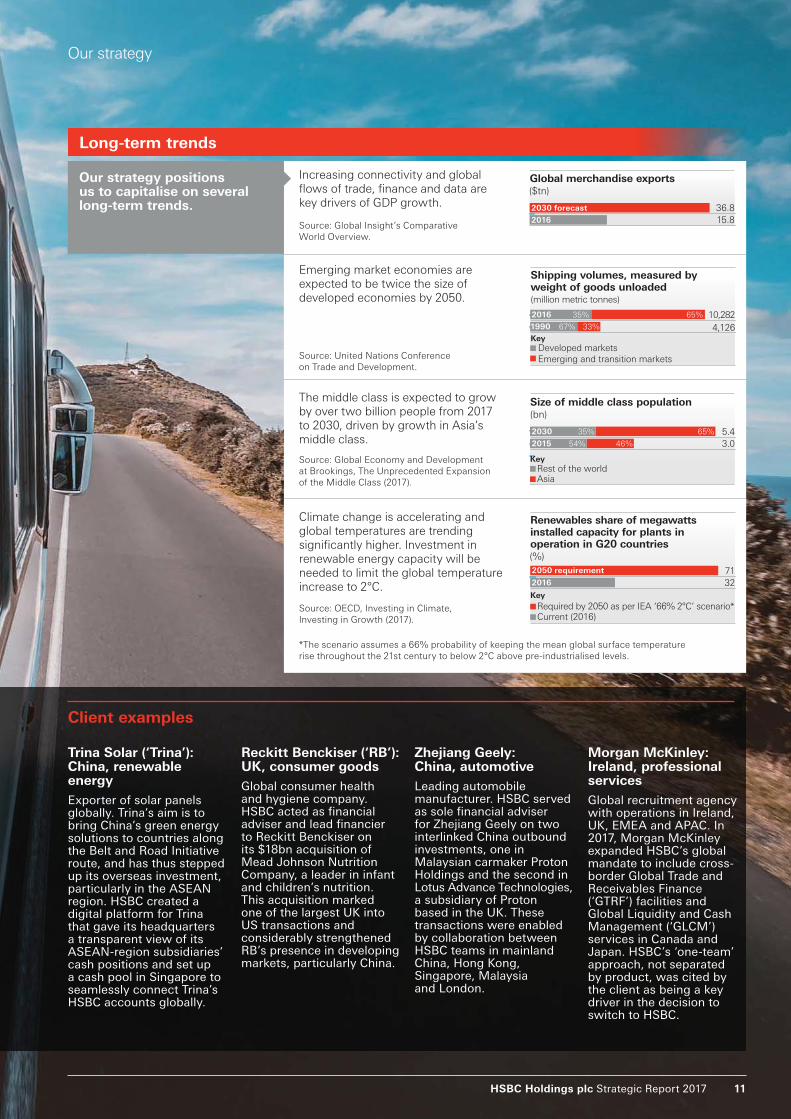
Our strategy positions us to capitalise on several long-term trends.
Increasing connectivity and global
flows of trade, finance and data are
key drivers of GDP growth.
Climate change is accelerating and
global temperatures are trending
significantly higher. Investment in
renewable energy capacity will be
needed to limit the global temperature
increase to 2°C.
Emerging market economies are
expected to be twice the size of
developed economies by 2050.
The middle class is expected to grow
by over two billion people from 2017
to 2030, driven by growth in Asia’s
middle class.
Source: Global Insight’s Comparative
World Overview.
Source: Global Economy and Development
at Brookings, The Unprecedented Expansion
of the Middle Class (2017).
Source: United Nations Conference
on Trade and Development.
Long-term trends
KeyDeveloped markets
Emerging and transition markets
4,126
10,282
Shipping volumes, measured byweight of goods unloaded(million metric tonnes)
2016
1990
35%
67%
65%
33%
32
712050 requirement
2016
Renewables share of megawattsinstalled capacity for plants in operation in G20 countries (%)
Required by 2050 as per IEA ‘66% 2°C’ scenario*
Key
Current (2016)
35% 5.4
3.054%
65%
46%
Size of middle class population(bn)
2030
2015
Asia
KeyRest of the world
Our strategy
15.8
36.8
Global merchandise exports ($tn)
2030 forecast
2016
Client examples
Trina Solar (‘Trina’): China, renewable energyExporter of solar panels globally. Trina’s aim is to bring China’s green energy solutions to countries along the Belt and Road Initiative route, and has thus stepped up its overseas investment, particularly in the ASEAN region. HSBC created a digital platform for Trina that gave its headquarters a transparent view of its ASEAN-region subsidiaries’ cash positions and set up a cash pool in Singapore to seamlessly connect Trina’s HSBC accounts globally.
Reckitt Benckiser (‘RB’): UK, consumer goodsGlobal consumer health and hygiene company. HSBC acted as financial adviser and lead financier to Reckitt Benckiser on its $18bn acquisition of Mead Johnson Nutrition Company, a leader in infant and children’s nutrition. This acquisition marked one of the largest UK into US transactions and considerably strengthened RB’s presence in developing markets, particularly China.
Zhejiang Geely: China, automotiveLeading automobile manufacturer. HSBC served as sole financial adviser for Zhejiang Geely on two interlinked China outbound investments, one in Malaysian carmaker Proton Holdings and the second in Lotus Advance Technologies, a subsidiary of Proton based in the UK. These transactions were enabled by collaboration between HSBC teams in mainland China, Hong Kong, Singapore, Malaysia and London.
Morgan McKinley: Ireland, professional servicesGlobal recruitment agency with operations in Ireland, UK, EMEA and APAC. In 2017, Morgan McKinley expanded HSBC’s global mandate to include cross-border Global Trade and Receivables Finance (‘GTRF’) facilities and Global Liquidity and Cash Management (‘GLCM’) services in Canada and Japan. HSBC’s ‘one-team’ approach, not separated by product, was cited by the client as being a key driver in the decision to switch to HSBC.
Source: OECD, Investing in Climate,
Investing in Growth (2017).
HSBC Holdings plc Strategic Report 2017 11

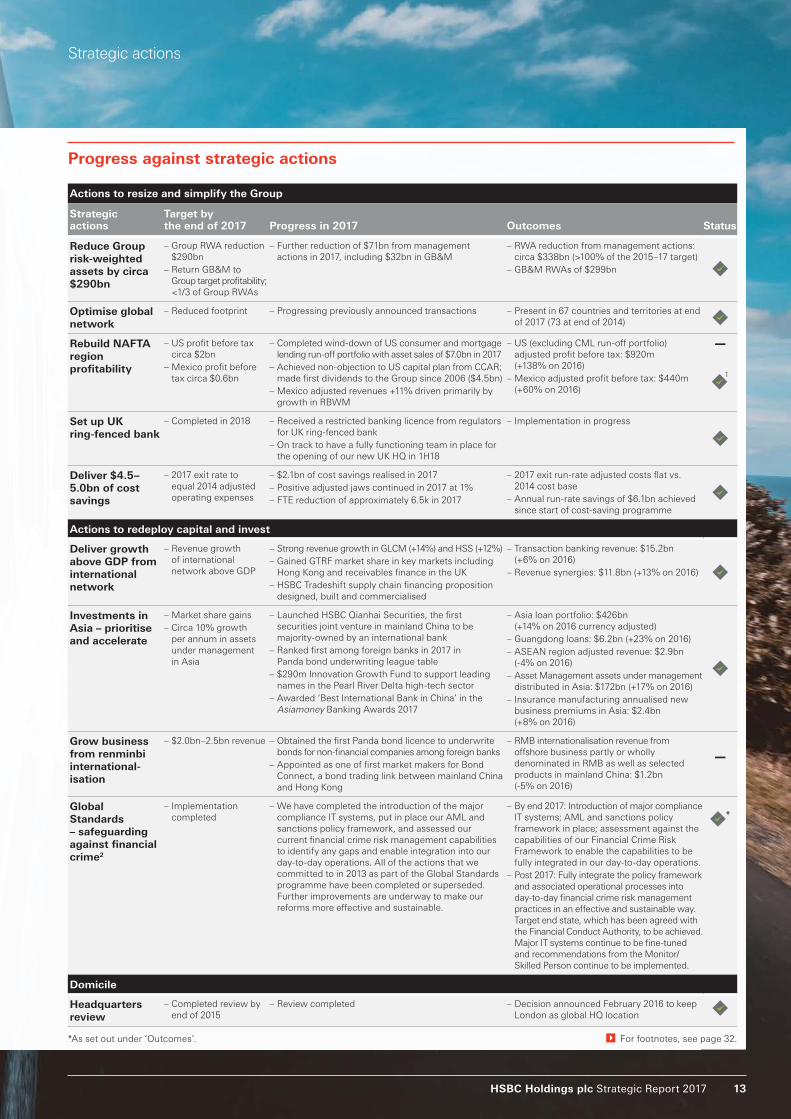
Strategic Report
Strategic actionsWe met eight out of ten targets from the strategic actions
outlined in our Investor Update in June 2015.
Capturing value from our international network
In June 2015, we outlined a series
of strategic actions to make the most
of our competitive advantages and
respond to a changing environment.
These actions focused on using our
resources more efficiently and on
investing for growth. Each action
had targets defined to the end of
2017. The table opposite contains
a summary of our progress with
additional details provided below.
Resizing and simplifying our business
We passed several significant
milestones in resizing and simplifying
our business in 2017. Our
management actions delivered
a gross reduction of risk-weighted
assets (‘RWAs’) by $338bn, exceeding
our RWA reduction target from
management initiatives by $60bn
on an FX-adjusted basis.
Among our NAFTA region Investor
Update targets, we did not reach our
US profit before tax (‘PBT’) target of
$2bn. However, we have taken steps
forward in, for example, our US Retail
Banking and Wealth Management
(‘RBWM’) business, where we
increased PBT, revenues and deposits,
and migrated over one million
customers to our impending new core
banking platform. We also completed
the wind-down of our US consumer
and mortgage lending (‘CML’) run-off
portfolio. In Mexico, our adjusted PBT
reached $440m, surpassing our Investor
Update target on a local currency
basis. We also grew adjusted revenue
in Mexico by 11% compared with
2016, supported by increased loan
balances from market share gains.
We remain on course to complete
the set-up of our UK ring-fenced bank
(‘RFB’) ahead of the 1 January 2019
statutory deadline. In 2017, we
received a restricted bank licence for
the RFB and are working through an
agreed mobilisation plan with the
Prudential Regulatory Authority and
Financial Conduct Authority to receive
an unrestricted licence in 2018.
We successfully concluded our cost-
saving programme and realised $6.1bn
of annual run-rate savings, over $1bn
more than our Investor Update target.
The programme enabled 2017 exit
run-rate adjusted costs to be kept flat
compared with the 2014 cost base.
The savings offset increased costs from
areas such as regulatory programmes
and compliance, and investments to
help facilitate further business growth.
For example, in RBWM, we expanded
the use of biometrics globally with
over 1.5 million customers using voice
recognition, and with fingerprint
technology launched in nine of our
markets. For our corporate customers,
we improved our key digital channels
with significant improvements to
HSBCnet and HSBC Connect. Our
costs-to-achieve transformation
concluded with approximately $7bn
spent since the start of the programme.
Redeploying capital to grow our business
Our international network remains core
to our strategy, and we achieved our
Investor Update target of revenue
growth above GDP. In 2017, we grew
our revenue from transaction banking
products by 6%, including double-digit
percentage growth in GLCM and HSBC
Security Services (‘HSS’). We grew
GTRF market share in key markets, in
particular Hong Kong and receivables
finance in the UK. Cross-border
revenues from our priority corridors
grew 10%, with double-digit percentage
growth in four of our five largest priority
corridors including our China-US
corridor. We were named ‘Top Global
Trade Finance Bank’ by our clients in the
Euromoney Trade Finance Survey 2018.
We delivered on our 2015 Investor
Update commitment to prioritise and
accelerate investments in Asia. In 2017,
we grew our loan portfolio in the region
by $53bn to $426bn. Our asset
management and insurance businesses
in Asia realised 17% and 8% growth in
AUM and annualised new business
premiums, respectively. In mainland
China, we reached over 400,000 cards
in circulation since launching credit
cards at the end of 2016, and we grew
our customer loans in the Pearl River
Delta region by 23%. We launched
HSBC Qianhai Securities, the first
securities joint venture in mainland
China to be majority-owned by an
international bank.
Revenue tied to renminbi (‘RMB’)
internationalisation in 2017 of $1.2bn did
not meet our Investor Update target of
$2.0bn to $2.5bn. This was largely due
to a decrease in overall market volumes.
However, we continue to be recognised
as the leading bank for international
RMB products and services. We ranked
first in Bloomberg’s offshore RMB bond
underwriting league table in 2017 with
28% market share and first for the sixth
year in a row in the Asiamoney Offshore
RMB Poll 2017. We had the largest
share, at 53%, of approved quota of
RMB Qualified Foreign Institutional
Investor (‘RQFII’) custodian business.
Selected awards and recognition
Euromoney Trade Finance Survey 2018
Top Global Trade Finance Bank
Euromoney Awards for Excellence 2017
World’s Best Bank
World’s Best Investment Bank in the
Emerging Markets
Asia’s Best Bank
North America’s Best Bank for
Transaction Services
Euromoney Cash Management Survey 2017
Best Global Cash Manager for Corporates
Best Global Cash Manager for Financial
Institutions for all Transactions
Asiamoney New Silk Road Finance Awards 2017
Best Overall International Bank for
Belt and Road Initiative
12 HSBC Holdings plc Strategic Report 2017
Strategic actions
Actions to resize and simplify the Group
Strategic actions
Target by the end of 2017 Progress in 2017 Outcomes Status
Reduce Group risk-weighted assets by circa $290bn
– Group RWA reduction
$290bn
– Return GB&M to
Group target profitability;
<1/3 of Group RWAs
– Further reduction of $71bn from management
actions in 2017, including $32bn in GB&M
– RWA reduction from management actions:
circa $338bn (>100% of the 2015–17 target)
– GB&M RWAs of $299bn
Optimise global network
– Reduced footprint – Progressing previously announced transactions – Present in 67 countries and territories at end
of 2017 (73 at end of 2014)
Rebuild NAFTA region profitability
– US profit before tax
circa $2bn
– Mexico profit before
tax circa $0.6bn
– Completed wind-down of US consumer and mortgage
lending run-off portfolio with asset sales of $7.0bn in 2017
– Achieved non-objection to US capital plan from CCAR;
made first dividends to the Group since 2006 ($4.5bn)
– Mexico adjusted revenues +11% driven primarily by
growth in RBWM
– US (excluding CML run-off portfolio)
adjusted profit before tax: $920m
(+138% on 2016)
– Mexico adjusted profit before tax: $440m
(+60% on 2016)
1
Set up UK ring-fenced bank
– Completed in 2018 – Received a restricted banking licence from regulators
for UK ring-fenced bank
– On track to have a fully functioning team in place for
the opening of our new UK HQ in 1H18
– Implementation in progress
Deliver $4.5–5.0bn of cost savings
– 2017 exit rate to
equal 2014 adjusted
operating expenses
– $2.1bn of cost savings realised in 2017
– Positive adjusted jaws continued in 2017 at 1%
– FTE reduction of approximately 6.5k in 2017
– 2017 exit run-rate adjusted costs flat vs.
2014 cost base
– Annual run-rate savings of $6.1bn achieved
since start of cost-saving programme
Actions to redeploy capital and invest
Deliver growth above GDP from international network
– Revenue growth
of international
network above GDP
– Strong revenue growth in GLCM (+14%) and HSS (+12%)
– Gained GTRF market share in key markets including
Hong Kong and receivables finance in the UK
– HSBC Tradeshift supply chain financing proposition
designed, built and commercialised
– Transaction banking revenue: $15.2bn
(+6% on 2016)
– Revenue synergies: $11.8bn (+13% on 2016)
Investments in Asia – prioritise and accelerate
– Market share gains
– Circa 10% growth
per annum in assets
under management
in Asia
– Launched HSBC Qianhai Securities, the first
securities joint venture in mainland China to be
majority-owned by an international bank
– Ranked first among foreign banks in 2017 in
Panda bond underwriting league table
– $290m Innovation Growth Fund to support leading
names in the Pearl River Delta high-tech sector
– Awarded ‘Best International Bank in China’ in the
Asiamoney Banking Awards 2017
– Asia loan portfolio: $426bn
(+14% on 2016 currency adjusted)
– Guangdong loans: $6.2bn (+23% on 2016)
– ASEAN region adjusted revenue: $2.9bn
(-4% on 2016)
– Asset Management assets under management
distributed in Asia: $172bn (+17% on 2016)
– Insurance manufacturing annualised new
business premiums in Asia: $2.4bn
(+8% on 2016)
Grow business from renminbi international-isation
– $2.0bn–2.5bn revenue – Obtained the first Panda bond licence to underwrite
bonds for non-financial companies among foreign banks
– Appointed as one of first market makers for Bond
Connect, a bond trading link between mainland China
and Hong Kong
– RMB internationalisation revenue from
offshore business partly or wholly
denominated in RMB as well as selected
products in mainland China: $1.2bn
(-5% on 2016)
Global Standards – safeguarding against financial crime2
– Implementation
completed
– We have completed the introduction of the major
compliance IT systems, put in place our AML and
sanctions policy framework, and assessed our
current financial crime risk management capabilities
to identify any gaps and enable integration into our
day-to-day operations. All of the actions that we
committed to in 2013 as part of the Global Standards
programme have been completed or superseded.
Further improvements are underway to make our
reforms more effective and sustainable.
– By end 2017: Introduction of major compliance
IT systems; AML and sanctions policy
framework in place; assessment against the
capabilities of our Financial Crime Risk
Framework to enable the capabilities to be
fully integrated in our day-to-day operations.
– Post 2017: Fully integrate the policy framework
and associated operational processes into
day-to-day financial crime risk management
practices in an effective and sustainable way.
Target end state, which has been agreed with
the Financial Conduct Authority, to be achieved.
Major IT systems continue to be fine-tuned
and recommendations from the Monitor/
Skilled Person continue to be implemented.
*
Domicile
Headquarters review
– Completed review by
end of 2015
– Review completed – Decision announced February 2016 to keep
London as global HQ location
Progress against strategic actions
*As set out under ‘Outcomes’. For footnotes, see page 32.
HSBC Holdings plc Strategic Report 2017 13
Financial overview
Reported operating expenses
Reported operating expenses of
$34.9bn were $4.9bn or 12% lower.
This included a net decrease in
significant items of $5.6bn, including:
–a $3.2bn write-off of goodwill in our
GPB business in Europe in 2016;
–a net release of $0.4bn in settlements
and provisions in connection with legal
matters, compared with charges in
2016 of $0.7bn;
–operating expenses of $1.1bn in 1H16
incurred by the operations in Brazil that
we sold; and
–costs to achieve of $3.0bn, compared
with $3.1bn in 2016.
Excluding significant items and a
favourable effect of foreign currency
translation of $0.3bn, operating
expenses increased by $1.1bn. This
increase mainly reflected increased
investment in growth programmes,
primarily in RBWM, where investments
were partly funded by the proceeds
from our disposal of Visa shares,
and higher performance-related pay.
Reported results2017
$m2016
$m
2015
$m
Net interest income 28,176 29,813 32,531
Net fee income 12,811 12,777 14,705
Net trading income 7,719 9,452 8,723
Other income 2,739 (4,076) 3,841
Net operating income before loan impairment charges and other credit risk provisions (‘revenue’)
51,445 47,966 59,800
Loan impairment charges and other credit risk provisions (1,769) (3,400) (3,721)
Net operating income 49,676 44,566 56,079
Total operating expenses (34,884) (39,808) (39,768)
Operating profit 14,792 4,758 16,311
Share of profit in associates and joint ventures 2,375 2,354 2,556
Profit before tax 17,167 7,112 18,867
This table shows our reported results for
the last three years, ended 31 December
2017, 2016 and 2015.
All commentary in this financial
overview compares the 2017 results
with 2016, unless otherwise stated.
Reported profit before tax
Reported profit before tax of $17.2bn
was $10.1bn or 141% higher, mainly
reflecting a net favourable movement of
significant items of $8.5bn, which is
described in more detail on page 32 of
the Annual Report and Accounts 2017.
Excluding significant items and an
adverse effect of foreign currency
translation of $0.5bn, profit before tax
increased by $2.1bn or 11%.
Reported revenue
Reported revenue of $51.4bn was
$3.5bn or 7% higher, partly reflecting a
net favourable movement in significant
items of $2.0bn, which included:
– in 2016, unfavourable fair value
movements on our own debt designated
at fair value reflecting changes in our
own credit spread of $1.8bn, which are
now reported in other comprehensive
income, following our partial early
adoption of IFRS 9 ‘Financial
Instruments’ on 1 January 2017; and
–favourable fair value movements in
2017 of $0.1bn on non-qualifying
hedges, compared with adverse
movements of $0.7bn in 2016.
Net favourable movements were partly
offset by:
– in 2016, a $0.7bn gain on the disposal
of our membership interests in Visa
Europe and Visa Inc. This compared
with a $0.3bn gain on the disposal of
our shares in Visa Inc. during 2017;
–adverse debit value adjustments on
derivative contracts in 2017 of $0.4bn,
compared with minimal movements
in 2016; and
– in 2017, a $0.1bn provision related to
customer redress programmes in the
UK, and a $0.1bn charge arising from
the opportunity to increase our
investment in new businesses.
Significant items also included a loss of
$1.7bn recognised in 2016 on the sale of
operations in Brazil to Banco Bradesco
S.A., which was completed on 1 July
2016. This loss was substantially offset
by the reported revenue earned by the
Brazil business during 2016 of $1.5bn.
Excluding significant items, and an
adverse effect of foreign currency
translation of $0.7bn, revenue increased
by $2.2bn or 5%, reflecting growth in
Retail Banking and Wealth Management
(‘RBWM’), Commercial Banking (‘CMB’)
and Global Banking and Markets
(‘GB&M’).
Reported LICs
Reported loan impairment charges
and other credit risk provisions (‘LICs’)
of $1.8bn were $1.6bn lower, in part
reflecting the effect of significant items,
which comprised the LICs incurred
by our operations in Brazil in 2016
of $0.7bn.
Excluding significant items and the
adverse effect of foreign currency
translation of $0.1bn, LICs decreased
by $0.8bn or 32%. The reduction in
LICs was primarily in CMB, RBWM
and Corporate Centre.
Reported results
Strategic Report
14 HSBC Holdings plc Strategic Report 2017

For reconciliations of our reported results to an adjusted basis, including lists of significant items, see page 48 of the Annual Report and Accounts 2017.
Adjusted results
This table shows our adjusted results for 2017 and 2016. These are discussed in more detail on the following pages.
Adjusted profit before tax
On an adjusted basis, profit before tax of $21.0bn was $2.1bn or 11% higher. This was driven by higher revenue (up $2.2bn), with growth in our three main global businesses, and a significant reduction in LICs (down $0.8bn), notably
Adjusted performance
Movements compared with 2016
Adjusted results2017
$m2016
$mAdverse
$mFavourable
$m (%)
Net operating income before loan impairment charges and other credit risk provisions (adjusted revenue) 51,524 49,290 5%
Loan impairment charges and other credit risk provisions (1,769) (2,594) 32%
Total operating expenses (31,140) (30,084) (4)%
Operating profit 18,615 16,612 12%
Share of profit in associates and joint ventures 2,375 2,322 2%
Profit before tax 20,990 18,934 11%
Our reported results are prepared in accordance with IFRSs as detailed in the Financial Statements on page 186 of the Annual Report and Accounts 2017.
We present adjusted performance measures to align internal and external reporting, identify and quantify items management believes to be significant, and provide insight into how management assesses period-on-period performance. Adjusted performance measures are highlighted with the following symbol:
To derive adjusted performance, we adjust for:
– the year-on-year effects of foreign currency translation differences; and –the effect of significant items that distort year-on-year comparisons and are excluded in order to improve understanding of the underlying trends in the business.
Reported results continued
Financial overview
Reported income from associates and joint ventures
Reported income from associates and joint ventures of $2.4bn increased by $21m.
Dividends
On 20 February 2018, the Board announced a fourth interim dividend of $0.21 per ordinary share.
as 2016 included charges relating to exposures to the oil and gas, and mining sectors. These movements were partly offset by higher operating expenses (up $1.1bn), in part due to investment in growth initiatives. In 2017, we achieved positive adjusted jaws of 1.0%.
2,234
825
(1,056)
2,003
53
2,056
HSBC Holdings plc Strategic Report 2017 15

2016$30.1bn
2017$31.1bn
$30.1bn $31.1bn
7.3
(0.1)
7.3 7.2 7.6 7.5 7.5 7.8 7.90.91.0
Adjusted operating expenses by quarter year($bn)
Adjusted operating expensesby year($bn)
Adjusted
operating
expenses
(excluding
UK bank levy)
UK bank levy
Key
29.2
0.9
30.2
0.9
1Q16 4Q163Q162Q16 1Q17 4Q173Q172Q17 2016 2017
Adjusted LICs
Adjusted LICs of $1.8bn were $0.8bn
lower, reflecting reductions in:
–CMB ($0.5bn lower), notably in the UK
and North America, primarily as 2016
included charges against exposures in
the oil and gas sector. In addition, there
were reductions in France, Spain and
Singapore as we incurred individually
assessed LICs against a small number
of corporate exposures in 2016.
–RBWM ($0.2bn lower), primarily in
Turkey and the US, reflecting improved
credit quality, partly offset by increases
in Mexico, notably from growth in
Adjusted revenue
Adjusted revenue of $51.5bn was
$2.2bn or 5% higher, as growth in our
three main global businesses was partly
offset by reductions in GPB and
Corporate Centre.
– In RBWM, revenue increased by $1.7bn
or 9%, driven by growth in Retail
Banking from current accounts,
savings and deposits, reflecting
balance growth and wider spreads
primarily in Hong Kong, and also in the
US and Mexico, partly offset by lower
personal lending revenue. Revenue
also increased in Wealth Management,
mainly in insurance manufacturing
driven by favourable market impacts
compared with adverse market
impacts in 2016, notably in Asia.
In addition, investment distribution
income increased, reflecting increased
investor confidence in Hong Kong.
– In CMB, revenue increased by $0.6bn
or 5%, driven by growth in Global
Liquidity and Cash Management
(‘GLCM’), notably in Asia. This primarily
reflected wider spreads and increased
average deposit balances. Revenue in
Credit and Lending (‘C&L’) increased as
we grew lending balances in key
markets, while revenue in Global Trade
and Receivables Finance (‘GTRF’) fell
marginally, due to managed client exits
in MENA despite balance sheet growth
in Asia and the UK.
– In GB&M, revenue increased by $0.4bn
or 3%, mainly in GLCM and Securities
Services. In Global Markets, revenue
was marginally higher as growth in
Equities, reflecting increased market
share in Prime Financing, was partly
offset by lower revenue in Fixed Income,
Currencies and Commodities that
reflected lower market volatility, as well
as a net adverse movement on credit
and funding valuations adjustments.
These increases were partly offset:
Movement in adjusted revenue compared with 2016
2017$m
2016
$m
Variance$m %
Retail Banking and Wealth Management 20,287 18,542 1,745 9%
Commercial Banking 13,223 12,619 604 5%
Global Banking and Markets 15,091 14,715 376 3%
Global Private Banking 1,703 1,748 (45) (3)%
Corporate Centre 1,220 1,666 (446) (27)%
Total 51,524 49,290 2,234 5%
– In GPB, revenue was $45m or 3%
lower, reflecting the impact of our
customer repositioning actions. This
was partly offset by increased revenue
in the markets that we have targeted
for growth, notably Hong Kong, due to
higher investment revenue reflecting
increased client activity and growth in
deposit revenue as we benefited from
wider spreads.
– In Corporate Centre, revenue decreased
by $0.4bn, with reductions in the US
run-off portfolio (down $0.7bn), following
the disposal of the remaining portfolio
during 2017, and in Central Treasury
(down $0.1bn). These decreases were
partly offset in other income (up
$0.4bn), which included revaluation
gains on investment properties.
Adjusted performance continued
Strategic Report | Financial overview
unsecured lending which resulted in an
associated increase in delinquency rates.
–LICs in GB&M of $0.5bn were broadly
unchanged from the prior year. LICs in
the current year related to two large
corporate exposures in Europe. This
compared with a small number of
individually assessed LICs, notably
on exposures in the oil and gas, and
mining sectors in the US in 2016.
Adjusted operating expenses
Adjusted operating expenses of $31.1bn
were $1.1bn or 4% higher. This reflected
investments in business growth
programmes ($0.6bn), primarily in
RBWM where investments were partly
funded by the proceeds from the
disposal of our shares in Visa, as well as
an increase in performance-related pay
(up $0.4bn). Compared with 2016, our
UK bank levy charge was broadly
unchanged, at $916m. The impact of
our cost-saving initiatives broadly offset
inflation and continued investment in our
regulatory programmes and compliance.
Our total investment in regulatory
programmes and compliance was
$3.0bn, up $0.2bn or 7%. This notably
reflected the continued implementation
of our Global Standards programme to
enhance financial crime risk controls
and capabilities.
The number of employees expressed in
full-time equivalent staff at 31 December
2017 was 228,687, a decrease of 6,488
from 31 December 2016. This reflected
reductions resulting from our
transformation programmes and the
completion of these programmes, partly
offset by increases from our investments
in Global Standards and in our business
growth programmes.
Adjusted income from associates and joint ventures
Adjusted income from associates and joint
ventures of $2.4bn increased by $0.1bn.
16 HSBC Holdings plc Strategic Report 2017

Balance sheet strength
Total reported assets were $2.5tn,
6% higher than at 31 December 2016
on a reported basis, and 1% higher on
a constant currency basis. We have
maintained the strength of our balance
sheet, as we continued our targeted
asset growth, notably in Asia.
Distributable reserves
The distributable reserves of HSBC
Holdings at 31 December 2017 were
$38bn, compared with $42bn at
31 December 2016. The decrease was
driven by distributions to shareholders
of $8.3bn, which were higher than
profits generated of $5.5bn, as well
as fair value losses net of tax due to
movements in our own credit risk
of $0.8bn.
Return on equity
Our medium-term target is to achieve a return on equity
(‘RoE’) of more than 10%. In 2017, we achieved an RoE of
5.9% compared with 0.8% in 2016. In 2016, significant items,
which included a write-off of goodwill in GPB in Europe,
costs to achieve and adverse fair value movements arising
from changes in credit spread on our own debt designated
at fair value, had a significant effect on our reported RoE.
Adjusted jaws
Jaws measures the difference between the rates of change
for revenue and costs. Positive jaws occurs when the figure
for the annual percentage change in revenue is higher than,
or less negative than, the corresponding rate for costs.
We calculate adjusted jaws using adjusted revenue and costs.
Our target is to maintain positive adjusted jaws.
In 2017, adjusted revenue increased by 5% and our adjusted
operating expenses increased by 4%. Adjusted jaws was
therefore positive 1%.
Dividends
In the current uncertain environment, we plan to sustain the
annual dividend in respect of the year at its current level for
the foreseeable future. Growing our dividend will depend on
the overall profitability of the Group, delivering further release
of less efficiently deployed capital and meeting regulatory
capital requirements in a timely manner. Actions to address
these points were core elements of our Investor Update in
June 2015.
Capital strength
We manage our capital in an effort to
ensure we exceed current regulatory
requirements and are well placed to
meet those expected in the future. We
monitor our position using capital ratios.
These measure capital relative to a
regulatory assessment of risks taken.
We quantify how these risks relate to
our businesses using RWAs.
Details of these risks are included on page 117
of the Annual Report and Accounts 2017.
Our CET1 ratio at 31 December 2017
was 14.5%, up from 13.6% at
31 December 2016.
Balance sheet and capital
Delivery against Group financial targets
5% Adjusted jaws
1%Adjusted costs up
4%
Adjusted revenue up
Total dividends declared in respect of the year($bn)
2017
2016
2015 10.0
10.1
10.2
Financial overview
Return on equity(%)
2017
2016
2015 7.2
0.8
5.9
Implementation of IFRS 9
IFRS 9 ‘Financial Instruments’ was
adopted on 1 January 2018. The
adoption of IFRS 9 will reduce the
Group’s net assets at 1 January 2018
by $1.0bn. We do not expect this to
have a significant impact on our
regulatory capital position.
Further explanation of the expected impact
of the implementation of IFRS 9 is provided in
Note 1 on the Financial Statements on page 186
of the Annual Report and Accounts 2017.
HSBC Holdings plc Strategic Report 2017 17

5.2
5.5
6.52017
2016
2015
Adjusted profit before tax($bn)
Change in adjusted profit before tax
+24%
partly offset in Mexico where higher
LICs ($24m) reflected targeted growth
in unsecured lending and associated
higher delinquency rates. In the UK LICs
of $132m were marginally higher, but
remained at very low levels (10bps of
the portfolio) as higher LICs relating to
mortgages and unsecured lending were
partly offset by a release from the sale
of a loan portfolio.
Adjusted operating expenses of $12.8bn
were $0.7bn or 5% higher, mainly due to
investment in growth initiatives, notably
in retail business banking, in our
international proposition as we introduced
new products and services, and in
mainland China. Transformational and
other cost savings partly offset inflation
and higher performance-related pay.
Global businessesWe manage our products and services
globally through our global businesses.
Retail Banking and Wealth Management (‘RBWM’)
RBWM serves close to 37 million
customers worldwide through four
main businesses: Retail Banking,
Wealth Management, Asset
Management and Insurance.
Our HSBC Premier and Advance
propositions are aimed at mass
affluent and emerging affluent
customers who value international
connectivity and benefit from our
global reach and scale. For customers
with simpler banking needs, RBWM
offers a full range of products and
services reflecting local requirements.
Key events
–Significant investment in digital
transformation across our six core
markets, reshaping the branch
network and sales force, and improving
customer engagement, including the
launch of a payment app in Hong Kong
(PayMe) and voice biometrics in the UK.
–Continued to attract customer deposits
(up 5%), providing the potential to
benefit from future interest rate rises;
lending balances increased by 7%.
–Strong growth in sales of investment
products, notably equities (up 45%)
and mutual funds (up 22%), and growth
in insurance annualised new business
premiums (up 7%), primarily in Asia.
Financial performance
Adjusted profit before tax of $6.5bn
was $1.2bn or 24% higher, reflecting
strong revenue growth from deposits
and Wealth Management, as well as
lower LICs, partly offset by higher
operating expenses. We achieved
positive adjusted jaws of 4.0%.
Adjusted revenue of $20.3bn was
$1.7bn or 9% higher, reflecting:
Higher revenue in Retail Banking (up
$0.8bn or 6%):
–Growth in revenue from current
accounts, savings and deposits (up
$1.1bn) due to wider spreads and
higher balances primarily in Hong
Kong, and also in the US and Mexico.
This was partly offset by:
–Lower personal lending revenue (down
$0.3bn), reflecting mortgage spread
compression, primarily in Hong Kong,
mainland China and the US. This was
partly offset by lending growth of
$22.2bn, notably driven by mortgages
in the UK and Hong Kong, where we
grew our market share.
Higher revenue in Wealth Management
(up $0.9bn or 18%):
–Growth in life insurance manufacturing
revenue (up $0.5bn) including
favourable movements in market
impacts of $0.3bn in 2017 compared
with adverse movements of $0.4bn in
2016, due to interest rate and equity
market movements, notably in Asia
and France, and to a lesser extent
higher insurance sales in Asia.
–Higher investment distribution revenue
(up $0.4bn), primarily from higher sales
of mutual funds and retail securities in
Hong Kong, reflecting increased
investor confidence.
Adjusted LICs of $1.0bn were $0.2bn or
14% lower, reflecting reductions in
Turkey of $85m and in the US of $44m,
as credit quality improved. This was
2017 vs 2016
Management view of adjusted revenue
2017$m
2016
$m
2015
$m $m %
Net operating income3
Retail Banking 13,495 12,695 12,508 800 6%
– current accounts, savings
and deposits
6,344 5,213 4,8141,131
22%
– personal lending 7,151 7,482 7,694 (331) (4)%
mortgages 2,337 2,546 2,648 (209) (8)%
credit cards 2,899 3,034 3,218 (135) (4)%
other personal lending4 1,915 1,902 1,828 13 1%
Wealth Management 6,224 5,292 5,748 932 18%
– investment distribution5 3,276 2,904 3,230 372 13%
– life insurance manufacturing 1,893 1,401 1,544 492 35%
– asset management 1,055 987 974 68 7%
Other 6 568 555 582 13 2%
Year ended 31 Dec 20,287 18,542 18,838 1,745 9%
Adjusted RoRWA (%)7 5.5 4.6 4.8
For footnotes, see page 32.
Strategic Report
18 HSBC Holdings plc Strategic Report 2017

Change in adjusted profit before tax
+15%*Analysis relates to corporate client income
which includes total income from GB&M synergy
products, including Foreign Exchange and Debt
Capital Markets. This measure differs from
reported revenue in that it excludes Business
Banking and Other and internal cost of funds.
5.9
5.2
6.82017
2016
2015
Adjusted profit before tax($bn)
The ‘Management view of adjusted revenue’ tables provide
a breakdown of revenue by major products, and reflect the
basis on which each business is assessed and managed.
The comparative period has been restated to reflect changes
to reportable segments, as described on page 46 of the Annual
Report and Accounts 2017.
Commentary is on an adjusted basis, which is consistent with
how we assess the performance of our global businesses.
Commercial Banking (‘CMB’)
CMB serves approximately 1.7 million
customers in 53 countries and
territories. Our customers range from
small enterprises focused primarily on
their domestic markets to corporates
operating globally. We support
customers with tailored financial
products and services to allow them
to operate efficiently and grow.
Services provided include working
capital, term loans, payment services
and international trade facilitation, as well
as expertise in mergers and acquisitions,
and access to financial markets.
Key events
–Corporate customer value from our
international subsidiary banking
proposition grew 19%* compared with
2016, continuing to demonstrate the
value of our global network.
– In GLCM we launched a number of
mobile solutions, including the
government sponsored Unified
Payments Interface in India, and
Omni-Channel mobile collections in
China. We also rolled out Voice and
Touch ID in 37 markets and launched
the next generation of HSBCnet.
–HSBC was named the world’s Best
Trade Finance Bank and Most
Innovative Bank by Global Trade
Review magazine. We also announced
a strategic partnership with Tradeshift,
the world’s largest business commerce
platform, which will enable companies
of all sizes to manage their global
supply chains and working capital
requirements from one simple online
platform, from any device.
Financial performance
Adjusted profit before tax of $6.8bn was
$0.9bn or 15% higher, reflecting higher
revenue and lower LICs. This was partly
offset by an increase in operating
expenses. We achieved positive
adjusted jaws of 1.3%.
Adjusted revenue of $13.2bn was
$0.6bn or 5% higher, as strong growth
in GLCM and increased revenue in C&L
were partly offset by a reduction in
GTRF revenue.
– In GLCM, revenue increased by $536m
or 13%, notably in Hong Kong and
mainland China, reflecting wider
spreads. Average balances grew 5%,
reflecting customer deposit retention
and new customer acquisitions. In the
UK, average balance sheet growth of
10% was more than offset by narrower
spreads due to the impact of the base
rate reduction in 2016.
– In C&L, revenue increased by $52m or
1%. In the UK, revenue increased as
lending growth more than offset
narrower spreads. By contrast, revenue
in Asia was lower, as balance growth in
Hong Kong was more than offset by
the effects of spread compression in
Hong Kong and mainland China, in
part reflecting competitive pressures.
Revenue in the US was lower, as we
reposition the portfolio towards
higher returns.
– In GTRF, revenue was $21m or 1%
lower, representing a stabilisation in
performance following a challenging
2016. Notably, revenue increased in
both Asia and the UK, reflecting
balance sheet growth. However, this
was more than offset by a reduction in
revenue in the Middle East and North
Africa (‘MENA’), reflecting the effect
of managed customer exits in the UAE.
Adjusted LICs of $0.5bn were $0.5bn or
2017 vs 2016
Management view of adjusted revenue
2017$m
2016
$m
2015
$m $m %
Net operating income3
Global Trade and Receivables Finance 1,817 1,838 2,039 (21) (1)%
Credit and Lending 5,061 5,009 4,934 52 1%
Global Liquidity and Cash
Management
4,783 4,247 4,077 536 13%
Markets products, Insurance and
Investments and Other8
1,562 1,525 1,457 37 2%
Year ended 31 Dec 13,223 12,619 12,507 604 5%
Adjusted RoRWA (%)7 2.3 2.1 1.9
For footnotes, see page 32.
49% lower, notably in North America
and the UK, primarily related to
exposures in the oil and gas sector,
and were also lower in France and
Spain. In Asia, lower LICs in Singapore
and mainland China were largely
offset by higher LICs in Hong Kong,
across various sectors.
Adjusted operating expenses were
$0.2bn or 3% higher. This reflected
our continued investment in Global
Standards and digital capabilities, as well
as inflation. This was partly offset by a
reduction from our cost-saving initiatives.
Adjusted RWAs increased by 5% to
$301bn reflecting growth in lending,
mainly in Asia and Europe, in part
funded through management initiatives
which reduced RWAs by $14bn.
Global businesses
HSBC Holdings plc Strategic Report 2017 19

Global Banking and Markets (‘GB&M’)
GB&M serves approximately 4,100
clients in more than 50 countries
and territories. It supports major
government, corporate and
institutional clients worldwide.
Our product specialists continue
to deliver a comprehensive range
of transaction banking, financing,
advisory, capital markets and risk
management services.
Key events
–The first foreign bank with a majority-
owned securities joint venture in
China, Qianhai Securities Limited,
which will allow us to provide GB&M
and CMB clients with a broad
spectrum of investment banking and
markets services in China.
– Issued the world’s first corporate
sustainable development bond.
Financial performance
Adjusted profit before tax of $5.8bn
was $0.3bn or 5% higher, reflecting
a strong revenue performance, partly
offset by higher operating expenses,
while achieving positive adjusted jaws
of 1.3%.
Adjusted revenue of $15.1bn was
$0.4bn or 3% higher, with growth in
all of our businesses. The increase
included a net adverse movement
of $0.2bn on credit and funding
valuation adjustments. Excluding
these movements, adjusted revenue
increased by $0.6bn or 4%. The
increase in revenue primarily
reflected the following:
–Revenue growth in all of our
transaction banking products,
notably GLCM (up $0.3bn) and
Securities Services (up $0.2bn).
These increases reflected continued
momentum as we won and retained
client mandates, and benefited from
higher interest rates, particularly in
Asia and the US.
–Global Markets revenue was resilient
(up $33m), despite lower volatility in
2017, compared with more robust
trading conditions in 2016. In Equities
revenue increased by $0.3bn, as we
continued to capture market share
from Prime Financing products. This
was largely offset by Fixed Income,
Currencies and Commodities, where
revenue decreased by $0.2bn,
reflecting subdued trading conditions.
–Global Banking revenue was marginally
higher than 2016 (up $16m), reflecting
growth in lending balances and
continued momentum in investment
banking products, which broadly offset
the effects of tightening spreads on
lending in Asia.
Adjusted LICs of $0.5bn were broadly
unchanged from the prior year. LICs in
2017 related to two large corporate
exposures in Europe, compared with
2016, which included a small number
of individually assessed LICs, notably on
exposures in the oil and gas, and mining
sectors in the US.
Adjusted operating expenses increased
by $0.1bn or 1%, reflecting higher
performance-related pay, pension
and severance costs. Our continued
cost management and efficiency
improvements, and saves from
technology investments, broadly
offset the effects of inflation.
2017 vs 2016
Management view of adjusted revenue
2017$m
2016
$m
2015
$m $m %
Net operating income3
Global Markets 6,689 6,656 6,010 33 —%
Foreign Exchange 2,568 2,764 2,658 (196) (7)%
Rates 1,970 2,120 1,404 (150) (7)%
Credit 900 781 606 119 15%
– FICC 5,438 5,665 4,668 (227) (4)%
– Equities 1,251 991 1,342 260 26%
Global Banking 3,807 3,791 3,757 16 —%
Global Liquidity and Cash
Management
2,197 1,885 1,744 312 17%
Securities Services 1,746 1,561 1,600 185 12%
Global Trade and Receivables Finance 700 689 682 11 2%
Principal Investments 318 226 226 92 41%
Credit and funding valuation
adjustments9
(262) (51) 186 (211) (414)%
Other10 (104) (42) 73 (62) (148)%
Year ended 31 Dec 15,091 14,715 14,278 376 3%
Adjusted RoRWA (%)7 1.9 1.7 1.5
For footnotes, see page 32.
We have exceeded the RWA reduction
target set in our Investor Update in
June 2015, with a cumulative reduction
in RWAs from management initiatives
of $128bn. This includes a further RWA
reduction of $32bn in 2017. Our adjusted
RoRWA improved to 1.9% from 1.7%
in 2016.
Strategic Report | Global businesses
Change in adjusted profit before tax
+5%
5.5
5.3
5.82017
2016
2015
Adjusted profit before tax($bn)
20 HSBC Holdings plc Strategic Report 2017

Global Private Banking (‘GPB’)
Corporate Centre
GPB serves high net worth individuals
and families, including those with
international banking needs.
We provide a full range of private
banking services, including Investment
Management, which includes advisory
and brokerage services, and Private
Wealth Solutions, which comprises
trusts and estate planning, to protect
and preserve wealth for future generations.
Key events
–Net new money inflows of $15bn in key
markets targeted for growth, especially
in Hong Kong.
–Significant progress made with
repositioning, with outflows of over
$15bn in 2017.
–Positive momentum with significant
growth in discretionary and advisory
mandates in 2017.
Financial performance
Adjusted profit before tax of $296m was
$24m or 9% higher as a reduction in
operating expenses was partly offset by
lower revenue. We achieved positive
adjusted jaws of 3.2%.
Corporate Centre comprises Central
Treasury, including Balance Sheet
Management (‘BSM’), our legacy
businesses, interests in our associates
and joint ventures, central stewardship
costs and the UK bank levy.
Financial performance
Adjusted profit before tax of $1.7bn was
$0.4bn or 17% lower, reflecting lower
revenue and higher operating expenses,
partly offset by a fall in LICs.
Adjusted revenue fell by $0.4bn or 27%,
mainly due to a decrease of $0.7bn
related to the US run-off portfolio with
respect to the disposal of the remaining
loan portfolio during 2017. In Central
Treasury revenue also decreased (down
$0.1bn), due to:
–higher interest on our debt (up $0.3bn),
mainly from higher costs of debt issued
to meet regulatory requirements; and
–a reduction in revenue in BSM (down
$0.3bn) reflecting lower yield rates and
increased utilisation of the Group’s
surplus liquidity by the global
businesses; partly offset by:
2017 vs 2016
Management view of adjusted revenue
2017$m
2016
$m
2015
$m $m %
Net operating income3
Investment revenue 693 733 902 (40) (5)%
Lending 387 411 411 (24) (6)%
Deposit 401 342 354 59 17%
Other 222 262 299 (40) (15)%
Year ended 31 Dec 1,703 1,748 1,966 (45) (3)%
Adjusted RoRWA (%)7 1.8 1.6 2.1
For footnotes, see page 32.
2017 vs 2016
Management view of adjusted revenue
2017$m
2016
$m
2015
$m $m %
Net operating income3
Central Treasury11 1,340 1,454 1,760 (114) (8)%
Legacy portfolios 8 724 1,233 (716) (99)%
– US run-off portfolio 40 692 1,165 (652) (94)%
– Legacy credit (32) 32 68 (64) (200)%
Other12 (128) (512) (160) 384 (75)%
Year ended 31 Dec 1,220 1,666 2,833 (446) (27)%
For footnotes, see page 32.
Adjusted revenue of $1.7bn was $45m
or 3% lower, reflecting the continued
impact of client repositioning. Revenue
from the markets that we have targeted
for growth increased by 10%. This was
mainly in Hong Kong, due to growth in
investment revenue reflecting increased
client activity, and higher deposit
income from wider spreads.
Adjusted LICs of $16m in 2017 primarily
related to a single client in the UK.
Adjusted operating expenses of $1.4bn
were $85m or 6% lower, mainly as a
Global businesses
Change in adjusted profit before tax
+9%
0.3
0.4
0.32017
2016
2015
Adjusted profit before tax($bn)
result of a managed reduction in
FTEs and the impact of our cost-
saving initiatives.
– favourable fair value movements
relating to the economic hedging of
interest and exchange rate risk on
our long-term debt with long-term
derivatives of $0.1bn, compared
with adverse movements of $0.3bn
in 2016.
Other income increased by $0.4bn,
which included revaluation gains on
investment properties.
Net loan impairment releases of $182m
compared with adjusted LICs of $22m in
2016. This reflected lower LICs in
the US run-off portfolio, and higher
net releases related to our legacy
credit portfolio.
Adjusted operating expenses of
$2.1bn were $0.2bn or 8% higher due
to investment in regulatory programmes
and compliance, partly offset by lower
US run-off portfolio costs.
Adjusted income from associates
rose by $55m or 2%.
HSBC Holdings plc Strategic Report 2017 21

39%
61%2017
2016
Hong Kong
50%
61%2017
2016
United Kingdom
20162017*
71%
13%
16%
71%
14%
15%
RBWM
Same day or next working day
Between 2-5 days
Longer than 5 days
Key
Strategic Report
How we do businessSupporting sustainable growthWe conduct our business intent on supporting
the sustained success of our customers, people
and communities.
Customers
We aim to be the world’s leading
international bank and strive for
excellence.
Our customers are at the heart of
everything we do and we are working
to make life simpler, faster and better
for them.
Understanding our customers
In this section we focus on our global
business with the largest amount of
customers. We also measure and
report on customer data for Retail
Banking and Wealth Management
(‘RBWM’) and Commercial Banking
in another eight markets within our
Environmental, Social and
Governance (‘ESG’) Update.
Taking responsibility for the service we provide
Operating with high standards of
conduct is central to our long-term
success and ability to serve customers,
and we have clear policies, frameworks
and governance in place to support our
delivery of that commitment. These
cover the way we behave, design
products and services, train and
incentivise employees, and interact
with customers and each other. Our
Conduct Framework guides activities to
strengthen our business and increases
our understanding of how the decisions
we make affect customers and other
stakeholders. Details on our Conduct
Framework are available at
www.hsbc.com and for further
information on conduct, see
pages 61 and 77 of the Annual Report
and Accounts 2017.
Senior leaders have ultimate responsibility
for customer service standards and
monitor these through key metrics
aligned to performance objectives.
These include:
–How customers feel about
recommending us; and
–The speed and quality of complaint
handling.
The targets for each of these metrics are
carefully set and managed to instil the
right behaviours among our employees.
Customer recommendation†
RBWM
†Percentage of customers providing an 8 or
above score out of 10. In Hong Kong the survey
methodology changed in 2017, with surveys
migrated from telephone to online. This may
affect the comparison with prior year figures.
Complaints resolution
Time taken to resolve complaints
(excluding PPI complaints)
Our largest global business
RBWM
Supports approximately 37 million
customers worldwide
Our largest markets
United Kingdom
More than $401bn in customer accounts
Hong Kong
More than $477bn in customer accounts
*2017 figures do not include First Direct UK
complaint volumes, which were not available
at time of publication. They are not expected
to materially impact results.
For more information about what we have
done, see our ESG reporting available on
www.hsbc.com/our-approach/
measuring-our-impact.
22 HSBC Holdings plc Strategic Report 2017

How we do business
What our customers are telling us Our response
Accessibility
Customers in all of our channels have provided feedback on
length of queues in branches, call waiting and handling time
in our contact centres, the length of appointments with our
relationship managers, and the complexity of logging on to
our online and mobile banking.
– Increased capacity in our contact centres.
– Introduced new multi-channel appointment booking tools.
– Added biometrics to make it easier for customers to authenticate
themselves using their unique voice and digital fingerprint.
Complexity
Customers told us our processes and procedures are too
complicated which affects the quality and length of time
required to service our customers day-to-day.
– Delivered training to 53,500 employees globally to use plain
language in communicating with our customers.
– For our commercial customers we have simplified options on
their online platform, HSBCnet.
Fees and charges
Our industry can be complex, and our customers can find it
difficult to understand when and why they will be charged for
our services.
– Introduced instantaneous text message notifications in
Hong Kong to provide application status and account servicing
updates. This has helped many customers to better manage
their accounts and to avoid incurring charges.
What customers are telling us
In 2017, our CMB and RBWM customers told us there were
three main issues that we needed to focus on to improve their
experience of our products and services:
A digital transformation
Our customers are becoming increasingly digitally oriented
in their everyday lives. This means their expectations of us
are changing.
Customers are now using branches less often. In the future,
we will have fewer – but better – branches and our front-line
employees will be using a greater range of technology to
support all our customers’ needs.
HSBC Holdings plc Strategic Report 2017 23
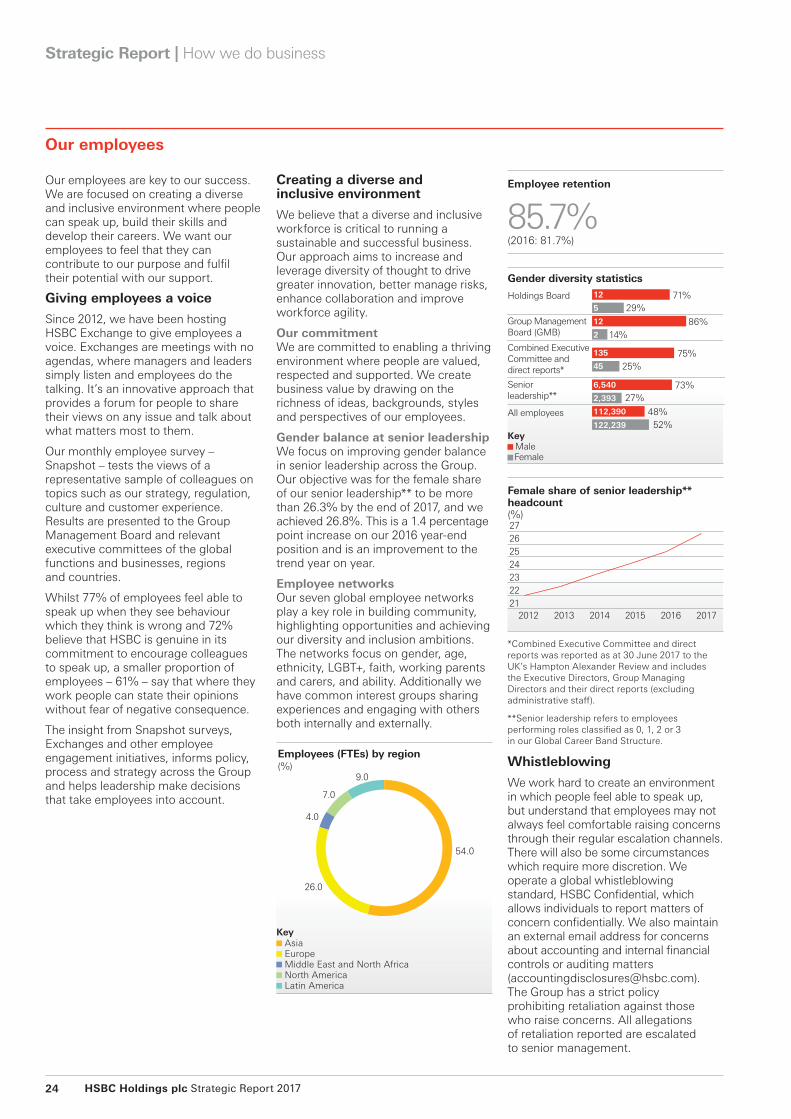
Strategic Report | How we do business
Our employees
Our employees are key to our success.
We are focused on creating a diverse
and inclusive environment where people
can speak up, build their skills and
develop their careers. We want our
employees to feel that they can
contribute to our purpose and fulfil
their potential with our support.
Giving employees a voice
Since 2012, we have been hosting
HSBC Exchange to give employees a
voice. Exchanges are meetings with no
agendas, where managers and leaders
simply listen and employees do the
talking. It’s an innovative approach that
provides a forum for people to share
their views on any issue and talk about
what matters most to them.
Our monthly employee survey –
Snapshot – tests the views of a
representative sample of colleagues on
topics such as our strategy, regulation,
culture and customer experience.
Results are presented to the Group
Management Board and relevant
executive committees of the global
functions and businesses, regions
and countries.
Whilst 77% of employees feel able to
speak up when they see behaviour
which they think is wrong and 72%
believe that HSBC is genuine in its
commitment to encourage colleagues
to speak up, a smaller proportion of
employees – 61% – say that where they
work people can state their opinions
without fear of negative consequence.
The insight from Snapshot surveys,
Exchanges and other employee
engagement initiatives, informs policy,
process and strategy across the Group
and helps leadership make decisions
that take employees into account.
Creating a diverse and inclusive environment
We believe that a diverse and inclusive
workforce is critical to running a
sustainable and successful business.
Our approach aims to increase and
leverage diversity of thought to drive
greater innovation, better manage risks,
enhance collaboration and improve
workforce agility.
Our commitment We are committed to enabling a thriving
environment where people are valued,
respected and supported. We create
business value by drawing on the
richness of ideas, backgrounds, styles
and perspectives of our employees.
Gender balance at senior leadershipWe focus on improving gender balance
in senior leadership across the Group.
Our objective was for the female share
of our senior leadership** to be more
than 26.3% by the end of 2017, and we
achieved 26.8%. This is a 1.4 percentage
point increase on our 2016 year-end
position and is an improvement to the
trend year on year.
Employee networksOur seven global employee networks
play a key role in building community,
highlighting opportunities and achieving
our diversity and inclusion ambitions.
The networks focus on gender, age,
ethnicity, LGBT+, faith, working parents
and carers, and ability. Additionally we
have common interest groups sharing
experiences and engaging with others
both internally and externally.
*Combined Executive Committee and direct
reports was reported as at 30 June 2017 to the
UK’s Hampton Alexander Review and includes
the Executive Directors, Group Managing
Directors and their direct reports (excluding
administrative staff).
**Senior leadership refers to employees
performing roles classified as 0, 1, 2 or 3
in our Global Career Band Structure.
54.0
9.0
7.0
26.0
4.0
Asia
Europe
Middle East and North Africa
North America
Latin America
Key
Employees (FTEs) by region(%)
Employee retention
85.7%(2016: 81.7%)
Holdings Board
Group Management
Board (GMB)
Combined Executive
Committee and
direct reports*
Senior
leadership**
All employees
86%
14%
29%
71%
25%
75%
27%
73%
48%
52%
12
5
6,540
2,393
135
45
112,390
122,239
12
2
Gender diversity statistics
Male
Female
Key
Female share of senior leadership**headcount(%)
2012
26
27
24
25
22
23
21
20172016201520142013
Whistleblowing
We work hard to create an environment
in which people feel able to speak up,
but understand that employees may not
always feel comfortable raising concerns
through their regular escalation channels.
There will also be some circumstances
which require more discretion. We
operate a global whistleblowing
standard, HSBC Confidential, which
allows individuals to report matters of
concern confidentially. We also maintain
an external email address for concerns
about accounting and internal financial
controls or auditing matters
The Group has a strict policy
prohibiting retaliation against those
who raise concerns. All allegations
of retaliation reported are escalated
to senior management.
24 HSBC Holdings plc Strategic Report 2017
Anti-bribery and corruption
As part of financial crime risk
management, we have a global anti-
bribery and corruption policy. The policy
gives practical effect to global initiatives
such as the Organisation of Economic
Co-operation and Development (‘OECD’)
Convention on Combating Bribery of
Foreign Public Officials in International
Business Transactions and Principle 10
of the United Nations Global Compact.
We continue to invest in technology and
training; in 2017 98% of our workforce
was trained via a mandatory e-learning
course ‘My Financial Crime Risk
Responsibilities’.
Tax
We apply the letter and the spirit of the
law in all territories where we operate.
We have adopted the UK tax authority’s
Code of Practice on Taxation for Banks.
As a consequence, we pay our fair share
of tax in the countries in which we
operate. We continue to strengthen our
processes to help ensure our banking
services are not associated with any
arrangements known or suspected to
How we do business
Other
HSBC’s purpose is to connect people
with opportunities. With this purpose
comes the responsibility to protect our
customers, our communities and the
integrity of the financial system.
Non-financial risks
We use a range of tools to monitor and
manage our non-financial risks including
our risk appetite, risk map, top and
emerging risks and stress testing
processes. In 2017, HSBC completed
a multi-year Operational Risk
Transformation Programme, the purpose
of which was to make it easier to
manage operational risk consistently in
HSBC. This included the implementation
of a new operational risk management
framework (‘ORMF’) and system of
record. The new ORMF provides an
end-to-end view of non-financial risks,
enhancing focus on associated controls
and the capital we hold. It provides a
platform to drive forward-looking risk
awareness and assist management
focus. Further details may be found
in the Risk section on page 63 and
page 77 of the Annual Report and
Accounts 2017.
Financial crime compliance
HSBC operates in many countries
around the world. As part of financial
crime risk management, we have built
a strong financial crime compliance
system with a global footprint, and have
a dedicated Financial Crime Risk team.
We have invested heavily in training
and communication for all employees.
Our risk appetite has been set formally.
Further details may be found in the
Risk section on page 63 of the Annual
Report and Accounts 2017.
HSBC Confidential is overseen by our
Conduct & Values Committee and
Group Audit Committee. Investigations
are carried out thoroughly and
independently, drawing on the
expertise of a variety of teams, including
Regulatory Compliance, Human
Resources, Legal, Financial Crime Risk,
Information Security and Internal Audit.
Common themes:
–Allegations of internal fraud by staff.
– Issues with staff behaviour and
personal conduct.
–Weaknesses in adherence to
information security protocols.
1,585Cases were raised during 2017 (2016: 1,102
cases). All cases are subject to investigation.
In 30% of the closed cases in 2017
(2016: 34%), allegations were
substantiated in whole or in part and
appropriate remedial action taken.
Our employees continued
facilitate tax evasion. HSBC continues
to apply global initiatives to improve
tax transparency such as:
–The US Foreign Account Tax
Compliance Act (‘FATCA’);
–The OECD Standard for Automatic
Exchange of Financial Account
Information (also known as the
Common Reporting Standard);
–The Capital Requirements Directive IV
(‘CRD IV’) Country by Country
Reporting; and
–The OECD Base Erosion and Profit
Shifting (‘BEPS’) initiative.
We do not expect BEPS or similar
initiatives adopted by national
governments to adversely impact
HSBC’s results.
Human rights
Our statement on modern slavery can
be found on www.hsbc.com/
our-approach/measuring-our-impact.
Our supplier code of conduct takes into
account legislation on modern slavery
and human rights; over 4,000 of our
largest suppliers have signed the code.
Supporting sustainable growth
In 2017 we launched our strategy to
support sustainable growth, which
focuses on three main areas: sustainable
finance; sustainable networks and
entrepreneurship; and future skills.
Full details are available in our ESG
Supplement released in November 2017.
This year we contributed $136m to
charitable programmes and our
employees volunteered 272,000 hours
to community activities during the
working day. We continue our flagship
environmental partnership, the HSBC
Water Programme.
For more information about what we have
done, see our ESG reporting available on
www.hsbc.com/our-approach/
measuring-our-impact.
2.7
0.5
0.4
0.3
2.3
0.6
Taxes paid by region($bn)
UK
Rest of Europe
Asia
Middle East and North Africa
North America
Latin America
Key
$6.8bn
HSBC Holdings plc Strategic Report 2017 25
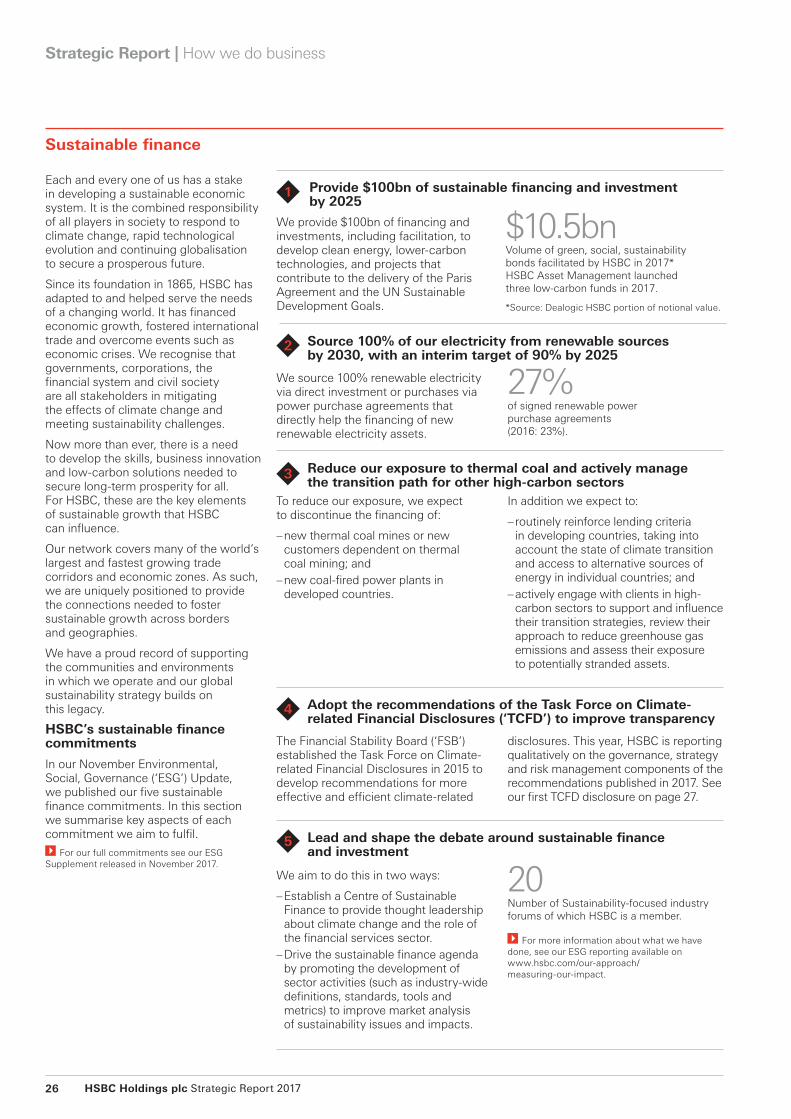
Strategic Report | How we do business
Each and every one of us has a stake
in developing a sustainable economic
system. It is the combined responsibility
of all players in society to respond to
climate change, rapid technological
evolution and continuing globalisation
to secure a prosperous future.
Since its foundation in 1865, HSBC has
adapted to and helped serve the needs
of a changing world. It has financed
economic growth, fostered international
trade and overcome events such as
economic crises. We recognise that
governments, corporations, the
financial system and civil society
are all stakeholders in mitigating
the effects of climate change and
meeting sustainability challenges.
Now more than ever, there is a need
to develop the skills, business innovation
and low-carbon solutions needed to
secure long-term prosperity for all.
For HSBC, these are the key elements
of sustainable growth that HSBC
can influence.
Our network covers many of the world’s
largest and fastest growing trade
corridors and economic zones. As such,
we are uniquely positioned to provide
the connections needed to foster
sustainable growth across borders
and geographies.
We have a proud record of supporting
the communities and environments
in which we operate and our global
sustainability strategy builds on
this legacy.
HSBC’s sustainable finance commitments
In our November Environmental,
Social, Governance (‘ESG’) Update,
we published our five sustainable
finance commitments. In this section
we summarise key aspects of each
commitment we aim to fulfil.
For our full commitments see our ESG
Supplement released in November 2017.
Sustainable finance
Provide $100bn of sustainable financing and investment by 2025
We aim to do this in two ways:
–Establish a Centre of Sustainable
Finance to provide thought leadership
about climate change and the role of
the financial services sector.
–Drive the sustainable finance agenda
by promoting the development of
sector activities (such as industry-wide
definitions, standards, tools and
metrics) to improve market analysis
of sustainability issues and impacts.
20Number of Sustainability-focused industry
forums of which HSBC is a member.
For more information about what we have
done, see our ESG reporting available on
www.hsbc.com/our-approach/
measuring-our-impact.
We source 100% renewable electricity
via direct investment or purchases via
power purchase agreements that
directly help the financing of new
renewable electricity assets.
27%of signed renewable power
purchase agreements
(2016: 23%).
We provide $100bn of financing and
investments, including facilitation, to
develop clean energy, lower-carbon
technologies, and projects that
contribute to the delivery of the Paris
Agreement and the UN Sustainable
Development Goals.
$10.5bnVolume of green, social, sustainability
bonds facilitated by HSBC in 2017*
HSBC Asset Management launched
three low-carbon funds in 2017.
*Source: Dealogic HSBC portion of notional value.
1
Source 100% of our electricity from renewable sources by 2030, with an interim target of 90% by 2025
2
Lead and shape the debate around sustainable finance and investment
5
Adopt the recommendations of the Task Force on Climate-related Financial Disclosures (‘TCFD’) to improve transparency
4
Reduce our exposure to thermal coal and actively manage the transition path for other high-carbon sectors
3
The Financial Stability Board (‘FSB’)
established the Task Force on Climate-
related Financial Disclosures in 2015 to
develop recommendations for more
effective and efficient climate-related
disclosures. This year, HSBC is reporting
qualitatively on the governance, strategy
and risk management components of the
recommendations published in 2017. See
our first TCFD disclosure on page 27.
To reduce our exposure, we expect
to discontinue the financing of:
–new thermal coal mines or new
customers dependent on thermal
coal mining; and
–new coal-fired power plants in
developed countries.
In addition we expect to:
– routinely reinforce lending criteria
in developing countries, taking into
account the state of climate transition
and access to alternative sources of
energy in individual countries; and
–actively engage with clients in high-
carbon sectors to support and influence
their transition strategies, review their
approach to reduce greenhouse gas
emissions and assess their exposure
to potentially stranded assets.
26 HSBC Holdings plc Strategic Report 2017

Initial response to the Financial Stability Board
Reducing global carbon dioxide emissions is a critical challenge for everyone. We recognise its importance and seek to be
a leader in managing climate change risk while developing opportunities with – and for – our customers. We welcome the
new disclosure recommendations from the FSB taskforce, which assist the understanding of climate-related risks, and we
were a signatory to the June 2017 TCFD report. This represents our first disclosure under the framework. We recognise this
will evolve and expand over time.
Next steps
The HSBC Centre of Sustainable Finance, Risk Management and Finance will work with external experts to develop
climate-related scenario analysis and related disclosures.
Task Force on Climate-related Financial Disclosures (‘TCFD’)
Governance Sustainability is a key concern of the HSBC Group Management Board, with five presentations taking
place during 2017.
HSBC’s 2016 Statement on Climate Change may be found on our website at www.hsbc.com/our-approach/
measuring-our-impact. The site gives information on our approach to low/high carbon transition, managing
our direct impact and partnerships.
Our Climate Business Council (‘CBC’), established in 2010, is an internal strategic committee whose role is to
coordinate across the bank, identifying and developing products and services to meet customers’ sustainable
finance needs. There is also a group-wide ESG steering group, chaired by the Group Finance Director, leading
our approach to ESG issues, including external disclosure and materiality considerations.
Strategy HSBC’s strategy is to connect customers to opportunities across a diversified range of products and services.
This, along with our geographical presence in developing markets, gives us a unique opportunity to engage
with our customers and support their transition strategies. HSBC has committed to directing $100bn of
financing and investment to the low-carbon economy by 2025.
In order to facilitate the transition to the low-carbon economy for us and our clients, during 2017 we created
a ‘Global Head of Sustainable Finance’ and an ‘HSBC Centre of Sustainable Finance’. Additionally, via training,
we have expanded our in-house sustainability expertise to approximately 1,300 employees across the Group.
We are committed to strengthening our role as a thought leader in the financial services industry.
During 2017, HSBC’s Global Research Climate Change Centre was ranked number one by Extel and HSBC was
the second-ranked bookrunner by Dealogic for green, social and sustainability bonds. We will work with our
customers in all our businesses to develop sustainable products and support innovation.
Risk Management
Climate risk, both physical and transition, is an increasing risk. During 2017 the Executive Risk Management
Committee approved a framework for measuring transition risks across our loan portfolio. We have identified
the higher transition risk sectors as oil and gas, metals and mining, power and utilities, automobiles, building
and construction, and chemicals. We actively engage with clients in these sectors to support their transition
strategies. We monitor and report our exposure internally, and will do so externally in 2018. Over time we
expect a reduction in the carbon intensity of our portfolio.
Our Sustainability risk policies cover all our lending to sensitive sectors and we apply the Equator Principles
to project finance. Details are available at www.hsbc.com/our-approach/measuring-our-impact. We also
manage the physical risks to our global network relating to climate change by undertaking regular operational
stress testing and contingency planning.
How we do business
HSBC Holdings plc Strategic Report 2017 27
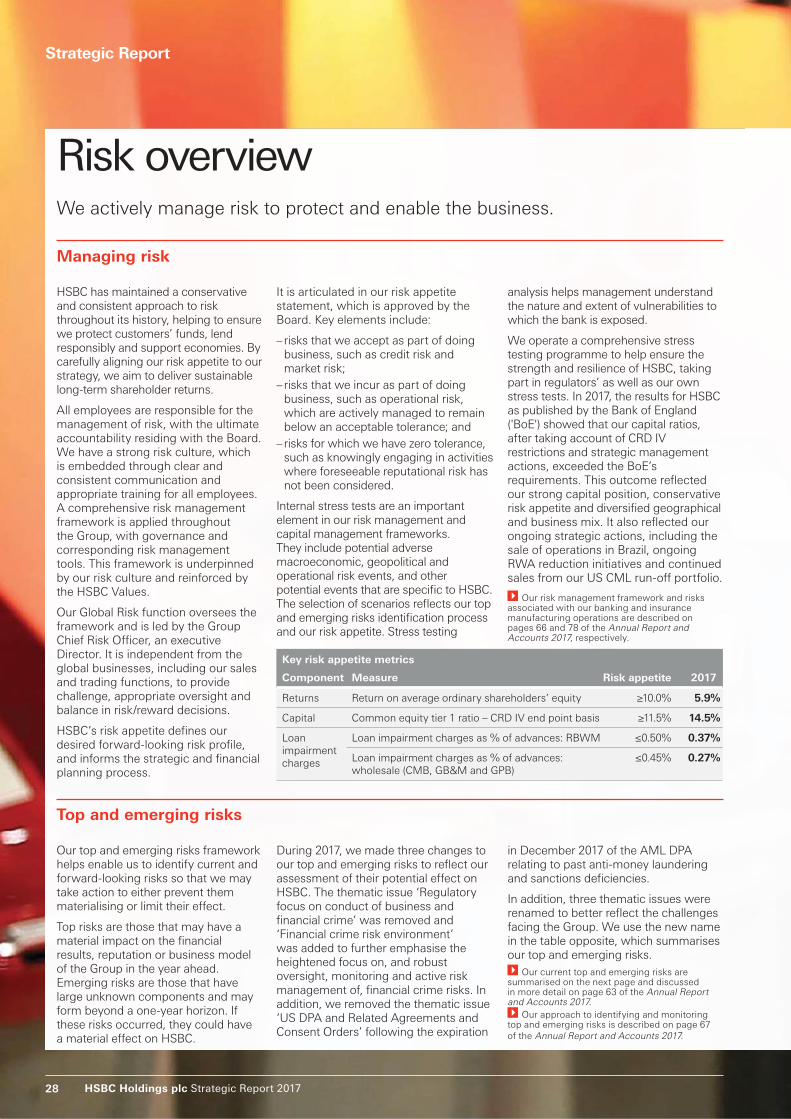
Risk overviewWe actively manage risk to protect and enable the business.
Managing risk
HSBC has maintained a conservative
and consistent approach to risk
throughout its history, helping to ensure
we protect customers’ funds, lend
responsibly and support economies. By
carefully aligning our risk appetite to our
strategy, we aim to deliver sustainable
long-term shareholder returns.
All employees are responsible for the
management of risk, with the ultimate
accountability residing with the Board.
We have a strong risk culture, which
is embedded through clear and
consistent communication and
appropriate training for all employees.
A comprehensive risk management
framework is applied throughout
the Group, with governance and
corresponding risk management
tools. This framework is underpinned
by our risk culture and reinforced by
the HSBC Values.
Our Global Risk function oversees the
framework and is led by the Group
Chief Risk Officer, an executive
Director. It is independent from the
global businesses, including our sales
and trading functions, to provide
challenge, appropriate oversight and
balance in risk/reward decisions.
HSBC’s risk appetite defines our
desired forward-looking risk profile,
and informs the strategic and financial
planning process.
Our top and emerging risks framework
helps enable us to identify current and
forward-looking risks so that we may
take action to either prevent them
materialising or limit their effect.
Top risks are those that may have a
material impact on the financial
results, reputation or business model
of the Group in the year ahead.
Emerging risks are those that have
large unknown components and may
form beyond a one-year horizon. If
these risks occurred, they could have
a material effect on HSBC.
During 2017, we made three changes to
our top and emerging risks to reflect our
assessment of their potential effect on
HSBC. The thematic issue ‘Regulatory
focus on conduct of business and
financial crime’ was removed and
‘Financial crime risk environment’
was added to further emphasise the
heightened focus on, and robust
oversight, monitoring and active risk
management of, financial crime risks. In
addition, we removed the thematic issue
‘US DPA and Related Agreements and
Consent Orders’ following the expiration
in December 2017 of the AML DPA
relating to past anti-money laundering
and sanctions deficiencies.
In addition, three thematic issues were
renamed to better reflect the challenges
facing the Group. We use the new name
in the table opposite, which summarises
our top and emerging risks.
Our current top and emerging risks are summarised on the next page and discussed in more detail on page 63 of the Annual Report and Accounts 2017.
Our approach to identifying and monitoring top and emerging risks is described on page 67
of the Annual Report and Accounts 2017.
It is articulated in our risk appetite
statement, which is approved by the
Board. Key elements include:
– risks that we accept as part of doing
business, such as credit risk and
market risk;
– risks that we incur as part of doing
business, such as operational risk,
which are actively managed to remain
below an acceptable tolerance; and
–risks for which we have zero tolerance,
such as knowingly engaging in activities
where foreseeable reputational risk has
not been considered.
Internal stress tests are an important
element in our risk management and
capital management frameworks.
They include potential adverse
macroeconomic, geopolitical and
operational risk events, and other
potential events that are specific to HSBC.
The selection of scenarios reflects our top
and emerging risks identification process
and our risk appetite. Stress testing
analysis helps management understand
the nature and extent of vulnerabilities to
which the bank is exposed.
We operate a comprehensive stress
testing programme to help ensure the
strength and resilience of HSBC, taking
part in regulators’ as well as our own
stress tests. In 2017, the results for HSBC
as published by the Bank of England
('BoE') showed that our capital ratios,
after taking account of CRD IV
restrictions and strategic management
actions, exceeded the BoE’s
requirements. This outcome reflected
our strong capital position, conservative
risk appetite and diversified geographical
and business mix. It also reflected our
ongoing strategic actions, including the
sale of operations in Brazil, ongoing
RWA reduction initiatives and continued
sales from our US CML run-off portfolio.
Our risk management framework and risks associated with our banking and insurance manufacturing operations are described on pages 66 and 78 of the Annual Report and Accounts 2017, respectively.
Key risk appetite metrics
Component Measure Risk appetite 2017
Returns Return on average ordinary shareholders’ equity ≥10.0% 5.9%
Capital Common equity tier 1 ratio – CRD IV end point basis ≥11.5% 14.5%
Loan
impairment
charges
Loan impairment charges as % of advances: RBWM ≤0.50% 0.37%
Loan impairment charges as % of advances:
wholesale (CMB, GB&M and GPB)
≤0.45% 0.27%
Top and emerging risks
Strategic Report
28 HSBC Holdings plc Strategic Report 2017

Risk Trend Mitigants
Externally driven
Economic outlook and
capital flows
We actively monitor our wholesale credit and trading portfolios, including undertaking stress
tests, to identify sectors and clients that may come under stress due to economic conditions
in the eurozone, mainland China and in the UK as negotiations to exit from the EU continue.
Geopolitical risk We continually assess the impact of geopolitical events on our businesses and exposures, and
take steps to mitigate them, where required, to help ensure we remain within our risk appetite.
We have also strengthened physical security at our premises where the risk of terrorism is
heightened.
• The credit cycle We continue to undertake detailed reviews of our portfolios and are proactively assessing
customers and sectors likely to come under stress as a result of geopolitical or macroeconomic
events, reducing limits where appropriate.
Cyber threat and
unauthorised access
to systems
We continue to strengthen our cyber control framework and implement initiatives to improve our
resilience and cybersecurity capabilities, including threat detection and analysis, access control,
payment systems controls, data protection and backup and recovery.
• Regulatory, technological and
sustainability developments
including conduct, with
adverse impact on business
model and profitability
We proactively engage with regulators wherever possible to help ensure new regulatory
requirements are effectively implemented, and work with them in relation to their investigations
into historical activities. We also engage with non-governmental organisations to help ensure
our policies address environmental concerns.
Financial crime risk
environment
We continue to develop and enhance the Financial Crime Risk function and augment our risk
management capabilities to further improve our financial crime detection and compliance
capabilities. We will continue to take steps to enhance our defences against financial crime across
our operations globally to help ensure our Global Standards are sustainable over the long term.
Internally driven
IT systems infrastructure
and resilience
We continue to monitor and improve service resilience across our technology infrastructure,
enhancing our problem diagnosis/resolution and change execution capabilities, reducing service
disruption to our customers.
Impact of organisational
change and regulatory
demands on employees
We continue to focus on resourcing and employee development to meet regulatory changes
as well as to maintain and enhance our leadership succession strength.
Execution risk The Group Change Committee oversees the progress of the highest priority programmes,
underpinning the implementation of our strategic actions to help ensure that we achieve
a consistent on time, on budget and on quality delivery across these critical initiatives.
• Risks arising from the receipt
of services from third parties
We have strengthened essential governance processes and relevant policies relating to how we
identify, assess, mitigate and manage risks across the range of third parties with which we do
business. This includes control monitoring and assurance throughout the third-party lifecycle.
Enhanced model risk
management expectations
We have strengthened our model risk management framework by establishing an independent
second line of defence Model Risk Management sub-function, and we continue to enhance
our existing policy and standards in order to address evolving regulatory, external and
internal requirements.
Data management We continue to improve our insights, consistency of data aggregation, reporting and decisions
through ongoing enhancement of our data governance, data quality and architecture framework.
Risk heightened during 2017
Risk remained at the same level as 2016
Thematic risk renamed during 2017•
Risk overview
HSBC Holdings plc Strategic Report 2017 29

Instilling the right behaviours, and
driving and encouraging actions that
are aligned to organisational values
and expectations, are essential.
We therefore have a number of
programmes to reinforce our values.
Embedding our values in our remuneration framework
RemunerationOur remuneration policy supports the achievement
of our strategic objectives by balancing reward for
short- and long-term sustainable performance.
Remuneration principles
The remuneration strategy for our
employees is based on a series of
key principles. What we do
–Focus on total compensation
with a strong link between pay
and performance
–Judge not only what is achieved, but
also how it is achieved, in line with the
HSBC Values
–Operate a thorough performance
management and HSBC Values
assessment process
–Recognise and reward our employees
for outstanding positive behaviour
–Design our policy to align compensation
with long-term stakeholder interests
–Apply consequence management
to strengthen the alignment between
risk and reward
What we don’t do
–Reward inappropriate or excessive
risk taking or short-term performance
at the expense of long-term company
sustainability
–Use only a formulaic approach to
determine bonuses for our executives
–Award discretionary bonuses to
employees rated unacceptable against
the HSBC Values and behaviours
–Allow our employees to hedge against
their unvested or retained awards
–Offer employment contracts with a
notice period of more than 12 months
–Have pre-arranged individual severance
agreements
Pay Outcomes
Positive
adjustments
– Individuals who exhibit exceptional conduct and behaviours which go
beyond the normal course of an employee’s responsibilities, and set an
outstanding example of our Values-aligned behaviours and conduct
expectations, are awarded positive variable pay adjustments during
the year.
Global
consequence
management
policy
– This provides a set of guidelines designed to align the handling of
employee conduct breaches, and support line managers in delivering
greater consistency of outcomes and messages.
– Ensures clear messaging to employees on the impact of any
inappropriate conduct as part of reward communications.
Global recognition
programme
– Introduced from July 2015 as the Group’s global peer-to-peer
recognition programme, designed to incentivise compliance by
allowing colleagues to recognise and reward positive behaviours.
– Includes communication of positive stories on our intranet (HSBC Now).
Performance
management
– Employees set objectives, which connect business, team and individual
goals, and are guided by expected behaviours aligned to our core values.
– All employees receive a behaviour rating based on their adherence
to HSBC Values to ensure performance is judged not only on what is
achieved, but also on how it is achieved.
– Employees and managers are encouraged to hold frequent conversations
throughout the year, exploring alternative ways to stay connected
outside the regular performance management cycle using
a mix of informal and formal check-ins on a range of topics,
including performance, development and well-being.
Strategic Report
30 HSBC Holdings plc Strategic Report 2017

(Audited)
(in £000)Base
salaryFixed pay
allowance
Cash in lieu of
pensionAnnual
incentive LTI1 Sub-totalTaxable benefits
Non-taxable
benefitsNotional
returns Total
Douglas Flint2
2017 1,125 — 338 — — 1,463 83 64 — 1,610
2016 1,500 — 450 — — 1,950 100 86 — 2,136
Stuart Gulliver3
2017 1,250 1,700 375 2,127 — 5,452 500 71 63 6,086
2016 1,250 1,700 375 1,695 — 5,020 557 71 27 5,675
Iain Mackay
2017 700 950 210 1,334 — 3,194 64 37 42 3,337
2016 700 950 210 987 — 2,847 52 37 17 2,953
Marc Moses
2017 700 950 210 1,358 — 3,218 16 38 42 3,314
2016 700 950 210 1,005 — 2,865 15 38 18 2,936
1 The first LTI award was made in February 2017, with a performance period ending in 2019. Vesting of the first LTI award will be included in the single figure
table for the financial year ending on 31 December 2019.
2 Douglas Flint stepped down from the Board on 30 September 2017 and his remuneration reflects time served as an executive Director. Details on retirement
arrangements are provided on page 151 of the Annual Report and Accounts 2017.
3 To meet regulatory deferral requirements for 2017, 60% of the annual incentive award of Stuart Gulliver has been deferred in shares and will vest in five equal
instalments between the third and seventh anniversary of the grant date.
Remuneration for our executive Directors
How we set our variable pay pool
When deciding on the variable pay pool, the Remuneration Committee
considers a number of factors, which are set out in the following table:
Our variable pay pool is $3,303m, an increase
of 8.8% compared with 2016.
Performance and
risk appetite
statement
– Our variable pay pool takes into account our performance
in the context of our risk appetite.
Countercyclical
funding
methodology
– To dampen effects of economic cycles, the variable pay
pool’s size has a floor and a ceiling, and we also limit the
payout ratio as performance increases to prevent the risk
of inappropriate behaviour.
Distribution of
profits
– Our funding methodology ensures that the distribution of
post-tax profit between capital, shareholders and variable
pay is appropriate, and that the majority of post-tax profit
is allocated to capital and shareholders.
Commerciality
and affordability
– We face challenges arising from being headquartered in
the UK, which has more stringent reward practices. We
take into account these challenges in determining the size
of the variable pay pool to ensure we can continue to
attract and retain talent in key markets.
Our remuneration policy for executive Directors was approved in
our 2016 Annual General Meeting (‘AGM’) and is intended to apply for
three performance years until the AGM in 2019. Full details of our
remuneration policy can be found online in our Directors’ Remuneration
Policy Supplement 2017.
The table below shows the amount our executive
Directors earned in 2017.
For details of Directors’ pay and performance for 2017,
see the Directors’ Remuneration Report on page 141 of the
Annual Report and Accounts 2017.
Variable pay pool($m)
Group
Of which Global
Banking and Markets
3,035
3,303
954
1,063
2017
2016
2017
2016
Remuneration
Variable pay for our executive Directors
Variable pay for our executive Directors is driven
by scorecard achievement. Targets in the scorecard
are set according to our key performance
indicators to ensure linkages between our
strategy and remuneration policies and outcome.
See the Directors’ Remuneration Report on page 146 of the
Annual Report and Accounts 2017 for further details.
HSBC Holdings plc Strategic Report 2017 31
Footnotes
1 Achieved Mexico profit before tax target on a local
currency basis; US dollar target set using the 2014
average exchange rate.
2 Further detail on the Monitor can be found on page 78
of the Annual Report and Accounts 2017.
3 Net operating income before loan impairment
charges and other credit risk provisions, also
referred to as revenue.
4 ‘Other personal lending’ includes personal non-
residential closed-end loans and personal overdrafts.
5 ‘Investment distribution’ includes Investments, which
comprises mutual funds (HSBC manufactured and
third party), structured products and securities trading,
and Wealth Insurance distribution, consisting of HSBC
manufactured and third-party life, pension and
investment insurance products.
6 ‘Other’ mainly includes the distribution and
manufacturing (where applicable) of retail and
credit protection insurance.
7 Adjusted return on average risk-weighted assets
(‘RoRWA’) is used to measure the performance of
RBWM, CMB, GB&M and GPB. Adjusted RoRWA is
calculated using profit before tax and reported average
risk-weighted assets at constant currency adjusted for
the effects of significant items.
8 ‘Markets products, Insurance and Investments and
Other’ includes revenue from Foreign Exchange,
insurance manufacturing and distribution, interest rate
management and global banking products.
9 In 2017, credit and funding valuation adjustments
included an adverse fair value movement of $546m
on the tightening of own credit spreads on structured
liabilities (2016: adverse fair value movement of $125m;
2015: favourable fair value movement of $163m).
10 ‘Other’ in GB&M includes net interest earned on free
capital held in the global business not assigned to
products, allocated funding costs and gains resulting
from business disposals. Within the management view
of adjusted revenue, notional tax credits are allocated
to the businesses to reflect the economic benefit
generated by certain activities which is not reflected
within operating income; for example, notional credits
on income earned from tax-exempt investments where
the economic benefit of the activity is reflected in tax
expense. In order to reflect the total operating income
on an IFRS basis, the offsets to these tax credits are
included within ‘Other’.
11 Central Treasury includes revenue relating to BSM
of $2,688m (2016: $3,007m; 2015: $2,805m), interest
expense of $1,275m (2016: $967m; 2015: $696m) and
favourable valuation differences on issued long-term
debt and associated swaps of $122m (2016: loss of
$271m; 2015: loss of $63m). Revenue relating to BSM
includes other internal allocations, including notional
tax credits to reflect the economic benefit generated by
certain activities which is not reflected within operating
income, for example notional credits on income earned
from tax-exempt investments where the economic
benefit of the activity is reflected in tax expense. In order
to reflect the total operating income on an IFRS basis,
the offsets to these tax credits are included in other
Central Treasury.
12 Other miscellaneous items in Corporate Centre includes
internal allocations relating to Legacy Credit.
Strategic Report
32 HSBC Holdings plc Strategic Report 2017

Supplementary information
Status of the Strategic Report 2017
Further copies of the Strategic Report 2017 and the Annual Report and Accounts 2017
may be obtained from:
Global Communications
HSBC Holdings plc
8 Canada Square
London E14 5HQ
United Kingdom
Communications (Asia)
The Hongkong and Shanghai
Banking Corporation Limited
1 Queen’s Road Central
Hong Kong
US Communications
HSBC Bank USA, N.A.
1 West 39th Street, 9th Floor
New York, NY 10018
USA
The Strategic Report 2017 and the Annual Report and Accounts 2017 may also be downloaded from
the HSBC website, www.hsbc.com.
Copies of the Annual Report and Accounts 2017
This is a part of HSBC Holdings plc’s
Annual Report and Accounts 2017 and
is not the Group’s statutory accounts. It
does not contain the full text of the
Directors’ Report, and it does not
contain sufficient information to allow as
full an understanding of the results and
state of affairs of the Group and of its
policies and arrangements concerning
Directors’ remuneration as would be
provided by the full Annual Report and
Accounts 2017.
Supplementary information
HSBC Holdings plc Strategic Report 2017 33
Enquiries
Any enquiries relating to your
shareholdings on the share register,
for example, transfers of shares,
change of name or address, lost share
certificates or dividend cheques should
be sent to the Registrars at an address
given below.
The Registrars offer an online facility,
Investor Centre, which enables
shareholders to manage their
shareholding electronically.
Persons whose shares are held on
their behalf by another person may
have been nominated to receive
communications from HSBC pursuant
to section 146 of the UK Companies Act
2006 (‘nominated person’). The main
point of contact for a nominated person
remains the registered shareholder (for
example, your stockbroker, investment
manager, custodian or other person
who manages the investment on
your behalf).
Any changes or queries relating to a
nominated person’s personal details and
holding (including any administration
thereof) must continue to be directed
to the registered shareholder and not
HSBC’s Registrars. The only exception
is where HSBC, in exercising one of its
powers under the UK Companies Act
2006, writes to nominated persons
directly for a response.
Principal RegisterComputershare Investor Services PLC
The Pavilions
Bridgwater Road
Bristol BS99 6ZZ
United Kingdom
Telephone: +44 (0) 870 702 0137
Email via website:
www.investorcentre.co.uk/contactus
Investor Centre:
www.investorcentre.co.uk
Shareholder enquiries and communications
Hong Kong Overseas Branch RegisterComputershare Hong Kong Investor
Services Limited
Rooms 1712-1716, 17th Floor
Hopewell Centre
183 Queen’s Road East
Hong Kong
Telephone: +852 2862 8555
Email: [email protected]
Investor Centre:
www.investorcentre.com/hk
Holders of shares through Euroclear FranceHSBC France
103 Avenue des Champs Élysées
75419 Paris Cedex 08
France
Telephone: +33 1 40 70 22 56
Email: ost-agence-des-titres-hsbc-reims.
Website: www.hsbc.fr
Holders of ADSsThe Bank of New York Mellon
Depositary Receipts
PO Box 43006
Providence
RI 02940-3006
USA
Telephone (US): +1 877 283 5786
Telephone (international): +1 201 680 6825
Email: [email protected]
Website: www.bnymellon.com/shareowner
Bermuda Overseas Branch RegisterInvestor Relations Team
HSBC Bank Bermuda Limited
6 Front Street
Hamilton HM 11
Bermuda
Telephone: +1 441 299 6737
Email: [email protected]
Investor Centre:
www.investorcentre.co.uk/bm
Strategic Report | Supplementary information
34 HSBC Holdings plc Strategic Report 2017
Electronic communications
Shareholders may at any time choose
to receive corporate communications
in printed form or to receive notifications
of their availability on HSBC’s website.
To receive future notifications of
the availability of a corporate
communication on HSBC’s website
by email, or revoke or amend an
instruction to receive such notifications
by email, go to www.hsbc.com/
ecomms. If you provide an email
address to receive electronic
communications from HSBC, we will
also send notifications of your dividend
entitlements by email. If you received a
notification of the availability of this
document on HSBC’s website and
would like to receive a printed copy,
or if you would like to receive future
corporate communications in printed
form, please write or send an email
(quoting your shareholder reference
number) to the appropriate Registrars
at an address given on the previous
page. Printed copies will be provided
without charge.
A Chinese translation of this and future
documents may be obtained on request
from the Registrars. Please also contact
the Registrars if you have received a
Chinese translation of this document
and do not wish to receive such
translations in future.
Persons whose shares are held on
their behalf by another person may
have been nominated to receive
communications from HSBC pursuant
to section 146 of the UK Companies
Act 2006 (‘nominated person’). The
main point of contact for a nominated
person remains the registered
shareholder (for example, your
stockbroker, investment manager,
custodian or other person who manages
the investment on your behalf). Any
changes or queries relating to a
nominated person’s personal details and
holding (including any administration
thereof) must continue to be directed
to the registered shareholder and not
HSBC’s Registrars. The only exception
is where HSBC, in exercising one of its
powers under the UK Companies Act
2006, writes to nominated persons
directly for a response.
Shareholder enquiries and communications continued
Supplementary information
HSBC Holdings plc Strategic Report 2017 35

Strategic Report | Supplementary information
Report of the auditorsThe auditors’ report on the full accounts
for the year ended 31 December 2017
was unqualified, and their statement
under section 496 (whether the Strategic
Report 2017 and the Annual Report and
Accounts 2017 and the Directors’ Report
are consistent with the accounts) of the
Companies Act 2006 was unqualified.
Certain defined termsUnless the context requires otherwise,
‘HSBC Holdings’ means HSBC Holdings
plc and ‘HSBC’, the ‘Group’, ‘we’, ‘us’
and ‘our’ refer to HSBC Holdings
together with its subsidiaries. Within
this document the Hong Kong Special
Administrative Region of the People’s
Republic of China is referred to as
‘Hong Kong’. When used in the terms
‘shareholders’ equity’ and ‘total
shareholders’ equity’, ‘shareholders’
means holders of HSBC Holdings
ordinary shares and those preference
shares and capital securities issued
by HSBC Holdings classified as equity.
The abbreviations ‘$m’, ‘$bn’ and ‘$tn’
represent millions, billions (thousands
of millions) and trillions of US dollars,
respectively.
© Copyright HSBC Holdings plc 2018
All rights reserved
No part of this publication may be
reproduced, stored in a retrieval
system, or transmitted, in any form or
by any means, electronic, mechanical,
photocopying, recording, or otherwise,
without the prior written permission
of HSBC Holdings plc.
Published by Global Finance,
HSBC Holdings plc, London
Designed by Superunion
(formerly Addison Group), London
www.superunion.com
Photography Cover, inside front cover-page 1, page 27: Getty Images
Pages 2-3: Terry Tam, The Hongkong and Shanghai Banking Corporation
Limited, Hong Kong
Pages 4 (Group Chairman), 7 (Group Chief Executive): Charles Best
Pages 10-13: David George, HSBC Bank Egypt S.A.E., Cairo, Egypt
Pages 18-21: Ramit Soni, The Hongkong and Shanghai Banking
Corporation Limited, Mumbai, India
Pages 22-23: Arunabha Hajra, The Hongkong and Shanghai Banking
Corporation Limited, Mumbai, India
Pages 28-29: Global Communications, HSBC Holdings plc
Inside back cover: Laurie Mae Gucilatar, HSBC Electronic Data
Processing (Philippines), Inc., Quezon City, Philippines
36 HSBC Holdings plc Strategic Report 2017

Printed by Park Communications Limited, London,
on Revive 100 Offset board and paper using
vegetable oil-based inks. Made in Austria, the
stocks comprise 100% de-inked post-consumer
waste. Pulps used are totally chlorine-free.
The FSC® recycled logo identifies
a paper which contains 100% post-
consumer recycled fibre certified in
accordance with the rules of the
Forest Stewardship Council®.

HSBC Holdings plc8 Canada SquareLondon E14 5HQUnited KingdomTelephone: 44 020 7991 8888www.hsbc.com