hsbc holdings plc - 3q17 earnings release audio webcast ... · there will be an audio webcast...
TRANSCRIPT
HSBC Holdings plc Registered Office and Group Head Office: 8 Canada Square, London E14 5HQ, United Kingdom Web: www.hsbc.com Incorporated in England with limited liability. Registered in England: number 617987
Hong Kong Exchanges and Clearing Limited and The Stock Exchange of Hong Kong Limited take no responsibility for the contents of this document, make no representation as to its accuracy or completeness and expressly disclaim any liability whatsoever for any loss howsoever arising from or in reliance upon the whole or any part of the contents of this document.
HSBC Holdings plc
Overseas Regulatory Announcement The attached announcement has been released to the other stock exchanges on which HSBC Holdings plc is listed. The Board of Directors of HSBC Holdings plc as at the date of this announcement comprises: Mark Tucker*, Stuart Gulliver, Phillip Ameen†, Kathleen Casey†, Laura Cha†, Henri de Castries†, Lord Evans of Weardale†, Joachim Faber†, Irene Lee†, John Lipsky†, Iain Mackay, Heidi Miller†, Marc Moses, David Nish†, Jonathan Symonds†, Jackson Tai† and Pauline van der Meer Mohr†. * Non-executive Group Chairman † Independent non-executive Director Hong Kong Stock Code: 5
Registered Office and Group Head Office:
8 Canada Square, London E14 5HQ, United Kingdom
Web: www.hsbc.com
Incorporated in England with limited liability. Registered number 617987
We only advise on our own life assurance, pensions and unit trusts
30 October 2017
HSBC HOLDINGS PLC
3Q17 EARNINGS RELEASE
AUDIO WEBCAST AND CONFERENCE CALL
There will be an audio webcast presentation and conference call today for investors and analysts. The speakers will be: Stuart Gulliver, Group Chief Executive; and Iain Mackay, Group Finance Director. A copy of the presentation to investors and analysts is attached and is also available to view and download at http://www.hsbc.com/investor-relations/events-and-presentations. Full details of how to access the conference call appear below and details of how to access the webcast can also be found at: www.hsbc.com/investor-relations/group-results-and-reporting Time: 7.30am (London); 3.30pm (Hong Kong); and 3.30am (New York). Conference call access numbers:
Restrictions may exist when accessing freephone/toll-free numbers using a mobile
telephone.
Passcode: HSBC Toll-free Toll
UK 0800 279 5983 US 1866 629 0054 Hong Kong 800 933 234 International +44 1452 584 928
Replay access details from 30 October 2017, 10:45am GMT (available until
Thursday, 30 November 2017, 10:45am GMT):
Passcode: 85745087
Toll-free Toll
UK 0800 953 1533 US 1866 247 4222 Hong Kong 800 901 393 International +44 1452 550 000 Note to editors:
The HSBC Group
HSBC Holdings plc, the parent company of the HSBC Group, is headquartered in London. The Group serves customers worldwide from around 3,900 offices in 67 countries and territories in Europe, Asia, North and Latin America, and the Middle East and North Africa. With assets of US$2,526bn at 30 September 2017, HSBC is one of the world’s largest banking and financial services organisations.
ends/all
Presentation to Investors and AnalystsHSBC Holdings plc 3Q 2017 Results
World’s Best Bank

11
Our highlights
3rd Quarter 2017
Reported PBT(3Q16: $0.8bn)
$4.6bn
3Q17 Financial Performance(vs. 3Q16 unless otherwise stated)
Balance Sheet and capital
Strategy execution
Adjusted PBT(3Q16: $5.5bn)
$5.4bnReported RoE1(9M16: 4.4%)
8.2%Adjusted Jaws2
(4.9)%
CET1 ratio3(3Q16: 13.9%)
14.6%
A/D ratio(3Q16: 67.9%)
70.7%
‒ $69bn or 8% lending growth since 3Q16 (excluding CML run-off and red-inked balances); $34bn or 3% growth in deposit balances
‒ Strong capital position with a CET1 ratio of 14.6% and a leverage ratio of 5.7%
‒ Completed 71% of the $2bn buy-back announced in July 2017
‒ Further $13bn of RWA reductions in 3Q17 bringing the total reduction to $309bn since the start of 2015
‒ $5.2bn of annual run-rate cost savings realised and remain committed to delivering positive jaws for 2017
‒ Continue to make good progress with actions to deploy capital and deliver revenue growth:
‒ Delivered growth from our international network with 7% increase in transaction banking products and a 14% rise in synergies between global businesses
‒ Pivot to Asia generating returns and driving over 70% of Group profits; 17% lending growth vs. 3Q16;
‒ $1.1bn lending growth in Guangdong vs. 3Q16
‒ Maintained momentum in Asian Insurance and Asset Management businesses with annualised new business premiums and AuM up 13% and 17% respectively
‒ Reported PBT of $4.6bn was $3.8bn higher than 3Q16
‒ Adjusted PBT of $5.4bn:
‒ Revenue of $13.0bn up $0.3bn or 3% up in all three of our largest global businesses:
‒ RBWM up $0.3bn or 6% primarily from increased deposit revenue and included favourable market impacts; excluding these market impacts, revenue increased 5%
‒ CMB up $0.2bn or 5% driven by our Global Liquidity and Cash Management business
‒ GB&M up $0.1bn or 2% primarily from our transaction banking businesses, notably our Global Liquidity and Cash Management and Securities Services businesses
‒ Lower LICs reflecting a stable credit environment
‒ Increase in operating costs of 7% in part reflecting planned investment in business growth as previously disclosed and increased performance-related costs
9M17
‒ Reported PBT of $14.9bn was $4.3bn higher than 9M16
‒ Adjusted PBT of $17.4bn was $1.2bn or 8% higher than 9M16
‒ Adjusted revenue of $39.1bn was $1.1bn higher than 9M16 reflecting the increased value of our deposit franchise across RBWM and CMB; GB&M revenue 6% higher, despite subdued market conditions
‒ Adjusted costs of $22.4bn increased by $0.9bn or 4% in part reflecting investment for growth
2
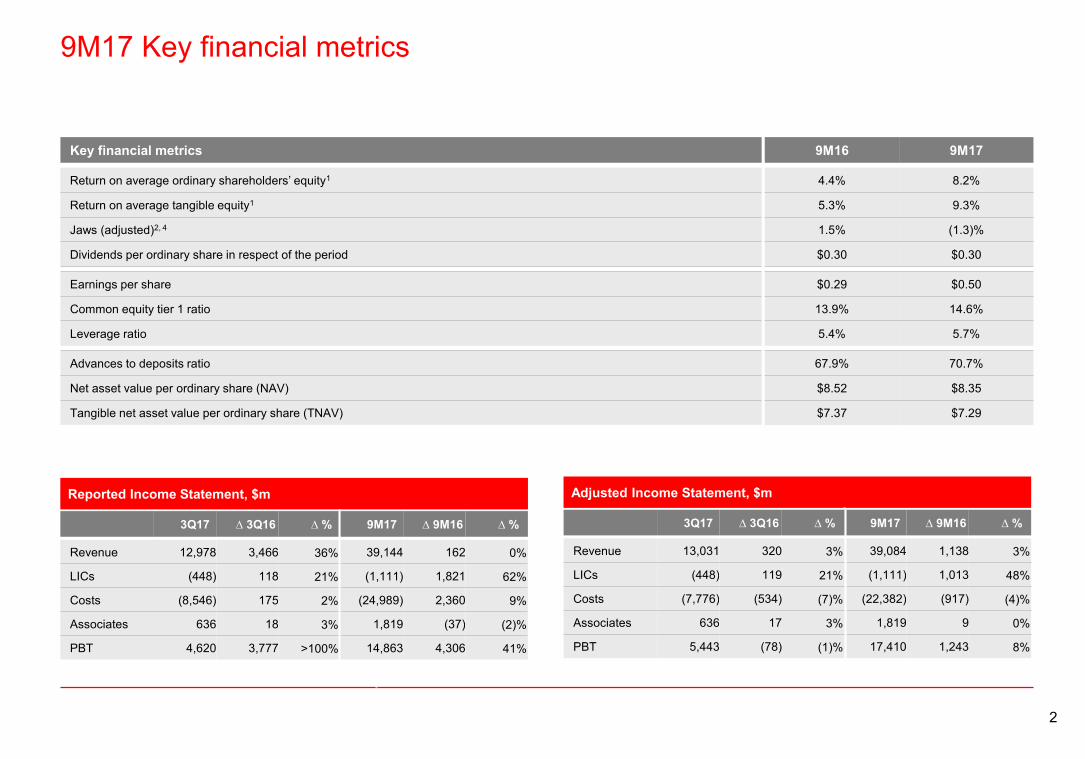
9M17 Key financial metrics
Return on average ordinary shareholders’ equity1
Return on average tangible equity1
Jaws (adjusted)2, 4
Dividends per ordinary share in respect of the period
Key financial metrics
4.4% 8.2%
5.3% 9.3%
1.5% (1.3)%
$0.30 $0.30
9M16 9M17
Advances to deposits ratio
Net asset value per ordinary share (NAV)
Tangible net asset value per ordinary share (TNAV)
67.9% 70.7%
$8.52 $8.35
$7.37 $7.29
Earnings per share
Common equity tier 1 ratio
Leverage ratio
$0.29 $0.50
13.9% 14.6%
5.4% 5.7%
Reported Income Statement, $m Adjusted Income Statement, $m
Revenue 12,978 3,466 36% 39,144 162 0%
LICs (448) 118 21% (1,111) 1,821 62%
Costs (8,546) 175 2% (24,989) 2,360 9%
Associates 636 18 3% 1,819 (37) (2)%
PBT 4,620 3,777 >100% 14,863 4,306 41%
3Q17 ∆ 3Q16 ∆ % 9M17 ∆ 9M16 ∆ %
Revenue 13,031 320 3% 39,084 1,138 3%
LICs (448) 119 21% (1,111) 1,013 48%
Costs (7,776) (534) (7)% (22,382) (917) (4)%
Associates 636 17 3% 1,819 9 0%
PBT 5,443 (78) (1)% 17,410 1,243 8%
3Q17 ∆ 3Q16 ∆ % 9M17 ∆ 9M16 ∆ %
3
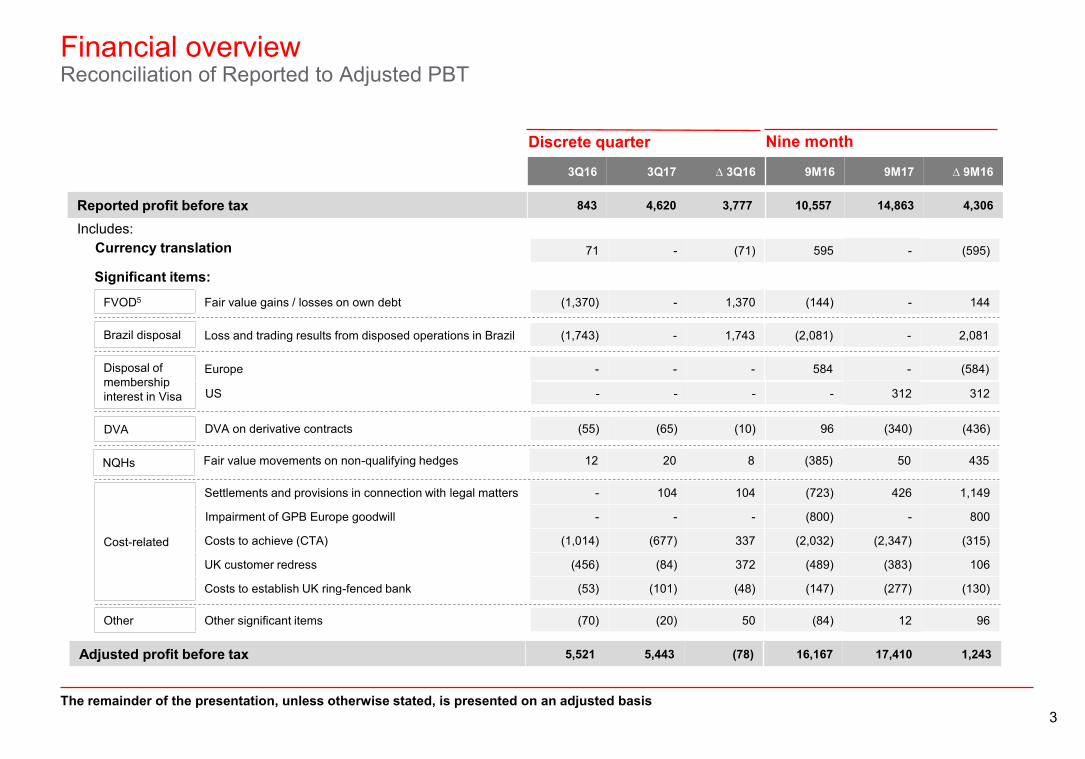
Financial overviewReconciliation of Reported to Adjusted PBT
The remainder of the presentation, unless otherwise stated, is presented on an adjusted basis
Discrete quarter
FVOD5
Brazil disposal
Cost-related
Other
Loss and trading results from disposed operations in Brazil (1,743) - 1,743 (2,081) - 2,081
Fair value gains / losses on own debt (1,370) - 1,370 (144) - 144
Settlements and provisions in connection with legal matters - 104 104 (723) 426 1,149
Impairment of GPB Europe goodwill - - - (800) - 800
Costs to achieve (CTA) (1,014) (677) 337 (2,032) (2,347) (315)
UK customer redress (456) (84) 372 (489) (383) 106
Costs to establish UK ring-fenced bank (53) (101) (48) (147) (277) (130)
Significant items:
Currency translation 71 - (71) 595 - (595)
Other significant items (70) (20) 50 (84) 12 96
Reported profit before tax 843 4,620 3,777 10,557 14,863 4,306
Adjusted profit before tax 5,521 5,443 (78) 16,167 17,410 1,243
Includes:
3Q16 3Q17 ∆ 3Q16 9M16 9M17 ∆ 9M16
DVA DVA on derivative contracts (55) (65) (10) 96 (340) (436)
NQHs Fair value movements on non-qualifying hedges 12 20 8 (385) 50 435
Nine month
Disposal of membership interest in Visa
Europe - - - 584 - (584)
US - - - - 312 312

4
9M17 Profit before taxHigher adjusted PBT from increased revenue and reduced LICs partly offset by increased costs
9M17 vs. 9M16
RBWM 4,076 5,058 982 24%
CMB 4,472 5,086 614 14%
GB&M 4,134 4,938 804 19%
GPB 254 197 (57) (22)%
Corporate Centre 3,231 2,130 (1,101) (34)%
Group 16,167 17,410 1,243 8%
Europe 2,509 2,341 (168) (7)%
Asia 10,948 12,116 1,167 11%
Middle East and North Africa 1,182 1,190 8 1%
North America 1,071 1,287 216 20%
Latin America 457 477 20 4%
Group 16,167 17,410 1,243 8%
Revenue
LICs
Operating expenses
Share of profits in associates and joint ventures
Profit before tax
Adjusted PBT by item
$39,084m
9M17 ∆ 9M16
($1,111m)
($22,382m)
$1,819m
$17,410m
9
(917)
1,013
1,243
1,138
8%
3%
48%
0%
Adjusted PBT by global business, $m 9M16 9M17 ∆ 9M16 ∆ %
Adjusted PBT by geography, $m 9M16 9M17 ∆ 9M16 ∆ %
(4)%
adverse favourable
Jaws2
(1.3)%

5
3Q17 Profit before taxIncreased revenue and lower LICs offset by increased costs
3Q17 vs. 3Q16
RBWM 1,533 1,703 170 11%
CMB 1,527 1,643 116 8%
GB&M 1,582 1,535 (47) (3)%
GPB 72 54 (18) (25)%
Corporate Centre 807 507 (300) (37)%
Group 5,521 5,443 (78) (1)%
Europe 865 540 (325) (38)%
Asia 3,791 4,009 218 6%
Middle East and North Africa 320 370 50 16%
North America 388 361 (27) (7)%
Latin America 157 163 6 4%
Group 5,521 5,443 (78) (1)%
Revenue
LICs
Operating expenses
Share of profits in associates and joint ventures
Profit before tax
Adjusted PBT by item
$13,031m
3Q17 ∆ 3Q16
($448m)
($7,776m)
$636m
$5,443m
17
(534)
119
320
(78) (1)%
3%
21%
3%
Adjusted PBT by global business, $m 3Q16 3Q17 ∆ 3Q16 ∆ %
Adjusted PBT by geography, $m 3Q16 3Q17 ∆ 3Q16 ∆ %
(7)%
adverse favourable
Jaws2
(4.9)%

6
Revenue performanceRevenue up across our three largest businesses vs. 3Q16
4,475 4,668 4,891 4,706 5,148 5,094 5,183
3,240 3,219 3,183 3,118 3,284 3,266 3,347
3,641 3,735 3,789 3,7034,025 4,008 3,878
12,305442 438
1Q17
12,885
2Q16
12,073 428
4Q16
451
1Q16
11,823467
11,941414
3Q16
+4%
3Q17
12,845437
2Q17
12,806
1,096 761 186605(596)
406
2Q161Q16 3Q172Q171Q17
357
4Q163Q16
12,711 13,24212,919 12,834 11,345
Global businesses
Corporate Centre
Group
GPB
GB&M
CMB
RBWM
13,411
Revenue performance, $m6
13,031

7
Retail Banking and Wealth Management performanceRevenue growth driven by liability revenue and wealth management
Adjusted PBT(9M16: $4.1bn)
$5.1bnAdjusted revenue(9M16: $13.8bn)
$15.2bnAdjusted LICs(9M16: $0.9bn)
$0.8bn
Adjusted costs(9M16: $8.9bn)
$9.4bnAdjusted Jaws
4.7%
9M17 highlights
3Q17 vs. 3Q16: Adjusted revenue up 6%
− Wider spreads and higher balances driving deposit revenues (up $312m), notably in Hong Kong and the US
− Partly offset by lower lending revenue (down $69m) in Asia and Europe due to margin compression from lower interest rates, despite volume growth
− Investment distribution (up $86m), mainly in Hong Kong due to higher sales from renewed investor confidence
− Insurance manufacturing (down $41m), driven by actuarial assumption changes, partly offset by higher insurance sales and positive market impacts
Revenue performance, $m6
Wealth Management excl. market impactsRetail banking Other Insurance manufacturing
market impacts
Wealth Mgt.
Retail banking and other
3Q17 vs. 2Q17: Adjusted revenue up 2%
− Higher balances driving deposit revenues (up $30m)
− Lending revenue stable with higher balances, offset by margin compression
− Investment distribution (up $84m), mainly in Hong Kong, due to higher sales
− Insurance manufacturing (down $84m), reflecting actuarial assumption changes and positive market impacts
4,668 5,148 5,0944,891 4,7064,475 5,183
Balance Sheet, $bn7
Customer lending:
Customer deposits:
318
+2%
3Q17
337
2Q17
330
3Q16
+0%
3Q17
629
2Q17
627
3Q16
601
− Lending growth up mainly in Hong Kong, the UK and Mexico compared with 3Q16 and 2Q17
− Customer deposits growth up notably in the UK and Hong Kong compared with 3Q16 and 2Q17
+6%
+5%
+6%
+2%
Adjusted revenue
158 148
166
3Q17
3,434
2Q17
3,404
100
1Q17
3,345
113
4Q16
3,236
3Q16
3,191
2Q16
3,234
106
1Q16
3,243
73
(203)
40
1,5431,51080
1,549141
1,363(41)
1,543
(1)
1,459
(131)
1,362
8
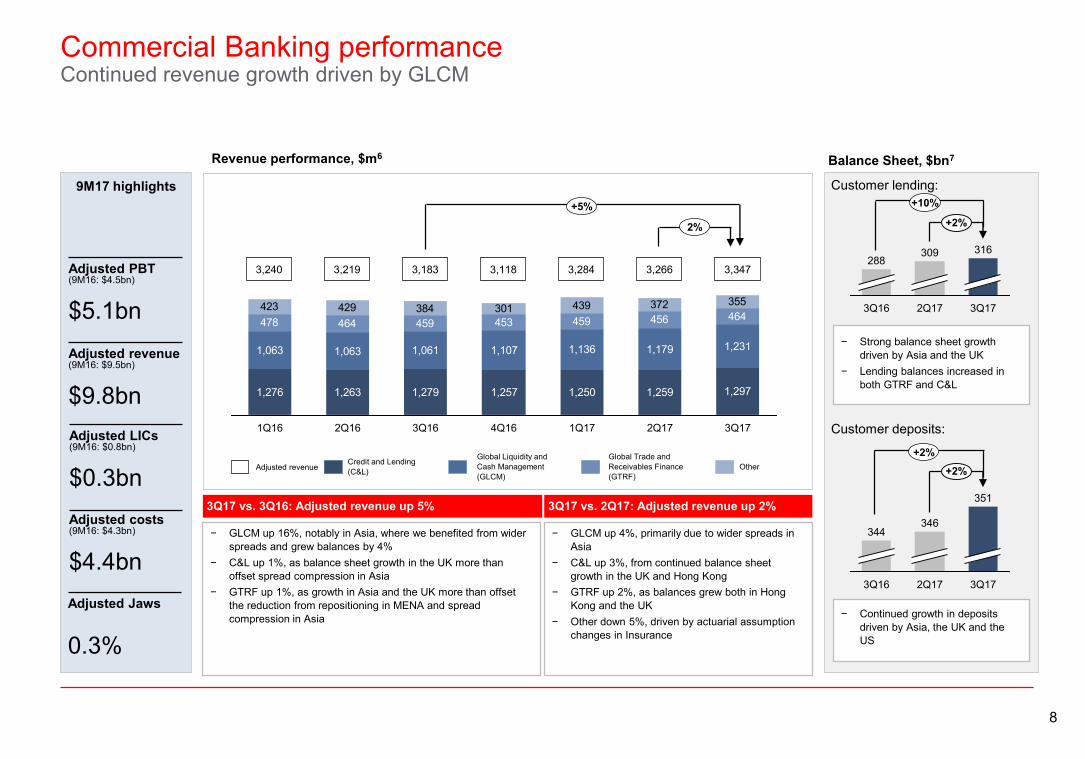
Commercial Banking performanceContinued revenue growth driven by GLCM
Adjusted PBT(9M16: $4.5bn)
$5.1bnAdjusted revenue(9M16: $9.5bn)
$9.8bnAdjusted LICs(9M16: $0.8bn)
$0.3bnAdjusted costs(9M16: $4.3bn)
$4.4bnAdjusted Jaws
0.3%
9M17 highlights
1,276 1,263 1,279 1,257 1,250 1,259 1,297
1,063 1,063 1,061 1,107 1,136 1,179 1,231
478 464 459 453 459 456 464423 429 384 301 439 372 355
2Q161Q16 3Q172Q171Q174Q163Q16
Revenue performance, $m6
OtherGlobal Trade and Receivables Finance (GTRF)
Global Liquidity and Cash Management (GLCM)
Credit and Lending (C&L)
3Q17 vs. 3Q16: Adjusted revenue up 5% 3Q17 vs. 2Q17: Adjusted revenue up 2%
− GLCM up 16%, notably in Asia, where we benefited from wider spreads and grew balances by 4%
− C&L up 1%, as balance sheet growth in the UK more than offset spread compression in Asia
− GTRF up 1%, as growth in Asia and the UK more than offset the reduction from repositioning in MENA and spread compression in Asia
− GLCM up 4%, primarily due to wider spreads in Asia
− C&L up 3%, from continued balance sheet growth in the UK and Hong Kong
− GTRF up 2%, as balances grew both in Hong Kong and the UK
− Other down 5%, driven by actuarial assumption changes in Insurance
+5%
2%
3,219 3,284 3,2663,183 3,1183,240 3,347
Balance Sheet, $bn7
Customer lending:
Customer deposits:
− Strong balance sheet growth driven by Asia and the UK
− Lending balances increased in both GTRF and C&L
+2%
3Q17
316
2Q17
309
3Q16
288
+2%
3Q17
351
2Q17
346
3Q16
344
− Continued growth in deposits driven by Asia, the UK and the US
Adjusted revenue
+2%
+10%

9
Global Banking & Markets performancePositive performance in 3rd quarter despite subdued trading conditions
Markets 1,679 (1)%
Of which:
FX 605 (8)%
Rates 551 1%
Credit 192 (15)%
FICC 1,348 (5)%
Equities 331 25%
$m 3Q17 ∆ 3Q16
Management view of adjusted revenue
Global Banking 943 (5)%
GLCM 567 19%Securities Services 442 8%
GTRF 174 (1)%
PrincipalInvestments 178 2%
Other (39) 22%
Credit and Funding Valuation Adjustment
(66) 14%
Total 3,878 2%
Revenue performance, $m6
3,735 4,025 4,008
3,944
1,679
2,265
4,100
1,815
2,285
4,026
2,005
2,021
3,728
1,582
2,146
3,866
1,689
2,177
3,834
1,924
1,910
3,490
1,686
1,804
(99)
3Q17
(66)
2Q17
(92)
1Q17
(1)
4Q16
(25)
3Q161Q16
151
2Q16
(77)
Credit and Funding Valuation Adjustment
MarketsAdjusted revenue Banking, Securities Services, GLCM, GTRF and other
3,789 3,7033,641
3Q17 vs. 3Q16: Positive revenue momentum
− Positive 3Q17 performance despite subdued trading activity as lower industry wide volumes and tighter spreads affected our Markets and Banking products
− Markets revenues stable due to diverse product offering as lower FICC revenues largely offset higher Equities revenues
− All transaction banking products continue to perform well from increased balances and widening spreads
− Positive momentum in global transaction banking products
− FICC saw reduced client activity from lower market volatility and seasonality
− Global Banking seasonally lower and impacted by continued spread compression notably in Asia
3Q17 vs. 2Q17: Resilient
3,878
+2%
Adjusted PBT(9M16: $4.1bn)
$4.9bnAdjusted revenue(9M16: $11.0bn)
$11.7bnAdjusted LICs(9M16: $0.5bn)
$0.1bnAdjusted costs(9M16: $6.4bn)
$6.7bnAdjusted Jaws
2.3%
9M17 highlights
Returns and RWAs
3Q17
307308
3Q16
305
2Q17
1.7% 2.3% 2.2%
Adjusted RWAs YTD RoRWA

10
Global Private Bank performanceBusiness now positioned for growth; $13.1bn of positive inflows in 2017
Adjusted PBT(9M16: $0.3bn)
$0.2bnAdjusted revenue(9M16: $1.3bn)
$1.3bnAdjusted LICs(9M16: $0.0bn)
$0.0bnAdjusted costs(9M16: $1.1bn)
$1.1bnAdjusted Jaws
(1.8)%
9M17 highlights
Client assets, $bn
271 263 283 295 305
3Q16
315 306298327316
3544 21 2223
3Q172Q171Q174Q16
− In 2017, positive inflows of $13.1bn in key markets targeted for growth, particularly in Hong Kong
Net new money, $bn
Net new money in areas targeted for growth
5.33.0
4.8
(2.7)
(0.2)
3Q172Q171Q174Q163Q16
200 191 191 162 182 180 174
110 106 10595 95 97 98
93 86 8283 91 103 103
64 68 6474 60 58 62
2Q17 3Q171Q173Q162Q161Q16 4Q16
Revenue performance, $m6
OtherDepositLendingInvestment
3Q17 vs. 3Q16: Adjusted revenue down 1%
− Lower revenue reflecting the impact of repositioning actions; run-off of client assets down by $22bn to $22bn
− Revenue in areas target for growth up 7%, particularly in Hong Kong reflecting higher client investment activity (mandates and brokerage) and wider deposit spreads
Return on client asset (bps)
451 428 438442 414467
3Q17 vs. 2Q17: Adjusted revenue steady
− Lower investment revenue (brokerage & trading) due to seasonality impact (summer period), partly offset by a gain on disposal
− Launched new products; front office positioned for growth
54 5455 54 55 55
-1%
Areas targeted for growthRepositioning
437
55
0%
Adjusted revenue

11
Corporate Centre performanceLower revenue from the run-off of the CML and other legacy portfolios
Adjusted PBT(9M16: $3.2bn)
$2.1bnAdjusted revenue(9M16: $2.3bn)
$1.1bnAdjusted LICs(9M16: $0.0bn)
$(0.1)bnAdjusted costs(9M16: $0.8bn)
$0.9bn
9M17 highlights
Central Treasury 745 634 366 (266) 397 431 311
Of which:
Balance Sheet Management 728 774 744 789 865 643 584
Interest expense (155) (244) (293) (276) (331) (296) (331)Valuation differences on long-term debt and associated swaps 250 110 108 (741) (28) 125 80
Other (78) (6) (193) (38) (109) (41) (22)
1Q16 2Q16 3Q16 4Q16 1Q17 2Q17 3Q17
US run-off portfolio (CML) 239 181 150 122 28 47 (28)
Legacy Credit (38) (55) 125 (3) - 59 (18)
Other 150 1 (235) (449) (68) 68 (79)
Total 1,096 761 406 (596) 357 605 186
Revenue performance, $m6 Balance Sheet, $bn7
US run-off portfolio (CML):
Legacy credit adjusted RWAs:
Adjusted RWAs:
0.00.3
3Q172Q173Q16
10.7
24.0 20.4 20.2
3Q16
-1%
3Q172Q17
477 20
4919
142
-1%
3Q172Q17
144
3Q16
175
GB&M legacy
BSM
Other US run-off
Associates
3Q17 vs. 3Q16: Adjusted revenue down $220m to $186m
3Q17 vs. 2Q17: Adjusted revenue down $419m to $186m
− US CML (down $178m) due to continued run-off− In BSM lower revenue due to repositioning in prior
quarters and lower balances due to increased deployment of the Group’s liquidity surplus by the global businesses
− Legacy credit (down $143m) reflecting favourable credit and funding valuation adjustments in 3Q16
− Other central treasury (up $172m) driven by a number of intra-group adjustments which were largely offset in the global businesses
− Other (up $156m) driven by revaluation of properties and lower adverse movement on own share liabilities
− US CML (down $75m) due to continued run-off− In BSM lower revenue due to repositioning in prior
quarters and lower balances due to increased deployment of the Group’s liquidity surplus by the global businesses
− Legacy credit (down $77m) reflecting favourable credit and funding valuation adjustments in 2Q17
− Valuation differences (down $46m) on long-term debt and associated swaps
− Other (down $147m) reflects the phasing of intercompany income and expenses.
0.3
Assets held
for sale
12
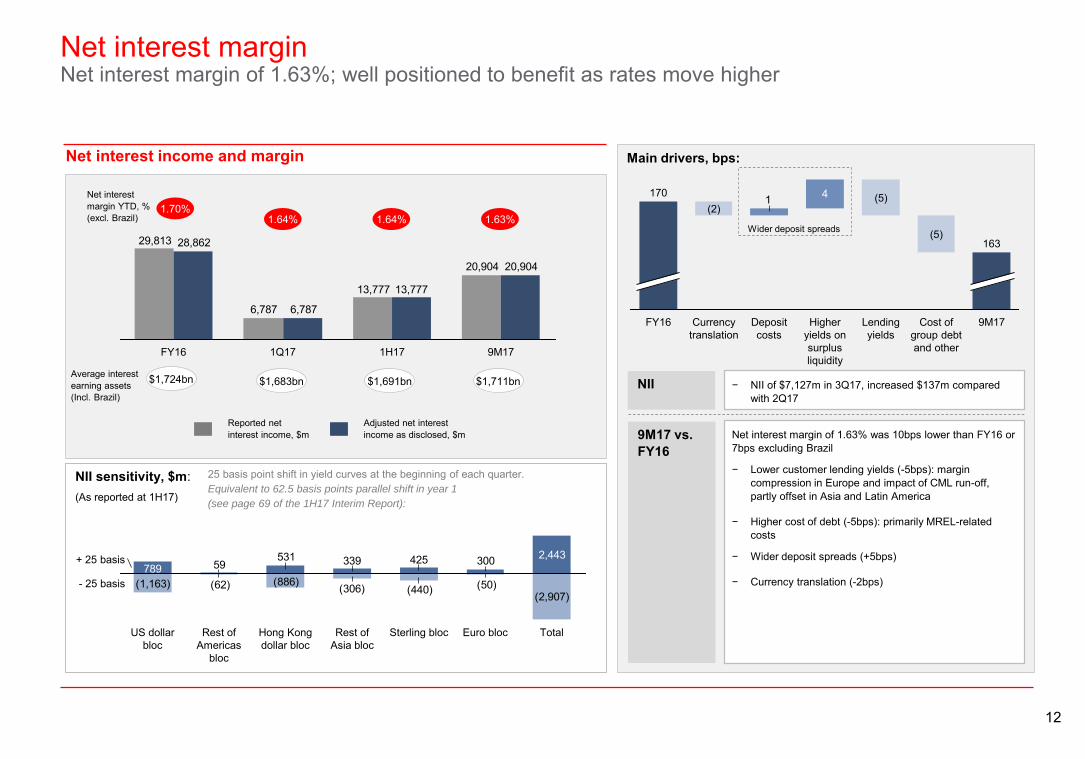
Main drivers, bps:
Net interest marginNet interest margin of 1.63%; well positioned to benefit as rates move higher
Net interest income and margin
Reported net interest income, $m
Net interest margin YTD, % (excl. Brazil)
20,904
13,777
6,787
29,813
20,904
13,777
6,787
28,862
9M171H171Q17FY16
Adjusted net interest income as disclosed, $m
1.64%
Average interest earning assets(Incl. Brazil)
$1,724bn $1,683bn
1.70%
9M17 vs. FY16
NII sensitivity, $m:(As reported at 1H17)
(2,907)(50)(886)(1,163) (440)(306)(62)
425339531 2,443789
30059
US dollar bloc
- 25 basis
+ 25 basis
TotalEuro blocSterling blocRest of Asia bloc
Hong Kong dollar bloc
Rest of Americas
bloc
25 basis point shift in yield curves at the beginning of each quarter. Equivalent to 62.5 basis points parallel shift in year 1
(see page 69 of the 1H17 Interim Report):
1.64%
$1,691bn
Net interest margin of 1.63% was 10bps lower than FY16 or 7bps excluding Brazil
− Lower customer lending yields (-5bps): margin compression in Europe and impact of CML run-off, partly offset in Asia and Latin America
− Higher cost of debt (-5bps): primarily MREL-related costs
− Wider deposit spreads (+5bps)
− Currency translation (-2bps)
1.63%
$1,711bn NII − NII of $7,127m in 3Q17, increased $137m compared with 2Q17
1 4
163
9M17Cost of group debt and other
Lending yields
Higher yields on surplus liquidity
Deposit costs
Currency translation
FY16
170 (5)
(5)
(2)
Wider deposit spreads

13
Operating expensesCommitted to delivering positive jaws for FY 2017 while investing in growth
7.3
3Q17
7.1
0.7
2Q17
6.7
0.8
1Q17
6.7
0.8
4Q16
6.7
Target exit run rate at average
3Q17 rates
0.8
1.1
3Q16
6.5
0.7
2Q16
6.6
0.7
1Q16
6.6
0.7
(0.1)
Quarterly trend
UK bank levyRegulatory programmes and compliance
0.3
0.1
0.3
0.30.5
0.2
7.3
Digital, IT security and other spend
Cost savings
(0.6)
Regulatory programmes
and compliance
Inflation3Q16
7.2
3Q17Investment and
incremental cost growth
7.3
3Q17 vs. 3Q16, $bn
7.2 7.3 7.2 8.6 7.5 7.5 7.8
$0.3bn additional performance-related pay, partly reflecting a YTD catch-up
$0.2bn investment for growth ($0.3bn YTD)
― Our three largest global businesses delivered positive jaws during 9M17
― Continue to invest in growth$0.3bn YTD and $0.2bn planned for 4Q17, primarily in RBWM, partly funded by gains from the disposal of our shares in Visa, Inc
― $0.3bn additional performance-related pay, reflecting YTD performance
― On track to deliver c$6bn of savings; achieved annualised run-rate savings of $5.2bn, and $0.6bn saves in the quarter
― Cost-to-achieve spending will end by 31 Dec 2017; 4Q17 cost-to-achieve spend c$0.4bn
― Deliver positive jaws for FY17
14
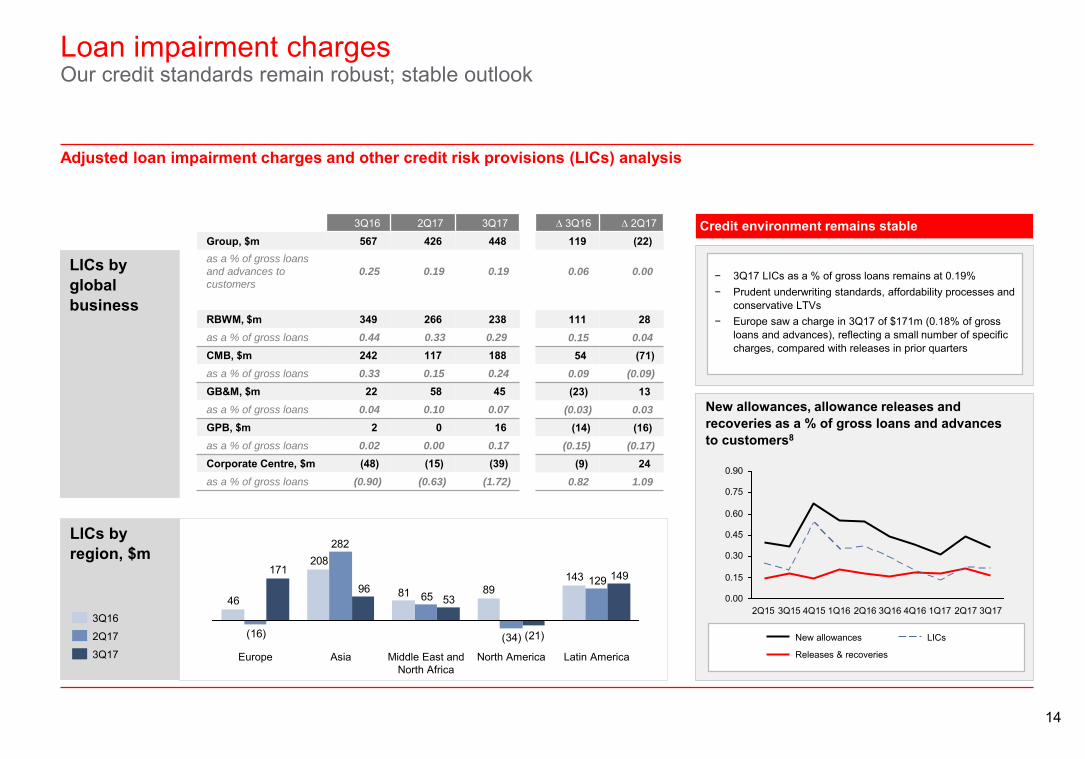
Loan impairment chargesOur credit standards remain robust; stable outlook
Adjusted loan impairment charges and other credit risk provisions (LICs) analysis
− 3Q17 LICs as a % of gross loans remains at 0.19%− Prudent underwriting standards, affordability processes and
conservative LTVs− Europe saw a charge in 3Q17 of $171m (0.18% of gross
loans and advances), reflecting a small number of specific charges, compared with releases in prior quarters
LICs by region, $m
LICs by global business
∆ 3Q16 ∆ 2Q17
119 (22)
0.06 0.00
111 280.15 0.04
54 (71)0.09 (0.09)
(23) 13(0.03) 0.03
(14) (16)(0.15) (0.17)
(9) 240.82 1.09
3Q16 2Q17 3Q17
Group, $m 567 426 448as a % of gross loans
and advances to
customers
0.25 0.19 0.19
RBWM, $m 349 266 238as a % of gross loans 0.44 0.33 0.29
CMB, $m 242 117 188as a % of gross loans 0.33 0.15 0.24
GB&M, $m 22 58 45as a % of gross loans 0.04 0.10 0.07
GPB, $m 2 0 16as a % of gross loans 0.02 0.00 0.17
Corporate Centre, $m (48) (15) (39)as a % of gross loans (0.90) (0.63) (1.72)
1438981
208
46
129
(34)
65
282
(16)
149
(21)
5396
171
Latin AmericaNorth AmericaMiddle East and North Africa
AsiaEurope
Credit environment remains stable
0.90
0.75
0.60
0.45
0.30
0.15
0.003Q172Q171Q174Q163Q162Q161Q164Q153Q152Q15
Releases & recoveries
LICsNew allowances
New allowances, allowance releases and recoveries as a % of gross loans and advances to customers8
3Q16
2Q17
3Q17

15
Capital adequacyStrong capital base: common equity tier 1 ratio of 14.6%
IFRS9 update
− Our current estimate is a day 1 (1 Jan 2018) increase in loan loss allowances of approximately $2.0bn, which is equivalent to a movement of fewer than 15bps in our CET1 capital ratio.*
Regulatory capital and RWAs ($bn) CET1 ratio movement (%)
3Q17 CET1 movement ($bn)
At 30 Jun 2017 128.9
Capital generation 0.9
Profit for the period including regulatory adjustments 3.1
Dividends9 net of scrip (2.2)
Share buy-back (2.0)
Foreign currency translation differences 1.8
Other movements 0.2
At 30 Sep 2017 129.8
Reported basis 2Q17 3Q17
Common equity tier 1 capital 128.9 129.8
Total regulatory capital 183.9 186.4
Risk-weighted assets 876.1 888.6
Quarterly CET1 ratio and leverage ratio progression
3Q16 4Q16 1Q17 2Q17 3Q17
CET1 ratio 13.9% 13.6% 14.3% 14.7% 14.6%
Leverage ratio 5.4% 5.4% 5.5% 5.7% 5.7%
0.1
0.3
3Q17Other incl. foreign
currency translation differences
14.6
Change in RWAs
(0.1)
Share buy-back
(0.2)
Dividends net of scrip
(0.2)
Profit for the period incl. regulatory
adjustments
2Q17
14.7
*The actual IFRS 9 impact on transition at 1 Jan 2018 could be significantly different as a result of ongoing work on models and data, as well as changes in balance sheet position, market conditions and forward-looking economic assumptions. The estimated impact on CET1 does not reflect any regulatory capital transition relief that may be available

16
Return metrics
9M17 Group ROE1, %
Adjusted RoRWA11
RBWM 4.8% 5.8%
CMB 2.2% 2.4%
GB&M 1.7% 2.2%
GPB12 2.0% 1.7%
Group RoRWA10
Reported 1.3% 2.3%
Adjusted11 2.2% 2.7%
9M16 9M17 9M16 9M17
5.3% 9.3%ROTE1 9.7% 10.9%
0.30.6
0.7
4.4
9M16 Reported LICs
(0.5)
Cost ex bank levy
Avg ordinary shareholders’
equity
(0.2)
Tax and other
9.7
(1.5)
Significantitems &
bank levy
Significantitems &
bank Levy
8.8
9M17 ex. Sig items & bank levy
9M16ex. Sig items & bank levy
8.2
9M17 ReportedRevenue
4.4
17
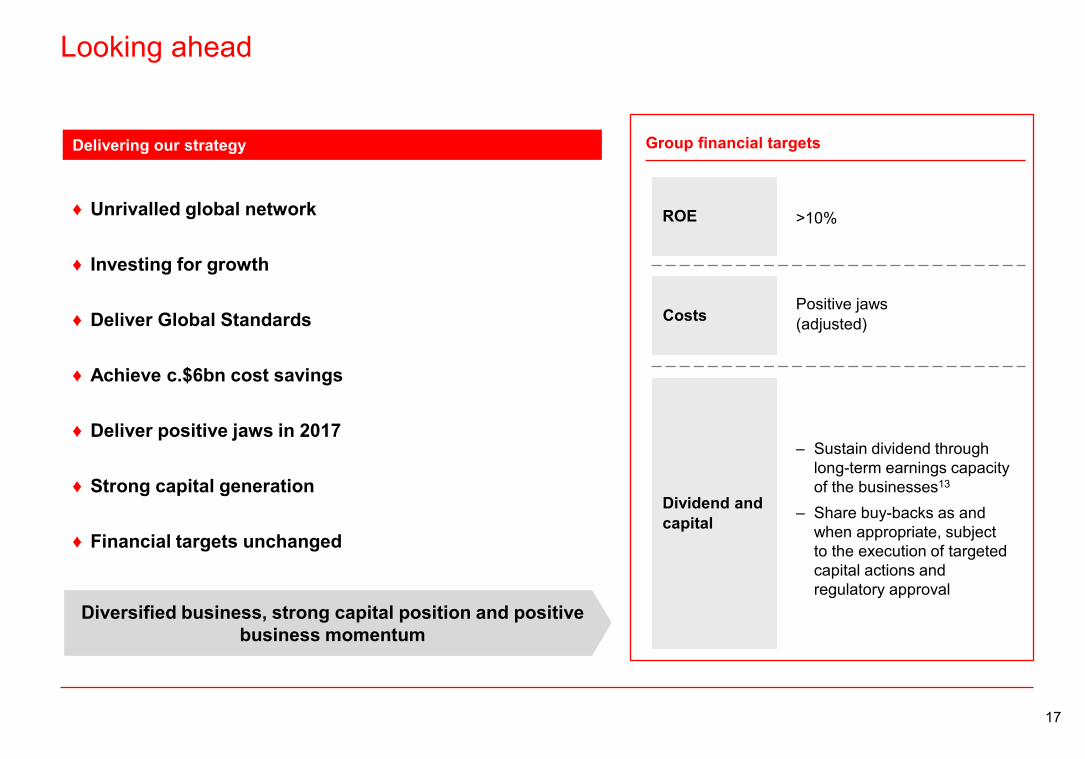
Looking ahead
CostsPositive jaws(adjusted)
Dividend and capital
ROE >10%
Group financial targets
‒ Sustain dividend through long-term earnings capacity of the businesses13
‒ Share buy-backs as and when appropriate, subject to the execution of targeted capital actions and regulatory approval
♦ Unrivalled global network
♦ Investing for growth
♦ Deliver Global Standards
♦ Achieve c.$6bn cost savings
♦ Deliver positive jaws in 2017
♦ Strong capital generation
♦ Financial targets unchanged
Delivering our strategy
Diversified business, strong capital position and positive business momentum

1818
Appendix

19
Deliver growth above GDP from international network
‒ Revenue growth of international network above GDP
‒ Transaction banking adjusted revenue up 7% YTD vs. prior year, with GLCM adjusted revenues increasing by 13% driven by growth in deposits and improved margins following rate rises
‒ Grew GTRF market share in key markets, in particular Hong Kong, Singapore and UK‒ Revenue driven by collaboration between our businesses grew 14% YTD vs. prior year
Investments in Asia – prioritise and accelerate
‒ Market share gains‒ c. 10% growth p.a. in assets under
management
‒ Guangdong customer advances up $1.1bn vs. 3Q16, driven by credit and lending and GTRF‒ Grew RBWM customer base in mainland China by over 70% YTD, driven by growth in our sole-branded credit card business‒ Insurance annualised new business premiums and Asset Management AuM up 13% and 17%, respectively vs. prior year‒ Awarded ‘Best Overall International Bank for Belt and Road Initiative’ by Asiamoney New Silk Road Finance Awards 2017
RMB internationalisation ‒ $2.0-2.5bn revenue
‒ Ranked #1 among all banks (53.9% market share) in terms of market share on approved quota of RMB Qualified Foreign Institutional Investor (“RQFII”) custodian business (Sep 17); Source: People’s Bank of China
‒ Ranked #1 in offshore RMB bond underwriting with a market share of 28.1% (Sep17); Source: Bloomberg‒ Approved as a joint lead underwriter for Panda bond issuances by offshore non-financial corporates in China’s interbank bond
market, becoming the first foreign bank in China to be granted such a licence
Global Standards –safeguarding against financialcrime14
‒ End of 2017: Introduction of major compliance IT systems; anti-moneylaundering (‘AML’) and sanctions policy framework in place; assessment against the capabilities of our financial crime risk framework to enable the capabilities to be fully integrated in our day-to-day operations
‒ We remain on track to complete the introduction of the major compliance IT systems, to have our AML and sanctions policy framework in place, and to complete all actions committed to as part of the Global Standards programme in 2013 by the end of 2017
‒ Post 2017: Policy framework and associated operational processes fully integrated into day-to-day financial crime risk management practices in an effective and sustainable way. Target end state agreed with the UK Financial Conduct Authority to be achieved. Major compliance IT systems continue to be fine-tuned, and recommendations from the Monitor continue to be implemented
Reduce Group RWAs by c.$290bn
‒ Group RWA reduction: $290bn‒ GB&M <1/3 of Group RWAs ‒ RWA: $309bn gross reduction through management actions (>100% of our FX adjusted target)
Optimise global network ‒ Reduced footprint ‒ Progressing previously announced transactions / closures
‒ Present in 67 countries at the end Sep 2017
Rebuild NAFTA profitability
‒ US PBT c. $2bn‒ US adjusted PBT excluding CML run-off portfolio increased 74% YTD vs. prior year to USD0.7bn‒ Completed asset sales of CML legacy portfolio totaling $1.3bn in 3Q17; remaining CML portfolio reduced to $0.3bn with plans
to complete the sale / wind-down of the portfolio by end 2017
‒ Mexico PBT c. $0.6bn ‒ Mexico adjusted PBT increased 44% YTD vs. prior year overall and across Global Businesses (RBWM +35%, CMB +14%, GB&M +132%); continued market share gains in strategic product areas
Set up UK ring-fenced bank ‒ Completed in 2018 ‒ Nearly 90% of head office roles are in place or accounted for in Birmingham; on track to have a fully functioning team by 1Q18
‒ The majority of technology deployments are complete to support the new ring-fenced bank
Deliver $4.5-5.0bn cost savings
‒ 2017 exit rate to equal 2014 operating expenses
‒ Achieved annualised run-rate saves of $5.2bn‒ Continued migration of activities to lower cost locations; approximately three quarters of global operations staff are now in
offshore locations, up from 57% in Jan 15‒ Roll-out of new DevOps tooling nearly complete and 813 apps already delivered through this automated software development
Strategic actions Progress
Actions to re-size and simplify
Actions to redeploy capital and invest
Targeted outcome by 2017
Significant progress in the execution of the “Strategic Actions to capture value from our international network” announced in June 2015
-
-
Status
On track to meet target
*
*As set out under ‘Targeted outcome by 2017’
20
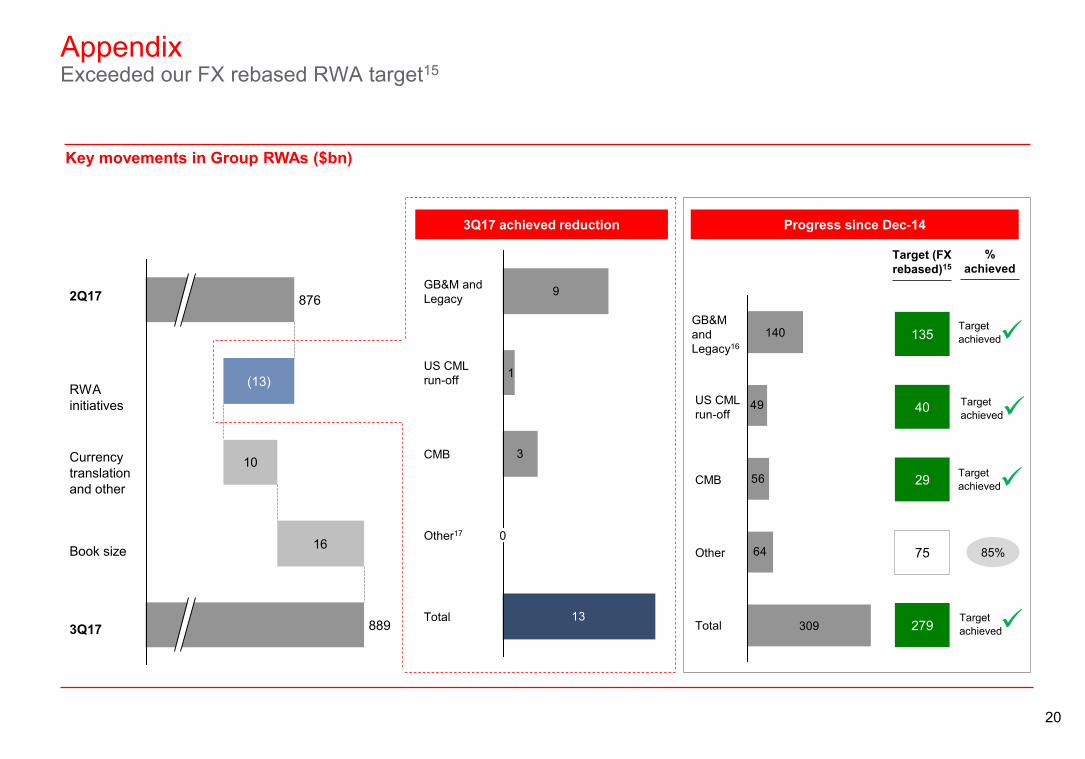
AppendixExceeded our FX rebased RWA target15
Key movements in Group RWAs ($bn)
3Q17 achieved reduction Progress since Dec-14
135
279
75
29
40
GB&M and Legacy16
Total
Other
CMB
US CML run-off
49
56
64
309
140
Target (FX rebased)15
Target achieved
9
3
1
13Total
Other17
CMB
0
US CML run-off
GB&M andLegacy
16
10
876
(13)
889
2Q17
Book size
3Q17
Currency translation and other
% achieved
85%
RWA initiatives Target
achieved
Target achieved
Target achieved

21
AppendixGlobal business management view of adjusted revenue
GB&M, $m 1Q16 2Q16 3Q16 4Q16 1Q17 2Q17 3Q17 ∆ 3Q16 ∆ 2Q17Global Markets 1,686 1,924 1,689 1,582 2,005 1,815 1,679 (1)% (7)%
Equities 292 267 264 233 349 331 331 25% 0%
FICC 1,394 1,657 1,425 1,349 1,656 1,484 1,348 (5)% (9)%
Foreign Exchange 719 669 655 754 643 733 605 (8)% (17)%
Rates 520 655 544 520 675 509 551 1% 8%
Credit 155 333 226 75 338 242 192 (15)% (21)%
Global Banking 905 923 995 1,011 924 1,077 943 (5)% (12)%
GLCM 469 459 475 497 532 530 567 19% 7%
Securities Services 375 391 408 405 419 441 442 8% 0%
GTRF 175 173 175 174 186 180 174 (1)% (3)%
Principal Investments 2 (4) 174 52 30 50 178 2% >100%
Other revenue (122) (32) (50) 7 (70) 7 (39) 22% >(100)%
Credit and Funding Valuation Adjustment 151 (99) (77) (25) (1) (92) (66) 14% 28%
Total 3,641 3,735 3,789 3,703 4,025 4,008 3,878 2% (3)%
Adjusted revenue as previously disclosed18 3,677 3,834 3,817 3,591 3,886 3,937 3,878 2% (2)%
RBWM, $m 1Q16 2Q16 3Q16 4Q16 1Q17 2Q17 3Q17 ∆ 3Q16 ∆ 2Q17Retail Banking 3,243 3,234 3,191 3,236 3,345 3,404 3,434 8% 1%
Current accounts, savings and deposits 1,303 1,344 1,300 1,359 1,503 1,582 1,612 24% 2%
Personal lending 1,940 1,890 1,891 1,877 1,842 1,822 1,822 (4)% 0%
Mortgages 672 651 646 637 619 578 599 (7)% 4%
Credit cards 803 762 771 756 750 771 742 (4)% (4)%
Other personal lending 465 477 474 484 473 473 481 1% 2%
Wealth Management 1,159 1,328 1,542 1,321 1,690 1,590 1,583 3% (0)%
Investmentdistribution 704 736 808 689 815 810 894 11% 10%
Life insurance manufacturing 207 350 466 379 615 509 425 (9)% (17)%
Asset management 248 242 268 254 260 271 264 (1)% (3)%
Other 73 106 158 148 113 100 166 5% 66%
Total 4,475 4,668 4,891 4,706 5,148 5,094 5,183 6% 2%
Adjusted revenue as previously disclosed18 4,597 4,819 4,921 4,590 5,009 5,034 5,183 5% 3%
CMB, $m 1Q16 2Q16 3Q16 4Q16 1Q17 2Q17 3Q17 ∆ 3Q16 ∆ 2Q17Global Trade and Receivables Finance 478 464 459 453 459 456 464 1% 2%
Credit and Lending 1,276 1,263 1,279 1,257 1,250 1,259 1,297 1% 3%
Global Liquidity and Cash Management 1,063 1,063 1,061 1,107 1,136 1,179 1,231 16% 4%
Markets products, Insurance and Investments and other
423 429 384 301 439 372 355 (8)% (5)%
Total 3,240 3,219 3,183 3,118 3,284 3,266 3,347 5% 2%
Adjusted revenue as previously disclosed18 3,318 3,326 3,201 3,041 3,191 3,216 3,347 5% 4%
GPB, $m 1Q16 2Q16 3Q16 4Q16 1Q17 2Q17 3Q17 ∆ 3Q16 ∆ 2Q17Investment 200 191 191 162 182 180 174 (9)% (3)%
Lending 110 106 105 95 95 97 98 (7)% 1%
Deposit 93 86 82 83 91 103 103 26% 0%
Other 64 68 64 74 60 58 62 (3)% 7%
Total 467 451 442 414 428 438 437 (1)% (0)%
Adjusted revenue as previously disclosed18 465 453 440 399 415 431 437 (1)% 1%
Corporate Centre, $m 1Q16 2Q16 3Q16 4Q16 1Q17 2Q17 3Q17 ∆ 3Q16 ∆ 2Q17
Central Treasury 747 635 366 (266) 393 431 311 (15)% (28)%
Balance Sheet Management 728 774 744 789 865 643 584 (22)% (9)%
Interest expense (155) (244) (293) (276) (331) (295) (331) (13)% (12)%
Valuation differences on long-term debt and associated swaps
251 110 108 (741) (32) 125 80 (26)% (36)%
Other (78) (6) (193) (38) (109) (41) (22) 89% 46%
US run-off portfolio 239 181 150 122 28 47 (28) (119)% (160)%
Legacy credit (38) (55) 125 (3) 0 59 (18) (114)% (131)%
Other 150 1 (235) (449) (68) 68 (79) 66% >(200)%
Total 1,096 761 406 (596) 357 605 186 (54)% (69)%
Adjusted revenue as previously disclosed18 1,122 756 408 (621) 342 592 186 (54)% (69)%
22
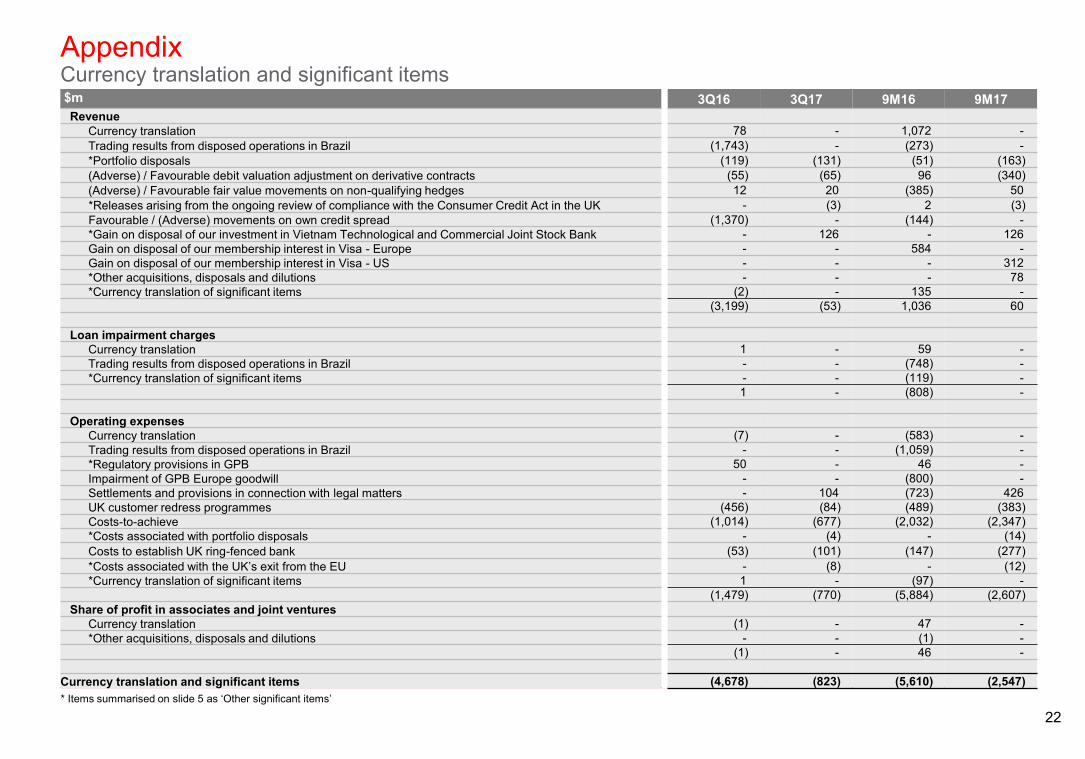
AppendixCurrency translation and significant items$m 3Q16 3Q17 9M16 9M17Revenue
Currency translation 78 - 1,072 -Trading results from disposed operations in Brazil (1,743) - (273) -*Portfolio disposals (119) (131) (51) (163) (Adverse) / Favourable debit valuation adjustment on derivative contracts (55) (65) 96 (340)(Adverse) / Favourable fair value movements on non-qualifying hedges 12 20 (385) 50*Releases arising from the ongoing review of compliance with the Consumer Credit Act in the UK - (3) 2 (3)Favourable / (Adverse) movements on own credit spread (1,370) - (144) -*Gain on disposal of our investment in Vietnam Technological and Commercial Joint Stock Bank - 126 - 126Gain on disposal of our membership interest in Visa - Europe - - 584 -Gain on disposal of our membership interest in Visa - US - - - 312*Other acquisitions, disposals and dilutions - - - 78*Currency translation of significant items (2) - 135 -
(3,199) (53) 1,036 60
Loan impairment chargesCurrency translation 1 - 59 -Trading results from disposed operations in Brazil - - (748) -*Currency translation of significant items - - (119) -
1 - (808) -
Operating expensesCurrency translation (7) - (583) -Trading results from disposed operations in Brazil - - (1,059) -*Regulatory provisions in GPB 50 - 46 -Impairment of GPB Europe goodwill - - (800) -Settlements and provisions in connection with legal matters - 104 (723) 426UK customer redress programmes (456) (84) (489) (383)Costs-to-achieve (1,014) (677) (2,032) (2,347)*Costs associated with portfolio disposals - (4) - (14)Costs to establish UK ring-fenced bank (53) (101) (147) (277)*Costs associated with the UK’s exit from the EU - (8) - (12)*Currency translation of significant items 1 - (97) -
(1,479) (770) (5,884) (2,607)Share of profit in associates and joint ventures
Currency translation (1) - 47 -*Other acquisitions, disposals and dilutions - - (1) -
(1) - 46 -
Currency translation and significant items (4,678) (823) (5,610) (2,547)* Items summarised on slide 5 as ‘Other significant items’
23
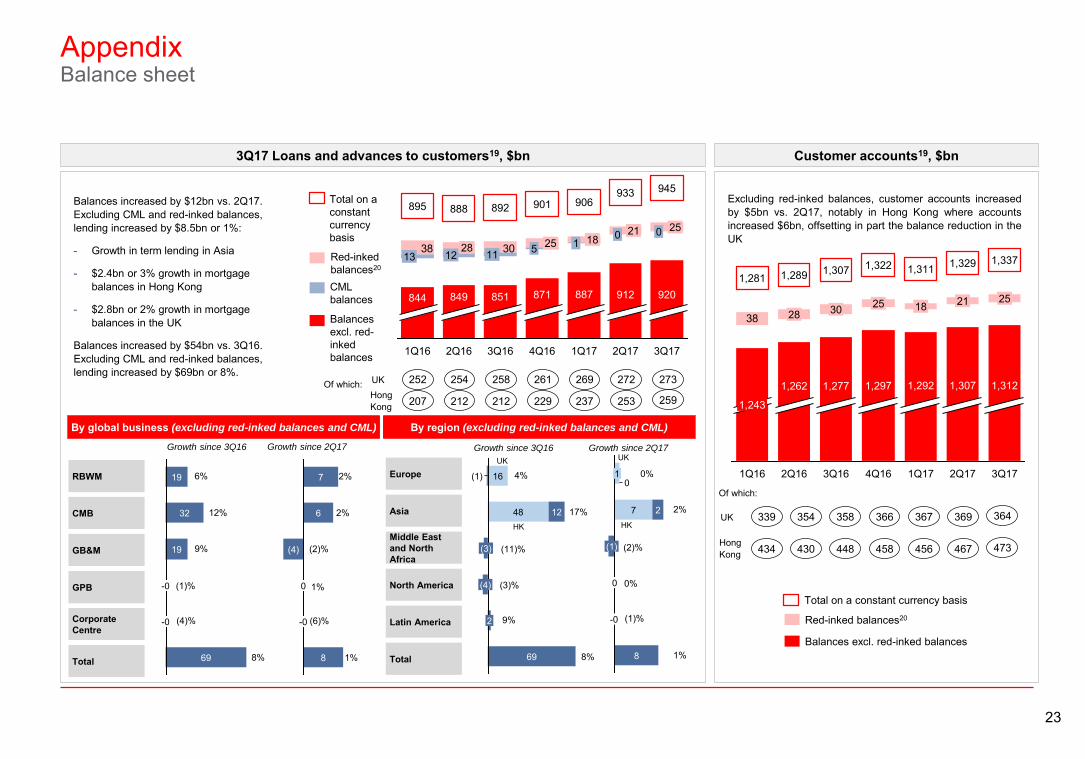
Customer accounts19, $bn
AppendixBalance sheet
Balances excl. red-inked balances
Total on a constant currency basis
Red-inked balances20
38
3Q17
1,312
25
1,337
2Q17
1,307
21
1,329
1Q17
1,292
18
3Q16
1,322
1,262
2528
1,289
1,297
1Q16
30
4Q16
1,243
1,2811,311
1,277
1,307
2Q16
3038
25
945
00
3Q17
21
933
1Q17
887
1 18
906
4Q16
871
5 25
901
3Q16
920
11
892
2Q16
849
1228
851
1Q16
844
13
895
2Q17
912
888Balances increased by $12bn vs. 2Q17. Excluding CML and red-inked balances, lending increased by $8.5bn or 1%:
- Growth in term lending in Asia
- $2.4bn or 3% growth in mortgage balances in Hong Kong
- $2.8bn or 2% growth in mortgage balances in the UK
Balances increased by $54bn vs. 3Q16. Excluding CML and red-inked balances, lending increased by $69bn or 8%.
Excluding red-inked balances, customer accounts increasedby $5bn vs. 2Q17, notably in Hong Kong where accountsincreased $6bn, offsetting in part the balance reduction in theUK
3Q17 Loans and advances to customers19, $bn
By global business (excluding red-inked balances and CML)
RBWM
CMB
GB&M
GPB
Corporate Centre
Total 69
-0
-0
19
32
19
Growth since 3Q16 Growth since 2Q17
8
-0
0
(4)
6
7
By region (excluding red-inked balances and CML)
Europe
Asia
Middle East and North Africa
North America
Latin America
Total 69
2
(4)
(3)
48 12
16(1)
8
-0
0
(1)
7 2
10
Growth since 3Q16 Growth since 2Q17
Balances excl. red-inked balances
Total on a constant currency basis
Red-inked balances20
CML balances
UK UK
HK HK339 354 358 366 367 369UK
Of which:
434 430 448 458 456 467Hong Kong
364
473
252 254 258 261 269 272UKOf which:
207 212 212 229 237 253Hong Kong
273
259
6%
12%
9%
(1)%
(4)%
8%
2%
2%
(2)%
1%
(6)%
1%
4%
17%
(11)%
(3)%
9%
8%
0%
2%
(2)%
0%
(1)%
1%
24
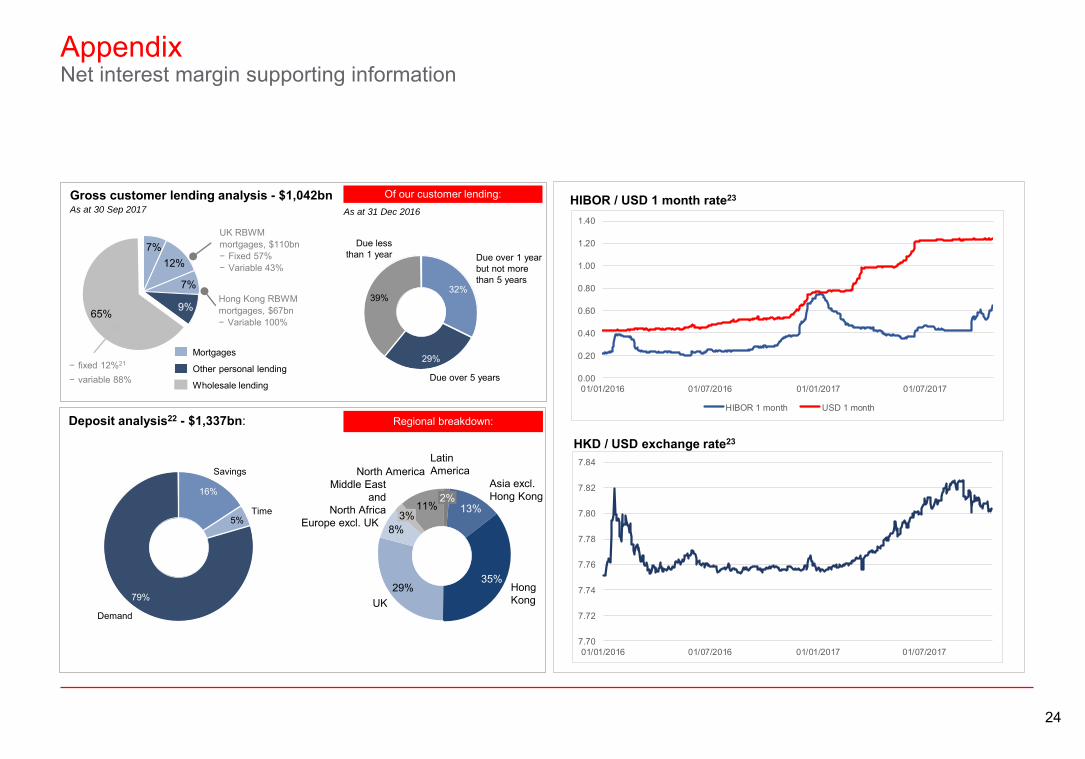
AppendixNet interest margin supporting information
Gross customer lending analysis - $1,042bn
65% 9%
7%
12%7%
− fixed 12%21
− variable 88%
Hong Kong RBWM mortgages, $67bn − Variable 100%
UK RBWM mortgages, $110bn− Fixed 57%− Variable 43%
29%
Due over 1 yearbut not morethan 5 years
32%
Due lessthan 1 year
39%
Due over 5 years
Of our customer lending: HIBOR / USD 1 month rate23
HKD / USD exchange rate23
Deposit analysis22 - $1,337bn:
Time5%
Savings
16%
Demand
79%
35%
13%2%
11%3%
8%
29%
North AmericaMiddle East
andNorth Africa
Europe excl. UK
UK
Asia excl.Hong Kong
HongKong
LatinAmerica
Regional breakdown:
Wholesale lending
Other personal lending
Mortgages
As at 31 Dec 2016
0.00
0.20
0.40
0.60
0.80
1.00
1.20
1.40
01/01/2016 01/07/2016 01/01/2017 01/07/2017
HIBOR 1 month USD 1 month
7.70
7.72
7.74
7.76
7.78
7.80
7.82
7.84
01/01/2016 01/07/2016 01/01/2017 01/07/2017
As at 30 Sep 2017
25
AppendixEquity drivers
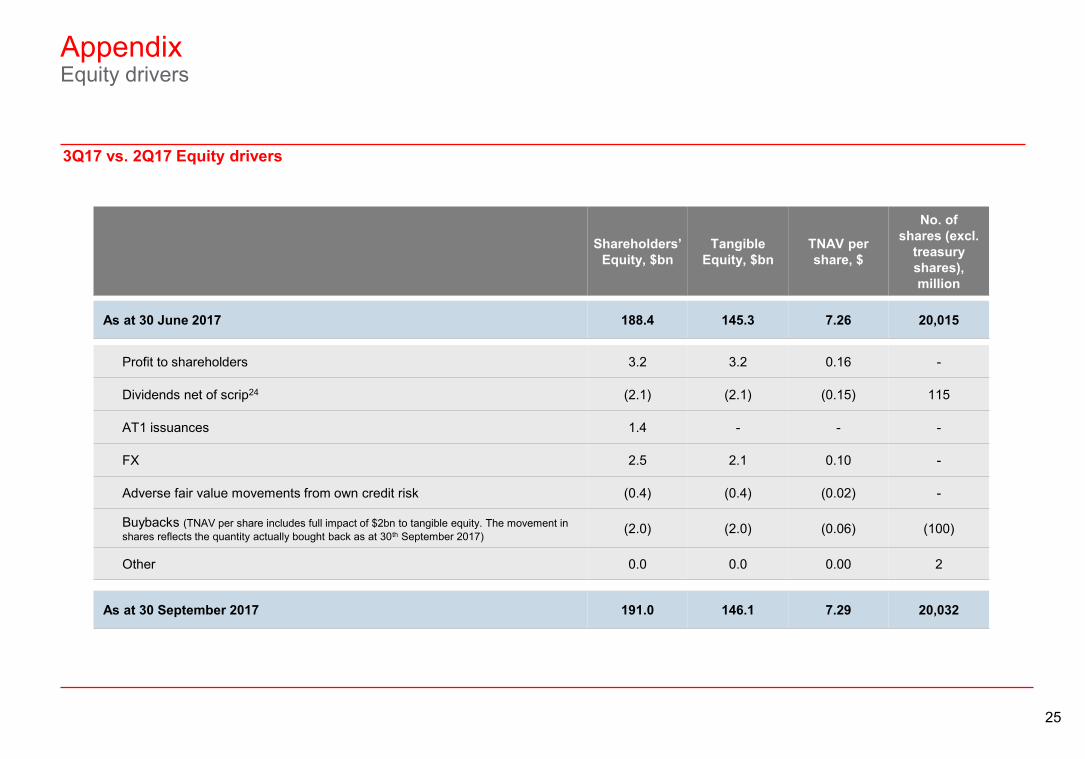
3Q17 vs. 2Q17 Equity drivers
Profit to shareholders 3.2 3.2 0.16 -
Dividends net of scrip24 (2.1) (2.1) (0.15) 115
AT1 issuances 1.4 - - -
FX 2.5 2.1 0.10 -
Adverse fair value movements from own credit risk (0.4) (0.4) (0.02) -
Buybacks (TNAV per share includes full impact of $2bn to tangible equity. The movement in shares reflects the quantity actually bought back as at 30th September 2017) (2.0) (2.0) (0.06) (100)
Other 0.0 0.0 0.00 2
As at 30 June 2017 188.4 145.3 7.26 20,015
As at 30 September 2017 191.0 146.1 7.29 20,032
Shareholders’ Equity, $bn
TangibleEquity, $bn
TNAV per share, $
No. of shares (excl.
treasury shares), million
26
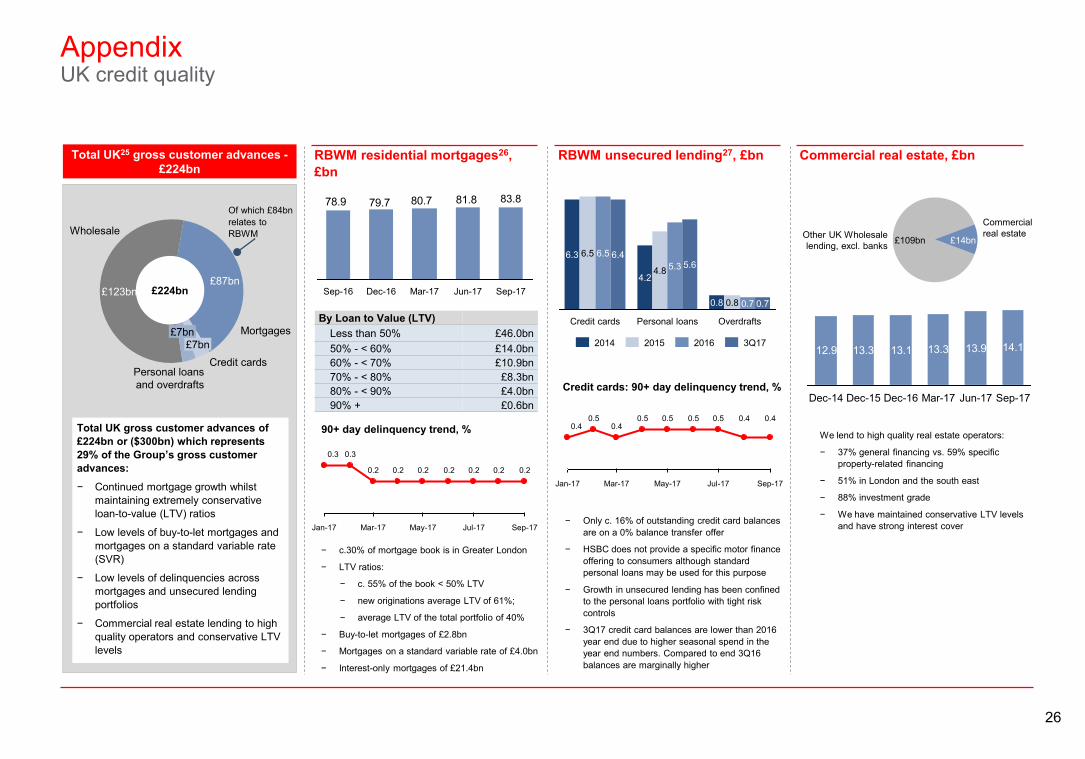
AppendixUK credit quality
Total UK25 gross customer advances -£224bn
RBWM residential mortgages26, £bn
£7bnMortgages
£87bn
Wholesale
£123bn
Personal loansand overdrafts
£7bn
Credit cards
£224bn
Total UK gross customer advances of £224bn or ($300bn) which represents 29% of the Group’s gross customer advances:
− Continued mortgage growth whilst maintaining extremely conservative loan-to-value (LTV) ratios
− Low levels of buy-to-let mortgages and mortgages on a standard variable rate (SVR)
− Low levels of delinquencies across mortgages and unsecured lending portfolios
− Commercial real estate lending to high quality operators and conservative LTV levels
RBWM unsecured lending27, £bn Commercial real estate, £bn
By Loan to Value (LTV)Less than 50% £46.0bn50% - < 60% £14.0bn60% - < 70% £10.9bn70% - < 80% £8.3bn80% - < 90% £4.0bn90% + £0.6bn
90+ day delinquency trend, %
− c.30% of mortgage book is in Greater London
− LTV ratios:
− c. 55% of the book < 50% LTV
− new originations average LTV of 61%;
− average LTV of the total portfolio of 40%
− Buy-to-let mortgages of £2.8bn
− Mortgages on a standard variable rate of £4.0bn
− Interest-only mortgages of £21.4bn
5.65.34.84.2
Credit cards
6.46.56.56.3
Overdrafts
0.70.70.80.8
Personal loans
3Q17201620152014
− Only c. 16% of outstanding credit card balances are on a 0% balance transfer offer
− HSBC does not provide a specific motor finance offering to consumers although standard personal loans may be used for this purpose
− Growth in unsecured lending has been confined to the personal loans portfolio with tight risk controls
− 3Q17 credit card balances are lower than 2016 year end due to higher seasonal spend in the year end numbers. Compared to end 3Q16 balances are marginally higher
Commercialreal estate
£14bnOther UK Wholesalelending, excl. banks £109bn
We lend to high quality real estate operators:
− 37% general financing vs. 59% specific property-related financing
− 51% in London and the south east
− 88% investment grade
− We have maintained conservative LTV levels and have strong interest cover
12.9 13.3 13.1 13.3 13.9 14.1
Jun-17Mar-17Dec-16Dec-15Dec-14 Sep-17
81.880.779.778.9
Mar-17Dec-16Sep-16
83.8
Sep-17Jun-17
Sep-17Mar-17 Jul-17May-17Jan-17
0.3
0.2
0.3
0.20.2 0.20.20.2 0.2
Credit cards: 90+ day delinquency trend, %
Jul-17 Sep-17May-17Mar-17Jan-17
0.4 0.40.50.50.50.50.4
0.50.4
Of which £84bn relates to RBWM

27
AppendixFootnotes
1. Annualised
2. Includes the impact of UK bank levy
3. Unless otherwise stated, risk-weighted assets and capital are calculated and presented on a transitional CRD IV basis as implemented in the UK by the Prudential Regulation Authority
4. 9M16 jaws as reported in our 3Q17 Results
5. ‘Own credit spread’ includes the fair value movements on our long-term debt attributable to credit spread where the net result of such movements will be zero upon maturity of the debt. On 1 January 2017, HSBC adopted the requirements of IFRS 9 relating to the presentation of gains and losses on financial liabilities designated at fair value. As a result, the effects of changes in those liabilities’ credit risk is presented in other comprehensive income
6. Where a quarterly trend is presented on the Income Statement, all comparatives are re-translated at average 3Q17 exchange rates
7. Where a quarterly trend is presented on Balance sheet data, all comparatives are re-translated at 30 Sep 2017 exchange rates
8. In the 1Q17 Results Presentation, new individually assessed and collectively assessed allowances were presented as new allowances; in the current disclosure new allowances includes new individually assessed allowances and new collectively assessed allowances net of allowance releases
9. This includes dividends on ordinary shares, dividends on preference shares and coupons on capital securities, classified as equity
10. RoRWA is calculated using annualised profit before tax and reported average risk-weighted assets
11. Adjusted RoRWA is calculated using annualised profit before tax and reported average risk-weighted assets at constant currency adjusted for the effects of significant items
12. Due to the nature of its business, GPB measures the performance of its business through other measures including Net New Money and Return on Client Assets
13. Dividend per ordinary share
14. Further detail on the Monitor and the US deferred prosecution agreement and related agreements and consent orders can be found in our ‘Annual Report and Accounts 2016’ on pages 82 and 66, respectively
15. Investor day target of $290bn rebased for exchange rates at 30 Sep 2017
16. Includes BSM
17. Includes reductions related to Legacy credit, which following re-segmentation now resides in Corporate Centre
18. 2Q17 as reported at 2Q17 Results; 1Q17 as reported at 1Q17 Results; 1Q16 to 4Q16 included in the ‘4Q 2016 Global Business Management View of Income’ published at 2016FY Results
19. Balances presented by quarter are on a constant currency basis. Reported equivalents for ‘Loans and advances to customers’ are as follows: 1Q16: $920bn, 2Q16: $888bn, 3Q16: $881bn, 4Q16: $862bn, 1Q17: $876bn, 2Q17: $920bn . Reported equivalents for ‘Customer Accounts’ are as follows: 1Q16: $1,315bn, 2Q16: $1,291bn, 3Q16: $1,296bn, 4Q16: $1,272bn, 1Q17: $1,273bn, 2Q17: $1,312bn.
20. Red-inked balances relate to corporate customers in the UK, who settle their overdraft and deposit balances on a net basis

28
AppendixFootnotes
21. Uses FY2016 split of fixed and variable for commercial lending including lending to banks with greater than 1 year maturity as published in ‘Form 20-F’ as a proxy
22. Based on the average balance sheet at 3Q17. Of the 79% that relates to Demand, 64% is interest bearing with the remaining 15% non-interest bearing
23. Source: Bloomberg
24. Includes dividends to preference shareholders and other equity holders and scrip issuances relating to the first and second interim dividend in 2017
25. Where the country of booking is the UK
26. Includes First Direct balances
27. Includes First Direct, M&S and John Lewis Financial Services

29
AppendixImportant notice and forward-looking statements
Important notice
The information set out in this presentation and subsequent discussion does not constitute a public offer for the purposes of any applicable law or an offer to sell or solicitation of any offer to purchase any securities or other financial instruments or any recommendation in respect of such securities or instruments.
Forward-looking statements
This presentation and subsequent discussion may contain projections, estimates, forecasts, targets, opinions, prospects, results, returns and forward-looking statements with respect to the financial condition, results of operations, capital position and business of the Group (together, “forward-looking statements”). Any such forward-looking statements are not a reliable indicator of future performance, as they may involve significant assumptions and subjective judgements which may or may not prove to be correct and there can be no assurance that any of the matters set out in forward-looking statements are attainable, will actually occur or will be realised or are complete or accurate. Forward-looking statements are statements about the future and are inherently uncertain and generally based on stated or implied assumptions. The assumptions may prove to be incorrect and involve known and unknown risks, uncertainties, contingencies and other important factors, many of which are outside the control of the Group. Actual achievements, results, performance or other future events or conditions may differ materially from those stated, implied and/or reflected in any forward-looking statements due to a variety of risks, uncertainties and other factors (including without limitation those which are referable to general market conditions or regulatory changes). Any such forward-looking statements are based on the beliefs, expectations and opinions of the Group at the date the statements are made, and the Group does not assume, and hereby disclaims, any obligation or duty to update them if circumstances or management’s beliefs, expectations or opinions should change. For these reasons, recipients should not place reliance on, and are cautioned about relying on, any forward-looking statements. Additional detailed information concerning important factors that could cause actual results to differ materially is available in our Interim Report 2017.
This presentation contains non-GAAP financial information. The primary non-GAAP financial measure we use is ‘adjusted performance’ which is computed by adjusting reported results for the period-on-period effects of foreign currency translation differences and significant items which distort period-on-period comparisons. Significant items are those items which management and investors would ordinarily identify and consider separately when assessing performance in order to better understand the underlying trends in the business. Reconciliations between non-GAAP financial measurements and the most directly comparable measures under GAAP are provided in the 3Q17 Earnings Release and the Reconciliations of Non-GAAP Financial Measures document which are both available at www.hsbc.com.

3030
Issued by HSBC Holdings plcGroup Investor Relations8 Canada SquareLondon E14 5HQUnited Kingdomwww.hsbc.com
Cover image: The Hong Kong-Zhuhai-Macau Bridge: one of the most ambitious infrastructure projects in the Pearl River.
Photography: courtesy of Dragages-China Harbour-VSL JV