hsbc+-+india+strategy+2012+-+headwinds+remain,+but+positives+emerging.pdf
TRANSCRIPT

abcGlobal Research
2011 saw a confluence of slowing growth and tighter monetary policy; the Sensex lost 37% in USD terms
Though headwinds remain, we are Neutral on India in view of valuations and potential monetary easing
Our key themes for 2012: Domestic consumption (autos, telcos, banks), import substitute resources (coal, oil) and exporters (pharma, IT)
2011: A year to forget India ranked among the worst performing markets in 2011. The Sensex fell 37% in USD terms on a mix of: self-inflicted paralysis in policy making; stubbornly high inflation (which resulted in tighter monetary policy); and buoyant oil prices, which placed the INR and fiscal situation under pressure.
A few positives are emerging Though pressure remains on the INR, fiscal situation and corporate earnings, valuations have come off sharply with the Sensex down 25% in INR terms in 2011 and EPS rolled forward a year. Additionally, monetary tightening is at an inflection point and the bulk of EPS downgrades seems to be behind us. We rate India Neutral within Asia with a Sensex target of 16,500 for 2012.
But an immediate rebound is unlikely While the MSCI India trades at an 11.9x PE and 1.9x PB on 2012 estimates – well below its long-term mean averages of 14.5x PE and 2.8x PB – upside looks limited near term on the potential downside to earnings and valuations relative to the rest of Asia.
Four key themes for 2012 Amid an uncertain global environment and slowing domestic demand, we believe investors should position themselves defensively based on the following four themes: 1) earnings resilience (Power Grid, ITC, Idea); 2) structural growth (Dr Reddy’s, Maruti, TCS); 3) balance sheet strength (HDFC, Hero MotoCorp, IndusInd Bank, Coal India); and 4) valuation anomalies (Cairn, Hindustan Zinc, Canara Bank).
Equity Strategy India
India Strategy Indian equities in 2012: Headwinds remain, but positives emerging
2012 themes and stocks
Theme Highlighted stocks CMP TP
Power Grid 101 130ITC 200 242Earnings resilience Idea Cellular 83 97
Dr Reddy’s 1606 1950Maruti Suzuki 952 1200Structural growth TCS 1173 1260
HDFC 660 808Hero MotoCorp 1786 2400IndusInd Bank 243 326
Balance sheet strength
Coal India 327 415
Cairn India 329 400Hindustan Zinc 122 150Valuation anomalies Canara Bank 384 572
Source: HSBC estimates; Prices as of 9 January 2012 and are in INR
12 January 2012 Jitendra Sriram* India Strategist HSBC Securities & Capital Markets (India) Private Limited +91 22 2268 1271 [email protected]
Herald van der Linde* Strategist The Hongkong and Shanghai Banking Corporation Limited +852 2996 6575 [email protected]
Vikas Ahuja* Associate Bangalore View HSBC Global Research at: http://www.research.hsbc.com
*Employed by a non-US affiliate of HSBC Securities (USA) Inc, and is not registered/qualified pursuant to FINRA regulations
Issuer of report: HSBC Securities and Capital Markets (India) Private Limited
Disclaimer & Disclosures This report must be read with the disclosures and the analyst certifications in the Disclosure appendix, and with the Disclaimer, which forms part of it
2
Equity Strategy India 12 January 2012
abc
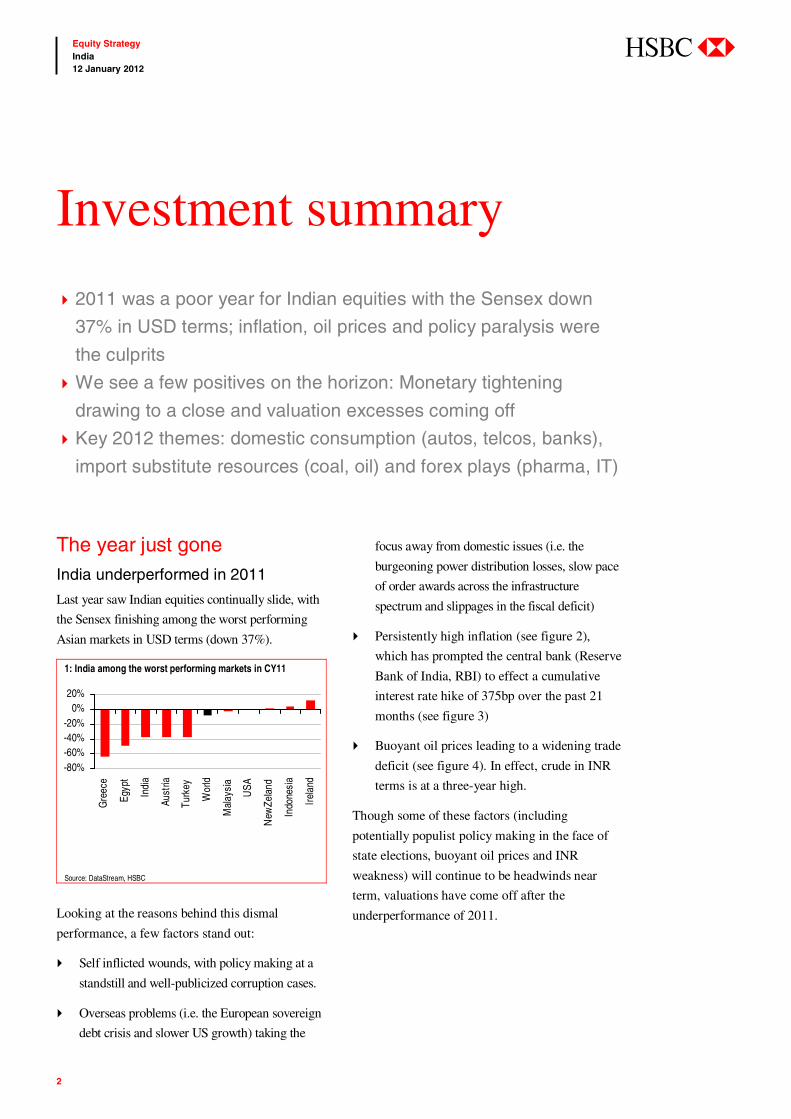
The year just gone India underperformed in 2011
Last year saw Indian equities continually slide, with
the Sensex finishing among the worst performing
Asian markets in USD terms (down 37%).
1: India among the worst performing markets in CY11
-80%-60%-40%-20%
0%20%
Gre
ece
Egyp
t
Indi
a
Aust
ria
Turk
ey
Wor
ld
Mal
aysi
a
USA
New
Zela
nd
Indo
nesi
a
Irela
nd
Source: DataStream, HSBC
Looking at the reasons behind this dismal
performance, a few factors stand out:
Self inflicted wounds, with policy making at a
standstill and well-publicized corruption cases.
Overseas problems (i.e. the European sovereign
debt crisis and slower US growth) taking the
focus away from domestic issues (i.e. the
burgeoning power distribution losses, slow pace
of order awards across the infrastructure
spectrum and slippages in the fiscal deficit)
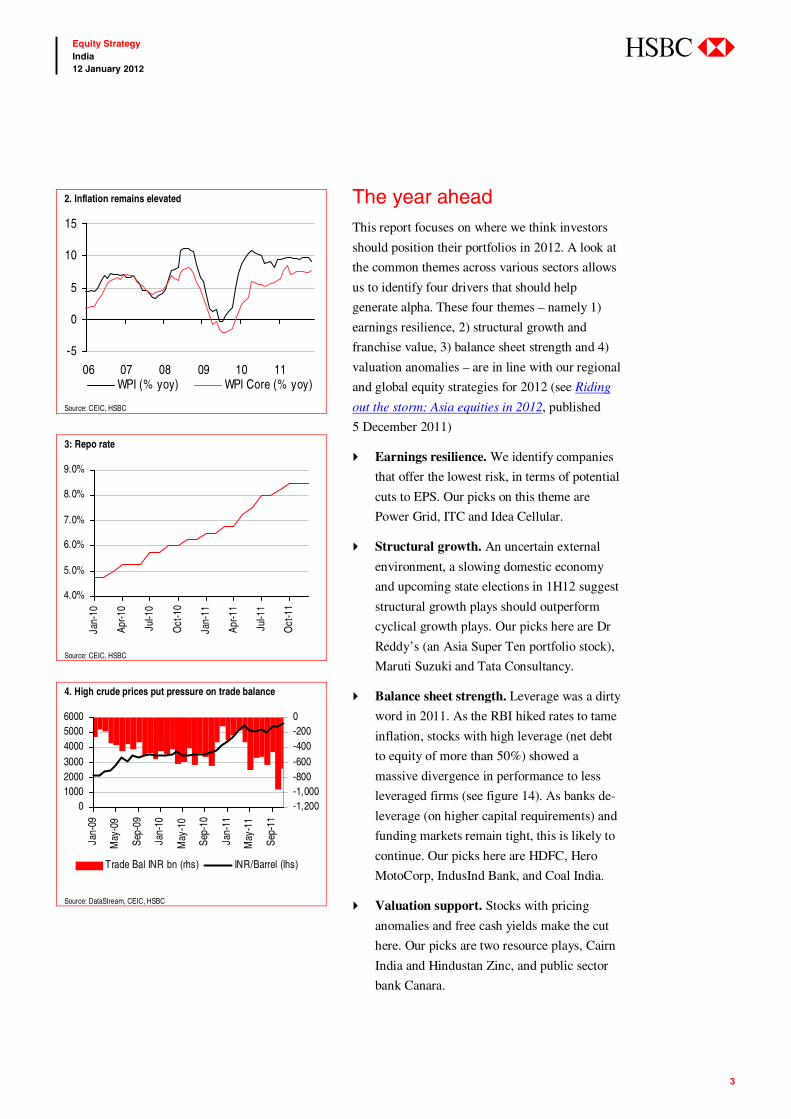
Persistently high inflation (see figure 2),
which has prompted the central bank (Reserve
Bank of India, RBI) to effect a cumulative
interest rate hike of 375bp over the past 21
months (see figure 3)
Buoyant oil prices leading to a widening trade
deficit (see figure 4). In effect, crude in INR
terms is at a three-year high.
Though some of these factors (including
potentially populist policy making in the face of
state elections, buoyant oil prices and INR
weakness) will continue to be headwinds near
term, valuations have come off after the
underperformance of 2011.
Investment summary
2011 was a poor year for Indian equities with the Sensex down
37% in USD terms; inflation, oil prices and policy paralysis were
the culprits
We see a few positives on the horizon: Monetary tightening
drawing to a close and valuation excesses coming off
Key 2012 themes: domestic consumption (autos, telcos, banks),
import substitute resources (coal, oil) and forex plays (pharma, IT)
3
Equity Strategy India 12 January 2012
abc
2. Inflation remains elevated
-5
0
5
10
15
06 07 08 09 10 11WPI (% yoy) WPI Core (% yoy)
Source: CEIC, HSBC
3: Repo rate
4.0%
5.0%
6.0%
7.0%
8.0%
9.0%
Jan-
10
Apr-1
0
Jul-1
0
Oct
-10
Jan-
11
Apr-1
1
Jul-1
1
Oct
-11
Source: CEIC, HSBC
4. High crude prices put pressure on trade balance
0100020003000400050006000
Jan-
09
May
-09
Sep-
09
Jan-
10
May
-10
Sep-
10
Jan-
11
May
-11
Sep-
11
-1,200-1,000-800-600-400-2000
Trade Bal INR bn (rhs) INR/Barrel (lhs)
Source: DataStream, CEIC, HSBC
The year ahead This report focuses on where we think investors
should position their portfolios in 2012. A look at
the common themes across various sectors allows
us to identify four drivers that should help
generate alpha. These four themes – namely 1)
earnings resilience, 2) structural growth and
franchise value, 3) balance sheet strength and 4)
valuation anomalies – are in line with our regional
and global equity strategies for 2012 (see Riding
out the storm: Asia equities in 2012, published
5 December 2011)
Earnings resilience. We identify companies
that offer the lowest risk, in terms of potential
cuts to EPS. Our picks on this theme are
Power Grid, ITC and Idea Cellular.
Structural growth. An uncertain external
environment, a slowing domestic economy
and upcoming state elections in 1H12 suggest
structural growth plays should outperform
cyclical growth plays. Our picks here are Dr
Reddy’s (an Asia Super Ten portfolio stock),
Maruti Suzuki and Tata Consultancy.
Balance sheet strength. Leverage was a dirty
word in 2011. As the RBI hiked rates to tame
inflation, stocks with high leverage (net debt
to equity of more than 50%) showed a
massive divergence in performance to less
leveraged firms (see figure 14). As banks de-
leverage (on higher capital requirements) and
funding markets remain tight, this is likely to
continue. Our picks here are HDFC, Hero
MotoCorp, IndusInd Bank, and Coal India.
Valuation support. Stocks with pricing
anomalies and free cash yields make the cut
here. Our picks are two resource plays, Cairn
India and Hindustan Zinc, and public sector
bank Canara.
4
Equity Strategy India 12 January 2012
abc
In our view, the themes of earnings stability in a
volatile external environment, regulatory or market
share led structural shifts, balance sheet strength and
valuation cushion to ride out external stresses will
provide defensive quality to investors’ portfolios in
an uncertain macro environment.
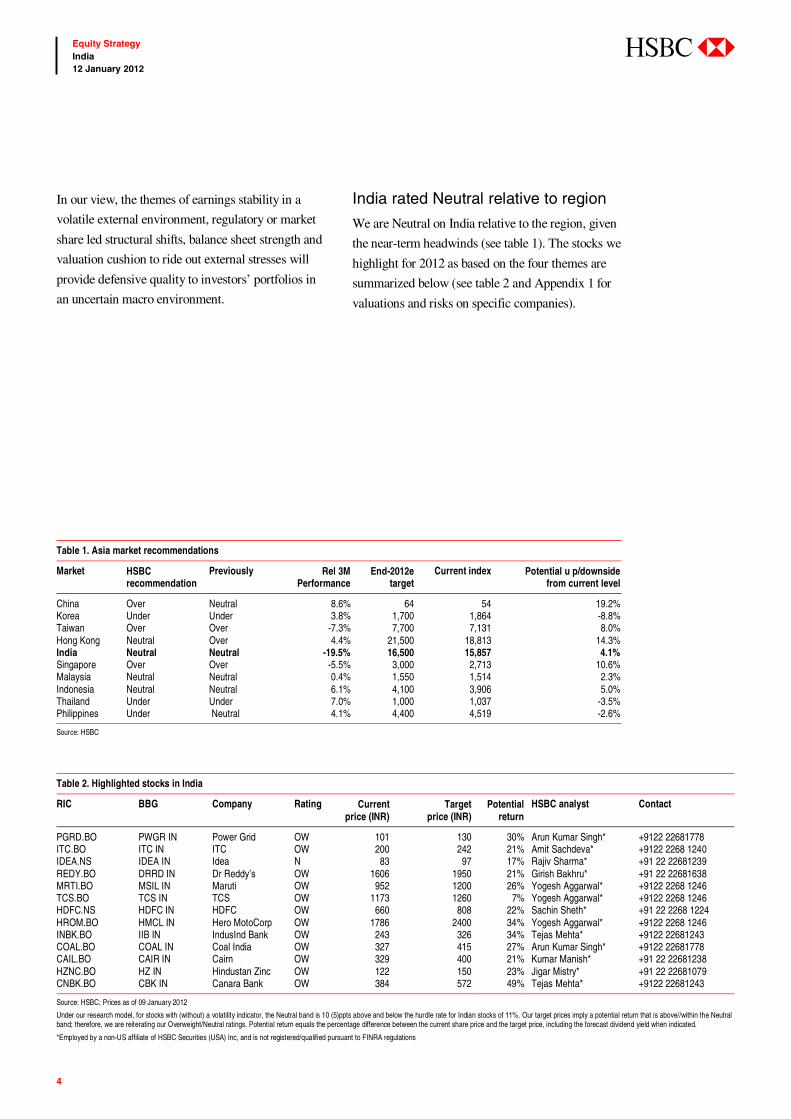
India rated Neutral relative to region
We are Neutral on India relative to the region, given
the near-term headwinds (see table 1). The stocks we
highlight for 2012 as based on the four themes are
summarized below (see table 2 and Appendix 1 for
valuations and risks on specific companies).
Table 2. Highlighted stocks in India
RIC BBG Company Rating Current price (INR)
Target price (INR)
Potential return
HSBC analyst Contact
PGRD.BO PWGR IN Power Grid OW 101 130 30% Arun Kumar Singh* +9122 22681778 ITC.BO ITC IN ITC OW 200 242 21% Amit Sachdeva* +9122 2268 1240 IDEA.NS IDEA IN Idea N 83 97 17% Rajiv Sharma* +91 22 22681239 REDY.BO DRRD IN Dr Reddy’s OW 1606 1950 21% Girish Bakhru* +91 22 22681638 MRTI.BO MSIL IN Maruti OW 952 1200 26% Yogesh Aggarwal* +9122 2268 1246 TCS.BO TCS IN TCS OW 1173 1260 7% Yogesh Aggarwal* +9122 2268 1246 HDFC.NS HDFC IN HDFC OW 660 808 22% Sachin Sheth* +91 22 2268 1224 HROM.BO HMCL IN Hero MotoCorp OW 1786 2400 34% Yogesh Aggarwal* +9122 2268 1246 INBK.BO IIB IN IndusInd Bank OW 243 326 34% Tejas Mehta* +9122 22681243 COAL.BO COAL IN Coal India OW 327 415 27% Arun Kumar Singh* +9122 22681778 CAIL.BO CAIR IN Cairn OW 329 400 21% Kumar Manish* +91 22 22681238 HZNC.BO HZ IN Hindustan Zinc OW 122 150 23% Jigar Mistry* +91 22 22681079 CNBK.BO CBK IN Canara Bank OW 384 572 49% Tejas Mehta* +9122 22681243
Source: HSBC; Prices as of 09 January 2012
Under our research model, for stocks with (without) a volatility indicator, the Neutral band is 10 (5)ppts above and below the hurdle rate for Indian stocks of 11%. Our target prices imply a potential return that is above//within the Neutral band; therefore, we are reiterating our Overweight/Neutral ratings. Potential return equals the percentage difference between the current share price and the target price, including the forecast dividend yield when indicated.
*Employed by a non-US affiliate of HSBC Securities (USA) Inc, and is not registered/qualified pursuant to FINRA regulations
Table 1. Asia market recommendations
Market HSBC recommendation
Previously Rel 3M Performance
End-2012etarget
Current index Potential u p/downside from current level
China Over Neutral 8.6% 64 54 19.2% Korea Under Under 3.8% 1,700 1,864 -8.8% Taiwan Over Over -7.3% 7,700 7,131 8.0% Hong Kong Neutral Over 4.4% 21,500 18,813 14.3% India Neutral Neutral -19.5% 16,500 15,857 4.1% Singapore Over Over -5.5% 3,000 2,713 10.6% Malaysia Neutral Neutral 0.4% 1,550 1,514 2.3% Indonesia Neutral Neutral 6.1% 4,100 3,906 5.0% Thailand Under Under 7.0% 1,000 1,037 -3.5% Philippines Under Neutral 4.1% 4,400 4,519 -2.6%
Source: HSBC

5
Equity Strategy India 12 January 2012
abc
Stimulus wearing off A look at India’s quarterly GDP shows that the
multiple stimulus packages announced by the
government between December 2008 and March
2009, in combination with the farm loan waiver
package, payouts following the 6th Pay
Commission and coordinated monetary easing by
the RBI to counteract the effects of the global
macro slowdown, have begun to wear off.
5. GDP growth (q-o-q %)
5%
6%
7%
8%
9%
10%
Mar
-06
Mar
-07
Mar
-08
Mar
-09
Mar
-10
Mar
-11
Source: CEIC, HSBC
With the economy experiencing a shorter-than-
normal cycle (barely 25 months from the lows of
March 2009), policy makers have not had
sufficient time to raise taxes to normative levels.
The subsequent fiscal slippage (see figure 6)
leaves the government with limited firepower to
battle the next wave of macro pressures.
6. Estimated fiscal slippage
4.60 0.35 0.17 0.22
-1.002.003.004.005.006.007.00
Budg
eted
Fisc
al
Def
icit
FY12
Slip
page
in
reve
nue
rece
ipts
Slip
page
in c
apita
l
rece
ipts
Slip
page
s on
subs
idy
bill
less
unde
rach
ievm
ent
Source: HSBC estimates
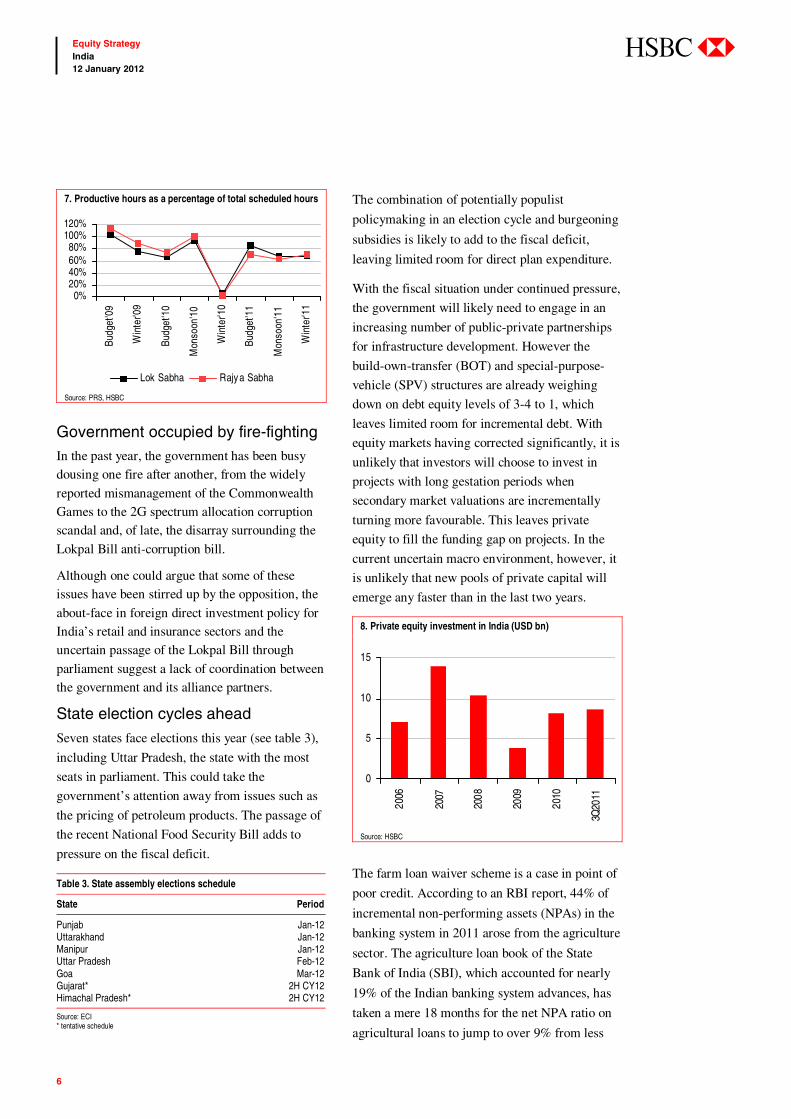
Politics remain murky Governance in state of paralysis
Parliament has been virtually paralysed since the
winter session of 2010 (see figure 7). This has
meant limited progress in enacting reformist
policies like the Direct Tax Code and the Goods
and Services Tax Act.
Environment: Slowing down
Slower post-stimulus growth momentum, political indecision and
waning earnings momentum cloud outlook for 2012
In our view, the impact of these factors will intensify in the early
part of 2012 before subsiding
6
Equity Strategy India 12 January 2012
abc
7. Productive hours as a percentage of total scheduled hours
0%20%40%60%80%
100%120%
Budg
et'0
9
Win
ter'0
9
Budg
et'1
0
Mon
soon
'10
Win
ter'1
0
Budg
et'1
1
Mon
soon
'11
Win
ter'1
1
Lok Sabha Rajy a Sabha
Source: PRS, HSBC
Government occupied by fire-fighting In the past year, the government has been busy dousing one fire after another, from the widely
reported mismanagement of the Commonwealth Games to the 2G spectrum allocation corruption scandal and, of late, the disarray surrounding the
Lokpal Bill anti-corruption bill.
Although one could argue that some of these issues have been stirred up by the opposition, the
about-face in foreign direct investment policy for India’s retail and insurance sectors and the uncertain passage of the Lokpal Bill through
parliament suggest a lack of coordination between the government and its alliance partners.
State election cycles ahead
Seven states face elections this year (see table 3),
including Uttar Pradesh, the state with the most
seats in parliament. This could take the
government’s attention away from issues such as
the pricing of petroleum products. The passage of
the recent National Food Security Bill adds to
pressure on the fiscal deficit.
Table 3. State assembly elections schedule
State Period
Punjab Jan-12 Uttarakhand Jan-12 Manipur Jan-12 Uttar Pradesh Feb-12 Goa Mar-12 Gujarat* 2H CY12 Himachal Pradesh* 2H CY12
Source: ECI * tentative schedule
The combination of potentially populist
policymaking in an election cycle and burgeoning
subsidies is likely to add to the fiscal deficit,
leaving limited room for direct plan expenditure.
With the fiscal situation under continued pressure,
the government will likely need to engage in an
increasing number of public-private partnerships
for infrastructure development. However the
build-own-transfer (BOT) and special-purpose-
vehicle (SPV) structures are already weighing
down on debt equity levels of 3-4 to 1, which
leaves limited room for incremental debt. With
equity markets having corrected significantly, it is
unlikely that investors will choose to invest in
projects with long gestation periods when
secondary market valuations are incrementally
turning more favourable. This leaves private
equity to fill the funding gap on projects. In the
current uncertain macro environment, however, it
is unlikely that new pools of private capital will
emerge any faster than in the last two years.
8. Private equity investment in India (USD bn)
0
5
10
15
2006
2007
2008
2009
2010
3Q20
11
Source: HSBC
The farm loan waiver scheme is a case in point of
poor credit. According to an RBI report, 44% of
incremental non-performing assets (NPAs) in the
banking system in 2011 arose from the agriculture
sector. The agriculture loan book of the State
Bank of India (SBI), which accounted for nearly
19% of the Indian banking system advances, has
taken a mere 18 months for the net NPA ratio on
agricultural loans to jump to over 9% from less
7
Equity Strategy India 12 January 2012
abc
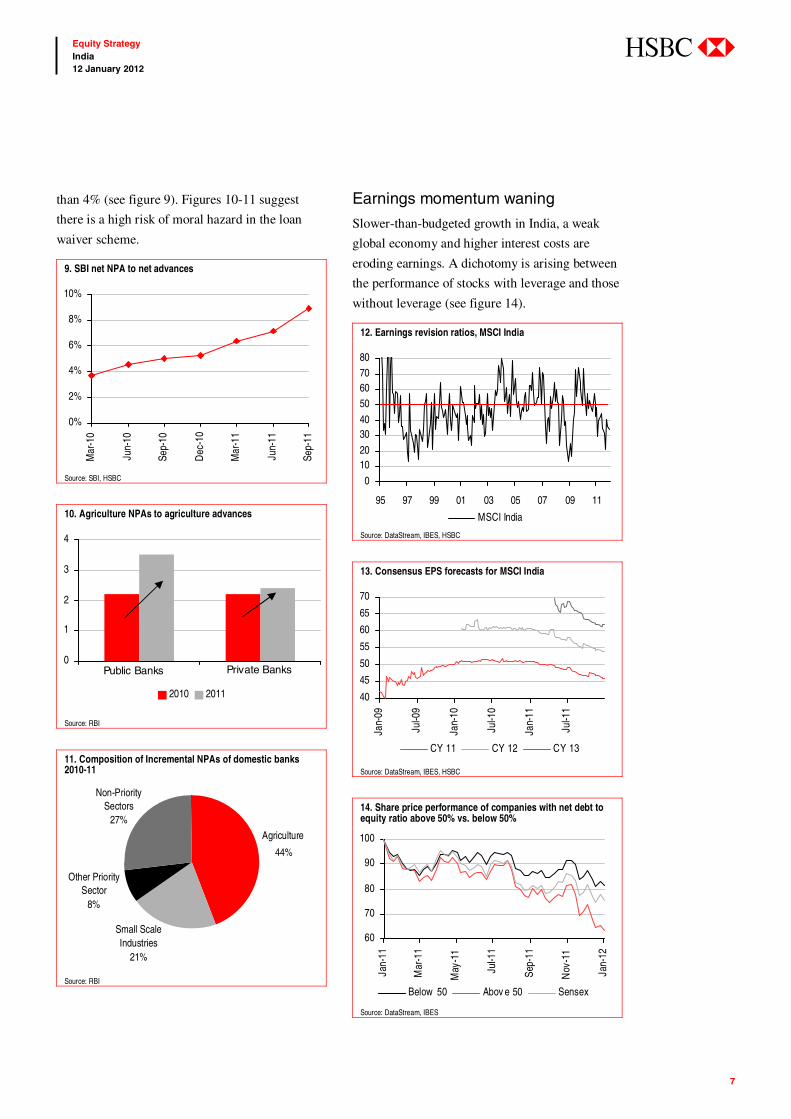
than 4% (see figure 9). Figures 10-11 suggest
there is a high risk of moral hazard in the loan
waiver scheme.
9. SBI net NPA to net advances
0%
2%
4%
6%
8%
10%
Mar
-10
Jun-
10
Sep-
10
Dec
-10
Mar
-11
Jun-
11
Sep-
11
Source: SBI, HSBC
10. Agriculture NPAs to agriculture advances
0
1
2
3
4
2010 2011
Private BanksPublic Banks
Source: RBI
11. Composition of Incremental NPAs of domestic banks 2010-11
Agriculture
44%
Non-PrioritySectors
27%
Small ScaleIndustries
21%
Other PrioritySector
8%
Agriculture
44%
Non-PrioritySectors
27%
Small ScaleIndustries
21%
Other PrioritySector
8%
Source: RBI
Earnings momentum waning
Slower-than-budgeted growth in India, a weak
global economy and higher interest costs are
eroding earnings. A dichotomy is arising between
the performance of stocks with leverage and those
without leverage (see figure 14).
12. Earnings revision ratios, MSCI India
0
1020
3040
50607080
95 97 99 01 03 05 07 09 11
MSCI India
Source: DataStream, IBES, HSBC
13. Consensus EPS forecasts for MSCI India
40
45
50
55
60
65
70
Jan-
09
Jul-0
9
Jan-
10
Jul-1
0
Jan-
11
Jul-1
1
CY 11 CY 12 CY 13
Source: DataStream, IBES, HSBC
14. Share price performance of companies with net debt to equity ratio above 50% vs. below 50%
60
70
80
90
100
Jan-
11
Mar
-11
May
-11
Jul-1
1
Sep-
11
Nov
-11
Jan-
12
Below 50 Abov e 50 Sensex
Source: DataStream, IBES
8
Equity Strategy India 12 January 2012
abc
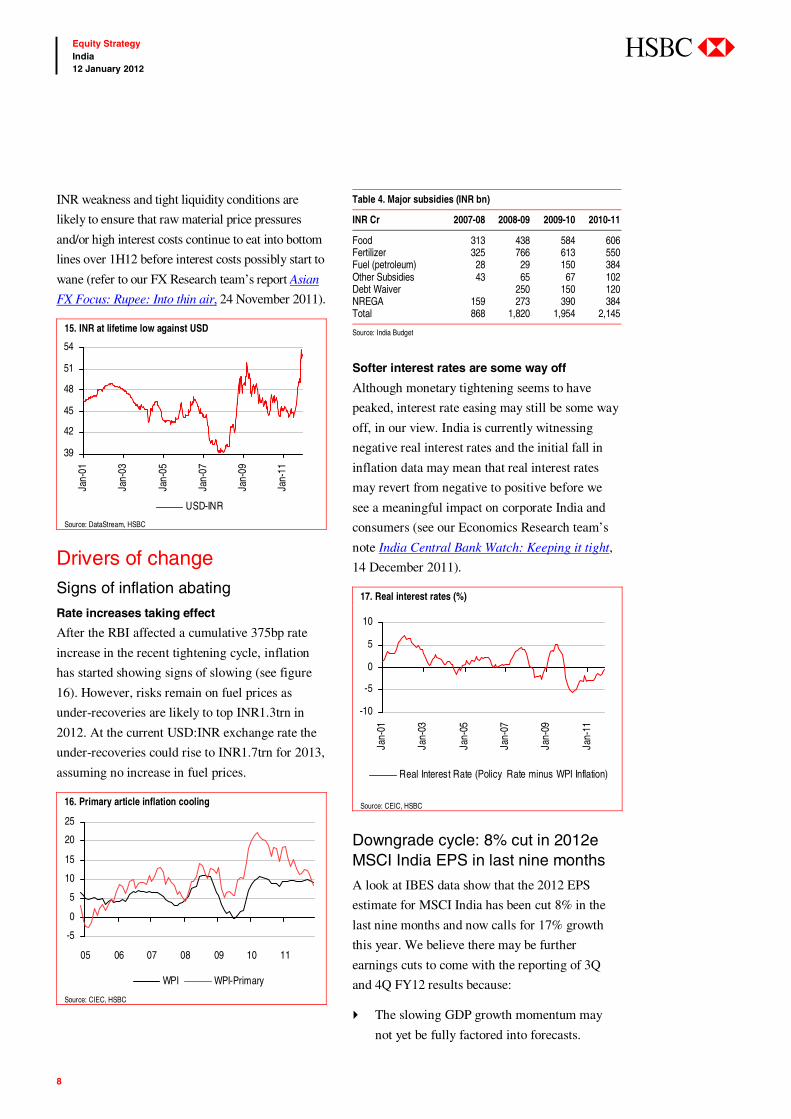
INR weakness and tight liquidity conditions are
likely to ensure that raw material price pressures
and/or high interest costs continue to eat into bottom
lines over 1H12 before interest costs possibly start to
wane (refer to our FX Research team’s report Asian
FX Focus: Rupee: Into thin air, 24 November 2011).
15. INR at lifetime low against USD
39
42
45
48
51
54
Jan-
01
Jan-
03
Jan-
05
Jan-
07
Jan-
09
Jan-
11
USD-INR
Source: DataStream, HSBC
Drivers of change Signs of inflation abating
Rate increases taking effect
After the RBI affected a cumulative 375bp rate
increase in the recent tightening cycle, inflation
has started showing signs of slowing (see figure
16). However, risks remain on fuel prices as
under-recoveries are likely to top INR1.3trn in
2012. At the current USD:INR exchange rate the
under-recoveries could rise to INR1.7trn for 2013,
assuming no increase in fuel prices.
16. Primary article inflation cooling
-5
0
5
10
15
20
25
05 06 07 08 09 10 11
WPI WPI-Primary
Source: CIEC, HSBC
Table 4. Major subsidies (INR bn)
INR Cr 2007-08 2008-09 2009-10 2010-11
Food 313 438 584 606 Fertilizer 325 766 613 550 Fuel (petroleum) 28 29 150 384 Other Subsidies 43 65 67 102 Debt Waiver 250 150 120 NREGA 159 273 390 384 Total 868 1,820 1,954 2,145
Source: India Budget
Softer interest rates are some way off
Although monetary tightening seems to have
peaked, interest rate easing may still be some way
off, in our view. India is currently witnessing
negative real interest rates and the initial fall in
inflation data may mean that real interest rates
may revert from negative to positive before we
see a meaningful impact on corporate India and
consumers (see our Economics Research team’s
note India Central Bank Watch: Keeping it tight,
14 December 2011).
17. Real interest rates (%)
-10
-5
0
5
10
Jan-
01
Jan-
03
Jan-
05
Jan-
07
Jan-
09
Jan-
11
Real Interest Rate (Policy Rate minus WPI Inflation)
Source: CEIC, HSBC
Downgrade cycle: 8% cut in 2012e MSCI India EPS in last nine months
A look at IBES data show that the 2012 EPS
estimate for MSCI India has been cut 8% in the
last nine months and now calls for 17% growth
this year. We believe there may be further
earnings cuts to come with the reporting of 3Q
and 4Q FY12 results because:
The slowing GDP growth momentum may
not yet be fully factored into forecasts.
9
Equity Strategy India 12 January 2012
abc
Interest costs as a percentage of net debt are
currently at 6%, whereas six-month AAA
corporate paper yields 10.1%. This suggests
that the effective interest cost of corporate
India will jump further.
Corporate tax collection was up 8.3% y-o-y
from April to December 2011.
The slowdown in the domestic economy’s
growth momentum is unlikely to reverse in a
hurry.
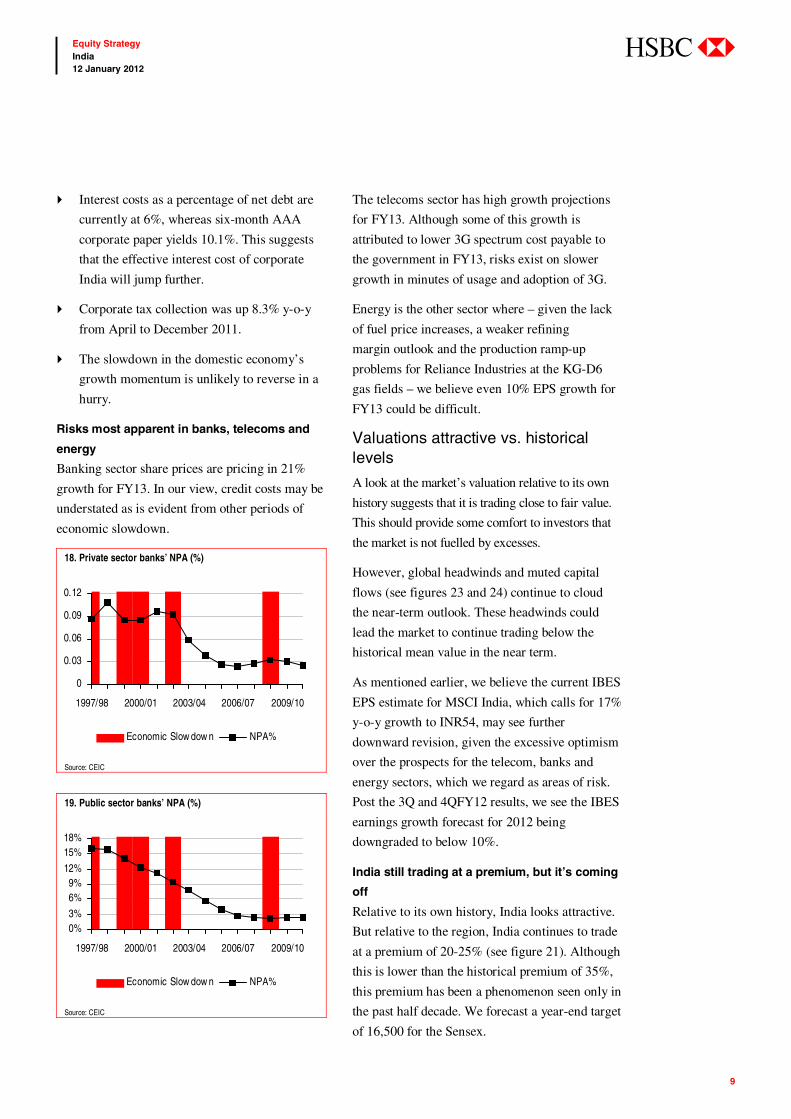
Risks most apparent in banks, telecoms and
energy
Banking sector share prices are pricing in 21%
growth for FY13. In our view, credit costs may be
understated as is evident from other periods of
economic slowdown.
18. Private sector banks’ NPA (%)
0
0.03
0.06
0.09
0.12
1997/98 2000/01 2003/04 2006/07 2009/10
Economic Slow dow n NPA%
Source: CEIC
19. Public sector banks’ NPA (%)
0%3%
6%9%
12%
15%18%
1997/98 2000/01 2003/04 2006/07 2009/10
Economic Slow dow n NPA%
Source: CEIC
The telecoms sector has high growth projections
for FY13. Although some of this growth is
attributed to lower 3G spectrum cost payable to
the government in FY13, risks exist on slower
growth in minutes of usage and adoption of 3G.
Energy is the other sector where – given the lack
of fuel price increases, a weaker refining
margin outlook and the production ramp-up
problems for Reliance Industries at the KG-D6
gas fields – we believe even 10% EPS growth for
FY13 could be difficult.
Valuations attractive vs. historical levels
A look at the market’s valuation relative to its own
history suggests that it is trading close to fair value.
This should provide some comfort to investors that
the market is not fuelled by excesses.
However, global headwinds and muted capital
flows (see figures 23 and 24) continue to cloud
the near-term outlook. These headwinds could
lead the market to continue trading below the
historical mean value in the near term.
As mentioned earlier, we believe the current IBES
EPS estimate for MSCI India, which calls for 17%
y-o-y growth to INR54, may see further
downward revision, given the excessive optimism
over the prospects for the telecom, banks and
energy sectors, which we regard as areas of risk.
Post the 3Q and 4QFY12 results, we see the IBES
earnings growth forecast for 2012 being
downgraded to below 10%.
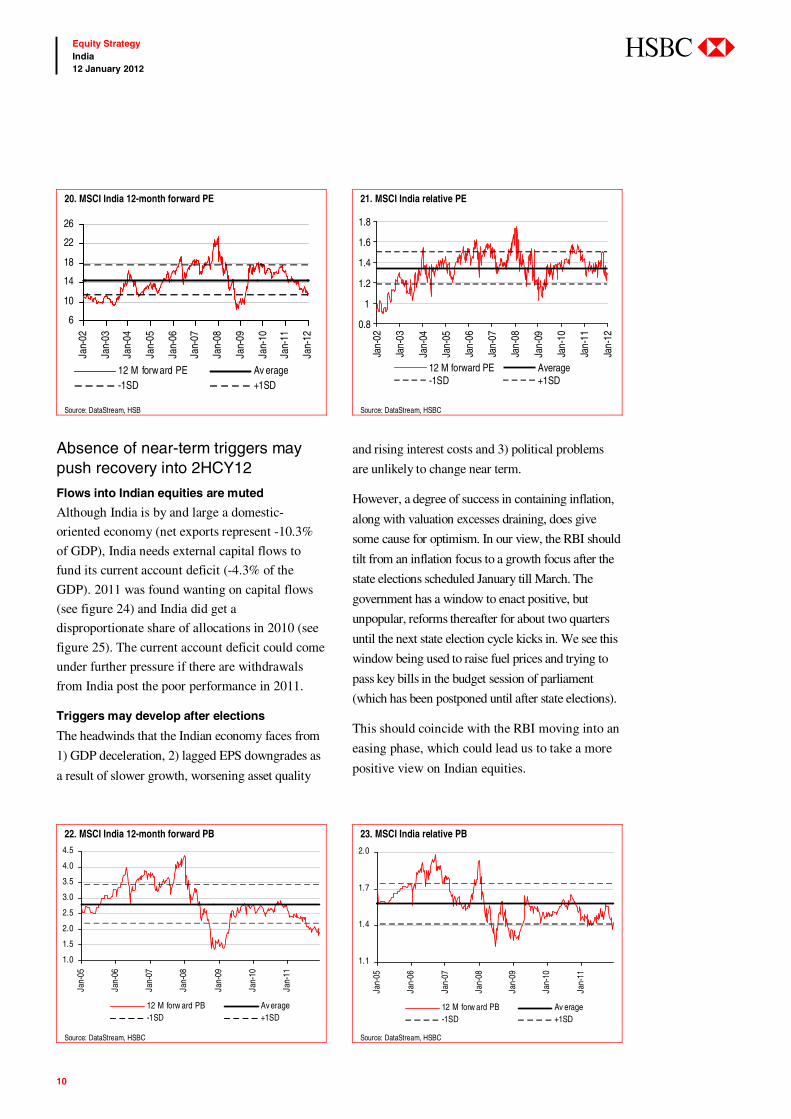
India still trading at a premium, but it’s coming
off
Relative to its own history, India looks attractive.
But relative to the region, India continues to trade
at a premium of 20-25% (see figure 21). Although
this is lower than the historical premium of 35%,
this premium has been a phenomenon seen only in
the past half decade. We forecast a year-end target
of 16,500 for the Sensex.
10
Equity Strategy India 12 January 2012
abc
Absence of near-term triggers may push recovery into 2HCY12
Flows into Indian equities are muted
Although India is by and large a domestic-
oriented economy (net exports represent -10.3%
of GDP), India needs external capital flows to
fund its current account deficit (-4.3% of the
GDP). 2011 was found wanting on capital flows
(see figure 24) and India did get a
disproportionate share of allocations in 2010 (see
figure 25). The current account deficit could come
under further pressure if there are withdrawals
from India post the poor performance in 2011.
Triggers may develop after elections
The headwinds that the Indian economy faces from
1) GDP deceleration, 2) lagged EPS downgrades as
a result of slower growth, worsening asset quality
and rising interest costs and 3) political problems
are unlikely to change near term.
However, a degree of success in containing inflation,
along with valuation excesses draining, does give
some cause for optimism. In our view, the RBI should
tilt from an inflation focus to a growth focus after the
state elections scheduled January till March. The
government has a window to enact positive, but
unpopular, reforms thereafter for about two quarters
until the next state election cycle kicks in. We see this
window being used to raise fuel prices and trying to
pass key bills in the budget session of parliament
(which has been postponed until after state elections).
This should coincide with the RBI moving into an
easing phase, which could lead us to take a more
positive view on Indian equities.
20. MSCI India 12-month forward PE 21. MSCI India relative PE
6
10
14
18
22
26
Jan-
02
Jan-
03
Jan-
04
Jan-
05
Jan-
06
Jan-
07
Jan-
08
Jan-
09
Jan-
10
Jan-
11
Jan-
12
12 M forward PE Av erage-1SD +1SD
0.8
1
1.2
1.4
1.6
1.8
Jan-
02
Jan-
03
Jan-
04
Jan-
05
Jan-
06
Jan-
07
Jan-
08
Jan-
09
Jan-
10
Jan-
11
Jan-
12
12 M forward PE Average-1SD +1SD
0.8
1
1.2
1.4
1.6
1.8
Jan-
02
Jan-
03
Jan-
04
Jan-
05
Jan-
06
Jan-
07
Jan-
08
Jan-
09
Jan-
10
Jan-
11
Jan-
12
12 M forward PE Average-1SD +1SD
Source: DataStream, HSB Source: DataStream, HSBC
22. MSCI India 12-month forward PB 23. MSCI India relative PB
1.0
1.5
2.0
2.5
3.0
3.5
4.0
4.5
Jan-
05
Jan-
06
Jan-
07
Jan-
08
Jan-
09
Jan-
10
Jan-
11
12 M forw ard PB Av erage-1SD +1SD
1.1
1.4
1.7
2.0
Jan-
05
Jan-
06
Jan-
07
Jan-
08
Jan-
09
Jan-
10
Jan-
11
12 M forw ard PB Av erage-1SD +1SD
Source: DataStream, HSBC Source: DataStream, HSBC

11
Equity Strategy India 12 January 2012
abc
24. Foreign net flows into India
-20
-10
0
10
20
30
40
2000
2001
2002
2003
2004
2005
2006
2007
2008
2009
2010
2011
Source: SEBI, HSBC
25. Funds flow
-20
-100
10203040
Indi
a
S. K
orea
Japa
n
Taiw
an
Indo
nesi
a
Thai
land
Philip
pine
s
Viet
nam
CY' 2010 CY' 2011
Source: Bloomberg, HSBC
12
Equity Strategy India 12 January 2012
abc
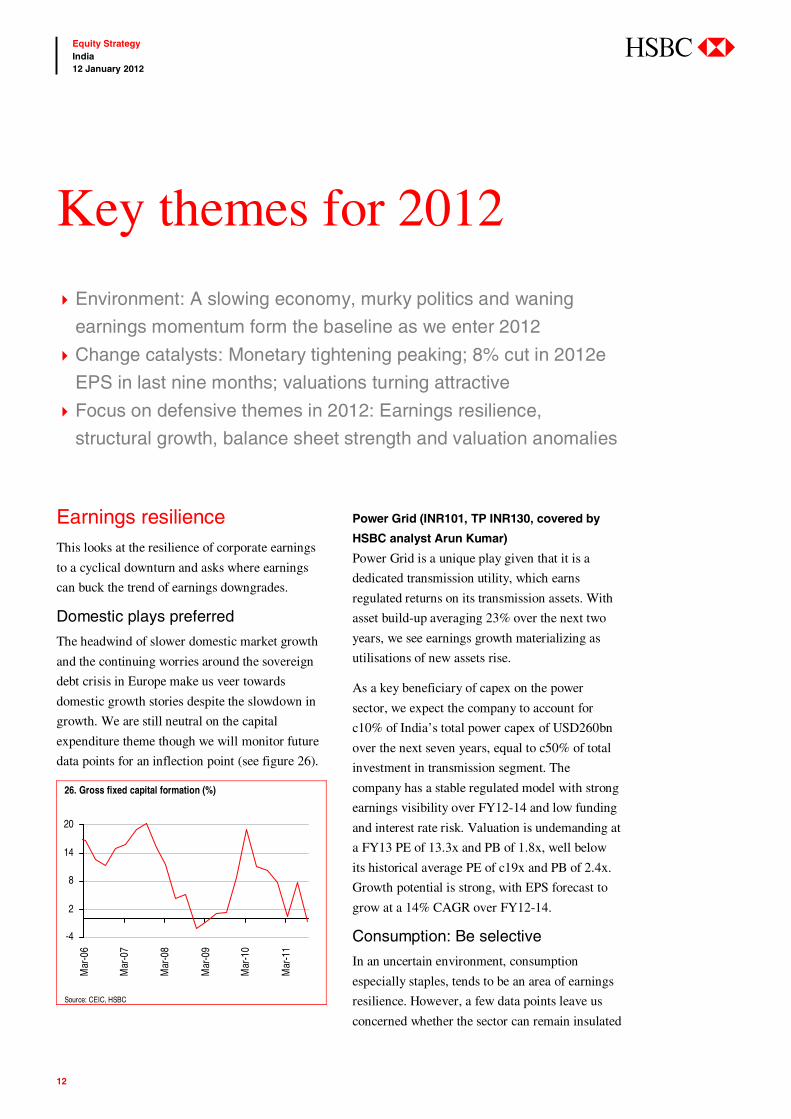
Earnings resilience This looks at the resilience of corporate earnings
to a cyclical downturn and asks where earnings
can buck the trend of earnings downgrades.
Domestic plays preferred
The headwind of slower domestic market growth
and the continuing worries around the sovereign
debt crisis in Europe make us veer towards
domestic growth stories despite the slowdown in
growth. We are still neutral on the capital
expenditure theme though we will monitor future
data points for an inflection point (see figure 26).
26. Gross fixed capital formation (%)
-4
2
8
14
20
Mar
-06
Mar
-07
Mar
-08
Mar
-09
Mar
-10
Mar
-11
Source: CEIC, HSBC
Power Grid (INR101, TP INR130, covered by
HSBC analyst Arun Kumar)
Power Grid is a unique play given that it is a
dedicated transmission utility, which earns
regulated returns on its transmission assets. With
asset build-up averaging 23% over the next two
years, we see earnings growth materializing as
utilisations of new assets rise.
As a key beneficiary of capex on the power
sector, we expect the company to account for
c10% of India’s total power capex of USD260bn
over the next seven years, equal to c50% of total
investment in transmission segment. The
company has a stable regulated model with strong
earnings visibility over FY12-14 and low funding
and interest rate risk. Valuation is undemanding at
a FY13 PE of 13.3x and PB of 1.8x, well below
its historical average PE of c19x and PB of 2.4x.
Growth potential is strong, with EPS forecast to
grow at a 14% CAGR over FY12-14.
Consumption: Be selective
In an uncertain environment, consumption
especially staples, tends to be an area of earnings
resilience. However, a few data points leave us
concerned whether the sector can remain insulated
Key themes for 2012
Environment: A slowing economy, murky politics and waning
earnings momentum form the baseline as we enter 2012
Change catalysts: Monetary tightening peaking; 8% cut in 2012e
EPS in last nine months; valuations turning attractive
Focus on defensive themes in 2012: Earnings resilience,
structural growth, balance sheet strength and valuation anomalies
13
Equity Strategy India 12 January 2012
abc
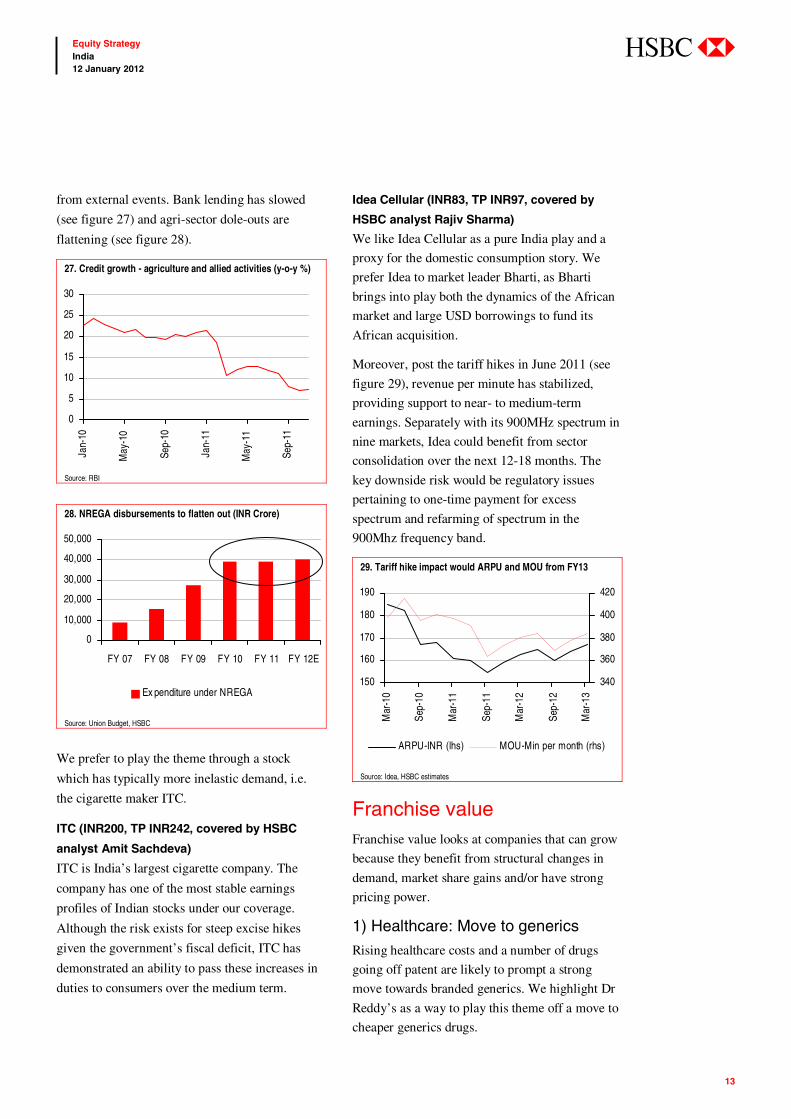
from external events. Bank lending has slowed
(see figure 27) and agri-sector dole-outs are
flattening (see figure 28).
27. Credit growth - agriculture and allied activities (y-o-y %)
0
5
10
15
20
25
30
Jan-
10
May
-10
Sep-
10
Jan-
11
May
-11
Sep-
11
Source: RBI
28. NREGA disbursements to flatten out (INR Crore)
0
10,000
20,000
30,000
40,000
50,000
FY 07 FY 08 FY 09 FY 10 FY 11 FY 12E
Ex penditure under NREGA
Source: Union Budget, HSBC
We prefer to play the theme through a stock
which has typically more inelastic demand, i.e.
the cigarette maker ITC.
ITC (INR200, TP INR242, covered by HSBC
analyst Amit Sachdeva)
ITC is India’s largest cigarette company. The
company has one of the most stable earnings
profiles of Indian stocks under our coverage.
Although the risk exists for steep excise hikes
given the government’s fiscal deficit, ITC has
demonstrated an ability to pass these increases in
duties to consumers over the medium term.
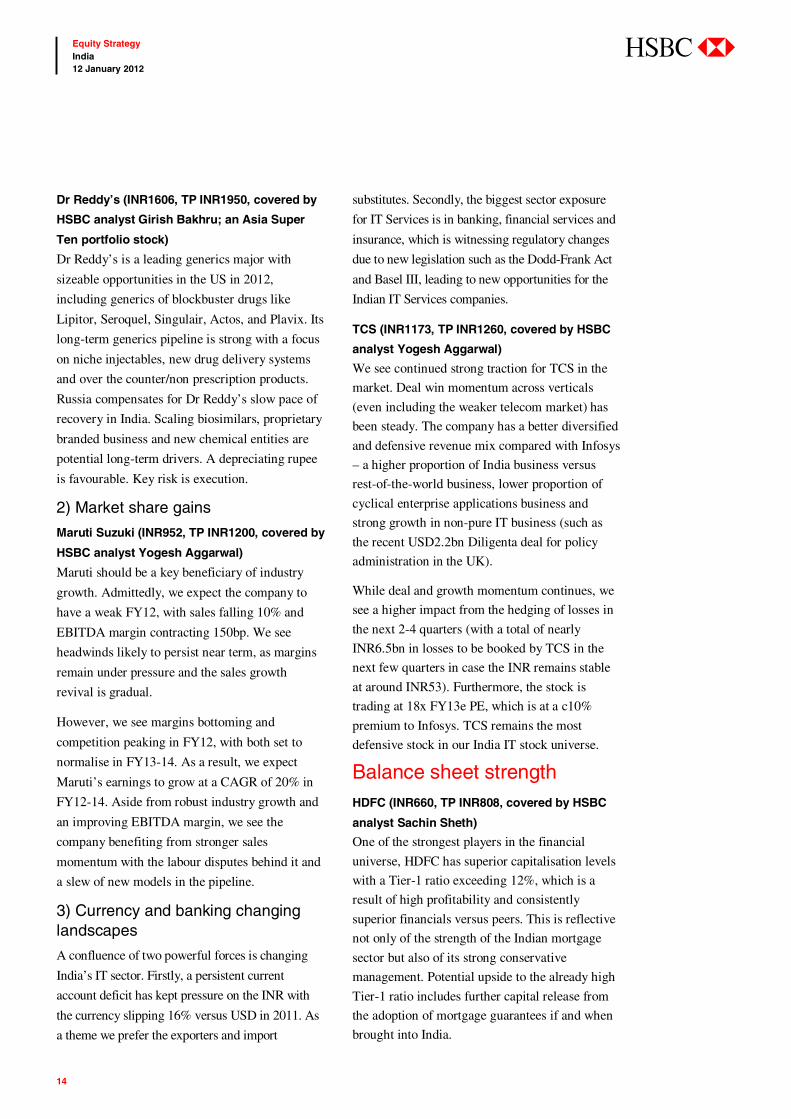
Idea Cellular (INR83, TP INR97, covered by
HSBC analyst Rajiv Sharma)
We like Idea Cellular as a pure India play and a
proxy for the domestic consumption story. We
prefer Idea to market leader Bharti, as Bharti
brings into play both the dynamics of the African
market and large USD borrowings to fund its
African acquisition.
Moreover, post the tariff hikes in June 2011 (see
figure 29), revenue per minute has stabilized,
providing support to near- to medium-term
earnings. Separately with its 900MHz spectrum in
nine markets, Idea could benefit from sector
consolidation over the next 12-18 months. The
key downside risk would be regulatory issues
pertaining to one-time payment for excess
spectrum and refarming of spectrum in the
900Mhz frequency band.
29. Tariff hike impact would ARPU and MOU from FY13
150
160
170
180
190
Mar
-10
Sep-
10
Mar
-11
Sep-
11
Mar
-12
Sep-
12
Mar
-13
340
360
380
400
420
ARPU-INR (lhs) MOU-Min per month (rhs)
Source: Idea, HSBC estimates
Franchise value Franchise value looks at companies that can grow
because they benefit from structural changes in
demand, market share gains and/or have strong
pricing power.
1) Healthcare: Move to generics
Rising healthcare costs and a number of drugs
going off patent are likely to prompt a strong
move towards branded generics. We highlight Dr
Reddy’s as a way to play this theme off a move to
cheaper generics drugs.
14
Equity Strategy India 12 January 2012
abc
Dr Reddy’s (INR1606, TP INR1950, covered by
HSBC analyst Girish Bakhru; an Asia Super
Ten portfolio stock)
Dr Reddy’s is a leading generics major with
sizeable opportunities in the US in 2012,
including generics of blockbuster drugs like
Lipitor, Seroquel, Singulair, Actos, and Plavix. Its
long-term generics pipeline is strong with a focus
on niche injectables, new drug delivery systems
and over the counter/non prescription products.
Russia compensates for Dr Reddy’s slow pace of
recovery in India. Scaling biosimilars, proprietary
branded business and new chemical entities are
potential long-term drivers. A depreciating rupee
is favourable. Key risk is execution.
2) Market share gains
Maruti Suzuki (INR952, TP INR1200, covered by
HSBC analyst Yogesh Aggarwal)
Maruti should be a key beneficiary of industry
growth. Admittedly, we expect the company to
have a weak FY12, with sales falling 10% and
EBITDA margin contracting 150bp. We see
headwinds likely to persist near term, as margins
remain under pressure and the sales growth
revival is gradual.
However, we see margins bottoming and
competition peaking in FY12, with both set to
normalise in FY13-14. As a result, we expect
Maruti’s earnings to grow at a CAGR of 20% in
FY12-14. Aside from robust industry growth and
an improving EBITDA margin, we see the
company benefiting from stronger sales
momentum with the labour disputes behind it and
a slew of new models in the pipeline.
3) Currency and banking changing landscapes
A confluence of two powerful forces is changing
India’s IT sector. Firstly, a persistent current
account deficit has kept pressure on the INR with
the currency slipping 16% versus USD in 2011. As
a theme we prefer the exporters and import
substitutes. Secondly, the biggest sector exposure
for IT Services is in banking, financial services and
insurance, which is witnessing regulatory changes
due to new legislation such as the Dodd-Frank Act
and Basel III, leading to new opportunities for the
Indian IT Services companies.
TCS (INR1173, TP INR1260, covered by HSBC
analyst Yogesh Aggarwal)
We see continued strong traction for TCS in the
market. Deal win momentum across verticals
(even including the weaker telecom market) has
been steady. The company has a better diversified
and defensive revenue mix compared with Infosys
– a higher proportion of India business versus
rest-of-the-world business, lower proportion of
cyclical enterprise applications business and
strong growth in non-pure IT business (such as
the recent USD2.2bn Diligenta deal for policy
administration in the UK).
While deal and growth momentum continues, we
see a higher impact from the hedging of losses in
the next 2-4 quarters (with a total of nearly
INR6.5bn in losses to be booked by TCS in the
next few quarters in case the INR remains stable
at around INR53). Furthermore, the stock is
trading at 18x FY13e PE, which is at a c10%
premium to Infosys. TCS remains the most
defensive stock in our India IT stock universe.
Balance sheet strength HDFC (INR660, TP INR808, covered by HSBC
analyst Sachin Sheth)
One of the strongest players in the financial
universe, HDFC has superior capitalisation levels
with a Tier-1 ratio exceeding 12%, which is a
result of high profitability and consistently
superior financials versus peers. This is reflective
not only of the strength of the Indian mortgage
sector but also of its strong conservative
management. Potential upside to the already high
Tier-1 ratio includes further capital release from
the adoption of mortgage guarantees if and when
brought into India.
15
Equity Strategy India 12 January 2012
abc
IndusInd Bank (INR243, TP INR326, covered by
HSBC analyst Tejas Mehta)
Among the smaller private banks, IndusInd stands
out as one which is comfortably capitalised with
Tier-1 exceeding 11%. A relatively new
management team has turned the bank around in
two years into a well-respected, well-run
institution with improving profitability and a solid
business model.
HDFC and IndusInd also fit our theme of the
peaking out of monetary tightening. As bulk
borrowing rates peak and potentially ease in the
latter part of 2012, we expect the benefit of lower
borrowing costs to be felt first by these entities.
Hero MotoCorp (INR1786, TP INR2400, covered
by HSBC analyst Yogesh Aggarwal)
Notwithstanding the risks from the split with
Honda, we believe Hero MotoCorp (HERO) is in
a better position to face slowing market growth
and rising competition, at least for the next few
quarters. HERO has a strong rural presence (45-
46% of its sales were from rural India in 2Q12, up
from 38% in 1Q09), which is positive as rural
income (both agrarian and non-agrarian)
continues to grow
Additionally, even if it is not the market leader in
the scooters market, the company is likely to
benefit from strong growth in this market, aided
by the launch of “Maestro”. Overall, thanks to
growth in the scooters market, a strong rural
presence and lower dependence on exports, we
believe competitive risks for HERO from Honda
are equal or lower than for Bajaj.
In terms of margins, HERO saw additional sales
and marketing expenditure (relating to
rebranding) and higher royalty payments in FY12.
The company is likely to face margin tailwinds on
both these fronts in FY13. Furthermore, a forecast
dividend yield of 5% in FY12 will mitigate the
downside on the stock.
Coal India (INR327, TP INR415, covered by
HSBC analyst Arun Kumar)
Coal demand is expected to double by FY17 as
coal-fired power projects come on stream with
approved linkages. Domestic coal prices, which
are still at a discount to the international prices,
have a lot of scope to go up, E-auction prices have
been strong at cINR2600 (up 45% y-o-y in the
first five months of FY12), while average fuel
supply agreements prices have increased from
INR1,400/MT to INR1,540/MT, leading to strong
EPS growth of 24% CAGR over FY11-14e.
Supply is a constraint but inventory is expected to
provide support over the next 2-3 years. Concern
on wage cost and the Mines and Minerals
Development and Regulation Bill to introduction
mines taxation is negated by the new pricing
system. Valuation is reasonable.
We like Coal India as an import substitute product.
India is in coal deficit and is expected to remain so
for the foreseeable future. With Coal India selling
coal at around a 50% or higher discount to
international prices (adjusted for calorific value),
demand and price variation risks turn low.
Pricing anomalies Cairn India: (INR329, TP400, covered by HSBC
analyst Kumar Manish)
Like Coal India, Cairn India is a play on an import
substitution product; India remains in oil deficit.
Our detailed analysis indicates substantial reserve
upside in Cairn India’s Rajasthan block, which is
currently producing 125,000 bopd (barrels of oil
per day). We believe the in-place oil volume can
more than double with a subsequent increase of
c40% in probability-weighted reserves. The
Rajasthan block constitutes c95% of our current
valuation for Cairn India. However, Cairn India
requires a series of approvals to ramp up
production. We anticipate these approvals post
final clearance from the cabinet for the Cairn-
16
Equity Strategy India 12 January 2012
abc
Vedanta deal. Cabinet approval is now a formality
given that the concerned parties have already
agreed to all conditions imposed by the cabinet.
Our valuation is based on our HSBC Brent
forecast of USD91/barrel in FY13 and a
USD/INR exchange rate of INR45. Each
USD10/barrel increase in our crude oil price
assumption raises our target price by 11%, while
each INR1 appreciation in the USD raises our
target price by 2%.
Cairn India’s current share price is building
Brent of cUSD90/barrel against the existing
price of USD109/barrel. Additionally, Cairn India
is in the top 10% of Nifty companies on the basis
of FCF yield.
Hindustan Zinc: (INR122, TP INR150, covered
by HSBC analyst Jigar Mistry)
Hindustan Zinc is the world’s largest integrated
and among the lowest cost producers producer of
zinc/lead. We expect a strong 25% CAGR in EPS
over the next two years following a ramp-up in
zinc/lead capacities as well as from a higher
contribution from silver. By FY13e, we expect a
Cash and cash equivalents balance of USD5.6bn
on a market capitalization of USD11bn, which
values the resident business at an EV/E of just
3.5x (FY13e EBITDA of USD1.6bn). In addition,
the stock trades at PB of just 1.5x, which we
consider very attractive given that the asset base is
almost irreplaceable. Negative risks are lower-
than-expected zinc prices and higher-than-
expected increase in royalties.
Canara Bank: (INR384, TP572, covered by
HSBC analyst Tejas Mehta)
Trading at 0.7x book, close to its 2008 low of 0.5x
which itself is a nine-year low, Canara Bank
offers an opportunity to play a bounce-back, as it
is trading at a discount to other large PSU banks,
arguably on account of concerns over its larger
power sector exposure. However, not only are its
slippages set to reduce but recoveries have been
showing very favourable trends. With a potential
rate easing likely this year, and if asset quality
fears prove unfounded as power sector issues
begin to be incrementally resolved, we see an
opportunity for entry, as the stock may retrace to
its five-year average multiple of 1x book.
17
Equity Strategy India 12 January 2012
abc
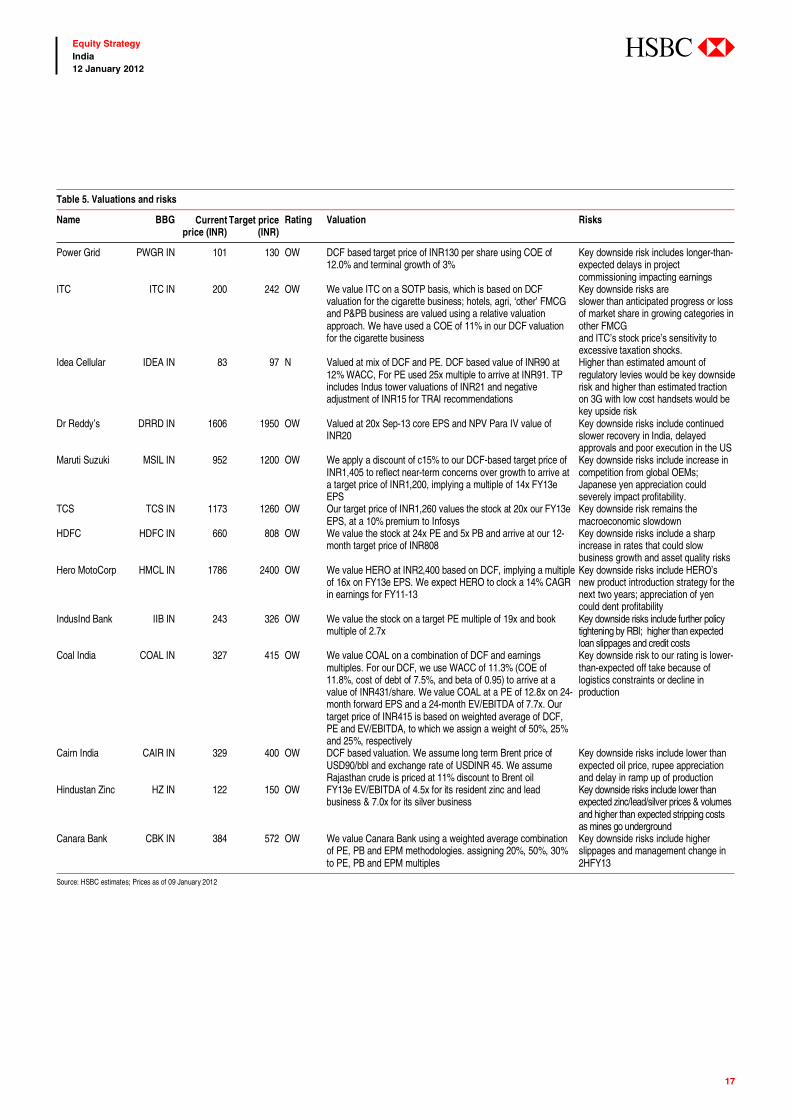
Table 5. Valuations and risks
Name BBG Current price (INR)
Target price (INR)
Rating Valuation Risks
Power Grid PWGR IN 101 130 OW DCF based target price of INR130 per share using COE of 12.0% and terminal growth of 3%
Key downside risk includes longer-than-expected delays in project commissioning impacting earnings
ITC ITC IN 200 242 OW We value ITC on a SOTP basis, which is based on DCF valuation for the cigarette business; hotels, agri, ‘other’ FMCG and P&PB business are valued using a relative valuation approach. We have used a COE of 11% in our DCF valuation for the cigarette business
Key downside risks are slower than anticipated progress or loss of market share in growing categories in other FMCG and ITC’s stock price’s sensitivity to excessive taxation shocks.
Idea Cellular IDEA IN 83 97 N Valued at mix of DCF and PE. DCF based value of INR90 at 12% WACC, For PE used 25x multiple to arrive at INR91. TP includes Indus tower valuations of INR21 and negative adjustment of INR15 for TRAI recommendations
Higher than estimated amount of regulatory levies would be key downside risk and higher than estimated traction on 3G with low cost handsets would be key upside risk
Dr Reddy’s DRRD IN 1606 1950 OW Valued at 20x Sep-13 core EPS and NPV Para IV value of INR20
Key downside risks include continued slower recovery in India, delayed approvals and poor execution in the US
Maruti Suzuki MSIL IN 952 1200 OW We apply a discount of c15% to our DCF-based target price of INR1,405 to reflect near-term concerns over growth to arrive at a target price of INR1,200, implying a multiple of 14x FY13e EPS
Key downside risks include increase in competition from global OEMs; Japanese yen appreciation could severely impact profitability.
TCS TCS IN 1173 1260 OW Our target price of INR1,260 values the stock at 20x our FY13e EPS, at a 10% premium to Infosys
Key downside risk remains the macroeconomic slowdown
HDFC HDFC IN 660 808 OW We value the stock at 24x PE and 5x PB and arrive at our 12-month target price of INR808
Key downside risks include a sharp increase in rates that could slow business growth and asset quality risks
Hero MotoCorp HMCL IN 1786 2400 OW We value HERO at INR2,400 based on DCF, implying a multiple of 16x on FY13e EPS. We expect HERO to clock a 14% CAGR in earnings for FY11-13
Key downside risks include HERO’s new product introduction strategy for the next two years; appreciation of yen could dent profitability
IndusInd Bank IIB IN 243 326 OW We value the stock on a target PE multiple of 19x and book multiple of 2.7x
Key downside risks include further policy tightening by RBI; higher than expected loan slippages and credit costs
Coal India COAL IN 327 415 OW We value COAL on a combination of DCF and earnings multiples. For our DCF, we use WACC of 11.3% (COE of 11.8%, cost of debt of 7.5%, and beta of 0.95) to arrive at a value of INR431/share. We value COAL at a PE of 12.8x on 24-month forward EPS and a 24-month EV/EBITDA of 7.7x. Our target price of INR415 is based on weighted average of DCF, PE and EV/EBITDA, to which we assign a weight of 50%, 25% and 25%, respectively
Key downside risk to our rating is lower-than-expected off take because of logistics constraints or decline in production
Cairn India CAIR IN 329 400 OW DCF based valuation. We assume long term Brent price of USD90/bbl and exchange rate of USDINR 45. We assume Rajasthan crude is priced at 11% discount to Brent oil
Key downside risks include lower than expected oil price, rupee appreciation and delay in ramp up of production
Hindustan Zinc HZ IN 122 150 OW FY13e EV/EBITDA of 4.5x for its resident zinc and lead business & 7.0x for its silver business
Key downside risks include lower than expected zinc/lead/silver prices & volumes and higher than expected stripping costs as mines go underground
Canara Bank CBK IN 384 572 OW We value Canara Bank using a weighted average combination of PE, PB and EPM methodologies. assigning 20%, 50%, 30% to PE, PB and EPM multiples
Key downside risks include higher slippages and management change in 2HFY13
Source: HSBC estimates; Prices as of 09 January 2012

18
Equity Strategy India 12 January 2012
abc
Notes

19
Equity Strategy India 12 January 2012
abc
Notes
20
Equity Strategy India 12 January 2012
abc
Disclosure appendix Analyst Certification The following analyst(s), economist(s), and/or strategist(s) who is(are) primarily responsible for this report, certifies(y) that the opinion(s) on the subject security(ies) or issuer(s) and/or any other views or forecasts expressed herein accurately reflect their personal view(s) and that no part of their compensation was, is or will be directly or indirectly related to the specific recommendation(s) or views contained in this research report: Jitendra Sriram, Herald van der Linde, Arun Singh, Amit Sachdeva, Rajiv Sharma, Girish Bakhru, Yogesh Aggarwal, Sachin Sheth, Tejas Mehta, Kumar Manish and Jigar Mistry
Important disclosures
Stock ratings and basis for financial analysis HSBC believes that investors utilise various disciplines and investment horizons when making investment decisions, which depend largely on individual circumstances such as the investor's existing holdings, risk tolerance and other considerations. Given these differences, HSBC has two principal aims in its equity research: 1) to identify long-term investment opportunities based on particular themes or ideas that may affect the future earnings or cash flows of companies on a 12 month time horizon; and 2) from time to time to identify short-term investment opportunities that are derived from fundamental, quantitative, technical or event-driven techniques on a 0-3 month time horizon and which may differ from our long-term investment rating. HSBC has assigned ratings for its long-term investment opportunities as described below.
This report addresses only the long-term investment opportunities of the companies referred to in the report. As and when HSBC publishes a short-term trading idea the stocks to which these relate are identified on the website at www.hsbcnet.com/research. Details of these short-term investment opportunities can be found under the Reports section of this website.
HSBC believes an investor's decision to buy or sell a stock should depend on individual circumstances such as the investor's existing holdings and other considerations. Different securities firms use a variety of ratings terms as well as different rating systems to describe their recommendations. Investors should carefully read the definitions of the ratings used in each research report. In addition, because research reports contain more complete information concerning the analysts' views, investors should carefully read the entire research report and should not infer its contents from the rating. In any case, ratings should not be used or relied on in isolation as investment advice.
Rating definitions for long-term investment opportunities
Stock ratings HSBC assigns ratings to its stocks in this sector on the following basis:
For each stock we set a required rate of return calculated from the cost of equity for that stock’s domestic or, as appropriate, regional market established by our strategy team. The price target for a stock represents the value the analyst expects the stock to reach over our performance horizon. The performance horizon is 12 months. For a stock to be classified as Overweight, the potential return, which equals the percentage difference between the current share price and the target price, including the forecast dividend yield when indicated, must exceed the required return by at least 5 percentage points over the next 12 months (or 10 percentage points for a stock classified as Volatile*). For a stock to be classified as Underweight, the stock must be expected to underperform its required return by at least 5 percentage points over the next 12 months (or 10 percentage points for a stock classified as Volatile*). Stocks between these bands are classified as Neutral.
Our ratings are re-calibrated against these bands at the time of any 'material change' (initiation of coverage, change of volatility status or change in price target). Notwithstanding this, and although ratings are subject to ongoing management review, expected returns will be permitted to move outside the bands as a result of normal share price fluctuations without necessarily triggering a rating change.
21
Equity Strategy India 12 January 2012
abc
*A stock will be classified as volatile if its historical volatility has exceeded 40%, if the stock has been listed for less than 12 months (unless it is in an industry or sector where volatility is low) or if the analyst expects significant volatility. However, stocks which we do not consider volatile may in fact also behave in such a way. Historical volatility is defined as the past month's average of the daily 365-day moving average volatilities. In order to avoid misleadingly frequent changes in rating, however, volatility has to move 2.5 percentage points past the 40% benchmark in either direction for a stock's status to change.
Rating distribution for long-term investment opportunities
As of 11 January 2012, the distribution of all ratings published is as follows: Overweight (Buy) 54% (25% of these provided with Investment Banking Services)
Neutral (Hold) 35% (20% of these provided with Investment Banking Services)
Underweight (Sell) 11% (13% of these provided with Investment Banking Services)
Information regarding company share price performance and history of HSBC ratings and price targets in respect of its long-term investment opportunities for the companies the subject of this report,is available from www.hsbcnet.com/research.
HSBC & Analyst disclosures Disclosure checklist
Company Ticker Recent price Price Date Disclosure
CAIRN INDIA LIMITED CAIL.BO 337.80 10-Jan-2012 5CANARA BANK CNBK.BO 412.60 10-Jan-2012 1, 4, 5, 6, 7, 11COAL INDIA LIMITED COAL.BO 318.05 10-Jan-2012 9DR. REDDY'S LAB. REDY.NS 1618.10 10-Jan-2012 4HDFC HDFC.NS 684.00 10-Jan-2012 2, 6, 7HERO MOTOCORP HROM.BO 1775.40 10-Jan-2012 2IDEA CELLULAR LTD IDEA.NS 82.10 10-Jan-2012 2, 5INDUSIND BANK INBK.BO 260.90 10-Jan-2012 4, 7ITC ITC.BO 205.15 10-Jan-2012 6MARUTI SUZUKI INDIA LTD MRTI.NS 986.35 10-Jan-2012 4POWER GRID CORP OF INDIA PGRD.BO 102.60 10-Jan-2012 9
Source: HSBC
1 HSBC* has managed or co-managed a public offering of securities for this company within the past 12 months. 2 HSBC expects to receive or intends to seek compensation for investment banking services from this company in the next
3 months. 3 At the time of publication of this report, HSBC Securities (USA) Inc. is a Market Maker in securities issued by this
company. 4 As of 31 December 2011 HSBC beneficially owned 1% or more of a class of common equity securities of this company. 5 As of 30 November 2011, this company was a client of HSBC or had during the preceding 12 month period been a client
of and/or paid compensation to HSBC in respect of investment banking services. 6 As of 30 November 2011, this company was a client of HSBC or had during the preceding 12 month period been a client
of and/or paid compensation to HSBC in respect of non-investment banking-securities related services. 7 As of 30 November 2011, this company was a client of HSBC or had during the preceding 12 month period been a client
of and/or paid compensation to HSBC in respect of non-securities services. 8 A covering analyst/s has received compensation from this company in the past 12 months. 9 A covering analyst/s or a member of his/her household has a financial interest in the securities of this company, as
detailed below. 10 A covering analyst/s or a member of his/her household is an officer, director or supervisory board member of this
company, as detailed below. 11 At the time of publication of this report, HSBC is a non-US Market Maker in securities issued by this company and/or in
securities in respect of this company
22
Equity Strategy India 12 January 2012
abc
Jitendra Sriram and his household members have a long position in the shares of Coal India Limited.
Jitendra Sriram and his household members have long positions in the shares of Power Grid Corp of India.
Analysts, economists, and strategists are paid in part by reference to the profitability of HSBC which includes investment banking revenues.
For disclosures in respect of any company mentioned in this report, please see the most recently published report on that company available at www.hsbcnet.com/research.
* HSBC Legal Entities are listed in the Disclaimer below.
Additional disclosures 1 This report is dated as at 12 January 2012. 2 All market data included in this report are dated as at close 09 January 2012, unless otherwise indicated in the report. 3 HSBC has procedures in place to identify and manage any potential conflicts of interest that arise in connection with its
Research business. HSBC's analysts and its other staff who are involved in the preparation and dissemination of Research operate and have a management reporting line independent of HSBC's Investment Banking business. Information Barrier procedures are in place between the Investment Banking and Research businesses to ensure that any confidential and/or price sensitive information is handled in an appropriate manner.
4 As of 31 December 2011, HSBC beneficially owned 5% or more of a class of common equity securities of the following company(ies) : MARUTI SUZUKI INDIA LTD
5 As of 31 December 2011, HSBC and/or its affiliates (including the funds, portfolios and investment clubs in securities managed by such entities) either, directly or indirectly, own or are involved in the acquisition, sale or intermediation of, 1% or more of the total capital of the subject companies securities in the market for the following Company(ies) : MARUTI SUZUKI INDIA LTD , DR. REDDY'S LAB. , CANARA BANK , INDUSIND BANK

23
Equity Strategy India 12 January 2012
abc
Disclaimer * Legal entities as at 04 March 2011 ‘UAE’ HSBC Bank Middle East Limited, Dubai; ‘HK’ The Hongkong and Shanghai Banking Corporation Limited, Hong Kong; ‘TW’ HSBC Securities (Taiwan) Corporation Limited; ‘CA’ HSBC Securities (Canada) Inc, Toronto; HSBC Bank, Paris Branch; HSBC France; ‘DE’ HSBC Trinkaus & Burkhardt AG, Düsseldorf; 000 HSBC Bank (RR), Moscow; ‘IN’ HSBC Securities and Capital Markets (India) Private Limited, Mumbai; ‘JP’ HSBC Securities (Japan) Limited, Tokyo; ‘EG’ HSBC Securities Egypt SAE, Cairo; ‘CN’ HSBC Investment Bank Asia Limited, Beijing Representative Office; The Hongkong and Shanghai Banking Corporation Limited, Singapore Branch; The Hongkong and Shanghai Banking Corporation Limited, Seoul Securities Branch; The Hongkong and Shanghai Banking Corporation Limited, Seoul Branch; HSBC Securities (South Africa) (Pty) Ltd, Johannesburg; ‘GR’ HSBC Securities SA, Athens; HSBC Bank plc, London, Madrid, Milan, Stockholm, Tel Aviv; ‘US’ HSBC Securities (USA) Inc, New York; HSBC Yatirim Menkul Degerler AS, Istanbul; HSBC México, SA, Institución de Banca Múltiple, Grupo Financiero HSBC; HSBC Bank Brasil SA – Banco Múltiplo; HSBC Bank Australia Limited; HSBC Bank Argentina SA; HSBC Saudi Arabia Limited; The Hongkong and Shanghai Banking Corporation Limited, New Zealand Branch
Issuer of report HSBC Securities and Capital Markets (India) Private Limited Registered Office 52/60 Mahatma Gandhi Road
Fort, Mumbai 400 001, India
Telephone: +91 22 2267 4921 Fax: +91 22 2263 1983
Website: www.research.hsbc.com
This document has been issued by HSBC Securities and Capital Markets (India) Private Limited ("HSBC") for the information of its customers only. HSBC Securities and Capital Markets (India) Private Limited is regulated by the Securities and Exchange Board of India. If it is received by a customer of an affiliate of HSBC, its provision to the recipient is subject to the terms of business in place between the recipient and such affiliate. This document is not and should not be construed as an offer to sell or the solicitation of an offer to purchase or subscribe for any investment. HSBC has based this document on information obtained from sources it believes to be reliable but which it has not independently verified; HSBC makes no guarantee, representation or warranty and accepts no responsibility or liability as to its accuracy or completeness. Expressions of opinion are those of the Research Division of HSBC only and are subject to change without notice. HSBC and its affiliates and/or their officers, directors and employees may have positions in any securities mentioned in this document (or in any related investment) and may from time to time add to or dispose of any such securities (or investment). HSBC and its affiliates may act as market maker or have assumed an underwriting commitment in the securities of companies discussed in this document (or in related investments), may sell them to or buy them from customers on a principal basis and may also perform or seek to perform investment banking or underwriting services for or relating to those companies and may also be represented in the supervisory board or any other committee of those companies. The information and opinions contained within the research reports are based upon publicly available information and rates of taxation applicable at the time of publication which are subject to change from time to time. Past performance is not necessarily a guide to future performance. The value of any investment or income may go down as well as up and you may not get back the full amount invested. Where an investment is denominated in a currency other than the local currency of the recipient of the research report, changes in the exchange rates may have an adverse effect on the value, price or income of that investment. In case of investments for which there is no recognised market it may be difficult for investors to sell their investments or to obtain reliable information about its value or the extent of the risk to which it is exposed. HSBC Securities (USA) Inc. accepts responsibility for the content of this research report prepared by its non-US foreign affiliate. All U.S. persons receiving and/or accessing this report and wishing to effect transactions in any security discussed herein should do so with HSBC Securities (USA) Inc. in the United States and not with its non-US foreign affiliate, the issuer of this report. In the UK this report may only be distributed to persons of a kind described in Article 19(5) of the Financial Services and Markets Act 2000 (Financial Promotion) Order 2001. The protections afforded by the UK regulatory regime are available only to those dealing with a representative of HSBC Bank plc in the UK. In Singapore, this publication is distributed by The Hongkong and Shanghai Banking Corporation Limited, Singapore Branch for the general information of institutional investors or other persons specified in Sections 274 and 304 of the Securities and Futures Act (Chapter 289) (“SFA”) and accredited investors and other persons in accordance with the conditions specified in Sections 275 and 305 of the SFA. This publication is not a prospectus as defined in the SFA. It may not be further distributed in whole or in part for any purpose. The Hongkong and Shanghai Banking Corporation Limited Singapore Branch is regulated by the Monetary Authority of Singapore. Recipients in Singapore should contact a "Hongkong and Shanghai Banking Corporation Limited, Singapore Branch" representative in respect of any matters arising from, or in connection with this report. In Australia, this publication has been distributed by The Hongkong and Shanghai Banking Corporation Limited (ABN 65 117 925 970, AFSL 301737) for the general information of its “wholesale” customers (as defined in the Corporations Act 2001). Where distributed to retail customers, this research is distributed by HSBC Bank Australia Limited (AFSL No. 232595). These respective entities make no representations that the products or services mentioned in this document are available to persons in Australia or are necessarily suitable for any particular person or appropriate in accordance with local law. No consideration has been given to the particular investment objectives, financial situation or particular needs of any recipient. This publication is distributed in New Zealand by The Hongkong and Shanghai Banking Corporation Limited, New Zealand Branch. In Japan, this publication has been distributed by HSBC Securities (Japan) Limited. In Hong Kong, this document has been distributed by The Hongkong and Shanghai Banking Corporation Limited in the conduct of its Hong Kong regulated business for the information of its institutional and professional customers; it is not intended for and should not be distributed to retail customers in Hong Kong. The Hongkong and Shanghai Banking Corporation Limited makes no representations that the products or services mentioned in this document are available to persons in Hong Kong or are necessarily suitable for any particular person or appropriate in accordance with local law. All inquiries by such recipients must be directed to The Hongkong and Shanghai Banking Corporation Limited. In Korea, this publication is distributed by The Hongkong and Shanghai Banking Corporation Limited, Seoul Securities Branch ("HBAP SLS") for the general information of professional investors specified in Article 9 of the Financial Investment Services and Capital Markets Act (“FSCMA”). This publication is not a prospectus as defined in the FSCMA. It may not be further distributed in whole or in part for any purpose. HBAP SLS is regulated by the Financial Services Commission and the Financial Supervisory Service of Korea. © Copyright. HSBC Securities and Capital Markets (India) Private Limited 2012, ALL RIGHTS RESERVED. No part of this publication may be reproduced, stored in a retrieval system, or transmitted, on any form or by any means, electronic, mechanical, photocopying, recording, or otherwise, without the prior written permission of HSBC Securities and Capital Markets (India) Private Limited. MICA (P) 208/04/2011 and MICA (P) 040/04/2011
[317692]
abc
Global
Garry Evans Global Head of Equity Strategy +852 2996 6916 [email protected]
Daniel Grosvenor +852 2996 6592 [email protected]
EU and US
Peter Sullivan Head of Equity Strategy, EU and US +44 20 7991 6702 [email protected]
Europe
Robert Parkes +44 20 7991 6716 [email protected]
CEEMEA
John Lomax +44 20 7992 3712 [email protected]
Wietse Nijenhuis +44 20 7992 3680 [email protected]
Asia
Herald van der Linde Deputy Head of Research and Head of Equity Strategy, Asia-Pacific +852 2996 6575 [email protected]
Jitendra Sriram +91 22 2268 1271 [email protected]
Steven Sun +852 2822 4298 [email protected]
Roger Xie +852 2822 4297 [email protected]
Devendra Joshi Associate, Bangalore
Taiwan
Jenny Lai Head of Taiwan Research +886 2 8725 6020 [email protected]
South East Asia
Neel Sinha Head of Equity Research, South East Asia +65 6239 0658 [email protected]
Global Equity Strategy Research Team