hsbc nutshell-a global guide to equity · pdf filethe nutshell guides have been compiled by...
TRANSCRIPT
A product of the Global Equity Research Team
This guide will help you gain an overall understanding of the structure of global equity markets,
earnings trends, and funds flows
We provide a snapshot for each major sector including information on performance and
valuations
HSBC NutshellA global guide to equity sectors
Global Equity Research
Multi-sector
July 2012
Chris Georgs
Global Head of Equity Research
HSBC Bank plc
+44 20 7991 6781
Disclosures and Disclaimer This report must be read with the disclosures and analyst
certifications in the Disclosure appendix, and with the Disclaimer, which forms part of it
Global
1
Global Equity Research Multi-sector July 2012
abc
Dear Client,
We are pleased to present HSBC Nutshell: A guide to equity sectors and countries, our inaugural suite of
multi-regional and global primers. The Nutshell guides have been compiled by our global equity research
team to help new and seasoned professionals gain a quick, but thorough, understanding of markets in
Latin America, EMEA, and Asia. For investors looking to invest globally and especially in emerging markets,
the guides provide a broad, top-down perspective on these markets and the sectors related to them.
We have assumed that our readers will have some basic working knowledge of the world economy,
equity markets, financial terminology and ratios, although the Nutshell guides are designed to be used by
anyone wanting to gain a deeper understanding of countries or industries with which they are not familiar.
The Nutshell guides are designed to provide consistency and comparability. For each sector, our analysts
explain how they value companies, and assess the key drivers affecting the sector, as well as the macro
issues and trends impacting the sector on a regional and global basis. We then build on the sector
framework to include regional macro overviews and country sections that provide a broader perspective
on the sectors and geographies that we cover, addressing topics such as market composition, liquidity,
fund flows, and political and regulatory structures.
We look forward to making our analysts available to you on a one-on-one or group basis to help you
build on your country, sector, industry or stock knowledge – from the nuts and bolts of the industry
dynamics through to individual company valuation and recommendations. The front page of each
industry or country section within these guides includes the names and contact details of our sector
analysts and, where relevant, their specialist salesperson/people. Please get in touch with your HSBC
representative to organise this, contact us directly, or email [email protected].
We hope you find these guides useful, and we look forward to continuing to work with you in the future.
Regards,
Chris Georgs – Global Head of Equity Research
Patrick Boucher – Head of Product Management, Equity Research
David May – Head of Equity Research, Asia Pacific

2
Global Equity Research Multi-sector July 2012
abc
3
Global Equity Research Multi-sector July 2012
abc
Global summary 5
Industry group snapshots 19 MSCI ACWI Automobiles & components 20
MSCI ACWI Banks 21
MSCI ACWI Capital goods 22
MSCI ACWI Commercial & professional services 23
MSCI ACWI Consumer durables & apparel 24
MSCI ACWI Consumer services 25
MSCI ACWI Diversified financials 26
MSCI ACWI Energy 27
MSCI ACWI Food & staples retailing 28
MSCI ACWI Food, beverages & tobacco 29
MSCI ACWI Healthcare equipment & services 30
MSCI ACWI Household & personal products 31
MSCI ACWI Insurance 32
MSCI ACWI Materials 33
MSCI ACWI Media 34
MSCI ACWI Pharmaceuticals, biotechnology &
life sciences 35
MSCI ACWI Real estate 36
MSCI ACWI Retailing 37
MSCI ACWI Semiconductors & semiconductor
equipment 38
MSCI ACWI Software & services 39
MSCI ACWI Technology hardware & equipment 40
MSCI ACWI Telecommunication services 41
MSCI ACWI Transportation 42
MSCI ACWI Utilities 43
Disclosure appendix 46
Disclaimer 48
Contents

4
Global Equity Research Multi-sector July 2012
abc
5
Global Equity Research Multi-sector July 2012
abc
Global summary
Glo
bal E
qu
ity Research
M
ulti-sector Ju
ly 2012
6
ab
c
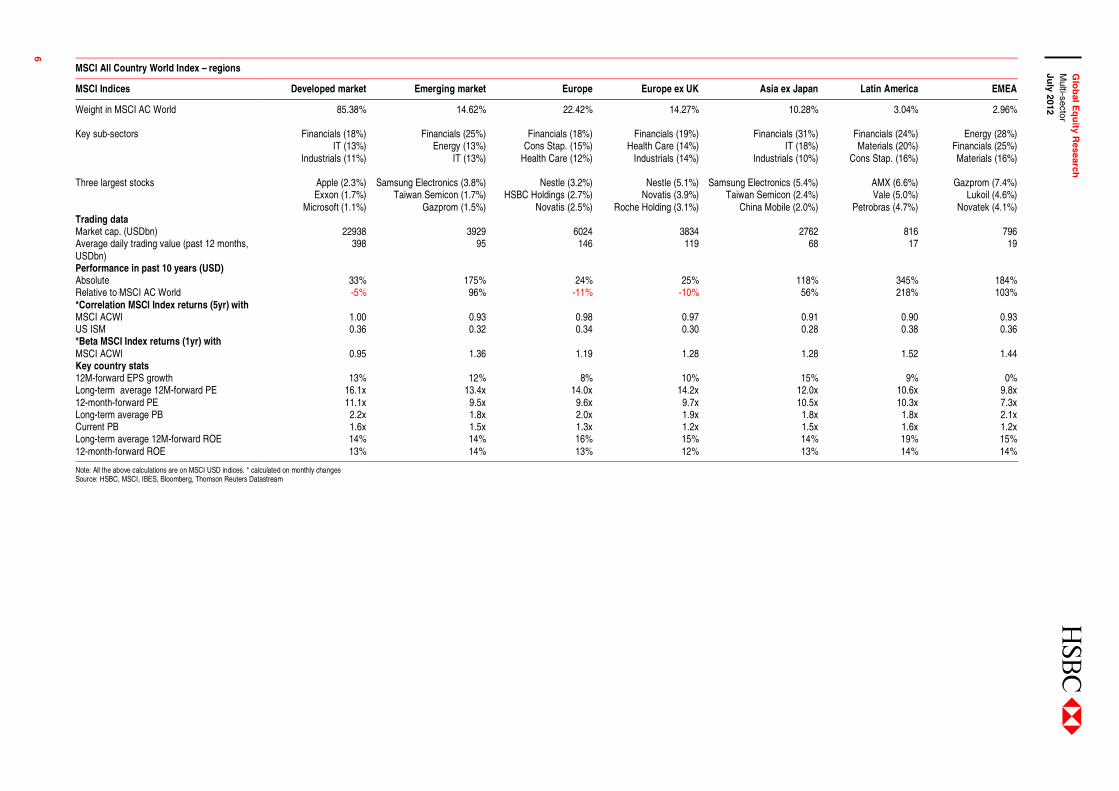
MSCI All Country World Index – regions
MSCI Indices Developed market Emerging market Europe Europe ex UK Asia ex Japan Latin America EMEA
Weight in MSCI AC World 85.38% 14.62% 22.42% 14.27% 10.28% 3.04% 2.96% Key sub-sectors Financials (18%) Financials (25%) Financials (18%) Financials (19%) Financials (31%) Financials (24%) Energy (28%) IT (13%) Energy (13%) Cons Stap. (15%) Health Care (14%) IT (18%) Materials (20%) Financials (25%) Industrials (11%) IT (13%) Health Care (12%) Industrials (14%) Industrials (10%) Cons Stap. (16%) Materials (16%) Three largest stocks Apple (2.3%) Samsung Electronics (3.8%) Nestle (3.2%) Nestle (5.1%) Samsung Electronics (5.4%) AMX (6.6%) Gazprom (7.4%) Exxon (1.7%) Taiwan Semicon (1.7%) HSBC Holdings (2.7%) Novatis (3.9%) Taiwan Semicon (2.4%) Vale (5.0%) Lukoil (4.6%) Microsoft (1.1%) Gazprom (1.5%) Novatis (2.5%) Roche Holding (3.1%) China Mobile (2.0%) Petrobras (4.7%) Novatek (4.1%) Trading data Market cap. (USDbn) 22938 3929 6024 3834 2762 816 796 Average daily trading value (past 12 months, USDbn)
398 95 146 119 68 17 19
Performance in past 10 years (USD) Absolute 33% 175% 24% 25% 118% 345% 184% Relative to MSCI AC World -5% 96% -11% -10% 56% 218% 103% *Correlation MSCI Index returns (5yr) with MSCI ACWI 1.00 0.93 0.98 0.97 0.91 0.90 0.93 US ISM 0.36 0.32 0.34 0.30 0.28 0.38 0.36 *Beta MSCI Index returns (1yr) with MSCI ACWI 0.95 1.36 1.19 1.28 1.28 1.52 1.44 Key country stats 12M-forward EPS growth 13% 12% 8% 10% 15% 9% 0% Long-term average 12M-forward PE 16.1x 13.4x 14.0x 14.2x 12.0x 10.6x 9.8x 12-month-forward PE 11.1x 9.5x 9.6x 9.7x 10.5x 10.3x 7.3x Long-term average PB 2.2x 1.8x 2.0x 1.9x 1.8x 1.8x 2.1x Current PB 1.6x 1.5x 1.3x 1.2x 1.5x 1.6x 1.2x Long-term average 12M-forward ROE 14% 14% 16% 15% 14% 19% 15% 12-month-forward ROE 13% 14% 13% 12% 13% 14% 14%
Note: All the above calculations are on MSCI USD indices. * calculated on monthly changes Source: HSBC, MSCI, IBES, Bloomberg, Thomson Reuters Datastream
Glo
bal E
qu
ity Research
M
ulti-sector Ju
ly 2012
7
ab
c
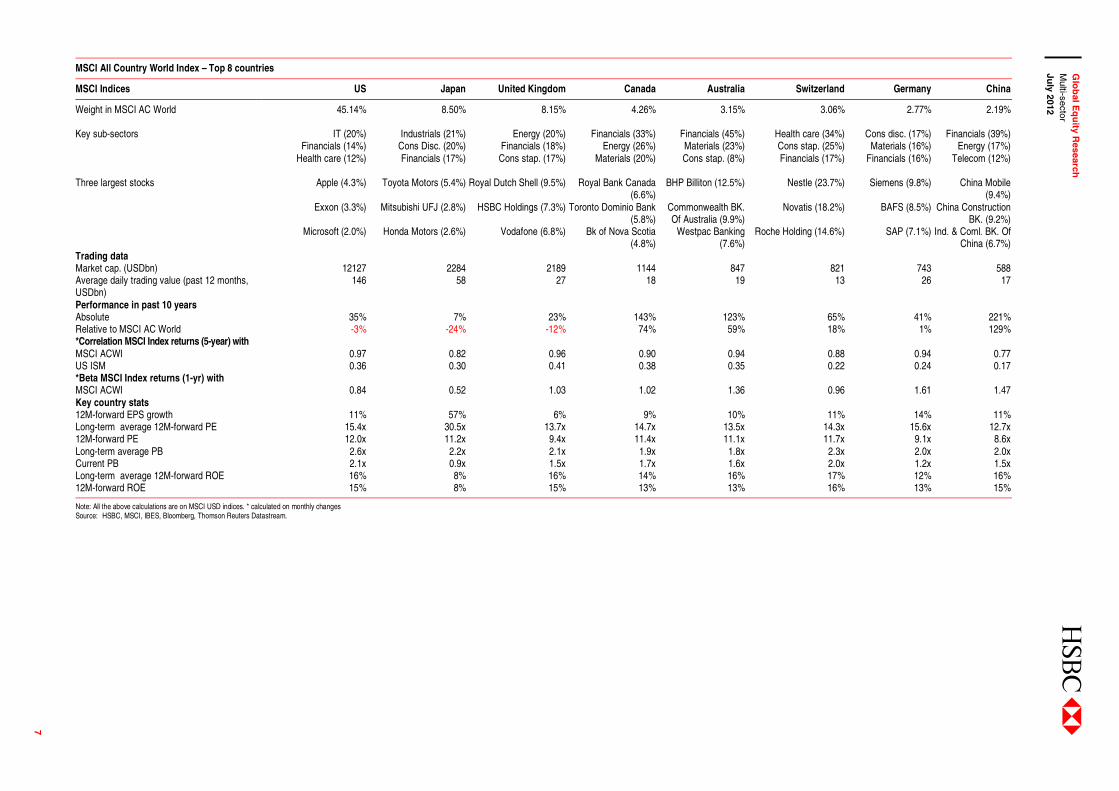
MSCI All Country World Index – Top 8 countries
MSCI Indices US Japan United Kingdom Canada Australia Switzerland Germany China
Weight in MSCI AC World 45.14% 8.50% 8.15% 4.26% 3.15% 3.06% 2.77% 2.19% Key sub-sectors IT (20%) Industrials (21%) Energy (20%) Financials (33%) Financials (45%) Health care (34%) Cons disc. (17%) Financials (39%) Financials (14%) Cons Disc. (20%) Financials (18%) Energy (26%) Materials (23%) Cons stap. (25%) Materials (16%) Energy (17%) Health care (12%) Financials (17%) Cons stap. (17%) Materials (20%) Cons stap. (8%) Financials (17%) Financials (16%) Telecom (12%) Three largest stocks Apple (4.3%) Toyota Motors (5.4%) Royal Dutch Shell (9.5%) Royal Bank Canada
(6.6%)BHP Billiton (12.5%) Nestle (23.7%) Siemens (9.8%) China Mobile
(9.4%) Exxon (3.3%) Mitsubishi UFJ (2.8%) HSBC Holdings (7.3%) Toronto Dominio Bank
(5.8%)Commonwealth BK. Of Australia (9.9%)
Novatis (18.2%) BAFS (8.5%) China Construction BK. (9.2%)
Microsoft (2.0%) Honda Motors (2.6%) Vodafone (6.8%) Bk of Nova Scotia (4.8%)
Westpac Banking (7.6%)
Roche Holding (14.6%) SAP (7.1%) Ind. & Coml. BK. Of China (6.7%)
Trading data Market cap. (USDbn) 12127 2284 2189 1144 847 821 743 588 Average daily trading value (past 12 months, USDbn)
146 58 27 18 19 13 26 17
Performance in past 10 years Absolute 35% 7% 23% 143% 123% 65% 41% 221% Relative to MSCI AC World -3% -24% -12% 74% 59% 18% 1% 129% *Correlation MSCI Index returns (5-year) with MSCI ACWI 0.97 0.82 0.96 0.90 0.94 0.88 0.94 0.77 US ISM 0.36 0.30 0.41 0.38 0.35 0.22 0.24 0.17 *Beta MSCI Index returns (1-yr) with MSCI ACWI 0.84 0.52 1.03 1.02 1.36 0.96 1.61 1.47 Key country stats 12M-forward EPS growth 11% 57% 6% 9% 10% 11% 14% 11% Long-term average 12M-forward PE 15.4x 30.5x 13.7x 14.7x 13.5x 14.3x 15.6x 12.7x 12M-forward PE 12.0x 11.2x 9.4x 11.4x 11.1x 11.7x 9.1x 8.6x Long-term average PB 2.6x 2.2x 2.1x 1.9x 1.8x 2.3x 2.0x 2.0x Current PB 2.1x 0.9x 1.5x 1.7x 1.6x 2.0x 1.2x 1.5x Long-term average 12M-forward ROE 16% 8% 16% 14% 16% 17% 12% 16% 12M-forward ROE 15% 8% 15% 13% 13% 16% 13% 15%
Note: All the above calculations are on MSCI USD indices. * calculated on monthly changes Source: HSBC, MSCI, IBES, Bloomberg, Thomson Reuters Datastream.
Glo
bal E
qu
ity Research
M
ulti-sector Ju
ly 2012
8
ab
c
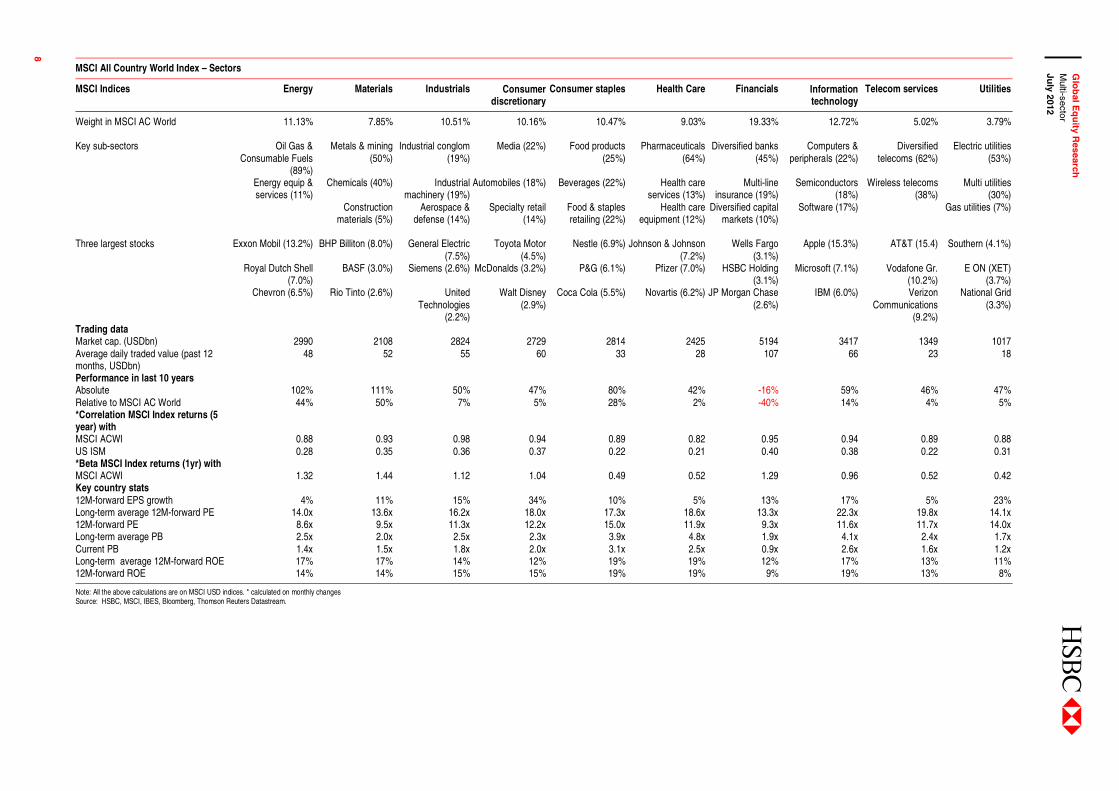
MSCI All Country World Index – Sectors
MSCI Indices Energy Materials Industrials Consumer discretionary
Consumer staples Health Care Financials Information technology
Telecom services Utilities
Weight in MSCI AC World 11.13% 7.85% 10.51% 10.16% 10.47% 9.03% 19.33% 12.72% 5.02% 3.79% Key sub-sectors Oil Gas &
Consumable Fuels (89%)
Metals & mining (50%)
Industrial conglom (19%)
Media (22%) Food products (25%)
Pharmaceuticals (64%)
Diversified banks (45%)
Computers & peripherals (22%)
Diversified telecoms (62%)
Electric utilities (53%)
Energy equip & services (11%)
Chemicals (40%) Industrial machinery (19%)
Automobiles (18%) Beverages (22%) Health care services (13%)
Multi-line insurance (19%)
Semiconductors (18%)
Wireless telecoms (38%)
Multi utilities (30%)
Construction materials (5%)
Aerospace & defense (14%)
Specialty retail (14%)
Food & staples retailing (22%)
Health care equipment (12%)
Diversified capital markets (10%)
Software (17%) Gas utilities (7%)
Three largest stocks Exxon Mobil (13.2%) BHP Billiton (8.0%) General Electric
(7.5%)Toyota Motor
(4.5%)Nestle (6.9%) Johnson & Johnson
(7.2%)Wells Fargo
(3.1%)Apple (15.3%) AT&T (15.4) Southern (4.1%)
Royal Dutch Shell (7.0%)
BASF (3.0%) Siemens (2.6%) McDonalds (3.2%) P&G (6.1%) Pfizer (7.0%) HSBC Holding (3.1%)
Microsoft (7.1%) Vodafone Gr. (10.2%)
E ON (XET) (3.7%)
Chevron (6.5%) Rio Tinto (2.6%) United Technologies
(2.2%)
Walt Disney (2.9%)
Coca Cola (5.5%) Novartis (6.2%) JP Morgan Chase (2.6%)
IBM (6.0%) Verizon Communications
(9.2%)
National Grid (3.3%)
Trading data Market cap. (USDbn) 2990 2108 2824 2729 2814 2425 5194 3417 1349 1017 Average daily traded value (past 12 months, USDbn)
48 52 55 60 33 28 107 66 23 18
Performance in last 10 years Absolute 102% 111% 50% 47% 80% 42% -16% 59% 46% 47% Relative to MSCI AC World 44% 50% 7% 5% 28% 2% -40% 14% 4% 5% *Correlation MSCI Index returns (5 year) with
MSCI ACWI 0.88 0.93 0.98 0.94 0.89 0.82 0.95 0.94 0.89 0.88 US ISM 0.28 0.35 0.36 0.37 0.22 0.21 0.40 0.38 0.22 0.31 *Beta MSCI Index returns (1yr) with MSCI ACWI 1.32 1.44 1.12 1.04 0.49 0.52 1.29 0.96 0.52 0.42 Key country stats 12M-forward EPS growth 4% 11% 15% 34% 10% 5% 13% 17% 5% 23% Long-term average 12M-forward PE 14.0x 13.6x 16.2x 18.0x 17.3x 18.6x 13.3x 22.3x 19.8x 14.1x 12M-forward PE 8.6x 9.5x 11.3x 12.2x 15.0x 11.9x 9.3x 11.6x 11.7x 14.0x Long-term average PB 2.5x 2.0x 2.5x 2.3x 3.9x 4.8x 1.9x 4.1x 2.4x 1.7x Current PB 1.4x 1.5x 1.8x 2.0x 3.1x 2.5x 0.9x 2.6x 1.6x 1.2x Long-term average 12M-forward ROE 17% 17% 14% 12% 19% 19% 12% 17% 13% 11% 12M-forward ROE 14% 14% 15% 15% 19% 19% 9% 19% 13% 8%
Note: All the above calculations are on MSCI USD indices. * calculated on monthly changes Source: HSBC, MSCI, IBES, Bloomberg, Thomson Reuters Datastream.
9
Global Equity Research Multi-sector July 2012
abc
Introduction This section analyses the characteristics of the global equity market, its composition, recent history and
key drivers, and describes some of the tools that HSBC’s strategy team uses to call turns in the market
and to make allocation decisions between different countries and sectors. We focus on the overall world
market (using the MSCI All Country World Index, or ACWI, as our benchmark) and provide detailed
information on the regional breakdown (developed versus emerging markets, Europe, Asia ex Japan, for
example) as well as the eight largest countries (US, Japan, UK, Canada, Australia, Switzerland, Germany
and China). Readers interested in more details on smaller country markets should refer to the overviews
in the companion Nutshells on Europe, Asia and Latin America, where the information is presented in a
similar format to here.
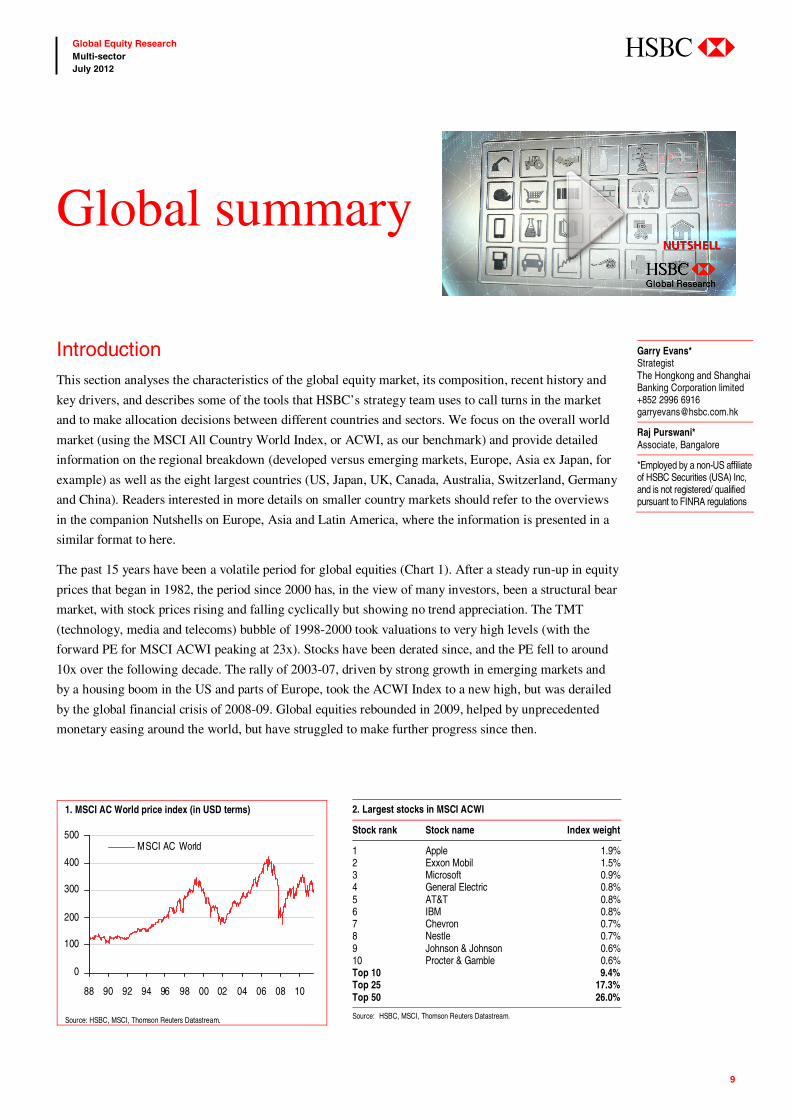
The past 15 years have been a volatile period for global equities (Chart 1). After a steady run-up in equity
prices that began in 1982, the period since 2000 has, in the view of many investors, been a structural bear
market, with stock prices rising and falling cyclically but showing no trend appreciation. The TMT
(technology, media and telecoms) bubble of 1998-2000 took valuations to very high levels (with the
forward PE for MSCI ACWI peaking at 23x). Stocks have been derated since, and the PE fell to around
10x over the following decade. The rally of 2003-07, driven by strong growth in emerging markets and
by a housing boom in the US and parts of Europe, took the ACWI Index to a new high, but was derailed
by the global financial crisis of 2008-09. Global equities rebounded in 2009, helped by unprecedented
monetary easing around the world, but have struggled to make further progress since then.
Global summary
Garry Evans* Strategist The Hongkong and Shanghai Banking Corporation limited +852 2996 6916 [email protected]
Raj Purswani* Associate, Bangalore
*Employed by a non-US affiliate of HSBC Securities (USA) Inc, and is not registered/ qualified pursuant to FINRA regulations
1. MSCI AC World price index (in USD terms)
0
100
200
300
400
500
88 90 92 94 96 98 00 02 04 06 08 10
MSCI AC World
Source: HSBC, MSCI, Thomson Reuters Datastream.
2. Largest stocks in MSCI ACWI
Stock rank Stock name Index weight
1 Apple 1.9% 2 Exxon Mobil 1.5% 3 Microsoft 0.9% 4 General Electric 0.8% 5 AT&T 0.8% 6 IBM 0.8% 7 Chevron 0.7% 8 Nestle 0.7% 9 Johnson & Johnson 0.6% 10 Procter & Gamble 0.6% Top 10 9.4% Top 25 17.3% Top 50 26.0%
Source: HSBC, MSCI, Thomson Reuters Datastream.
10
Global Equity Research Multi-sector July 2012
abc
Market structure The US remains by far the largest stock market in the world, with a 45% weight in the ACWI Index. It is
followed by Europe (22%) and Japan (9%). Eurozone markets, individually, are not that important: the
largest, Germany, comprises less than 3% of world market capitalisation. The weight of emerging markets
has increased substantially over the past decade, to 14.6% from 4.8% in 2000. Within Global Emerging
Markets (GEMS), China is the largest country, with 18.0%, followed by Korea (15.5%), Brazil (13.1%)
and Taiwan (11.2%). Asian markets comprise 60.2% of GEMS.
The US is very over-represented in the ACWI Index relative to the size of its economy, which makes up
only 24% of global GDP (in purchasing power parity, PPP, terms). Europe, at 29% of global GDP (larger
than the US), is somewhat under-represented, mainly because of its valuation discount to the US (the
forward price/earnings ratio for Europe is 9.6x versus 12.0x for the US). Emerging markets, however,
account for 39% of the world economy but less than 15% of the index. This is mainly because the free float
of many emerging markets (on which the MSCI indexes are calculated) is small – for example, 54% in
Brazil and 33% in India (compared with 95% for the US and 76% for Japan). Moreover, MSCI China does
not include the Chinese domestic A-share market, which has total market cap of USD3trn (close to Japan’s
market cap of USD3.3trn). As more emerging market companies list in the coming years, foreign access to
domestic markets such as China’s increases and governments and founders float more shares, the weight of
EM is likely to rise further.
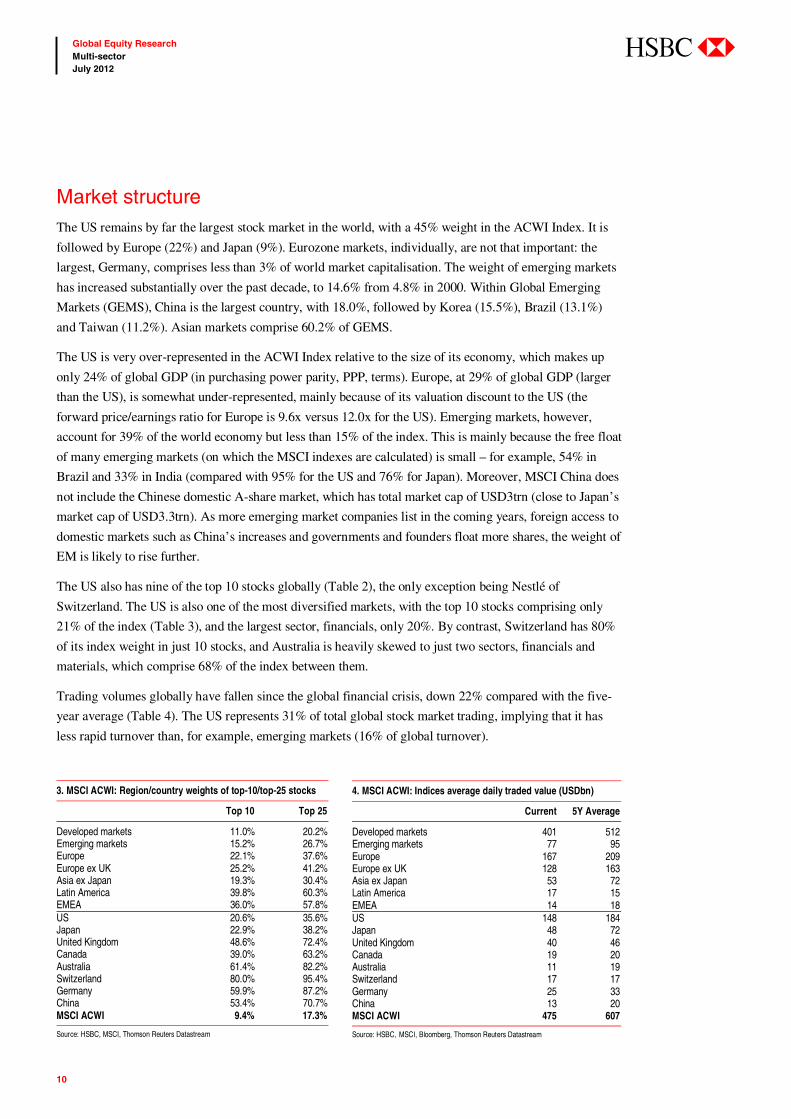
The US also has nine of the top 10 stocks globally (Table 2), the only exception being Nestlé of
Switzerland. The US is also one of the most diversified markets, with the top 10 stocks comprising only
21% of the index (Table 3), and the largest sector, financials, only 20%. By contrast, Switzerland has 80%
of its index weight in just 10 stocks, and Australia is heavily skewed to just two sectors, financials and
materials, which comprise 68% of the index between them.
Trading volumes globally have fallen since the global financial crisis, down 22% compared with the five-
year average (Table 4). The US represents 31% of total global stock market trading, implying that it has
less rapid turnover than, for example, emerging markets (16% of global turnover).
3. MSCI ACWI: Region/country weights of top-10/top-25 stocks
Top 10 Top 25
Developed markets 11.0% 20.2%Emerging markets 15.2% 26.7%Europe 22.1% 37.6%Europe ex UK 25.2% 41.2%Asia ex Japan 19.3% 30.4%Latin America 39.8% 60.3%EMEA 36.0% 57.8%US 20.6% 35.6%Japan 22.9% 38.2%United Kingdom 48.6% 72.4%Canada 39.0% 63.2%Australia 61.4% 82.2%Switzerland 80.0% 95.4%Germany 59.9% 87.2%China 53.4% 70.7%MSCI ACWI 9.4% 17.3%
Source: HSBC, MSCI, Thomson Reuters Datastream
4. MSCI ACWI: Indices average daily traded value (USDbn)
Current 5Y Average
Developed markets 401 512 Emerging markets 77 95 Europe 167 209 Europe ex UK 128 163 Asia ex Japan 53 72 Latin America 17 15 EMEA 14 18 US 148 184 Japan 48 72 United Kingdom 40 46 Canada 19 20 Australia 11 19 Switzerland 17 17 Germany 25 33 China 13 20 MSCI ACWI 475 607
Source: HSBC, MSCI, Bloomberg, Thomson Reuters Datastream
11
Global Equity Research Multi-sector July 2012
abc
5. Earnings and index volatility
MSCI Indices ______ Trailing earnings volatility*_______ ______ Market returns volatility* _______
10 years 5 years 10 years 5 years
Developed markets 75% 64% 17% 21% Emerging markets 72% 47% 25% 30% Europe 121% 99% 21% 26% Europe ex UK 145% 118% 23% 27% Asia ex Japan 31% 24% 24% 29% Latin America 322% 152% 29% 32% EMEA 32% 20% 27% 32% USA 56% 54% 16% 19% Japan 252% 269% 17% 18% United Kingdom 86% 79% 19% 23% Canada 97% 51% 22% 27% Australia 52% 39% 24% 31% Switzerland 249% 252% 17% 21% Germany 176% 147% 27% 31% China 5% 3% 29% 34% MSCI ACWI 19% 16% 18% 22%
Source: HSBC, MSCI, Thomson Reuters Datastream; Note: *calculated as the annualised standard deviation of monthly changes
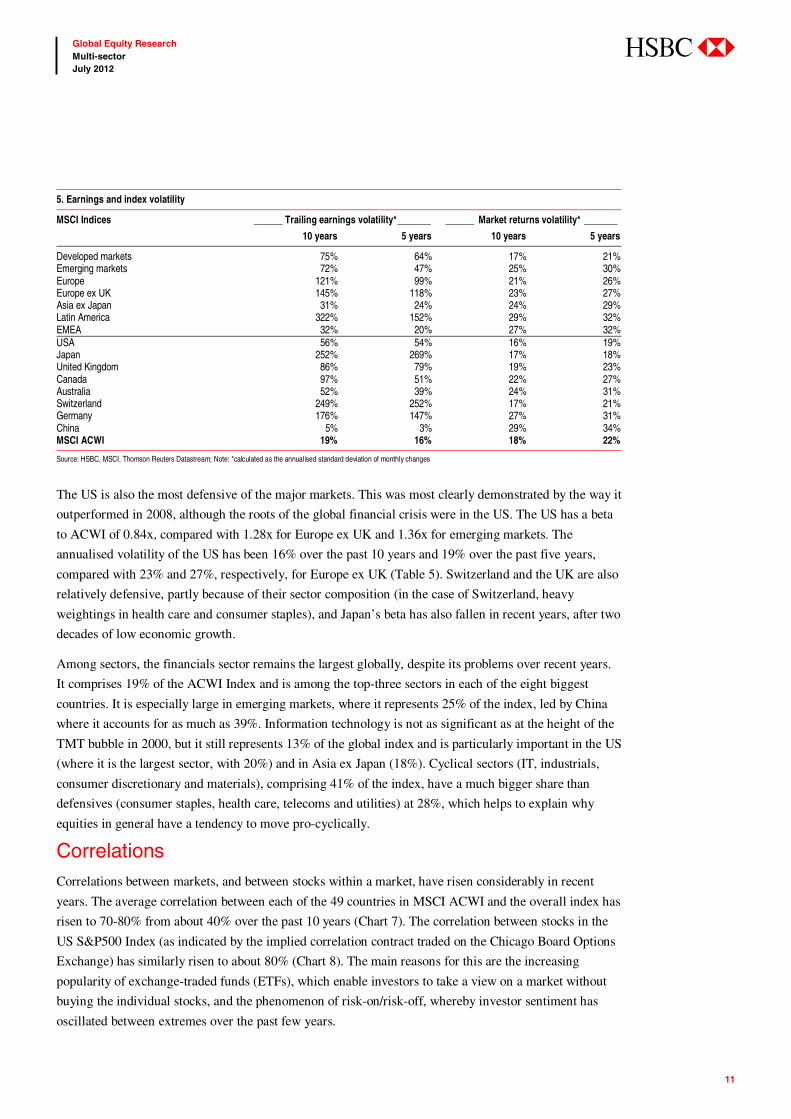
The US is also the most defensive of the major markets. This was most clearly demonstrated by the way it
outperformed in 2008, although the roots of the global financial crisis were in the US. The US has a beta
to ACWI of 0.84x, compared with 1.28x for Europe ex UK and 1.36x for emerging markets. The
annualised volatility of the US has been 16% over the past 10 years and 19% over the past five years,
compared with 23% and 27%, respectively, for Europe ex UK (Table 5). Switzerland and the UK are also
relatively defensive, partly because of their sector composition (in the case of Switzerland, heavy
weightings in health care and consumer staples), and Japan’s beta has also fallen in recent years, after two
decades of low economic growth.
Among sectors, the financials sector remains the largest globally, despite its problems over recent years.
It comprises 19% of the ACWI Index and is among the top-three sectors in each of the eight biggest
countries. It is especially large in emerging markets, where it represents 25% of the index, led by China
where it accounts for as much as 39%. Information technology is not as significant as at the height of the
TMT bubble in 2000, but it still represents 13% of the global index and is particularly important in the US
(where it is the largest sector, with 20%) and in Asia ex Japan (18%). Cyclical sectors (IT, industrials,
consumer discretionary and materials), comprising 41% of the index, have a much bigger share than
defensives (consumer staples, health care, telecoms and utilities) at 28%, which helps to explain why
equities in general have a tendency to move pro-cyclically.
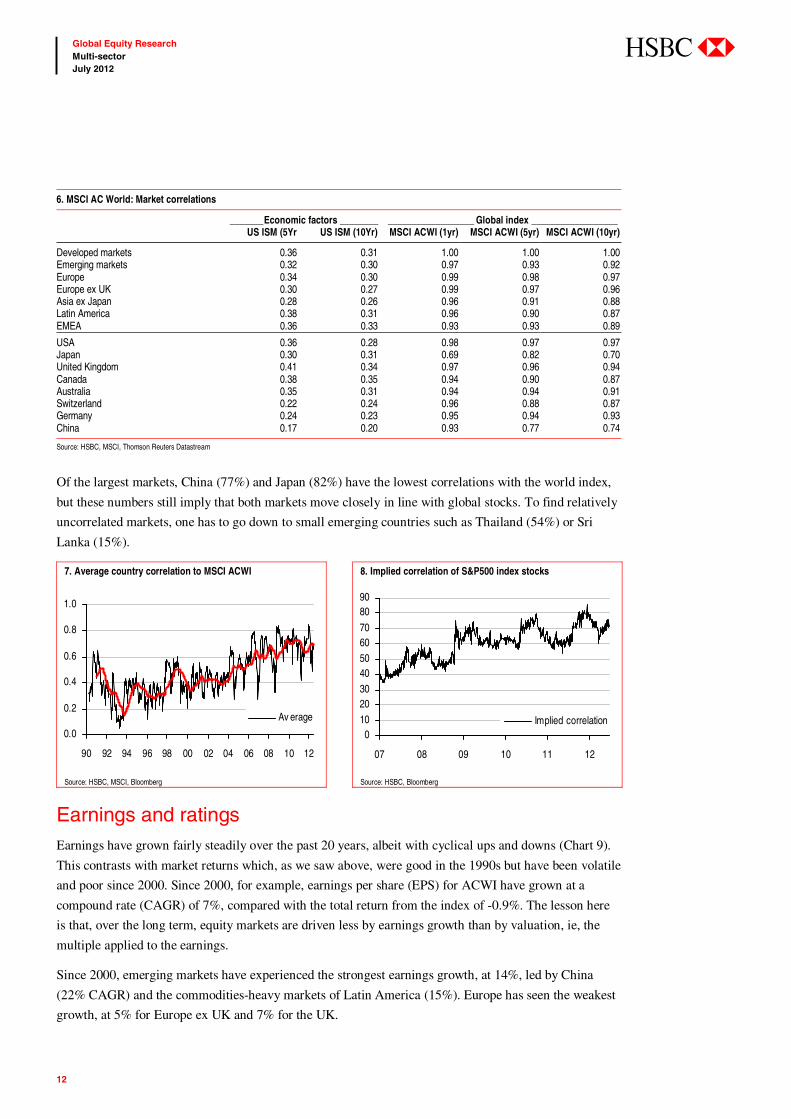
Correlations Correlations between markets, and between stocks within a market, have risen considerably in recent
years. The average correlation between each of the 49 countries in MSCI ACWI and the overall index has
risen to 70-80% from about 40% over the past 10 years (Chart 7). The correlation between stocks in the
US S&P500 Index (as indicated by the implied correlation contract traded on the Chicago Board Options
Exchange) has similarly risen to about 80% (Chart 8). The main reasons for this are the increasing
popularity of exchange-traded funds (ETFs), which enable investors to take a view on a market without
buying the individual stocks, and the phenomenon of risk-on/risk-off, whereby investor sentiment has
oscillated between extremes over the past few years.
12
Global Equity Research Multi-sector July 2012
abc
6. MSCI AC World: Market correlations
_______Economic factors ________ __________________ Global index __________________ US ISM (5Yr US ISM (10Yr) MSCI ACWI (1yr) MSCI ACWI (5yr) MSCI ACWI (10yr)
Developed markets 0.36 0.31 1.00 1.00 1.00 Emerging markets 0.32 0.30 0.97 0.93 0.92 Europe 0.34 0.30 0.99 0.98 0.97 Europe ex UK 0.30 0.27 0.99 0.97 0.96 Asia ex Japan 0.28 0.26 0.96 0.91 0.88 Latin America 0.38 0.31 0.96 0.90 0.87 EMEA 0.36 0.33 0.93 0.93 0.89
USA 0.36 0.28 0.98 0.97 0.97 Japan 0.30 0.31 0.69 0.82 0.70 United Kingdom 0.41 0.34 0.97 0.96 0.94 Canada 0.38 0.35 0.94 0.90 0.87 Australia 0.35 0.31 0.94 0.94 0.91 Switzerland 0.22 0.24 0.96 0.88 0.87 Germany 0.24 0.23 0.95 0.94 0.93 China 0.17 0.20 0.93 0.77 0.74
Source: HSBC, MSCI, Thomson Reuters Datastream
Of the largest markets, China (77%) and Japan (82%) have the lowest correlations with the world index,
but these numbers still imply that both markets move closely in line with global stocks. To find relatively
uncorrelated markets, one has to go down to small emerging countries such as Thailand (54%) or Sri
Lanka (15%).
7. Average country correlation to MSCI ACWI 8. Implied correlation of S&P500 index stocks
0.0
0.2
0.4
0.6
0.8
1.0
90 92 94 96 98 00 02 04 06 08 10 12
Av erage
010203040506070
8090
07 08 09 10 11 12
Implied correlation
Source: HSBC, MSCI, Bloomberg Source: HSBC, Bloomberg
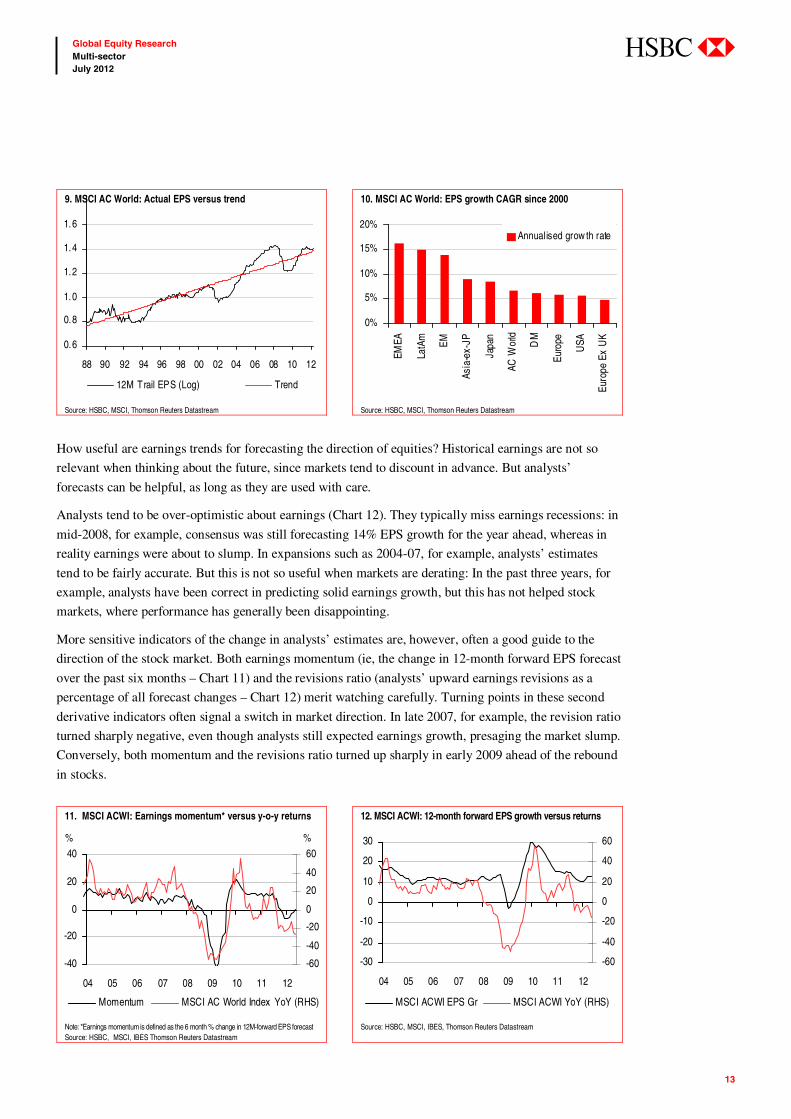
Earnings and ratings Earnings have grown fairly steadily over the past 20 years, albeit with cyclical ups and downs (Chart 9).
This contrasts with market returns which, as we saw above, were good in the 1990s but have been volatile
and poor since 2000. Since 2000, for example, earnings per share (EPS) for ACWI have grown at a
compound rate (CAGR) of 7%, compared with the total return from the index of -0.9%. The lesson here
is that, over the long term, equity markets are driven less by earnings growth than by valuation, ie, the
multiple applied to the earnings.
Since 2000, emerging markets have experienced the strongest earnings growth, at 14%, led by China
(22% CAGR) and the commodities-heavy markets of Latin America (15%). Europe has seen the weakest
growth, at 5% for Europe ex UK and 7% for the UK.
13
Global Equity Research Multi-sector July 2012
abc
How useful are earnings trends for forecasting the direction of equities? Historical earnings are not so
relevant when thinking about the future, since markets tend to discount in advance. But analysts’
forecasts can be helpful, as long as they are used with care.
Analysts tend to be over-optimistic about earnings (Chart 12). They typically miss earnings recessions: in
mid-2008, for example, consensus was still forecasting 14% EPS growth for the year ahead, whereas in
reality earnings were about to slump. In expansions such as 2004-07, for example, analysts’ estimates
tend to be fairly accurate. But this is not so useful when markets are derating: In the past three years, for
example, analysts have been correct in predicting solid earnings growth, but this has not helped stock
markets, where performance has generally been disappointing.
More sensitive indicators of the change in analysts’ estimates are, however, often a good guide to the
direction of the stock market. Both earnings momentum (ie, the change in 12-month forward EPS forecast
over the past six months – Chart 11) and the revisions ratio (analysts’ upward earnings revisions as a
percentage of all forecast changes – Chart 12) merit watching carefully. Turning points in these second
derivative indicators often signal a switch in market direction. In late 2007, for example, the revision ratio
turned sharply negative, even though analysts still expected earnings growth, presaging the market slump.
Conversely, both momentum and the revisions ratio turned up sharply in early 2009 ahead of the rebound
in stocks.
9. MSCI AC World: Actual EPS versus trend 10. MSCI AC World: EPS growth CAGR since 2000
0.6
0.8
1.0
1.2
1.4
1.6
88 90 92 94 96 98 00 02 04 06 08 10 12
12M Trail EPS (Log) Trend
0%
5%
10%
15%
20%
EMEA
LatA
m
EM
Asia
-ex-
JP
Japa
n
AC W
orld
DM
Euro
pe
USA
Euro
pe E
x U
K
Annualised grow th rate
Source: HSBC, MSCI, Thomson Reuters Datastream Source: HSBC, MSCI, Thomson Reuters Datastream
11. MSCI ACWI: Earnings momentum* versus y-o-y returns 12. MSCI ACWI: 12-month forward EPS growth versus returns
-40
-20
0
20
40
04 05 06 07 08 09 10 11 12
-60
-40
-20
0
20
40
60
Momentum MSCI AC World Index YoY (RHS)
%%
-30
-20
-10
0
10
20
30
04 05 06 07 08 09 10 11 12
-60
-40
-20
0
20
40
60
MSCI ACWI EPS Gr MSCI ACWI YoY (RHS)
Note: *Earnings momentum is defined as the 6 month % change in 12M-forward EPS forecast Source: HSBC, MSCI, IBES Thomson Reuters Datastream
Source: HSBC, MSCI, IBES, Thomson Reuters Datastream
14
Global Equity Research Multi-sector July 2012
abc
13. MSCI ACWI: EPS revisions ratio* versus y-o-y return 14. MSCI ACWI recommendation consensus score
102030405060708090
04 05 06 07 08 09 10 11 12
-60
-40
-20
0
20
40
60
ACWI earning rev isions MSCI ACWI YoY (RHS)
% %
2.02.12.22.32.42.52.62.72.8
94 95 96 97 98 99 00 01 02 03 04 05 06 07 08 09 10 11 12
Recommendation consensus score (RCS)Av erage±2SD
more bearish
more bullish
Note:- *Number of EPS estimates up as a % of total number of revisions in estimates Source: HSBC, IBES, MSCI, Thomson Reuters Datastream
Source: HSBC, IBES, MSCI, Thomson Reuters Datastream
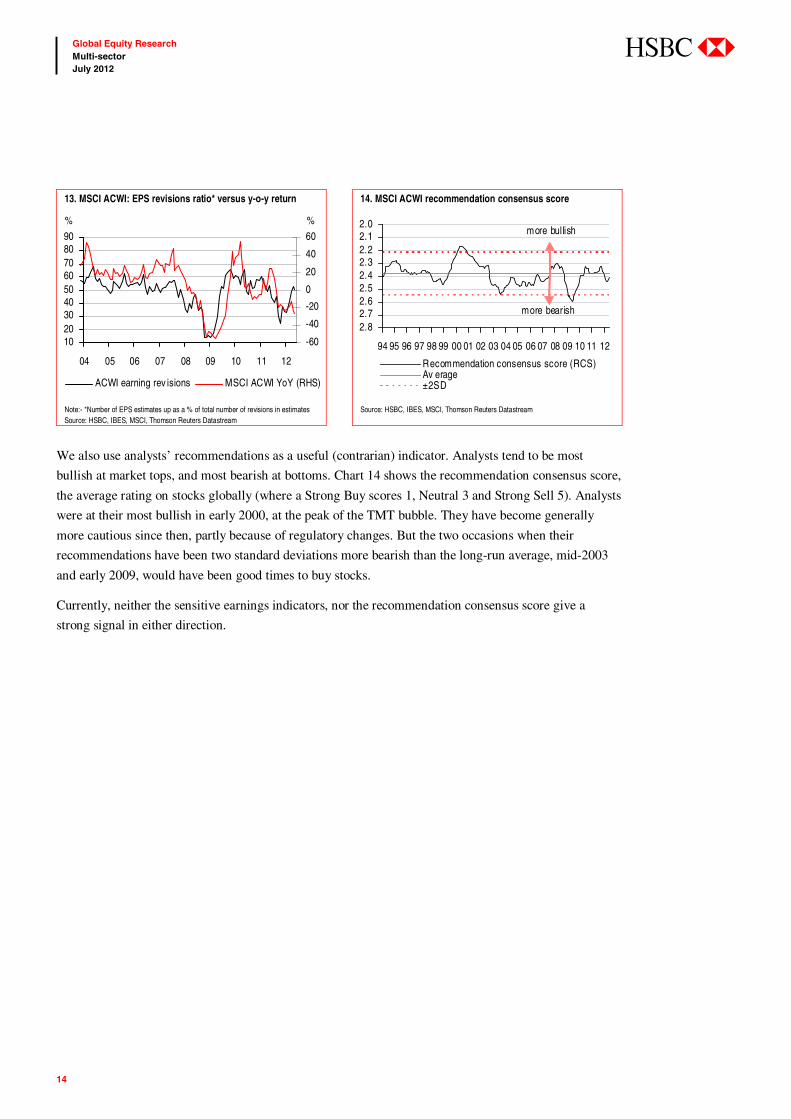
We also use analysts’ recommendations as a useful (contrarian) indicator. Analysts tend to be most
bullish at market tops, and most bearish at bottoms. Chart 14 shows the recommendation consensus score,
the average rating on stocks globally (where a Strong Buy scores 1, Neutral 3 and Strong Sell 5). Analysts
were at their most bullish in early 2000, at the peak of the TMT bubble. They have become generally
more cautious since then, partly because of regulatory changes. But the two occasions when their
recommendations have been two standard deviations more bearish than the long-run average, mid-2003
and early 2009, would have been good times to buy stocks.
Currently, neither the sensitive earnings indicators, nor the recommendation consensus score give a
strong signal in either direction.
15
Global Equity Research Multi-sector July 2012
abc
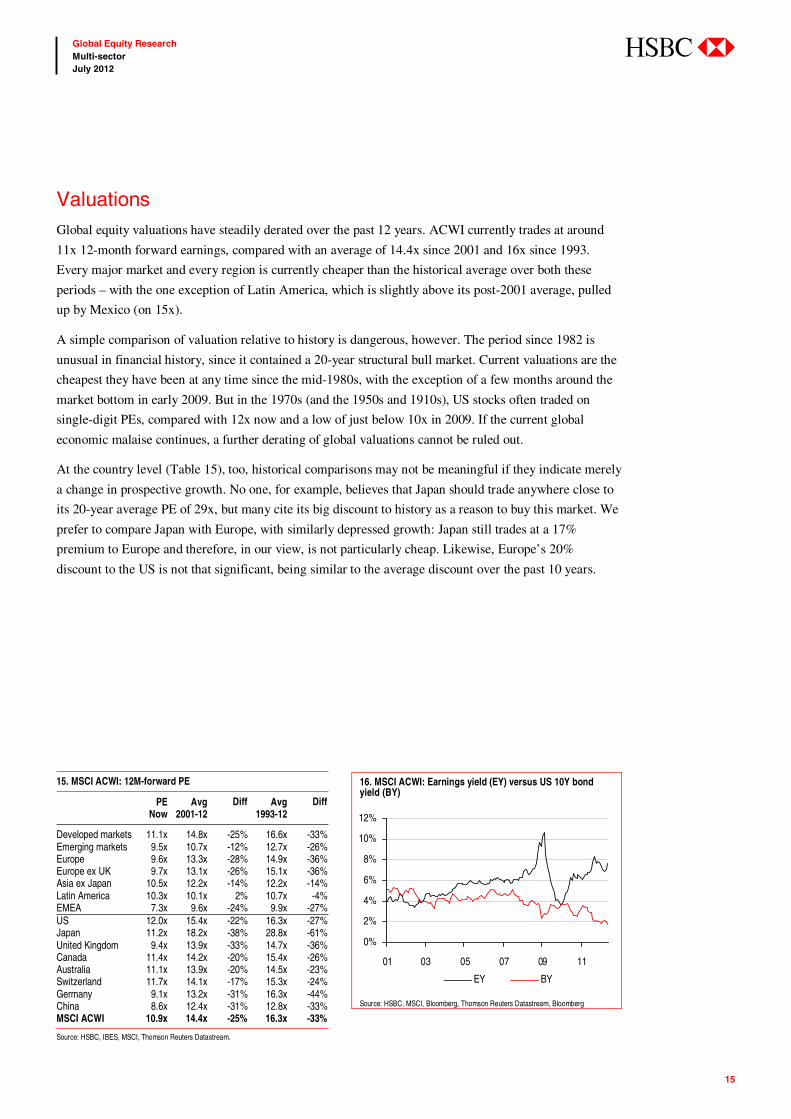
Valuations Global equity valuations have steadily derated over the past 12 years. ACWI currently trades at around
11x 12-month forward earnings, compared with an average of 14.4x since 2001 and 16x since 1993.
Every major market and every region is currently cheaper than the historical average over both these
periods – with the one exception of Latin America, which is slightly above its post-2001 average, pulled
up by Mexico (on 15x).
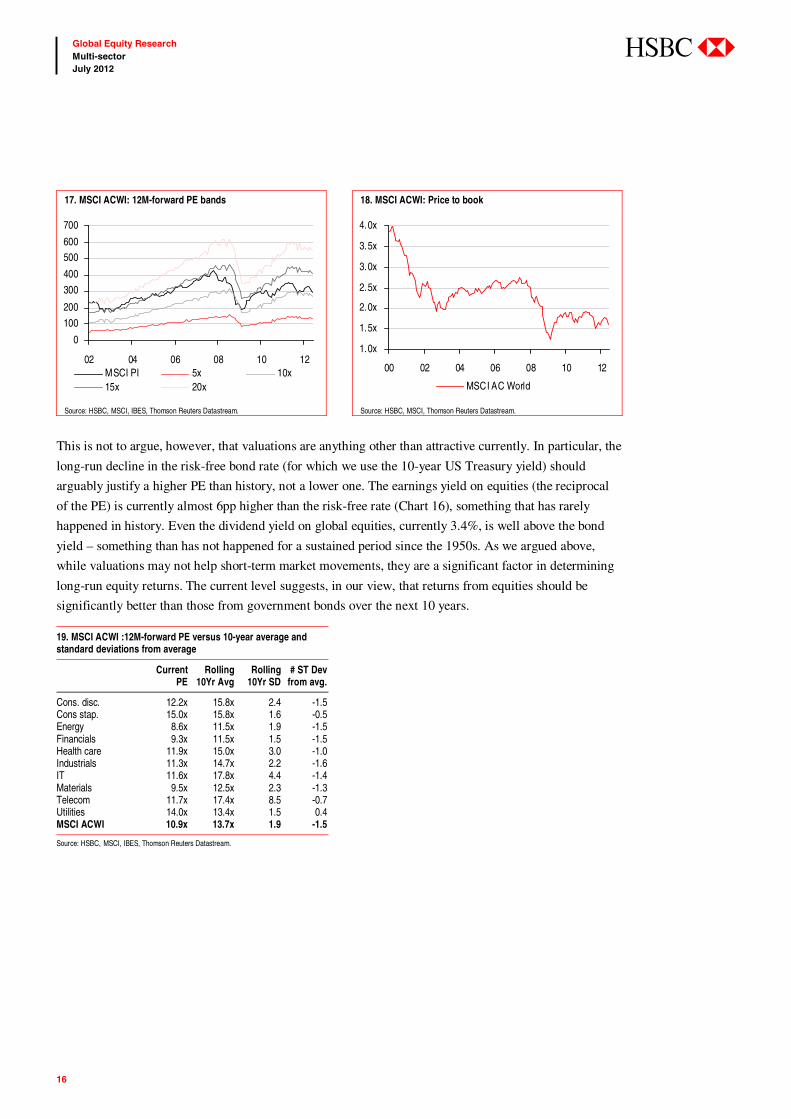
A simple comparison of valuation relative to history is dangerous, however. The period since 1982 is
unusual in financial history, since it contained a 20-year structural bull market. Current valuations are the
cheapest they have been at any time since the mid-1980s, with the exception of a few months around the
market bottom in early 2009. But in the 1970s (and the 1950s and 1910s), US stocks often traded on
single-digit PEs, compared with 12x now and a low of just below 10x in 2009. If the current global
economic malaise continues, a further derating of global valuations cannot be ruled out.
At the country level (Table 15), too, historical comparisons may not be meaningful if they indicate merely
a change in prospective growth. No one, for example, believes that Japan should trade anywhere close to
its 20-year average PE of 29x, but many cite its big discount to history as a reason to buy this market. We
prefer to compare Japan with Europe, with similarly depressed growth: Japan still trades at a 17%
premium to Europe and therefore, in our view, is not particularly cheap. Likewise, Europe’s 20%
discount to the US is not that significant, being similar to the average discount over the past 10 years.
15. MSCI ACWI: 12M-forward PE
PE Now
Avg 2001-12
Diff Avg 1993-12
Diff
Developed markets 11.1x 14.8x -25% 16.6x -33%Emerging markets 9.5x 10.7x -12% 12.7x -26%Europe 9.6x 13.3x -28% 14.9x -36%Europe ex UK 9.7x 13.1x -26% 15.1x -36%Asia ex Japan 10.5x 12.2x -14% 12.2x -14%Latin America 10.3x 10.1x 2% 10.7x -4%EMEA 7.3x 9.6x -24% 9.9x -27%US 12.0x 15.4x -22% 16.3x -27%Japan 11.2x 18.2x -38% 28.8x -61%United Kingdom 9.4x 13.9x -33% 14.7x -36%Canada 11.4x 14.2x -20% 15.4x -26%Australia 11.1x 13.9x -20% 14.5x -23%Switzerland 11.7x 14.1x -17% 15.3x -24%Germany 9.1x 13.2x -31% 16.3x -44%China 8.6x 12.4x -31% 12.8x -33%MSCI ACWI 10.9x 14.4x -25% 16.3x -33%
Source: HSBC, IBES, MSCI, Thomson Reuters Datastream.
16. MSCI ACWI: Earnings yield (EY) versus US 10Y bond yield (BY)
0%
2%
4%
6%
8%
10%
12%
01 03 05 07 09 11
EY BY
Source: HSBC, MSCI, Bloomberg, Thomson Reuters Datastream, Bloomberg
16
Global Equity Research Multi-sector July 2012
abc
17. MSCI ACWI: 12M-forward PE bands 18. MSCI ACWI: Price to book
0
100
200
300
400
500
600
700
02 04 06 08 10 12MSCI PI 5x 10x15x 20x
1.0x
1.5x
2.0x
2.5x
3.0x
3.5x
4.0x
00 02 04 06 08 10 12
MSCI AC World
Source: HSBC, MSCI, IBES, Thomson Reuters Datastream. Source: HSBC, MSCI, Thomson Reuters Datastream.
This is not to argue, however, that valuations are anything other than attractive currently. In particular, the
long-run decline in the risk-free bond rate (for which we use the 10-year US Treasury yield) should
arguably justify a higher PE than history, not a lower one. The earnings yield on equities (the reciprocal
of the PE) is currently almost 6pp higher than the risk-free rate (Chart 16), something that has rarely
happened in history. Even the dividend yield on global equities, currently 3.4%, is well above the bond
yield – something than has not happened for a sustained period since the 1950s. As we argued above,
while valuations may not help short-term market movements, they are a significant factor in determining
long-run equity returns. The current level suggests, in our view, that returns from equities should be
significantly better than those from government bonds over the next 10 years. 19. MSCI ACWI :12M-forward PE versus 10-year average and standard deviations from average
Current PE
Rolling 10Yr Avg
Rolling 10Yr SD
# ST Dev from avg.
Cons. disc. 12.2x 15.8x 2.4 -1.5Cons stap. 15.0x 15.8x 1.6 -0.5Energy 8.6x 11.5x 1.9 -1.5Financials 9.3x 11.5x 1.5 -1.5Health care 11.9x 15.0x 3.0 -1.0Industrials 11.3x 14.7x 2.2 -1.6IT 11.6x 17.8x 4.4 -1.4Materials 9.5x 12.5x 2.3 -1.3Telecom 11.7x 17.4x 8.5 -0.7Utilities 14.0x 13.4x 1.5 0.4MSCI ACWI 10.9x 13.7x 1.9 -1.5
Source: HSBC, MSCI, IBES, Thomson Reuters Datastream.
17
Global Equity Research Multi-sector July 2012
abc
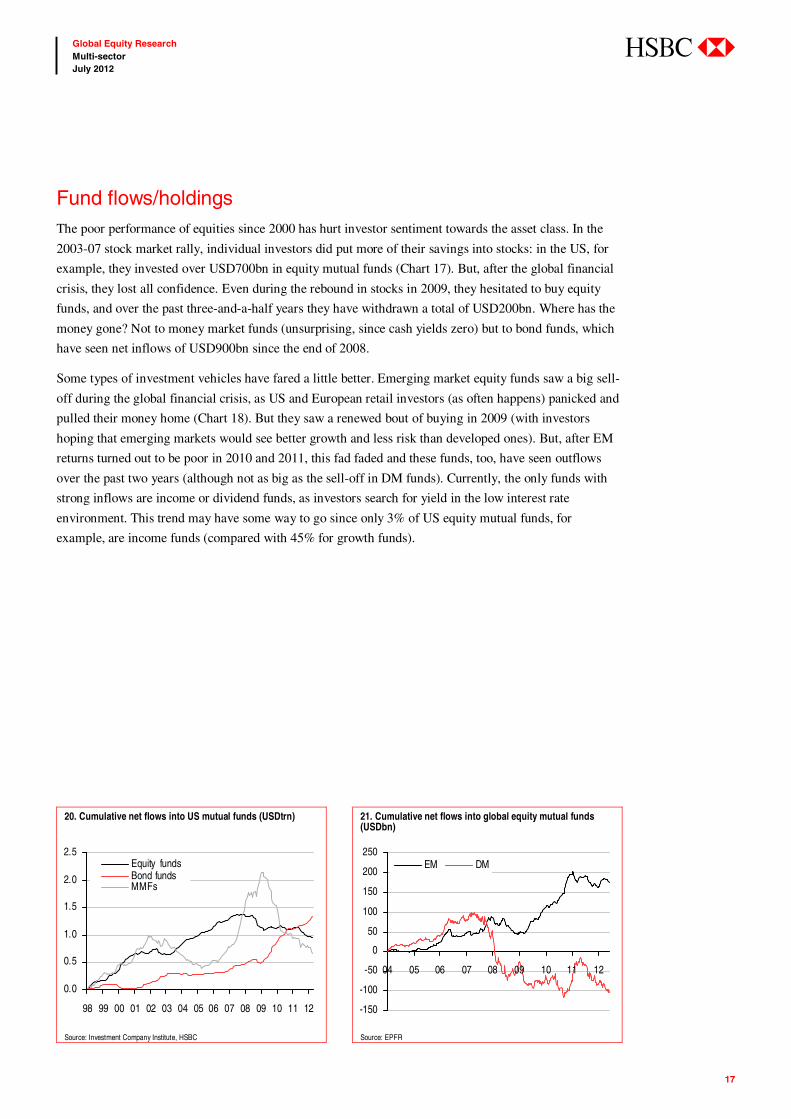
Fund flows/holdings The poor performance of equities since 2000 has hurt investor sentiment towards the asset class. In the
2003-07 stock market rally, individual investors did put more of their savings into stocks: in the US, for
example, they invested over USD700bn in equity mutual funds (Chart 17). But, after the global financial
crisis, they lost all confidence. Even during the rebound in stocks in 2009, they hesitated to buy equity
funds, and over the past three-and-a-half years they have withdrawn a total of USD200bn. Where has the
money gone? Not to money market funds (unsurprising, since cash yields zero) but to bond funds, which
have seen net inflows of USD900bn since the end of 2008.
Some types of investment vehicles have fared a little better. Emerging market equity funds saw a big sell-
off during the global financial crisis, as US and European retail investors (as often happens) panicked and
pulled their money home (Chart 18). But they saw a renewed bout of buying in 2009 (with investors
hoping that emerging markets would see better growth and less risk than developed ones). But, after EM
returns turned out to be poor in 2010 and 2011, this fad faded and these funds, too, have seen outflows
over the past two years (although not as big as the sell-off in DM funds). Currently, the only funds with
strong inflows are income or dividend funds, as investors search for yield in the low interest rate
environment. This trend may have some way to go since only 3% of US equity mutual funds, for
example, are income funds (compared with 45% for growth funds).
20. Cumulative net flows into US mutual funds (USDtrn) 21. Cumulative net flows into global equity mutual funds (USDbn)
0.0
0.5
1.0
1.5
2.0
2.5
98 99 00 01 02 03 04 05 06 07 08 09 10 11 12
Equity fundsBond fundsMMFs
-150
-100
-50
0
50
100
150
200
250
04 05 06 07 08 09 10 11 12
EM DM
Source: Investment Company Institute, HSBC Source: EPFR

18
Global Equity Research Multi-sector July 2012
abc
Notes
19
Global Equity Research Multi-sector July 2012
abc
Industry group snapshots
20
Global Equity Research Multi-sector July 2012
abc
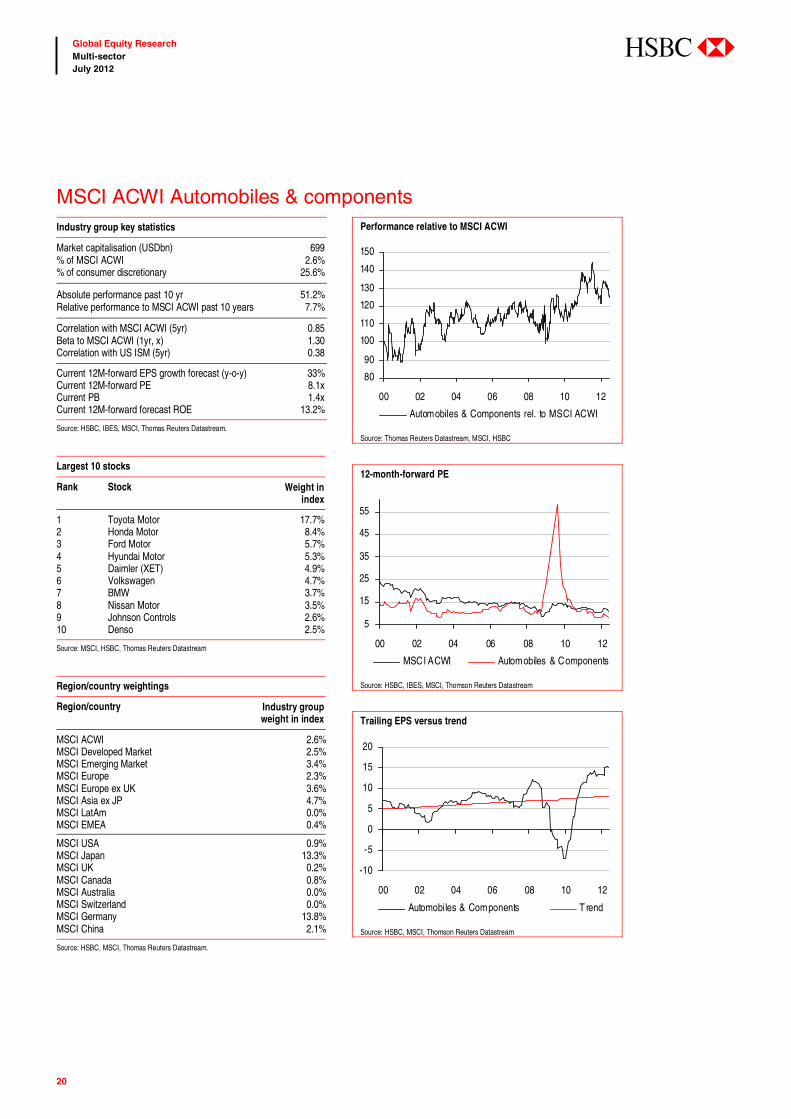
MSCI ACWI Automobiles & componentsIndustry group key statistics
Market capitalisation (USDbn) 699 % of MSCI ACWI 2.6% % of consumer discretionary 25.6%
Absolute performance past 10 yr 51.2% Relative performance to MSCI ACWI past 10 years 7.7%
Correlation with MSCI ACWI (5yr) 0.85 Beta to MSCI ACWI (1yr, x) 1.30 Correlation with US ISM (5yr) 0.38
Current 12M-forward EPS growth forecast (y-o-y) 33% Current 12M-forward PE 8.1x Current PB 1.4x Current 12M-forward forecast ROE 13.2%
Source: HSBC, IBES, MSCI, Thomas Reuters Datastream.
Largest 10 stocks
Rank Stock Weight in index
1 Toyota Motor 17.7% 2 Honda Motor 8.4% 3 Ford Motor 5.7% 4 Hyundai Motor 5.3% 5 Daimler (XET) 4.9% 6 Volkswagen 4.7% 7 BMW 3.7% 8 Nissan Motor 3.5% 9 Johnson Controls 2.6% 10 Denso 2.5%
Source: MSCI, HSBC, Thomas Reuters Datastream
Region/country weightings
Region/country Industry group weight in index
MSCI ACWI 2.6% MSCI Developed Market 2.5% MSCI Emerging Market 3.4% MSCI Europe 2.3% MSCI Europe ex UK 3.6% MSCI Asia ex JP 4.7% MSCI LatAm 0.0% MSCI EMEA 0.4%
MSCI USA 0.9% MSCI Japan 13.3% MSCI UK 0.2% MSCI Canada 0.8% MSCI Australia 0.0% MSCI Switzerland 0.0% MSCI Germany 13.8% MSCI China 2.1%
Source: HSBC, MSCI, Thomas Reuters Datastream.
Performance relative to MSCI ACWI
80
90
100
110
120
130
140
150
00 02 04 06 08 10 12
Automobiles & Components rel. to MSCI ACWI
Source: Thomas Reuters Datastream, MSCI, HSBC
12-month-forward PE
5
15
25
35
45
55
00 02 04 06 08 10 12
MSCI ACWI Automobiles & Components
Source: HSBC, IBES, MSCI, Thomson Reuters Datastream
Trailing EPS versus trend
-10
-5
0
5
10
15
20
00 02 04 06 08 10 12
Automobiles & Components T rend
Source: HSBC, MSCI, Thomson Reuters Datastream
21
Global Equity Research Multi-sector July 2012
abc
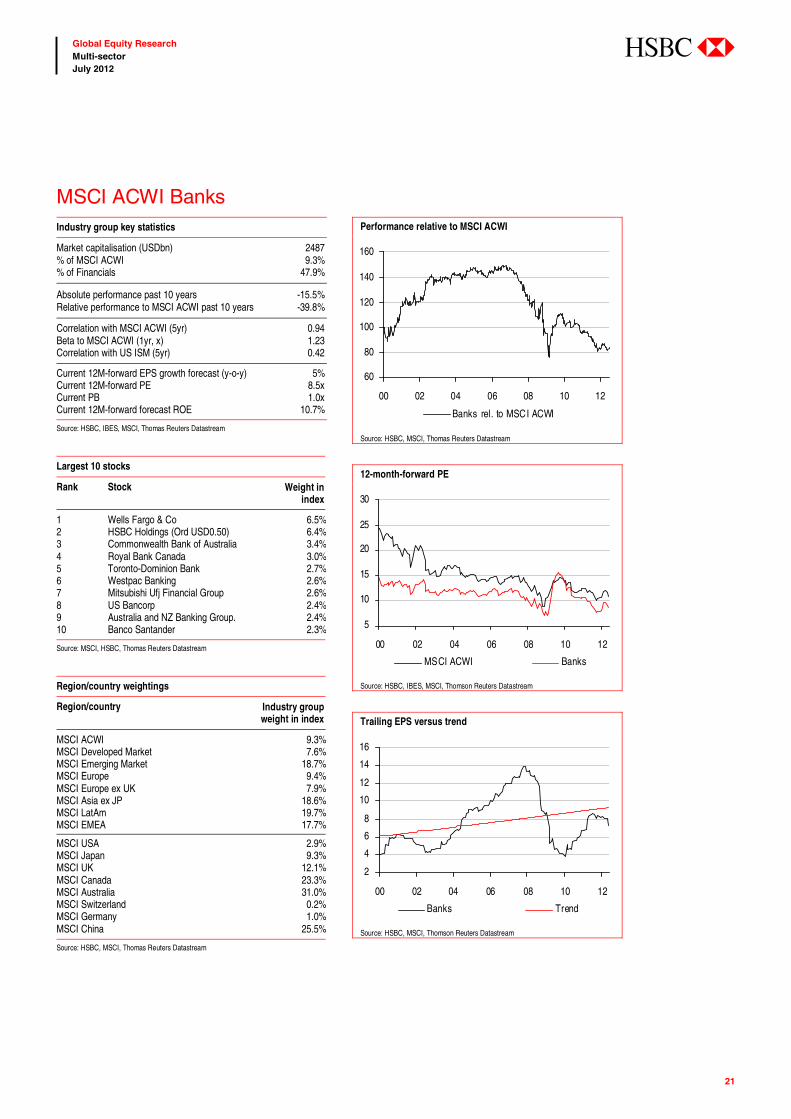
MSCI ACWI BanksIndustry group key statistics
Market capitalisation (USDbn) 2487 % of MSCI ACWI 9.3% % of Financials 47.9%
Absolute performance past 10 years -15.5% Relative performance to MSCI ACWI past 10 years -39.8%
Correlation with MSCI ACWI (5yr) 0.94 Beta to MSCI ACWI (1yr, x) 1.23 Correlation with US ISM (5yr) 0.42
Current 12M-forward EPS growth forecast (y-o-y) 5% Current 12M-forward PE 8.5x Current PB 1.0x Current 12M-forward forecast ROE 10.7%
Source: HSBC, IBES, MSCI, Thomas Reuters Datastream
Largest 10 stocks
Rank Stock Weight in index
1 Wells Fargo & Co 6.5%2 HSBC Holdings (Ord USD0.50) 6.4%3 Commonwealth Bank of Australia 3.4%4 Royal Bank Canada 3.0%5 Toronto-Dominion Bank 2.7%6 Westpac Banking 2.6%7 Mitsubishi Ufj Financial Group 2.6%8 US Bancorp 2.4%9 Australia and NZ Banking Group. 2.4%10 Banco Santander 2.3%
Source: MSCI, HSBC, Thomas Reuters Datastream
Region/country weightings
Region/country Industry group weight in index
MSCI ACWI 9.3% MSCI Developed Market 7.6% MSCI Emerging Market 18.7% MSCI Europe 9.4% MSCI Europe ex UK 7.9% MSCI Asia ex JP 18.6% MSCI LatAm 19.7% MSCI EMEA 17.7%
MSCI USA 2.9% MSCI Japan 9.3% MSCI UK 12.1% MSCI Canada 23.3% MSCI Australia 31.0% MSCI Switzerland 0.2% MSCI Germany 1.0% MSCI China 25.5%
Source: HSBC, MSCI, Thomas Reuters Datastream
Performance relative to MSCI ACWI
60
80
100
120
140
160
00 02 04 06 08 10 12
Banks rel. to MSCI ACWI
Source: HSBC, MSCI, Thomas Reuters Datastream
12-month-forward PE
5
10
15
20
25
30
00 02 04 06 08 10 12
MSCI ACWI Banks
Source: HSBC, IBES, MSCI, Thomson Reuters Datastream
Trailing EPS versus trend
2
4
6
8
10
12
14
16
00 02 04 06 08 10 12
Banks Trend
Source: HSBC, MSCI, Thomson Reuters Datastream
22
Global Equity Research Multi-sector July 2012
abc
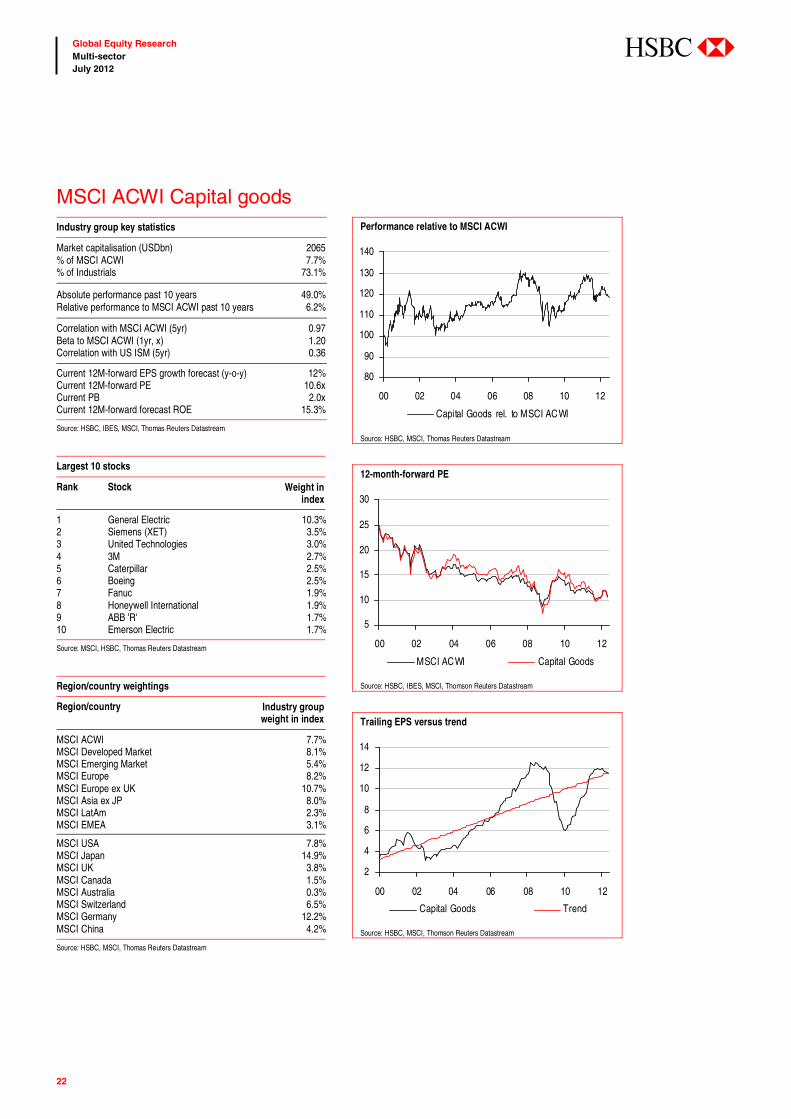
MSCI ACWI Capital goodsIndustry group key statistics
Market capitalisation (USDbn) 2065 % of MSCI ACWI 7.7% % of Industrials 73.1%
Absolute performance past 10 years 49.0% Relative performance to MSCI ACWI past 10 years 6.2%
Correlation with MSCI ACWI (5yr) 0.97 Beta to MSCI ACWI (1yr, x) 1.20 Correlation with US ISM (5yr) 0.36
Current 12M-forward EPS growth forecast (y-o-y) 12% Current 12M-forward PE 10.6x Current PB 2.0x Current 12M-forward forecast ROE 15.3%
Source: HSBC, IBES, MSCI, Thomas Reuters Datastream
Largest 10 stocks
Rank Stock Weight in index
1 General Electric 10.3%2 Siemens (XET) 3.5%3 United Technologies 3.0%4 3M 2.7%5 Caterpillar 2.5%6 Boeing 2.5%7 Fanuc 1.9%8 Honeywell International 1.9%9 ABB 'R' 1.7%10 Emerson Electric 1.7%
Source: MSCI, HSBC, Thomas Reuters Datastream
Region/country weightings
Region/country Industry group weight in index
MSCI ACWI 7.7% MSCI Developed Market 8.1% MSCI Emerging Market 5.4% MSCI Europe 8.2% MSCI Europe ex UK 10.7% MSCI Asia ex JP 8.0% MSCI LatAm 2.3% MSCI EMEA 3.1%
MSCI USA 7.8% MSCI Japan 14.9% MSCI UK 3.8% MSCI Canada 1.5% MSCI Australia 0.3% MSCI Switzerland 6.5% MSCI Germany 12.2% MSCI China 4.2%
Source: HSBC, MSCI, Thomas Reuters Datastream
Performance relative to MSCI ACWI
80
90
100
110
120
130
140
00 02 04 06 08 10 12
Capital Goods rel. to MSCI ACWI
Source: HSBC, MSCI, Thomas Reuters Datastream
12-month-forward PE
5
10
15
20
25
30
00 02 04 06 08 10 12
MSCI ACWI Capital Goods
Source: HSBC, IBES, MSCI, Thomson Reuters Datastream
Trailing EPS versus trend
2
4
6
8
10
12
14
00 02 04 06 08 10 12
Capital Goods Trend
Source: HSBC, MSCI, Thomson Reuters Datastream
23
Global Equity Research Multi-sector July 2012
abc
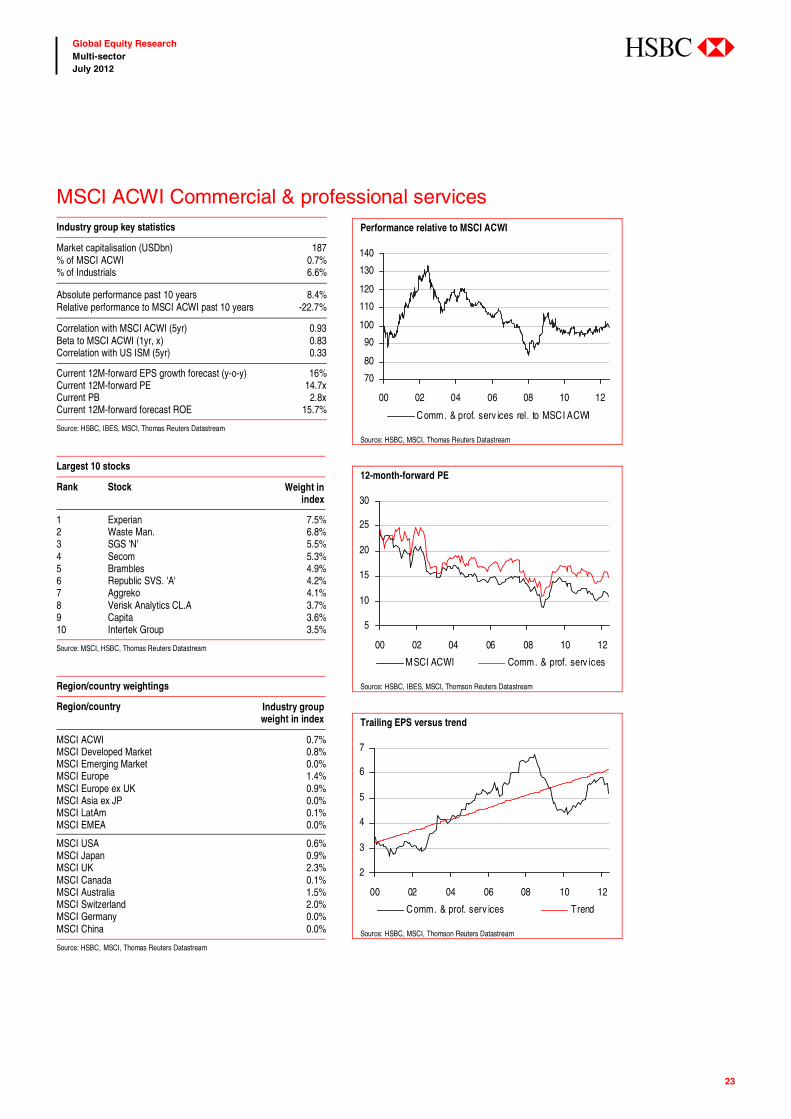
MSCI ACWI Commercial & professional servicesIndustry group key statistics
Market capitalisation (USDbn) 187 % of MSCI ACWI 0.7% % of Industrials 6.6%
Absolute performance past 10 years 8.4% Relative performance to MSCI ACWI past 10 years -22.7%
Correlation with MSCI ACWI (5yr) 0.93 Beta to MSCI ACWI (1yr, x) 0.83 Correlation with US ISM (5yr) 0.33
Current 12M-forward EPS growth forecast (y-o-y) 16% Current 12M-forward PE 14.7x Current PB 2.8x Current 12M-forward forecast ROE 15.7%
Source: HSBC, IBES, MSCI, Thomas Reuters Datastream
Largest 10 stocks
Rank Stock Weight in index
1 Experian 7.5%2 Waste Man. 6.8%3 SGS 'N' 5.5%4 Secom 5.3%5 Brambles 4.9%6 Republic SVS. 'A' 4.2%7 Aggreko 4.1%8 Verisk Analytics CL.A 3.7%9 Capita 3.6%10 Intertek Group 3.5%
Source: MSCI, HSBC, Thomas Reuters Datastream
Region/country weightings
Region/country Industry group weight in index
MSCI ACWI 0.7% MSCI Developed Market 0.8% MSCI Emerging Market 0.0% MSCI Europe 1.4% MSCI Europe ex UK 0.9% MSCI Asia ex JP 0.0% MSCI LatAm 0.1% MSCI EMEA 0.0%
MSCI USA 0.6% MSCI Japan 0.9% MSCI UK 2.3% MSCI Canada 0.1% MSCI Australia 1.5% MSCI Switzerland 2.0% MSCI Germany 0.0% MSCI China 0.0%
Source: HSBC, MSCI, Thomas Reuters Datastream
Performance relative to MSCI ACWI
70
80
90
100
110
120
130
140
00 02 04 06 08 10 12
Comm. & prof. serv ices rel. to MSCI ACWI
Source: HSBC, MSCI, Thomas Reuters Datastream
12-month-forward PE
5
10
15
20
25
30
00 02 04 06 08 10 12
MSCI ACWI Comm. & prof. serv ices
Source: HSBC, IBES, MSCI, Thomson Reuters Datastream
Trailing EPS versus trend
2
3
4
5
6
7
00 02 04 06 08 10 12
Comm. & prof. serv ices Trend
Source: HSBC, MSCI, Thomson Reuters Datastream
24
Global Equity Research Multi-sector July 2012
abc
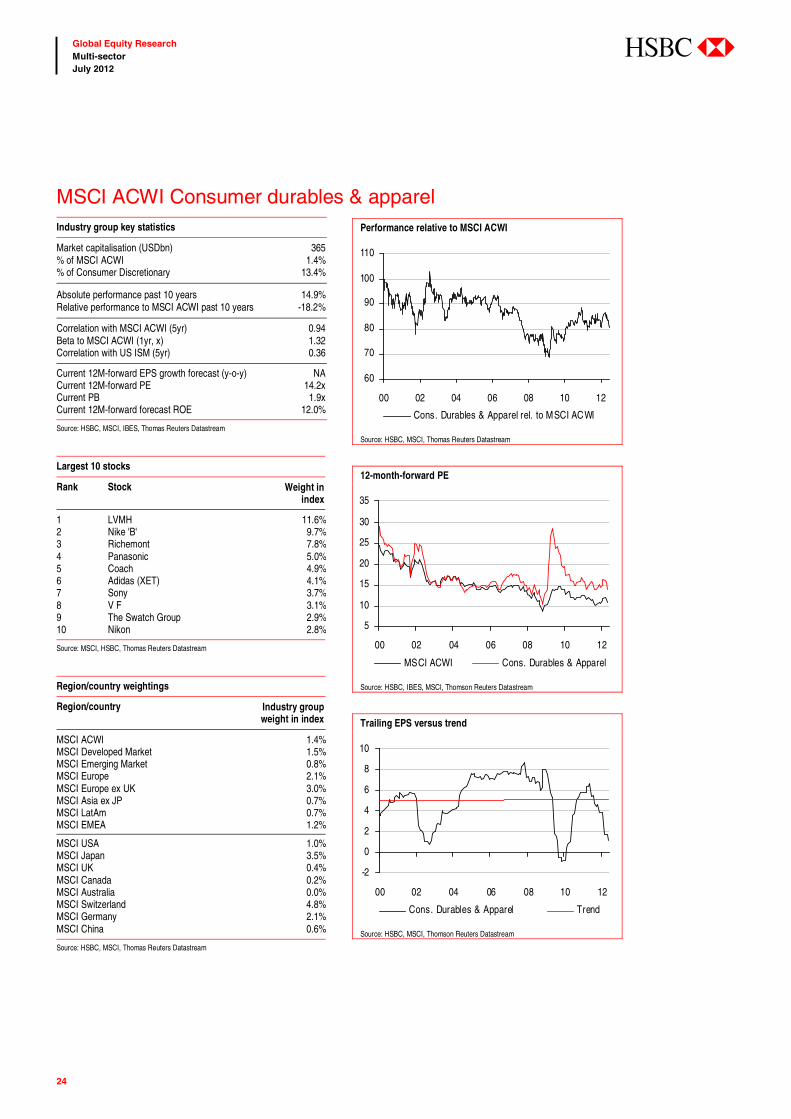
MSCI ACWI Consumer durables & apparelIndustry group key statistics
Market capitalisation (USDbn) 365 % of MSCI ACWI 1.4% % of Consumer Discretionary 13.4%
Absolute performance past 10 years 14.9% Relative performance to MSCI ACWI past 10 years -18.2%
Correlation with MSCI ACWI (5yr) 0.94 Beta to MSCI ACWI (1yr, x) 1.32 Correlation with US ISM (5yr) 0.36
Current 12M-forward EPS growth forecast (y-o-y) NA Current 12M-forward PE 14.2x Current PB 1.9x Current 12M-forward forecast ROE 12.0%
Source: HSBC, MSCI, IBES, Thomas Reuters Datastream
Largest 10 stocks
Rank Stock Weight in index
1 LVMH 11.6%2 Nike 'B' 9.7%3 Richemont 7.8%4 Panasonic 5.0%5 Coach 4.9%6 Adidas (XET) 4.1%7 Sony 3.7%8 V F 3.1%9 The Swatch Group 2.9%10 Nikon 2.8%
Source: MSCI, HSBC, Thomas Reuters Datastream
Region/country weightings
Region/country Industry group weight in index
MSCI ACWI 1.4% MSCI Developed Market 1.5% MSCI Emerging Market 0.8% MSCI Europe 2.1% MSCI Europe ex UK 3.0% MSCI Asia ex JP 0.7% MSCI LatAm 0.7% MSCI EMEA 1.2%
MSCI USA 1.0% MSCI Japan 3.5% MSCI UK 0.4% MSCI Canada 0.2% MSCI Australia 0.0% MSCI Switzerland 4.8% MSCI Germany 2.1% MSCI China 0.6%
Source: HSBC, MSCI, Thomas Reuters Datastream
Performance relative to MSCI ACWI
60
70
80
90
100
110
00 02 04 06 08 10 12
Cons. Durables & Apparel rel. to MSCI ACWI
Source: HSBC, MSCI, Thomas Reuters Datastream
12-month-forward PE
5
10
15
20
25
30
35
00 02 04 06 08 10 12
MSCI ACWI Cons. Durables & Apparel
Source: HSBC, IBES, MSCI, Thomson Reuters Datastream
Trailing EPS versus trend
-2
0
2
4
6
8
10
00 02 04 06 08 10 12
Cons. Durables & Apparel Trend
Source: HSBC, MSCI, Thomson Reuters Datastream
25
Global Equity Research Multi-sector July 2012
abc
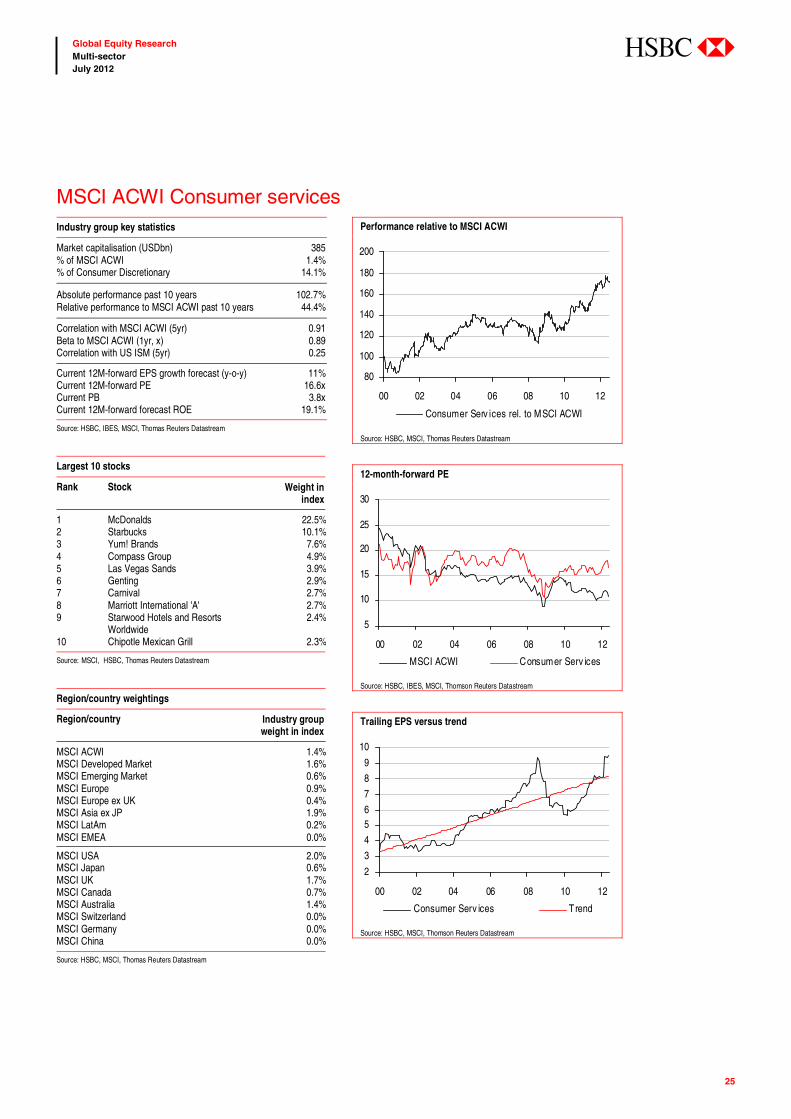
MSCI ACWI Consumer servicesIndustry group key statistics
Market capitalisation (USDbn) 385 % of MSCI ACWI 1.4% % of Consumer Discretionary 14.1%
Absolute performance past 10 years 102.7% Relative performance to MSCI ACWI past 10 years 44.4%
Correlation with MSCI ACWI (5yr) 0.91 Beta to MSCI ACWI (1yr, x) 0.89 Correlation with US ISM (5yr) 0.25
Current 12M-forward EPS growth forecast (y-o-y) 11% Current 12M-forward PE 16.6x Current PB 3.8x Current 12M-forward forecast ROE 19.1%
Source: HSBC, IBES, MSCI, Thomas Reuters Datastream
Largest 10 stocks
Rank Stock Weight in index
1 McDonalds 22.5%2 Starbucks 10.1%3 Yum! Brands 7.6%4 Compass Group 4.9%5 Las Vegas Sands 3.9%6 Genting 2.9%7 Carnival 2.7%8 Marriott International 'A' 2.7%9 Starwood Hotels and Resorts
Worldwide 2.4%
10 Chipotle Mexican Grill 2.3%
Source: MSCI, HSBC, Thomas Reuters Datastream
Region/country weightings
Region/country Industry group weight in index
MSCI ACWI 1.4% MSCI Developed Market 1.6% MSCI Emerging Market 0.6% MSCI Europe 0.9% MSCI Europe ex UK 0.4% MSCI Asia ex JP 1.9% MSCI LatAm 0.2% MSCI EMEA 0.0%
MSCI USA 2.0% MSCI Japan 0.6% MSCI UK 1.7% MSCI Canada 0.7% MSCI Australia 1.4% MSCI Switzerland 0.0% MSCI Germany 0.0% MSCI China 0.0%
Source: HSBC, MSCI, Thomas Reuters Datastream
Performance relative to MSCI ACWI
80
100
120
140
160
180
200
00 02 04 06 08 10 12
Consumer Serv ices rel. to MSCI ACWI
Source: HSBC, MSCI, Thomas Reuters Datastream
12-month-forward PE
5
10
15
20
25
30
00 02 04 06 08 10 12
MSCI ACWI Consumer Serv ices
Source: HSBC, IBES, MSCI, Thomson Reuters Datastream
Trailing EPS versus trend
2
3
4
56
7
8
9
10
00 02 04 06 08 10 12
Consumer Serv ices Trend
Source: HSBC, MSCI, Thomson Reuters Datastream
26
Global Equity Research Multi-sector July 2012
abc
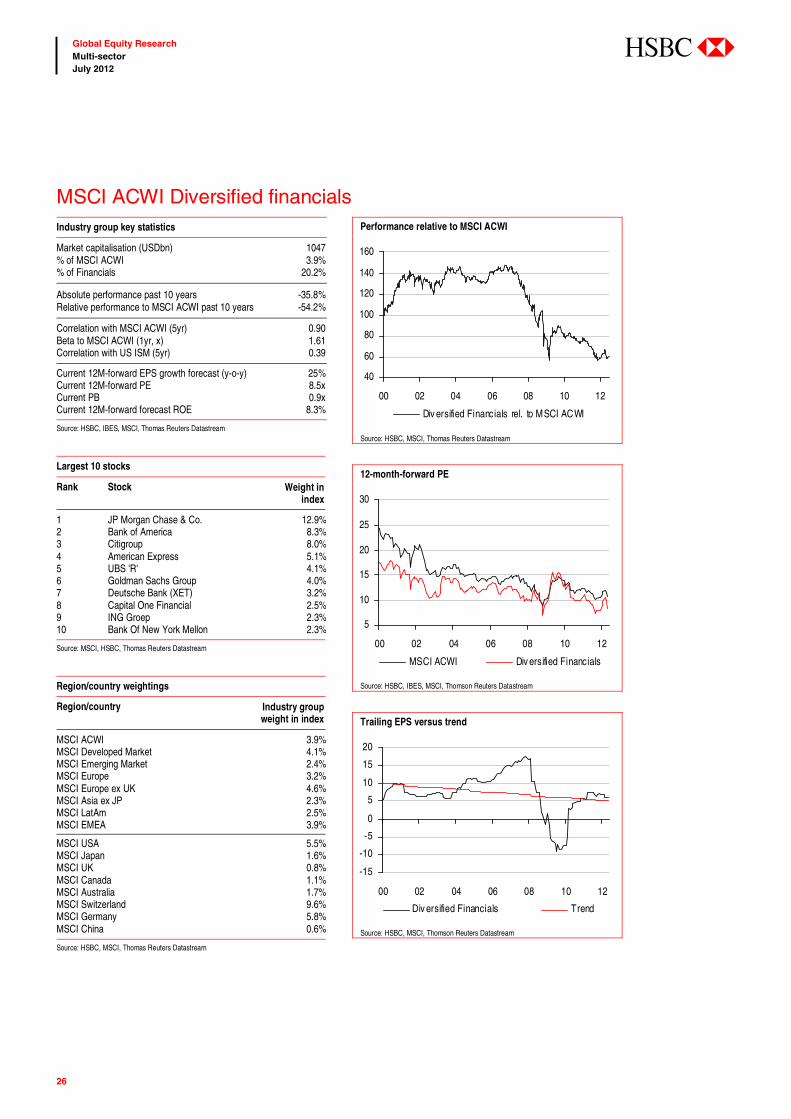
MSCI ACWI Diversified financialsIndustry group key statistics
Market capitalisation (USDbn) 1047 % of MSCI ACWI 3.9% % of Financials 20.2%
Absolute performance past 10 years -35.8% Relative performance to MSCI ACWI past 10 years -54.2%
Correlation with MSCI ACWI (5yr) 0.90 Beta to MSCI ACWI (1yr, x) 1.61 Correlation with US ISM (5yr) 0.39
Current 12M-forward EPS growth forecast (y-o-y) 25% Current 12M-forward PE 8.5x Current PB 0.9x Current 12M-forward forecast ROE 8.3%
Source: HSBC, IBES, MSCI, Thomas Reuters Datastream
Largest 10 stocks
Rank Stock Weight in index
1 JP Morgan Chase & Co. 12.9%2 Bank of America 8.3%3 Citigroup 8.0%4 American Express 5.1%5 UBS 'R' 4.1%6 Goldman Sachs Group 4.0%7 Deutsche Bank (XET) 3.2%8 Capital One Financial 2.5%9 ING Groep 2.3%10 Bank Of New York Mellon 2.3%
Source: MSCI, HSBC, Thomas Reuters Datastream
Region/country weightings
Region/country Industry group weight in index
MSCI ACWI 3.9% MSCI Developed Market 4.1% MSCI Emerging Market 2.4% MSCI Europe 3.2% MSCI Europe ex UK 4.6% MSCI Asia ex JP 2.3% MSCI LatAm 2.5% MSCI EMEA 3.9%
MSCI USA 5.5% MSCI Japan 1.6% MSCI UK 0.8% MSCI Canada 1.1% MSCI Australia 1.7% MSCI Switzerland 9.6% MSCI Germany 5.8% MSCI China 0.6%
Source: HSBC, MSCI, Thomas Reuters Datastream
Performance relative to MSCI ACWI
40
60
80
100
120
140
160
00 02 04 06 08 10 12
Div ersified Financials rel. to MSCI ACWI
Source: HSBC, MSCI, Thomas Reuters Datastream
12-month-forward PE
5
10
15
20
25
30
00 02 04 06 08 10 12
MSCI ACWI Div ersified Financials
Source: HSBC, IBES, MSCI, Thomson Reuters Datastream
Trailing EPS versus trend
-15
-10
-5
0
5
10
15
20
00 02 04 06 08 10 12
Div ersified Financials Trend
Source: HSBC, MSCI, Thomson Reuters Datastream
27
Global Equity Research Multi-sector July 2012
abc
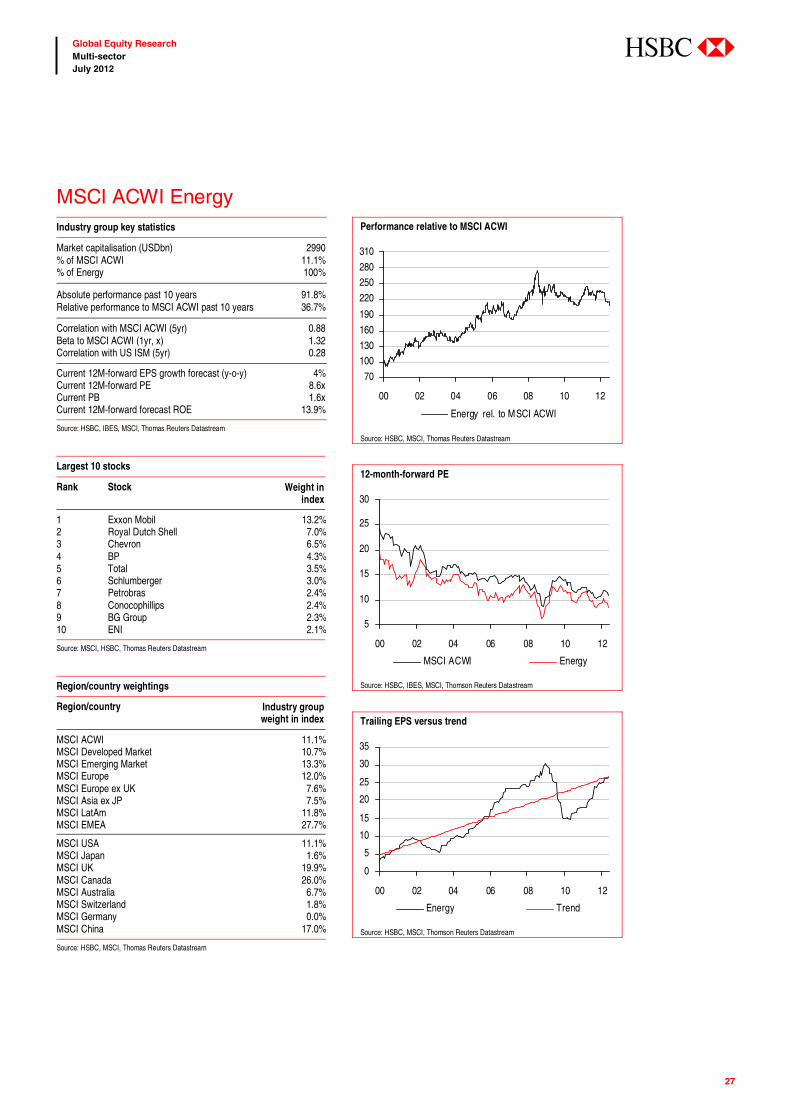
MSCI ACWI EnergyIndustry group key statistics
Market capitalisation (USDbn) 2990 % of MSCI ACWI 11.1% % of Energy 100%
Absolute performance past 10 years 91.8% Relative performance to MSCI ACWI past 10 years 36.7%
Correlation with MSCI ACWI (5yr) 0.88 Beta to MSCI ACWI (1yr, x) 1.32 Correlation with US ISM (5yr) 0.28
Current 12M-forward EPS growth forecast (y-o-y) 4% Current 12M-forward PE 8.6x Current PB 1.6x Current 12M-forward forecast ROE 13.9%
Source: HSBC, IBES, MSCI, Thomas Reuters Datastream
Largest 10 stocks
Rank Stock Weight in index
1 Exxon Mobil 13.2%2 Royal Dutch Shell 7.0%3 Chevron 6.5%4 BP 4.3%5 Total 3.5%6 Schlumberger 3.0%7 Petrobras 2.4%8 Conocophillips 2.4%9 BG Group 2.3%10 ENI 2.1%
Source: MSCI, HSBC, Thomas Reuters Datastream
Region/country weightings
Region/country Industry group weight in index
MSCI ACWI 11.1% MSCI Developed Market 10.7% MSCI Emerging Market 13.3% MSCI Europe 12.0% MSCI Europe ex UK 7.6% MSCI Asia ex JP 7.5% MSCI LatAm 11.8% MSCI EMEA 27.7%
MSCI USA 11.1% MSCI Japan 1.6% MSCI UK 19.9% MSCI Canada 26.0% MSCI Australia 6.7% MSCI Switzerland 1.8% MSCI Germany 0.0% MSCI China 17.0%
Source: HSBC, MSCI, Thomas Reuters Datastream
Performance relative to MSCI ACWI
70
100130
160
190
220
250280
310
00 02 04 06 08 10 12
Energy rel. to MSCI ACWI
Source: HSBC, MSCI, Thomas Reuters Datastream
12-month-forward PE
5
10
15
20
25
30
00 02 04 06 08 10 12
MSCI ACWI Energy
Source: HSBC, IBES, MSCI, Thomson Reuters Datastream
Trailing EPS versus trend
0
5
10
15
20
25
30
35
00 02 04 06 08 10 12
Energy Trend
Source: HSBC, MSCI, Thomson Reuters Datastream
28
Global Equity Research Multi-sector July 2012
abc
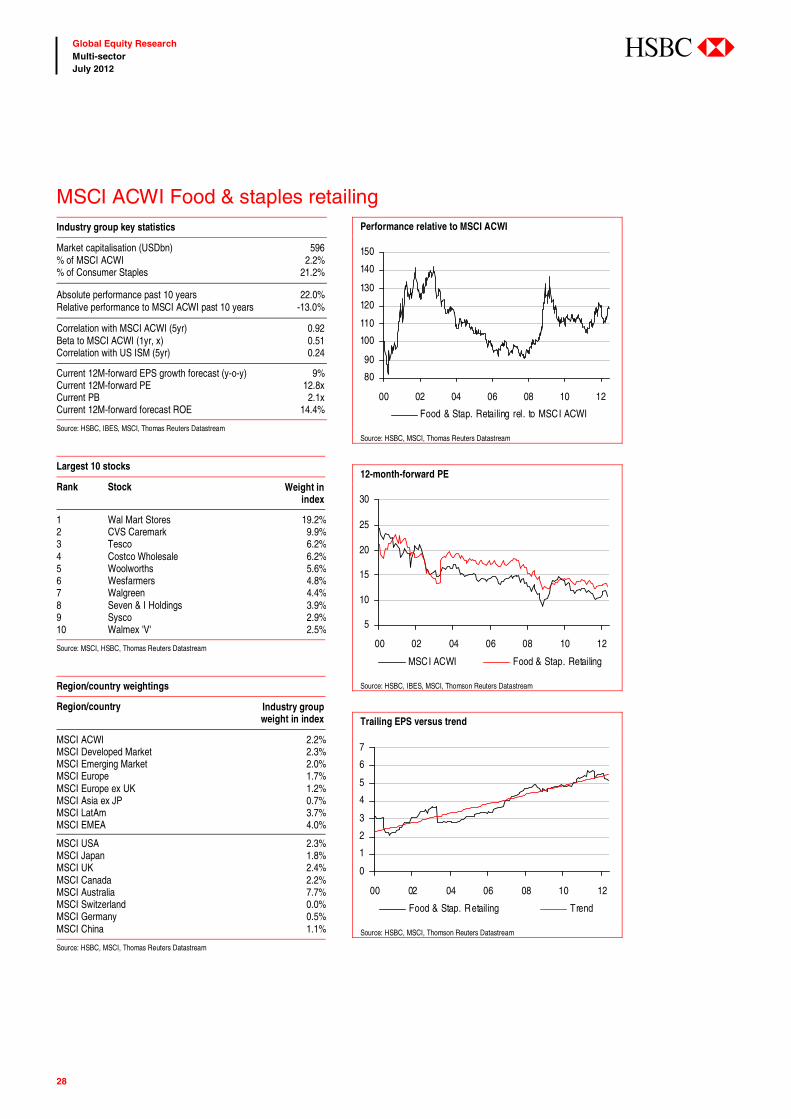
MSCI ACWI Food & staples retailingIndustry group key statistics
Market capitalisation (USDbn) 596 % of MSCI ACWI 2.2% % of Consumer Staples 21.2%
Absolute performance past 10 years 22.0% Relative performance to MSCI ACWI past 10 years -13.0%
Correlation with MSCI ACWI (5yr) 0.92 Beta to MSCI ACWI (1yr, x) 0.51 Correlation with US ISM (5yr) 0.24
Current 12M-forward EPS growth forecast (y-o-y) 9% Current 12M-forward PE 12.8x Current PB 2.1x Current 12M-forward forecast ROE 14.4%
Source: HSBC, IBES, MSCI, Thomas Reuters Datastream
Largest 10 stocks
Rank Stock Weight in index
1 Wal Mart Stores 19.2%2 CVS Caremark 9.9%3 Tesco 6.2%4 Costco Wholesale 6.2%5 Woolworths 5.6%6 Wesfarmers 4.8%7 Walgreen 4.4%8 Seven & I Holdings 3.9%9 Sysco 2.9%10 Walmex 'V' 2.5%
Source: MSCI, HSBC, Thomas Reuters Datastream
Region/country weightings
Region/country Industry group weight in index
MSCI ACWI 2.2% MSCI Developed Market 2.3% MSCI Emerging Market 2.0% MSCI Europe 1.7% MSCI Europe ex UK 1.2% MSCI Asia ex JP 0.7% MSCI LatAm 3.7% MSCI EMEA 4.0%
MSCI USA 2.3% MSCI Japan 1.8% MSCI UK 2.4% MSCI Canada 2.2% MSCI Australia 7.7% MSCI Switzerland 0.0% MSCI Germany 0.5% MSCI China 1.1%
Source: HSBC, MSCI, Thomas Reuters Datastream
Performance relative to MSCI ACWI
80
90
100
110
120
130
140
150
00 02 04 06 08 10 12
Food & Stap. Retailing rel. to MSCI ACWI
Source: HSBC, MSCI, Thomas Reuters Datastream
12-month-forward PE
5
10
15
20
25
30
00 02 04 06 08 10 12
MSCI ACWI Food & Stap. Retailing
Source: HSBC, IBES, MSCI, Thomson Reuters Datastream
Trailing EPS versus trend
0
1
2
3
4
5
6
7
00 02 04 06 08 10 12
Food & Stap. Retailing Trend
Source: HSBC, MSCI, Thomson Reuters Datastream
29
Global Equity Research Multi-sector July 2012
abc
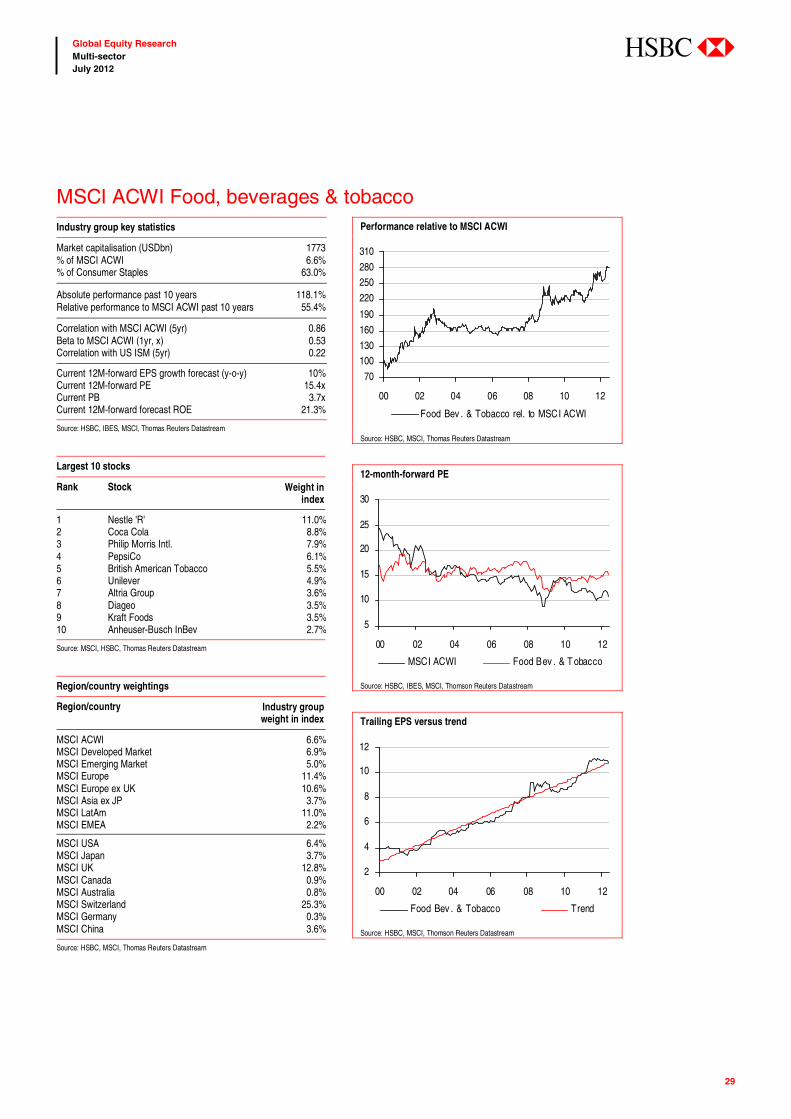
MSCI ACWI Food, beverages & tobaccoIndustry group key statistics
Market capitalisation (USDbn) 1773 % of MSCI ACWI 6.6% % of Consumer Staples 63.0%
Absolute performance past 10 years 118.1% Relative performance to MSCI ACWI past 10 years 55.4%
Correlation with MSCI ACWI (5yr) 0.86 Beta to MSCI ACWI (1yr, x) 0.53 Correlation with US ISM (5yr) 0.22
Current 12M-forward EPS growth forecast (y-o-y) 10% Current 12M-forward PE 15.4x Current PB 3.7x Current 12M-forward forecast ROE 21.3%
Source: HSBC, IBES, MSCI, Thomas Reuters Datastream
Largest 10 stocks
Rank Stock Weight in index
1 Nestle 'R' 11.0%2 Coca Cola 8.8%3 Philip Morris Intl. 7.9%4 PepsiCo 6.1%5 British American Tobacco 5.5%6 Unilever 4.9%7 Altria Group 3.6%8 Diageo 3.5%9 Kraft Foods 3.5%10 Anheuser-Busch InBev 2.7%
Source: MSCI, HSBC, Thomas Reuters Datastream
Region/country weightings
Region/country Industry group weight in index
MSCI ACWI 6.6% MSCI Developed Market 6.9% MSCI Emerging Market 5.0% MSCI Europe 11.4% MSCI Europe ex UK 10.6% MSCI Asia ex JP 3.7% MSCI LatAm 11.0% MSCI EMEA 2.2%
MSCI USA 6.4% MSCI Japan 3.7% MSCI UK 12.8% MSCI Canada 0.9% MSCI Australia 0.8% MSCI Switzerland 25.3% MSCI Germany 0.3% MSCI China 3.6%
Source: HSBC, MSCI, Thomas Reuters Datastream
Performance relative to MSCI ACWI
70
100130
160
190
220
250280
310
00 02 04 06 08 10 12
Food Bev . & Tobacco rel. to MSCI ACWI
Source: HSBC, MSCI, Thomas Reuters Datastream
12-month-forward PE
5
10
15
20
25
30
00 02 04 06 08 10 12
MSCI ACWI Food Bev . & T obacco
Source: HSBC, IBES, MSCI, Thomson Reuters Datastream
Trailing EPS versus trend
2
4
6
8
10
12
00 02 04 06 08 10 12
Food Bev . & Tobacco Trend
Source: HSBC, MSCI, Thomson Reuters Datastream
30
Global Equity Research Multi-sector July 2012
abc
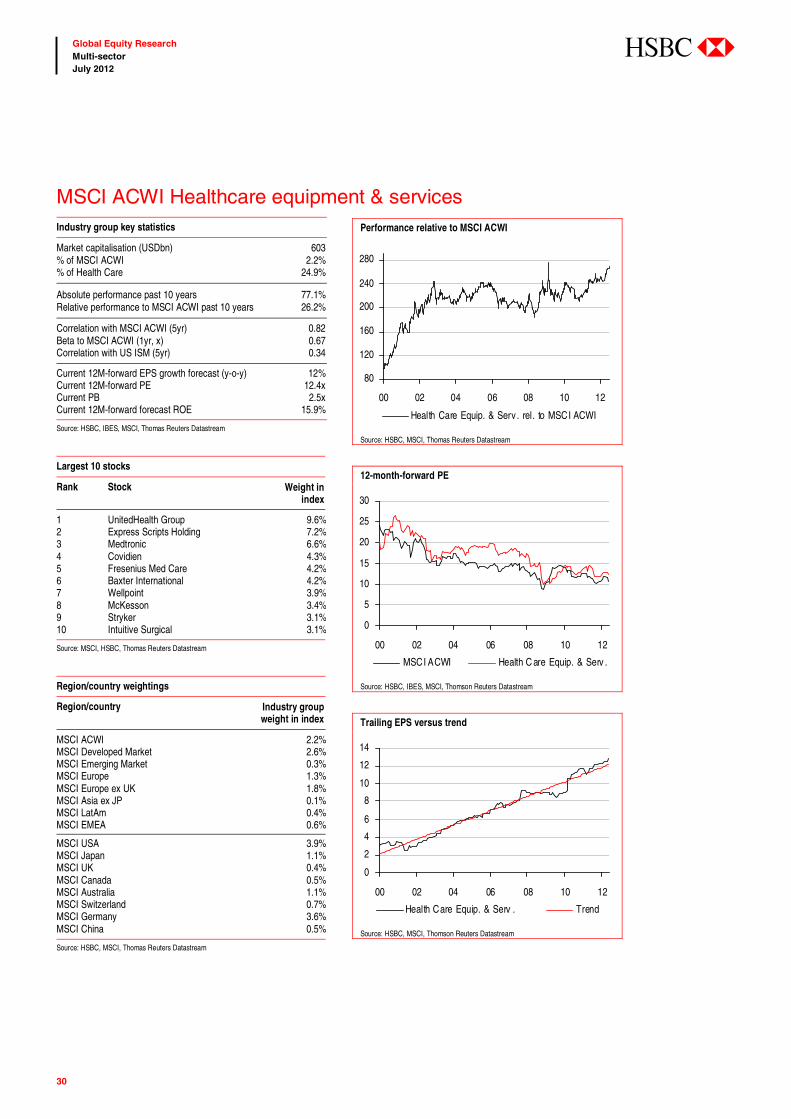
MSCI ACWI Healthcare equipment & servicesIndustry group key statistics
Market capitalisation (USDbn) 603 % of MSCI ACWI 2.2% % of Health Care 24.9%
Absolute performance past 10 years 77.1% Relative performance to MSCI ACWI past 10 years 26.2%
Correlation with MSCI ACWI (5yr) 0.82 Beta to MSCI ACWI (1yr, x) 0.67 Correlation with US ISM (5yr) 0.34
Current 12M-forward EPS growth forecast (y-o-y) 12% Current 12M-forward PE 12.4x Current PB 2.5x Current 12M-forward forecast ROE 15.9%
Source: HSBC, IBES, MSCI, Thomas Reuters Datastream
Largest 10 stocks
Rank Stock Weight in index
1 UnitedHealth Group 9.6%2 Express Scripts Holding 7.2%3 Medtronic 6.6%4 Covidien 4.3%5 Fresenius Med Care 4.2%6 Baxter International 4.2%7 Wellpoint 3.9%8 McKesson 3.4%9 Stryker 3.1%10 Intuitive Surgical 3.1%
Source: MSCI, HSBC, Thomas Reuters Datastream
Region/country weightings
Region/country Industry group weight in index
MSCI ACWI 2.2% MSCI Developed Market 2.6% MSCI Emerging Market 0.3% MSCI Europe 1.3% MSCI Europe ex UK 1.8% MSCI Asia ex JP 0.1% MSCI LatAm 0.4% MSCI EMEA 0.6%
MSCI USA 3.9% MSCI Japan 1.1% MSCI UK 0.4% MSCI Canada 0.5% MSCI Australia 1.1% MSCI Switzerland 0.7% MSCI Germany 3.6% MSCI China 0.5%
Source: HSBC, MSCI, Thomas Reuters Datastream
Performance relative to MSCI ACWI
80
120
160
200
240
280
00 02 04 06 08 10 12
Health Care Equip. & Serv . rel. to MSCI ACWI
Source: HSBC, MSCI, Thomas Reuters Datastream
12-month-forward PE
0
5
10
15
20
25
30
00 02 04 06 08 10 12
MSCI ACWI Health C are Equip. & Serv .
Source: HSBC, IBES, MSCI, Thomson Reuters Datastream
Trailing EPS versus trend
0
2
4
6
8
10
12
14
00 02 04 06 08 10 12
Health Care Equip. & Serv . Trend
Source: HSBC, MSCI, Thomson Reuters Datastream
31
Global Equity Research Multi-sector July 2012
abc
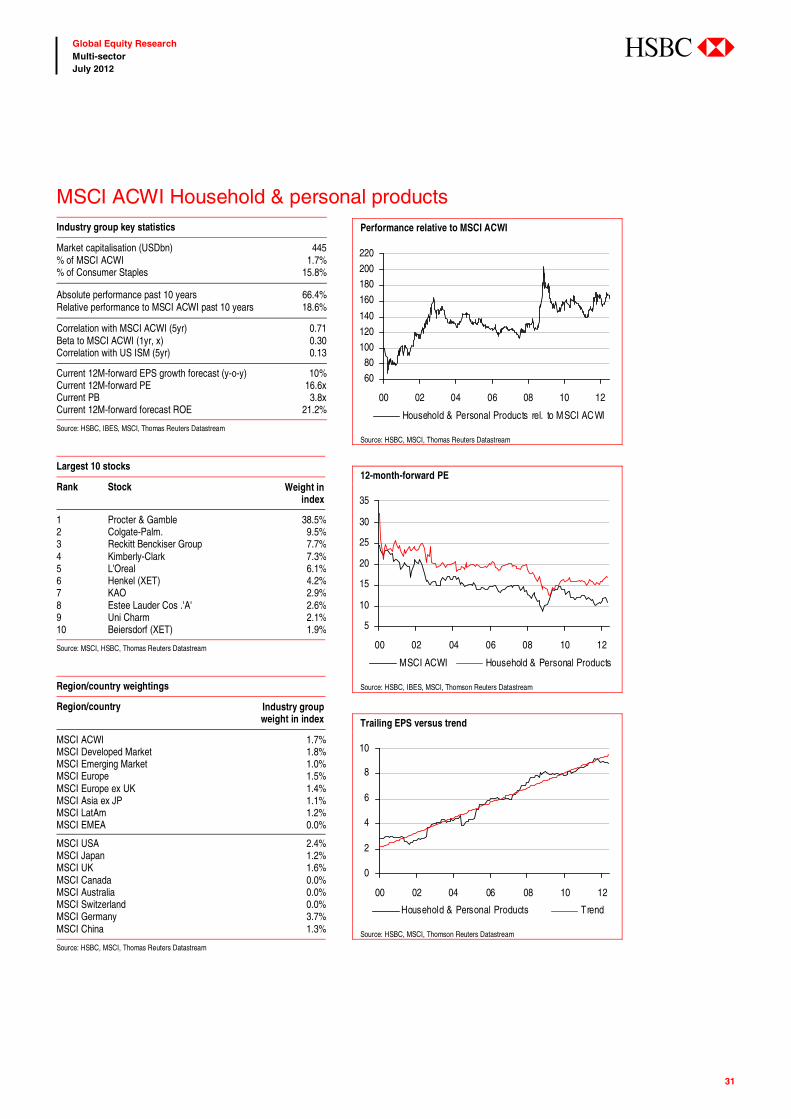
MSCI ACWI Household & personal productsIndustry group key statistics
Market capitalisation (USDbn) 445 % of MSCI ACWI 1.7% % of Consumer Staples 15.8%
Absolute performance past 10 years 66.4% Relative performance to MSCI ACWI past 10 years 18.6%
Correlation with MSCI ACWI (5yr) 0.71 Beta to MSCI ACWI (1yr, x) 0.30 Correlation with US ISM (5yr) 0.13
Current 12M-forward EPS growth forecast (y-o-y) 10% Current 12M-forward PE 16.6x Current PB 3.8x Current 12M-forward forecast ROE 21.2%
Source: HSBC, IBES, MSCI, Thomas Reuters Datastream
Largest 10 stocks
Rank Stock Weight in index
1 Procter & Gamble 38.5%2 Colgate-Palm. 9.5%3 Reckitt Benckiser Group 7.7%4 Kimberly-Clark 7.3%5 L'Oreal 6.1%6 Henkel (XET) 4.2%7 KAO 2.9%8 Estee Lauder Cos .'A' 2.6%9 Uni Charm 2.1%10 Beiersdorf (XET) 1.9%
Source: MSCI, HSBC, Thomas Reuters Datastream
Region/country weightings
Region/country Industry group weight in index
MSCI ACWI 1.7% MSCI Developed Market 1.8% MSCI Emerging Market 1.0% MSCI Europe 1.5% MSCI Europe ex UK 1.4% MSCI Asia ex JP 1.1% MSCI LatAm 1.2% MSCI EMEA 0.0%
MSCI USA 2.4% MSCI Japan 1.2% MSCI UK 1.6% MSCI Canada 0.0% MSCI Australia 0.0% MSCI Switzerland 0.0% MSCI Germany 3.7% MSCI China 1.3%
Source: HSBC, MSCI, Thomas Reuters Datastream
Performance relative to MSCI ACWI
60
80100
120
140
160
180200
220
00 02 04 06 08 10 12
Household & Personal Products rel. to MSCI ACWI
Source: HSBC, MSCI, Thomas Reuters Datastream
12-month-forward PE
5
10
15
20
25
30
35
00 02 04 06 08 10 12
MSCI ACWI Household & Personal Products
Source: HSBC, IBES, MSCI, Thomson Reuters Datastream
Trailing EPS versus trend
0
2
4
6
8
10
00 02 04 06 08 10 12
Household & Personal Products Trend
Source: HSBC, MSCI, Thomson Reuters Datastream
32
Global Equity Research Multi-sector July 2012
abc
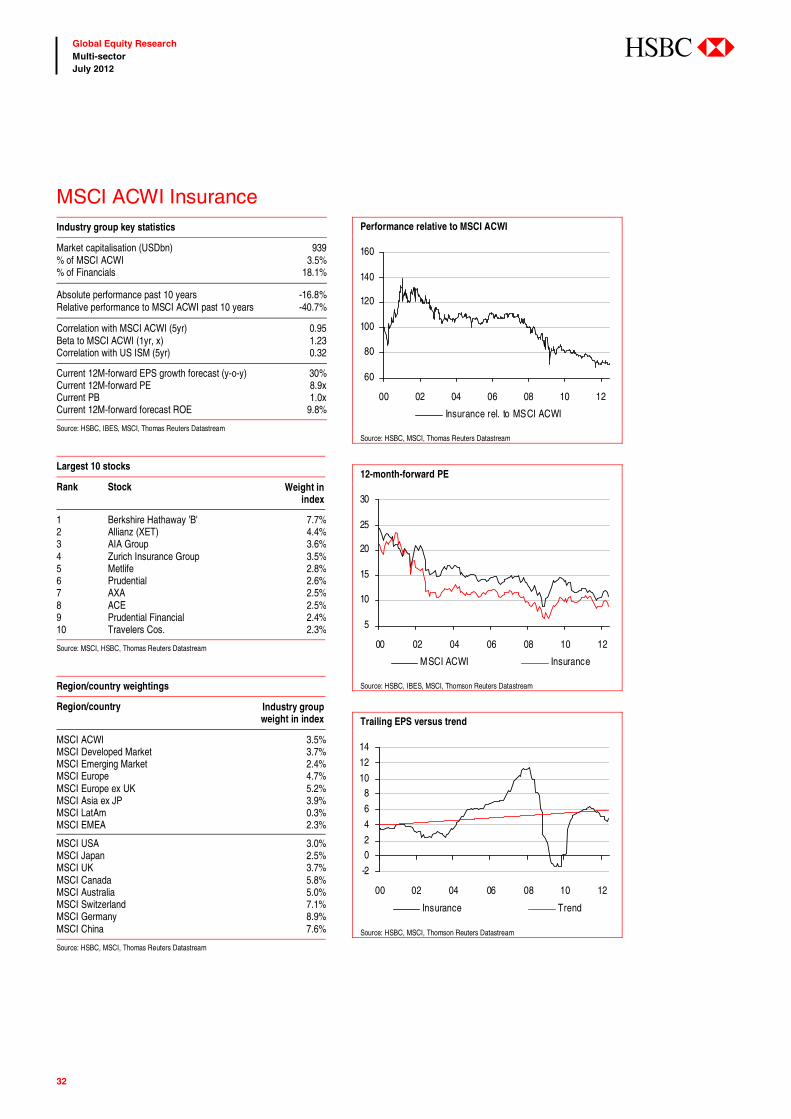
MSCI ACWI InsuranceIndustry group key statistics
Market capitalisation (USDbn) 939 % of MSCI ACWI 3.5% % of Financials 18.1%
Absolute performance past 10 years -16.8% Relative performance to MSCI ACWI past 10 years -40.7%
Correlation with MSCI ACWI (5yr) 0.95 Beta to MSCI ACWI (1yr, x) 1.23 Correlation with US ISM (5yr) 0.32
Current 12M-forward EPS growth forecast (y-o-y) 30% Current 12M-forward PE 8.9x Current PB 1.0x Current 12M-forward forecast ROE 9.8%
Source: HSBC, IBES, MSCI, Thomas Reuters Datastream
Largest 10 stocks
Rank Stock Weight in index
1 Berkshire Hathaway 'B' 7.7%2 Allianz (XET) 4.4%3 AIA Group 3.6%4 Zurich Insurance Group 3.5%5 Metlife 2.8%6 Prudential 2.6%7 AXA 2.5%8 ACE 2.5%9 Prudential Financial 2.4%10 Travelers Cos. 2.3%
Source: MSCI, HSBC, Thomas Reuters Datastream
Region/country weightings
Region/country Industry group weight in index
MSCI ACWI 3.5% MSCI Developed Market 3.7% MSCI Emerging Market 2.4% MSCI Europe 4.7% MSCI Europe ex UK 5.2% MSCI Asia ex JP 3.9% MSCI LatAm 0.3% MSCI EMEA 2.3%
MSCI USA 3.0% MSCI Japan 2.5% MSCI UK 3.7% MSCI Canada 5.8% MSCI Australia 5.0% MSCI Switzerland 7.1% MSCI Germany 8.9% MSCI China 7.6%
Source: HSBC, MSCI, Thomas Reuters Datastream
Performance relative to MSCI ACWI
60
80
100
120
140
160
00 02 04 06 08 10 12
Insurance rel. to MSCI ACWI
Source: HSBC, MSCI, Thomas Reuters Datastream
12-month-forward PE
5
10
15
20
25
30
00 02 04 06 08 10 12
MSCI ACWI Insurance
Source: HSBC, IBES, MSCI, Thomson Reuters Datastream
Trailing EPS versus trend
-2
02
4
6
810
12
14
00 02 04 06 08 10 12
Insurance Trend
Source: HSBC, MSCI, Thomson Reuters Datastream
33
Global Equity Research Multi-sector July 2012
abc
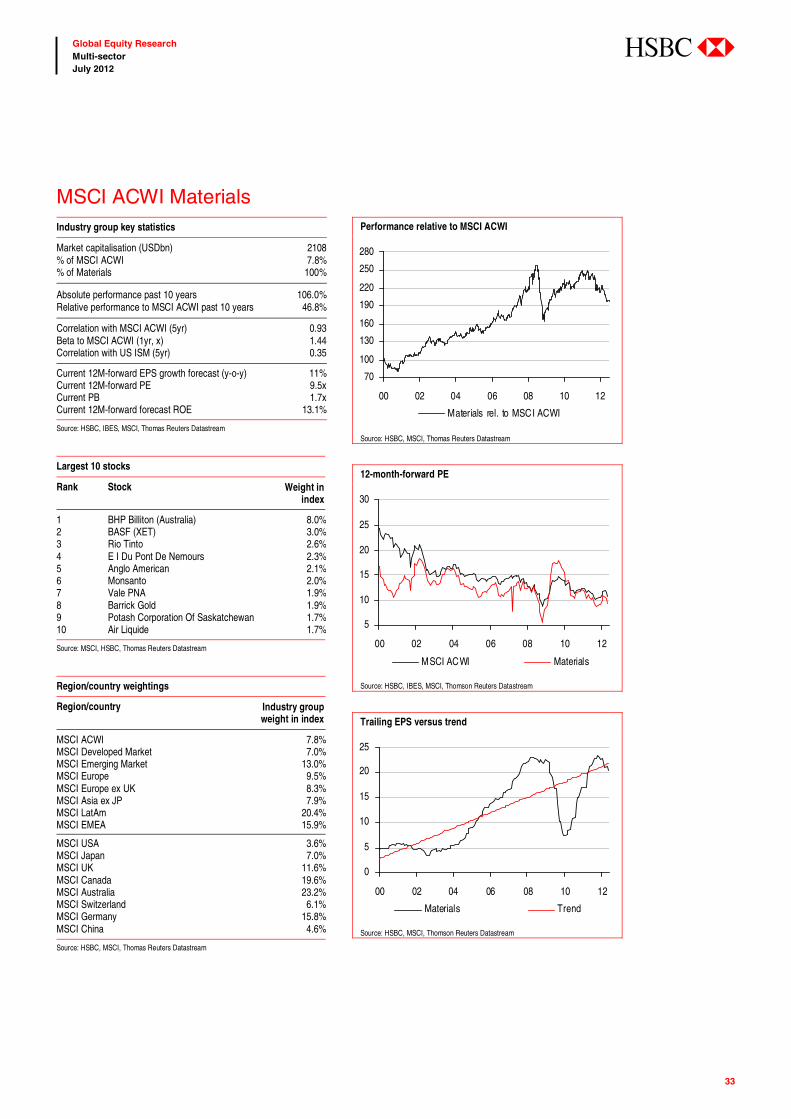
MSCI ACWI MaterialsIndustry group key statistics
Market capitalisation (USDbn) 2108 % of MSCI ACWI 7.8% % of Materials 100%
Absolute performance past 10 years 106.0% Relative performance to MSCI ACWI past 10 years 46.8%
Correlation with MSCI ACWI (5yr) 0.93 Beta to MSCI ACWI (1yr, x) 1.44 Correlation with US ISM (5yr) 0.35
Current 12M-forward EPS growth forecast (y-o-y) 11% Current 12M-forward PE 9.5x Current PB 1.7x Current 12M-forward forecast ROE 13.1%
Source: HSBC, IBES, MSCI, Thomas Reuters Datastream
Largest 10 stocks
Rank Stock Weight in index
1 BHP Billiton (Australia) 8.0%2 BASF (XET) 3.0%3 Rio Tinto 2.6%4 E I Du Pont De Nemours 2.3%5 Anglo American 2.1%6 Monsanto 2.0%7 Vale PNA 1.9%8 Barrick Gold 1.9%9 Potash Corporation Of Saskatchewan 1.7%10 Air Liquide 1.7%
Source: MSCI, HSBC, Thomas Reuters Datastream
Region/country weightings
Region/country Industry group weight in index
MSCI ACWI 7.8% MSCI Developed Market 7.0% MSCI Emerging Market 13.0% MSCI Europe 9.5% MSCI Europe ex UK 8.3% MSCI Asia ex JP 7.9% MSCI LatAm 20.4% MSCI EMEA 15.9%
MSCI USA 3.6% MSCI Japan 7.0% MSCI UK 11.6% MSCI Canada 19.6% MSCI Australia 23.2% MSCI Switzerland 6.1% MSCI Germany 15.8% MSCI China 4.6%
Source: HSBC, MSCI, Thomas Reuters Datastream
Performance relative to MSCI ACWI
70
100
130
160
190
220
250
280
00 02 04 06 08 10 12
Materials rel. to MSCI ACWI
Source: HSBC, MSCI, Thomas Reuters Datastream
12-month-forward PE
5
10
15
20
25
30
00 02 04 06 08 10 12
MSCI ACWI Materials
Source: HSBC, IBES, MSCI, Thomson Reuters Datastream
Trailing EPS versus trend
0
5
10
15
20
25
00 02 04 06 08 10 12
Materials Trend
Source: HSBC, MSCI, Thomson Reuters Datastream
34
Global Equity Research Multi-sector July 2012
abc
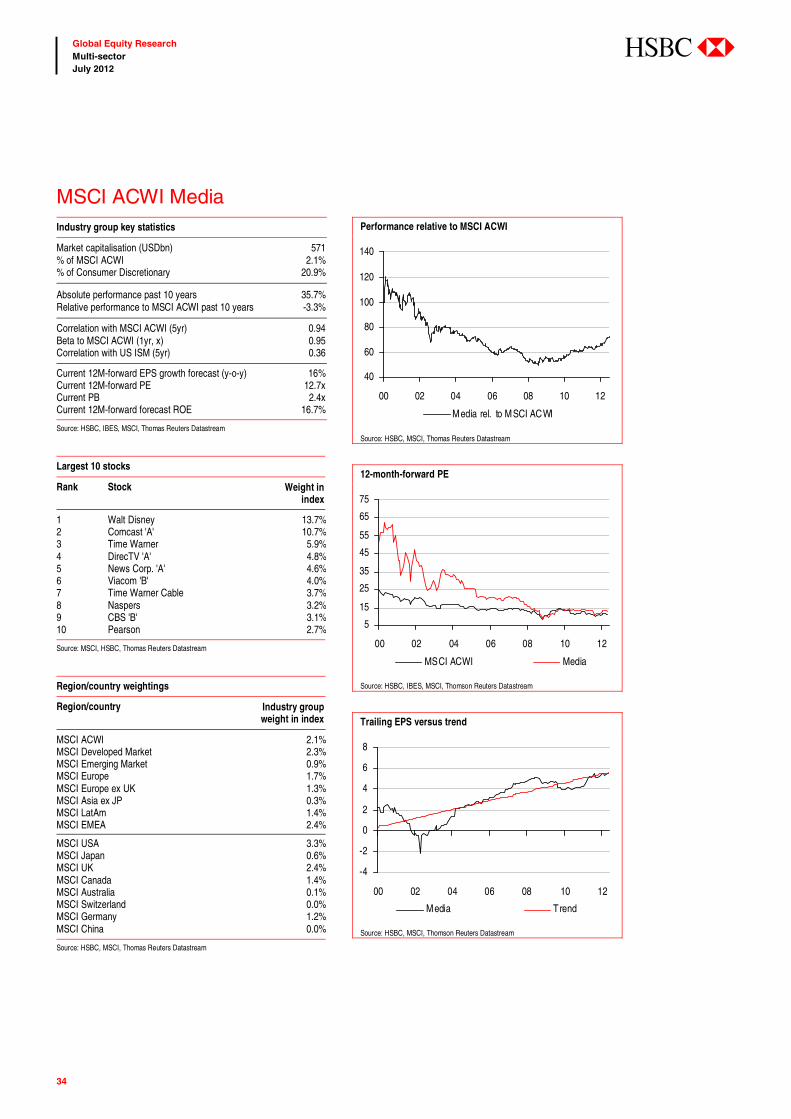
MSCI ACWI MediaIndustry group key statistics
Market capitalisation (USDbn) 571 % of MSCI ACWI 2.1% % of Consumer Discretionary 20.9%
Absolute performance past 10 years 35.7% Relative performance to MSCI ACWI past 10 years -3.3%
Correlation with MSCI ACWI (5yr) 0.94 Beta to MSCI ACWI (1yr, x) 0.95 Correlation with US ISM (5yr) 0.36
Current 12M-forward EPS growth forecast (y-o-y) 16% Current 12M-forward PE 12.7x Current PB 2.4x Current 12M-forward forecast ROE 16.7%
Source: HSBC, IBES, MSCI, Thomas Reuters Datastream
Largest 10 stocks
Rank Stock Weight in index
1 Walt Disney 13.7%2 Comcast 'A' 10.7%3 Time Warner 5.9%4 DirecTV 'A' 4.8%5 News Corp. 'A' 4.6%6 Viacom 'B' 4.0%7 Time Warner Cable 3.7%8 Naspers 3.2%9 CBS 'B' 3.1%10 Pearson 2.7%
Source: MSCI, HSBC, Thomas Reuters Datastream
Region/country weightings
Region/country Industry group weight in index
MSCI ACWI 2.1% MSCI Developed Market 2.3% MSCI Emerging Market 0.9% MSCI Europe 1.7% MSCI Europe ex UK 1.3% MSCI Asia ex JP 0.3% MSCI LatAm 1.4% MSCI EMEA 2.4%
MSCI USA 3.3% MSCI Japan 0.6% MSCI UK 2.4% MSCI Canada 1.4% MSCI Australia 0.1% MSCI Switzerland 0.0% MSCI Germany 1.2% MSCI China 0.0%
Source: HSBC, MSCI, Thomas Reuters Datastream
Performance relative to MSCI ACWI
40
60
80
100
120
140
00 02 04 06 08 10 12
Media rel. to MSCI ACWI
Source: HSBC, MSCI, Thomas Reuters Datastream
12-month-forward PE
5
15
25
35
45
55
65
75
00 02 04 06 08 10 12
MSCI ACWI Media
Source: HSBC, IBES, MSCI, Thomson Reuters Datastream
Trailing EPS versus trend
-4
-2
0
2
4
6
8
00 02 04 06 08 10 12
Media Trend
Source: HSBC, MSCI, Thomson Reuters Datastream
35
Global Equity Research Multi-sector July 2012
abc
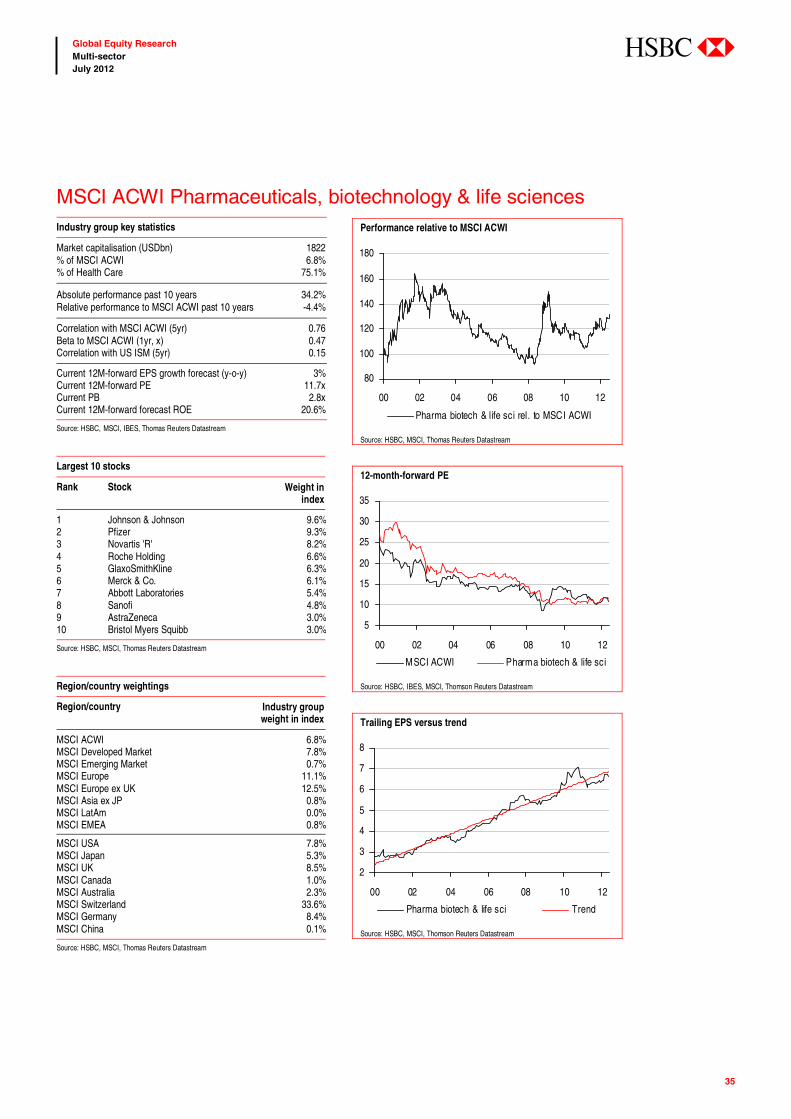
MSCI ACWI Pharmaceuticals, biotechnology & life sciencesIndustry group key statistics
Market capitalisation (USDbn) 1822 % of MSCI ACWI 6.8% % of Health Care 75.1%
Absolute performance past 10 years 34.2% Relative performance to MSCI ACWI past 10 years -4.4%
Correlation with MSCI ACWI (5yr) 0.76 Beta to MSCI ACWI (1yr, x) 0.47 Correlation with US ISM (5yr) 0.15
Current 12M-forward EPS growth forecast (y-o-y) 3% Current 12M-forward PE 11.7x Current PB 2.8x Current 12M-forward forecast ROE 20.6%
Source: HSBC, MSCI, IBES, Thomas Reuters Datastream
Largest 10 stocks
Rank Stock Weight in index
1 Johnson & Johnson 9.6%2 Pfizer 9.3%3 Novartis 'R' 8.2%4 Roche Holding 6.6%5 GlaxoSmithKline 6.3%6 Merck & Co. 6.1%7 Abbott Laboratories 5.4%8 Sanofi 4.8%9 AstraZeneca 3.0%10 Bristol Myers Squibb 3.0%
Source: HSBC, MSCI, Thomas Reuters Datastream
Region/country weightings
Region/country Industry group weight in index
MSCI ACWI 6.8% MSCI Developed Market 7.8% MSCI Emerging Market 0.7% MSCI Europe 11.1% MSCI Europe ex UK 12.5% MSCI Asia ex JP 0.8% MSCI LatAm 0.0% MSCI EMEA 0.8%
MSCI USA 7.8% MSCI Japan 5.3% MSCI UK 8.5% MSCI Canada 1.0% MSCI Australia 2.3% MSCI Switzerland 33.6% MSCI Germany 8.4% MSCI China 0.1%
Source: HSBC, MSCI, Thomas Reuters Datastream
Performance relative to MSCI ACWI
80
100
120
140
160
180
00 02 04 06 08 10 12
Pharma biotech & life sci rel. to MSCI ACWI
Source: HSBC, MSCI, Thomas Reuters Datastream
12-month-forward PE
5
10
15
20
25
30
35
00 02 04 06 08 10 12
MSCI ACWI Pharma biotech & life sci
Source: HSBC, IBES, MSCI, Thomson Reuters Datastream
Trailing EPS versus trend
2
3
4
5
6
7
8
00 02 04 06 08 10 12
Pharma biotech & life sci Trend
Source: HSBC, MSCI, Thomson Reuters Datastream
36
Global Equity Research Multi-sector July 2012
abc
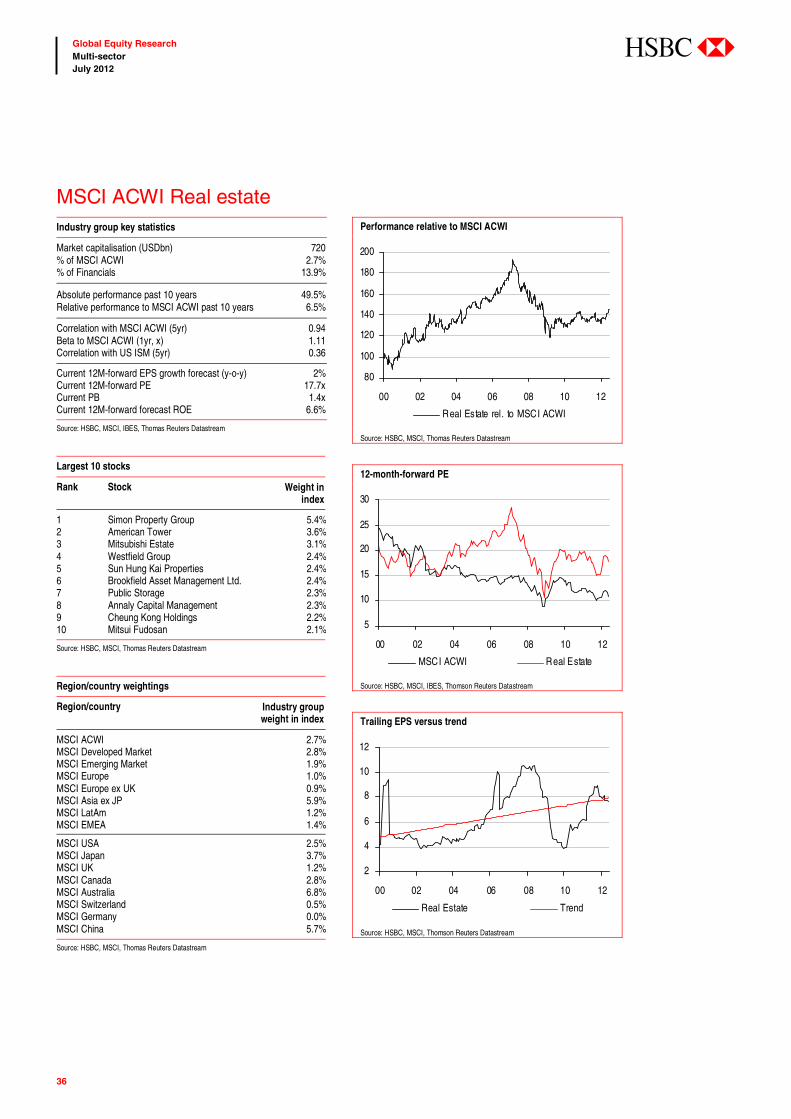
MSCI ACWI Real estateIndustry group key statistics
Market capitalisation (USDbn) 720 % of MSCI ACWI 2.7% % of Financials 13.9%
Absolute performance past 10 years 49.5% Relative performance to MSCI ACWI past 10 years 6.5%
Correlation with MSCI ACWI (5yr) 0.94 Beta to MSCI ACWI (1yr, x) 1.11 Correlation with US ISM (5yr) 0.36
Current 12M-forward EPS growth forecast (y-o-y) 2% Current 12M-forward PE 17.7x Current PB 1.4x Current 12M-forward forecast ROE 6.6%
Source: HSBC, MSCI, IBES, Thomas Reuters Datastream
Largest 10 stocks
Rank Stock Weight in index
1 Simon Property Group 5.4%2 American Tower 3.6%3 Mitsubishi Estate 3.1%4 Westfield Group 2.4%5 Sun Hung Kai Properties 2.4%6 Brookfield Asset Management Ltd. 2.4%7 Public Storage 2.3%8 Annaly Capital Management 2.3%9 Cheung Kong Holdings 2.2%10 Mitsui Fudosan 2.1%
Source: HSBC, MSCI, Thomas Reuters Datastream
Region/country weightings
Region/country Industry group weight in index
MSCI ACWI 2.7% MSCI Developed Market 2.8% MSCI Emerging Market 1.9% MSCI Europe 1.0% MSCI Europe ex UK 0.9% MSCI Asia ex JP 5.9% MSCI LatAm 1.2% MSCI EMEA 1.4%
MSCI USA 2.5% MSCI Japan 3.7% MSCI UK 1.2% MSCI Canada 2.8% MSCI Australia 6.8% MSCI Switzerland 0.5% MSCI Germany 0.0% MSCI China 5.7%
Source: HSBC, MSCI, Thomas Reuters Datastream
Performance relative to MSCI ACWI
80
100
120
140
160
180
200
00 02 04 06 08 10 12
Real Estate rel. to MSCI ACWI
Source: HSBC, MSCI, Thomas Reuters Datastream
12-month-forward PE
5
10
15
20
25
30
00 02 04 06 08 10 12
MSCI ACWI Real Estate
Source: HSBC, MSCI, IBES, Thomson Reuters Datastream
Trailing EPS versus trend
2
4
6
8
10
12
00 02 04 06 08 10 12
Real Estate Trend
Source: HSBC, MSCI, Thomson Reuters Datastream
37
Global Equity Research Multi-sector July 2012
abc
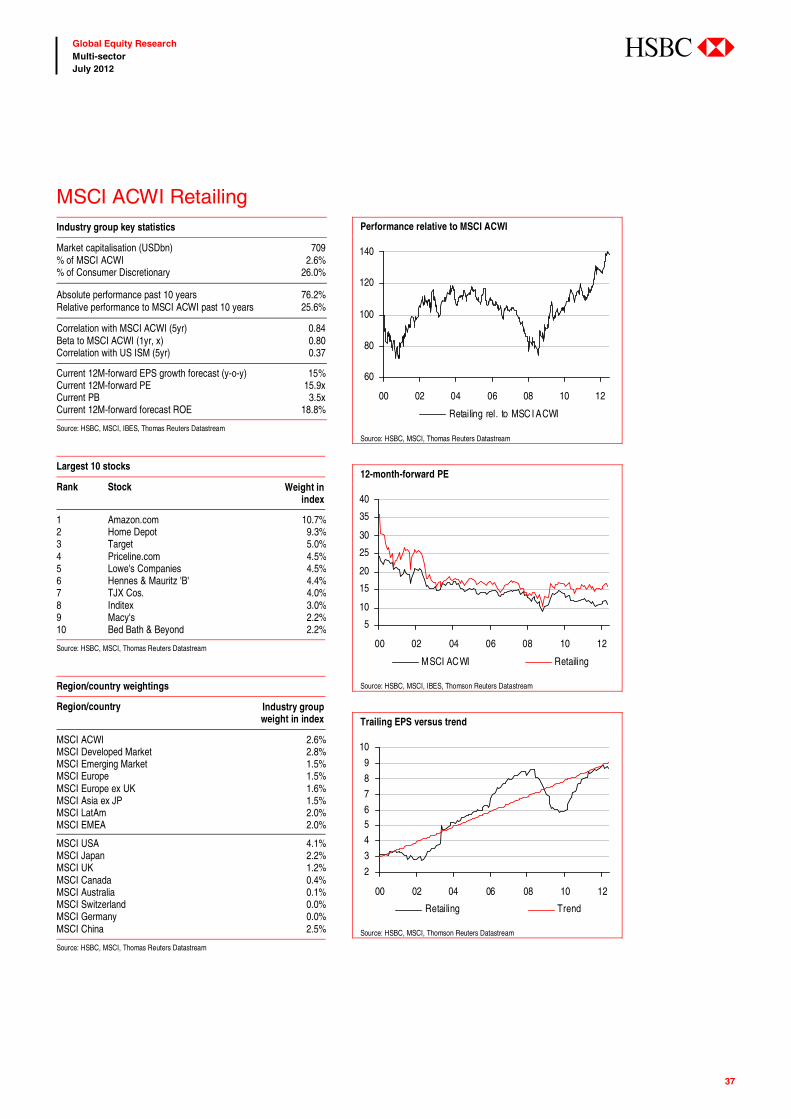
MSCI ACWI RetailingIndustry group key statistics
Market capitalisation (USDbn) 709 % of MSCI ACWI 2.6% % of Consumer Discretionary 26.0%
Absolute performance past 10 years 76.2% Relative performance to MSCI ACWI past 10 years 25.6%
Correlation with MSCI ACWI (5yr) 0.84 Beta to MSCI ACWI (1yr, x) 0.80 Correlation with US ISM (5yr) 0.37
Current 12M-forward EPS growth forecast (y-o-y) 15% Current 12M-forward PE 15.9x Current PB 3.5x Current 12M-forward forecast ROE 18.8%
Source: HSBC, MSCI, IBES, Thomas Reuters Datastream
Largest 10 stocks
Rank Stock Weight in index
1 Amazon.com 10.7%2 Home Depot 9.3%3 Target 5.0%4 Priceline.com 4.5%5 Lowe's Companies 4.5%6 Hennes & Mauritz 'B' 4.4%7 TJX Cos. 4.0%8 Inditex 3.0%9 Macy's 2.2%10 Bed Bath & Beyond 2.2%
Source: HSBC, MSCI, Thomas Reuters Datastream
Region/country weightings
Region/country Industry group weight in index
MSCI ACWI 2.6% MSCI Developed Market 2.8% MSCI Emerging Market 1.5% MSCI Europe 1.5% MSCI Europe ex UK 1.6% MSCI Asia ex JP 1.5% MSCI LatAm 2.0% MSCI EMEA 2.0%
MSCI USA 4.1% MSCI Japan 2.2% MSCI UK 1.2% MSCI Canada 0.4% MSCI Australia 0.1% MSCI Switzerland 0.0% MSCI Germany 0.0% MSCI China 2.5%
Source: HSBC, MSCI, Thomas Reuters Datastream
Performance relative to MSCI ACWI
60
80
100
120
140
00 02 04 06 08 10 12
Retailing rel. to MSC I ACWI
Source: HSBC, MSCI, Thomas Reuters Datastream
12-month-forward PE
5
10
15
20
25
30
35
40
00 02 04 06 08 10 12
MSCI ACWI Retailing
Source: HSBC, MSCI, IBES, Thomson Reuters Datastream
Trailing EPS versus trend
2
3
4
56
7
8
9
10
00 02 04 06 08 10 12
Retailing Trend
Source: HSBC, MSCI, Thomson Reuters Datastream
38
Global Equity Research Multi-sector July 2012
abc
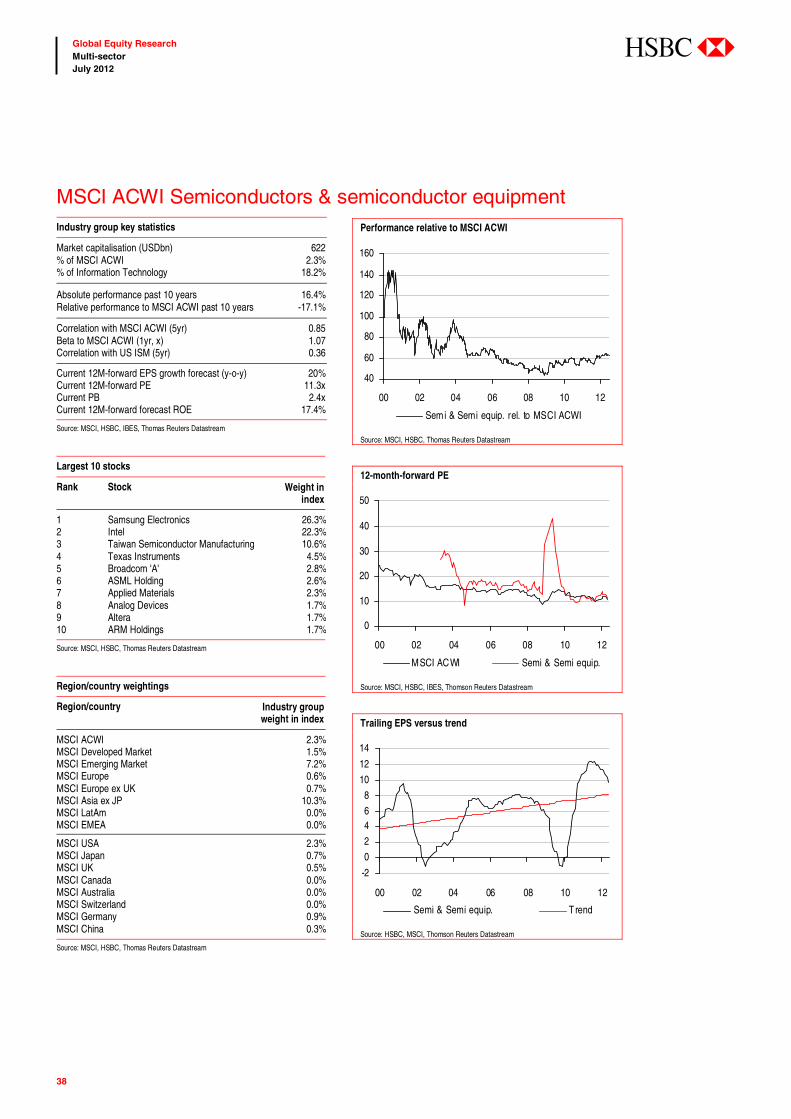
MSCI ACWI Semiconductors & semiconductor equipmentIndustry group key statistics
Market capitalisation (USDbn) 622 % of MSCI ACWI 2.3% % of Information Technology 18.2%
Absolute performance past 10 years 16.4% Relative performance to MSCI ACWI past 10 years -17.1%
Correlation with MSCI ACWI (5yr) 0.85 Beta to MSCI ACWI (1yr, x) 1.07 Correlation with US ISM (5yr) 0.36
Current 12M-forward EPS growth forecast (y-o-y) 20% Current 12M-forward PE 11.3x Current PB 2.4x Current 12M-forward forecast ROE 17.4%
Source: MSCI, HSBC, IBES, Thomas Reuters Datastream
Largest 10 stocks
Rank Stock Weight in index
1 Samsung Electronics 26.3%2 Intel 22.3%3 Taiwan Semiconductor Manufacturing 10.6%4 Texas Instruments 4.5%5 Broadcom 'A' 2.8%6 ASML Holding 2.6%7 Applied Materials 2.3%8 Analog Devices 1.7%9 Altera 1.7%10 ARM Holdings 1.7%
Source: MSCI, HSBC, Thomas Reuters Datastream
Region/country weightings
Region/country Industry group weight in index
MSCI ACWI 2.3% MSCI Developed Market 1.5% MSCI Emerging Market 7.2% MSCI Europe 0.6% MSCI Europe ex UK 0.7% MSCI Asia ex JP 10.3% MSCI LatAm 0.0% MSCI EMEA 0.0%
MSCI USA 2.3% MSCI Japan 0.7% MSCI UK 0.5% MSCI Canada 0.0% MSCI Australia 0.0% MSCI Switzerland 0.0% MSCI Germany 0.9% MSCI China 0.3%
Source: MSCI, HSBC, Thomas Reuters Datastream
Performance relative to MSCI ACWI
40
60
80
100
120
140
160
00 02 04 06 08 10 12
Semi & Semi equip. rel. to MSCI ACWI
Source: MSCI, HSBC, Thomas Reuters Datastream
12-month-forward PE
0
10
20
30
40
50
00 02 04 06 08 10 12
MSCI ACWI Semi & Semi equip.
Source: MSCI, HSBC, IBES, Thomson Reuters Datastream
Trailing EPS versus trend
-2
0
2
46
8
10
12
14
00 02 04 06 08 10 12
Semi & Semi equip. Trend
Source: HSBC, MSCI, Thomson Reuters Datastream
39
Global Equity Research Multi-sector July 2012
abc
MSCI ACWI Software & servicesIndustry group key statistics
Market capitalisation (USDbn) 1442 % of MSCI ACWI 5.4% % of Information Technology 42.2%
Absolute performance past 10 years 83.0% Relative performance to MSCI ACWI past 10 years 30.4%
Correlation with MSCI ACWI (5yr) 0.92 Beta to MSCI ACWI (1yr, x) 0.86 Correlation with US ISM (5yr) 0.35
Current 12M-forward EPS growth forecast (y-o-y) 13% Current 12M-forward PE 13.2x Current PB 4.3x Current 12M-forward forecast ROE 24.0%
Source: MSCI, HSBC, IBES, Thomas Reuters Datastream
Largest 10 stocks
Rank Stock Weight in index
1 Microsoft 16.8%2 International Business Machines 14.2%3 Google 'A' 10.0%4 Oracle 7.5%5 Visa 'A' 4.4%6 SAP (XET) 3.7%7 eBay 3.5%8 Mastercard 3.0%9 Accenture 2.5%10 Tencent Holdings 2.2%
Source: MSCI, HSBC, Thomas Reuters Datastream
Region/country weightings
Region/country Industry group weight in index
MSCI ACWI 5.4% MSCI Developed Market 5.8% MSCI Emerging Market 2.8% MSCI Europe 1.3% MSCI Europe ex UK 2.0% MSCI Asia ex JP 3.3% MSCI LatAm 2.2% MSCI EMEA 0.1%
MSCI USA 9.9% MSCI Japan 1.8% MSCI UK 0.2% MSCI Canada 0.6% MSCI Australia 0.5% MSCI Switzerland 0.0% MSCI Germany 7.3% MSCI China 5.4%
Source: MSCI, HSBC, Thomas Reuters Datastream
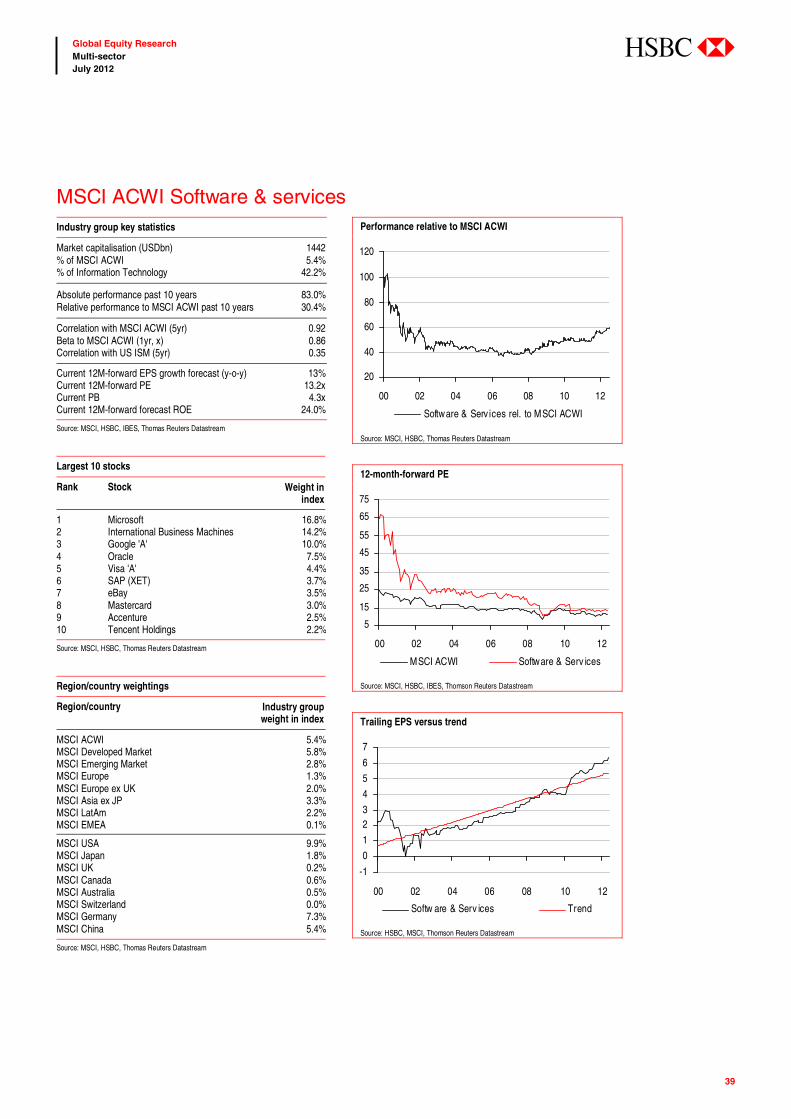
Performance relative to MSCI ACWI
20
40
60
80
100
120
00 02 04 06 08 10 12
Software & Serv ices rel. to MSCI ACWI
Source: MSCI, HSBC, Thomas Reuters Datastream
12-month-forward PE
5
15
25
35
45
55
65
75
00 02 04 06 08 10 12
MSCI ACWI Software & Serv ices
Source: MSCI, HSBC, IBES, Thomson Reuters Datastream
Trailing EPS versus trend
-1
0
1
23
4
5
6
7
00 02 04 06 08 10 12
Softw are & Serv ices Trend
Source: HSBC, MSCI, Thomson Reuters Datastream
40
Global Equity Research Multi-sector July 2012
abc
MSCI ACWI Technology hardware & equipmentIndustry group key statistics
Market capitalisation (USDbn) 1353 % of MSCI ACWI 5.0% % of Information Technology 39.6%
Absolute performance past 10 years 62.2% Relative performance to MSCI ACWI past 10 years 15.6%
Correlation with MSCI ACWI (5yr) 0.93 Beta to MSCI ACWI (1yr, x) 1.03 Correlation with US ISM (5yr) 0.37
Current 12M-forward EPS growth forecast (y-o-y) 18% Current 12M-forward PE 10.5x Current PB 2.3x Current 12M-forward forecast ROE 16.9%
Source: MSCI, HSBC, IBES, Thomas Reuters Datastream
Largest 10 stocks
Rank Stock Weight in index
1 Apple 38.6%2 Qualcomm 7.2%3 Cisco Systems 6.8%4 Canon 4.0%5 EMC 4.0%6 Hewlett-Packard 2.6%7 Ericsson 'B' 2.1%8 Hitachi 2.1%9 Hon Hai Precision Industry 2.0%10 Corning 1.5%
Source: MSCI, HSBC, Thomas Reuters Datastream
Region/country weightings
Region/country Industry group weight in index
MSCI ACWI 5.0% MSCI Developed Market 5.3% MSCI Emerging Market 3.2% MSCI Europe 0.9% MSCI Europe ex UK 1.3% MSCI Asia ex JP 4.6% MSCI LatAm 0.0% MSCI EMEA 0.0%
MSCI USA 7.9% MSCI Japan 9.4% MSCI UK 0.0% MSCI Canada 0.4% MSCI Australia 0.0% MSCI Switzerland 0.0% MSCI Germany 0.0% MSCI China 1.3%
Source: MSCI, HSBC, Thomas Reuters Datastream
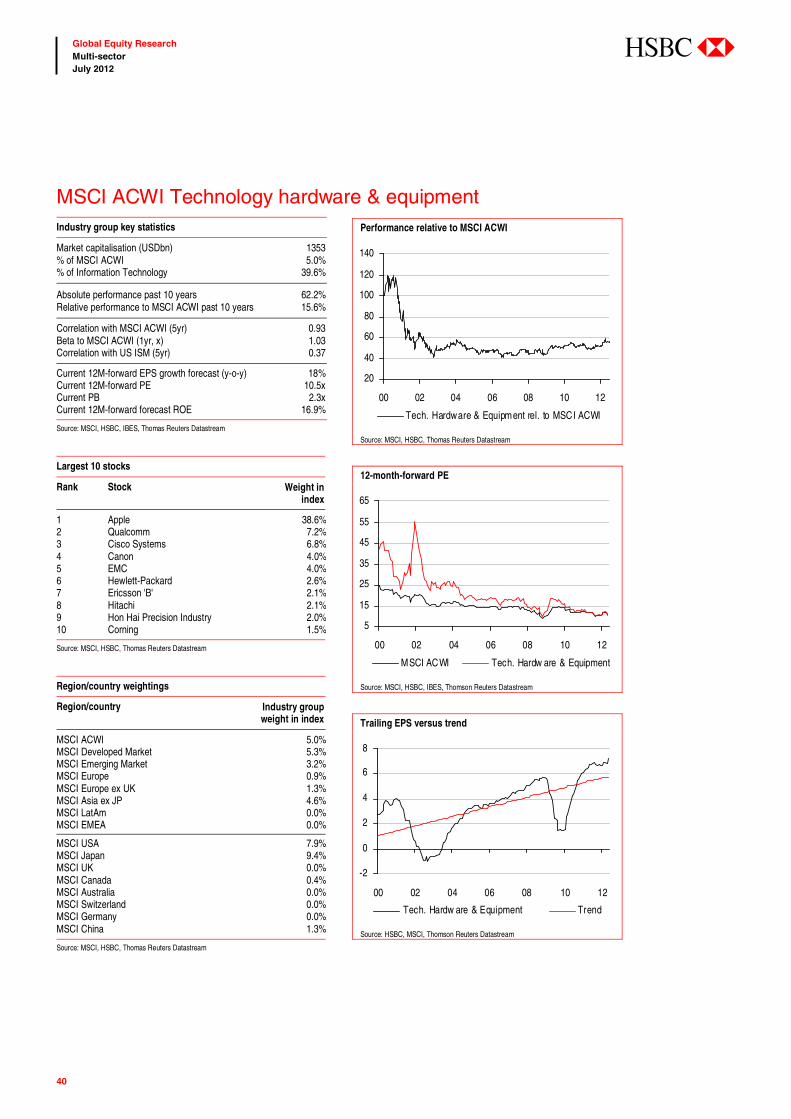
Performance relative to MSCI ACWI
20
40
60
80
100
120
140
00 02 04 06 08 10 12
Tech. Hardware & Equipment rel. to MSCI ACWI
Source: MSCI, HSBC, Thomas Reuters Datastream
12-month-forward PE
5
15
25
35
45
55
65
00 02 04 06 08 10 12
MSCI ACWI Tech. Hardw are & Equipment
Source: MSCI, HSBC, IBES, Thomson Reuters Datastream
Trailing EPS versus trend
-2
0
2
4
6
8
00 02 04 06 08 10 12
Tech. Hardw are & Equipment Trend
Source: HSBC, MSCI, Thomson Reuters Datastream
41
Global Equity Research Multi-sector July 2012
abc
MSCI ACWI Telecommunication servicesIndustry group key statistics
Market capitalisation (USDbn) 1349 % of MSCI ACWI 5.0% % of Telecommunication Services 100%
Absolute performance past 10 years 47.9% Relative performance to MSCI ACWI past 10 years 5.4%
Correlation with MSCI ACWI (5yr) 0.89 Beta to MSCI ACWI (1yr, x) 0.52 Correlation with US ISM (5yr) 0.22
Current 12M-forward EPS growth forecast (y-o-y) 5% Current 12M-forward PE 11.7x Current PB 1.7x Current 12M-forward forecast ROE 13.3%
Source: MSCI, HSBC, IBES, Thomas Reuters Datastream
Largest 10 stocks
Rank Stock Weight in index
1 AT&T 15.4%2 Vodafone Group 10.2%3 Verizon Communications 9.2%4 China Mobile 4.1%5 AMX 'L' 4.0%6 Telefonica 3.7%7 Telstra 3.4%8 Nippon Telegraph And Telephone 2.7%9 Deutsche Telekom (XET) 2.3%10 BCE 2.2%
Source: MSCI, HSBC, Thomas Reuters Datastream
Region/country weightings
Region/country Industry group weight in index
MSCI ACWI 5.0% MSCI Developed Market 4.5% MSCI Emerging Market 8.1% MSCI Europe 6.4% MSCI Europe ex UK 5.7% MSCI Asia ex JP 6.5% MSCI LatAm 9.2% MSCI EMEA 10.6%
MSCI USA 3.3% MSCI Japan 4.8% MSCI UK 7.6% MSCI Canada 5.5% MSCI Australia 5.4% MSCI Switzerland 1.1% MSCI Germany 4.1% MSCI China 11.5%
Source: MSCI, HSBC, Thomas Reuters Datastream
Performance relative to MSCI ACWI
40
60
80
100
120
00 02 04 06 08 10 12
Telecom Serv ices rel. to MSCI ACWI
Source: MSCI, HSBC, Thomas Reuters Datastream
12-month-forward PE
5
15
25
35
45
55
00 02 04 06 08 10 12
MSCI ACWI Telecom Serv ices
Source: MSCI, HSBC, IBES, Thomson Reuters Datastream
Trailing EPS versus trend
-2-101234567
00 02 04 06 08 10 12
Telecom Serv ices Trend
Source: HSBC, MSCI, Thomson Reuters Datastream
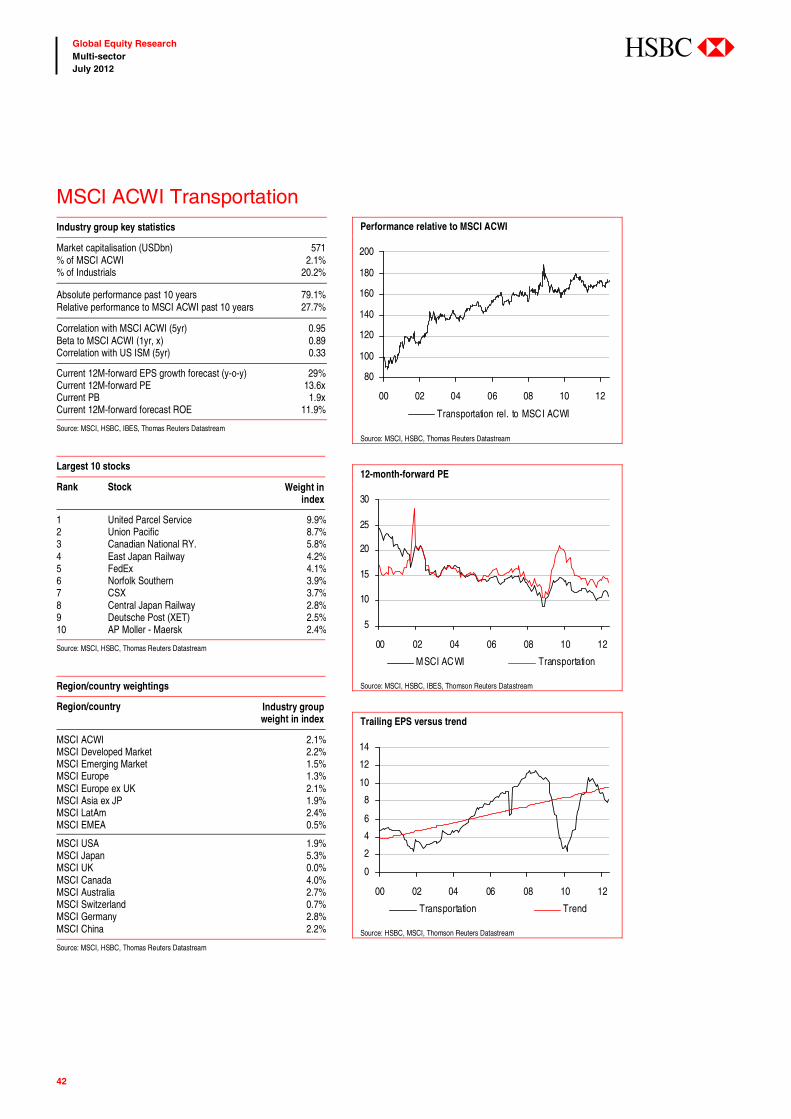
42
Global Equity Research Multi-sector July 2012
abc
MSCI ACWI TransportationIndustry group key statistics
Market capitalisation (USDbn) 571 % of MSCI ACWI 2.1% % of Industrials 20.2%
Absolute performance past 10 years 79.1% Relative performance to MSCI ACWI past 10 years 27.7%
Correlation with MSCI ACWI (5yr) 0.95 Beta to MSCI ACWI (1yr, x) 0.89 Correlation with US ISM (5yr) 0.33
Current 12M-forward EPS growth forecast (y-o-y) 29% Current 12M-forward PE 13.6x Current PB 1.9x Current 12M-forward forecast ROE 11.9%
Source: MSCI, HSBC, IBES, Thomas Reuters Datastream
Largest 10 stocks
Rank Stock Weight in index
1 United Parcel Service 9.9%2 Union Pacific 8.7%3 Canadian National RY. 5.8%4 East Japan Railway 4.2%5 FedEx 4.1%6 Norfolk Southern 3.9%7 CSX 3.7%8 Central Japan Railway 2.8%9 Deutsche Post (XET) 2.5%10 AP Moller - Maersk 2.4%
Source: MSCI, HSBC, Thomas Reuters Datastream
Region/country weightings
Region/country Industry group weight in index
MSCI ACWI 2.1% MSCI Developed Market 2.2% MSCI Emerging Market 1.5% MSCI Europe 1.3% MSCI Europe ex UK 2.1% MSCI Asia ex JP 1.9% MSCI LatAm 2.4% MSCI EMEA 0.5%
MSCI USA 1.9% MSCI Japan 5.3% MSCI UK 0.0% MSCI Canada 4.0% MSCI Australia 2.7% MSCI Switzerland 0.7% MSCI Germany 2.8% MSCI China 2.2%
Source: MSCI, HSBC, Thomas Reuters Datastream
Performance relative to MSCI ACWI
80
100
120
140
160
180
200
00 02 04 06 08 10 12
Transportation rel. to MSCI ACWI
Source: MSCI, HSBC, Thomas Reuters Datastream
12-month-forward PE
5
10
15
20
25
30
00 02 04 06 08 10 12
MSCI ACWI Transportation
Source: MSCI, HSBC, IBES, Thomson Reuters Datastream
Trailing EPS versus trend
0
2
4
6
8
10
12
14
00 02 04 06 08 10 12
Transportation Trend
Source: HSBC, MSCI, Thomson Reuters Datastream
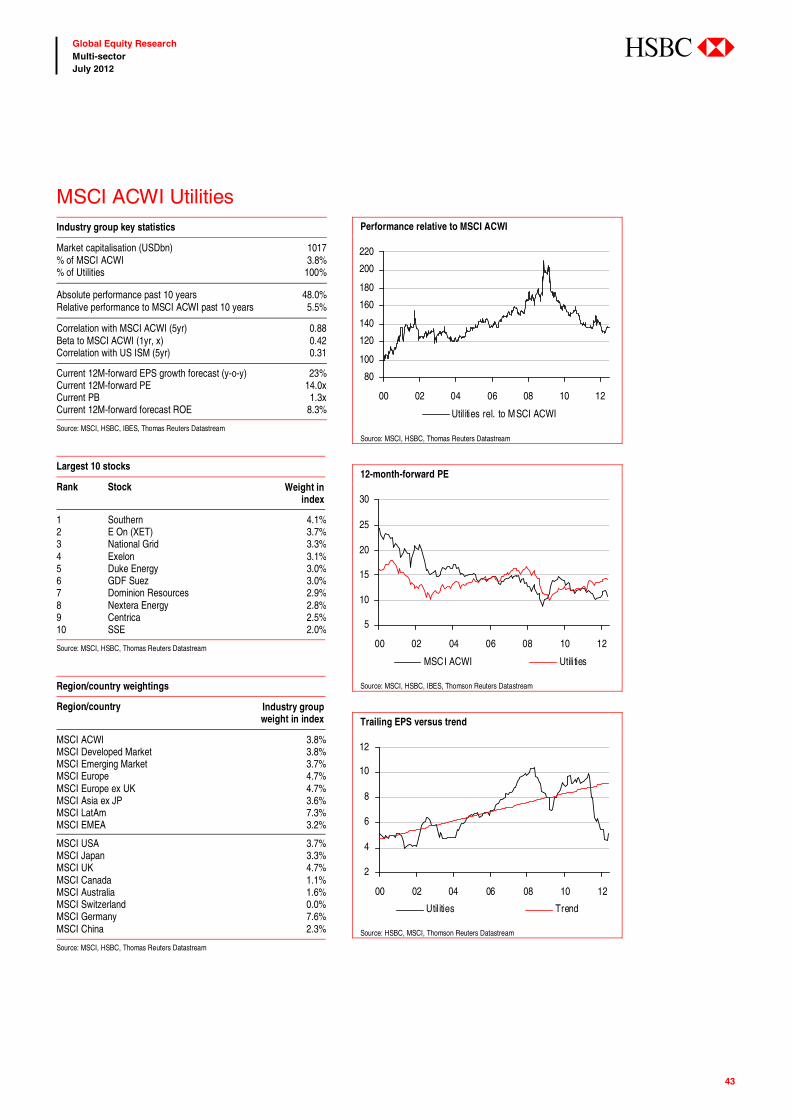
43
Global Equity Research Multi-sector July 2012
abc
MSCI ACWI UtilitiesIndustry group key statistics
Market capitalisation (USDbn) 1017 % of MSCI ACWI 3.8% % of Utilities 100%
Absolute performance past 10 years 48.0% Relative performance to MSCI ACWI past 10 years 5.5%
Correlation with MSCI ACWI (5yr) 0.88 Beta to MSCI ACWI (1yr, x) 0.42 Correlation with US ISM (5yr) 0.31
Current 12M-forward EPS growth forecast (y-o-y) 23% Current 12M-forward PE 14.0x Current PB 1.3x Current 12M-forward forecast ROE 8.3%
Source: MSCI, HSBC, IBES, Thomas Reuters Datastream
Largest 10 stocks
Rank Stock Weight in index
1 Southern 4.1%2 E On (XET) 3.7%3 National Grid 3.3%4 Exelon 3.1%5 Duke Energy 3.0%6 GDF Suez 3.0%7 Dominion Resources 2.9%8 Nextera Energy 2.8%9 Centrica 2.5%10 SSE 2.0%
Source: MSCI, HSBC, Thomas Reuters Datastream
Region/country weightings
Region/country Industry group weight in index
MSCI ACWI 3.8% MSCI Developed Market 3.8% MSCI Emerging Market 3.7% MSCI Europe 4.7% MSCI Europe ex UK 4.7% MSCI Asia ex JP 3.6% MSCI LatAm 7.3% MSCI EMEA 3.2%
MSCI USA 3.7% MSCI Japan 3.3% MSCI UK 4.7% MSCI Canada 1.1% MSCI Australia 1.6% MSCI Switzerland 0.0% MSCI Germany 7.6% MSCI China 2.3%
Source: MSCI, HSBC, Thomas Reuters Datastream
Performance relative to MSCI ACWI
80
100
120
140
160
180
200
220
00 02 04 06 08 10 12
Utilities rel. to MSCI ACWI
Source: MSCI, HSBC, Thomas Reuters Datastream
12-month-forward PE
5
10
15
20
25
30
00 02 04 06 08 10 12
MSCI ACWI Utilities
Source: MSCI, HSBC, IBES, Thomson Reuters Datastream
Trailing EPS versus trend
2
4
6
8
10
12
00 02 04 06 08 10 12
Utilities Trend
Source: HSBC, MSCI, Thomson Reuters Datastream

44
Global Equity Research Multi-sector July 2012
abc
Notes

45
Global Equity Research Multi-sector July 2012
abc
Notes
46
Global Equity Research Multi-sector July 2012
abc
Disclosure appendix Analyst Certification The following analyst(s), economist(s), and/or strategist(s) who is(are) primarily responsible for this report, certifies(y) that the opinion(s) on the subject security(ies) or issuer(s) and/or any other views or forecasts expressed herein accurately reflect their personal view(s) and that no part of their compensation was, is or will be directly or indirectly related to the specific recommendation(s) or views contained in this research report: Chris Georgs, Garry Evans.
Important disclosures
Stock ratings and basis for financial analysis HSBC believes that investors utilise various disciplines and investment horizons when making investment decisions, which depend largely on individual circumstances such as the investor's existing holdings, risk tolerance and other considerations. Given these differences, HSBC has two principal aims in its equity research: 1) to identify long-term investment opportunities based on particular themes or ideas that may affect the future earnings or cash flows of companies on a 12 month time horizon; and 2) from time to time to identify short-term investment opportunities that are derived from fundamental, quantitative, technical or event-driven techniques on a 0-3 month time horizon and which may differ from our long-term investment rating. HSBC has assigned ratings for its long-term investment opportunities as described below.
This report addresses only the long-term investment opportunities of the companies referred to in the report. As and when HSBC publishes a short-term trading idea the stocks to which these relate are identified on the website at www.hsbcnet.com/research. Details of these short-term investment opportunities can be found under the Reports section of this website.
HSBC believes an investor's decision to buy or sell a stock should depend on individual circumstances such as the investor's existing holdings and other considerations. Different securities firms use a variety of ratings terms as well as different rating systems to describe their recommendations. Investors should carefully read the definitions of the ratings used in each research report. In addition, because research reports contain more complete information concerning the analysts' views, investors should carefully read the entire research report and should not infer its contents from the rating. In any case, ratings should not be used or relied on in isolation as investment advice.
Rating definitions for long-term investment opportunities
Stock ratings HSBC assigns ratings to its stocks in this sector on the following basis:
For each stock we set a required rate of return calculated from the cost of equity for that stock’s domestic or, as appropriate, regional market established by our strategy team. The price target for a stock represents the value the analyst expects the stock to reach over our performance horizon. The performance horizon is 12 months. For a stock to be classified as Overweight, the potential return, which equals the percentage difference between the current share price and the target price, including the forecast dividend yield when indicated, must exceed the required return by at least 5 percentage points over the next 12 months (or 10 percentage points for a stock classified as Volatile*). For a stock to be classified as Underweight, the stock must be expected to underperform its required return by at least 5 percentage points over the next 12 months (or 10 percentage points for a stock classified as Volatile*). Stocks between these bands are classified as Neutral.
Our ratings are re-calibrated against these bands at the time of any 'material change' (initiation of coverage, change of volatility status or change in price target). Notwithstanding this, and although ratings are subject to ongoing management review, expected returns will be permitted to move outside the bands as a result of normal share price fluctuations without necessarily triggering a rating change.
47
Global Equity Research Multi-sector July 2012
abc
*A stock will be classified as volatile if its historical volatility has exceeded 40%, if the stock has been listed for less than 12 months (unless it is in an industry or sector where volatility is low) or if the analyst expects significant volatility. However, stocks which we do not consider volatile may in fact also behave in such a way. Historical volatility is defined as the past month's average of the daily 365-day moving average volatilities. In order to avoid misleadingly frequent changes in rating, however, volatility has to move 2.5 percentage points past the 40% benchmark in either direction for a stock's status to change.
Rating distribution for long-term investment opportunities
As of 24 July 2012, the distribution of all ratings published is as follows: Overweight (Buy) 50% (27% of these provided with Investment Banking Services)
Neutral (Hold) 37% (26% of these provided with Investment Banking Services)
Underweight (Sell) 13% (18% of these provided with Investment Banking Services)
Analysts, economists, and strategists are paid in part by reference to the profitability of HSBC which includes investment banking revenues.
For disclosures in respect of any company mentioned in this report, please see the most recently published report on that company available at www.hsbcnet.com/research.
* HSBC Legal Entities are listed in the Disclaimer below.
Additional disclosures 1 This report is dated as at 29 July 2012. 2 All market data included in this report are dated as at close 15 June 2012, unless otherwise indicated in the report. 3 HSBC has procedures in place to identify and manage any potential conflicts of interest that arise in connection with its
Research business. HSBC's analysts and its other staff who are involved in the preparation and dissemination of Research operate and have a management reporting line independent of HSBC's Investment Banking business. Information Barrier procedures are in place between the Investment Banking and Research businesses to ensure that any confidential and/or price sensitive information is handled in an appropriate manner.
MSCI Disclaimer The MSCI sourced information is the exclusive property of MSCI Inc. (MSCI). Without prior written permission of MSCI, this information and any other MSCI intellectual property may not be reproduced, redisseminated or used to create any financial products, including any indices. This information is provided on an “as is” basis. The user assumes the entire risk of any use made of this information. MSCI, its affiliates and any third party involved in, or related to, computing or compiling the information hereby expressly disclaim all warranties of originality, accuracy, completeness, merchantability or fitness for a particular purpose with respect to any of this information. Without limiting any of the foregoing, in no event shall MSCI, any of its affiliates or any third party involved in, or related to, computing or compiling the information have any liability for any damages of any kind. MSCI and MSCI indexes are service marks of MSCI and its affiliates.
48
Global Equity Research Multi-sector July 2012
abc
Disclaimer * Legal entities as at 12 June 2012 ‘UAE’ HSBC Bank Middle East Limited, Dubai; ‘HK’ The Hongkong and Shanghai Banking Corporation Limited, Hong Kong; ‘TW’ HSBC Securities (Taiwan) Corporation Limited; 'CA' HSBC Bank Canada, Toronto; HSBC Bank, Paris Branch; HSBC France; ‘DE’ HSBC Trinkaus & Burkhardt AG, Düsseldorf; 000 HSBC Bank (RR), Moscow; ‘IN’ HSBC Securities and Capital Markets (India) Private Limited, Mumbai; ‘JP’ HSBC Securities (Japan) Limited, Tokyo; ‘EG’ HSBC Securities Egypt SAE, Cairo; ‘CN’ HSBC Investment Bank Asia Limited, Beijing Representative Office; The Hongkong and Shanghai Banking Corporation Limited, Singapore Branch; The Hongkong and Shanghai Banking Corporation Limited, Seoul Securities Branch; The Hongkong and Shanghai Banking Corporation Limited, Seoul Branch; HSBC Securities (South Africa) (Pty) Ltd, Johannesburg; ‘GR’ HSBC Securities SA, Athens; HSBC Bank plc, London, Madrid, Milan, Stockholm, Tel Aviv; ‘US’ HSBC Securities (USA) Inc, New York; HSBC Yatirim Menkul Degerler AS, Istanbul; HSBC México, SA, Institución de Banca Múltiple, Grupo Financiero HSBC; HSBC Bank Brasil SA – Banco Múltiplo; HSBC Bank Australia Limited; HSBC Bank Argentina SA; HSBC Saudi Arabia Limited; The Hongkong and Shanghai Banking Corporation Limited, New Zealand Branch incorporated in Hong Kong SAR
Issuer of report HSBC Bank plc 8 Canada Square London, E14 5HQ, United Kingdom
Telephone: +44 20 7991 8888
Fax: +44 20 7992 4880 Website: www.research.hsbc.com
In the UK this document has been issued and approved by HSBC Bank plc (“HSBC”) for the information of its Clients (as defined in the Rules of FSA) and those of its affiliates only. It is not intended for Retail Clients in the UK. If this research is received by a customer of an affiliate of HSBC, its provision to the recipient is subject to the terms of business in place between the recipient and such affiliate. HSBC Securities (USA) Inc. accepts responsibility for the content of this research report prepared by its non-US foreign affiliate. All U.S. persons receiving and/or accessing this report and wishing to effect transactions in any security discussed herein should do so with HSBC Securities (USA) Inc. in the United States and not with its non-US foreign affiliate, the issuer of this report. In Singapore, this publication is distributed by The Hongkong and Shanghai Banking Corporation Limited, Singapore Branch for the general information of institutional investors or other persons specified in Sections 274 and 304 of the Securities and Futures Act (Chapter 289) (“SFA”) and accredited investors and other persons in accordance with the conditions specified in Sections 275 and 305 of the SFA. This publication is not a prospectus as defined in the SFA. It may not be further distributed in whole or in part for any purpose. The Hongkong and Shanghai Banking Corporation Limited Singapore Branch is regulated by the Monetary Authority of Singapore. Recipients in Singapore should contact a "Hongkong and Shanghai Banking Corporation Limited, Singapore Branch" representative in respect of any matters arising from, or in connection with this report. In Australia, this publication has been distributed by The Hongkong and Shanghai Banking Corporation Limited (ABN 65 117 925 970, AFSL 301737) for the general information of its “wholesale” customers (as defined in the Corporations Act 2001). Where distributed to retail customers, this research is distributed by HSBC Bank Australia Limited (AFSL No. 232595). These respective entities make no representations that the products or services mentioned in this document are available to persons in Australia or are necessarily suitable for any particular person or appropriate in accordance with local law. No consideration has been given to the particular investment objectives, financial situation or particular needs of any recipient. This publication has been distributed in Japan by HSBC Securities (Japan) Limited. It may not be further distributed, in whole or in part, for any purpose. In Hong Kong, this document has been distributed by The Hongkong and Shanghai Banking Corporation Limited in the conduct of its Hong Kong regulated business for the information of its institutional and professional customers; it is not intended for and should not be distributed to retail customers in Hong Kong. The Hongkong and Shanghai Banking Corporation Limited makes no representations that the products or services mentioned in this document are available to persons in Hong Kong or are necessarily suitable for any particular person or appropriate in accordance with local law. All inquiries by such recipients must be directed to The Hongkong and Shanghai Banking Corporation Limited. In Korea, this publication is distributed by The Hongkong and Shanghai Banking Corporation Limited, Seoul Securities Branch ("HBAP SLS") for the general information of professional investors specified in Article 9 of the Financial Investment Services and Capital Markets Act (“FSCMA”). This publication is not a prospectus as defined in the FSCMA. It may not be further distributed in whole or in part for any purpose. HBAP SLS is regulated by the Financial Services Commission and the Financial Supervisory Service of Korea. This publication is distributed in New Zealand by The Hongkong and Shanghai Banking Corporation Limited, New Zealand Branch incorporated in Hong Kong SAR. This document is not and should not be construed as an offer to sell or the solicitation of an offer to purchase or subscribe for any investment. HSBC has based this document on information obtained from sources it believes to be reliable but which it has not independently verified; HSBC makes no guarantee, representation or warranty and accepts no responsibility or liability as to its accuracy or completeness. The opinions contained within the report are based upon publicly available information at the time of publication and are subject to change without notice. Nothing herein excludes or restricts any duty or liability to a customer which HSBC has under the Financial Services and Markets Act 2000 or under the Rules of FSA. A recipient who chooses to deal with any person who is not a representative of HSBC in the UK will not enjoy the protections afforded by the UK regulatory regime. Past performance is not necessarily a guide to future performance. The value of any investment or income may go down as well as up and you may not get back the full amount invested. Where an investment is denominated in a currency other than the local currency of the recipient of the research report, changes in the exchange rates may have an adverse effect on the value, price or income of that investment. In case of investments for which there is no recognised market it may be difficult for investors to sell their investments or to obtain reliable information about its value or the extent of the risk to which it is exposed. HSBC Bank plc is registered in England No 14259, is authorised and regulated by the Financial Services Authority and is a member of the London Stock Exchange. © Copyright 2012, HSBC Bank plc, ALL RIGHTS RESERVED. No part of this publication may be reproduced, stored in a retrieval system, or transmitted, on any form or by any means, electronic, mechanical, photocopying, recording, or otherwise, without the prior written permission of HSBC Bank plc. MICA (P) 038/04/2012, MICA (P) 063/04/2012 and MICA (P) 206/01/2012

A product of the Global Equity Research Team
This guide will help you gain an overall understanding of the structure of global equity markets,
earnings trends, and funds flows
We provide a snapshot for each major sector including information on performance and
valuations
HSBC NutshellA global guide to equity sectors
Global Equity Research
Multi-sector
July 2012
Chris Georgs
Global Head of Equity Research
HSBC Bank plc
+44 20 7991 6781
Disclosures and Disclaimer This report must be read with the disclosures and analyst
certifications in the Disclosure appendix, and with the Disclaimer, which forms part of it
Global