hsbc openfunds interim report and accounts · welcome to the interim report for the hsbc openfunds...
TRANSCRIPT

HSBC OpenFundsInterim Report and Accounts
15 October 2014

2
Company
HSBC OpenFunds Registered in England with Company Number IC000488
Registered Office
8 Canada Square London E14 5HQ
Directors
The Authorised Corporate Director (ACD) is HSBC Global Asset Management (UK) Limited which is the sole director.
HSBC Global Asset Management (UK) Limited is authorised and regulated by the Financial Conduct Authority (FCA) and is a member of the Investment Management Association (IMA).
HSBC Global Asset Management (UK) Limited - Directors
S. Chandrasekharan
C.S. Cheetham
A.S. Clark
A.C. Corfield
J. Ellerby
E.R. Stokes
Company Information
3
Market Review 4
HSBC OpenFunds
Aggregated Statements 7
Open Global Distribution Fund 9
Open Global Property Fund 18
Open Global Return Fund 25
World Selection - Balanced Portfolio 34
World Selection - Cautious Portfolio 42
World Selection - Dynamic Portfolio 54
World Selection - Income Portfolio 62
World Index Balanced Portfolio 70
World Index Cautious Portfolio 78
World Index Dynamic Portfolio 86
General Information 94
Important Notes 96
Important Changes to the Company and/or Fund Documentation 97
Other Information 100
Corporate Shareholders 101
Risk and Reward Profile 102
Directory 103
Quick Reference Guide 104
Contents

4
Welcome to the Interim Report for the HSBC OpenFunds Open-Ended Investment Company (OEIC). The report covers the period 16 April 2014 to 15 October 2014.
Please do take the time to look through the report and if you have any questions, contact our Customer Services on 0345 745 6123 *.
To help us continually improve our service, and in the interests of security, we may monitor and/or record your communications with us.
*Lines are open 8am to 6pm Monday to Friday (excluding public holidays). If you also have shares in another HSBC OEIC, you will receive a separate statement and report when it is due.
Market Overview
Despite heightening geopolitical tensions and mixed economic data, the world’s equity markets made positive progress over the review period, with investors choosing to focus on the encouraging aspects of the global recovery rather than dwell on the less certain elements. Ongoing support from central banks also underpinned investor confidence. The pound’s strength against the euro and the yen, among other currencies, muted returns for UK-based investors, however. The period saw increased confidence in the recovering economies of the developed world, although uncertainties remained throughout Europe. Growth in the eurozone stagnated in the second quarter, as the Germany economy contracted and France and Italy failed to grow. After a first-quarter contraction that was ascribed to severe winter weather, US economic data rebounded powerfully, however, with initial reports of 4% growth in the second quarter and a final revision to 4.6%. The UK’s economic recovery remained on track, with gross domestic product (GDP) up by 0.8% in the second quarter according to initial estimates and by 0.9% in the final assessment.
Less positive, however, was the ongoing geopolitical uncertainty resulting from Russia’s intervention in Ukraine and concerns over China’s slowing economic growth and tightening credit conditions. The International Monetary Fund cut its Russian growth forecast, and credit-ratings agency Standard & Poor’s (S&P) downgraded the country on capital outflows and weaker growth. Meanwhile, ongoing struggles with extremist insurgents in Iraq were problematic for the oil markets. In Syria, the struggle by Kurdish fighters to resist the onslaught of Islamic State (IS) in the town of Kobani attracted global attention. The UK parliament voted to engage in air strikes against IS forces in Iraq as the US increased its aerial offensive against the group.
Another blow to global sentiment came from the worsening Ebola crisis in West Africa. The outbreak has claimed thousands of lives in Guinea, Liberia and Sierra Leone. The transmission of the disease to healthcare workers in Spain and the US underscored the global implications of the crisis, which is having severe social and economic consequences in the affected areas. After criticism for their slowness to react, developed countries pledged greater support for efforts to combat the epidemic.
As a consequence of the global uncertainties arising from the crises in Eastern Europe, the Middle East and Africa, markets were markedly more volatile toward the end of the period.
UK Equities
The UK economic rebound continued to gain momentum over the period, with the UK now one of the fastest-growing developed economies. Mark Carney, the governor of the Bank of England (BoE), indicated that rate rises would be more gradual and limited than in the past, but the strength of the economy led him to also say that increases could come ‘sooner than the markets currently expect’. According to the Office for National Statistics, the UK economy expanded by 0.9% in the second quarter of the year, up from 0.8% in the first, and by 3.2% year on year. Both the British Chambers of Commerce and the Organisation for Economic Co-operation and Development (OECD) upgraded their growth forecasts for the UK, with the latter predicting that the UK’s economy would grow by 3.2% in 2014, helped by investment and private consumption. Later in the period, however, the OECD revised down its forecast slightly, to 3.1%. Despite the strengthening economy, the UK stockmarket continued to underperform many other markets. Returns were held back; investors favoured the safety of gilts as tensions between Russia and the Ukraine escalated and the global economic outlook remained uncertain. With the index heavily weighted toward exporters, China’s slower economic growth and tightening credit conditions served to dampen sentiment overall. Mergers & acquisitions (M&A) and initial public offering volumes were strong over the period, however. In September, the Scottish independence referendum came sharply into focus with the publication of the first poll showing a lead for the ‘Yes’ camp. Share prices and the pound tumbled in response. In the event, however, the referendum produced a ‘No’ victory by a margin of more than 10 percentage points.
Market Review

5
UK Fixed Income
UK government bonds (gilts) produced positive returns over the six-month period. The Monetary Policy Committee (MPC) held the base rate at 0.5% and maintained its programme of quantitative easing at £375 billion. This was despite a faster-than-expected improvement in the UK economy, evident in both GDP growth (with estimates for the second quarters coming in at 0.9% quarter on quarter, or an annualised 3.2%) and in employment data. Last year, the MPC had expected the unemployment rate to fall to 7% by the third quarter of 2015, but figures released in August 2014 showed that the rate had already fallen to 6.2% in July. By the end of the period, the BoE’s full-year growth forecast had risen to 3.5%. Given the strength of the recovery, investors began to focus on the timing of the first rise in interest rates since March 2009. Volatility increased after the central bank’s governor, Mark Carney, said that a UK rate rise could occur “sooner than market participants expect”. Late in the period, however, gilt prices firmed as Mr Carney cited weak wage growth, which dampened speculation about an early rate rise. The governor repeatedly emphasised that rate rises would be more gradual and limited than in the past, and that the “new normal” for interest rates is likely to be about 2.5%. Demand for gilts was also boosted by fears over political instability in Iraq and Ukraine. Inflation fell to its lowest level in over four years, thanks to lower commodity prices and a stronger currency, providing further support for the market.
Global Bonds
Government bonds delivered positive returns over the period, led by US Treasuries. For UK investors, returns from European and Japanese bonds were reduced by the strength of the pound. Over the six months, the increase in global uncertainties – arising from the crises in Ukraine, the Middle East and West Africa – led investors to seek the safety offered by developed-market government bonds. Bond yields rose in September, however, as comments from US Federal Reserve (Fed) officials led investors to speculate as to when the first rise in interest rates would come, following the winding down of the central bank’s programme of quantitative easing. But toward the end of the period, reassurance from the Fed that any rise in interest rates was still some way off allowed bond yields to fall once more. In Europe, bond prices rose on hopes that the successive stimulus measures announced by the European Central Bank (ECB) would eventually include full-blown quantitative easing (the purchase of government bonds). This had not materialised by the end of the period, however. In Japan, government bonds continued to receive support from both the Bank of Japan’s (BoJ) asset-purchase programme and foreign investors. Investment-grade corporate bonds performed well over the period, as investors continued to exhibit an appetite for yield. High-yield corporate bonds fell back, however, as global uncertainties contributed to a more risk-averse mood.
US Equities
The US equity market advanced strongly over the period, as investors grew more comfortable with the Fed’s ‘tapering’ of its asset-purchase programme and as economic weakness at the start of the year was increasingly ascribed to an unusually harsh winter. As the period progressed, strong US jobs data and reassurance from the Fed that it would not raise interest rates in the near future generated widespread confidence among investors. The unemployment rate fell to 5.9% in September. Consumer confidence also showed a strongly positive trend, with the Thompson Reuters/University of Michigan index reaching a seven-year high by the end of the period. Boosted by the growing strength of the economic recovery, the S&P 500 hit successive record highs over the six months. Trading activity was brisk, helped by a surge in new share listings, particularly for biotechnology companies, and growing numbers of M&A. That said, soaring share prices have fuelled concerns about an overheating stockmarket, against the background of an economic recovery that, while strengthening, remains tentative. In many cases, companies have boosted earnings through stringent cost-cutting and share repurchases rather than by growing underlying sales.
European Equities
European equities declined over period, with sterling’s strength exacerbating the fall for UK-based investors. The eurozone had exited recession and returned to low growth in the first quarter of the year, but it continued to be beset by persistently low inflation, with the consumer-price index falling to 0.3% in September. In June, earlier signs of disinflation had prompted the ECB to provide additional stimulus for the region’s faltering economy, including the unprecedented step of introducing negative deposit rates. It also offered cheap long-term loans to encourage banks to increase lending activity and further cut its benchmark interest rate from 0.25% to 0.15% – a record low. In September, the ECB cut rates still further, to 0.05%, and moved deposit rates deeper into negative territory. The central bank also introduced a limited programme of asset purchases, involving the acquisition of covered bonds and asset-backed securities. This stopped short, however, of full-blown quantitative easing (the purchase of government bonds). The ECB’s initiatives came after GDP data for the second quarter had shown that the German economy had contracted in the second quarter, while the French economy – and that of the eurozone as a whole – had failed

6
to grow. As the tension in Ukraine escalated, the German market weakened significantly in the latter part of the period, as investors favoured its bond market instead. The relative strength of the euro also had a negative impact on Germany’s export sector. French stocks lagged as business conditions within the country deteriorated further. Peripheral markets were mixed, with Spain outperforming its European peers but Italy falling back. Overall, the European market ended the period behind many other developed regions. Europe has seen a surge in M&A activity this year, with the largest deals taking place in the healthcare sector.
Japanese Equities
In yen terms, Japanese equities performed strongly over the period, although there was considerable volatility along the way. Sterling returns were dampened by the strength of the pound, however, as the BoJ’s stimulus measures led to sustained weakness in the yen. A particular source of volatility over the period was April’s increase in sales tax, from 5% to 8%, which caused fears that consumer activity would be hampered. A slightly steeper-than-expected fall in June’s retail numbers bore this out. At the end of August, figures showed a rebound in July’s retail sales, raising hopes that the worst of the impact was past. Second-quarter GDP contracted sharply, however, with an annualised fall of 7.1% reported in September’s revised estimate. Nevertheless, signs of improvement in the US’s economic recovery and stability in emerging markets helped lift sentiment toward Japan’s exporters, which are benefiting from the weak yen. The government also provided some comfort, as Shinzo Abe, the prime minister, said that no further increase in the sales tax would take place unless the economy had strengthened enough to warrant it.
Asian Equities
The start of the period was characterised by growing unease about China’s growth prospects, which weighed on the performance of the Chinese, Singaporean and Australian markets. Other markets less reliant on China as a trading partner generally performed strongly, helped by reassurance from the Fed that monetary policy would remain accommodative. Stockmarkets in Indonesia and India were boosted by the election victories of Narendra Modi and Joko Widodo, and the prospect of business-friendly economic policies. Thailand’s stockmarket improved significantly too, despite an army coup which displaced the government, on hopes much-needed economic reforms will be fast-tracked. New Zealand’s equities were lifted higher by its rate rise and strengthening economy. Later in the period, sentiment toward China was boosted by upbeat industrial-production data. Asian indices lost some of their gains toward the end of the period, however, as global uncertainties and the pro-democracy protests in Hong Kong led to heightened volatility.
Property
Property markets – both listed and unlisted – generally performed strongly over the six months to the end of September 2014. The UK unlisted (direct) property market saw a total return of 10.0%, as recorded by the IPD UK Monthly Index. Growth in capital values of 6.8% accounted for most of the performance, mainly attributable to the downward pressure on yields as investor demand pushed up prices. Rental values, however, also rose by 1.6% during this period, led by offices in London and the South East.
Listed property markets rose in all regions during the review period. Strongest performance was seen in Asia, where the FTSE EPRA/NAREIT Total Return Index increased by 13.4% in local currency terms during 2014 Q2 and Q3. Listed property in the Eurozone rose by 11.6% in Euro terms during this period. Weaker performance was experienced in the US and UK, where the FTSE EPRA/NAREIT indices both increased by 3.5% in local currency terms. The FTSE EPRA/NAREIT Developed Index – a measure of global listed property performance – saw a total return of 6.0% in sterling terms during the six months to the end of September 2014.
Please note that the above information refers to the past and that past performance is not a reliable indication of future returns. Information provided by HSBC Global Asset Management (UK) Limited 15 October 2014.

7
HSBC OpenFundsCompany Financial StatementsAggregated Statement of Total Returnfor the six months ended 15 October 2014 (unaudited)
Aggregated Statement of Change in Net Assets Attributable to Shareholdersfor the six months ended 15 October 2014 (unaudited)
15.10.14 15.10.13£’000 £’000 £’000 £’000
Income Net capital gains/(losses) 90,317 33,871 Revenue 49,964 50,751 Expenses (21,780) (22,084) Finance costs: Interest (23) - Net revenue before taxation 28,161 28,667 Taxation (1,359) (1,033) Net revenue after taxation for the period 26,802 27,634 Total return before distributions 117,119 61,505 Finance costs: Distributions (30,796) (31,906)Change in net assets attributable to shareholders from investment activities 86,323 29,599
15.10.14 15.10.13£’000 £’000 £’000 £’000
Opening net assets attributable to shareholders 3,871,320 3,650,871 Amounts receivable on creation of shares 324,662 324,384 Amounts payable on cancellation of shares (211,501) (265,836)
113,161 58,548 Stamp duty reserve tax (54) (583)Change in net assets attributable to shareholders from investment activities (see Statement of Total Return above) 86,323 29,599 Retained distribution on accumulation shares 20,632 23,098 Closing net assets attributable to shareholders 4,091,382 3,761,533

8
Aggregated Balance Sheetas at 15 October 2014 (unaudited)
15.10.14 15.4.13£’000 £’000 £’000 £’000
AssetsInvestment assets 4,008,090 3,759,526 Debtors 68,676 21,912 Cash and bank balances 104,848 120,297 Total other assets 173,524 142,209 Total assets 4,181,614 3,901,735 LiabilitiesInvestment liabilities (14,966) (214)Creditors (70,001) (25,958) Distribution payable on income shares (5,265) (4,243) Total other liabilities (75,266) (30,201) Total liabilities (90,232) (30,415) Net assets attributable to shareholders 4,091,382 3,871,320
The Company is authorised and regulated by the Financial Conduct Authority and is structured as an umbrella company, in that the Company proposes to issue shares linked to different Funds which have been established. The Company is a Non-UCITS Scheme (NURS).
A.C. Corfield
Director
A. Clark
Director
For and on behalf of HSBC Global Asset Management (UK) Limited Authorised Corporate Director
1 December 2014
Accounting Policies
The financial statements have been prepared in accordance with the Statement of Recommended Practice (“SORP”) for Authorised Funds issued by the Investment Management Association (“IMA”) in October 2010.
The accounting policies applied are consistent with those of the Annual Financial Statements to 15 April 2014 and are described in those financial statements.

9
Investment Objective
To provide a high level of income by investing in a broad range of asset classes across global markets.
Investment Policy
To invest primarily in collective investment schemes that in turn invest in fixed income securities, higher-yielding equities, property, commodities and derivatives.
Investment Strategy
With effect from 1 July 2014:
The Fund’s strategy is to provide a high level of income for investors by maintaining exposure consistently to a diverse set of asset classes including, global or regional equities, sovereign developed markets, corporate, high yield and emerging market bonds, property, commodities and cash.
Portfolio Activity
Recent months have seen divergence in economic performance between continued steady expansion in the US and a marked weakening in the Eurozone where falling inflation expectations have been a growing concern. Currency markets have reacted to these developments with the US dollar strengthening. Globally, growth remains a challenging issue with Japan and China supporting their economies through stimulus programmes, although Chinese growth is changing shape. With some volatility equity markets have continued to make progress and a weakening currency enhancing returns for sterling based investors. Equity markets were impacted by a bout of risk aversion at the end of the period while government bond yields hit fresh lows for the year and continue to look unattractive.
Against this backdrop the portfolio’s equity position was reduced earlier in the year to a moderate level and we are comfortable with this positioning, although acknowledging that equities appear somewhat more attractively valued than prior to recent events. Whilst government bond prices remained stable, the price of high yield corporate bonds started to fall thus offering a greater relative value. Tactically we moved the portfolio to a more defensive stance as the period progressed, although the magnitude of the changes in the portfolio were relatively small.
There was a circa 1% reduction in exposure to Developed Market Equities and a 2% reduction in High Yield Bonds (bonds which make higher income payments on the basis of their credit ratings) while Emerging Market Equities exposure was allowed to rise along with cash levels. At the individual fund level an increasingly negative view was taken concerning European Equity markets which resulted in a reduction in the funds directly invested in these markets, while the Liontrust Macro Equity Income Fund was sold to zero following an earlier change in our research view.
Major purchases included: Legg Mason Brandywine Global Fixed Income Fund, Newton Global Higher Income Fund and Fidelity Moneybuilder Dividend Fund.
Major sales included: Invesco Perpetual European Equity Income Fund, HSBC ISF MultiAlpha Global High Yield Bond Fund and Liontrust Macro Equity Income Fund.
Investment Performance
During the period under review, the value of the shares in the Fund increased by 2.71%.
(Source: Morningstar Direct, GBP, UK net of tax, for the Retail Accumulation share class. Returns based on the NAV, which is a single price.)
Please note that the above information refers to the past and that past performance is not a reliable indication of future returns.
Fund Particulars as at 16 October 2014 (unaudited)
Retail Income
Retail Accumulation
Income C Accumulation C
Price 103.7p xd 144.1p 105.2p xd 145.7p
Distribution payable (on 15 December 2014) per share net 1.050000 1.440000 1.060000 1.460000
Current net estimated yield 3.76% 3.59% 3.74% 3.58%
Annual ACD charge 1.25% 1.25% 0.55% 0.55%
Open Global Distribution Fund
OPEN GLOBAL DISTRIBUTION FUND

10 OPEN GLOBAL DISTRIBUTION FUND
Portfolio Statement as at 15 October 2014 (unaudited)
Security Holding Bid Totalvalue net£’000 assets
%Absolute Return - 0.96% (1.06%)
*Majedie Tortoise Fund 3,084,305 5,210 0.96 Total Absolute Return 5,210 0.96 Asia-Pacific (excluding Japan) Equities - 5.36% (5.39%)
Henderson Asian Dividend Income Fund 12,931,234 13,920 2.57*Prusik Asian Equity Income Fund B 129,152 12,261 2.26*Prusik Asian Equity Income Fund X 33,409 2,896 0.53
Total Asia-Pacific (excluding Japan) Equities 29,077 5.36 Commodities - 2.03% (2.55%)
*Schroder Alternative Solutions Commodity Fund 125,415 10,973 2.03 Total Commodities 10,973 2.03 European Equities - 2.31% (4.15%)
BlackRock Continental European Income Fund 3,986,100 4,397 0.81 Invesco Perpetual European Equity Income Fund 15,282,365 8,144 1.50 Total European Equities 12,541 2.31 Global Aggregate Bonds - 1.92% (2.07%)
*M&G European Loan Fund 119,694 10,379 1.92 Total Global Aggregate Bonds 10,379 1.92 Global Emerging Markets Debt - 9.82% (9.55%)
*Ashmore SICAV Emerging Markets Local Currency Bond Fund 69,063 4,318 0.80*Ashmore SICAV Emerging Markets Corporate Debt Fund 82,063 5,349 0.99*BNY Mellon Emerging Markets Local Currency Debt Fund 4,700,325 5,080 0.94*GS Global Emerging Markets Debt Portfolio 1,075,597 12,570 2.32*Polar Capital Emerging Markets Growth Fund 1,189,639 7,507 1.38*Stone Harbor Emerging Markets Local Currency Debt Fund 37,958 6,625 1.22*Wellington Opportunistic Emerging Markets Debt Portfolio 1,737,869 11,763 2.17
Total Global Emerging Markets Debt 53,212 9.82 Global Equities - 8.07% (7.35%)
Artemis Global Income Fund 33,310,019 24,146 4.46 Newton Global Higher Income Fund 17,970,305 19,550 3.61 Total Global Equities 43,696 8.07 Global Government Bonds - 3.40% (1.90%)
*Legg Mason Brandywine Global Fixed Income Fund 286,694 18,422 3.40 Total Global Government Bonds 18,422 3.40

11OPEN GLOBAL DISTRIBUTION FUND
Portfolio Statement as at 15 October 2014 (unaudited)
Security Holding Bid Totalvalue net£’000 assets
%Global High Yield Bonds - 7.99% (9.72%) *+HSBC ISF MultiAlpha Global High Yield Bond Fund 3,951,847 43,273 7.99
Total Global High Yield Bonds 43,273 7.99 Global Property Equities Funds - 3.76% (3.81%)
*+HSBC ISF MultiAlpha Global Real Estate Equity Fund 2,314,344 20,365 3.76 Total Global Property Equities Funds 20,365 3.76 Infrastructure - 6.88% (6.79%)
^Bilfinger Berger Global Infrastructure SICAV 8,066,871 9,680 1.79 First State Global Listed Infrastructure Fund 13,319,753 18,191 3.36^+HICL Infrastructure 6,466,746 9,377 1.73
Total Infrastructure 37,248 6.88 Direct Property Funds - 7.31% (7.38%)
Aviva Investors Property Trust 7,773,522 8,060 1.49^F&C Commercial Property Trust 2,112,059 2,640 0.49
Henderson UK Property Fund 13,842,624 14,864 2.74 Ignis UK Property Fund 8,830,206 8,725 1.61 SWIP Property Trust 5,523,296 5,339 0.98 Total Direct Property Funds 39,628 7.31 UK Corporate Bonds - 19.78% (20.26%)
Henderson Sterling Bond Fund 9,733,494 10,307 1.90*+HSBC ISF MultiAlpha Sterling Bond Fund 5,168,378 63,206 11.66
Invesco Perpetual Corporate Bond Fund 12,484,001 11,257 2.08 M&G Corporate Bond Fund 30,557,673 12,104 2.23
*Royal London Sterling Extra Yield Bond Fund 8,949,328 10,329 1.91 Total UK Corporate Bonds 107,203 19.78 UK Equities - 14.95% (15.21%)
^Aberforth Smaller Companies Fund 692,364 6,768 1.25 Fidelity MoneyBuilder Dividend Fund 30,547,505 36,871 6.80 JOHCM UK Dynamic Fund 6,518,434 9,719 1.79 Schroder Income Maximiser Fund 62,356,885 27,680 5.11 Total UK Equities 81,038 14.95 US Equities - 2.44% (2.19%)
JPM US Equity Income Fund 14,266,685 13,242 2.44 Total US Equities 13,242 2.44

12 OPEN GLOBAL DISTRIBUTION FUND
Portfolio Statement as at 15 October 2014 (unaudited)
Security Holding Bid Totalvalue net£’000 assets
%Forward Foreign Exchange Contracts - 0.00% (0.01%)
Portfolio of investments 525,507 96.98
Net other assets 16,390 3.02
Net assets 541,897 100.00 *offshore funds +related party ^listed Figures in brackets denote comparative percentage holdings as at 15 April 2014.
All holdings are authorised investment funds unless otherwise stated. Total purchases for the period, including transaction charges, were £38,537,866.
Total sales for the period, net of transaction charges, were £17,951,105.

13OPEN GLOBAL DISTRIBUTION FUND
as at 15 April Net asset value Net asset value Shares in per share issue
(£) (p)
2012Retail Income 253,396,273 94.41 268,400,830 Retail Accumulation 136,109,481 118.9 114,427,290
2013Retail Income 270,781,165 104.1 260,201,019 Retail Accumulation 159,678,506 136.4 117,080,115 Income C† 18,807,976 104.8 17,945,614 Accumulation C† 15,050,093 136.8 10,999,609
2014Retail Income 230,745,592 103.2 223,571,823 Retail Accumulation 135,221,573 140.5 96,269,768 Income C 68,974,941 104.5 66,012,051 Accumulation C 70,107,440 141.7 49,487,116
2014*Retail Income 205,463,603 103.6 198,316,915 Retail Accumulation 125,256,125 144.0 86,987,318 Income C 97,575,978 105.2 92,784,987 Accumulation C 113,601,114 145.6 78,019,880
*as at 15 October †The Income C and Accumulation C share classes were launched on 3 September 2012.
Comparative Tablefor the six months ended 15 October 2014 (unaudited)

14 OPEN GLOBAL DISTRIBUTION FUND
Net income Highest share Lowest shareper share price price
(p) (p) (p)
Calendar year2009Retail Income 3.531427 93.91 75.24Retail Accumulation 3.898765 106.4 82.71
2010Retail Income 3.789793 98.12 90.58 Retail Accumulation 4.356658 115.5 104.3
2011Retail Income 4.451142 99.21 89.11Retail Accumulation 5.330548 119.6 109.1
2012Retail Income 3.927115 99.95 92.56Retail Accumulation 4.933133 128.6 114.8Income C† 0.400000 100.5 97.00Accumulation C† 0.510000 128.8 124.0
2013Retail Income 3.879023 107.5 99.56 Retail Accumulation 5.058920 140.9 128.1 Income C 3.906804 108.4 100.1 Accumulation C 5.078817 141.5 128.3
2014*Retail Income 4.147155 107.6 101.5Retail Accumulation 5.616402 148.0 137.0Income C 4.195406 109.1 102.7Accumulation C 5.666149 149.6 138.1
†The Income C and Accumulation C share classes were launched on 3 September 2012. *to 15 October
Comparative Tablefor the year ended 15 April 2012

15OPEN GLOBAL DISTRIBUTION FUND
2014Retail Income 2.01%Retail Accumulation 2.01%Income C 1.36%Accumulation C 1.36%
as at 15 April2014Retail Income 2.06%Retail Accumulation 2.06%Income C 1.41%Accumulation C 1.41%
Ongoing Charges Figure (OCF) as at 15 October

16 OPEN GLOBAL DISTRIBUTION FUND
Statement of Total Returnfor the six months ended 15 October 2014 (unaudited)
15.10.14 15.10.13 £’000 £’000 £’000 £’000
Income Net capital gains/(losses) 4,396 (2,557) Revenue 12,285 9,939 Expenses (2,923) (2,956)Net revenue before taxation 9,362 6,983 Taxation (780) (488)Net revenue after taxation for the period 8,582 6,495 Total return before distributions 12,978 3,938 Finance costs: Distributions (10,990) (9,063)Change in net assets attributable to shareholders from investment activities 1,988 (5,125)
Statement of Change in Net Assets Attributable to Shareholdersfor the six months ended 15 October 2014 (unaudited)
15.10.14 15.10.13 £’000 £’000 £’000 £’000
Opening net assets attributable to shareholders 505,050 464,318 Amounts receivable on creation of shares 54,668 48,957 Amounts payable on cancellation of shares (24,600) (25,043)
30,068 23,914 Stamp duty reserve tax (3) (55)Change in net assets attributable to shareholders frominvestment activities (see Statement of Total Return above) 1,988 (5,125)Retained distribution on accumulation shares 4,794 3,595 Closing net assets attributable to shareholders 541,897 486,647
Balance Sheetas at 15 October 2014 (unaudited)
15.10.14 15.4.14£’000 £’000 £’000 £’000
AssetsInvestment assets 525,507 501,946 Debtors 4,124 3,608 Cash and bank balances 16,759 3,227 Total other assets 20,883 6,835 Total assets 546,390 508,781 Liabilities Creditors (1,427) (1,128) Distribution payable on income shares (3,066) (2,603)Total liabilities (4,493) (3,731)Net assets attributable to shareholders 541,897 505,050

17OPEN GLOBAL DISTRIBUTION FUND
Distribution Table (pence per share) for the six months ended 15 October 2014 (unaudited)
Net Equalisation Distribution Distributionincome payable paid
15.12.14 15.12.13
Retail IncomeGroup 1 1.050000 - 1.050000 0.820000Group 2 0.590000 0.460000 1.050000 0.820000
Retail AccumulationGroup 1 1.440000 - 1.440000 1.090000Group 2 0.800000 0.640000 1.440000 1.090000
Income C*Group 1 1.060000 - 1.060000 0.830000Group 2 0.450000 0.610000 1.060000 0.830000
Accumulation C*Group 1 1.460000 - 1.460000 1.090000Group 2 0.620000 0.840000 1.460000 1.090000
*launched on 3 September 2012
Group 1: Shares purchased prior to 16 July 2014 Group 2: Shares purchased from 16 July 2014 to 15 October 2014
Net Equalisation Distribution Distributionincome paid paid
15.9.14 15.9.13
Retail IncomeGroup 1 1.150000 - 1.150000 1.150000Group 2 0.910000 0.240000 1.150000 1.150000
Retail AccumulationGroup 1 1.570000 - 1.570000 1.510000Group 2 1.160000 0.410000 1.570000 1.510000
Income C*Group 1 1.170000 - 1.170000 1.160000Group 2 0.720000 0.450000 1.170000 1.160000
Accumulation C*Group 1 1.580000 - 1.580000 1.520000Group 2 0.980000 0.600000 1.580000 1.520000
*launched on 3 September 2012
Group 1: Shares purchased prior to 16 April 2014 Group 2: Shares purchased from 16 April 2014 to 15 July 2014

18 OPEN GLOBAL PROPERTY FUND
Open Global Property Fund
Investment Objective
To provide long-term capital growth.
Investment Policy
The Fund predominantly invests in property securities and property-related securities and collective investment schemes that, in turn, invest directly or indirectly in property, unlisted property and listed property securities. There are no geographical restrictions.
Investment Strategy
With effect from 1 July 2014:
The strategy for this Fund is to provide long term capital growth by direct investment into property securities, property related securities and in collective investments schemes that, in turn, invest in property. The balance between direct property funds, listed property funds and cash, and the geographic composition of the portfolio, will vary over time depending on our view of prospective risk-adjusted returns.
Fund Particulars as at 16 October 2014 (unaudited)
Retail Income
Retail Accumulation
Institutional A Income
Income C Accumulation C
Price 124.4p xd 136.8p 124.4p xd 125.5p xd 138.3p
Distribution payable (on 15 December 2014) per share net
0.940000p 1.020000p 1.210000p 1.270000p 1.390000p
Current net estimated yield 1.18% 1.17% 1.54% 1.68% 1.64%
Annual ACD charge 1.25% 1.25% 0.75% 0.55% 0.55%
Portfolio Activity
In anticipation of the expected improvement in performance of the UK direct (unlisted)
property market, the Manager increased the allocation to UK direct property funds from
37.7% on 16 April 2014 to 47.6% on 15 October. The increase in weighting was made
across existing holdings rather than adding new investments and was largely funded by
net inflows.
The allocation to listed property securities funds consequently reduced over the review
period, from 58.1% to 49.8%. The manager exited from two funds completely: the
Schroder Global Property Securities Fund and the Goldman Sachs US Balanced Portfolio.
One new holding was introduced within the listed property part of the Fund: an initial
1% allocation was made to UK Commercial Property Trust, a quoted investment
company registered in Guernsey with a full listing on the London Stock Exchange.
The weighting to cash held within the Fund reduced from 4.2% as at 16 April 2014 to
2.6% as at 15 October.
Investment Performance
During the period under review, the value of the shares in the Fund increased by 6.31%.
(Source: Morningstar Direct, GBP, UK net of tax, for the Accumulation C share class.
Returns based on the NAV, which is a single price.)
Please note that the above information refers to the past and that past performance is
not a reliable indication of future returns.

19
Portfolio Statement as at 15 October 2014 (unaudited)
Security Holding Bid Totalvalue net£’000 assets
%Asia-Pacific (excluding Japan) Equities - 4.42% (6.56%)
*Schroder ISF Asia Pacific Property Fund 57,123 5,264 4.42 Total Asia-Pacific (excluding Japan) Equities 5,264 4.42 Direct Property Funds - 47.65% (37.67%)
Aviva Investors Property Trust 1,924,408 1,996 1.68 Henderson UK Property Fund 12,224,766 13,127 11.02 Ignis UK Property Fund 10,670,987 10,544 8.85 Legal & General UK Property Trust 13,789,029 6,524 5.48 M&G Property Portfolio 12,116,470 13,116 11.01 SWIP Property Trust 11,836,924 11,443 9.61 Total Direct Property Funds 56,750 47.65 European (including UK) Equities - 14.57% (15.49%)
^F&C Commercial Property Trust 4,964,878 6,206 5.21#F&C Real Estate Securities Fund 202,833 2,953 2.48
+^HICL Infrastructure 2,280,331 3,307 2.78^TR Property Investment Trust 1,547,292 3,706 3.11^UK Commercial Property Trust 1,441,881 1,180 0.99
Total European (including UK) Equities 17,352 14.57 Global Property Equities Funds - 16.13% (17.29%)
*AXA World Fund Framlington Global Real Estate Securities Fund 55,928 6,193 5.20*+HSBC ISF MultiAlpha Global Real Estate Equity Fund 1,480,169 13,025 10.93
Total Global Property Equities Funds 19,218 16.13 US Property Securities - 14.67% (18.78%) *#Brookfield US Listed Real Estate UCITS Fund 292,844 5,895 4.95*#iShares FTSE US Property Yield Fund 725,498 11,575 9.72
Total US Property Securities 17,470 14.67 Portfolio of investments 116,054 97.44
Net other assets 3,043 2.56
Net assets 119,097 100.00 *offshore fund #Dublin ICVC +related party ^listed Figures in brackets denote comparative percentage holdings as at 15 April 2014.
All holdings are authorised investment funds unless otherwise stated. Total purchases for the period, including transaction charges, were £47,775,888.
Total sales for the period, net of transaction charges, were £18,147,281.
OPEN GLOBAL PROPERTY FUND

20
as at 15 April Net asset value Net asset value Shares in per share issue
(£) (p)
2012Retail Income 9,756,694 103.9 9,388,538 Retail Accumulation 14,736,680 109.9 13,414,807 Institutional A Income 12,653,839 103.8 12,187,615
2013Retail Income 17,568,816 118.7 14,800,733 Retail Accumulation 20,689,806 127.7 16,196,456 Institutional A Income 14,655,782 118.6 12,357,553 Income C† 2,094,829 119.7 1,749,924 Accumulation C† 1,238,778 128.1 966,896
2014Retail Income 10,452,159 117.3 8,908,239 Retail Accumulation 27,252,897 128.0 21,288,918 Institutional A Income 188,206 117.3 160,452 Income C 22,265,089 118.4 18,805,940 Accumulation C 25,687,686 129.1 19,901,937
2014*Retail Income 9,735,925 123.9 7,860,627 Retail Accumulation 25,918,432 136.2 19,035,996 Institutional A Income 268,960 123.8 217,190 Income C 25,926,343 125.0 20,740,879 Accumulation C 57,246,999 137.6 41,595,326
†The Income C and Accumulation C share classes were launched on 3 September 2012. *as at 15 October
Comparative Tablefor the six months ended 15 October 2014 (unaudited)
OPEN GLOBAL PROPERTY FUND

21
Net income Highest share Lowest shareper share price price
(p) (p) (p)
Calendar year2009Retail Income 1.452731 94.15 67.39Retail Accumulation 1.476523 97.16 68.38
2010Retail Income 0.856895 107.7 90.88Retail Accumulation 0.875034 112.1 93.78Institutional A Income† 0.000000 107.7 101.3
2011Retail Income 1.272483 112.0 96.47Retail Accumulation 1.321703 117.3 101.1Institutional A Income 1.747049 112.0 96.58
2012Retail Income 1.273024 111.3 100.0Retail Accumulation 1.352528 118.1 105.4Institutional A Income 1.739370 111.3 100.0Income C†† 0.170000 111.8 107.6Accumulation C†† 0.180000 118.3 113.6
2013Retail Income 1.772776 124.1 110.4Retail Accumulation 1.898476 133.6 117.7Institutional A Income 2.233537 124.0 110.4Income C 2.410198 125.3 111.4Accumulation C 2.563735 134.0 117.9
2014*Retail Income 1.817473 130.1 115.7Retail Accumulation 1.968358 142.0 125.3Institutional A Income 2.335720 130.3 115.8Income C 2.455862 131.6 116.8Accumulation C 2.677964 143.4 126.1
†The Institutional A Income share class was launched on 16 November 2010. ††The Income C and Accumulation C share classes were launched on 3 September 2012. *to 15 October
Comparative Tablefor the year ended 15 April 2012
OPEN GLOBAL PROPERTY FUND

22 OPEN GLOBAL PROPERTY FUND
2014Retail Income 2.03%Retail Accumulation 2.03%Institutional A Income 1.48%Income C 1.38%Accumulation C 1.38%
as at 15 April2014Retail Income 2.03%Retail Accumulation 2.03%Institutional A Income 1.48%Income C 1.38%Accumulation C 1.38%
Ongoing Charges Figure (OCF) as at 15 October

23
Statement of Total Returnfor the six months ended 15 October 2014 (unaudited)
15.10.14 15.10.13£’000 £’000 £’000 £’000
Income Net capital gains/(losses) 4,351 (2,180) Revenue 1,432 826 Expenses (454) (331)Net revenue before taxation 978 495 Taxation (72) (40)Net revenue after taxation for the period 906 455 Total return before distributions 5,257 (1,725)Finance costs: Distributions (909) (411)Change in net assets attributable to shareholders from investment activities 4,348 (2,136)
Statement of Change in Net Assets Attributable to Shareholdersfor the six months ended 15 October 2014 (unaudited)
15.10.14 15.10.13£’000 £’000 £’000 £’000
Opening net assets attributable to shareholders 85,846 56,248 Amounts receivable on creation of shares 36,109 35,476 Amounts payable on cancellation of shares (7,975) (24,209)
28,134 11,267 Stamp duty reserve tax (3) (13)Change in net assets attributable to shareholders frominvestment activities (see Statement of Total Return above) 4,348 (2,136)Retained distribution on accumulation shares 772 228 Closing net assets attributable to shareholders 119,097 65,594
Balance Sheet as at 15 October 2014 (unaudited)
15.10.14 15.4.14£’000 £’000 £’000 £’000
AssetsInvestment assets 116,054 82,229 Debtors 953 1,422 Cash and bank balances 2,595 2,658 Total other assets 3,548 4,080 Total assets 119,602 86,309 Liabilities Creditors (165) (160) Distribution payable on income shares (340) (303)Total liabilities (505) (463)Net assets attributable to shareholders 119,097 85,846
OPEN GLOBAL PROPERTY FUND

24
Distribution Table (pence per share) for the six months ended 15 October 2014 (unaudited)
Net Equalisation Distribution Distributionincome payable paid
15.12.14 15.12.13
Retail IncomeGroup 1 0.940000 - 0.940000 0.680000Group 2 0.340000 0.600000 0.940000 0.680000
Retail AccumulationGroup 1 1.020000 - 1.020000 0.740000Group 2 0.290000 0.730000 1.020000 0.740000
Institutional A IncomeGroup 1 1.210000 - 1.210000 0.900000Group 2 0.290000 0.920000 1.210000 0.900000
Income CGroup 1 1.270000 - 1.270000 1.010000Group 2 0.540000 0.730000 1.270000 1.010000
Accumulation CGroup 1 1.390000 - 1.390000 1.080000Group 2 0.510000 0.880000 1.390000 1.080000
Group 1: Shares purchased prior to 16 April 2014 Group 2: Shares purchased from 16 April 2014 to 15 October 2014
OPEN GLOBAL PROPERTY FUND

25OPEN GLOBAL RETURN FUND
Investment Objective
To provide capital growth and income by investing in a broad range of asset classes across global markets.
Investment Policy
To invest primarily in collective investment schemes that in turn invest in fixed income securities, equities, property, commodities and derivatives.
Investment Strategy
With effect from 1 July 2014:
To derive capital growth and income for investors over the medium to longer-term by maintaining exposure consistently to a diverse set of asset classes including, global, regional and thematic equities, sovereign developed markets, corporate, high yield and emerging market bonds, property, commodities and a diverse set of absolute return strategies and cash.
Portfolio Activity
Recent months have seen divergence in economic performance between continued steady expansion in the US and a marked weakening in the eurozone where falling inflation expectations have been a growing concern. Currency markets have reacted to these developments with the US dollar strengthening. Globally, growth remains a challenging issue with Japan and China supporting their economies through stimulus programmes, although Chinese growth is changing shape. Equity markets were volatile but went up over the period. The investors in the Fund benefited from the decline in the value of the pound. Equity markets were impacted by a bout of risk aversion at the end of the period while government bond yields hit fresh lows for the year and continue to look unattractive.
Against this backdrop the portfolio’s equity overweight was reduced earlier in the year to a moderate level and we are comfortable with this positioning, although acknowledging that equities appear somewhat more attractively valued than prior to recent events. Whilst government bond prices remained stable, the price of high yield corporate bonds started to fall thus offering a greater relative value. Tactically we moved the portfolio to a more defensive stance as the period progressed, although the magnitude of the changes in the portfolio were relatively small.
There was a small reduction in exposure to Developed Market Equities and a circa 1.5% reduction in High Yield Bonds (bonds which make higher income payments on the basis of their credit ratings) while Emerging Market Equities exposure was allowed to rise along with exposure to the Global Aggregate Sector. At the individual fund level we exited the Schroder European Alpha Plus Fund following a change in our underlying fund research view while introducing the Ardevora Global Long Only Equity Fund to the portfolio, thus developing the global approach to equity investing in the portfolio, further.
Major purchases included: Ardevora Global Long Only Equity Fund, HSBC ISF MultiAlpha Global Equity Fund and HSBC ISF MultiAlpha Global Aggregate Bond Fund.
Major sales included: Schroder European Alpha Plus Fund, HSBC ISF MultiAlpha Global Equity Fund and HSBC ISF MultiAlpha Global High Yield Bond Fund.
Investment Performance
During the period under review, the value of the shares in the Fund increased by 1.81%.
(Source: Morningstar Direct, GBP, UK net of tax, for the Retail Accumulation share class. Returns based on the NAV, which is a single price.)
Please note that the above information refers to the past and that past performance is not a reliable indication of future returns.
Fund Particulars as at 16 October 2014 (unaudited)
Retail Income
Retail Accumulation
Income C Accumulation C
Price 136.8p xd 141.5p 137.3p xd 143.2p
Distribution payable (on 15 December 2014) per share net 0.410000p 0.420000p 0.770000p 0.800000p
Current net estimated yield 0.34% 0.34% 0.86% 0.85%
Annual ACD charge 1.25% 1.25% 0.55% 0.55%
Open Global Return Fund

26 OPEN GLOBAL RETURN FUND
Portfolio Statement as at 15 October 2014 (unaudited)
Security Holding Bid Totalvalue net£’000 assets
%Absolute Return - 10.21% (10.24%)
*Exane Archimedes Fund 289 3,819 1.40*Exane Ceres Fund 290 3,425 1.25
Henderson UK Absolute Return Fund 4,677,870 6,582 2.41*Majedie Tortoise Fund 3,393,480 5,732 2.09*Melchior Selected Trust European Absolute Return Fund 31,708 3,608 1.32*Pensato Europa Absolute Return Fund 44,026 4,758 1.74
Total Absolute Return 27,924 10.21
Asia-Pacific (excluding Japan) Equities - 2.33% (2.31%) *Tiburon Taipan Unhedged GBP Fund 5,059 6,362 2.33
Total Asia-Pacific (excluding Japan) Equities 6,362 2.33
Commodities - 2.78% (3.09%) Artemis Global Energy Fund 12,825,224 4,435 1.62
*Schroder Alternative Solutions Commodity Fund 36,122 3,160 1.16 Total Commodities 7,595 2.78
European Equities - 0.00% (2.81%)
Global Aggregate Bonds - 5.91% (4.64%) *+HSBC ISF MultiAlpha Global Aggregate Bond Fund 975,432 11,285 4.12*M&G European Loan Fund 56,455 4,895 1.79
Total Global Aggregate Bonds 16,180 5.91
Global Emerging Markets Debt - 8.13% (8.14%) *Ashmore SICAV Emerging Markets Corporate Debt Fund 44,101 2,757 1.01*Ashmore SICAV Emerging Markets Local Currency Bond Fund 46,858 2,929 1.07*BTG Pactual SICAV Emerging Markets Local Currency Bond Fund 264,455 1,710 0.63*GS Global Emerging Markets Debt Portfolio 493,961 5,773 2.11*Stone Harbor Emerging Markets Local Currency Debt Fund 20,173 3,521 1.29*Wellington Opportunistic Emerging Markets Debt Portfolio 818,154 5,538 2.02
Total Global Emerging Markets Debt 22,228 8.13
Global Emerging Markets Equities - 6.77% (6.18%) *+HSBC ISF MultiAlpha Global Emerging Markets Equity Fund 1,536,303 10,120 3.70*Polar Capital Emerging Markets Growth Fund 489,222 3,043 1.11*Polunin Emerging Markets Developing Countries Fund 10,103 5,352 1.96
Total Global Emerging Markets Equities 18,515 6.77
Global Equities - 23.68% (21.90%) Ardevora Global Long Only Equity Fund 7,553,521 7,699 2.82
Artisan Global Opportunities Fund 912,714 9,439 3.45*+HSBC ISF MultiAlpha Global Equity Fund 3,251,487 27,564 10.08

27OPEN GLOBAL RETURN FUND
Portfolio Statement as at 15 October 2014 (unaudited)
Security Holding Bid Totalvalue net£’000 assets
%^Impax Environmental Markets Fund 1,645,000 2,278 0.83
Invesco Perpetual Global Opportunities Fund 12,875,920 10,865 3.97*Polar Capital Global Technology Fund 202,884 2,534 0.93*Polar Capital Healthcare Opportunities Fund 217,933 4,385 1.60
Total Global Equities 64,764 23.68
Global Government Bonds - 2.41% (2.56%) M&G Optimal Income Fund 3,399,520 6,581 2.41
Total Global Government Bonds 6,581 2.41
Global High Yield Bonds - 3.92% (5.18%) *+HSBC ISF MultiAlpha Global High Yield Bond Fund 979,170 10,722 3.92
Total Global High Yield Bonds 10,722 3.92
Global Property Equities Funds - 4.94% (4.66%) *+HSBC ISF MultiAlpha Global Real Estate Equity Fund 1,536,120 13,517 4.94
Total Global Property Equities Funds 13,517 4.94
Gold - 1.10% (1.23%) *ETFS Physical Gold 39,947 3,025 1.10
Total Gold 3,025 1.10
Infrastructure - 2.45% (2.31%) ^Bilfinger Berger Global Infrastructure SICAV 3,476,728 4,172 1.53
+^HICL Infrastructure 1,737,216 2,519 0.92 Total Infrastructure 6,691 2.45
Japanese Equities - 2.31% (2.06%) *iShares MSCI Japan Monthly GBP Hedged UCITS ETF 127,533 5,240 1.92*iShares MSCI Japan UCITS ETF 157,272 1,075 0.39
Total Japanese Equities 6,315 2.31
Direct Property Funds - 6.55% (6.17%) Aviva Investors Property Trust 1,762,747 2,022 0.74
^F&C Commercial Property Trust 1,106,380 1,383 0.51 Henderson UK Property Unit Trust 4,831,926 5,644 2.06 Ignis UK Property Fund 6,510,483 6,520 2.38 SWIP Property Trust 1,786,377 2,340 0.86 Total Direct Property Funds 17,909 6.55
UK Corporate Bonds - 6.81% (6.56%) Henderson Sterling Bond 2,763,984 2,926 1.07
*+HSBC ISF MultiAlpha Sterling Bond Fund 1,039,793 12,716 4.65 Invesco Perpetual Corporate Bond Fund 3,322,196 2,996 1.09 Total UK Corporate Bonds 18,638 6.81

28 OPEN GLOBAL RETURN FUND
Portfolio Statement as at 15 October 2014 (unaudited)
Security Holding Bid Totalvalue net£’000 assets
%
UK Equities - 4.40% (3.89%) Artemis UK Smaller Companies Fund 416,753 4,149 1.52
JOHCM UK Dynamic Fund 3,945,240 7,894 2.88 Total UK Equities 12,043 4.40
Forward Foreign Exchange Contracts - -0.06% (0.01%) #Sold €9,060,778 for £7,084,514 settled 6/1/2015 (177) (0.06)
Total Forward Foreign Exchange Contracts (177) (0.06)
Portfolio of investments 258,832 94.64
Net other assets 14,668 5.36
Net assets 273,500 100.00 *offshore fund +related party #unlisted ^listed Figures in brackets denote comparative percentage holdings as at 15 April 2014. All holdings are authorised investment funds unless otherwise stated. Total purchases for the period, including transaction charges, were £41,630,444. Total sales for the period, net of transaction charges, were £16,559,886.

29OPEN GLOBAL RETURN FUND
as at 15 April Net asset value Net asset value Shares in per share issue
(£) (p)
2012Retail Income 46,838,702 121.1 38,668,290 Retail Accumulation 118,799,379 123.9 95,906,063
2013Retail Income 50,725,407 132.8 38,204,313 Retail Accumulation 120,433,391 136.4 88,271,467 Income C† 351,509 133.1 264,119 Accumulation C† 21,223,504 136.9 15,507,204
2014Retail Income 46,351,165 135.0 34,333,441 Retail Accumulation 102,645,359 139.2 73,722,307 Income C 5,128,515 135.5 3,785,439 Accumulation C 91,916,403 140.5 65,430,835
2014*Retail Income 42,965,802 136.9 31,395,026 Retail Accumulation 89,929,303 141.6 63,525,339 Income C 7,999,503 137.3 5,824,477 Accumulation C 132,605,781 143.2 92,599,805
*as at 15 October†The Income C and Accumulation C share classes were launched on 3 September 2012.
Comparative Tablefor the six months ended 15 October 2014 (unaudited)

30 OPEN GLOBAL RETURN FUND
Net income Highest share Lowest shareper share price price
(p) (p) (p)
Calendar year2009Retail Income 0.310000 110.5 90.96Retail Accumulation 0.310000 112.0 92.06
2010Retail Income 0.010910 120.6 108.5Retail Accumulation 0.019703 122.4 110.1
2011Retail Income 0.666490 123.2 113.6Retail Accumulation 0.686572 125.3 115.6
2012Retail Income 0.555784 125.3 117.4Retail Accumulation 0.587094 128.5 120.0Income C† 0.100000 125.7 122.0Accumulation C† 0.100000 128.7 125.0
2013Retail Income 0.617564 138.3 124.9Retail Accumulation 0.631398 142.1 128.1Income C 1.318321 138.7 125.3Accumulation C 1.362678 142.6 128.3
2014*Retail Income 0.564370 143.4 134.2Retail Accumulation 0.577874 147.9 138.2Income C 1.260262 144.2 134.9Accumulation C 1.305764 149.5 139.3
*to 15 October†The Income C and Accumulation C share classes were launched on 3 September 2012.
Comparative Tablefor the year ended 15 April 2012

31OPEN GLOBAL RETURN FUND
2014Retail Income 2.18%Retail Accumulation 2.18%Income C 1.53%Accumulation C 1.53%
as at 15 April2014Retail Income 2.17%Retail Accumulation 2.17%Income C 1.52%Accumulation C 1.52%
Ongoing Charges Figure (OCF) as at 15 October

32
Statement of Total Returnfor the six months ended 15 October 2014 (unaudited)
15.10.14 15.10.13£’000 £’000 £’000 £’000
Income Net capital gains 3,218 2,924 Revenue 2,534 1,846 Expenses (1,367) (1,240)Net revenue before taxation 1,167 606 Taxation (89) (92)Net revenue after taxation for the period 1,078 514 Total return before distributions 4,296 3,438 Finance costs: Distributions (1,091) (642)Change in net assets attributable to shareholders from investment activities 3,205 2,796
Statement of Change in Net Assets Attributable to Shareholdersfor the six months ended 15 October 2014 (unaudited)
15.10.14 15.10.13£’000 £’000 £’000 £’000
Opening net assets attributable to shareholders 246,041 192,734 Amounts receivable on creation of shares 39,254 40,100 Amounts payable on cancellation of shares (16,005) (13,909)
23,249 26,191 Stamp duty reserve tax (3) (24)Change in net assets attributable to shareholders frominvestment activities (see Statement of Total Return above) 3,205 2,796 Retained distribution on accumulation shares 1,008 590 Closing net assets attributable to shareholders 273,500 222,287
Balance Sheet as at 15 October 2014 (unaudited)
15.10.14 15.4.14£’000 £’000 £’000 £’000
AssetsInvestment assets 259,009 231,136 Debtors 897 1,634 Cash and bank balances 16,625 14,165 Total other assets 17,522 15,799 Total assets 276,531 246,935 LiabilitiesInvestment liabilities (177) - Creditors (2,680) (822) Distribution payable on income shares (174) (72)Total other liabilities (2,854) (894)Total liabilities (3,031) (894)Net assets attributable to shareholders 273,500 246,041
OPEN GLOBAL RETURN FUND

33
Distribution Table (pence per share) for the six months ended 15 October 2014 (unaudited)
Net Equalisation Distribution Distributionincome payable paid
15.12.14 15.12.13
Retail IncomeGroup 1 0.410000 - 0.410000 0.340000Group 2 0.200000 0.210000 0.410000 0.340000
Retail AccumulationGroup 1 0.420000 - 0.420000 0.350000Group 2 0.170000 0.250000 0.420000 0.350000
Income CGroup 1 0.770000 - 0.770000 0.720000Group 2 0.140000 0.630000 0.770000 0.720000
Accumulation CGroup 1 0.800000 - 0.800000 0.740000Group 2 0.400000 0.400000 0.800000 0.740000
Group 1: Shares purchased prior to 16 April 2014 Group 2: Shares purchased from 16 April 2014 to 15 October 2014
OPEN GLOBAL RETURN FUND

34
Investment Objective
To provide capital growth through balanced investment in a broad range of asset classes across global markets.
Investment Policy
With effect from 1 July 2014:
To invest primarily in collective investment schemes that in turn invest in fixed income securities, equities, property and derivatives. The ACD may also invest at its discretion in other transferable securities, money market instruments, deposits, cash and near cash.
On giving 60 days’ notice to Shareholders, the Fund may, in addition to its other investment powers, use exchange traded and over the counter derivatives and forward currency contracts for investment purposes. Using these investment powers for investment purposes means, in particular, maintaining positions in these investments for the long term rather than just for tactical short-term purposes.
Where the use of derivatives is for investment purposes in addition to hedging it is envisaged that the use of such instruments will not affect the overall risk profile of the Fund.
Investment Strategy
With effect from 1 July 2014:
The Fund follows a broadly diversified investment approach by investing primarily in other collective investment schemes that, in turn, invest across various different asset classes. Such asset classes shall include traditional asset classes, such as equities and fixed income, but also alternative asset classes, for example property. The Manager uses a complex quantitative investment process with a qualitative overlay to identify the optimal portfolio construction.
Portfolio Activity
The World Selection Balanced Portfolio posted good positive returns over the reporting period. For the larger part of the period, performance was mainly driven by the allocation toward riskier asset classes, such as equities and global high yield bonds. In September and the first half of October, nervousness amongst investors increased as the strength of the US economy gave rise to expectations of a less accommodative monetary policy stance of the US Federal Reserve Bank in 2015. Economic newsflow from the Eurozone remained fragile over the period. Economic and geopolitical risks over the reporting period, such as some soft economic data releases from emerging markets and the Ukraine crisis, again demonstrated the importance of portfolio diversification. The portfolio maintained a bias towards equities and away from government bonds over the reporting period. The medium-term prospective return on core government bonds should remain poor given historically low yield levels. Global equities appear comparatively better value and we anticipate global equity markets will continue to grind moderately higher over the medium term. Towards the end of the period, exposure to global high yield debt was increased given what we perceived to be improved starting valuations. A reduced allocation to the asset class was held throughout Q3, a position that successfully added value on a relative basis. The portfolio’s allocation to global investment grade credit was decreased to accommodate the move. Investment grade spreads remained relatively tight, and little changed, over the course of Q3 as high yield spreads moved wider. A number of enhancements were made to the portfolio’s strategy over the reporting period. Without changing the core investment objective of the World Selection proposition, these changes ensure the portfolio reflects our latest thinking on multi-asset investing. For example, we now employ even stricter asset class selection criteria for asset classes to be included in World Selection’s long term asset mixes. We have also increased the frequency of reviews of the asset allocation and the related input data by moving from annual to now quarterly reviews. These enhancements should provide an even more robust global portfolio to World Selection investors.An increased emphasis on the cost efficient fulfilment of the portfolio’s asset allocation resulted in a move away from actively managed third party funds and a greater allocation towards HSBC managed and passive investment vehicles. These changes ensure the portfolio can now be delivered at a lower cost to the World Selection investor, without comprising the investment outcome.Major purchases included: HSBC FTSE All-World Index Fund, HSBC GIF Global Corporate Bond Fund and HSBC ESI Worldwide Equity UCITS ETF.Major sales included: HSBC ISF MultiAlpha Europe Equity Fund, HSBC ISF MultiAlpha Global Aggregate Bond Fund and HSBC ISF MultiAlpha Japan Equity Fund.
Investment Performance
During the period under review, the value of the shares in the Fund increased by 3.38%.(Source: Morningstar Direct, GBP, UK net of tax, for the Retail Accumulation share class. Returns based on the NAV, which is a single price.)Please note that the above information refers to the past and that past performance is not a reliable indication of future returns.
World Selection - Balanced Portfolio
Fund Particulars as at 16 October 2014 (unaudited)
Retail Income
Retail Accumulation
Institutional Accumulation
Income C Accumulation C
Price 149.5p xd 154.9p 163.0p 149.7p xd 156.4p
Distribution payable (on 15 December 2014) per share net
0.630000p 0.630000p 1.480000p 0.980000p 1.010000p
Current net estimated yield 0.75% 0.74% 1.73% 1.27% 1.25%
Annual ACD charge 1.25% 1.25% 0.00% 0.55% 0.55%
WORLD SELECTION - BALANCED PORTFOLIO

35
Portfolio Statement as at 15 October 2014 (unaudited)
Security Holding Bid Totalvalue net£’000 assets
%Asia-Pacific (excluding Japan) Equities - 0.00% (2.50%)
European Equities - 0.00% (14.95%) **Banco Popular Español 136,883 1 0.00**Repsol rights 34,817 14 0.00
Total European Equities 15 0.00
Direct Property Funds - 1.29% (1.28%) Henderson UK Property Fund 9,237,606 9,919 0.66
M&G Property Portfolio 8,842,148 9,572 0.63 Total Direct Property Funds 19,491 1.29
Hedge Funds - 0.00% (0.87%)
Commodities - 0.00% (1.49%)
Japanese Equities - 1.48% (9.40%) +HSBC Japan Index Fund 35,207,953 22,403 1.48
Total Japanese Equities 22,403 1.48
Global Emerging Markets Equities - 0.00% (3.90%)
Global Property Equities Funds - 4.71% (3.03%) *+HSBC ISF MultiAlpha Global Real Estate Equity Fund 8,112,270 71,385 4.71
Total Global Property Equities Funds 71,385 4.71
US Equities - 0.00% (15.50%)
UK Equities - 1.44% (14.78%) +HSBC FTSE All-Share Index Fund 7,536,826 21,827 1.44**McBride non-cumulative redeemable preference 254,940 0 0.00**Persimmon 13,454 9 0.00**Persimmon C 79,909 56 0.00
Total UK Equities 21,892 1.44
Global Equities - 45.43% (0.00%) *+HSBC ESI Worldwide Equity UCITS ETF 24,368,167 207,437 13.69 +HSBC FTSE All-World Index Fund 453,056,663 446,397 29.45*+HSBC Worldwide Equity UCITS ETF 3,785,213 34,751 2.29
Total Global Equities 688,585 45.43
UK Government Bonds - 0.00% (6.54%)
US Government Bonds - 0.00% (0.00%) US Treasury 0% 2/1/2015 $400 0 0.00
Total US Government Bonds 0 0.00
WORLD SELECTION - BALANCED PORTFOLIO

36
Portfolio Statement as at 15 October 2014 (unaudited)
Security Holding Bid Totalvalue net£’000 assets
%Global Government Bonds - 4.12% (0.00%)
*+HSBC GIF Global Government Bond Fund 9,613,887 62,474 4.12 Total Global Government Bonds 62,474 4.12
Global Corporate Bonds - 24.19% (0.00%) *+HSBC GIF Global Corporate Bond Fund 56,970,992 366,571 24.19
Total Global Corporate Bonds 366,571 24.19
Global High Yield Bonds - 5.99% (4.34%) *+HSBC GIF Global High Yield Bond Fund 5,873,185 36,630 2.42*+HSBC ISF MultiAlpha Global High Yield Bond Fund 7,890,649 54,141 3.57
Total Global High Yield Bonds 90,771 5.99
Global Aggregate Bonds - 0.00% (11.87%)
Global Emerging Markets Debt - 10.23% (6.80%) *+HSBC GIF Global Emerging Markets Bond Fund 5,763,140 77,313 5.10*+HSBC GIF Global Emerging Markets Local Debt Fund 10,867,348 77,689 5.13
Total Global Emerging Markets Debt 155,002 10.23
Forward Foreign Exchange Contracts - -0.39% (0.03%) #Sold $944,121,412 for £586,914,332 settled 31/10/2014 (5,421) (0.36)#Sold ¥4,077,660,875 for £23,602,451 settled 31/10/2014 (487) (0.03)
Total Forward Foreign Exchange Contracts (5,908) (0.39) Portfolio of investments 1,492,681 98.49
Net other assets 22,960 1.51
Net assets 1,515,641 100.00 *offshore fund **equity shares +related party #unlisted Figures in brackets denote comparative percentage holdings as at 15 April 2014.
All holdings are authorised investment funds unless otherwise stated. Total purchases for the period, including transaction charges, were £3,091,058,178.
Total sales for the period, net of transaction charges, were £3,054,551,782.
WORLD SELECTION - BALANCED PORTFOLIO

37WORLD SELECTION - BALANCED PORTFOLIO
as at 15 April Net asset value Net asset value Shares in per share issue
(£) (p)
2012Retail Income 11,354,030 125.7 9,029,948 Retail Accumulation 1,194,708,713 127.6 935,995,928 Institutional Accumulation 43,016,328 130.9 32,868,324
2013Retail Income 11,220,644 141.9 7,905,549 Retail Accumulation 1,209,208,903 145.4 831,766,304 Institutional Accumulation 65,226,439 150.7 43,288,466 Income C† 1,614,452 142.2 1,135,514 Accumulation C† 86,483,793 145.7 59,354,765
2014Retail Income 6,612,895 146.4 4,516,642 Retail Accumulation 1,054,118,836 151.1 697,578,833 Institutional Accumulation 76,626,937 158.3 48,417,558 Income C 6,750,511 146.6 4,603,494 Accumulation C 303,677,590 152.2 199,476,597
2014*Retail Income 6,057,091 150.4 4,027,347 Retail Accumulation 973,986,110 155.9 624,931,882 Institutional Accumulation 80,665,686 164.1 49,171,489 Income C 7,407,152 150.6 4,917,550 Accumulation C 447,525,329 157.4 284,332,068
*as at 15 October†The Income C and Accumulation C share classes were launched on 3 December 2012.
Comparative Tablefor the six months ended 15 October 2014 (unaudited)
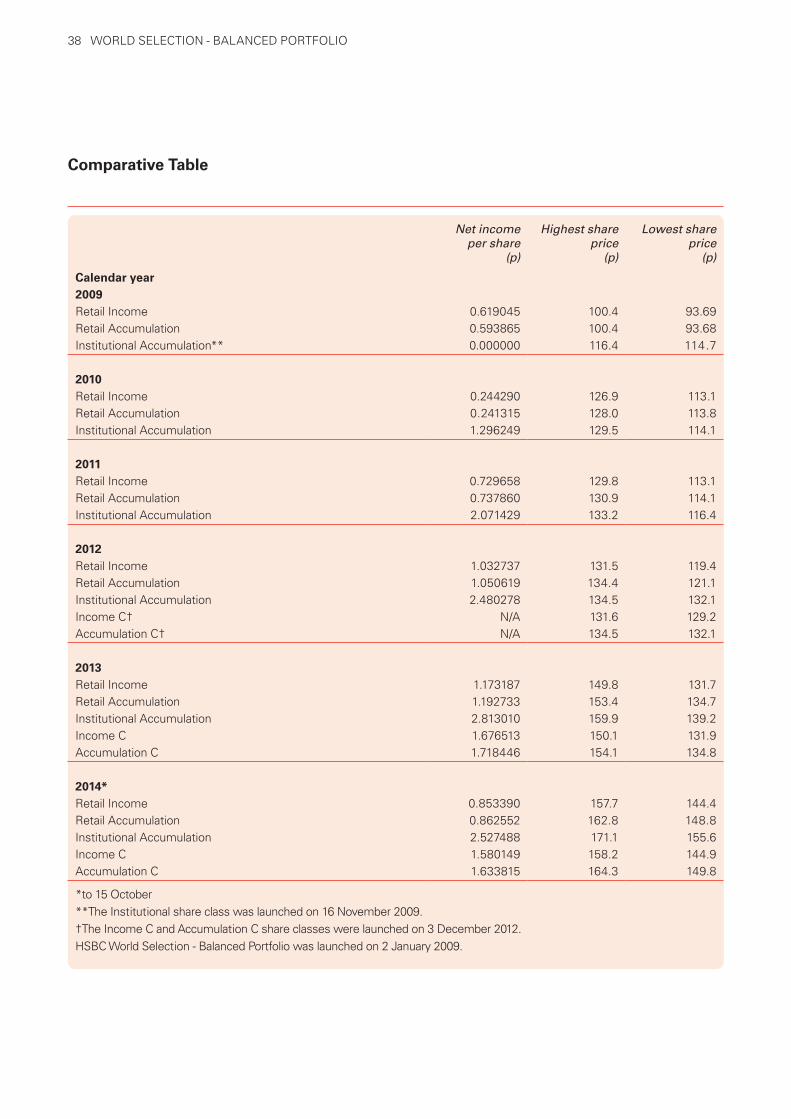
38 WORLD SELECTION - BALANCED PORTFOLIO
Net income Highest share Lowest shareper share price price
(p) (p) (p)
Calendar year2009Retail Income 0.619045 100.4 93.69Retail Accumulation 0.593865 100.4 93.68Institutional Accumulation** 0.000000 116.4 114.7
2010Retail Income 0.244290 126.9 113.1Retail Accumulation 0.241315 128.0 113.8Institutional Accumulation 1.296249 129.5 114.1
2011Retail Income 0.729658 129.8 113.1Retail Accumulation 0.737860 130.9 114.1Institutional Accumulation 2.071429 133.2 116.4
2012Retail Income 1.032737 131.5 119.4Retail Accumulation 1.050619 134.4 121.1Institutional Accumulation 2.480278 134.5 132.1Income C† N/A 131.6 129.2Accumulation C† N/A 134.5 132.1
2013Retail Income 1.173187 149.8 131.7Retail Accumulation 1.192733 153.4 134.7Institutional Accumulation 2.813010 159.9 139.2Income C 1.676513 150.1 131.9Accumulation C 1.718446 154.1 134.8
2014*Retail Income 0.853390 157.7 144.4Retail Accumulation 0.862552 162.8 148.8Institutional Accumulation 2.527488 171.1 155.6Income C 1.580149 158.2 144.9Accumulation C 1.633815 164.3 149.8
*to 15 October**The Institutional share class was launched on 16 November 2009.†The Income C and Accumulation C share classes were launched on 3 December 2012.HSBC World Selection - Balanced Portfolio was launched on 2 January 2009.
Comparative Tablefor the year ended 15 April 2012

39WORLD SELECTION - BALANCED PORTFOLIO
2014Retail Income 1.58%Retail Accumulation 1.58%Institutional Accumulation 0.28%Income C 0.93%Accumulation C 0.93%
as at 15 April2014Retail Income 1.89%Retail Accumulation 1.89%Institutional Accumulation 0.59%Income C 1.24%Accumulation C 1.24%
Ongoing Charges Figure (OCF) as at 15 October

40
Statement of Total Returnfor the six months ended 15 October 2014 (unaudited)
15.10.14 15.10.13£’000 £’000 £’000 £’000
Income Net capital gains 39,357 34,444 Revenue 15,562 17,608 Expenses (8,181) (8,290)Finance costs: Interest (10) - Net revenue before taxation 7,371 9,318 Taxation (57) - Net revenue after taxation for the period 7,314 9,318 Total return before distributions 46,671 43,762 Finance costs: Distributions (7,438) (9,468)Change in net assets attributable to shareholders from investment activities 39,233 34,294
Statement of Change in Net Assets Attributable to Shareholdersfor the six months ended 15 October 2014 (unaudited)
15.10.14 15.10.13£’000 £’000 £’000 £’000
Opening net assets attributable to shareholders 1,447,787 1,373,754 Amounts receivable on creation of shares 92,777 93,399 Amounts payable on cancellation of shares (71,664) (97,046)
21,113 (3,647)Stamp duty reserve tax (28) (283)Change in net assets attributable to shareholders frominvestment activities (see Statement of Total Return above) 39,233 34,294 Retained distribution on accumulation shares 7,536 9,447 Closing net assets attributable to shareholders 1,515,641 1,413,565
Balance Sheet as at 15 October 2014 (unaudited)
15.10.14 15.4.14£’000 £’000 £’000 £’000
AssetsInvestment assets 1,498,589 1,408,528 Debtors 34,715 7,578 Cash and bank balances 36,975 49,683 Total other assets 71,690 57,261 Total assets 1,570,279 1,465,789 LiabilitiesInvestment liabilities (5,908) (125) Creditors (48,656) (17,839) Distribution payable on income shares (74) (38)Total other liabilities (48,730) (17,877)Total liabilities (54,638) (18,002)Net assets attributable to shareholders 1,515,641 1,447,787
WORLD SELECTION - BALANCED PORTFOLIO

41WORLD SELECTION - BALANCED PORTFOLIO
Distribution Table (pence per share) for the six months ended 15 October 2014 (unaudited)
Net Equalisation Distribution Distributionincome payable paid
15.12.14 15.12.13
Retail IncomeGroup 1 0.630000 - 0.630000 0.900000Group 2 0.430000 0.200000 0.630000 0.900000
Retail AccumulationGroup 1 0.630000 - 0.630000 0.920000Group 2 0.420000 0.210000 0.630000 0.920000
Institutional AccumulationGroup 1 1.480000 - 1.480000 1.780000Group 2 0.640000 0.840000 1.480000 1.780000
Income CGroup 1 0.980000 - 0.980000 1.300000Group 2 0.260000 0.720000 0.980000 1.300000
Accumulation CGroup 1 1.010000 - 1.010000 1.330000Group 2 0.440000 0.570000 1.010000 1.330000
Group 1: Shares purchased prior to 16 April 2014 Group 2: Shares purchased from 16 April 2014 to 15 October 2014

42 WORLD SELECTION - CAUTIOUS PORTFOLIO
Investment Objective
To provide capital growth through cautious investment in a broad range of asset classes across global markets.
Investment Policy
With effect from 1 July 2014:
To invest primarily in collective investment schemes that in turn invest in fixed income securities, equities, property and derivatives. Typically the Fund will have a bias towards asset classes that focus on fixed interest strategies. The ACD may also invest at its discretion in other transferable securities, money market instruments, deposits, cash and near cash.
On giving 60 days’ notice to Shareholders, the Fund may, in addition to its other investment powers, use exchange traded and over the counter derivatives and forward currency contracts for investment purposes. Using these investment powers for investment purposes means, in particular, maintaining positions in these investments for the long term rather than just for tactical short-term purposes.
Where the use of derivatives is for investment purposes in addition to hedging it is envisaged that the use of such instruments will not affect the overall risk profile of the Fund.
Investment Strategy
With effect from 1 July 2014:
The Fund follows a broadly diversified investment approach by investing primarily in other collective investment schemes that, in turn, invest across various different asset classes. Such asset classes shall include traditional asset classes, such as equities and fixed income, but also alternative asset classes, for example property. The Manager uses a complex quantitative investment process with a qualitative overlay to identify the optimal portfolio construction.
Portfolio Activity
The World Selection Cautious Portfolio posted good positive returns over the reporting period. For the larger part of the period, performance was mainly driven by the allocation toward riskier asset classes, such as equities and global high yield bonds. In September and the first half of October, nervousness amongst investors increased as the strength of the US economy gave rise to expectations of a less accommodative monetary policy stance of the US Federal Reserve Bank in 2015. Economic newsflow from the Eurozone remained fragile over the period. Economic and geopolitical risks over the reporting period, such as some soft economic data releases from emerging markets and the Ukraine crisis, again demonstrated the importance of portfolio diversification. The portfolio maintained a bias towards equities and away from government bonds over the reporting period. The medium-term prospective return on core government bonds should remain poor given historically low yield levels. Global equities appear comparatively better value and we anticipate global equity markets will continue to grind moderately higher over the medium term. Towards the end of the period, exposure to global high yield debt was increased given what we perceived to be improved starting valuations. A reduced allocation to the asset class was held throughout Q3, a position that successfully added value on a relative basis. The portfolio’s allocation to global investment grade credit was decreased to accommodate the move. Investment grade spreads remained relatively tight, and little changed, over the course of Q3 as high yield spreads moved wider. A number of enhancements were made to the portfolio’s strategy over the reporting period. Without changing the core investment objective of the World Selection proposition, these changes ensure the portfolio reflects our latest thinking on multi-asset investing. For example, we now employ even stricter asset class selection criteria for asset classes to be included in World Selection’s long term asset mixes. We have also increased the frequency of reviews of the asset allocation and the related input data by moving from annual to now quarterly reviews. These enhancements should provide an even more robust global portfolio to World Selection investors.An increased emphasis on the cost efficient fulfilment of the portfolio’s asset allocation resulted in a move away from actively managed third party funds and a greater allocation towards HSBC managed and passive investment vehicles. These changes ensure the portfolio can now be delivered at a lower cost to the World Selection investor, without comprising the investment outcome. Major purchases included: HSBC GIF Global Corporate Bond Fund, HSBC GIF Global Government Bond Fund and HSBC Sterling Liquidity Fund.Major sales included: HSBC ISF MultiAlpha Global Aggregate Bond Fund, HSBC Sterling Liquidity Fund and HSBC UK Gilt Index Fund.
Investment Performance
During the period under review, the value of the shares in the Fund increased by 3.10%.(Source: Morningstar Direct, GBP, UK net of tax, for the Retail Accumulation share class. Returns based on the NAV, which is a single price.)Please note that the above information refers to the past and that past performance is not a reliable indication of future returns.
World Selection - Cautious Portfolio
Fund Particulars as at 16 October 2014 (unaudited)
Retail Income
Retail Accumulation
Institutional Accumulation
Income C Accumulation C
Price 124.1p xd 129.7p 136.4p 124.4p xd 131.0p
Distribution payable (on 15 December 2014) per share net
0.410000p 0.430000p 1.150000p 0.740000p 0.770000p
Current net estimated yield 0.79% 0.79% 1.77% 1.31% 1.29%
Annual ACD charge 1.25% 1.25% 0.00% 0.55% 0.55%

43WORLD SELECTION - CAUTIOUS PORTFOLIO
Portfolio Statement as at 15 October 2014 (unaudited)
Security Holding Bid Totalvalue net£’000 assets
%Absolute Return - 0.00% (3.73%)
Asia-Pacific (excluding Japan) Equities - 0.00% (0.67%)
Commodities - 0.00% (1.48%) European Equities - 0.00% (6.88%)
^Banco Popular Español 9,989 0 0.00^Repsol rights 2,540 1 0.00
Total European Equities 1 0.00
Global Aggregate Bonds - 0.00% (26.46%)
Global Corporate Bonds - 20.52% (0.00%)*+HSBC GIF Corporate Bond Fund 26,093,772 167,897 20.52
Total Global Corporate Bonds 167,897 20.52
Global Emerging Markets Debt - 10.13% (6.22%) *+HSBC GIF Emerging Markets Bond Fund 3,097,684 41,556 5.08*+HSBC GIF Global Emerging Markets Local Debt Fund 5,777,390 41,302 5.05
Total Global Emerging Markets Debt 82,858 10.13
Global Equities - 12.55% (0.00%) *+HSBC ESI Worldwide Equity UCITS ETF 3,509,004 29,871 3.65*+HSBC FTSE All-World Index Fund 73,874,386 72,788 8.90
Total Global Equities 102,659 12.55
Global Government Bonds - 17.87% (0.00%) *+HSBC GIF Government Bond Fund 22,502,390 146,228 17.87
Total Global Government Bonds 146,228 17.87
Global High Yield Bonds - 3.48% (4.15%) *+HSBC ISF MultiAlpha Global High Yield Bond Fund 4,155,323 28,511 3.48
Total Global High Yield Bonds 28,511 3.48
Global Property Equities Funds - 4.49% (2.72%) *+HSBC ISF MultiAlpha Global Real Estate Equity Fund 4,173,391 36,724 4.49
Total Global Property Equities Funds 36,724 4.49
Hedge Funds - 0.00% (0.80%)
Japanese Equities - 0.97% (3.23%) +HSBC Japan Index Fund 12,472,392 7,936 0.97
Total Japanese Equities 7,936 0.97

44 WORLD SELECTION - CAUTIOUS PORTFOLIO
Portfolio Statement as at 15 October 2014 (unaudited)
Security Holding Bid Totalvalue net£’000 assets
%Money Market - 0.00% (3.02%) *+HSBC Sterling Liquidity Fund 1,756 2 0.00
Total Money Market 2 0.00
Direct Property Funds - 1.47% (1.39%) Henderson UK Property Unit Trust 4,425,730 4,752 0.58
M&G Property Portfolio Fund 6,708,702 7,262 0.89 Total Direct Property Funds 12,014 1.47
UK Equities - 0.94% (5.91%) +HSBC FTSE All-Share Index Fund 2,669,915 7,732 0.94^McBride non-cumulative redeemable preference share 58,536 0 0.00^Persimmon 3,036 2 0.00^Persimmon C 5,831 4 0.00
Total UK Equities 7,738 0.94
UK Government Bonds - 4.54% (22.48%) Treasury 1.25% 22/7/2018 £3,323,600 3,348 0.41
Treasury 1.75% 22/7/2019 £482,800 494 0.06 Treasury 1.75% 7/9/2022 £397,000 398 0.05 Treasury 2.25% 7/9/2023 £4,091,300 4,223 0.52 Treasury 3.25% 22/1/2044 £3,190,600 3,509 0.43 Treasury 3.75% 7/9/2020 £3,273,300 3,703 0.45 Treasury 4% 7/9/2016 £867,600 924 0.11 Treasury 4% 22/1/2060 £1,522,900 2,025 0.25 Treasury 4.25% 7/12/2027 £4,357,700 5,359 0.66 Treasury 4.25% 7/3/2036 £2,619,900 3,312 0.40 Treasury 4.25% 7/12/2046 £930,800 1,230 0.15 Treasury 4.25% 7/12/2055 £1,070,100 1,474 0.18 Treasury 4.5% 7/3/2019 £1,264,300 1,447 0.18 Treasury 4.75% 7/3/2020 £1,406,800 1,656 0.20 Treasury 4.75% 7/12/2038 £1,054,000 1,446 0.18 Treasury 5% 7/3/2018 £446,300 507 0.06 Treasury 6% 7/12/2028 £1,428,900 2,078 0.25 Total UK Government Bonds 37,133 4.54
US Equities - 0.00% (6.56%)
US Government Bonds - 5.66% (0.00%) US Treasury 0% 2/1/2015 $500 0 0.00
US Treasury 0.25% 15/5/2016 $15,800,000 9,919 1.21 US Treasury 0.875% 15/4/2017 $12,600,000 7,975 0.97 US Treasury 1% 31/5/2018 $7,200,000 4,517 0.55 US Treasury 1.25% 30/11/2018 $821,100 517 0.06 US Treasury 1.375% 31/5/2020 $12,130,000 7,567 0.93 US Treasury 1.5% 31/12/2018 $1,819,500 1,157 0.14

45WORLD SELECTION - CAUTIOUS PORTFOLIO
US Treasury 2.5% 15/8/2023 $2,402,000 1,571 0.19 US Treasury 2.5% 15/5/2024 $3,000,000 1,954 0.24 US Treasury 2.875% 15/5/2043 $214,300 134 0.02 US Treasury 3.375% 15/5/2044 $2,240,000 1,544 0.19 US Treasury 3.5% 15/2/2018 $6,360,000 4,333 0.53 US Treasury 3.625% 15/2/2044 $3,146,400 2,268 0.28 US Treasury 4.25% 15/5/2039 $1,201,000 954 0.12 US Treasury 6.125% 15/11/2027 $1,200,000 1,074 0.13 US Treasury 7.25% 15/8/2022 $960,800 843 0.10 Total US Government Bonds 46,327 5.66
Australian Government Bonds - 2.46% (0.00%) Government of Australia 2.75% 21/4/2024 A$3,400,000 1,783 0.22
Government of Australia 3.25% 21/10/2018 A$7,300,000 4,097 0.50 Government of Australia 3.25% 21/4/2029 A$6,510,000 3,408 0.41 Government of Australia 4.75% 15/6/2016 A$8,157,000 4,654 0.57 Government of Australia 5.75% 15/5/2021 A$5,800,000 3,704 0.45 Government of Australia 5.75% 15/7/2022 A$3,900,000 2,524 0.31 Total Australian Government Bonds 20,170 2.46
Belgian Government Bonds - 0.49% (0.00%) Government of Belgium 2.6% 22/6/2024 €16,500 15 0.00
Government of Belgium 1.25% 22/6/2018 €207,100 173 0.02 Government of Belgium 2.25% 22/6/2023 €1,315,700 1,171 0.14 Government of Belgium 3.5% 28/6/2017 €1,277,200 1,118 0.14 Government of Belgium 3.75% 22/6/2045 €458,000 489 0.06 Government of Belgium 4.25% 28/9/2022 €939,700 955 0.12 Government of Belgium 5% 28/3/2035 €48,000 58 0.01 Total Belgian Government Bonds 3,979 0.49
Canadian Government Bonds - 1.74% (0.00%) Government of Canada 1% 1/5/2016 £8,000,000 4,439 0.54
Government of Canada 1.25% 1/2/2016 £475,000 264 0.03 Government of Canada 1.75% 1/3/2019 £2,053,000 1,162 0.14 Government of Canada 1.75% 1/9/2019 £4,380,000 2,476 0.30 Government of Canada 2.5% 1/6/2024 £4,400,000 2,577 0.32 Government of Canada 2.75% 1/6/2022 £2,284,000 1,365 0.17 Government of Canada 3.5% 1/12/2045 £2,880,000 1,956 0.24 Total Canadian Government Bonds 14,239 1.74
Danish Government Bonds - 0.24% (0.00%) Government of Denmark 1.5% 15/11/2023 DKK10,686,700 1,225 0.15
Government of Denmark 2.5% 15/11/2016 DKK6,000,000 679 0.08 Government of Denmark 4% 15/11/2019 DKK379,800 49 0.01 Government of Denmark 4.5% 15/11/2039 DKK90,000 15 0.00 Total Danish Government Bonds 1,968 0.24
Portfolio Statement as at 15 October 2014 (unaudited)
Security Holding Bid Totalvalue net£’000 assets
%

46 WORLD SELECTION - CAUTIOUS PORTFOLIO
Dutch Government Bonds - 0.42% (0.00%) Government of Netherlands 1.25% 15/1/2019 €1,073,500 901 0.11
Government of Netherlands 1.75% 15/7/2023 €115,500 100 0.01 Government of Netherlands 2% 15/7/2024 €180,000 159 0.02 Government of Netherlands 2.25% 15/7/2022 €2,074,700 1,867 0.23 Government of Netherlands 3.75% 15/1/2042 €59,200 69 0.01 Government of Netherlands 4.5% 15/7/2017 €360,300 324 0.04 Total Dutch Government Bonds 3,420 0.42
French Government Bonds - 1.24% (0.00%) Government of France 1% 25/5/2019 €3,660,400 3,036 0.37
Government of France 2.25% 25/5/2024 €2,850,400 2,533 0.31 Government of France 2.5% 25/5/2030 €127,600 113 0.01 Government of France 3% 25/4/2022 €1,011,800 948 0.12 Government of France 3.25% 25/4/2016 €2,702,200 2,270 0.28 Government of France 3.25% 25/5/2045 €129,100 128 0.02 Government of France 4% 25/10/2038 €935,000 1,025 0.12 Government of France 5% 25/10/2016 €123,100 108 0.01 Total French Government Bonds 10,161 1.24
Italian Government Bonds - 2.56% (0.00%) Government of Italy 1.15% 15/5/2017 €267,000 216 0.03
Government of Italy 2.25% 15/5/2016 €4,700,000 3,863 0.47 Government of Italy 2.5% 1/5/2019 €244,000 208 0.03 Government of Italy 3% 1/11/2015 €367,000 302 0.04 Government of Italy 3.5% 1/11/2017 €521,000 451 0.05 Government of Italy 3.5% 1/3/2030 €692,000 587 0.07 Government of Italy 3.75% 1/9/2024 €252,000 226 0.03 Government of Italy 4% 1/2/2037 €490,000 427 0.05 Government of Italy 4.25% 1/2/2019 €3,410,000 3,102 0.38 Government of Italy 4.25% 1/3/2020 €3,360,000 3,107 0.38 Government of Italy 4.5% 15/7/2015 €326,000 269 0.03 Government of Italy 4.5% 1/5/2023 €1,500,000 1,419 0.17 Government of Italy 4.5% 1/3/2024 €457,000 434 0.05 Government of Italy 4.75% 1/6/2017 €106,000 94 0.01 Government of Italy 4.75% 1/9/2028 €4,210,000 4,054 0.50 Government of Italy 4.75% 1/9/2044 €823,000 783 0.10 Government of Italy 5.5% 1/9/2022 €1,410,000 1,415 0.17 Total Italian Government Bonds 20,957 2.56
Japanese Government Bonds - 1.37% (0.00%) Government of Japan 0.1% 15/6/2016 ¥400,000,000 2,365 0.29
Government of Japan 0.3% 20/3/2017 ¥53,150,000 316 0.04 Government of Japan 0.9% 20/3/2022 ¥268,000,000 1,654 0.20 Government of Japan 1.3% 20/3/2019 ¥466,550,000 2,898 0.35 Government of Japan 1.6% 20/3/2033 ¥81,700,000 513 0.06 Government of Japan 1.7% 20/6/2033 ¥73,900,000 470 0.06
Portfolio Statement as at 15 October 2014 (unaudited)
Security Holding Bid Totalvalue net£’000 assets
%

47WORLD SELECTION - CAUTIOUS PORTFOLIO
Government of Japan 1.7% 20/12/2043 ¥70,250,000 422 0.05 Government of Japan 1.7% 20/3/2044 ¥62,300,000 374 0.05 Government of Japan 1.8% 20/3/2043 ¥14,550,000 90 0.01 Government of Japan 1.9% 20/9/2030 ¥209,750,000 1,403 0.17 Government of Japan 1.9% 20/3/2053 ¥10,100,000 62 0.01 Government of Japan 2% 20/12/2033 ¥60,050,000 398 0.05 Government of Japan 2% 20/3/2042 ¥3,100,000 20 0.00 Government of Japan 2.30% 20/3/2039 ¥32,500,000 223 0.03 Total Japanese Government Bonds 11,208 1.37
Spanish Government Bonds - 2.94% (0.00%) Government of Spain 2.1% 30/4/2017 €121,000 101 0.01
Government of Spain 2.75% 30/4/2019 €3,473,000 3,014 0.37 Government of Spain 2.75% 31/10/2024 €42,000 36 0.00 Government of Spain 3.3% 30/7/2016 €7,800,000 6,564 0.80 Government of Spain 3.8% 30/4/2024 €329,000 305 0.04 Government of Spain 4.2% 31/1/2037 €43,000 40 0.00 Government of Spain 4.4% 31/10/2023 €2,200,000 2,127 0.26 Government of Spain 4.5% 31/1/2018 €504,000 454 0.06 Government of Spain 4.7% 30/7/2041 €56,000 56 0.01 Government of Spain 5.15% 31/10/2028 €3,860,000 3,950 0.48 Government of Spain 5.15% 31/10/2044 €902,000 949 0.12 Government of Spain 5.5% 30/4/2021 €3,550,000 3,598 0.44 Government of Spain 5.75% 30/7/2032 €1,291,000 1,433 0.17 Government of Spain 5.85% 31/1/2022 €1,375,000 1,435 0.18 Total Spanish Government Bonds 24,062 2.94
Swedish Government Bonds - 1.18% (0.00%) Government of Sweden 1.5% 13/11/2023 SEK36,710,000 3,319 0.40
Government of Sweden 2.5% 12/5/2025 SEK29,000,000 2,865 0.35 Government of Sweden 3.75% 12/8/2017 SEK25,000,000 2,399 0.29 Government of Sweden 4.25% 12/3/2019 SEK10,955,000 1,119 0.14 Total Swedish Government Bonds 9,702 1.18
Forward Foreign Exchange Contracts - -0.93% (0.02%) #Sold A$36,913,000 for £19,797,695 settled 7/11/2014 (517) (0.06)#Sold C$25,436,000 for £14,009,261 settled 7/11/2014 (73) (0.01)#Sold DKK18,428,000 for £1,927,766 settled 7/11/2014 (54) (0.01)#Sold €79,138,000 for £61,603,526 settled 7/11/2014 (1,761) (0.21)#Sold £9,965,313 for $16,016,949 settled 7/11/2014 84 0.01 #Sold ¥3,342,341,430 for £19,034,930 settled 7/11/2014 (712) (0.09)#Sold SEK110,422,000 for £9,457,720 settled 7/11/2014 (158) (0.02)#Sold $700,293,842 for £434,926,489 settled 7/11/2014 (4,436) (0.54)
Total Forward Foreign Exchange Contracts (7,627) (0.93)
Portfolio Statement as at 15 October 2014 (unaudited)
Security Holding Bid Totalvalue net£’000 assets
%
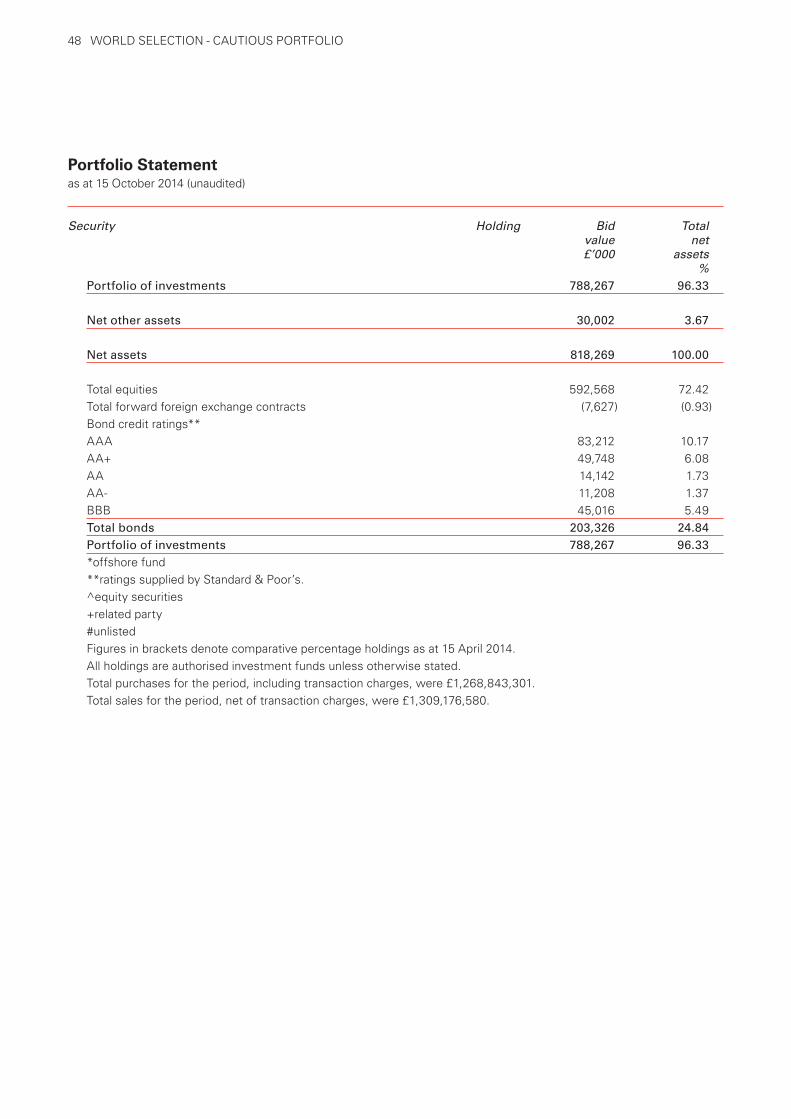
48 WORLD SELECTION - CAUTIOUS PORTFOLIO
Portfolio of investments 788,267 96.33
Net other assets 30,002 3.67
Net assets 818,269 100.00 Total equities 592,568 72.42 Total forward foreign exchange contracts (7,627) (0.93) Bond credit ratings** AAA 83,212 10.17 AA+ 49,748 6.08 AA 14,142 1.73 AA- 11,208 1.37 BBB 45,016 5.49 Total bonds 203,326 24.84 Portfolio of investments 788,267 96.33 *offshore fund **ratings supplied by Standard & Poor’s. ^equity securities +related party #unlisted Figures in brackets denote comparative percentage holdings as at 15 April 2014.
All holdings are authorised investment funds unless otherwise stated. Total purchases for the period, including transaction charges, were £1,268,843,301.
Total sales for the period, net of transaction charges, were £1,309,176,580.
Portfolio Statement as at 15 October 2014 (unaudited)
Security Holding Bid Totalvalue net£’000 assets
%

49WORLD SELECTION - CAUTIOUS PORTFOLIO
as at 15 April Net asset value Net asset value Shares in per share issue
(£) (p)
2012Retail Income 14,036,308 113.0 12,422,566 Retail Accumulation 802,639,096 115.8 693,325,927 Institutional Accumulation 10,662,879 118.6 8,991,503
2013Retail Income 12,955,279 121.9 10,624,482 Retail Accumulation 795,077,510 126.0 630,894,814 Institutional Accumulation 14,493,143 130.4 11,110,690 Income C† 1,066,003 122.2 872,043 Accumulation C† 45,817,620 126.3 36,288,894
2014Retail Income 9,016,199 120.8 7,466,023 Retail Accumulation 675,935,441 125.8 537,172,532 Institutional Accumulation 15,001,988 131.6 11,398,909 Income C 3,705,316 121.0 3,061,219 Accumulation C 122,430,426 126.7 96,609,261
2014*Retail Income 8,438,887 124.3 6,787,174 Retail Accumulation 620,695,951 130.0 477,527,866 Institutional Accumulation 15,361,580 136.7 11,240,752 Income C 4,371,085 124.6 3,507,507 Accumulation C 169,401,838 131.3 129,069,434
*as at 15 October†The Income C and Accumulation C share classes were launched on 3 December 2012.
Comparative Tablefor the six months ended 15 October 2014 (unaudited)

50
Net income Highest share Lowest shareper share price price
(p) (p) (p)
Calendar year2009Retail Income 0.797039 106.8 96.71Retail Accumulation 0.749526 107.2 96.71Institutional Accumulation† N/A 106.1 105.30
2010Retail Income 0.495165 110.6 104.3Retail Accumulation 0.500082 111.7 105.1Institutional Accumulation 1.432073 112.9 105.3
2011Retail Income 0.926429 111.6 107.4Retail Accumulation 0.945098 113.4 109.1Institutional Accumulation 2.129230 115.2 111.1
2012Retail Income 0.960231 117.2 110.6Retail Accumulation 0.977869 120.7 112.9Institutional Accumulation 2.240855 124.6 115.3Income C†† N/A 117.3 116.4Accumulation C†† N/A 120.7 119.8
2013Retail Income 1.039447 124.5 116.8Retail Accumulation 1.077290 128.6 120.6Institutional Accumulation 2.435091 133.3 124.5Income C 1.340195 124.8 117.2Accumulation C 1.392163 128.9 120.7
2014*Retail Income 0.807104 125.9 119.9Retail Accumulation 0.843201 131.1 124.5Institutional Accumulation 2.258985 137.7 129.9Income C 1.457339 126.4 120.4Accumulation C 1.516810 132.3 125.3
*to 15 October†The Institutional Accumulation share class was launched on 16 November 2009.††The Income C and Accumulation C share classes were launched on 3 December 2012.HSBC World Selection - Cautious Portfolio Fund was launched on 2 January 2009.
Comparative Tablefor the year ended 15 April 2012
WORLD SELECTION - CAUTIOUS PORTFOLIO

51
2014Retail Income 1.54%Retail Accumulation 1.54%Institutional Accumulation 0.24%Income C 0.89%Accumulation C 0.89%
as at 15 April2014Retail Income 1.82%Retail Accumulation 1.82%Institutional Accumulation 0.52%Income C 1.17%Accumulation C 1.17%
Ongoing Charges Figure (OCF) as at 15 October
WORLD SELECTION - CAUTIOUS PORTFOLIO

52
Statement of Total Returnfor the six months ended 15 October 2014 (unaudited)
15.10.14 15.10.13 £’000 £’000 £’000 £’000
Income Net capital gains/(losses) 24,027 (14,036) Revenue 8,501 10,080 Expenses (4,868) (5,305)Finance costs: Interest (10) -Net revenue before taxation 3,623 4,775 Taxation (310) (405)Net revenue after taxation for the period 3,313 4,370 Total return before distributions 27,340 (9,666)Finance costs: Distributions (3,351) (4,428)Change in net assets attributable to shareholders from investment activities 23,989 (14,094)
Statement of Change in Net Assets Attributable to Shareholdersfor the six months ended 15 October 2014 (unaudited)
15.10.14 15.10.13 £’000 £’000 £’000 £’000
Opening net assets attributable to shareholders 826,089 869,410 Amounts receivable on creation of shares 18,810 38,473 Amounts payable on cancellation of shares (53,791) (55,464)
(34,981) (16,991)Stamp duty reserve tax (4) (83)Change in net assets attributable to shareholders frominvestment activities (see Statement of Total Return above) 23,989 (14,094)Retained distribution on accumulation shares 3,176 4,350 Closing net assets attributable to shareholders 818,269 842,592
Balance Sheet as at 15 October 2014 (unaudited)
15.10.14 15.4.14£’000 £’000 £’000 £’000
AssetsInvestment assets 795,978 790,740 Debtors 15,278 2,315 Cash and bank balances 20,467 35,144 Total other assets 35,745 37,459 Total assets 831,723 828,199 LiabilitiesInvestment liabilities (7,711) (30) Creditors (5,689) (2,028) Distribution payable on income shares (54) (52)Total other liabilities (5,743) (2,080)Total liabilities (13,454) (2,110)Net assets attributable to shareholders 818,269 826,089
WORLD SELECTION - CAUTIOUS PORTFOLIO
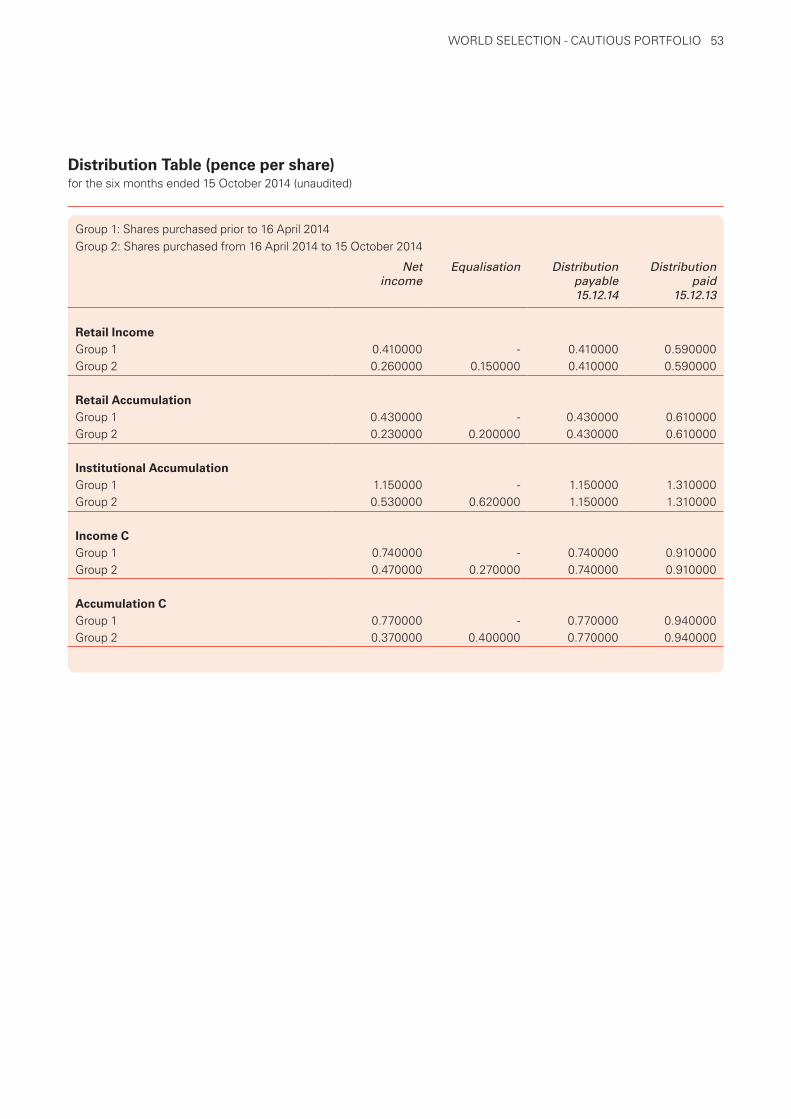
53
Distribution Table (pence per share) for the six months ended 15 October 2014 (unaudited)
Net Equalisation Distribution Distributionincome payable paid
15.12.14 15.12.13
Retail IncomeGroup 1 0.410000 - 0.410000 0.590000Group 2 0.260000 0.150000 0.410000 0.590000
Retail AccumulationGroup 1 0.430000 - 0.430000 0.610000Group 2 0.230000 0.200000 0.430000 0.610000
Institutional AccumulationGroup 1 1.150000 - 1.150000 1.310000Group 2 0.530000 0.620000 1.150000 1.310000
Income CGroup 1 0.740000 - 0.740000 0.910000Group 2 0.470000 0.270000 0.740000 0.910000
Accumulation CGroup 1 0.770000 - 0.770000 0.940000Group 2 0.370000 0.400000 0.770000 0.940000
Group 1: Shares purchased prior to 16 April 2014 Group 2: Shares purchased from 16 April 2014 to 15 October 2014
WORLD SELECTION - CAUTIOUS PORTFOLIO

54
Investment Objective
To provide capital growth through dynamic investment in a broad range of asset classes across global markets.
Investment Policy
With effect from 1 July 2014:To invest primarily in collective investment schemes that in turn invest in fixed income securities, equities, property and derivatives. Typically the Fund will have a bias towards asset classes that focus on equity investment strategies. The ACD may also invest at its discretion in other transferable securities, money market instruments, deposits, cash and near cash.On giving 60 days’ notice to Shareholders, the Fund may, in addition to its other investment powers, use exchange traded and over the counter derivatives and forward currency contracts for investment purposes. Using these investment powers for investment purposes means, in particular, maintaining positions in these investments for the long term rather than just for tactical short-term purposes. Where the use of derivatives is for investment purposes in addition to hedging it is envisaged that the use of such instruments will not affect the overall risk profile of the Fund.
Investment Strategy
With effect from 1 July 2014:
The Fund follows a broadly diversified investment approach by investing primarily in other collective investment schemes that, in turn, invest across various different asset classes. Such asset classes shall include traditional asset classes, such as equities and fixed income, but also alternative asset classes, for example property. The Manager uses a complex quantitative investment process with a qualitative overlay to identify the optimal portfolio construction.
Portfolio Activity
The World Selection Dynamic Portfolio posted good positive returns over the reporting period. For the larger part of the period, performance was mainly driven by the allocation toward riskier asset classes, such as equities and global high yield bonds. In September and the first half of October, nervousness amongst investors increased as the strength of the US economy gave rise to expectations of a less accommodative monetary policy stance of the US Federal Reserve Bank in 2015. Economic newsflow from the Eurozone remained fragile over the period. Economic and geopolitical risks over the reporting period, such as some soft economic data releases from emerging markets and the Ukraine crisis, again demonstrated the importance of portfolio diversification.
The portfolio maintained a bias towards equities and away from government bonds over the reporting period. The medium-term prospective return on core government bonds seems to remain poor given historically low yield levels. Global equities appear comparatively better value and we anticipate global equity markets will continue to grind moderately higher over the medium term. Towards the end of the period, exposure to global high yield debt was increased given what we perceived to be improved starting valuations. A reduced allocation to the asset class was held throughout Q3, a position that successfully added value on a relative basis. The portfolio’s allocation to global investment grade credit was decreased to accommodate the move. Investment grade spreads remained relatively tight, and little changed, over the course of Q3 as high yield spreads moved wider.
A number of enhancements were made to the portfolio’s strategy over the reporting period. Without changing the core investment objective of the World Selection proposition, these changes ensure the portfolio reflects our latest thinking on multi-asset investing. For example, we now employ even stricter asset class selection criteria for asset classes to be included in World Selection’s long term asset mixes. We have also increased the frequency of reviews of the asset allocation and the related input data by moving from annual to now quarterly reviews. These enhancements should provide an even more robust global portfolio to World Selection investors.
An increased emphasis on the cost efficient fulfilment of the portfolio’s asset allocation resulted in a move away from actively managed third party funds and a greater allocation towards HSBC managed and passive investment vehicles. These changes ensure the portfolio can now be delivered at a lower cost to the World Selection investor, without comprising the investment outcome.
Major purchases included: HSBC FTSE All-World Fund, HSBC ESI Worldwide Equity UCITS ETF and HSBC Worldwide Equity UCITS ETF.
Major sales included: HSBC ISF MultiAlpha Europe Equity Fund, HSBC ISF MultiAlpha North America Equity Fund and HSBC American Equity Fund.
Investment Performance
During the period under review, the value of the shares in the Fund increased by 2.62%.
(Source: Morningstar Direct, GBP, UK net of tax, for the Retail Accumulation share class. Returns based on the NAV, which is a single price.)
Please note that the above information refers to the past and that past performance is not a reliable indication of future returns.
World Selection - Dynamic Portfolio
WORLD SELECTION - DYNAMIC PORTFOLIO
Fund Particulars as at 16 October 2014 (unaudited)
Retail Income
Retail Accumulation
Institutional Accumulation
Income C Accumulation C
Price 158.0p xd 162.1p 171.0p 158.1p xd 163.8p
Distribution payable (on 15 December 2014) per share net
0.270000p 0.270000p 1.220000p 0.710000p 0.730000p
Current net estimated yield 0.69% 0.68% 1.74% 1.26% 1.24%
Annual ACD charge 1.25% 1.25% 0.00% 0.55% 0.55%

55
Portfolio Statement as at 15 October 2014 (unaudited)
Security Holding Bid Totalvalue net£’000 assets
%Asia-Pacific (excluding Japan) Equities - 0.00% (5.76%)
Commodities - 0.00% (1.06%)
European Equities - 0.00% (19.38%)
#Banco Popular Espanol 71,971 0 0.00#Repsol SA rights 18,306 7 0.00
Total European Equities 7 0.00 Global Aggregate Bonds - 0.00% (1.44%)
Global Corporate Bonds - 4.77% (0.00%) *+HSBC GIF Global Corporate Bond Fund 3,805,499 24,486 4.77
Total Global Corporate Bonds 24,486 4.77 Global Equities - 68.76% (0.00%) *+HSBC ESI Worldwide Equity UCITS ETF 11,895,787 101,265 19.74+HSBC FTSE All-World Index Fund 173,787,769 171,233 33.39
*+HSBC Worldwide Equity UCITS ETF 8,730,798 80,155 15.63 Total Global Equities 352,653 68.76 Global Emerging Markets Debt - 16.41% (4.74%) *+HSBC GIF Global Emerging Markets Bond Fund 2,029,807 27,230 5.31*+HSBC GIF Global Emerging Markets Local Debt Fund 3,841,687 27,464 5.35*+HSBC ISF MultiAlpha Global High Yield Bond 4,296,840 29,482 5.75
Total Global Emerging Markets Debt 84,176 16.41 Global Emerging Markets Equities - 0.00% (9.84%)
Global High Yield Bonds - 0.30% (5.37%) *+HSBC GIF Global High Yield Bond Fund 246,162 1,535 0.30
Total Global High Yield Bonds 1,535 0.30 Global Property Equities Funds - 4.11% (3.69%) *+HSBC ISF MultiAlpha Global Real Estate Equity Fund 2,392,854 21,056 4.11
Total Global Property Equities Funds 21,056 4.11 Japanese Equities - 1.52% (8.46%)
+HSBC Japan Index Fund 12,265,746 7,805 1.52 Total Japanese Equities 7,805 1.52 Private Equity - 0.00% (0.36%)
Direct Property Funds - 1.97% (1.91%) Henderson UK Property Fund 3,678,449 3,950 0.77 M&G Property Portfolio 5,686,909 6,156 1.20 Total Direct Property Funds 10,106 1.97
WORLD SELECTION - DYNAMIC PORTFOLIO

56
Portfolio Statement as at 15 October 2014 (unaudited)
Security Holding Bid Totalvalue net£’000 assets
% UK Equities - 1.49% (17.19%)
+HSBC FTSE All-Share Index Fund 2,625,679 7,604 1.48**McBride non-cumulative redeemable preference 103,982 0 0.00**Persimmon 5,444 4 0.00**Persimmon C 42,015 29 0.01
Total UK Equities 7,637 1.49 US Equities - 0.00% (18.48%)
Forward Foreign Exchange Contracts - -0.20% (0.03%)
#Sold £7,979,401 for $12,729,003 settled 31/10/2014 7 0.00#Sold ¥1,420,575,418 for £8,222,621 settled 31/10/2014 (170) (0.03)#Sold $144,318,182 for £89,687,867 settled 31/10/2014 (856) (0.17)
Total Forward Foreign Exchange Contracts (1,019) (0.20) Portfolio of investments 508,442 99.13
Net other assets 4,461 0.87
Net assets 512,903 100.00 *offshore investment funds **equities +related party #unlisted Figures in brackets denote comparative percentage holdings as at 15 April 2014.
All holdings are authorised investment funds unless otherwise stated. Total purchases for the period, including transaction charges, were £1,072,826,434.
Total sales for the period, net of transaction charges, were £1,066,304,494.
WORLD SELECTION - DYNAMIC PORTFOLIO
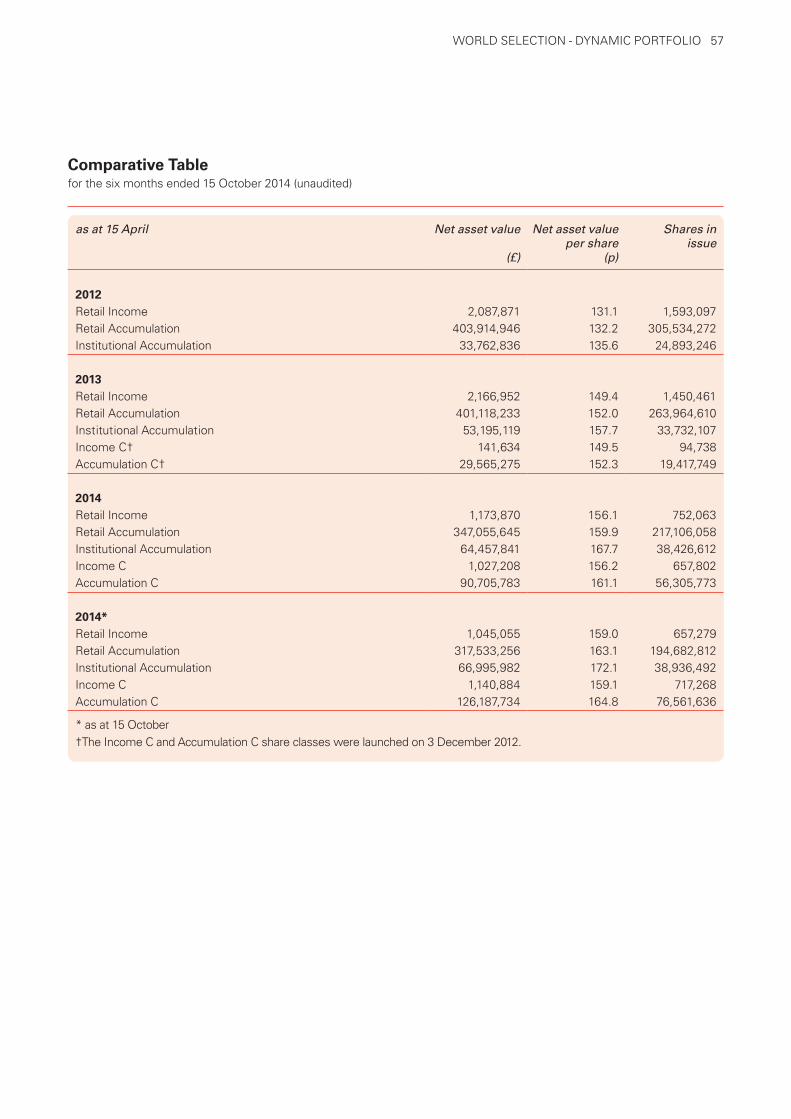
57
as at 15 April Net asset value Net asset value Shares in per share issue
(£) (p)
2012Retail Income 2,087,871 131.1 1,593,097Retail Accumulation 403,914,946 132.2 305,534,272Institutional Accumulation 33,762,836 135.6 24,893,246
2013Retail Income 2,166,952 149.4 1,450,461 Retail Accumulation 401,118,233 152.0 263,964,610 Institutional Accumulation 53,195,119 157.7 33,732,107 Income C† 141,634 149.5 94,738 Accumulation C† 29,565,275 152.3 19,417,749
2014Retail Income 1,173,870 156.1 752,063 Retail Accumulation 347,055,645 159.9 217,106,058 Institutional Accumulation 64,457,841 167.7 38,426,612 Income C 1,027,208 156.2 657,802 Accumulation C 90,705,783 161.1 56,305,773
2014*Retail Income 1,045,055 159.0 657,279 Retail Accumulation 317,533,256 163.1 194,682,812 Institutional Accumulation 66,995,982 172.1 38,936,492 Income C 1,140,884 159.1 717,268 Accumulation C 126,187,734 164.8 76,561,636
* as at 15 October†The Income C and Accumulation C share classes were launched on 3 December 2012.
Comparative Tablefor the six months ended 15 October 2014 (unaudited)
WORLD SELECTION - DYNAMIC PORTFOLIO

58
Comparative Tablefor the year ended 15 April 2012
WORLD SELECTION - DYNAMIC PORTFOLIO
Net income Highest share Lowest shareper share price price
(p) (p) (p)
Calendar year2009Retail Income 0.415257 121.3 90.85Retail Accumulation 0.365300 121.7 90.42Institutional Accumulation† 0.000000 121.7 118.7
2010Retail Income 0.020000 136.2 116.6 Retail Accumulation 0.010000 136.8 117.0 Institutional Accumulation 1.066926 138.3 117.7
2011Retail Income 0.590000 139.4 114.7 Retail Accumulation 0.601706 139.9 115.2 Institutional Accumulation 2.085533 142.1 117.4
2012Retail Income 1.040000 137.4 122.2 Retail Accumulation 1.050000 139.7 123.3 Institutional Accumulation 2.547637 144.5 126.7 Income C†† N/A 137.4 134.4 Accumulation C†† N/A 139.7 136.6
2013Retail Income 1.159630 159.7 137.6 Retail Accumulation 1.180569 162.9 139.9 Institutional Accumulation 2.994268 170.4 144.7 Income C 1.847121 159.8 137.7 Accumulation C 1.887410 163.9 139.9
2014*Retail Income 0.270000 170.7 153.4 Retail Accumulation 0.270000 174.8 157.1 Institutional Accumulation 2.109516 184.2 164.5 Income C 1.135377 171.1 153.8 Accumulation C 1.169874 176.5 158.2
*to 15 October†The Institutional Accumulation share class was launched on 16 November 2009.††The Income C and Accumulation C share classes were launched on 3 December 2012.HSBC World Selection - Dynamic Portfolio was launched on 2 January 2009.

59
2014Retail Income 1.60%Retail Accumulation 1.60%Institutional Accumulation 0.30%Income C 0.95%Accumulation C 0.95%
as at 15 April2014Retail Income 1.94%Retail Accumulation 1.94%Institutional Accumulation 0.64%Income C 1.29%Accumulation C 1.29%
Ongoing Charges Figure (OCF) as at 15 October
WORLD SELECTION - DYNAMIC PORTFOLIO

60
Statement of Total Returnfor the six months ended 15 October 2014 (unaudited)
15.10.14 15.10.13 £’000 £’000 £’000 £’000
Income Net capital gains 9,437 19,554 Revenue 4,183 6,699 Expenses (2,656) (2,753)Finance costs: Interest (3) - Net revenue before taxation 1,524 3,946 Taxation (23) - Net revenue after taxation for the period 1,501 3,946 Total return before distributions 10,938 23,500 Finance costs: Distributions (1,540) (4,006)Change in net assets attributable to shareholders from investment activities 9,398 19,494
Statement of Change in Net Assets Attributable to Shareholdersfor the six months ended 15 October 2014 (unaudited)
15.10.14 15.10.13 £’000 £’000 £’000 £’000
Opening net assets attributable to shareholders 504,420 486,187 Amounts receivable on creation of shares 24,195 29,465 Amounts payable on cancellation of shares (26,657) (36,436)
(2,462) (6,971)Stamp duty reserve tax (12) (103)Change in net assets attributable to shareholders frominvestment activities (see Statement of Total Return above) 9,398 19,494 Retained distribution on accumulation shares 1,559 3,991 Closing net assets attributable to shareholders 512,903 502,598
Balance Sheet as at 15 October 2014 (unaudited)
15.10.14 15.4.14£’000 £’000 £’000 £’000
AssetsInvestment assets 509,468 492,930 Debtors 9,821 2,763 Cash and bank balances 3,911 10,022 Total other assets 13,732 12,785Total assets 523,200 505,715LiabilitiesInvestment liabilities (1,026) (53) Creditors (9,264) (1,239) Distribution payable on income shares (7) (3)Total other liabilities (9,271) (1,242)Total liabilities (10,297) (1,295)Net assets attributable to shareholders 512,903 504,420
WORLD SELECTION - DYNAMIC PORTFOLIO

61
Distribution Table (pence per share) for the six months ended 15 October 2014 (unaudited)
Net Equalisation Distribution Distributionincome payable paid
15.12.14 15.12.13
Retail IncomeGroup 1 0.270000 - 0.270000 1.090000Group 2 0.180000 0.090000 0.270000 1.090000
Retail AccumulationGroup 1 0.270000 - 0.270000 1.110000Group 2 0.140000 0.130000 0.270000 1.110000
Institutional AccumulationGroup 1 1.220000 - 1.220000 2.090000Group 2 0.490000 0.730000 1.220000 2.090000
Income CGroup 1 0.710000 - 0.710000 1.570000Group 2 0.410000 0.300000 0.710000 1.570000
Accumulation CGroup 1 0.730000 - 0.730000 1.600000Group 2 0.280000 0.450000 0.730000 1.600000
Group 1: Shares purchased prior to 16 April 2014 Group 2: Shares purchased from 16 April 2014 to 15 October 2014
WORLD SELECTION - DYNAMIC PORTFOLIO

62 WORLD SELECTION - INCOME PORTFOLIO
Investment Objective
To provide income through cautious investment in a broad range of asset classes across global markets.
Investment Policy
With effect from 1 July 2014:
To invest primarily in collective investment schemes that in turn invest in fixed income securities, equities, property and derivatives. Typically the Fund will have a bias towards asset classes that focus on fixed interest strategies. The ACD may also invest at its discretion in other transferable securities, money market instruments, deposits, cash and near cash.
On giving 60 days’ notice to Shareholders, the Fund may, in addition to its other investment powers, use exchange traded and over the counter derivatives and forward currency contracts for investment purposes. Using these investment powers for investment purposes means, in particular, maintaining positions in these investments for the long term rather than just for tactical short-term purposes.
Where the use of derivatives is for investment purposes in addition to hedging it is envisaged that the use of such instruments will not affect the overall risk profile of the Fund.
Investment Strategy
With effect from 1 July 2014:
The Fund follows a broadly diversified investment approach by investing primarily in other collective investment schemes that, in turn, invest across various different asset classes. Such asset classes shall include traditional asset classes, such as equities and fixed income, but also alternative asset classes, for example property. The Manager uses a complex quantitative investment process with a qualitative overlay to identify the optimal portfolio construction.
Portfolio Activity
The portfolio maintained a bias towards equities and away from UK government bonds (gilts) over the reporting period. In our view the medium term prospective return on core government bonds, including UK Gilts, remains poor given historically low yield levels. Equities appear comparatively better value and we anticipate global equity markets will continue to grind moderately higher over the medium term. Overweight allocations, relative to the portfolio’s neutral positioning, were therefore held in both UK and global equities.
Major purchases included: HSBC ISF MultiAlpha Sterling Bond Fund, HSBC ISF MultiAlpha Global High Yield Bond and Schroder UK Alpha Income Fund.
Major sales consisted of: Threadneedle European High Yield Bond Fund.
Investment Performance
During the period under review, the value of the shares in the Fund increased by 3.57%.
(Source: Morningstar Direct, GBP, UK net of tax, for the Accumulation C share class. Returns based on the NAV, which is a single price.)
Please note that the above information refers to the past and that past performance is not a reliable indication of future returns.
World Selection - Income Portfolio
Fund Particulars as at 16 October 2014 (unaudited)
Retail Income
Retail Accumulation
Income C Accumulation C
Price 108.0p xd 125.2p 110.1p xd 126.6p
Distribution payable (on 15 December 2014)per share net
0.880000p 1.020000p 0.900000p 1.030000p
Current net estimated yield 3.25% 3.13% 3.23% 3.11%
Annual ACD charge 1.25% 1.25% 0.55% 0.55%
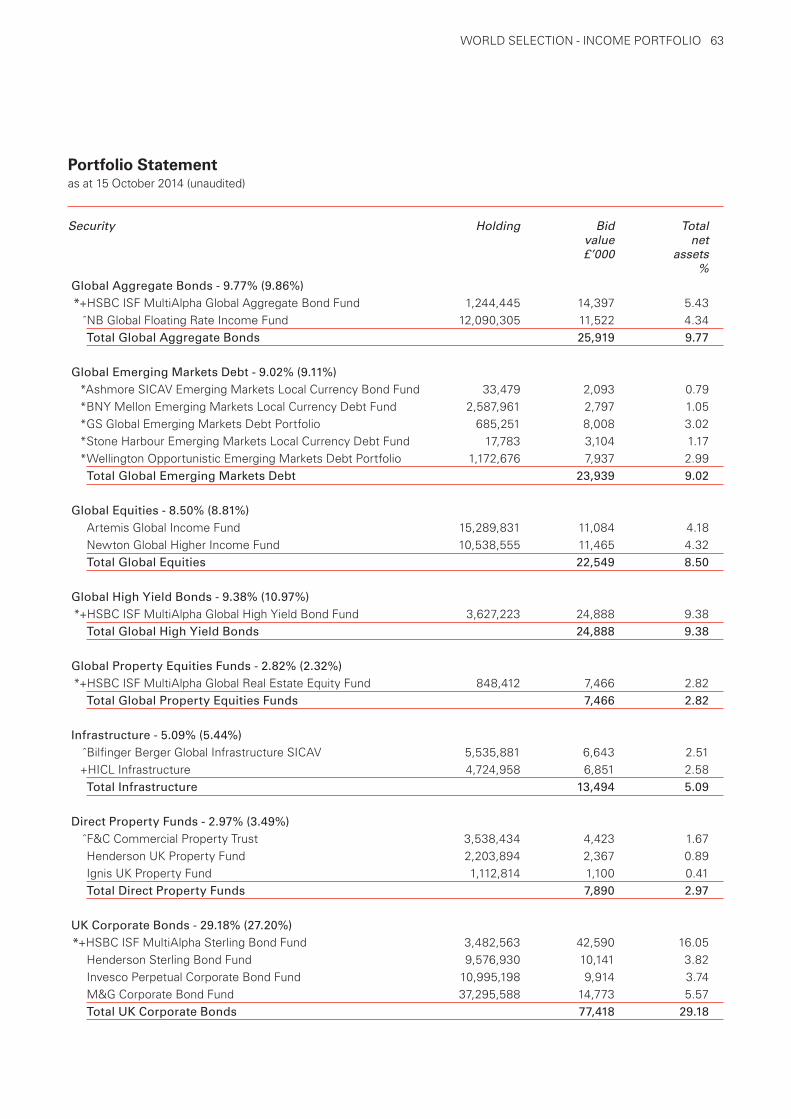
63WORLD SELECTION - INCOME PORTFOLIO
Portfolio Statement as at 15 October 2014 (unaudited)
Security Holding Bid Totalvalue net£’000 assets
% Global Aggregate Bonds - 9.77% (9.86%) *+HSBC ISF MultiAlpha Global Aggregate Bond Fund 1,244,445 14,397 5.43
ˆNB Global Floating Rate Income Fund 12,090,305 11,522 4.34 Total Global Aggregate Bonds 25,919 9.77 Global Emerging Markets Debt - 9.02% (9.11%)
*Ashmore SICAV Emerging Markets Local Currency Bond Fund 33,479 2,093 0.79*BNY Mellon Emerging Markets Local Currency Debt Fund 2,587,961 2,797 1.05*GS Global Emerging Markets Debt Portfolio 685,251 8,008 3.02*Stone Harbour Emerging Markets Local Currency Debt Fund 17,783 3,104 1.17*Wellington Opportunistic Emerging Markets Debt Portfolio 1,172,676 7,937 2.99
Total Global Emerging Markets Debt 23,939 9.02 Global Equities - 8.50% (8.81%)
Artemis Global Income Fund 15,289,831 11,084 4.18 Newton Global Higher Income Fund 10,538,555 11,465 4.32 Total Global Equities 22,549 8.50 Global High Yield Bonds - 9.38% (10.97%) *+HSBC ISF MultiAlpha Global High Yield Bond Fund 3,627,223 24,888 9.38
Total Global High Yield Bonds 24,888 9.38 Global Property Equities Funds - 2.82% (2.32%) *+HSBC ISF MultiAlpha Global Real Estate Equity Fund 848,412 7,466 2.82
Total Global Property Equities Funds 7,466 2.82 Infrastructure - 5.09% (5.44%)
ˆBilfinger Berger Global Infrastructure SICAV 5,535,881 6,643 2.51+HICL Infrastructure 4,724,958 6,851 2.58
Total Infrastructure 13,494 5.09 Direct Property Funds - 2.97% (3.49%)
ˆF&C Commercial Property Trust 3,538,434 4,423 1.67 Henderson UK Property Fund 2,203,894 2,367 0.89 Ignis UK Property Fund 1,112,814 1,100 0.41 Total Direct Property Funds 7,890 2.97 UK Corporate Bonds - 29.18% (27.20%) *+HSBC ISF MultiAlpha Sterling Bond Fund 3,482,563 42,590 16.05
Henderson Sterling Bond Fund 9,576,930 10,141 3.82 Invesco Perpetual Corporate Bond Fund 10,995,198 9,914 3.74 M&G Corporate Bond Fund 37,295,588 14,773 5.57 Total UK Corporate Bonds 77,418 29.18

64 WORLD SELECTION - INCOME PORTFOLIO
Portfolio Statement as at 15 October 2014 (unaudited)
Security Holding Bid Totalvalue net£’000 assets
%UK Equities - 12.44% (13.04%)
Fidelity MoneyBuilder Dividend Fund 8,254,856 9,964 3.76 Schroder Income Fund 8,865,053 5,496 2.07 Schroder Income Maximiser Fund 5,386,956 2,391 0.90 Schroder UK Alpha Income Fund 9,639,952 15,154 5.71 Total UK Equities 33,005 12.44 UK Government Bonds - 8.64% (8.39%)
Allianz PIMCO Gilt Yield Fund 6,898,012 11,556 4.36+HSBC UK Gilt Index Fund 10,331,169 11,354 4.28
Total UK Government Bonds 22,910 8.64 Portfolio of investments 259,478 97.81
Net other assets 5,801 2.19
Net assets 265,279 100.00 *offshore investment fund +related party ˆlisted Figures in brackets denote comparative percentage holdings as at 15 April 2014. All holdings are authorised investment funds unless otherwise stated. Total purchases for the period, including transaction charges, were £45,020,038. Total sales for the period, net of transaction charges, were £4,054,635.

65WORLD SELECTION - INCOME PORTFOLIO
as at 15 April Net asset value Net asset value Shares in per share issue
(£) (p)
2012Retail Income 112,604,335 102.5 109,821,170 Retail Accumulation 18,123,008 109.1 16,618,090
2013Retail Income 125,061,942 110.8 112,884,080 Retail Accumulation 24,481,827 122.3 20,019,236 Income C† 16,587,009 111.8 14,840,238 Accumulation C† 7,881,900 122.5 6,433,992
2014Retail Income 100,982,522 106.7 94,620,421 Retail Accumulation 18,878,087 121.7 15,509,955 Income C 55,820,606 108.4 51,502,208 Accumulation C 41,525,633 122.7 33,842,161
2014*Retail Income 89,959,543 108.0 83,304,826 Retail Accumulation 17,048,046 125.2 13,614,954 Income C 83,963,209 110.0 76,309,286 Accumulation C 74,307,786 126.6 58,676,094
*as at 15 October†The Income C and Accumulation C share classes were launched on 3 December 2012.
Comparative Tablefor the six months ended 15 October 2014 (unaudited)

66 WORLD SELECTION - INCOME PORTFOLIO
Comparative Tablefor the year ended 15 April 2012
Net income Highest share Lowest shareper share price price
(p) (p) (p)
Calendar year2010Retail Income 0.270000 104.4 99.86Retail Accumulation 0.290000 104.5 99.86
2011Retail Income 4.395005 103.6 98.57Retail Accumulation 4.422264 106.6 102.2
2012Retail Income 3.752817 106.5 97.56Retail Accumulation 3.977622 116.4 106.6Income C† N/A 107.6 107.0Accumulation C† N/A 116.4 115.8
2013Retail Income 3.812063 113.1 106.4Retail Accumulation 4.175901 124.7 116.1Income C 3.186312 114.2 107.3Accumulation C 3.480898 125.0 116.1
2014*Retail Income 3.631425 110.2 106.3Retail Accumulation 4.124546 126.7 120.3Income C 3.677925 112.2 107.8Accumulation C 4.144860 128.1 121.2
* to 15 October†The Income C and Accumulation C share classes were launched on 3 December 2012.HSBC World Selection - Income Portfolio Fund was launched on 5 July 2010.
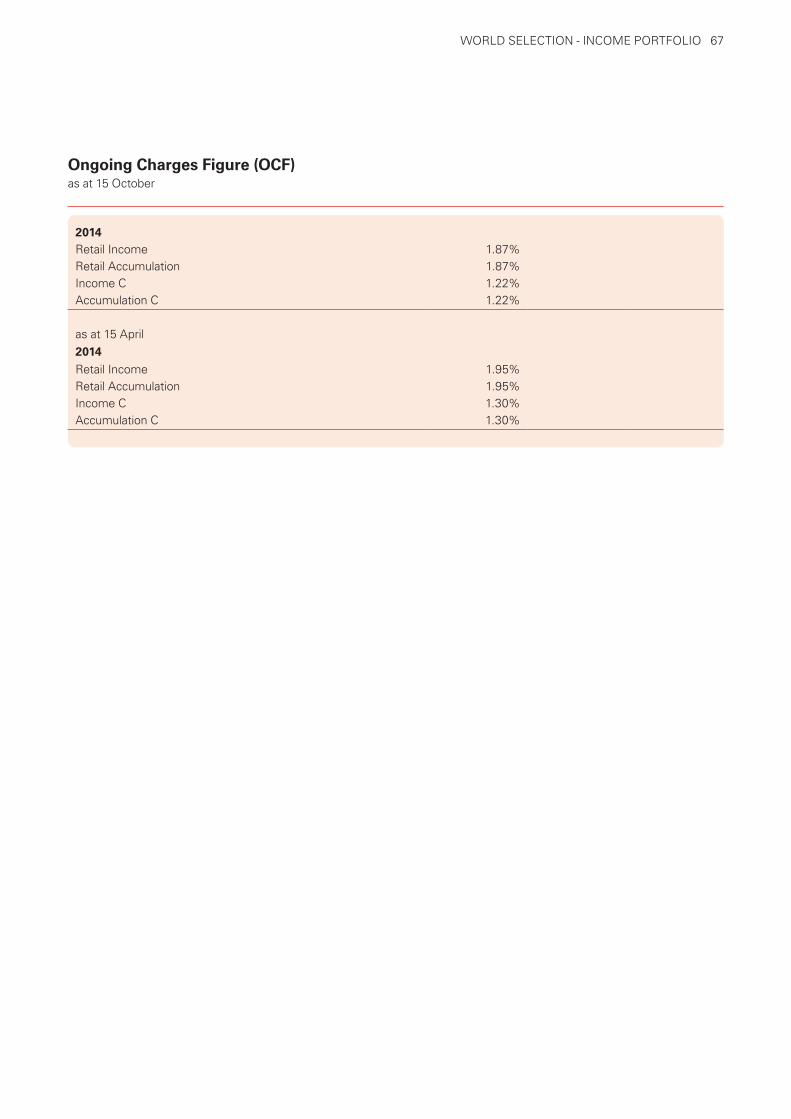
67
2014Retail Income 1.87%Retail Accumulation 1.87%Income C 1.22%Accumulation C 1.22%
as at 15 April2014Retail Income 1.95%Retail Accumulation 1.95%Income C 1.30%Accumulation C 1.30%
Ongoing Charges Figure (OCF) as at 15 October
WORLD SELECTION - INCOME PORTFOLIO

68
Statement of Total Returnfor the six months ended 15 October 2014 (unaudited)
15.10.14 15.10.13 £’000 £’000 £’000 £’000
Income Net capital gains/(losses) 4,435 (4,278) Revenue 4,822 3,274 Expenses (1,191) (1,078)Net revenue before taxation 3,631 2,196 Taxation - - Net revenue after taxation for the year 3,631 2,196 Total return before distributions 8,066 (2,082)Finance costs: Distributions (4,981) (3,517)Change in net assets attributable to shareholders from investment activities 3,085 (5,599)
Statement of Change in Net Assets Attributable to Shareholdersfor the six months ended 15 October 2014 (unaudited)
15.10.14 15.10.13 £’000 £’000 £’000 £’000
Opening net assets attributable to shareholders 217,207 174,013 Amounts receivable on creation of shares 51,772 34,581 Amounts payable on cancellation of shares (8,158) (12,196)
43,614 22,385 Stamp duty reserve tax (1) (21)Change in net assets attributable to shareholders frominvestment activities (see Statement of Total Return above) 3,085 (5,599)Retained distribution on accumulation shares 1,374 612 Closing net assets attributable to shareholders 265,279 191,390
Balance Sheet as at 15 October 2014 (unaudited)
15.10.14 15.4.14£’000 £’000 £’000 £’000
AssetsInvestment assets 259,478 214,226 Debtors 1,859 2,286 Cash and bank balances 6,126 4,174 Total other assets 7,985 6,460 Total assets 267,463 220,686 Liabilities Creditors (764) (2,363) Distribution payable on income shares (1,420) (1,116)Total liabilities (2,184) (3,479)Net assets attributable to shareholders 265,279 217,207
WORLD SELECTION - INCOME PORTFOLIO

69
Distribution Table (pence per share) for the six months ended 15 October 2014 (unaudited)
Gross Tax Net Equalisation Distribution Distributionincome at 20% income payable paid
15.12.14 15.12.13
Retail IncomeGroup 1 1.100000 0.220000 0.880000 - 0.880000 0.580000Group 2 0.625000 0.125000 0.500000 0.380000 0.880000 0.580000
Retail AccumulationGroup 1 1.275000 0.255000 1.020000 - 1.020000 0.640000Group 2 0.700000 0.140000 0.560000 0.460000 1.020000 0.640000
Income CGroup 1 1.125000 0.225000 0.900000 - 0.900000 0.590000Group 2 0.500000 0.100000 0.400000 0.500000 0.900000 0.590000
Accumulation CGroup 1 1.287500 0.257500 1.030000 - 1.030000 0.650000Group 2 0.562500 0.112500 0.450000 0.580000 1.030000 0.650000
Group 1: Shares purchased prior to 16 July 2014 Group 2: Shares purchased from 16 July 2014 to 15 October 2014
Gross Tax Net Equalisation Distribution Distributionincome at 20% income paid paid
15.9.14 15.9.13
Retail IncomeGroup 1 1.137500 0.227500 0.910000 - 0.910000 1.110000Group 2 0.762500 0.152500 0.610000 0.300000 0.910000 1.110000
Retail AccumulationGroup 1 1.287500 0.257500 1.030000 - 1.030000 1.230000Group 2 0.850000 0.170000 0.680000 0.350000 1.030000 1.230000
Income CGroup 1 1.150000 0.230000 0.920000 - 0.920000 1.120000Group 2 0.625000 0.125000 0.500000 0.420000 0.920000 1.120000
Accumulation CGroup 1 1.300000 0.260000 1.040000 - 1.040000 1.230000Group 2 0.700000 0.140000 0.560000 0.480000 1.040000 1.230000
Group 1: Shares purchased prior to 16 April 2014Group 2: Shares purchased from 16 April 2014 to 15 July 2014
WORLD SELECTION - INCOME PORTFOLIO

70
Investment ObjectiveTo provide capital growth through investment in a broad range of asset classes across global markets.
Investment PolicyTo invest primarily in collective investment schemes and exchange traded funds that aim to match the returns of market indices.
Investment StrategyWith effect from 1 July 2014:The Fund follows a broadly diversified investment approach across various different asset classes primarily investing in vehicles that track an appropriate market index. Asset classes held include traditional asset classes, such as equities and fixed income, but also alternative asset classes, for example commodities, private equity and property. The Fund Manager incorporates a quantitative investment process to identify the optimal portfolio construction and periodically rebalances the portfolio.Exposure to such asset classes may be obtained by either direct investment, where permitted to do so within the Funds’ investment and borrowing powers, or through exposure by way of investing into collective investment schemes or exchange traded funds that in turn provide exposure to such asset classes.
Risk ProfileThe Fund has little exposure to credit or cash flow risk. There are no borrowings or unlisted securities of a material nature and so there is little exposure to liquidity risk. The main risk is faces from its financial instruments are market price and foreign currency. The Manager reviews policies for managing these risks in order to follow and aim to achieve the Investment Objective and Policy as summarised above.
Portfolio Activity
The portfolio maintained a bias towards equities and away from government bonds over the reporting period. In our view the medium term prospective return on core government bonds remains poor given historically low yield levels. Global equities appear comparatively better value and we anticipate global equity markets will continue to grind moderately higher over the medium term. Towards the end of the period, exposure to global high yield debt was increased given what seemed to be improved starting valuations. The portfolio’s allocation to global investment grade credit was decreased to accommodate the move. Investment grade spreads remained relatively tight, and little changed, over the course of Q3 as high yield spreads moved wider.
Major purchases included: HSBC American Index Fund, iShares iBoxx High Yield Capped Bond ETF and iShares GS Corporate Bond.
Major sales included: HSBC FTSE All-Share Index Fund, HSBC European Index Fund and iShares iBoxx High Yield Capped Bond ETF.
Investment Performance
During the period under review, the value of the shares in the Fund increased by 4.16%.
(Source: Morningstar Direct, GBP, UK net of tax, for the Retail X Accumulation share class. Returns based on the NAV, which is a single price.)
Please note that the above information refers to the past and that past performance is not a reliable indication of future returns.
World Index Balanced Portfolio
Fund Particulars as at 16 October 2014 (unaudited)
Retail Income
Retail Accumulation
Retail X Income
Retail X Accumulation
Institutional Accumulation
Income CAccumulation
C
Price 120.1p xd 124.4p 119.9p xd 125.8p 127.5p 120.2p xd 126.0p
Distribution payable (on 15 Dec 2014) per share net
1.320000p 1.360000p 1.570000p 1.620000p 1.950000p 1.690000p 1.750000p
Current net estimated yield 1.26% 1.24% 1.68% 1.69% 2.06% 1.75% 1.80%
Annual ACD charge 0.95% 0.95% 0.45% 0.45% 0.00% 0.25% 0.25%
WORLD INDEX BALANCED PORTFOLIO

71
Portfolio Statement as at 15 October 2014 (unaudited)
Security Holding Bid Totalvalue net£’000 assets
%
Asia - Pacific (excluding Japan) Equities - 5.33% (2.51%) +HSBC Pacific Index Fund 465,713 931 5.33
Total Asia - Pacific (excluding Japan) Equities 931 5.33
European (excluding UK) Equities - 7.25% (11.02%) +HSBC European Index Fund 288,578 1,267 7.25
Total European (excluding UK) Equities 1,267 7.25
Global Corporate Bonds - 23.93% (22.93%) *iShares $ Corporate Bond UCITS ETF 38,623 2,800 16.03 *iShares £ Corporate Bond UCITS ETF 2,412 325 1.86 *iShares € Corporate Bond Large Cap UCITS ETF 9,804 1,055 6.04
Total Global Corporate Bonds 4,180 23.93
Global Emerging Markets Debt - 9.86% (10.02%) *iShares JPMorgan $ Emerging Markets Bond UCITS ETF 12,011 845 4.84 *SPDR Barclays Capital Emerging Markets Local Bond ETF 15,866 878 5.02
Total Global Emerging Markets Debt 1,723 9.86
Global Emerging Markets Equities - 1.91% (2.90%) *+HSBC MSCI Emerging Markets Fund 53,833 334 1.91
Total Global Emerging Markets Equities 334 1.91
Global High Yield Bonds - 5.94% (7.72%) *iShares $ High Yield Corporate Bond UCITS ETF 15,086 1,038 5.94
Total Global High Yield Bonds 1,038 5.94
Japanese Equities - 4.85% (4.26%) +HSBC Japan Index Fund 1,332,443 848 4.85
Total Japan Equities 848 4.85
North American Equities - 24.02% (17.95%) +HSBC American Index Fund 1,332,700 4,197 24.02
Total North American Equities 4,197 24.02
Direct Property Funds - 6.09% (5.94%) *+HSBC FTSE ERPA/NAREIT Developed ETF 80,350 1,064 6.09
Total Direct Property Funds 1,064 6.09
UK Equities - 5.17% (8.30%) +HSBC FTSE All-Share Index Fund 312,154 904 5.17
Total UK Equities 904 5.17
WORLD INDEX BALANCED PORTFOLIO

72
Portfolio Statement as at 15 October 2014 (unaudited)
Security Holding Bid Totalvalue net£’000 assets
%UK Government Bonds - 1.42% (2.52%)
Treasury 2% 22/1/2016 £57,425 59 0.34 Treasury 3.75% 7/9/2019 £56,865 64 0.37 Treasury 4% 7/3/2022 £61,078 71 0.41 Treasury 4.75% 7/12/2030 £40,383 53 0.30 Total UK Government Bonds 247 1.42
US Government Bonds - 2.71% (2.49%) US Treasury 0.25% 15/5/2016 $314,800 198 1.13
US Treasury 2% 15/2/2022 $123,100 78 0.45 US Treasury 2.25% 31/1/2021 $179,200 116 0.67 US Treasury 4.375% 15/5/2041 $99,900 81 0.46 Total US Government Bonds 473 2.71
Forward Foreign Exchange Contracts - -0.33% (0.05%) #Sold USD 6,421,238 for £3,990,538 settled 31/10/2014 (38) (0.22)#Sold EUR 1,362,144 for £1,073,465 settled 31/10/2014 (17) (0.10)#Sold JPY 19,744,968 for £114,288 settled 31/10/2014 (2) (0.01)
Total Forward Foreign Exchange Contracts (57) (0.33)
Portfolio of investments 17,149 98.15
Net other assets 323 1.85
Net assets 17,472 100.00 *offshore funds +related party #unlisted Figures in brackets denote comparative percentage holdings as at 15 April 2014.
All holdings are authorised investment funds unless otherwise stated. Total purchases for the period, including transaction charges, were £5,677,883.
Total sales for the period, net of transaction charges, were £4,227,393.
WORLD INDEX BALANCED PORTFOLIO

73
Comparative Tablefor the six months ended 15 October 2014 (unaudited)
WORLD INDEX BALANCED PORTFOLIO
as at 15 April Net asset value Net asset value Shares in per share issue
(£) (p)
2012Retail Income* 52,975 105.9 50,000 Retail Accumulation** 2,978,722 105.8 2,812,946 Retail X Income 2,732,414 105.7 2,584,157 Retail X Accumulation 3,013,142 105.9 2,842,943 Institutional Accumulation*** 54,018 106.0 50,932
2013Retail Income 58,634 117.3 50,000 Retail Accumulation 3,346,029 118.7 2,819,519 Retail X Income 3,140,309 117.1 2,681,590 Retail X Accumulation 6,675,811 119.3 5,597,414 Institutional Accumulation 61,119 120.0 50,933 Income C**** 54,887 117.4 46,773 Accumulation C**** 735,111 119.0 617,585
2014Retail Income 58,954 117.9 50,000 Retail Accumulation 3,072,735 120.9 2,542,117 Retail X Income 3,105,393 117.8 2,637,350 Retail X Accumulation 6,106,701 122.0 5,007,006 Institutional Accumulation 163,100 123.3 132,294 Income C 363,241 118.0 307,846 Accumulation C 2,559,203 122.0 2,098,205
2014*****Retail Income 60,619 121.2 50,000 Retail Accumulation 3,123,524 125.6 2,486,076 Retail X Income 3,176,725 121.1 2,623,908 Retail X Accumulation 5,565,519 127.0 4,381,337 Institutional Accumulation 170,283 128.7 132,294 Income C 473,958 121.3 390,639 Accumulation C 4,901,251 127.2 3,854,452
*The Retail Income share class was launched on 12 March 2012. **The Retail Accumulation share class was launched on 27 February 2012. ***The Institutional Accumulation share class was launched on 10 February 2012. ****The Income C and Accumulation C share classes were launched on 1 November 2012. *****to 15 October

74 WORLD INDEX BALANCED PORTFOLIO
Comparative Tablefor the year ended 15 April 2012
Net income Highest share Lowest shareper share price price
(p) (p) (p)
Calendar year2011Retail X Income† - 102.5 96.45Retail X Accumulation†† - 102.4 96.39
2012Retail Income* 1.070000 110.2 101.6Retail Accumulation** 1.060000 111.2 101.5Retail X Income 1.541232 110.1 100.2Retail X Accumulation 1.534829 111.6 101.7Institutional Accumulation*** 1.617585 112.1 101.8Income C**** N/A 110.2 106.0Accumulation C**** N/A 111.4 107.1
2013Retail Income 1.397780 122.3 111.0Retail Accumulation 1.424253 123.8 112.0Retail X Income 1.869775 122.2 110.9Retail X Accumulation 1.891600 124.5 112.4Institutional Accumulation 2.464739 125.3 112.9Income C 1.989652 122.5 111.0Accumulation C 2.017399 124.3 112.2
2014*****Retail Income 1.760180 126.9 115.2Retail Accumulation 1.801932 130.1 117.7Retail X Income 2.238452 127.0 115.2Retail X Accumulation 2.313044 131.5 118.7Institutional Accumulation 2.941872 132.9 119.8Income C 2.484774 127.0 115.5Accumulation C 2.563901 131.3 118.6
†The Retail X Income share class was launched on 25 October 2011.††The Retail X Accumulation share class was launched on 17 October 2011.*The Retail Income share class was launched on 12 March 2012.**The Retail Accumulation share class was launched on 27 February 2012.***The Institutional Accumulation share class was launched on 10 February 2012.****The Income C and Accumulation C share classes were launched on 1 November 2012.*****to 15 October

75
2014Retail Income 1.36%Retail Accumulation 1.36%Retail X Income 0.86%Retail X Accumulation 0.86%Institutional Accumulation 0.26%Income C 0.61%Accumulation C 0.61%
as at 15 April2014Retail Income 1.36%Retail Accumulation 1.36%Retail X Income 0.86%Retail X Accumulation 0.86%Institutional Accumulation 0.26%Income C 0.61%Accumulation C 0.61%
Ongoing Charges Figure (OCF) as at 15 October
WORLD INDEX BALANCED PORTFOLIO

76 WORLD INDEX BALANCED PORTFOLIO
Statement of Total Returnfor the six months ended 15 October 2014 (unaudited)
15.10.14 15.10.13 £’000 £’000 £’000 £’000
Income Net capital gains 431 66 Revenue 254 205 Expenses (56) (55)Net revenue before taxation 198 150 Taxation (11) (2)Net revenue after taxation for the period 187 148 Total return before distributions 618 214 Finance costs: Distributions (205) (158)Change in net assets attributable to shareholders from investment activities 413 56
Statement of Change in Net Assets Attributable to Shareholdersfor the six months ended 15 October 2014 (unaudited)
15.10.14 15.10.13 £’000 £’000 £’000 £’000
Opening net assets attributable to shareholders 15,429 14,072 Amounts receivable on creation of shares 2,597 2,024 Amounts payable on cancellation of shares (1,142) (710)
1,455 1,314 Stamp duty reserve tax - (1)Change in net assets attributable to shareholders frominvestment activities (see Statement of Total Return above) 413 56 Retained distribution on accumulation shares 175 131 Closing net assets attributable to shareholders 17,472 15,572
Balance Sheet as at 15 October 2014 (unaudited)
15.10.14 15.4.14£’000 £’000 £’000 £’000
AssetsInvestment assets 17,206 15,217 Debtors 624 21 Cash and bank balances 599 250 Total other assets 1,223 271 Total assets 18,429 15,488 LiabilitiesInvestment liabilities (57) (2) Creditors (852) (37) Distribution payable on income shares (48) (20)Total other liabilities (900) (57)Total liabilities (957) (59)Net assets attributable to shareholders 17,472 15,429

77WORLD INDEX BALANCED PORTFOLIO
Distribution Table (pence per share) for the six months ended 15 October 2014 (unaudited)
Net Equalisation Distribution Distributionincome payable paid
15.12.14 15.12.13
Retail IncomeGroup 1 1.320000 - 1.320000 1.090000Group 2 1.320000 0.000000 1.320000 1.090000
Retail AccumulationGroup 1 1.360000 - 1.360000 1.110000Group 2 0.870000 0.490000 1.360000 1.110000
Retail X IncomeGroup 1 1.570000 - 1.570000 1.330000Group 2 0.460000 1.110000 1.570000 1.330000
Retail X AccumulationGroup 1 1.620000 - 1.620000 1.350000Group 2 0.950000 0.670000 1.620000 1.350000
Institutional AccumulationGroup 1 1.950000 - 1.950000 1.650000Group 2 1.950000 0.000000 1.950000 1.650000
Income CGroup 1 1.690000 - 1.690000 1.450000Group 2 0.810000 0.880000 1.690000 1.450000
Accumulation CGroup 1 1.750000 - 1.750000 1.470000Group 2 0.280000 1.470000 1.750000 1.470000
Group 1: Shares purchased prior to 16 April 2014 Group 2: Shares purchased from 16 April 2014 to 15 October 2014

78
Investment Objective
To provide capital growth through cautious investment in a broad range of asset classes across global markets, with a bias towards fixed interest securities.
Investment Policy
To invest mainly in collective investment schemes, exchange traded funds and, where appropriate, direct investment into certain other assets.
Investment Strategy
With effect from 1 July 2014:
The Fund follows a broadly diversified investment approach across various different asset classes primarily investing in vehicles that track an appropriate market index. Asset classes held include traditional asset classes, such as equities and fixed income, but also alternative asset classes, for example commodities, private equity and property. The Fund Manager incorporates a quantitative investment process to identify the optimal portfolio construction and periodically rebalances the portfolio.
Exposure to such asset classes may be obtained by either direct investment, where permitted to do so within the Funds’ investment and borrowing powers, or through exposure by way of investing into collective investment schemes or exchange traded funds that in turn provide exposure to such asset classes.
Risk Profile
The Fund has little exposure to credit or cash flow risk. There are no borrowings or unlisted securities of a material nature and so there is little exposure to liquidity risk. The main risk is faces from its financial instruments are market price and foreign currency. The Manager reviews policies for managing these risks in order to follow and aim to achieve the Investment Objective and Policy as summarised above.
Portfolio Activity
The portfolio maintained a bias towards equities and away from government bonds over the reporting period. In our view the medium term prospective return on core government bonds remains poor given historically low yield levels. Global equities appear comparatively better value and we anticipate global equity markets will continue to grind moderately higher over the medium term. Towards the end of the period, exposure to global high yield debt was increased given what seemed to be improved starting valuations. The portfolio’s allocation to global investment grade credit was decreased to accommodate the move. Investment grade spreads remained relatively tight, and little changed, over the course of Q3 as high yield spreads moved wider.
Major purchases included: US Treasury 0.25% 15/5/2016, US Treasury 0.875% 31/7/2019 and US Treasury 2.25% 31/1/2021.
Major sales included: US Treasury 1% 30/9/2019, US Treasury 1% 31/5/2018 and Treasury 3.75% 7/9/2019.
Investment Performance
During the period under review, the value of the shares in the Fund increased by 4.06%.
(Source: Morningstar Direct, GBP, UK net of tax, for the Accumulation C share class. Returns based on the NAV, which is a single price.)
Please note that the above information refers to the past and that past performance is not a reliable indication of future returns.
World Index Cautious Portfolio
WORLD INDEX CAUTIOUS PORTFOLIO
Fund Particulars as at 16 October 2014 (unaudited)
Retail Income
Retail Accumulation
Retail X Income
Retail X Accumulation
Institutional Accumulation
Income CAccumulation
C
Price 111.1p xd 114.4p 110.6p xd 115.6p 117.2p 111.1p xd 115.7p
Distribution payable (on 15 Dec 2014) per share net
0.780000p 0.800000p 1.000000p 1.030000p 1.320000p 1.110000p 1.150000p
Current net estimated yield 1.10% 1.08% 1.50% 1.54% 1.90% 1.58% 1.63%
Annual ACD charge 0.95% 0.95% 0.45% 0.45% 0.00% 0.25% 0.25%

79WORLD INDEX CAUTIOUS PORTFOLIO
Portfolio Statement as at 15 October 2014 (unaudited)
Security Holding Bid Totalvalue net£’000 assets
%Asia-Pacific (excluding Japan) Equities - 1.43% (0.61%)
+HSBC Pacific Index Fund 106,385 213 1.43 Total Asia-Pacific (excluding Japan) Equities 213 1.43 Direct Property Funds - 6.01% (5.78%) *+HSBC FTSE ERPA/NAREIT Developed ETF 67,387 893 6.01
Total Direct Property Funds 893 6.01 European (excluding UK) Equities - 1.43% (3.68%)
+HSBC European Index Fund 48,399 212 1.43 Total European (excluding UK) Equities 212 1.43 Global Corporate Bonds - 21.09% (19.70%)
*iShares $ Corporate Bond UCITS ETF 28,855 2,092 14.09*iShares £ Corporate Bond UCITS ETF 1,858 251 1.69*iShares € Corporate Bond Large Cap UCITS ETF 7,325 788 5.31
Total Global Corporate Bonds 3,131 21.09 Global Emerging Markets Debt - 10.06% (9.88%)
*iShares JPMorgan $ Emerging Markets Bond UCITS ETF 10,484 738 4.97*SPDR Barclays Capital Emerging Markets Local Bond ETF 13,640 755 5.09
Total Global Emerging Markets Debt 1,493 10.06 Global Emerging Markets Equities - 0.51% (0.78%) *+HSBC MSCI Emerging Markets Fund 12,352 76 0.51
Total Global Emerging Markets Equities 76 0.51 Global High Yield Bonds - 3.46% (3.58%)
*iShares $ High Yield Corporate Bond UCITS ETF 7,467 514 3.46 Total Global High Yield Bonds 514 3.46 Japanese Equities - 1.95% (1.97%)
+HSBC Japan Index Fund 454,064 289 1.95 Total Japanese Equities 289 1.95 North American Equities - 6.59% (5.85%)
+HSBC American Index Fund 310,448 978 6.59 Total North American Equities 978 6.59 UK Equities - 2.15% (2.70%)
+HSBC FTSE All-Share Index Fund 110,106 319 2.15 Total UK Equities 319 2.15

80 WORLD INDEX CAUTIOUS PORTFOLIO
Portfolio Statement as at 15 October 2014 (unaudited)
Security Holding Bid Totalvalue net£’000 assets
%UK Government Bonds - 14.69% (19.75%) Treasury 1.75% 22/7/2019 £342,874 350 2.36 Treasury 2% 22/1/2016 £532,422 543 3.66 Treasury 2% 22/7/2020 £309,353 318 2.14 Treasury 4% 7/3/2022 £273,709 319 2.15 Treasury 4.25% 7/12/2027 £151,145 186 1.25 Treasury 4.75% 7/12/2030 £259,110 340 2.29 Treasury 5% 7/3/2025 £96,919 124 0.84 Total UK Government Bonds 2,180 14.69 US Government Bonds - 28.86% (19.83%) US Treasury 0.25% 15/5/2016 $2,241,100 1,407 9.48 US Treasury 0.875% 31/7/2019 $1,582,300 972 6.55 US Treasury 2% 15/2/2022 $784,200 499 3.36 US Treasury 2.25% 31/1/2021 $1,050,600 677 4.56 US Treasury 4.375% 15/5/2041 $757,300 617 4.16 US Treasury 5.375% 15/2/2031 $128,700 112 0.75 Total US Government Bonds 4,284 28.86 Forward Foreign Exchange Contracts - 0.49% (0.01%)
#Sold €887,160 for £699,144 settled 31/10/2014 (11) (0.07)#Sold $10,614,847 for £6,598,654 settled 31/10/2014 (61) (0.41)#Sold ¥7,220,973 for £41,797 settled 31/10/2014 (1) (0.01)
Total Forward Foreign Exchange Contracts (73) (0.49) Portfolio of investments 14,509 97.74
Net other assets 335 2.26
Net assets 14,844 100.00 *offshore funds +related party #unlisted Figures in brackets denote comparative percentage holdings as at 15 April 2014.
All holdings are authorised investment funds unless otherwise stated. Total purchases for the period, including transaction charges, were £10,460,592.
Total sales for the period, net of transaction charges, were £8,223,155.

81WORLD INDEX CAUTIOUS PORTFOLIO
Comparative Tablefor the six months ended 15 October 2014 (unaudited)
as at 15 April Net asset value Net asset value Shares in per share issue
(£) (p)
2012Retail Income* 78,281 104.3 75,037 Retail Accumulation** 2,618,233 104.3 2,510,870 Retail X Income 2,636,330 103.8 2,538,962 Retail X Accumulation 2,791,168 104.3 2,675,384 Institutional Accumulation*** 53,204 104.4 50,957
2013Retail Income 83,168 110.5 75,237 Retail Accumulation 2,547,281 111.8 2,278,046 Retail X Income 2,866,121 110.0 2,604,835 Retail X Accumulation 3,810,985 112.3 3,394,534 Institutional Accumulation 75,912 113.0 67,183 Income C**** 52,489 110.5 47,483 Accumulation C**** 930,325 112.0 830,389
2014Retail Income 81,480 107.9 75,504 Retail Accumulation 2,333,595 110.4 2,113,834 Retail X Income 2,837,455 107.4 2,641,568 Retail X Accumulation 3,629,258 111.3 3,261,166 Institutional Accumulation 56,275 112.6 50,000 Income C 220,316 107.9 204,148 Accumulation C 3,214,662 111.3 2,888,870
2014*****Retail Income 84,166 111.3 75,630 Retail Accumulation 2,391,139 114.6 2,085,707 Retail X Income 2,905,710 110.8 2,623,122 Retail X Accumulation 3,364,238 115.8 2,905,184 Institutional Accumulation 58,699 117.4 50,000 Income C 349,885 111.3 314,407 Accumulation C 5,689,669 115.9 4,908,915
*The Retail Income share class was launched on 12 March 2012. **The Retail Accumulation share class was launched on 23 February 2012. ***The Institutional Accumulation share class was launched on 10 February 2012. ****The Income C and Accumulation C share classes were launched on 1 November 2012. *****as at 15 October

82 WORLD INDEX CAUTIOUS PORTFOLIO
Comparative Tablefor the year ended 15 April 2012
Net income Highest share Lowest shareper share price price
(p) (p) (p)
Calendar year2011Retail X Income† - 102.2 99.42Retail X Accumulation†† - 102.1 99.33
2012Retail Income* 0.850000 107.0 103.1Retail Accumulation** 0.846098 107.8 103.0Retail X Income 1.597356 106.8 102.3Retail X Accumulation 1.590417 108.1 102.2Institutional Accumulation*** 1.596078 108.6 103.2Income C**** N/A 107.0 105.4Accumulation C**** N/A 107.8 106.2
2013Retail Income 1.131014 111.8 105.2Retail Accumulation 1.124858 113.1 106.4Retail X Income 1.552358 111.3 104.8Retail X Accumulation 1.587988 113.6 107.0Institutional Accumulation 2.128730 114.4 107.7Income C 1.705531 111.9 105.3Accumulation C 1.755977 113.4 106.8
2014*****Retail Income 1.317216 112.3 106.7Retail Accumulation 1.354967 114.9 108.6Retail X Income 1.752597 112.0 106.3Retail X Accumulation 1.804588 116.0 109.4Institutional Accumulation 2.371120 117.5 110.5Income C 1.984080 112.6 106.9Accumulation C 2.017012 116.1 109.3
†The Retail X Income share class was launched on 25 October 2011.††The Retail X Accumulation share class was launched on 17 October 2011.* The Retail Income share class was launched on 12 March 2012.** The Retail Accumulation share class was launched on 23 February 2012.*** The Institutional Accumulation share class was launched on 10 February 2012.****The Income C and Accumulation C share classes were launched on 1 November 2012.*****to 15 October

83
2014Retail Income 1.33%Retail Accumulation 1.33%Retail X Income 0.83%Retail X Accumulation 0.83%Institutional Accumulation 0.23%Income C 0.58%Accumulation C 0.58%
as at 15 April2014Retail Income 1.33%Retail Accumulation 1.33%Retail X Income 0.83%Retail X Accumulation 0.83%Institutional Accumulation 0.23%Income C 0.58%Accumulation C 0.58%
Ongoing Charges Figure (OCF) as at 15 October
WORLD INDEX CAUTIOUS PORTFOLIO

84
Statement of Total Returnfor the six months ended 15 October 2014 (unaudited)
15.10.14 15.10.13 £’000 £’000 £’000 £’000
Income Net capital gains/(losses) 419 (294) Revenue 175 113 Expenses (45) (40)Net revenue before taxation 130 73 Taxation (17) (6)Net revenue after taxation for the period 113 67 Total return before distributions 532 (227)Finance costs: Distributions (120) (81)Change in net assets attributable to shareholders from investment activities 412 (308)
Statement of Change in Net Assets Attributable to Shareholdersfor the six months ended 15 October 2014 (unaudited)
15.10.14 15.10.13 £’000 £’000 £’000 £’000
Opening net assets attributable to shareholders 12,373 10,366Amounts receivable on creation of shares 2,850 708 Amounts payable on cancellation of shares (895) (432)
1,955 276 Change in net assets attributable to shareholders frominvestment activities (see Statement of Total Return above) 412 (308)Retained distribution on accumulation shares 104 58 Closing net assets attributable to shareholders 14,844 10,392
Balance Sheet as at 15 October 2014 (unaudited)
15.10.14 15.4.14£’000 £’000 £’000 £’000
AssetsInvestment assets 14,582 11,649 Debtors 147 262 Cash and bank balances 465 724 Total other assets 612 986 Total assets 15,194 12,635 LiabilitiesInvestment liabilities (73) (3) Creditors (247) (237) Distribution payable on income shares (30) (22)Total other liabilities (277) (259)Total liabilities (350) (262)Net assets attributable to shareholders 14,844 12,373
WORLD INDEX CAUTIOUS PORTFOLIO

85
Distribution Table (pence per share) for the six months ended 15 October 2014 (unaudited)
Net Equalisation Distribution Distributionincome payable paid
15.12.14 15.12.13
Retail IncomeGroup 1 0.780000 - 0.780000 0.680000Group 2 0.260000 0.520000 0.780000 0.680000
Retail AccumulationGroup 1 0.800000 - 0.800000 0.680000Group 2 0.610000 0.190000 0.800000 0.680000
Retail X IncomeGroup 1 1.000000 - 1.000000 0.890000Group 2 0.420000 0.580000 1.000000 0.890000
Retail X AccumulationGroup 1 1.030000 - 1.030000 0.910000Group 2 0.580000 0.450000 1.030000 0.910000
Institutional AccumulationGroup 1 1.320000 - 1.320000 1.180000Group 2 1.320000 - 1.320000 1.180000
Income CGroup 1 1.110000 - 1.110000 1.000000Group 2 0.420000 0.690000 1.110000 1.000000
Accumulation CGroup 1 1.150000 - 1.150000 1.020000Group 2 0.410000 0.740000 1.150000 1.020000
Group 1: Shares purchased prior to 16 April 2014 Group 2: Shares purchased from 16 April 2014 to 15 October 2014
WORLD INDEX CAUTIOUS PORTFOLIO

86
Investment ObjectiveTo provide capital growth through investment in a broad range of asset classes across global markets, with a bias towards equities.
Investment PolicyTo invest primarily in collective investment schemes and exchange traded funds that aim to match the returns of market indices.
Investment StrategyWith effect from 1 July 2014:The Fund follows a broadly diversified investment approach across various different asset classes primarily investing in vehicles that track an appropriate market index. Asset classes held include traditional asset classes, such as equities and fixed income, but also alternative asset classes, for example commodities, private equity and property. The Fund Manager incorporates a quantitative investment process to identify the optimal portfolio construction and periodically rebalances the portfolio.Exposure to such asset classes may be obtained by either direct investment, where permitted to do so within the Funds’ investment and borrowing powers, or through exposure by way of investing into collective investment schemes or exchange traded funds that in turn provide exposure to such asset classes.
Risk ProfileThe Fund has little exposure to credit or cash flow risk. There are no borrowings or unlisted securities of a material nature and so there is little exposure to liquidity risk. The main risk it faces from its financial instruments are market price and foreign currency. The Manager reviews policies for managing these risks in order to follow and aim to achieve the Investment Objective and Policy as summarised above.
Portfolio Activity
The portfolio maintained a bias towards equities and away from government bonds over the reporting period. In our view the medium term prospective return on core government bonds remains poor given historically low yield levels. Global equities appear comparatively better value and we anticipate global equity markets will continue to grind moderately higher over the medium term. Towards the end of the period, exposure to global high yield debt was increased given what seemed to be improved starting valuations. The portfolio’s allocation to global investment grade credit was decreased to accommodate the move. Investment grade spreads remained relatively tight, and little changed, over the course of Q3 as high yield spreads moved wider.
Major purchases included: HSBC American Index Fund, HSBC S&P 500 ETF USD and HSBC European Index Fund.
Major sales included: HSBC European Index Fund, HSBC FTSE All-Share Index Fund and iShares Markit iBoxx Euro High Yield Bond UCITS ETF.
Investment Performance
During the period under review, the value of the shares in the Fund increased by 4.04%.
(Source: Morningstar Direct, GBP, UK net of tax, for the Retail X Accumulation share class. Returns based on the NAV, which is a single price.)
Please note that the above information refers to the past and that past performance is not a reliable indication of future returns.
World Index Dynamic Portfolio
Fund Particulars as at 16 October 2014 (unaudited)
Retail Income
Retail Accumulation
Retail X Income
Retail X Accumulation
Institutional Accumulation
Income CAccumulation
C
Price 121.9p xd 126.8p 121.9p xd 128.1p 129.9p 121.9p xd 128.3p
Distribution payable (on 15 Dec 2014) per share net
1.600000p 1.640000p 1.850000p 1.920000p 2.260000p 1.980000p 2.050000p
Current net estimated yield 1.34% 1.31% 1.71% 1.73% 2.09% 1.79% 1.83%
Annual ACD charge 0.95% 0.95% 0.45% 0.45% 0.00% 0.25% 0.25%
WORLD INDEX DYNAMIC PORTFOLIO

87
Portfolio Statement as at 15 October 2014 (unaudited)
Security Holding Bid Totalvalue net£’000 assets
%Asia-Pacific (excluding Japan) Equities - 7.74% (6.14%)
+HSBC Pacific Index Fund 482,942 966 7.74 Total Asia-Pacific (excluding Japan) Equities 966 7.74 European High Yield Bonds - 0.00% (2.03%)
European (excluding UK) Equities - 11.16% (15.39%)
+HSBC European Index Fund 317,199 1,393 11.16 Total European (excluding UK) Equities 1,393 11.16 Global Corporate Bonds - 4.67% (4.65%)
*iShares £ Corporate Bond UCITS ETF 336 45 0.36*iShares $ Corporate Bond UCITS ETF 5,389 391 3.13*iShares € Corporate Bond Large Cap UCITS ETF 1,368 147 1.18
Total Global Corporate Bonds 583 4.67 Global Emerging Markets Debt - 10.15% (8.02%)
*iShares JPMorgan $ Emerging Markets Bond Fund UCITS ETF 9,032 636 5.10*SPDR Barclays Capital Emerging Markets Local Bond ETF 11,391 631 5.05
Total Global Emerging Markets Debt 1,267 10.15 Global Emerging Markets Equities - 2.97% (4.51%) *+HSBC MSCI Emerging Markets Fund 59,829 371 2.97
Total Global Emerging Markets Equities 371 2.97 Global High Yield Bonds - 5.95% (9.02%)
*iShares $ High Yield Corporate Bond UCITS ETF 10,791 743 5.95 Total Global High Yield Bonds 743 5.95 Japanese Equities - 6.99% (6.37%)
+HSBC Japan Index Fund 1,370,439 872 6.99 Total Japanese Equities 872 6.99 North American Equities - 29.95% (25.61%)
+HSBC American Index Fund 1,186,840 3,737 29.95 Total North American Equities 3,737 29.95 Direct Property Funds - 6.13% (5.98%) *+HSBC FTSE ERPA/NAREIT Developed ETF 57,777 765 6.13
Total Direct Property Funds 765 6.13 UK Equities - 12.20% (10.84%)
+HSBC FTSE All-Share Index Fund 314,906 912 7.31 HSBC S&P 500 ETF USD 52,329 610 4.89 Total UK Equities 1,522 12.20
WORLD INDEX DYNAMIC PORTFOLIO

88
Portfolio Statement as at 15 October 2014 (unaudited)
Security Holding Bid Totalvalue net£’000 assets
%Forward Foreign Exchange Contracts - -0.11% (0.05%)
#Sold €219,304 for £172,827 settled 31/10/2014 (3) (0.02)#Sold ¥13,120,304 for £75,943 settled 31/10/2014 (1) (0.01)#Sold $1,689,615 for £1,050,027 settled 31/10/2014 (10) (0.08)
Total Forward Foreign Exchange Contracts (14) (0.11)
Portfolio of investments 12,205 97.80
Net other assets 275 2.20
Net assets 12,480 100.00 *offshore funds +related party #unlisted Figures in brackets denote comparative percentage holdings as at 15 April 2014.
All holdings are authorised investment funds unless otherwise stated. Total purchases for the period, including transaction charges, were £3,473,588.
Total sales for the period, net of transaction charges, were £2,461,089.
WORLD INDEX DYNAMIC PORTFOLIO

89WORLD INDEX DYNAMIC PORTFOLIO
Comparative Tablefor the six months ended 15 October 2014 (unaudited)
as at 15 April Net asset value Net asset value Shares in per share issue
(£) (p)
2012Retail Income* 53,383 106.7 50,046 Retail Accumulation** 900,672 106.8 843,098 Retail X Income 2,711,568 106.6 2,543,487 Retail X Accumulation 3,013,182 106.8 2,820,126 Institutional Accumulation*** 54,454 106.9 50,924
2013Retail Income 61,362 119.2 51,496 Retail Accumulation 1,094,451 120.7 906,706 Retail X Income 3,074,122 119.1 2,580,752 Retail X Accumulation 4,865,461 121.2 4,012,760 Institutional Accumulation 64,416 122.0 52,779 Income C**** 55,370 119.2 46,468 Accumulation C**** 553,858 121.1 457,330
2014Retail Income 64,369 120.7 53,329 Retail Accumulation 948,055 123.9 764,961 Retail X Income 3,148,880 120.7 2,609,528 Retail X Accumulation 4,987,155 125.0 3,991,438 Institutional Accumulation 63,179 126.4 50,000 Income C 148,314 120.7 122,860 Accumulation C 1,718,388 125.0 1,374,273
2014*****Retail Income 66,913 123.6 54,135 Retail Accumulation 937,477 128.6 729,241 Retail X Income 3,228,404 123.6 2,611,238 Retail X Accumulation 5,012,897 129.9 3,858,230 Institutional Accumulation 65,875 131.8 50,000 Income C 181,407 123.6 146,719 Accumulation C 2,987,268 130.1 2,296,021
*The Retail Income share class was launched on 12 March 2012. **The Retail Accumulation share class was launched on 27 February 2012. ***The Institutional Accumulation share class was launched on 10 February 2012. ****The Income C and Accumulation C share classes were launched on 1 November 2012. *****as at 15 October

90 WORLD INDEX DYNAMIC PORTFOLIO
Comparative Tablefor the year ended 15 April 2012
Net income Highest share Lowest shareper share price price
(p) (p) (p)
Calendar year2011Retail X Income† - 103.2 94.88Retail X Accumulation†† - 103.3 94.95
2012Retail Income* 1.100000 111.5 100.6Retail Accumulation** 1.090000 112.8 100.8Retail X Income 1.455766 111.5 100.6Retail X Accumulation 1.433012 113.1 100.8Institutional Accumulation*** 1.650000 113.7 100.9Income C**** N/A 112.9 107.4Accumulation C**** N/A 112.9 107.4
2013Retail Income 1.488594 125.8 112.8Retail Accumulation 1.513115 127.4 114.1Retail X Income 2.022428 125.8 112.9Retail X Accumulation 2.062747 128.0 114.5Institutional Accumulation 2.641311 129.0 115.1Income C 2.198826 125.8 112.9Accumulation C 2.236918 127.9 114.3
2014*****Retail Income 1.927830 132.1 117.5Retail Accumulation 1.973856 135.6 120.3Retail X Income 2.338414 132.3 117.5Retail X Accumulation 2.427600 137.0 121.2Institutional Accumulation 3.066980 138.9 122.4Income C 2.591427 132.4 117.6Accumulation C 2.677628 137.2 121.2
†The Retail X Income share class was launched on 25 October 2011.††The Retail X Accumulation share class was launched on 17 October 2011.* The Retail Income share class was launched on 12 March 2012.** The Retail Accumulation share class was launched on 27 February 2012.*** The Institutional Accumulation share class was launched on 10 February 2012.****The Income C and Accumulation C share classes were launched on 1 November 2012.*****to 15 October

91
2014Retail Income 1.36%Retail Accumulation 1.36%Retail X Income 0.86%Retail X Accumulation 0.86%Institutional Accumulation 0.26%Income C 0.61%Accumulation C 0.61%
as at 15 April2014Retail Income 1.37%Retail Accumulation 1.37%Retail X Income 0.87%Retail X Accumulation 0.87%Institutional Accumulation 0.27%Income C 0.62%Accumulation C 0.62%
Ongoing Charges Figure (OCF) as at 15 October
WORLD INDEX DYNAMIC PORTFOLIO

92
Statement of Total Returnfor the six months ended 15 October 2014 (unaudited)
15.10.14 15.10.13 £’000 £’000 £’000 £’000
Income Net capital gains 246 228 Revenue 216 161 Expenses (39) (36)Net revenue before taxation 177 125 Taxation - - Net revenue after taxation for the period 177 125 Total return before distributions 423 353 Finance costs: Distributions (171) (132)Change in net assets attributable to shareholders from investment activities 252 221
Statement of Change in Net Assets Attributable to Shareholdersfor the six months ended 15 October 2014 (unaudited)
15.10.14 15.10.13 £’000 £’000 £’000 £’000
Opening net assets attributable to shareholders 11,078 9,769 Amounts receivable on creation of shares 1,630 1,201 Amounts payable on cancellation of shares (614) (391)
1,016 810 Change in net assets attributable to shareholders frominvestment activities (see Statement of Total Return above) 252 221 Retained distribution on accumulation shares 134 96 Closing net assets attributable to shareholders 12,480 10,896
Balance Sheet as at 15 October 2014 (unaudited)
15.10.14 15.4.14£’000 £’000 £’000 £’000
AssetsInvestment assets 12,219 10,925 Debtors 258 23 Cash and bank balances 326 250 Total other assets 584 273 Total assets 12,803 11,198 LiabilitiesInvestment liabilities (14) (1) Creditors (257) (105) Distribution payable on income shares (52) (14)Total other liabilities (309) (119)Total liabilities (323) (120)Net assets attributable to shareholders 12,480 11,078
WORLD INDEX DYNAMIC PORTFOLIO
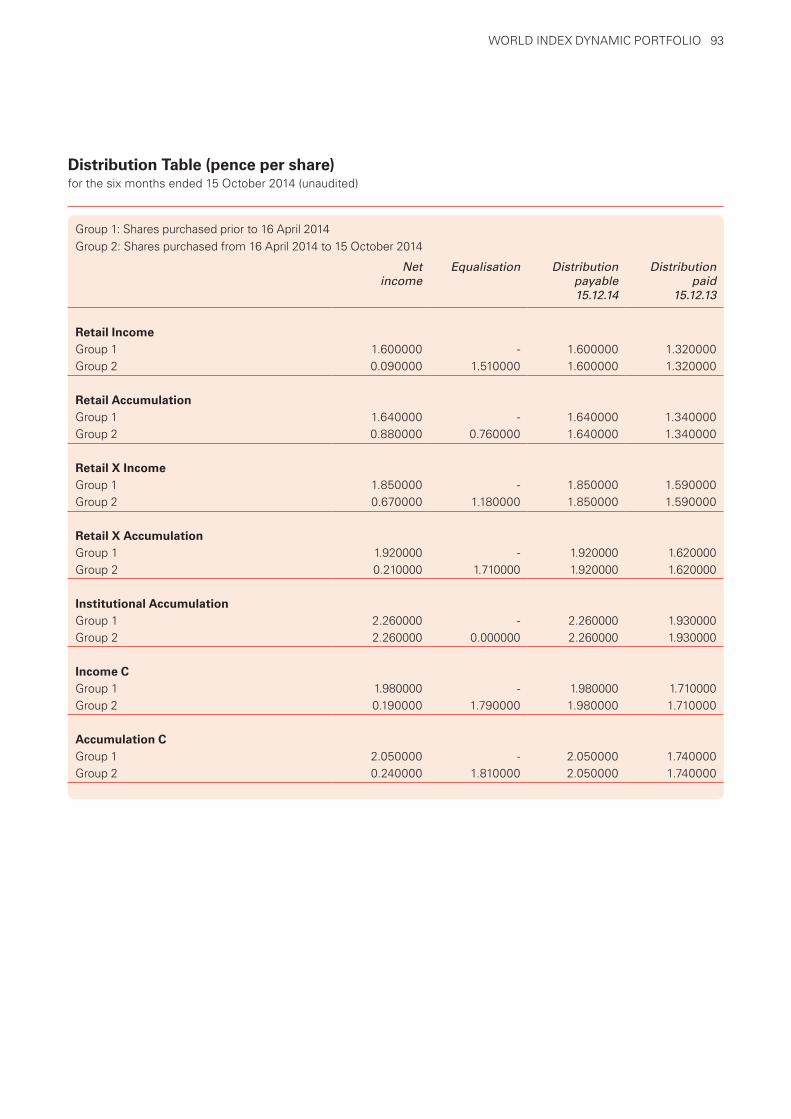
93
Distribution Table (pence per share) for the six months ended 15 October 2014 (unaudited)
Net Equalisation Distribution Distributionincome payable paid
15.12.14 15.12.13
Retail IncomeGroup 1 1.600000 - 1.600000 1.320000Group 2 0.090000 1.510000 1.600000 1.320000
Retail AccumulationGroup 1 1.640000 - 1.640000 1.340000Group 2 0.880000 0.760000 1.640000 1.340000
Retail X IncomeGroup 1 1.850000 - 1.850000 1.590000Group 2 0.670000 1.180000 1.850000 1.590000
Retail X AccumulationGroup 1 1.920000 - 1.920000 1.620000Group 2 0.210000 1.710000 1.920000 1.620000
Institutional AccumulationGroup 1 2.260000 - 2.260000 1.930000Group 2 2.260000 0.000000 2.260000 1.930000
Income CGroup 1 1.980000 - 1.980000 1.710000Group 2 0.190000 1.790000 1.980000 1.710000
Accumulation CGroup 1 2.050000 - 2.050000 1.740000Group 2 0.240000 1.810000 2.050000 1.740000
Group 1: Shares purchased prior to 16 April 2014 Group 2: Shares purchased from 16 April 2014 to 15 October 2014
WORLD INDEX DYNAMIC PORTFOLIO

94
General Information
How to Buy, Sell or Switch Your Investment
• Call our Dealers on 0345 745 6123*
or
• Write to our Administration Office at: HSBC Global Asset Management (UK) Limited, PO Box 6189, Coventry, CV3 9HS.
Switching Your Investment
• Some discounts are available for switching between our OEIC Funds.
• Switching from one OEIC Fund to another may create a capital gains tax liability.
No subscription can be received on the basis of financial reports. Subscriptions are only valid if made on the basis of the current KIID (in conjunction with the Supplementary Information Document (SID)) and Prospectus accompanied by the latest Annual Report and the most recent Interim Report, if published thereafter. Further details of our switching discounts may be obtained by:-
• Telephoning our Customer Services, on 0345 745 6123*
• Textphone 0345 766 0391*
Minimum Additional Subscription
• The minimum additional subscription is £500 for the X and retail share classes, £1,000 for the C and institutional A share classes and £1,000,000 for the institutional share class.
Selling your Investment
You can sell or make a withdrawal at any time.
• You must take at least £100 each time.
• We reserve the right to request that you leave the minimum investment of £1,000 for retail holdings, £1,000,000 for Institutional ‘A’ holdings and £10,000,000 for institutional holdings, or close the investment.
• Settlement is normally made within 3 business days from the receipt of your instructions.
When We Will Buy or Sell Your Investment
Share prices are calculated at 12 noon each business day. The price at which shares are bought or sold depends on when we receive your instructions.
• Before 12 noon. That day’s share prices will be used.
• After 12 noon. The following business day’s prices will be used.
We will send you a contract note within 24 hours of the transaction. This confirms the transaction was made.
Cancellation Rights
• In certain circumstances we will send you a cancellation notice. If so this will be sent within 7 days of making your investment.
• Return this notice to us within 30 days if you do not wish to proceed with your investment.
• It is possible to receive back less than your original investment, if the value of your shares has fallen.
Publication of Prices
The prices of shares are updated daily on the following websites: www.assetmanagement.hsbc.com/uk and www.investinginfunds.org/ways-to-buy-and-sell-funds.html.
Alternatively you can call our Investments Helpline on 0345 745 6123 (Textphone 0345 766 0391).*
If you are registered to use the Personal Internet Banking service offered by HSBC Bank plc you can view a valuation of your investments online. For more information please visit: www.hsbc.co.uk.

95
Prospectus
The Prospectus provides further details on our OEICs. For a copy of the latest Prospectus (available free of charge):-
• Telephone our Customer Services on 0345 745 6123*
• Write to our Administration Office
Income
Income is distributed or accumulated in the following way:-
• You will receive income payments net of tax. The payment dates for each of the Funds are detailed in the table on pages 104 and 105.
• If you hold accumulation shares, income will be retained within the Fund. No additional shares will be bought. The price of shares will reflect the net income received.
We must disclose details of such distributions to HM Revenue and Customs (HMRC). The distribution also needs to be disclosed on your tax return.
Income Tax
A tax voucher is sent each year to all shareholders which will aid completion of tax returns.
Distributions from the World Selection - Income Portfolio are classed as interest distributions. Distributions from all other Funds are classed as dividend distributions.
An interest distribution is paid to you after deduction of tax at the rate of 20%. The position for individual categories of taxpayers is set out below:
• Non-taxpayers can use the tax voucher to support a tax repayment claim.
• Basic rate taxpayers will have no further tax to pay. The tax deducted meets any liability for basic rate income tax.
• Higher rate taxpayers will have a further tax liability of one quarter of the net distribution payment.
You will be entitled to receive all or part of the interest distribution gross of income tax, providing:
• You are not ordinarily resident (NOR) in the UK, and
• You have made a valid NOR declaration to the Authorised Corporate Director.
If you require a Not Ordinarily Resident Declaration Form (R105) please contact our Administration Office.
A dividend distribution is paid to you with a tax credit of one ninth of the payment. Your income for tax purposes is the sum of the distribution and the tax credit. The tax credit can be set off against your tax liability. The position for individual categories of taxpayers is set out below.
• It is not possible for non-taxpayers to claim repayment of tax credits on distributions.
• Basic rate taxpayers will have no further tax to pay. The tax credit meets any liability for basic rate income tax.
• Higher rate taxpayers will have a further tax liability of one quarter of the net distribution payment.
Capital Gains Tax
You will not need to pay capital gains tax unless your net gains from all sources exceed the annual exemption limit. The limit for the 2014/2015 tax year is £11,000.
*To help us continually improve our service, and in the interests of security, we may monitor and/or record your communications with us.
Lines are open Monday to Friday from 8am to 6pm (excluding public holidays).

96
Important Notes
The Interim report covers the period 16 April 2014 to 15 October 2014.
Investments in stocks and shares can go down as well as up and investors may not get back the amount they originally invested. This can affect the price of shares within open-ended investment companies and the income from them.
Past performance should not be seen as an indication of future returns.
Your holding in an open-ended investment company must be regarded as a medium to long-term investment; this means for at least five years.
Where overseas securities are held the prices and income may also be affected by changes in currency exchange rates. It is possible that the value of an investment may fall below its original level.
Investments in emerging markets are by their nature higher risk and potentially more volatile than those inherent in some established markets. These risks include the possibility of failed or delayed settlement, registration and custody of securities and the level of investor protection offered.
The value and relative yield of fixed interest securities (including bonds) are strongly affected by interest rate fluctuations and by changes in the credit ratings of the underlying issuer of the assets. Higher-yielding securities are more likely to default.
The long-term nature of investment in property and the income generated tend to make this type of investment less volatile than equities although it can be difficult to buy and/or sell quickly. Where the underlying Funds invest directly in property, the property in the Fund may not be readily realisable, and the Manager of the Fund may apply a deferral on redemption requests. The value of property is generally a matter of the valuer’s opinion rather than fact. Listed property securities are part of the equity market and are more volatile than direct (unlisted) property, which can mean that the price of shares and the income from them can fluctuate, sometimes dramatically.
There are further risks involved in investing in HSBC OpenFunds. Please refer to the Prospectus, Key Investor Information Document (KIID) and Supplementary Information Document (SID) for further details.
Please note any reference to “Fund” or “Funds” means a sub fund of the Company.
This report is issued in the UK by HSBC Global Asset Management (UK) Limited, authorised and regulated by the Financial Conduct Authority.
The information in this report is based on our understanding of current law and HM Revenue and Customs practice as at 15 October 2014. Both law and practice may of course change.
The views expressed are those of HSBC Global Asset Management (UK) Limited and do not constitute investment advice. No liability can be accepted for recipients acting independently on its content.

97
Important Changes to the Company and/or Fund DocumentationThe following changes to the Company have resulted in the ACD (Authorised Corporate Director) making changes to the Company’s Instrument of Incorporation and its Prospectus.
Amendments to the Company’s Instrument of Incorporation
New definitions were added for “AIFM” and “UK Valuations Committee”. In addition the definition for “ACD” was amended to confirm that the ACD is also the AIFM and the definition for the “FCA Rules” was amended to include the FUND Sourcebook.
Clause 16.4 has been amended to allow the ACD to defer a bulk conversion request until the following XD date where it is felt this would be in the interest of shareholders.
Clause 20.5 has been removed, following the changes to the rules around Stamp Duty Reserve Tax, announced in the April 2014 budget.
Part 3 – Determination of the Net Asset Value has been expanded to explain the role of the UK Valuations Committee as well as confirming that income received from stocklending will be received into the income account for the relevant Fund and reflected in that Fund’s NAV.
Amendments to the Company Prospectus
The Prospectus has been amended to implement the changes required as a result of the implementation for the Alternative Investment Fund Manager’s Directive (“AIFMD”):-
Definitions
New definitions were added for “AIF”, “AIFM”, “AIFMD”, “financial instruments held in custody”, “OEIC Regulations”, “SRRI”, “UK Valuations Committee”, “Auditor”, “Depositary Agreement” and “Register”. In addition, the definition for ACD” was amended to confirm that the ACD is also the AIFM and the definition for the “FCA Rules” was amended to include the FUND Sourcebook.
Share Classes
The ACD has added information regarding the circumstances in which discounts and exceptions to subscription criteria may be available to investors.
Calculation of the Net Asset Value (NAV)
Determination of the Net Asset Value has been expanded to explain the role of the UK Valuations Committee as well as confirming that income received from stocklending will be received into the income account for the relevant Fund and reflected in that Fund’s NAV.
Dealing in Shares
The Investments Helpline is now open from 8am to 6pm, Monday to Friday (excluding public holidays).
Selling Shares
Changes to Fund Settlement Cycles
For all Funds in the Company the settlement cycle is being shortened by one business day in order to follow the settlement cycle of the underlying assets that the Funds trade in, which is shortening as a result of regulatory changes.
The effect of this change is that when you buy shares in the affected Funds, payment will be required from you one day sooner than it is currently. It also means that when shares are sold, payment will be sent to you one day earlier than currently happens. In accordance with the Company Prospectus, the settlement date for the purchase of shares in the Funds will continue to be stated in contract notes and the Prospectus has been amended to make clear that, in the case of the sale of your shares, payment will be made to you one business earlier, that is by the close of business on the third business day rather than the fourth.
Risks – (the following additional risks have been added although they do not alter the risk profile of your fund)
SRRI - A description of the Synthetic Risk and Reward Indicator (SRRI) has been added to this section with an explanation of what the indicators mean.
Leverage Risk - An explanation of Leverage Risk has been added which sets out how it is calculated, how it is reported and the risks it presents;

98
Management and Administration
The ACD Agreement has been replaced with effect from 1 July 2014 to comply with the requirements of the AIFMD.
The Depositary section has been amended to reflect the increased responsibilities of the Depositary under the AIFMD and a new depositary agreement has been entered into effective from 1 July 2014.
New sections for each of the Auditor and the Legal Adviser have been added with a description of the duties of the auditor and the legal adviser and the rights of the Shareholders in respect of these and other service providers.
The Investment Management section has been expanded to cover delegated management functions and the AIFM’s responsibility in selecting and approving such delegates, as well as setting out the AIFM’s responsibility on Shareholder communications when a change is made to the investment objective, investment policy and/or investment strategy of a fund.
The Conflicts of Interest section has been expanded to include the AIFM’s Conflicts of Interest Policy. We have also included a section on the Bank Holding Company Act and the circumstances under which this may restrict the investments and transactions of the Company.
Increase to Depositary Charges
Following changes that have been made to the Funds to comply with the requirements of the Alternative Investment Funds Managers Directive (AIFMD), the role of the Depositary requires an increased liability and monitoring duties and this has necessitated an increase in the Depositary charges payable by the Funds. The ACD has agreed the proposed increase as detailed below.
Currently the Depositary’s charge is 0.01% per annum of the value of the relevant Fund property (plus VAT), on the first £200,000,000. After the first £200,000,000 the charge is 0.0075% per annum (plus VAT). These charges are exclusive of custody settlement charges.
The Depositary has advised that, with effect from 1 January 2015, its new charge will be 0.015% per annum of the value of the relevant Fund property (plus VAT), on the first £200,000,000. After the first £200,000,000 the charge will remain at 0.0075% per annum (plus VAT). These charges are exclusive of custody settlement charges.
Fees and Expenses
This has been expanded to include the Ongoing Charges Figure (OCF) with an explanation of how the OCF is calculated.
We have also clarified how the initial charge, annual management charge, registration fee and other expenses payable to the ACD and its associates may be increased in accordance with the FCA Rules.
The Auditor’s fee and Legal Adviser’s Fee are also now explained in this section.
General Information
A statement is added confirming the AIFM has professional indemnity insurance and maintains an amount of its own funds in order to protect shareholders where there is professional negligence and to satisfy the requirements laid down in the FCA rules.
Individual Fund Information
Expansion of the information on each Fund of the Company including the investment strategy and the SRRI for each of the Funds; and as the AIFs in this document are funds of funds information is provided on where the underlying funds are established.
Investment Powers and Restrictions
A new section, Part E, has been added to outline the type of leverage that can be used as part of EPM and borrowing. Stocklending and underwriting has been renumbered as Part F which has also been expanded to outline restrictions for stocklending and underwriting transactions.
Eligible Collective Investment Schemes
As the AIFs in this document are funds of funds information is provided on where the underlying funds are established.

99
Eligible Securities Markets
The Channel Islands Stock Exchange (CISX) has been added to the eligible securities markets for the World Selection - Income Portfolio.
World Selection Portfolios – Update
As previously communicated by the Authorised Corporate Director (ACD), from 1 July 2014 changes have been made to the strategy to achieve the investment objectives for the World Selection Portfolios.
Although the World Selection – Income Portfolio was included in the changes, the underlying holdings are selected with an income objective and there are fewer potential underlying holdings which target income rather than growth. This means that the opportunity to reduce the World Selection – Income Portfolio’s overall costs through changes to underlying holdings is more limited, and has to be managed carefully to ensure the income objective is not compromised.
While the World Selection – Income Portfolio has now adopted the new investment strategy the ACD has not yet been able to achieve a reduction in the on-going charges. This also means that the change in the investment strategy of the World Selection Portfolios has so far not resulted in any transition costs for the World Selection – Income Portfolio.
The ACD is seeking to achieve the World Selection – Income Portfolio’s objective in the most cost-efficient manner. In the future, this may result in changes to some of the underlying holdings in the World Selection – Income Portfolio with the aim of reducing overall charges for investors. The World Selection – Income Portfolio’s holdings are in any case not static and will change from time to time, which will incur the normal transactional costs.
For the World Selection – Cautious Portfolio, World Selection – Balanced Portfolio and World Selection – Dynamic Portfolio the strategy changes have resulted in reduced ongoing charges because the underlying investments the Portfolios now hold are lower in cost overall. The Portfolios incurred one-off transitional costs in moving to the new investment strategy, for example where it was necessary to sell some assets and buy others. These costs were reflected in the daily share prices for the Portfolios like most other fees.

100
Other Information
Equalisation
Revenue received by the Fund during the distribution period is reflected in the price of shares until the revenue is distributed. The cost of Group 2 shares bought during a distribution period will therefore include an element of revenue.
Equalisation represents the average amount of accrued revenue included in the purchase price of all Group 2 shares sold in the period, which is refunded as part of a shareholder’s first distribution. This amount is treated as a capital repayment for tax purposes. It is not liable to income or corporation tax and is deducted from the original cost of the shares for capital gains tax purposes.

101
All other Funds in this OEIC have a 100% franked distribution shown on their annual consolidated tax voucher.
Corporate Shareholders
A corporate shareholder will receive the distribution shown on their annual consolidated tax voucher as follows:
Fund Date Share class Investment income
payable/paid Franked Unfranked
Open Global Distribution Fund 15.12.14 Retail Income 67.85% 32.15%
15.12.14 Retail Accumulation 67.85% 32.15%
15.12.14 Income C 58.27% 41.73%
15.12.14 Accumulation C 58.45% 41.55%
15.09.14 Retail Income 65.52% 34.48%
15.09.14 Retail Accumulation 65.49% 34.51%
15.09.14 Income C 57.95% 42.05%
15.09.14 Accumulation C 58.41% 41.59%
Open Global Property Fund 15.12.14 Retail Income 90.60% 9.40%
15.12.14 Retail Accumulation 90.11% 9.89%
15.12.14 Institutional A Income 65.41% 34.59%
15.12.14 Income C 66.23% 33.77%
15.12.14 Accumulation C 60.51% 39.49%
Open Global Return Fund 15.12.14 Retail Income 100.00% 0.00%
15.12.14 Retail Accumulation 100.00% 0.00%
15.12.14 Income C 56.25% 43.75%
15.12.14 Accumulation C 56.47% 43.53%
World Selection 15.12.14 Retail Income 78.48% 21.52%
- Cautious Portfolio 15.12.14 Retail Accumulation 78.16% 21.84%
15.12.14 Institutional Accumulation 32.36% 67.64%
15.12.14 Income C 47.51% 52.49%
15.12.14 Accumulation C 47.65% 52.35%
World Selection 15.12.14 Retail Income 0.00% 100.00%
- Income Portfolio 15.12.14 Retail Accumulation 0.00% 100.00%
15.12.14 Income C 0.00% 100.00%
15.12.14 Accumulation C 0.00% 100.00%
15.09.14 Retail Income 0.00% 100.00%
15.09.14 Retail Accumulation 0.00% 100.00%
15.09.14 Income C 0.00% 100.00%
15.09.14 Accumulation C 0.00% 100.00%
World Index Balanced Portfolio 15.12.14 Retail Income 89.36% 10.64%
15.12.14 Retail Accumulation 89.07% 10.93%
15.12.14 Institutional Accumulation 61.60% 38.40%
15.12.14 Retail X Income 74.13% 25.87%
15.12.14 Retail X Accumulation 74.33% 25.67%
15.12.14 Income C 65.85% 34.15%
15.12.14 Accumulation C 71.71% 28.29%
World Index Cautious Portfolio 15.12.14 Retail Income 51.28% 48.72%
15.12.14 Retail Accumulation 51.29% 48.71%
15.12.14 Institutional Accumulation 30.88% 69.12%
15.12.14 Retail X Income 39.53% 60.47%
15.12.14 Retail X Accumulation 40.19% 59.81%
15.12.14 Income C 33.88% 66.12%
15.12.14 Accumulation C 33.90% 66.10%

102
Risk and Reward Profile
Fund Rating*
Open Global Distribution Fund 4
Open Global Property Fund 5
Open Global Return Fund 4
World Selection - Balanced Portfolio 4
World Selection - Cautious Portfolio 3
World Selection - Dynamic Portfolio 5
World Selection - Income Portfolio 3
World Index Balanced Portfolio 4
World Index Cautious Portfolio 3
World Index Dynamic Portfolio 4†
Lower risk
Typically lower rewards
Higher risk
Typically higher rewards
1 2 3 4 5 6 7
†The previous risk rating for this Fund was 5 up until 3 October 2014.
*More About this Rating
The rating is based on price volatility over the last five years, and is an indicator of absolute risk. Historical data may not be a reliable indication for the future. The rating is not guaranteed to remain unchanged and the categorisation may shift over time. The lowest rating does not mean a risk-free investment.
For further information on the specific risks applicable to each Fund please visit: www.assetmanagement.hsbc.com/uk.

103
Directory
The Company
HSBC OpenFunds, 78 St James’s Street, London SW1A 1EJ
Authorised Corporate Director (ACD) and Head Office
HSBC Global Asset Management (UK) Limited, 78 St. James’s Street, London SW1A 1EJ
Investment Manager
HSBC Global Asset Management (UK) Limited, 78 St. James’s Street, London SW1A 1EJ
Depositary
State Street Trustees Limited, 525 Ferry Road, Edinburgh EH5 2AW
Regulator
Financial Conduct Authority (FCA), 25 North Colonade, Canary Wharf, London E14 5HS
Auditor
KPMG LLP, 15 Canada Square, London E14 5GL
Legal Advisers
Stephenson Harwood LLP, 1 Finsbury Circus, London EC2M 7SH
Registrar (delegated to HSBC Bank plc)
HSBC Global Asset Management (UK) Limited, Frobisher House, Nelson Gate, Commercial Road, Southampton SO15 9DF
Telephone: 0800 181 890 (Professional Advisers)* 0800 289 505 (Direct Investors)* 0345 745 6123 (Investors)* 0345 766 0391 (Textphone) +44 238 024 4095 (Investors Overseas)* +44 238 072 3029 (Overseas Textphone)
Administrator (delegated to HSBC Bank plc) - postal address
PO Box 6189, Coventry CV3 9HS
Website
www.assetmanagement.hsbc.com/uk
To help us continually improve our services, and in the interests of security, we may monitor and/or record your communications with us.
*Lines are open 8am to 6pm Monday to Friday (excluding public holidays).

104
Name of OEIC Fund
Open Global Distribution
Fund
Open Global Property
Fund
Open Global ReturnFund
World Selection - Balanced Portfolio
World Selection - Cautious Portfolio
Number of distributions per year
4 2 2 2 2
Distribution dates
15 Jun15 Sep15 Dec15 Mar
15 Jun15 Dec
15 Jun15 Dec
15 Jun15 Dec
15 Jun15 Dec
Lump sum minimum investment level
£1,000 £1,000 £1,000 £1,000 £1,000
Regular saverminimuminvestment level
£50 £50 £50 £50 £50
Authorised Corporate Director periodic charge % †
1.25 1.25 1.25 1.25 1.25
Available as an ISA
Yes Yes Yes Yes Yes
In ISA can income be paid
Yes Yes Yes Yes Yes
Income shares available
Yes Yes Yes Yes Yes
Accumulation shares available
Yes Yes Yes Yes Yes
Historic research of files*
£25 per hour including VAT - all Funds
Duplicate tax voucher*
£5 per voucher including VAT - all Funds
Duplicate tax vouchers* (more than one)
£25 per voucher including VAT - all Funds
European Savings Directive in scope for distributions/ redemptions
N/A N/A N/A N/A N/A
* Charges for additional services. The ACD reserves the right to apply these charges and amend them subject to the annual rate of the retail price index.† The above information relates only to retail share classes. Other share classes may differ.
Quick Reference Guide to HSBC OpenFunds

105
Name of OEIC Fund
World Selection - Dynamic Portfolio
World Selection -
Income Portfolio
World Index
Balanced Portfolio
World Index
Cautious Portfolio
World Index
DynamicPortfolio
Number of distributions per year
2 4 2 2 2
Distribution dates
15 Jun15 Dec
15 Jun 15 Sep 15 Dec 15 Mar
15 Jun 15 Dec
15 Jun 15 Dec
15 Jun15 Dec
Lump sum minimum investment level
£1,000 £1,000 £1,000 £1,000 £1,000
Regular saverminimuminvestment level
£50 £50 £50 £50 £50
Authorised Corporate Director periodic charge % †
1.25 1.25 0.95 0.95 0.95
Available as an ISA
Yes Yes Yes Yes Yes
In ISA can income be paid
Yes Yes Yes Yes Yes
Income shares available
Yes Yes Yes Yes Yes
Accumulation shares available
Yes Yes Yes Yes Yes
Historic research of files*
£25 per hour including VAT - all Funds
Duplicate tax voucher*
£5 per voucher including VAT - all Funds
Duplicate tax vouchers* (more than one)
£25 per voucher including VAT - all Funds
European Savings Directive in scope for distributions/ redemptions
N/A N/A N/A N/A N/A
* Charges for additional services. The ACD reserves the right to apply these charges and amend them subject to the annual rate of the retail price index.† The above information relates only to retail share classes. Other share classes may differ.
Quick Reference Guide to HSBC OpenFunds

Issued by HSBC Global Asset Management (UK) Limited. Authorised and regulated by the Financial Conduct Authority.
A member of the HSBC Group, one of the world’s largest banking and financial services organisations with around 6,200 offices in 74 countries and territories.
www.assetmanagement.hsbc.com/uk
HSBC Global Asset Management (UK) Limited Frobisher House Nelson Gate Commercial Road Southampton SO15 9DF United Kingdom
FP14-1885 November 2014. Printed by The Partnership. © HSBC Global Asset Management (UK) Limited 2014. All rights reserved. MP/216