hst q3 2021 investor presentation - host hotels
TRANSCRIPT

ANDAZ MAUI AT WAILEA RESORT
Investor PresentationFEBRUARY 2022
2
This investor presentation, and the related discussion, contains forward-looking statements. These include statements about Host Hotels & Resorts’ plans, strategies, financial performance, prospects or future events. Forward-looking statements are not guarantees of future performance. They involve known and unknown risks, uncertainties and assumptions and many of the factors that will determine these items are beyond our ability to control or predict. Consequently, our future results, financial condition and business may differ materially from those expressed in these forward-looking statements. You can find many of these statements by looking or listening for words such as “approximates,” “believes,” “expects,” “anticipates,” “intends,” “plans,” “would,” “may” or similar expressions in these slides or in the related discussion. Factors that may cause actual results to differ materially from those contemplated by the forward-looking statements include, but are not limited to, (i) the duration and scope of the COVID-19 pandemic and its short and longer-term impact on the demand for travel, transient and group business, and levels of consumer confidence; actions governments, businesses and individuals take in response to the pandemic, including limiting or banning travel or the size of gatherings; the impact of the pandemic, and actions taken in response to the pandemic, on global and regional economies, travel, and economic activity, including the duration and magnitude of its impact on unemployment rates, business investment and consumer discretionary spending; the pace of recovery when the COVID-19 pandemic subsides; general economic uncertainty in U.S. markets where we own hotels and a worsening of economic conditions or low levels of economic growth in these markets; the effects of steps we and our hotel managers take to reduce operating costs in response to the COVID-19 pandemic; (ii) other changes in national and local economic and business conditions and other factors such as natural disasters and weather that will affect occupancy rates at our hotels and the demand for hotel products and services (iii) operating risks associated with the hotel business, including the effect of increasing labor cost; (iv) risks associated with our ability to complete acquisitions and dispositions and develop new properties and the risks that acquisitions and new developments may not perform in accordance with our expectations; (v) our ability to maintain our properties in a first-class manner, including meeting capital expenditures requirements, and the effect of renovations, including temporary closures, on our hotel occupancy and financial results; (vii) our ability to compete effectively in areas such as access, location, quality of accommodations and room rate structures; (viii) risks associated with entering into joint ventures, including the potential for disputes with our partners and the risk that the joint ventures may not perform in accordance with expectations; and (ix) those factors set forth in our Annual Report on Form 10-K for the year ended December 31, 2020 under the heading “Risk Factors,” which is available on our website: www.hosthotels.com. Although the Company believes the expectations reflected in such forward-looking statements are based upon reasonable assumptions, it can give no assurance that the expectations will be attained or that any deviation will not be material. All information in this presentation is as of the respective dates provided and the Company undertakes no obligation to update any forward-looking statement to conform the statement to actual results or to changes in the Company’s expectations.
This presentation is not an offer to sell or a solicitation of an offer to buy any securities of the Company.
Use of Non-GAAP Financial Measures:
This investor presentation, and the related discussion, also contain certain non-GAAP financial measures, which should be considered only as supplemental to, and not as superior to, financial measures prepared in accordance with generally accepted accounting principles (“GAAP”). Please refer to the Reconciliations & Supplemental Information section of this presentation for a reconciliation of these non-GAAP financial measures to the most directly comparable financial measures prepared in accordance with GAAP and definitions and calculation methodologies used for other defined terms used in this presentation.
Trademarks:
The brands and logos used in this presentation are the trademarks of our managers or their affiliates. The trademarked names and their logos are the property of their respective owners and are being used with the express permission of their owners. None of the owners of these trademarks has any responsibility or liability for any information contained in this presentation.
Forward-Looking Statements
2022 Host Hotels & Resorts, Inc.
TABLE OF CONTENTS4 COMPANY OVERVIEW
12 RECENT PROGRESS
24 PORTFOLIO UPDATE
30 GROWTH OPPORTUNITIES
34 CORPORATE RESPONSIBILITY
41 RECONCILIATIONS & SUPPLEMENTAL INFORMATION
FOUR SEASONS RESORT ORLANDO AT WALT DISNEY WORLD® RESORT
COMPANY OVERVIEW
RECENTPROGRESS
PORTFOLIO UPDATE
GROWTH OPPORTUNITIES
CORPORATE RESPONSIBILITY
RECONCILIATIONS & SUPPLEMENTAL INFO

Company Overview
ALILA VENTANA BIG SUR
COMPANY OVERVIEW
RECENTPROGRESS
PORTFOLIO UPDATE
GROWTH OPPORTUNITIES
CORPORATE RESPONSIBILITY
RECONCILIATIONS & SUPPLEMENTAL INFO

5
$269MILLION
$242MILLION
$1.8BILLION
$68MILLION
+13%RevPAR
70HOTELS
Key Highlights – Q4 2021
of pro forma Hotel EBITDA(1)
of Adjusted EBITDAre(1) of total available liquidity, including approximately $144 million of FF&E reserves and $1.5 billion available under the credit facility revolver(2)
amount that Adjusted EBITDAre exceeded
interest expense and capital expenditures(1)
Q4 2021 pro forma RevPAR compared to Q3 2021
achieved positive hotel-level operating profit in Q4 2021
Includes: • SF Marriott Marquis• Three NYC hotels• Two downtown Boston hotels
1) In Q4 2021, net income was $323 million, interest expense was $40 million excluding $23 million of refinancing costs, and capital expenditures totaled $134 million. See Reconciliations & Supplemental Information for reconciliation of comparable GAAP measures.
2) As of February 16, 2022.
2022 Host Hotels & Resorts, Inc.
COMPANY OVERVIEW
RECENTPROGRESS
PORTFOLIO UPDATE
GROWTH OPPORTUNITIES
CORPORATE RESPONSIBILITY
RECONCILIATIONS & SUPPLEMENTAL INFO
6
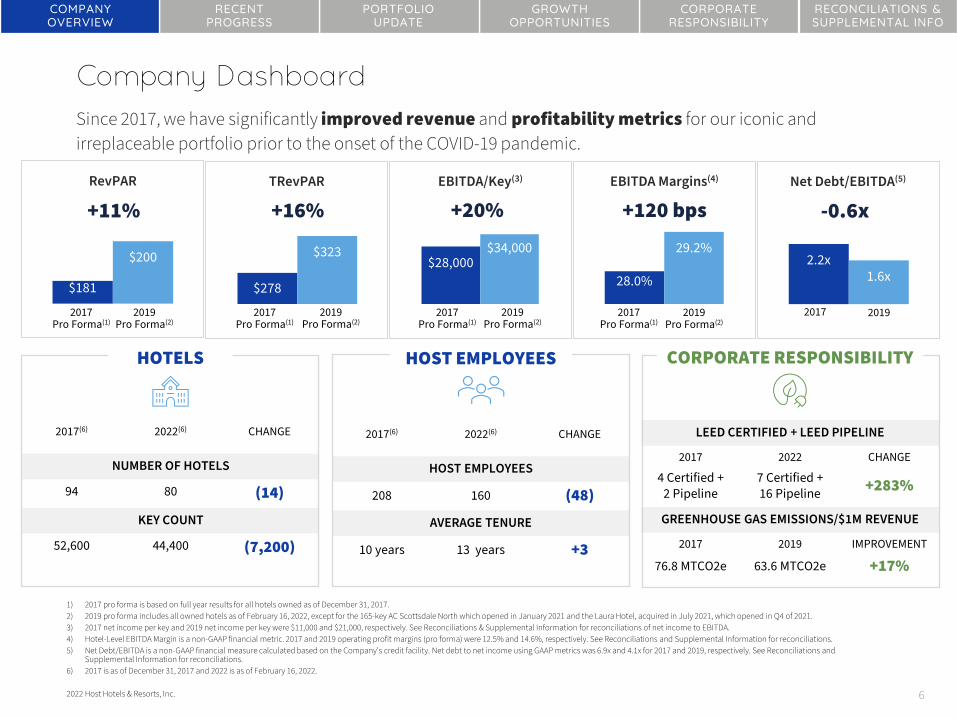
2017(6) 2022(6) CHANGE
NUMBER OF HOTELS
94 80 (14)
KEY COUNT
52,600 44,400 (7,200)
2017(6) 2022(6) CHANGE
HOST EMPLOYEES
208 160 (48)
AVERAGE TENURE
10 years 13 years +3
Company Dashboard
COMPANY OVERVIEW
RECENTPROGRESS
PORTFOLIO UPDATE
GROWTH OPPORTUNITIES
CORPORATE RESPONSIBILITY
RECONCILIATIONS & SUPPLEMENTAL INFO
Since 2017, we have significantly improved revenue and profitability metrics for our iconic and irreplaceable portfolio prior to the onset of the COVID-19 pandemic.
$181
$200
RevPAR
$278
$323
TRevPAR
$28,000 $34,000
EBITDA/Key(3)
28.0%
29.2%
EBITDA Margins(4)
2.2x1.6x
Net Debt/EBITDA(5)
+11% +16% +20% +120 bps -0.6x
HOTELS HOST EMPLOYEES
LEED CERTIFIED + LEED PIPELINE
2017 2022 CHANGE
4 Certified + 2 Pipeline
7 Certified + 16 Pipeline +283%
GREENHOUSE GAS EMISSIONS/$1M REVENUE
2017 2019 IMPROVEMENT
76.8 MTCO2e 63.6 MTCO2e +17%
CORPORATE RESPONSIBILITY
2019 Pro Forma(2)
2019 Pro Forma(2)
2019 Pro Forma(2)
2019 Pro Forma(2)
2017 2019
1) 2017 pro forma is based on full year results for all hotels owned as of December 31, 2017.2) 2019 pro forma includes all owned hotels as of February 16, 2022, except for the 165-key AC Scottsdale North which opened in January 2021 and the Laura Hotel, acquired in July 2021, which opened in Q4 of 2021. 3) 2017 net income per key and 2019 net income per key were $11,000 and $21,000, respectively. See Reconciliations & Supplemental Information for reconciliations of net income to EBITDA.4) Hotel-Level EBITDA Margin is a non-GAAP financial metric. 2017 and 2019 operating profit margins (pro forma) were 12.5% and 14.6%, respectively. See Reconciliations and Supplemental Information for reconciliations.5) Net Debt/EBITDA is a non-GAAP financial measure calculated based on the Company's credit facility. Net debt to net income using GAAP metrics was 6.9x and 4.1x for 2017 and 2019, respectively. See Reconciliations and
Supplemental Information for reconciliations.6) 2017 is as of December 31, 2017 and 2022 is as of February 16, 2022.
2022 Host Hotels & Resorts, Inc.
2017 Pro Forma(1)
2017 Pro Forma(1)
2017 Pro Forma(1)
2017 Pro Forma(1)

7
-93.1%
-82.9%
-77.7%
-65.4%
-49.1%
-29.9%
-23.9%
Q2 '20
Q3 '20
Q4 '20
Q1 '21
Q2 '21
Q3 '21
Q4 '21
ANNUAL ASSUMPTIONS:
2022 Outlook
OPERATIONAL OUTLOOK:Subject to impacts from known and future COVID variants
► We expect sequential quarterly RevPAR improvements driven by demand growth across our portfolio and continued rate strength at our resorts
► We expect a continued ramp-up in business transient and group business alongside sustained strength in leisure
RevPAR Change vs. 2019(1)
COMPANY OVERVIEW
RECENTPROGRESS
PORTFOLIO UPDATE
GROWTH OPPORTUNITIES
CORPORATE RESPONSIBILITY
RECONCILIATIONS & SUPPLEMENTAL INFO
1) Results are for all owned hotels on a pro forma basis for acquisitions/dispositions through February 16, 2022. The AC Hotel Scottsdale North is a new development hotel that opened in January 2021 and The Laura Hotel in Houston re-opened under new management in November 2021. Therefore, no adjustments were made for results of those hotels for periods prior to their openings. See Reconciliations & Supplemental Information for further explanation of pro forma adjustments.
2022 Host Hotels & Resorts, Inc.
Corporate & Other Expenses$103 - $106 million
Interest Expense$146 - $149 million
Capital Expenditures$500 - $600 million
%

8
Investment Thesis
Accretive capital recycling since current management team began transitioning the portfolio in 2017.
EBITDA Multiples(1)
Targeting $267 - $342 million of incremental future stabilized EBITDA on a 2019 base of $1.4 billion (as adjusted for dispositions) through three strategic objectives and acquisitions (see slides 10 and 31 for more detail).
$267 - $342Mtargeted incremental future stabilized EBITDA(2)
on a 2019 base of
COMPANY OVERVIEW
RECENTPROGRESS
PORTFOLIO UPDATE
GROWTH OPPORTUNITIES
CORPORATE RESPONSIBILITY
RECONCILIATIONS & SUPPLEMENTAL INFO
$1.4B
DISPOSITIONS ACQUISITIONS
2018
–20
22 Y
TD
$4.5B @ 17x $3.2B @ 14x
2021
–20
22 Y
TD
$981M @ 15.4x $1.6B @ 13.0x
1) Disposition multiples are calculated as the ratio between the sales price (plus avoided capital expenditures) and EBITDA on a TTM basis from the disposition date for 2018 – 2019 dispositions, while the 2020 – 2022 dispositions use 2019 full year results as the TTM are not representative of normalized operations. For 2018 – 2022 YTD dispositions, combined avoided capital expenditures over the 5 years following the disposition dates totaled $793 million. The disposition net income multiple is 28x. For 2021 – 2022 YTD dispositions, combined avoided capital expenditures over the 5 years following the disposition dates totaled $290 million. The 2021 – 2022 YTD disposition net income multiple is 24x. Acquisition multiples are based on 2019 operations except for Baker's Cay Resort Key Largo, which is based on 2021 forecast operations at acquisition, as the property was under renovation and closed for part of 2019; The Laura Hotel which is based on estimated normalized results that assume results are in-line with the 2019 results of comparable Houston properties, as the property was re-opened with a new manager and brand in 2021; the Alila Ventana Big Sur which is based on 2021 forecast operations at acquisition as the property was under renovation for part of 2019; and The Alida, Savannah, which adjusts for construction disruption to the surrounding Plant Riverside District and for initial ramp-up of hotel operations. Acquisition EBITDA includes an upward adjustment of $13 million to reflect normalized operations for both The Laura Hotel and The Alida, Savannah. The 2018 – 2022 YTD acquisition net income multiple is 23x. The 2021 – 2022 YTD acquisition net income multiple is 21x. See Reconciliations and Supplemental Information for reconciliations.
2) The 2019 base excludes operations for five hotels sold in October 2021, one hotel sold in December 2021, and one hotel sold in February 2022. These results are illustrative only and actual results are expected to vary from these targets. See footnotes on slides 10 and 31 for factors that may cause actual results to vary.
2022 Host Hotels & Resorts, Inc.
Capital Allocation Track Record EBITDA Growth Profile
THE DON CESAR

9
60%35%
5%
2019 ROOM REVENUE BREAKDOWN
Transient Group Contract-Based
Investment ThesisStrong Balance Sheet Size, Scale & Reputation► Only investment grade rating among lodging
REITs(1)
► $1.8 billion in total available liquidity as of February 16, 2022, including approximately $144 million of FF&E reserves and $1.5 billion available under credit facility
► Entered the pandemic at 1.6x leverage(2)
which allowed us to invest opportunistically in the portfolio during a period of reduced demand and deploy capital to acquire assets
Allows us to leverage multiple fronts:► Operational benchmarking and analytic
capability► Ability to source off-market transactions and
close with certainty
► Branded portfolio allows us to redefine the operating model and implement broad changes efficiently
Diverse PortfolioGeographic EBITDA diversification: no market accounts for more than 10% of 2019 pro forma hotel EBITDA(3)
COMPANY OVERVIEW
RECENTPROGRESS
PORTFOLIO UPDATE
GROWTH OPPORTUNITIES
CORPORATE RESPONSIBILITY
RECONCILIATIONS & SUPPLEMENTAL INFO
1) A securities rating is not a recommendation to buy, sell or hold securities and may be subject to revision or withdrawal at any time. Credit ratings are subject to change depending on financial and other factors.2) Host leverage ratio is calculated using Host's credit facility definition. Leverage ratio using GAAP metrics at December 31, 2019, was 4.1x. See Reconciliations and Supplemental Information for reconciliation of the credit facility
leverage to GAAP leverage ratio.3) No market accounts for more than 10% of 2019 hotel net income. See Reconciliations & Supplemental Information for reconciliations of net income to EBITDA.
2022 Host Hotels & Resorts, Inc.
NEW YORK MARRIOTT MARQUIS
10
REDEFINING THE OPERATING MODEL
SEEKING TO GAIN MARKET SHARE
ALLOCATING CAPITAL STRATEGICALLY
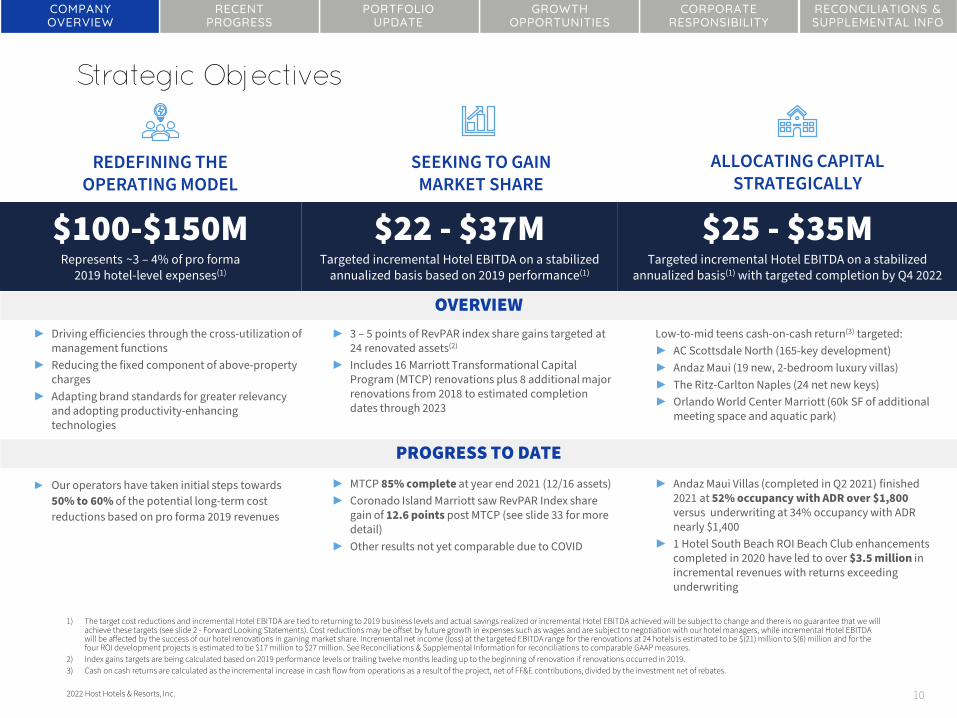
Strategic Objectives
1) The target cost reductions and incremental Hotel EBITDA are tied to returning to 2019 business levels and actual savings realized or incremental Hotel EBITDA achieved will be subject to change and there is no guarantee that we will achieve these targets (see slide 2 - Forward Looking Statements). Cost reductions may be offset by future growth in expenses such as wages and are subject to negotiation with our hotel managers, while incremental Hotel EBITDA will be affected by the success of our hotel renovations in gaining market share. Incremental net income (loss) at the targeted EBITDA range for the renovations at 24 hotels is estimated to be $(21) million to $(6) million and for the four ROI development projects is estimated to be $17 million to $27 million. See Reconciliations & Supplemental Information for reconciliations to comparable GAAP measures.
2) Index gains targets are being calculated based on 2019 performance levels or trailing twelve months leading up to the beginning of renovation if renovations occurred in 2019. 3) Cash on cash returns are calculated as the incremental increase in cash flow from operations as a result of the project, net of FF&E contributions, divided by the investment net of rebates.
2022 Host Hotels & Resorts, Inc.
$100-$150MRepresents ~3 – 4% of pro forma
2019 hotel-level expenses(1)
$22 - $37M Targeted incremental Hotel EBITDA on a stabilized
annualized basis based on 2019 performance(1)
$25 - $35MTargeted incremental Hotel EBITDA on a stabilized
annualized basis(1) with targeted completion by Q4 2022
► Driving efficiencies through the cross-utilization of management functions
► Reducing the fixed component of above-property charges
► Adapting brand standards for greater relevancy and adopting productivity-enhancing technologies
► 3 – 5 points of RevPAR index share gains targeted at 24 renovated assets(2)
► Includes 16 Marriott Transformational Capital Program (MTCP) renovations plus 8 additional major renovations from 2018 to estimated completion dates through 2023
Low-to-mid teens cash-on-cash return(3) targeted:► AC Scottsdale North (165-key development)► Andaz Maui (19 new, 2-bedroom luxury villas)► The Ritz-Carlton Naples (24 net new keys)► Orlando World Center Marriott (60k SF of additional
meeting space and aquatic park)
OVERVIEW
PROGRESS TO DATE
COMPANY OVERVIEW
RECENTPROGRESS
PORTFOLIO UPDATE
GROWTH OPPORTUNITIES
CORPORATE RESPONSIBILITY
RECONCILIATIONS & SUPPLEMENTAL INFO
► Our operators have taken initial steps towards 50% to 60% of the potential long-term cost reductions based on pro forma 2019 revenues
► MTCP 85% complete at year end 2021 (12/16 assets)► Coronado Island Marriott saw RevPAR Index share
gain of 12.6 points post MTCP (see slide 33 for more detail)
► Other results not yet comparable due to COVID
► Andaz Maui Villas (completed in Q2 2021) finished 2021 at 52% occupancy with ADR over $1,800versus underwriting at 34% occupancy with ADR nearly $1,400
► 1 Hotel South Beach ROI Beach Club enhancements completed in 2020 have led to over $3.5 million in incremental revenues with returns exceeding underwriting

11
$500 $400$650 $750
$450
$5
$90
2022 2023 2024 2025 2026 2027 2028 2029 2030 2031
Senior Notes Term Loan Revolver Mortgage and Other Debt
$500$500
Strong credit profile and investment grade balance sheet provides flexibility and optionality.
Balance Sheet
1) A securities rating is not a recommendation to buy, sell or hold securities and may be subject to revision or withdrawal at any time. Credit ratings are subject to change depending on financial and other factors.2) The Term Loan, due January 2024, can be extended up to one year by exercising extension options subject to certain conditions, including payment of a fee. The $683 million Revolver balance at December 31, 2021 was repaid in full
on February 11, 2022.3) Mortgage and Other Debt excludes principal amortization of $2 million each year from 2022-2027 for the mortgage loan that matures in 2027.
2022 Host Hotels & Resorts, Inc.
$1.8BTotal availability liquidity as of February 16, 2022, including approximately $144 million of FF&E reserves and $1.5 billion
available under credit facility
TOTAL AVAILABLE LIQUIDITY INVESTMENT GRADE RATED(1)
99%of the consolidated portfolio is
unencumbered by debt
UNENCUMBERED
AGENCY RATING OUTLOOK
Moody’s Baa3 Negative
S&P BBB- Negative
Fitch BBB- Stable
Only investment grade rated lodging REIT
MATURITY SCHEDULE ($ in millions)(2)
$400
No material maturity until January 20245.5 years of weighted debt maturity3.4% weighted average interest rate
COMPANY OVERVIEW
RECENTPROGRESS
PORTFOLIO UPDATE
GROWTH OPPORTUNITIES
CORPORATE RESPONSIBILITY
RECONCILIATIONS & SUPPLEMENTAL INFO
(3)

Recent Progress
THE LAURA HOTEL
COMPANY OVERVIEW
RECENTPROGRESS
PORTFOLIO UPDATE
GROWTH OPPORTUNITIES
CORPORATE RESPONSIBILITY
RECONCILIATIONS & SUPPLEMENTAL INFO

13
Capital Allocation Update
COMPANY OVERVIEW
RECENTPROGRESS
PORTFOLIO UPDATE
GROWTH OPPORTUNITIES
CORPORATE RESPONSIBILITY
RECONCILIATIONS & SUPPLEMENTAL INFO
319-key, luxury lifestyle hotel located in Austin’s Rainey Street entertainment district; recently developed and opened in 2015
173-key fee simple boutique hotel located in Savannah’s Historic District; recently developed and opened in October 2018
Hotel Van Zandt AcquisitionThe Alida, Savannah Acquisition
$103 | 12.1x2019 EBITDA(1)
(NORMALIZED ESTIMATE)MILLION
$242 | 13.2x2019 EBITDA(1)MILLION
1) Consistent with industry standard, we calculate the EBITDA multiple as the ratio of the purchase price (plus avoided capital expenditures for dispositions) to the property’s EBITDA. EBITDA is a non-GAAP measure. For The Alida, Savannah, the comparable GAAP metric using normalized net income is the ratio of the purchase price to 2019 net income of 20x, which includes an upward adjustment of $8 million in estimated net income to adjust for construction disruption to the surrounding Plant Riverside District and for initial ramp-up of hotel operations. For Hotel Van Zandt, the comparable GAAP metric using 2019 net income is the ratio of the purchase price to net income of 22.4x. For the W Hollywood and Sheraton Boston, the comparable GAAP metric utilizing 2019 net income is the ratio of the purchase price to net income of 142x and 18x, respectively. Avoided capital expenditures represent $33 million and $135 million of estimated spend requirements for the W Hollywood and Sheraton Boston, respectively, including escrow funding over the next 5 years. Reconciliation of net income to EBITDA is available at the end of this presentation.
2022 Host Hotels & Resorts, Inc.
Sheraton Boston
$197 25.0x2019 EBITDA(1)MILLION
W Hollywood
305(ground lease)
DISPOSITIONS
$233 14.2x2019 EBITDA(1)MILLIONKEYS
1,220KEYS

14
Acquisition: The Alida, Savannah
COMPANY OVERVIEW
RECENTPROGRESS
PORTFOLIO UPDATE
GROWTH OPPORTUNITIES
CORPORATE RESPONSIBILITY
RECONCILIATIONS & SUPPLEMENTAL INFO
RATIONALE
1) Consistent with industry practice, we calculate the EBITDA multiple as the ratio of the purchase price to the property’s EBITDA. EBITDA is a non-GAAP measure. For The Alida, Savannah, the comparable GAAP metric using net income is the ratio of the purchase price to 2019 net income of 20x, and the comparable GAAP metric using estimated stabilized net income is the ratio of the purchase price to net income of 18.2x. Stabilized EBITDA/net income multiple targets are illustrative only and actual results are expected to vary. See slide 2 for factors that may cause results to be materially different from these targets. Reconciliation of net income to EBITDA is available at the end of this presentation.
2) Source: STR, Inc. a CoStar company, Host Hotels & Resorts Enterprise Analytics, Strategic Insight; December 2021.
2022 Host Hotels & Resorts, Inc.
► Strong 2019 estimated normalized EBITDA multiple (12.1x) with targeted stabilized EBITDA multiple of 11x –12x in 2024 – 2025(1) (see slides 18 and 20)
► Newly constructed high-quality hotel opened in October 2018; no near-term capex expected
► Directly adjacent to demand drivers such as the historic district and the newly-opened Plant Riverside District
► Favorable operating cost environment
► New market for Host further diversifies portfolio
► Savannah’s 2014-2019 RevPAR CAGR was over 100 bps higher than the US(2)
► Drive-to leisure destination with fast-growing feeder markets
► Increasing airlift and convention center expansion

15
Hotel Overview Capex Requirements► 173-room boutique hotel located in
Savannah’s historic district (one block from the Savannah River)
► Rooms average 371 SF with high ceilings, hardwood floors, marble baths and built-in window seats
► Tribute Portfolio by Marriott► Fee-simple and unencumbered by debt
► New asset opened in October 2018► Minimal capex required in near term
Hotel Features► 11,570 SF of meeting space (5,170
indoor)► Four F&B outlets, gift shop, and street-
front retail space► Engaging social pool deck at the rooftop
pool
Acquisition: The Alida, Savannah
COMPANY OVERVIEW
RECENTPROGRESS
PORTFOLIO UPDATE
GROWTH OPPORTUNITIES
CORPORATE RESPONSIBILITY
RECONCILIATIONS & SUPPLEMENTAL INFO
1) The comparable GAAP metric utilizing 2024-2025 forecast stabilized net income for this hotel is $33,000 per key. Stabilized EBITDA/net income multiple targets are illustrative only and actual results are expected to vary. See slide 2 for factors that may cause results to be materially different from these targets. See Reconciliations and Supplemental Information for reconciliation of net income to EBITDA.
2022 Host Hotels & Resorts, Inc.
$242 | $443 | $52k Stabilized RevPAR Stabilized EBITDA/Key(1)Stabilized TRevPAR

16
Acquisition: Hotel Van Zandt
► Strong 2019 EBITDA multiple (13.2x) with targeted stabilized EBITDA multiple of 10x – 12x in 2025 – 2027(1)
(see slides 18 & 20)
► 2019 performance metrics rank in Host’s portfolio: EBITDA margin (4th), EBITDA per key (10th), RevPAR and TRevPAR (15th)
► New construction luxury lifestyle product opened in 2015
► Brand and management flexibility
► Additional F&B ROI opportunities not reflected in our underwriting have been identified
► Iconic and irreplaceable fee simple location in the Rainey Street district, the most popular entertainment district in downtown Austin
► Austin has been a major beneficiary of corporate and population relocation and benefits from recurring annual entertainment events
RATIONALE
1) Consistent with industry standard, we calculate the EBITDA multiple as the ratio of the purchase price to the property’s EBITDA. EBITDA is a non-GAAP measure. For Hotel Van Zandt, the comparable GAAP metric using 2019 net income is the ratio of the purchase price to net income of 22.4x. The comparable GAAP metric using estimated stabilized net income is 15.8x. Stabilized EBITDA/net income multiple targets are illustrative only and actual results are expected to vary. See slide 2 for factors that may cause results to be materially different from these targets. Reconciliation of net income to EBITDA is available at the end of this presentation.
2022 Host Hotels & Resorts, Inc.
COMPANY OVERVIEW
RECENTPROGRESS
PORTFOLIO UPDATE
GROWTH OPPORTUNITIES
CORPORATE RESPONSIBILITY
RECONCILIATIONS & SUPPLEMENTAL INFO

17
Acquisition: Hotel Van Zandt
$244 | $410 | $57k 2019 RevPAR 2019 EBITDA/Key(1)2019 TRevPAR
1) The comparable GAAP metric utilizing 2019 net income for this hotel is $34,000 per key. See Reconciliations and Supplemental Information for reconciliation of net income to EBITDA.
2022 Host Hotels & Resorts, Inc.
COMPANY OVERVIEW
RECENTPROGRESS
PORTFOLIO UPDATE
GROWTH OPPORTUNITIES
CORPORATE RESPONSIBILITY
RECONCILIATIONS & SUPPLEMENTAL INFO
Hotel Overview Capex Requirements► Fee simple in the heart of Austin’s
downtown Rainey Street main entertainment district
► 319 keys ranging from 330 to 1,100 SF► 52 suites► Developed as a luxury lifestyle property,
well aligned to Austin’s guest preferences
► Recently developed and opened in 2015► No significant near-term capex expected
Hotel Features► 13,000 SF indoor meeting space,
including 5,200 SF ballroom, 2,000 SF junior ballroom
► Rooftop pool with outdoor bar► F&B outlet with stage and nightly live
music & lobby coffee bar► Fitness center► Underground parking garage

18
$28,000 $34,000
2017 Pro Forma 2019 Pro Forma
EBITDA / Key(5)
$181 $200
2017 Pro Forma 2019 Pro Forma
RevPAR
Price(millions) Keys
EBITDA Multiple at
Acquisition(1)
EBITDA per Key(1)
Stabilized EBITDA
Multiple(1)
Stabilization Timeframe
Target
Off-Market?
Hyatt Regency Austin $161 448 8.8x $40,700 7x – 9x 2024-2025 Yes
Four Seasons Resort Orlando at Walt Disney World® Resort $610 444 16.8x $81,500 12x – 14x 2023-2025 Yes
Baker’s Cay Resort $200 200 14.5x $69,000 12x – 14x 2023-2025 Yes
The Laura Hotel $65 223 9.2x $31,400 7x – 9x 2024-2026 Yes
Alila Ventana Big Sur $150 59 9.3x $272,900 8x – 10x 2025-2027 Yes
The Alida, Savannah $103 173 12.1x $49,300 11x – 12x 2024-2025 No
Hotel Van Zandt $242 319 13.2 $57,200 10x – 12x 2025-2027 No
2021 Rollup $1,559(2) 1,866 13.0x $63,300 10x – 12x - -
2021 Hotel Acquisitions Summary
+11% +20%(4) (4)
1) We calculate the EBITDA multiple as the ratio of the purchase price to the property’s EBITDA and EBITDA per key as the ratio of the property’s EBITDA to number of rooms. EBITDA is a non-GAAP measure. The comparable GAAP measures are the ratio of the purchase price to the hotel’s net income and the ratio of the property’s net income to number of rooms. The comparable GAAP metrics using 2019 net income are as follows: Hyatt Regency Austin, 12x, 12x (stabilized) and $30,500 per key; The Four Seasons Resort Orlando at Walt Disney World® Resort, 32x, 18x (stabilized) and $43,500 per key; and Hotel Van Zandt, 22x, 16x (stabilized), and $34,000 per key. For other acquisitions, 2021 forecast EBITDA was used instead of 2019 EBITDA due to renovations (see Slide 8, footnote 1 for explanations). The comparable GAAP metrics utilizing 2021 forecast net income for these hotels are as follows: Baker’s Cay Resort Key Largo, 23x, 20x (stabilized) and $43,500 per key; and Alila Ventana Big Sur, 14x, 14x (stabilized) and $177,500 per key. For the Laura Hotel, the comparable GAAP metrics are 13x, 12x (stabilized) and $22,000 per key and for The Alida, Savannah, 20x, 18x (stabilized), and $29,500 per key in each case using estimated normalized 2019 net income (see Slide 8, footnote 1). Stabilized EBITDA/net income multiple targets are illustrative only and actual results are expected to vary from these targets; see Slide 19 for steps to be taken to achieve these stabilized results and Slide 2 for factors that may cause results to be materially different from these targets. See Reconciliations & Supplemental Information for reconciliations of net income to EBITDA..
2) Purchase price includes $28 million paid for two golf courses on Maui.3) 2017 pro forma results include operations for all owned hotels as of December 31, 2017.4) 2019 pro forma results include operations for all owned hotels as of February 16, 2022 except for the 165-key AC Scottsdale North which opened in January 2021 and the Laura Hotel, acquired in July 2021.5) 2017 net income per key and 2019 net income per key were $11,000 and $21,000, respectively. See Reconciliations & Supplemental Information for reconciliations of net income to EBITDA.
2022 Host Hotels & Resorts, Inc.
COMPANY OVERVIEW
RECENTPROGRESS
PORTFOLIO UPDATE
GROWTH OPPORTUNITIES
CORPORATE RESPONSIBILITY
RECONCILIATIONS & SUPPLEMENTAL INFO
(3) (3)

19
Stabilized EBITDA Multiple Details
We are targeting the stabilized EBITDA multiples presented on the prior slide by taking the following steps at each asset:
HYATT REGENCY AUSTIN
FOUR SEASONS RESORT ORLANDO AT WALT DISNEY
WORLD® RESORT
BAKER’S CAY
RESORT
THELAURA HOTEL
► Seek to increase revenue penetration through group, business transient and leisure
► Technology solutions which we believe will enhance operational efficiency and guest experience
► Collaboration with Hyatt to seek to enhance productivity and processes as recovery continues post Covid
► Reposition F&B offerings and increase breakout meeting space
► Elimination of third-party asset manager costs
► Membership enhancements and pricing opportunities
► Ancillary revenue opportunities for amenities
► Seek to improve ADR through rate-focused revenue management strategies
► Collaboration with Four Seasons to seek to enhance productivity and processes post Covid
► Seek to improve F&B spend by enhancing pool service and outlet offerings
► Technology solutions which we believe will enhance operational efficiencies and guest experience
► Target increased revenue penetration through group and leisure-transient as post Covid recovery continues
► Affiliate the asset with a soft brand
► Engage HEI as institutional third-party management company
► Lease vacant retail space
► Expand lobby bar to incorporate new outdoor patio
► Deploy technology solutions which we believe will enhance revenues, operational efficiency, and guest experience
2022 Host Hotels & Resorts, Inc.
COMPANY OVERVIEW
RECENTPROGRESS
PORTFOLIO UPDATE
GROWTH OPPORTUNITIES
CORPORATE RESPONSIBILITY
RECONCILIATIONS & SUPPLEMENTAL INFO

20
Stabilized EBITDA Multiple Details
We are targeting the stabilized EBITDA multiples presented on slide 18 by taking the following steps at each asset:
ALILA VENTANA BIG SUR THE ALIDA, SAVANNAH HOTEL VAN ZANDT
► Seek to close the ADR gap between Ventana and the neighboring Post Ranch Inn
► Seek to improve ancillary revenue for the spa and activities to comparable spend for ultra-luxury resorts
► Opening the Sur House restaurant to non-resort guests
► Seek to close the ADR index gap versus competitive set by targeting incremental demand generators
► Lease vacant retail space
► Enhance the F&B out experience, particularly at the pool and rooftop venue
► Deploy technology solutions which we believe will enhance revenues, operational efficiency, and guest experience
► Target increased revenue penetration as recovery continues by capitalizing on growing corporate demand
► Collaborate with operator to seek to enhance productivity post-Covid
► Seek to increase F&B spend by repositioning offerings
► Ancillary revenue opportunities for amenities
2022 Host Hotels & Resorts, Inc.
COMPANY OVERVIEW
RECENTPROGRESS
PORTFOLIO UPDATE
GROWTH OPPORTUNITIES
CORPORATE RESPONSIBILITY
RECONCILIATIONS & SUPPLEMENTAL INFO
21
MILLION$90.7
Initial investment from Host (49% interest in Noble’s fee-based
asset management business)
MILLION$7-10
Average expected annual earnings over the next three years(Host’s ownership interest)
MILLION$150
Host’s commitment to next Noble fund
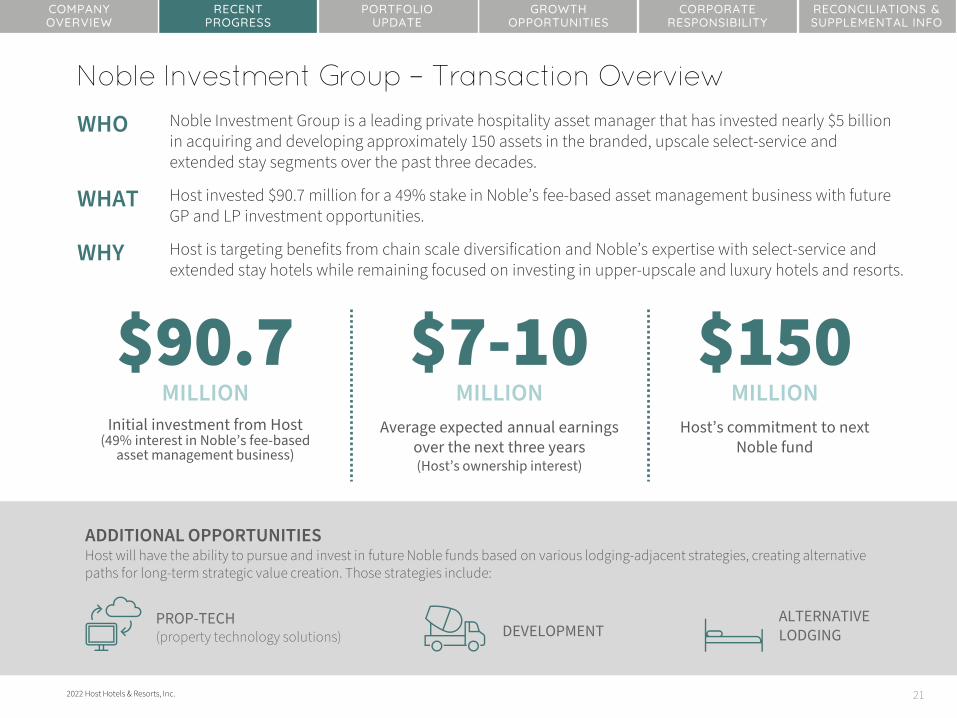
ADDITIONAL OPPORTUNITIESHost will have the ability to pursue and invest in future Noble funds based on various lodging-adjacent strategies, creating alternative paths for long-term strategic value creation. Those strategies include:
Noble Investment Group – Transaction Overview
2022 Host Hotels & Resorts, Inc.
PROP-TECH(property technology solutions) DEVELOPMENT
ALTERNATIVE LODGING
COMPANY OVERVIEW
RECENTPROGRESS
PORTFOLIO UPDATE
GROWTH OPPORTUNITIES
CORPORATE RESPONSIBILITY
RECONCILIATIONS & SUPPLEMENTAL INFO
WHO Noble Investment Group is a leading private hospitality asset manager that has invested nearly $5 billion in acquiring and developing approximately 150 assets in the branded, upscale select-service and extended stay segments over the past three decades.
WHAT Host invested $90.7 million for a 49% stake in Noble’s fee-based asset management business with future GP and LP investment opportunities.
WHY Host is targeting benefits from chain scale diversification and Noble’s expertise with select-service and extended stay hotels while remaining focused on investing in upper-upscale and luxury hotels and resorts.

22
Noble Investment Group – Overview
1993Founded in 1993 by Mit Shah,
who remains the current CEO, and senior team has been together for an average of
over 20 years
LEADERSHIP CONTINUITY
36 LPs► Noble has 36 limited partners with
nearly 100 investment positions► All Fund III investors participated in
Fund IV
INVESTOR STABILITY
90%+Investments made from
1993 – 2018 fully realized
CAPITAL ALLOCATION
84US markets across 143 properties
with over 24,000 keys
GEOGRAPHIC DIVERSIFICATION
A vertically-integrated hospitality specialist with a strong track record and three decades of expertisesourcing investment opportunities in real estate and capital markets.
COMPANY OVERVIEW
RECENTPROGRESS
PORTFOLIO UPDATE
GROWTH OPPORTUNITIES
CORPORATE RESPONSIBILITY
RECONCILIATIONS & SUPPLEMENTAL INFO
2022 Host Hotels & Resorts, Inc.

23
Host’s core strategy is investing in upper-upscale and luxury hotels. This joint venture represents another opportunity to elevate the EBITDA growth profile of our portfolio by allowing for investment in select service hotels, extended stay hotels, and new development opportunities.
We believe a fund vehicle is one of the best ways for Host to invest in these types of hotels and investments.
Noble Investment Group – Strategic Rationale
2022 Host Hotels & Resorts, Inc.
INVESTMENT OPPORTUNITIES
► Creates a new fee-driven income source from recurring management and development fees
► Opportunity to separately co-invest in funds as a limited partner
► Potential to generate outsized returns from GP participation
EXPAND CAPABILITIES
► Expands Host’s investment capabilities into select service, extended stay investments, and new development opportunities
► Allows Host to benefit from differentiated segments of the lodging industry
► Increases Host’s deal flow and knowledge base, including insight gained from Noble’s underwriting and pipeline monitoring
LEVERAGE EXPERTISE
► Host expects to be able to leverage Noble's deep operational heritage and expertise in fund management
► Noble expects to be able to utilize Host’s best-in-class business intelligence, data analytics, extensive relationships and investment sourcing opportunities as the largest lodging REIT
COMPANY OVERVIEW
RECENTPROGRESS
PORTFOLIO UPDATE
GROWTH OPPORTUNITIES
CORPORATE RESPONSIBILITY
RECONCILIATIONS & SUPPLEMENTAL INFO

COMPANY OVERVIEW
RECENTPROGRESS
PORTFOLIO UPDATE
GROWTH OPPORTUNITIES
CORPORATE RESPONSIBILITY
RECONCILIATIONS & SUPPLEMENTAL INFO
Portfolio Update
FOUR SEASONS RESORT ORLANDO AT WALT DISNEY WORLD© RESORT

25
$9 $13$22 $26
$34 $38 $43 $43 $45 $47
$66
$96 $101 $103
$119
$143$127 $128
$145 $143$159
$17 $21$37 $42
$54$61 $68 $72 $77 $76
$105
$148$157 $160
$180
$207$194
$205
$236 $234
$253
April'20
May June July Aug Sept Oct Nov Dec Jan '21 Feb March April May June July Aug Sept Oct Nov Dec
Grew RevPAR sequentially and reduced RevPAR declines compared to 2019 each quarter since the onset of the pandemic in Q2 2020.
Improved RevPAR from April ’20 lows
Total RevPAR and RevPAR April ’20 – December ’21(1):
Q4’20RevPAR (77.7%) YoYLeisure demand surged between Christmas & New Years Eve
Q3’20RevPAR (82.9%) YoYSteady sequential YoY improvement through SeptemberQ2’20
RevPAR (93.1%) YoYRevPAR bottomed in April at the height of nationwide lockdowns
Q1’21RevPAR (65.4%) vs. ‘19Vaccination rollouts and spring break led to leisure demand surging in sunbelt resort markets
Q2’21RevPAR (49.1%) vs. ‘19Leisure demand continued past the spring holidays alongside improvements in BT and group demand
COMPANY OVERVIEW
RECENTPROGRESS
PORTFOLIO UPDATE
GROWTH OPPORTUNITIES
CORPORATE RESPONSIBILITY
RECONCILIATIONS & SUPPLEMENTAL INFO
1) Results are for all owned hotels as of February 16, 2022 on a pro forma basis. See Reconciliations & Supplemental Information for further explanation of pro forma adjustments.
2022 Host Hotels & Resorts, Inc.
Q3’21RevPAR (29.9%) vs. ‘19Leisure, group, and BT demand all contributed to continued sequential RevPAR improvement despite Delta variant headwinds
TRevPAR
RevPAR
Q4’21RevPAR (23.9%) vs. ‘19The lodging recovery momentum continued after recent COVID variants

26
-91% -89% -87% -84% -76% -74% -73% -73% -74% -71% -64% -56% -52% -47% -40%-29% -32% -29% -29% -25% -21%
-52%-40%
-22% -19% -22% -25% -26%-17%
-5% -10% -8% -3% -5% -6% -5%
3% 3%
-7% -6%
1%11%
April'20
May June July Aug Sept Oct Nov Dec Jan '21 Feb March April May June July Aug Sept Oct Nov Dec
Occupancy vs. 2019 ADR vs. 2019
4.8%9.7%
13.4%21.4% 21.7%
16.5%
25.2%29.5%
44.3% 45.1%
55.0% 52.9%60.1%
50.7%
63.6%56.2%
37.4%
41.5%
4-Ap
r-20
18-A
pr-2
0
2-M
ay-2
0
16-M
ay-2
0
30-M
ay-2
0
13-Ju
n-20
27-Ju
n-20
11-Ju
l-20
25-Ju
l-20
8-Au
g-20
22-A
ug-2
0
5-Se
p-20
19-S
ep-2
0
3-O
ct-2
0
17-O
ct-2
0
31-O
ct-2
0
14-N
ov-2
0
28-N
ov-2
0
12-D
ec-2
0
26-D
ec-2
0
9-Ja
n-21
23-Ja
n-21
6-Fe
b-21
20-F
eb-2
1
6-M
ar-2
1
20-M
ar-2
1
3-Ap
r-21
17-A
pr-2
1
1-M
ay-2
1
15-M
ay-2
1
29-M
ay-2
1
12-Ju
n-21
26-Ju
n-21
10-Ju
l-21
24-Ju
l-21
7-Au
g-21
21-A
ug-2
1
4-Se
p-21
18-S
ep-2
1
2-O
ct-2
1
16-O
ct-2
1
30-O
ct-2
1
13-N
ov-2
1
27-N
ov-2
1
11-D
ec-2
1
25-D
ec-2
1
8-Ja
n-22
22-Ja
n-22
While both occupancy and ADR have improved, ADR has staged a faster recovery, driven by leisure demand our hotels and resorts in the sunbelt and Hawaii.
Improved ADR and Occupancy
1) Results are for all owned hotels as of February 16, 2022 on a pro forma basis . See Reconciliations & Supplemental Information for further explanation of pro forma adjustments.2) Source: STR, Inc. a CoStar company. Host Hotels & Resorts Enterprise Analytics, Revenue Management, February 2022. Includes owned hotels as of February 16, 2022 on a pro forma basis except for Hotel Van Zandt which is only
included from October 2021.
2022 Host Hotels & Resorts, Inc.
Weekly Occupancy for All Owned Hotels APRIL 4, 2020 – JANUARY 29, 2022(2)
Host ADR & Occupancy vs. 2019 APRIL ’20 – DECEMBER ’21(1)
COMPANY OVERVIEW
RECENTPROGRESS
PORTFOLIO UPDATE
GROWTH OPPORTUNITIES
CORPORATE RESPONSIBILITY
RECONCILIATIONS & SUPPLEMENTAL INFO

27
-37.5%-46.0% -47.1% -41.4%
-32.0%-19.3% -19.0%
-94.3%-85.5% -81.6%
-74.2%-58.8%
-40.4%-30.0%
-72.5% -67.9% -65.4% -58.7%-45.9%
-30.0%-24.0%
Fixed Expenses % Change Variable Expenses % Change Total Hotel Operating Expenses % Change
We have worked with our operators to aggressively limit costs and evolve the operating model to adjust for the business environment.
Minimized Operating Expense Growth
Pro forma hotel operating expense declines versus 2019(1):
MARGIN IMPROVEMENTS:Q4 2021 Hotel EBITDA margin was only 80 bps below that of Q4 2019 and improved 370 bps sequentially compared to Q3 2021(3).
26.9%Q4 2021
Hotel EBITDA Margin(3)
Q2 ’20-92.6%
Pro Forma Total Revenues YoY(2)
Q3 ’20-83.7%
Pro Forma Total Revenues YoY(2)
Q4 ’20-79.7%
Pro Forma Total Revenues YoY(2)
Q1 ’21-69.5%
Pro Forma Total Revenues vs. 2019(2)
Q2 ’21-54.2%
Pro Forma Total Revenues vs. 2019(2)
COMPANY OVERVIEW
RECENTPROGRESS
PORTFOLIO UPDATE
GROWTH OPPORTUNITIES
CORPORATE RESPONSIBILITY
RECONCILIATIONS & SUPPLEMENTAL INFO
Q3 ’21-32.0%
Pro Forma Total Revenues vs. 2019(2)
1) Pro forma hotel operating expenses include the employee retention credit recorded by the Company’s operators and exclude the severance expense recorded in the second half of 2020. Year-over-Year GAAP total hotel operating expenses were -62.1%, -54.1%, and -53.9%, in the second, third, and fourth quarters of 2020 respectively and -51.9%, -40.4%, -16.5%, and -21.3% in the first, second, third, and fourth quarters of 2021, respectively, compared to 2019. Q2-Q4 2020 includes all hotels owned as of December 31, 2020. Q1 2021 includes all hotels owned as of March 31, 2021. Q2 2021 includes all hotels owned as of June 30, 2021. Q3 2021 includes all hotels owned as of September 30, 2021, except for the Laura Hotel, acquired in July 2021, which was closed for the entirety of the quarter. Q4 2021 includes all hotels owned as of December 31, 2021. See Reconciliations & Supplemental Information for reconciliations to the comparable GAAP metrics and explanations of pro forma adjustments.
2) Year-over-Year GAAP total revenues were -93.1%, -84.3%, and -80.0% in in the second, third, and fourth quarters of 2020, respectively, and -71.3%, -56.2%, -33.1%, and -25.2% in the first, second, third, and fourth quarters of 2021, respectively, compared to 2019. See Reconciliations & Supplemental Information for reconciliations to the comparable GAAP metrics and explanations of pro forma adjustments.
3) Hotel-Level EBITDA Margin is a non-GAAP financial metric. Q4 2019, Q3 2021, and Q4 2021 operating profit margins were 12.4%, -11.3%, and 7.9%, respectively. See Reconciliations and Supplemental Information for reconciliations.
2022 Host Hotels & Resorts, Inc.
Q4 ’21-25.0%
Pro Forma Total Revenues vs. 2019(2)

28
Green Shoots for Group Business
1) Group room nights booked are subject to cancellation, as has occurred during the pandemic, and there can be no assurances as to the actual group room nights achieved in future periods. See slide 2 (Forward Looking Statements) for factors that may affect lodging demand.
2) Compared to November 3, 2021 estimate and adjusted for subsequent acquisitions and dispositions through February 16, 2022.3) Group room nights adjusted for portfolio owned as of February 16, 2022.4) As of February 16, 2022.
2022 Host Hotels & Resorts, Inc.
Q4 2021 Highlights
Group business continued to show meaningful sequential improvements(1)
+15%+35%
Sequential increase in group rooms sold from Q3 to Q4 2021, totaling 660,000 group room nights
Sequential increase in group room revenue from Q3 to Q4 2021, including a 17% sequential rate improvement and a 11% increase in corporate group room nights sold
2021 2022
Maintained 1.2 million group room nights in 2H 2021(2) due to strong in-the-quarter bookings
60%Q4 2021 group demand represents 60% of Q4 2019 levels, up sequentially from 52% in Q3
2.8M
Group rate 1% higher than same-time 2019(4)
COMPANY OVERVIEW
RECENTPROGRESS
PORTFOLIO UPDATE
GROWTH OPPORTUNITIES
CORPORATE RESPONSIBILITY
RECONCILIATIONS & SUPPLEMENTAL INFO
+84% Sequential increase in banquet and catering revenue from Q3 to Q4 2021
Definite group room nights on the books in 2022 up from 2.5 million in Q3 2021(3)
► 11% sequential increase over Q3 2021► 60% of 2019 actual group room nights

29
Strengthening Transient Demand
+7%Sequential increase in transient ADR at our urban hotels compared to Q3 2021, with rooms sold also up 1%
URBAN MARKETS
COMPANY OVERVIEW
RECENTPROGRESS
PORTFOLIO UPDATE
GROWTH OPPORTUNITIES
CORPORATE RESPONSIBILITY
RECONCILIATIONS & SUPPLEMENTAL INFO
2022 Host Hotels & Resorts, Inc.
+9%Sequential increase in transient ADR compared to Q3 2021
Transient rooms sold in Q4 2021 were 82% of 2019 levels, an increase from:► 77% in Q3 2021► 58% in 1H 2021
Sequential Business Transient ADR increase compared to Q3 2021, with rooms sold up 5%
70% of Business Transient rooms sold were from traditional top-10 accounts including financial, government, and consulting companies
+20%
SUNBELT AND HAWAII
OVERALL TRANSIENT BUSINESS TRANSIENT
+12%Sequential transient ADR increase compared to Q3 2021 driven by 35% ADR increase at our resorts over Q4 2019

COMPANY OVERVIEW
RECENTPROGRESS
PORTFOLIO UPDATE
GROWTH OPPORTUNITIES
CORPORATE RESPONSIBILITY
RECONCILIATIONS & SUPPLEMENTAL INFO
Growth Opportunities
THE RITZ-CARLTON GOLF RESORT, NAPLES

31
Our goal is to meaningfully grow our hotel EBITDA throughout the current lodging cycle through multiple external and internal growth drivers.
EBITDA Growth Drivers
Pro Forma Hotel-Level EBITDA ($ millions)(1):
$1,493
$(82) $120
$100 - $150
$22 - $37$25 - $35
Pro Forma EBITDA for 7 hotel and 2 golf course acquisitions
in 2021
Redefining the operating model,
target long-term cost savings based on 2019
revenues
Goal of gaining 3 – 5 points of RevPAR
index share at 24 renovated or to be renovated hotels at
stabilization based on 2019 business levels
Target from our 4 major ROI
development projects at stabilization
2019 EBITDA for 7 hotel dispositions in
2021 – YTD 2022(see slide 13)
All Hotel Pro Forma EBITDA Dec 31, 2019(2)
*targeted stabilization 2-3 years after completion
External +
Internal Growth Drivers
= $267 -$342
INTERNAL GROWTH DRIVERS
EXTERNAL GROWTH DRIVERS
DISPOSITIONS
2021ACQUISITIONS
2021
PROGRESS TO DATE
Initial Steps Toward50% - 60%
RENOVATION PERIOD
2018 – 2023*
REDEVELOPMENT COMPLETION
PERIOD
2021 – 2022*
(see slide 10)
1) Combined 2019 net income for the seven hotel dispositions was $40 million. Combined acquisition net income for Hyatt Regency Austin, Four Seasons Resort Orlando at Walt Disney World® Resort, Baker’s Cay Resort Key Largo, The Laura Hotel, Ka’anapali golf courses, Alila Ventana Big Sur, The Alida, Savannah, and Hotel Van Zandt was $74 million, using 2019 results except for Baker’s Cay and Alila Ventana Big Sur which use 2021E net income and the Laura Hotel and The Alida, Savannah which use estimated 2019 normalized net income (see slide 8, footnote 1 for explanations). Incremental net income (loss) at the targeted EBITDA range for the renovations at 24 hotels is estimated to be $(21) million to $(6) million and for the four ROI development projects is estimated to be $17 million to $27 million. See slide 10 for qualifications and assumptions for these target EBITDA projections. These results are illustrative only and actual results are expected to vary from these targets, see Slide 2 for factors that may cause results to be materially different from these targets. See Reconciliations & Supplemental Information for reconciliation of net income to EBITDA.
2) 2019 EBITDA for Hotels owned as of December 31, 2020. The timing of a return to this level of EBITDA for these properties is unknown, and will be affected by, among other items, the timing of a return to 2019 revenue levels as well as any inflationary effects on operating costs.
2022 Host Hotels & Resorts, Inc.
COMPANY OVERVIEW
RECENTPROGRESS
PORTFOLIO UPDATE
GROWTH OPPORTUNITIES
CORPORATE RESPONSIBILITY
RECONCILIATIONS & SUPPLEMENTAL INFO

32
We have been able to meaningfully invest in our properties with minimal disruption in 2020-2021 as a result of entering 2020 with low leverage and a large cash balance.
CapEx Investment Comparison
1) Calculated as 2020 Capital Expenditures plus midpoint of 2021 forecasts divided by room count on a weighted average basis as provided in filings with the SEC. Lodging REIT companies in the peer group average are based on the next seven largest lodging REITs by market capitalization (excluding APL and SVC, which have a high portfolio concentration of limited service hotels which are not comparable to Host’s portfolio). The peer group average includes PEB, PK, RHP, RLJ, SHO, XHR and DRH based on their Q3 2021 filings. Host is based on Q4 2021 filings.
2) Marriott Transformational Capital Program.
2022 Host Hotels & Resorts, Inc.
By investing during a time of low demand, we have avoided disruption to operations as demand continues to ramp up
Minimize Disruption
We believe our assets will be better positioned to capitalize on pent-up demand compared to our lodging REIT peers and our hotels’ competitive sets
Maximize Competitiveness
By having the newest product fully available, our goal is to increase our RevPAR index share with the potential to further drive EBITDA growth
Capture ShareHost’s CapEx by Type 2020 2021 2022
($ in millions) Actual Actual Forecast – Low Forecast - High
ROI – MTCP(2) $175 $126 $90 $115
ROI – All Other Projects $168 $167 $235 $260
Total ROI Investment $343 $293 $325 $375
Renewal and Replacement $156 $134 $175 $225
Total Capital Expenditures $499 $427 $500 $600
COMPANY OVERVIEW
RECENTPROGRESS
PORTFOLIO UPDATE
GROWTH OPPORTUNITIES
CORPORATE RESPONSIBILITY
RECONCILIATIONS & SUPPLEMENTAL INFO
$21,000
$11,000
Host Peers
2020-2021 CapEx per Key(1)

33
The Coronado Island Marriott Resort and Spa received one of the first Marriott Transformational Capital Program (MTCP) renovations and has meaningfully outperformed expectations since completion.
MTCP CapEx Case Study
GOALMTCP underwriting target: 3-5 points of RevPAR index share gain(1) versus 2019 (or TTM prior to renovation) at stabilization
WHAT WE DID► MTCP renovations began in October 2018
and finished in April 2019► Scope of renovations in 2018-2019
included: public spaces lobby, restaurant, fitness center, pools and grounds (guestroom renovations completed 2016)
LATEST RESULTS(2)
► RevPAR index share gain of 12.6 points (135.8 at TTM Aug 2021 vs. 123.2 at TTM Aug 2018)
► Allowed hotel to increase the resort fee by $15 or 60%
1) RevPAR index share is measured relative to hotels’ competitive sets using STR data for peers. For more information on how RevPAR index is calculated, see Reconciliations & Supplemental Information.
2) These results are illustrative only and there can be no guarantees that other projects will result in similar results. See Slide 2 for factors that may cause results to be materially different from expectations.
2022 Host Hotels & Resorts, Inc.
BEFORE AFTER
BEFORE AFTER
COMPANY OVERVIEW
RECENTPROGRESS
PORTFOLIO UPDATE
GROWTH OPPORTUNITIES
CORPORATE RESPONSIBILITY
RECONCILIATIONS & SUPPLEMENTAL INFO

COMPANY OVERVIEW
RECENTPROGRESS
PORTFOLIO UPDATE
GROWTH OPPORTUNITIES
CORPORATE RESPONSIBILITY
RECONCILIATIONS & SUPPLEMENTAL INFO
Corporate Responsibility
FAIRMONT KEA LANI, MAUI

35
As the premier lodging REIT and a sustainability industry leader, we are committed to creating long-term value through investing responsibly in our business, environment, people, stakeholders and community. Our Corporate Responsibility program is centered around the concept of responsible investment—an overarching strategy that guides our focus and actions across our three main themes:
Value Creation Through Responsible Investment
ENVIRONMENTAL STEWARDSHIP
SOCIAL RESPONSIBILITY
GOVERNANCE
ESG HIGHLIGHTS
Participant in the CEO Action for Diversity & Inclusion™ and establishment of D&I program and women’s employee resource group
First lodging REIT to sign on to industry 5-Star Promise as an owner to advance safety, non-discrimination and human rights within the hospitality industry
Multi-dimensional performance reviews for 100% of employees
ESG oversight from our Board’s Nominating, Governance and Corporate Responsibility Committee
Cross-functional Corporate Responsibility Advisory Committee, representing nearly every department at Host
ESG Executive Steering Committee that guides corporate responsibility strategies and engagement with Board
Emissions reduction target approved by Science Based Targets initiative (SBTi) at the 1.5-degree Celsius level of ambition
7 LEED-certified hotels, including two LEED Gold hotels as well as Host’s corporate headquarters
Only lodging REIT to issue green bonds—$1.85B raised from 2019-2021 to invest insustainability projects and LEED-certified hotels
COMPANY OVERVIEW
RECENTPROGRESS
PORTFOLIO UPDATE
GROWTH OPPORTUNITIES
CORPORATE RESPONSIBILITY
RECONCILIATIONS & SUPPLEMENTAL INFO
2022 Host Hotels & Resorts, Inc.
36
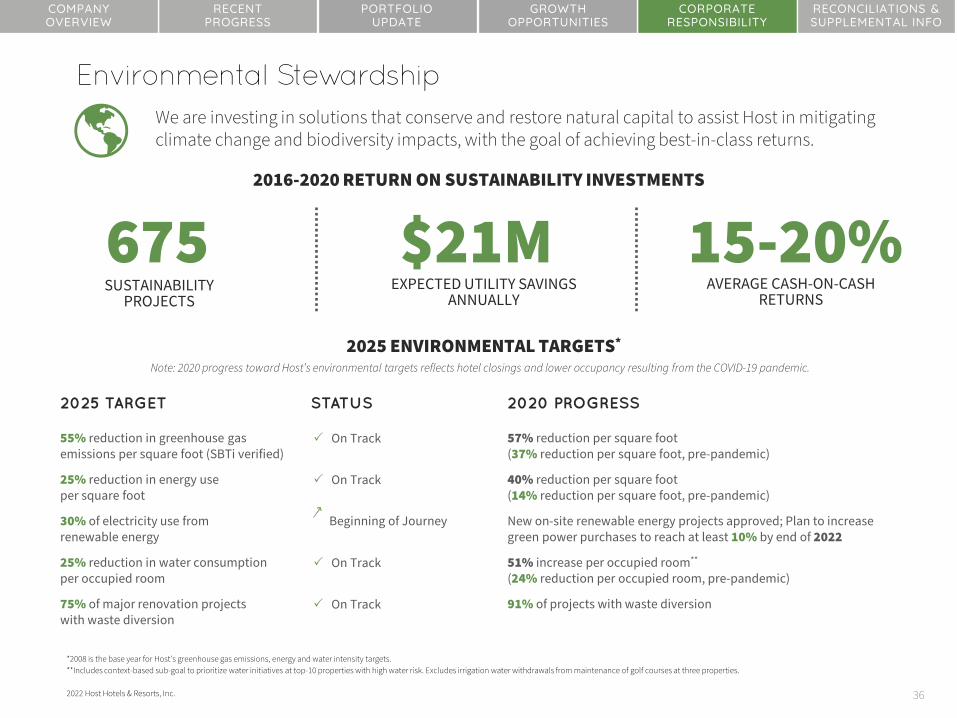
2025 TARGET STATUS 2020 PROGRESS
55% reduction in greenhouse gas emissions per square foot (SBTi verified)
On Track 57% reduction per square foot(37% reduction per square foot, pre-pandemic)
25% reduction in energy use per square foot
On Track 40% reduction per square foot(14% reduction per square foot, pre-pandemic)
30% of electricity use from renewable energy
Beginning of Journey New on-site renewable energy projects approved; Plan to increase green power purchases to reach at least 10% by end of 2022
25% reduction in water consumption per occupied room
On Track 51% increase per occupied room**
(24% reduction per occupied room, pre-pandemic)
75% of major renovation projects with waste diversion
On Track 91% of projects with waste diversion
Environmental Stewardship
675 $21M 15-20%SUSTAINABILITY
PROJECTSEXPECTED UTILITY SAVINGS
ANNUALLYAVERAGE CASH-ON-CASH
RETURNS
Note: 2020 progress toward Host’s environmental targets reflects hotel closings and lower occupancy resulting from the COVID-19 pandemic.
We are investing in solutions that conserve and restore natural capital to assist Host in mitigating climate change and biodiversity impacts, with the goal of achieving best-in-class returns.
2016-2020 RETURN ON SUSTAINABILITY INVESTMENTS
2025 ENVIRONMENTAL TARGETS*
*2008 is the base year for Host’s greenhouse gas emissions, energy and water intensity targets.**Includes context-based sub-goal to prioritize water initiatives at top-10 properties with high water risk. Excludes irrigation water withdrawals from maintenance of golf courses at three properties.
2022 Host Hotels & Resorts, Inc.
COMPANY OVERVIEW
RECENTPROGRESS
PORTFOLIO UPDATE
GROWTH OPPORTUNITIES
CORPORATE RESPONSIBILITY
RECONCILIATIONS & SUPPLEMENTAL INFO

37
Social Responsibility
2022 Host Hotels & Resorts, Inc.
2025 TARGET STATUS PROGRESS
100% of employees trained on unconscious biases
On Track Baseline concept introduced via an online training module; senior management diversity training completed in 2021; external training partner to conduct more comprehensive diversity training for all employees, which will include unconscious bias
Conduct at least two engagement surveys On Track Initial culture survey completed in 2020; engagement survey completed in 2021
Include at least two women and two persons of color in each initial candidate pool for externally sourced executive level positions
Beginning of Journey Commitment to include in external searches for department head and above positions
165+ YEAR 5 $850KCHARITIES SUPPORTED,
INCLUDING 116 EMPLOYEE-SELECTED CHARITIES
OF $500,000, 5-YEAR PLEDGE TO SUPPORT THE AHLA FOUNDATION’S
INITIATIVE TO SUPPORT YOUTH EDUCATION AND TRAINING FOR CAREERS IN THE HOSPITALITY
INDUSTRY
DONATED TO SUPPORT COVID-19 RELIEF EFFORTS IN ALL OF HOST’S KEY MARKETS, WITH A FOCUS ON HUNGER
RELIEF, MEDICAL SUPPLIES AND INDUSTRY RECOVERY EFFORTS
We are committed to advancing health, well-being and opportunity for all Host stakeholders, including investors, employees, partners and communities.
2020 CORPORATE CITIZENSHIP HIGHLIGHTS
2025 SOCIAL TARGETS
COMPANY OVERVIEW
RECENTPROGRESS
PORTFOLIO UPDATE
GROWTH OPPORTUNITIES
CORPORATE RESPONSIBILITY
RECONCILIATIONS & SUPPLEMENTAL INFO

38
Governance
2022 Host Hotels & Resorts, Inc.
Our responsible investment strategies are guided by executive and board-level oversight, our EPIC values and ethical standards, and a disciplined approach to risk management and sustainable value creation.
GOVERNANCE HIGHLIGHTS
► Board Oversight: Highest level of responsibility for ESG matters formally residing with Nominating, Governance and Corporate Responsibility Committee of our Board of Directors.
► Best-in-class Governance: Governed by ESG Executive Steering Committee that guides strategy and engagement, and advised by cross-functional Corporate Responsibility Advisory Committee representing nearly every department at Host.
► Stockholder Rights: Implementation of numerous corporate governance enhancements to strengthen the rights of and to serve the long-term interests of stockholders.
► Policies: Code of Business Conduct and Ethics centered around our corporate EPIC values—Excellence, Partnership, Integrity and Community. Maintain a Human Rights Policy, Environmental Policy, Supplier Code of Conduct and Antibribery Compliance Manual as well as conduct annual compliance training for all employees.
► Business Intelligence: Best-in-class Enterprise Analytics platform that uses business intelligence to monitor performance, identify opportunities and manage and mitigate risks, including first-of-its-kind joint development agreement with IBM Research.
► Risk Management: Conduct IT infrastructure testing and ongoing, company-wide cybersecurity training.
COMPANY OVERVIEW
RECENTPROGRESS
PORTFOLIO UPDATE
GROWTH OPPORTUNITIES
CORPORATE RESPONSIBILITY
RECONCILIATIONS & SUPPLEMENTAL INFO

39
Commitment to Green Building Certifications
COMPANY OVERVIEW
RECENTPROGRESS
PORTFOLIO UPDATE
GROWTH OPPORTUNITIES
CORPORATE RESPONSIBILITY
RECONCILIATIONS & SUPPLEMENTAL INFO
16
VILLAS DEVELOPMENT AT ANDAZ MAUI: LEED SILVER TARGET
► Building energy performance 24% more efficient with a solar photovoltaic (PV) system, LED Lighting, Energy Star appliances, guestroom energy management systems, light roofs and other strategies
► Solar PV array generates over 45% of building electricity usage► Low-flow plumbing fixtures result in 26% indoor water savings► Over 50% reduced landscaping irrigation needs► Emphasis on healthy materials verified as low-emissions/non-toxic► All stormwater run-off filtered and percolates into the ground► Outdoor lighting utilizes BUG Rating Method to reduce light pollution
WHAT WE DID19 new, 2-bedroom luxury villas development completed in Q2 2021
SUSTAINABLE ATTRIBUTES
LEED CERTIFICATIONS
ANDAZ MAUI AT WAILEA RESORT
1 HOTEL SOUTH BEACH
AXIOM HOTEL
HYATT REGENCY MAUI RESORT AND SPA
GRAND HYATT WASHINGTON
HYATT REGENCY SAN FRANCISCO AIRPORT
NEW MARRIOTT HALL
NEW HOST HQ
LEED CERTIFIED
LEED SILVER
LEED GOLD
LEED PROJECTS IN THE PIPELINE
2022 Host Hotels & Resorts, Inc.

40
NEWSWEEK
ESG LEADERSHIP
Awards & Recognition
This presentation contains registered trademarks that are the exclusive property of their respective owners. None of the owners of these trademarks has any responsibility or liability for any information contained in this presentation. The inclusion of Host Hotels & Resorts in any MSCI index, and the use of MSCI logos, trademarks, service marks or index names herein, do not constitute a sponsorship, endorsement or promotion of Host Hotels & Resorts by MSCI or any of its affiliates. The MSCI indexes are the exclusive property of MSCI. MSCI and the MSCI index names and logos are trademarks or service marks of MSCI or its affiliates.
2022 Host Hotels & Resorts, Inc.
DJSI World & North America Listed
Prime Corporate Rating
2021 Climate Change and Supplier Engagement
Leadership Level
One of America’s Most Responsible Companies
One of the World’s Most Sustainable Companies
Top 10 Most Sustainable REITs
Top 25% Ranking on Corporate Governance
“A” Rating “Robust” Rating
Low ESG Risk Rating
Top 13% of All Companies
Industry Leader (Top 10%)
TO LEARN MORE ABOUT OUR CR PROGRAM AND ESG PERFORMANCE, READ OUR2021 CORPORATE RESPONSIBILITY REPORT OR VISIT THE CR SECTION ON OUR WEBSITE.
VIGEO EIRIS
COMPANY OVERVIEW
RECENTPROGRESS
PORTFOLIO UPDATE
GROWTH OPPORTUNITIES
CORPORATE RESPONSIBILITY
RECONCILIATIONS & SUPPLEMENTAL INFO

COMPANY OVERVIEW
RECENTPROGRESS
PORTFOLIO UPDATE
GROWTH OPPORTUNITIES
CORPORATE RESPONSIBILITY
RECONCILIATIONS & SUPPLEMENTAL INFO
Reconciliations & Supplemental
Information
THE ALIDA, SAVANNAH, A TRIBUTE PORTFOLIO HOTEL

42
Appendix
COMPANY OVERVIEW
RECENTPROGRESS
PORTFOLIO UPDATE
GROWTH OPPORTUNITIES
CORPORATE RESPONSIBILITY
RECONCILIATIONS & SUPPLEMENTAL INFO
Table of Contents
Key Terms and Statistics
• Defined Terms• Non-GAAP Financial Measures• Items that may Affect Forecast Results, Projections, and Other Estimates
A-1A-1A-1A-5
Reconciliation of GAAP Leverage Ratio to Credit Facility Leverage Ratio A-6
Reconciliation of Net Loss to EBITDA, EBITDAre and Adjusted EBITDAre A-8
Reconciliation of GAAP Revenues and Expenses to All Owned Hotel Pro Forma Revenues and Expenses A-9
Schedule of All Owned Hotel Pro Forma Results A-10
Reconciliation of Net Income (Loss) to All Owned Hotel Pro Forma EBITDA A-11
Reconciliation of Targeted Net Income (Loss) to Hotel EBITDA for Renovation and Development Projects A-12
Schedule of All Owned Hotel Pro Forma Results for 2019 and 2017 A-13
Schedule of Net income to All Owned Hotel Pro Forma EBITDA for 2019 by Location A-15
Acquisitions & Dispositions Metrics A-16
2022 Host Hotels & Resorts, Inc.

43
Key Terms And Statistics
COMPANY OVERVIEW
RECENTPROGRESS
PORTFOLIO UPDATE
GROWTH OPPORTUNITIES
CORPORATE RESPONSIBILITY
RECONCILIATIONS & SUPPLEMENTAL INFO
A-1
Defined Terms
Cap Rate – Capitalization Rate, calculated as Net Operating Income (NOI) divided by sales price. The corresponding metric using GAAP measures is net income divided by sales price.
EBITDA Multiple – Sales price divided by EBITDA. The corresponding metric using GAAP measures is sales price divided by net income.
Investment – Our investment of cash, land or other property.
MTCP – Marriott Transformational Capital Program.
Replacement Cost – The cost to develop a new hotel in the same lodging segment based on current estimated costs.
RevPAR Index – RevPAR Index measures a hotel’s fair market share of their competitive set’s revenue per available room within a given market by dividing the property’s RevPAR by the average RevPAR of the competitive set. If a hotel is capturing its fair market share, the index will be 100; if capturing less than its fair market share, a hotel’s index will be less than 100; and if capturing more than its fair market share, a hotel’s index will be greater than 100. For each property, the market competitive set is based on the set agreed to with the manager and is included within the respective property’s management agreement. The competitive set can be used for various purposes, including for determining the hotel general manager’s compensation as well as owner’s performance based termination rights under the hotel management agreement. Therefore, it represents an arm’s length negotiated set of hotels which the parties agree represent the hotel’s most direct competition. However, it does not necessarily represent all the hotels against which the hotel competes and may exclude hotels in other segments (e.g., select service hotels) even though those hotels may compete with the hotel for certain customers.
RevPAR – The product of the average daily room rate charged and the average daily occupancy achieved.
ROI – Return on Investment. ROI projects are designed to improve the positioning of our hotels within their markets and competitive set.
Total RevPAR – A summary measure of hotel results calculated by dividing the sum of room, food and beverage and other ancillary service revenue by room nights available to guests for the period. It includes ancillary revenues not included within RevPAR.
TTM – Trailing twelve months
Non-GAAP Financial Measures
Included in this presentation are certain “non-GAAP financial measures,” which are measures of our historical or future financial performance that are not calculated and presented in accordance with GAAP, within the meaning of applicable SEC rules. They are as follows: (i) EBITDA, (ii) EBITDAre and Adjusted EBITDAre, (iii) Net Operating Income (NOI), and (iv) All Owned Hotel Pro Forma Property Level Operating Results. Additionally, we have presented our leverage ratio, which is used to determine compliance with financial covenants under our credit facility that are not calculated and presented in accordance with GAAP. The following discussion defines these measures and presents why we believe they are useful supplemental measures of our performance.
2022 Host Hotels & Resorts, Inc.

44
Key Terms And Statistics
COMPANY OVERVIEW
RECENTPROGRESS
PORTFOLIO UPDATE
GROWTH OPPORTUNITIES
CORPORATE RESPONSIBILITY
RECONCILIATIONS & SUPPLEMENTAL INFO
A-2
EBITDA and NOI
Earnings before Interest Expense, Income Taxes, Depreciation and Amortization (“EBITDA”) is a commonly used measure of performance in many industries. Management believes EBITDA provides useful information to investors regarding our results of operations because it helps us and our investors evaluate the ongoing operating performance of our properties after removing the impact of the Company’s capital structure (primarily interest expense) and its asset base (primarily depreciation and amortization). Management also believes the use of EBITDA facilitates comparisons between us and other lodging REITs, hotel owners who are not REITs and other capital-intensive companies. Management uses EBITDA to evaluate property-level results and as one measure in determining the value of acquisitions and dispositions and, like FFO and Adjusted FFO per diluted share, is widely used by management in the annual budget process and for our compensation programs. Management also uses NOI when calculating Cap Rates to evaluate acquisitions and dispositions. For a specific hotel, NOI is calculated as the hotel or entity level EBITDA less an estimate for the annual contractual reserve requirements for renewal and replacement expenditures. Management believes using Cap Rates allows for a consistent valuation method in comparing the purchase or sale value of properties.
EBITDAre and Adjusted EBITDAre
We present EBITDAre in accordance with NAREIT guidelines, as defined in its September 2017 white paper “Earnings Before Interest, Taxes, Depreciation and Amortization for Real Estate,” to provide an additional performance measure to facilitate the evaluation and comparison of the Company’s results with other REITs. NAREIT defines EBITDAre as net income (calculated in accordance with GAAP) excluding interest expense, income tax, depreciation and amortization, gains or losses on disposition of depreciated property (including gains or losses on change of control), impairment write-downs of depreciated property and of investments in unconsolidated affiliates caused by a decrease in value of depreciated property in the affiliate, and adjustments to reflect the entity’s pro rata share of EBITDAre of unconsolidated affiliates.
We make additional adjustments to EBITDAre when evaluating our performance because we believe that the exclusion of certain additional items described below provides useful supplemental information to investors regarding our ongoing operating performance. We believe that the presentation of Adjusted EBITDAre, when combined with the primary GAAP presentation of net income, is beneficial to an investor’s understanding of our operating performance. Adjusted EBITDAre also is similar to the measure used to calculate certain credit ratios for our credit facility and senior notes. We adjust EBITDAre for the following items, which may occur in any period, and refer to this measure as Adjusted EBITDAre:
• Property Insurance Gains – We exclude the effect of property insurance gains reflected in our consolidated statements of operations because we believe that including them in Adjusted EBITDAre is not consistent with reflecting the ongoing performance of our assets. In addition, property insurance gains could be less important to investors given that the depreciated asset book value written off in connection with the calculation of the property insurance gain often does not reflect the market value of real estate assets.
• Acquisition Costs – Under GAAP, costs associated with completed property acquisitions that are considered business combinations are expensed in the year incurred. We exclude the effect of these costs because we believe they are not reflective of the ongoing performance of the Company.
• Litigation Gains and Losses – We exclude the effect of gains or losses associated with litigation recorded under GAAP that we consider outside the ordinary course of business. We believe that including these items is not consistent with our ongoing operating performance.
2022 Host Hotels & Resorts, Inc.
45
Key Terms And Statistics
COMPANY OVERVIEW
RECENTPROGRESS
PORTFOLIO UPDATE
GROWTH OPPORTUNITIES
CORPORATE RESPONSIBILITY
RECONCILIATIONS & SUPPLEMENTAL INFO
A-3
• Severance Expense – In certain circumstances, we will add back hotel-level severance expenses when we do not believe that such expenses are reflective of the ongoing operation of our properties. Situations that would result in a severance add-back include, but are not limited to, (i) costs incurred as part of a broad-based reconfiguration of the operating model with the specific hotel operator for a portfolio of hotels and (ii) costs incurred at a specific hotel due to a broad-based and significant restructuring of a hotel and/or its workforce. We do not add back corporate-level severance costs or severance costs at an individual hotel that we consider to be incurred in the normal course of business.
In unusual circumstances, we also may adjust EBITDAre for gains or losses that management believes are not representative of the Company’s current operating performance.
Limitations on the Use of EBITDA, NOI, EBITDAre and Adjusted EBITDAre
EBITDA, NOI, EBITDAre and Adjusted EBITDAre, as presented, may not be comparable to measures calculated by other companies. This information should not be considered as an alternative to net income, operating profit, cash from operations or any other operating performance measure calculated in accordance with GAAP. Cash expenditures for various long-term assets (such as renewal and replacement capital expenditures, with the exception of NOI), interest expense (for EBITDA, NOI, EBITDAreand Adjusted EBITDAre purposes only) severance expense related to significant property-level restructuring and other items have been and will be made and are not reflected in the EBITDA, EBITDAre, and Adjusted EBITDAre, presentations. Management compensates for these limitations by separately considering the impact of these excluded items to the extent they are material to operating decisions or assessments of our operating performance. Our consolidated statement of operations and cash flows include interest expense, capital expenditures, and other excluded items, all of which should be considered when evaluating our performance, as well as the usefulness of our non-GAAP financial measures. Additionally, EBITDA, NOI, EBITDAre and Adjusted EBITDAre should not be considered as a measure of our liquidity or indicative of funds available to fund our cash needs, including our ability to make cash distributions.
Similarly, EBITDAre and Adjusted EBITDAre, include adjustments for the pro rata share of our equity investments. Our equity investments consist of interests ranging from11% to 67% in seven domestic and international partnerships that own a total of 10 properties and a vacation ownership development. Due to the voting rights of the outside owners, we do not control and, therefore, do not consolidate these entities. The non-controlling partners in consolidated partnerships primarily consist of the approximate 1% interest in Host LP held by outside partners and a 15% interest held by outside partners in a partnership owning one hotel for which we do control the entity and, therefore, consolidate its operations. These pro rata results for EBITDAre and Adjusted EBITDAre were calculated as set forth in the definitions above. Readers should be cautioned that the pro rata results presented in these measures for equity investments may not accurately depict the legal and economic implications of our investments in these entities.
Credit Facility – Leverage Ratio
Host’s credit facility contains certain financial covenants, including allowable leverage, which is determined using earnings before interest expense, income taxes, depreciation and amortization (“EBITDA”) as calculated under the terms of our credit facility (“Adjusted Credit Facility EBITDA”). The leverage ratio is defined as net debt plus preferred equity to Adjusted Credit Facility EBITDA. These calculations are based on pro forma results for the prior four fiscal quarters, except as defined under the amendments to the credit facility, giving effect to transactions such as acquisitions, dispositions and financings as if they occurred at the beginning of the period.
Additionally, total debt used in the calculation of our leverage ratio is based on a “net debt” concept, under which cash and cash equivalents in excess of $100 million are deducted from our total debt balance. Management believes these financial ratios provide useful information to investors regarding our compliance with the covenants in our credit facility and our ability to access the capital markets, in particular debt financing.
2022 Host Hotels & Resorts, Inc.

46
Key Terms And Statistics
COMPANY OVERVIEW
RECENTPROGRESS
PORTFOLIO UPDATE
GROWTH OPPORTUNITIES
CORPORATE RESPONSIBILITY
RECONCILIATIONS & SUPPLEMENTAL INFO
A-4
Limitations on Credit Facility Credit Ratios
These metrics are useful in evaluating the Company’s compliance with the covenants contained in its credit facility. However, because of the various adjustments taken to the ratio components as a result of negotiations with the Company’s lenders they should not be considered as an alternative to the same ratios determined in accordance with GAAP. For instance, interest expense as calculated under the credit facility excludes items such as deferred financing charges and amortization of debt premiums or discounts, all of which are included in interest expense on our consolidated statement of operations. Management compensates for these limitations by separately considering the impact of these excluded items to the extent they are material to operating decisions or assessments of performance. In addition, because the credit facility ratio components are also based on pro forma results for the prior four fiscal quarters, giving effect to transactions such as acquisitions, dispositions and financings as if they occurred at the beginning of the period, they are not reflective of actual performance over the same period calculated in accordance with GAAP.
All Owned Hotel Pro Forma Operating Statistics and Results
To facilitate a quarter-to-quarter comparison of our operations, we typically present certain operating statistics (i.e., Total RevPAR, RevPAR, average daily rate and average occupancy) and operating results (revenues, expenses, hotel EBITDA and associated margins) for the periods included in this presentation on a comparable hotel basis in order to enable our investors to better evaluate our operating performance. However, due to the COVID-19 pandemic and its effects on operations, there is little comparability between periods. For this reason, we temporarily are suspending our comparable hotel presentation and instead present hotel operating results for all consolidated hotels and, to facilitate comparisons between periods, we are presenting results on a pro forma basis, including the following adjustments: (1) operating results are presented for all consolidated hotels owned as of December 31 of the reporting year, but do not include the results of operations for properties sold through the reporting date; and (2) operating results for acquisitions in the current and prior year are reflected for full calendar years, to include results for periods prior to our ownership. For these hotels, since the year-over-year comparison includes periods prior to our ownership, the changes will not necessarily correspond to changes in our actual results.
We present certain operating results for our hotels, such as hotel revenues, expenses, food and beverage profit, and EBITDA (and the related margins), on a hotel-level pro forma basis as supplemental information for our investors. Our hotel results reflect the operating results of our hotels as discussed above. We present all owned hotel pro forma EBITDA to help us and our investors evaluate the ongoing operating performance of our hotels after removing the impact of the Company’s capital structure (primarily interest expense) and its asset base (primarily depreciation and amortization expense). Corporate-level costs and expenses also are removed to arrive at property-level results. We believe these property-level results provide investors with supplemental information about the ongoing operating performance of our hotels. All owned hotel pro forma results are presented both by location and for the Company’s properties in the aggregate. We eliminate from our hotel level operating results severance costs related to broad-based and significant property-level reconfiguration that is not considered to be within the normal course of business, as we believe this elimination provides useful supplemental information that is beneficial to an investor’s understanding of our ongoing operating performance. We also eliminate depreciation and amortization expense because, even though depreciation and amortization expense are property-level expenses, these non-cash expenses, which are based on historical cost accounting for real estate assets, implicitly assume that the value of real estate assets diminishes predictably over time. As noted earlier, because real estate values historically have risen or fallen with market conditions, many real estate industry investors have considered presentation of historical cost accounting for operating results to be insufficient.
2022 Host Hotels & Resorts, Inc.

47
Key Terms And Statistics
COMPANY OVERVIEW
RECENTPROGRESS
PORTFOLIO UPDATE
GROWTH OPPORTUNITIES
CORPORATE RESPONSIBILITY
RECONCILIATIONS & SUPPLEMENTAL INFO
A-5
Limitations on All Owned Hotel Property Level Operating Results
As a result of the elimination of corporate-level costs and expenses, gains or losses on dispositions and depreciation and amortization, the all owned hotel operating results we present do not represent our total revenues, expenses, operating profit or net income and should not be used to evaluate our performance as a whole. Management compensates for these limitations by separately considering the impact of these excluded items to the extent they are material to operating decisions or assessments of our operating performance. Our consolidated statements of operations include such amounts, all of which should be considered by investors when evaluating our performance.
Items That May Affect Forecast Results, Projections and Other Estimates
Certain items included in this investor presentation such as forecast EBITDA for acquired hotels, expected incremental EBITDA from capital expenditure projects, including redevelopment and repositioning of hotels, meeting space and restaurants and estimated internal rate of return (IRR) require the company to make assumptions about the future performance of our hotels that may affect forecast results. In determining these forecasts, we evaluate a number of operating performance metrics, including occupancy, room rate, mix of group and transient customers, as well as market specific estimates of demand drivers. Additionally, based on like hotels in our portfolio, we have estimated costs such as utilities, marketing, general overhead costs, and management fees. For certain of our projects, where we have closed or substantially disrupted current year operations, or where we have changed operators, historical operating data is not predictive of future results and there can be no assurances that we will achieve these forecasts due to potential delays in the renovations, less than expected demand or a slower than expected ramp-up in operations.
See Forward-Looking Statements slide in this presentation for additional risks and uncertainties that may affect forecast results.
2022 Host Hotels & Resorts, Inc.

48
Reconciliation of GAAP Leverage Ratio to Credit Facility Leverage Ratio
COMPANY OVERVIEW
RECENTPROGRESS
PORTFOLIO UPDATE
GROWTH OPPORTUNITIES
CORPORATE RESPONSIBILITY
RECONCILIATIONS & SUPPLEMENTAL INFO
A-62022 Host Hotels & Resorts, Inc.
The following tables present the calculation of Host’s leverage ratio using GAAP measures and as used in the financial covenants of the credit facility (in millions, except ratios):
GAAP Leverage Ratio – As Reported atYear ended Year ended
December 31, 2019 December 31, 2017Debt $ 3,794 $ 3,954Net income (loss) 932 571GAAP Leverage Ratio 4.1x 6.9x
Leverage Ratio per Credit Facility – As Reported atYear ended Year ended
December 31, 2019 December 31, 2017Net debt (1) $ 2,321 $ 3,175Adjusted Credit Facility EBITDA (2) 1,490 1,466Leverage Ratio 1.6x 2.2x
(1) The following presents the reconciliation of debt to net debt per our credit facility definition (in millions):
At December 31, 2019 At December 31, 2017Debt $ 3,794 $ 3,954Deferred financing cost - 27Contingent obligations - 6Less: Unrestricted cash over $100 million (1,473) (812)Net debt per credit facility definition $ 2,321 $ 3,175

49
Reconciliation of GAAP Leverage Ratio to Credit Facility Leverage Ratio
COMPANY OVERVIEW
RECENTPROGRESS
PORTFOLIO UPDATE
GROWTH OPPORTUNITIES
CORPORATE RESPONSIBILITY
RECONCILIATIONS & SUPPLEMENTAL INFO
A-72022 Host Hotels & Resorts, Inc.
(2) The following presents the reconciliation of net income (loss) to EBITDA, EBITDAre, Adjusted EBITDAre and EBITDA per our credit facility definition in determining leverageratio (in millions):
As Reported at Year ended As Reported at Year endedDecember 31, 2019 December 31, 2017
Net income $ 932 $ 571Interest expense 222 167Depreciation and amortization 662 708Income taxes 30 80EBITDA 1,846 1,526Gain on dispositions (334) (100)Non-cash impairment expense 14 43Equity in earnings of affiliates (14) (30)Pro rata EBITDAre of equity investments 26 71EBITDAre 1,538 1,510Acquisition costs - 1Gain on property insurance settlement (4) (1)Adjusted EBITDAre 1,534 1,510Pro forma EBITDA - Acquisitions 9 4Pro forma EBITDA - Dispositions (64) (17)Restricted stock expense and other non-cash items 28 12Non-cash partnership adjustments (17) (43)Adjusted Credit Facility EBITDA $ 1,490 $ 1,466

50
Reconciliation of Net Loss to EBITDA, EBITDAre and Adjusted EBITDAre
COMPANY OVERVIEW
RECENTPROGRESS
PORTFOLIO UPDATE
GROWTH OPPORTUNITIES
CORPORATE RESPONSIBILITY
RECONCILIATIONS & SUPPLEMENTAL INFO
A-82022 Host Hotels & Resorts, Inc.
The following reconciles net loss to Adjusted EBITDAre (in millions):
Quarter endedDecember 31, 2021
Net loss $ 323Interest expense 63Depreciation and amortization 165Income taxes (10)
EBITDA 541Gain on dispositions (303)
Equity investment adjustments:Equity in (earnings) losses of affiliates 5
Pro rata EBITDAre of equity investments (1) 4EBITDAre 247Adjustments to EBITDAre:
Severance expense (reversal) at hotel properties (5)Adjusted EBITDAre $ 242

51
Quarter endedDecember 31,
Quarter endedSeptember 30,
Quarter endedJune 30,
Quarter endedMarch 31,
Quarter endedDecember 31,
Quarter endedSeptember 30,
Quarter endedJune 30,
2021 2019 2021 2019 2021 2019 2021 2019 2020 2019 2020 2019 2020 2019
GAAP Total Revenues $ 998 $ 1,334 $ 844 $ 1,262 $ 649 $ 1,483 $ 399 $ 1,390 $ 267 $ 1,334 $ 198 $ 1,262 $ 103 $ 1,483Pro forma adjustments 2 (1) 9 (7) 10 (44) 2 (75) (1) (26) (3) (64) (1) (99)
All Owned Hotel Pro Forma Revenues $ 1,000 $ 1,333 $ 853 $ 1,255 $ 659 $ 1,439 $ 401 $ 1,315 $ 266 $ 1,308 $ 195 $ 1,198 $ 102 $ 1,384
GAAP Total Expenses $ 919 $ 1,168 $ 939 $ 1,125 $ 717 $ 1,203 $ 565 $ 1,174 $ 538 $ 1,168 $ 516 $ 1,125 $ 456 $ 1,203(Severance) reversal at hotel properties 5 - 2 - 1 - 2 - (21) - (43) - (1) -Pro forma adjustments (2) (3) 3 (1) 9 (27) 2 (54) (1) (20) (2) (44) (2) (68)Depreciation and corporate level items (191) (201) (287) (187) (194) (191) (189) (199) (188) (201) (184) (187) (193) (191)
All Owned Hotel Pro Forma Expenses $ 731 $ 964 $ 657 $ 937 $ 533 $ 985 $ 380 $ 921 $ 328 $ 947 $ 287 $ 894 $ 260 $ 944
The following table reconciles the 2021, fourth quarter, third quarter and second quarter 2020 and 2019 GAAP Revenues and Expenses to All Owned Hotel Pro forma Revenues and Expenses (in millions)(1):
Reconciliation of GAAP Revenues and Expenses to All Owned Hotel Pro Forma Revenues and Expenses
COMPANY OVERVIEW
RECENTPROGRESS
PORTFOLIO UPDATE
GROWTH OPPORTUNITIES
CORPORATE RESPONSIBILITY
RECONCILIATIONS & SUPPLEMENTAL INFO
A-9
(1) The comparative amounts for the fourth quarter proforma results for 2021 and 2019 are shown for hotels owned as of December 31, 2021. Third quarter pro forma results for 2021 and 2019 are shown for hotels owned as of September 30, 2021. Second quarter pro forma results for 2021 and 2019 are shown for hotels owned as of June 30, 2021. First quarter pro forma results for 2021 and 2019 are shown for hotels owned as of March 31, 2021. The comparative amounts for fourth quarter, third quarter and second quarter pro forma results for 2020 and 2019 are shown for hotels owned as of December 31, 2020.
2022 Host Hotels & Resorts, Inc.

52
Schedule of All Owned Hotel Pro Forma Results
COMPANY OVERVIEW
RECENTPROGRESS
PORTFOLIO UPDATE
GROWTH OPPORTUNITIES
CORPORATE RESPONSIBILITY
RECONCILIATIONS & SUPPLEMENTAL INFO
A-10
(1) Operating profit is calculated as GAAP Total Revenues less GAAP Total Expenses. All Owned Hotel Pro Forma EBITDA is calculated as All Owned Hotel Pro Forma Revenues less All Owned Hotel Pro Forma Expenses. Profit margins are calculated by dividing the applicable operating profit by the related revenue amount. GAAP profit margins are calculated using operating profit and hotel margins are calculated using amounts presented in the above tables.
2022 Host Hotels & Resorts, Inc.
The following table reconciles the fourth quarter and third quarter of 2021 and fourth quarter of 2019 GAAP results to All Owned Hotel Pro Forma EBITDA Results. All amounts are in millions except margins:
December 31, 2021 PortfolioQuarter endedDecember 31,
Quarter endedDecember 31,
Quarter endedSeptember 30,
2021 2019 2021
GAAP Total Revenues $ 998 $ 1,334 $ 844Pro forma adjustments 2 (1) (13)
All Owned Hotel Pro Forma Revenues $ 1,000 $ 1,333 $ 831
GAAP Total Expenses $ 919 $ 1,168 $ 939Severance at hotel properties 5 - 2Pro forma adjustments (2 ) (3) (16)Depreciation and corporate level items (191 ) (201) (287)
All Owned Hotel Pro Forma Expenses $ 731 $ 964 $ 638
Operating Profit(1) $ 79 $ 166 $ (95)
All Owned Hotel Pro Forma EBITDA(1) $ 269 $ 369 $ 193
Operating profit margin(1) 7.9 % 12.4% (11.3)%All Owned Hotel Pro Forma EBITDA margin(1) 26.9 % 27.7% 23.2%
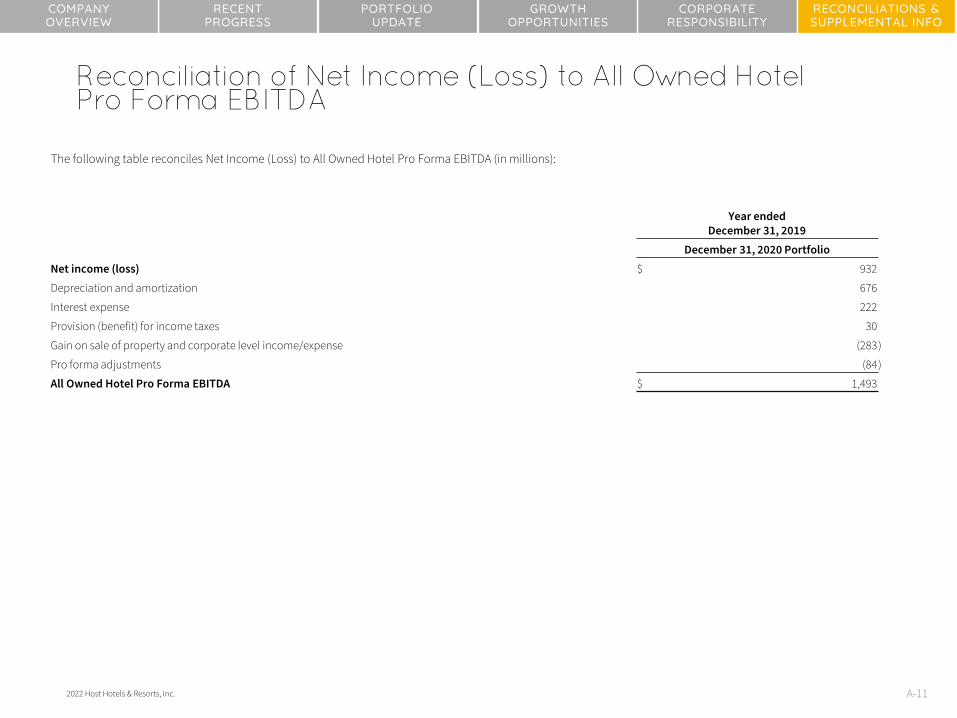
53
Reconciliation of Net Income (Loss) to All Owned Hotel Pro Forma EBITDA
COMPANY OVERVIEW
RECENTPROGRESS
PORTFOLIO UPDATE
GROWTH OPPORTUNITIES
CORPORATE RESPONSIBILITY
RECONCILIATIONS & SUPPLEMENTAL INFO
A-112022 Host Hotels & Resorts, Inc.
The following table reconciles Net Income (Loss) to All Owned Hotel Pro Forma EBITDA (in millions):
Year endedDecember 31, 2019
December 31, 2020 PortfolioNet income (loss) $ 932Depreciation and amortization 676Interest expense 222Provision (benefit) for income taxes 30Gain on sale of property and corporate level income/expense (283)Pro forma adjustments (84)All Owned Hotel Pro Forma EBITDA $ 1,493

54
Reconciliation of Targeted Net Income (Loss) to Hotel EBITDA for Renovation and Development Projects
COMPANY OVERVIEW
RECENTPROGRESS
PORTFOLIO UPDATE
GROWTH OPPORTUNITIES
CORPORATE RESPONSIBILITY
RECONCILIATIONS & SUPPLEMENTAL INFO
A-122022 Host Hotels & Resorts, Inc.
The following reconciles Hotel Net Income to Hotel-level EBITDA for the targeted incremental growth at stabilization as a result of renovation projects at 24 hotels that are either completed or under renovation and for four ROI development projects either completed or under development (in millions):
Targeted Incremental Growth
24 Hotel Renovations Four ROI development projects
Low High Low High
Hotel Net Income (Loss) $ (21) $ (6) $ 17 $ 27
Depreciation 43 43 8 8
Interest expense - - - -
Income taxes - - - -
Hotel-level EBITDA $ 22 $ 37 $ 25 $ 35

55
COMPANY OVERVIEW
RECENTPROGRESS
PORTFOLIO UPDATE
GROWTH OPPORTUNITIES
CORPORATE RESPONSIBILITY
RECONCILIATIONS & SUPPLEMENTAL INFO
A-13
(1) Profit margins are calculated by dividing the applicable operating profit by the related revenue amount. GAAP profit margins are calculated using amounts presented in the GAAP Results presented in the above table. Hotel margins are calculated using amounts in the All Owned Hotel Pro Forma Results presented in the above table.
(2) For 2019: Pro forma adjustments represent the following items: (i) the elimination of results of operations of our sold hotels in 2019 through February 16, 2022 and (ii) the addition of results for periods prior to our ownership for hotels acquired from January 1, 2019 through February 16, 2022, with the exception of the Laura Hotel and AC Scottsdale North which were not operating during 2019. For 2017: Pro forma adjustments represent the following items: (i) the elimination of results of operations of our sold hotels in 2017 and (ii) the addition of results for periods prior to our ownership for hotels acquired in 2017.
(3) Consistent with our comparable hotel definitions prior to 2020, corporate level items includes the following: (i) corporate and other expenses (ii) gains on insurance settlements and business interruption proceeds, and (iii) the results of our office spaces and other non-hotel income.
2022 Host Hotels & Resorts, Inc.
Year ended December 31,
2019 2017
February 16, 2022 Portfolio(2) December 31, 2017 Portfolio
Number of hotels 78 94
Number of rooms 43,964 52,560
Operating profit margin (1) 14.6 % 12.5 %
All Owned Hotel Pro Forma EBITDA margin (1) 29.2 % 28.0 %
Net income $ 932 $ 571
Depreciation and amortization 676 751
Interest expense 222 167
Provision for income taxes 30 80
Gain on sale of property and corporate levelincome/expense (268 ) (61 )
Pro forma adjustments (2) (82 ) (13 )
All Owned Hotel Pro Forma EBITDA $ 1,510 $ 1,495
Year ended December 31,2019 2017
February 16, 2022 Portfolio(2) December 31, 2017 Portfolio
Total Revenues $ 5,469 $ 5,387Pro forma adjustments (2) (288 ) $ (29 )Corporate level items (3) (4 ) $ (10 )Pro Forma Revenues - All Owned Hotels $ 5,177 $ 5,348
Total Expenses $ 4,670 $ 4,711Pro forma adjustments (2) (206 ) $ (16 )Depreciation and corporate level items (3) (797 ) $ (842 )Pro Forma Expenses - All Owned Hotels $ 3,667 $ 3,853
All Owned Hotel Pro Forma EBITDA $ 1,510 $ 1,495
Schedule of All Owned Hotel Pro Forma Results for 2019 and 2017

56
Schedule of All Owned Hotel Pro Forma Results for 2019 and 2017
COMPANY OVERVIEW
RECENTPROGRESS
PORTFOLIO UPDATE
GROWTH OPPORTUNITIES
CORPORATE RESPONSIBILITY
RECONCILIATIONS & SUPPLEMENTAL INFO
A-142022 Host Hotels & Resorts, Inc.
The following tables present the calculations of per key amounts for the full Host portfolio:
20192019 February 16, 2022 Portfolio
Net income (in millions) $ 932 All Owned Hotel Pro Forma EBITDA (in millions) $ 1,510Number of rooms 43,964 Number of rooms 43,964Net income/key $ 21,000 EBITDA/Key $ 34,000
20172017 December 31, 2017 Portfolio
Net income (in millions) $ 571 All Owned Hotel Pro Forma EBITDA (in millions) $ 1,495Number of rooms 52,560 Number of rooms 52,560Net income/key $ 11,000 EBITDA/Key $ 28,000

57
The following table reconciles net income to all owned hotel pro forma EBITDA for 2019 by geographic location, for hotels owned as of February 16, 2022(1) (in millions)
Schedule of Net Income to All Owned Hotel Pro Forma EBITDA by Location
COMPANY OVERVIEW
RECENTPROGRESS
PORTFOLIO UPDATE
GROWTH OPPORTUNITIES
CORPORATE RESPONSIBILITY
RECONCILIATIONS & SUPPLEMENTAL INFO
A-15
(1) Results exclude AC Hotel Scottsdale North, a new development that opened in January 2021, and The Laura Hotel in Houston, which re-opened under new management in November 2021.
2022 Host Hotels & Resorts, Inc.
Year ended December 31, 2019
LocationHotel Net Income(2)
Acquisitions and Dispositions
Adjusted Hotel Net Income(2)
Plus: Depreciation
Plus: Interest Expense(2)
Less:Income
tax(2)Equals: Hotel
EBITDAPercent of Total
EBITDAMaui/Oahu $ 89.2 $ 0.9 $ 90.1 $ 45.3 $ — $ — $ 135.4 9 %Florida Gulf Coast 69.3 — 69.3 34.7 — — 104.0 7 %New York 39.1 2.9 42.0 50.4 — — 92.4 6 %Jacksonville 25.0 — 25.0 9.1 — — 34.1 2 %San Francisco/San Jose 95.2 (6.7 ) 88.5 64.0 — — 152.5 10 %Washington, D.C. (CBD) 60.9 — 60.9 39.3 — — 100.2 7 %Seattle 14.2 — 14.2 16.1 — — 30.3 2 %Los Angeles/Orange County 42.1 (23.5 ) 18.6 13.0 — — 31.6 2 %Boston 57.0 (25.2 ) 31.8 14.7 — — 46.5 3 %San Diego 81.4 (4.5 ) 76.9 68.8 — — 145.7 10 %Philadelphia 15.3 — 15.3 12.8 — — 28.1 2 %Chicago 18.2 (1.4 ) 16.8 22.6 — — 39.4 3 %Phoenix 49.8 (8.0 ) 41.8 49.5 — — 91.3 6 %Atlanta 34.0 (17.0 ) 17.0 8.0 — — 25.0 2 %Denver 14.0 — 14.0 16.1 — — 30.1 2 %New Orleans 26.3 — 26.3 10.6 — — 36.9 2 %Northern Virginia 22.4 (8.2 ) 14.2 11.9 — — 26.1 2 %San Antonio/Austin 16.5 24.3 40.8 23.2 — — 64.0 4 %Houston 13.4 — 13.4 19.6 — — 33.0 2 %Orlando 48.3 19.3 67.6 40.0 — — 107.6 7 %Miami 37.2 — 37.2 20.7 — — 57.9 4 %Other 43.0 (11.5 ) 31.5 31.2 — — 62.7 4 %International 14.7 — 14.7 10.0 — — 24.7 2 %
Total $ 926.5 $ (58.6 ) $ 867.9 $ 631.6 $ — $ — $ 1,499.5 100 %Operations for
acquired andsold hotels — 58.6 23.8 — — 82.4
Gain on sale ofproperty andcorporate levelincome/expense 5.5 5.5 6.5 222.4 29.5 263.9
Total $ 932.0 $ 932.0 $ 661.9 $ 222.4 $ 29.5 $ 1,845.8___________

58
Acquisitions & Dispositions Metrics
COMPANY OVERVIEW
RECENTPROGRESS
PORTFOLIO UPDATE
GROWTH OPPORTUNITIES
CORPORATE RESPONSIBILITY
RECONCILIATIONS & SUPPLEMENTAL INFO
A-162022 Host Hotels & Resorts, Inc.
(1) 2021 Acquisitions include seven hotels acquired since January 1, 2021, through February 16, 2022. The Hyatt Regency Austin, Four Seasons Resort Orlando at Walt Disney World® Resort and Hotel Van Zandt use full year 2019 results. Baker’s Cay Resort Key Largo and Alila Ventana Big Sur are based on 2021 forecast operations at acquisition, as the hotels experienced renovation disruption and closures in 2019. The Laura Hotel is based on estimated normalized results, which assumes a new manager, brand and operations in line with the 2019 results of comparable Houston properties. The Alida, Savannah is based on estimated normalized 2019 results, adjusting for construction disruption to the surrounding Plant Riverside District and for initial ramp-up of hotel operations. Due to the impact of COVID-19, results in 2020 are not reflective of normal operations of the hotels. Any forecast incremental increases to net income compared to net income at underwriting would be equal to the incremental increases in Hotel EBITDA. Some operating results are based on actual results from the manager for periods prior to our ownership. Since the operations include periods prior to our ownership, the results may not necessarily correspond to our actual results.
(2) The pro forma adjustment to net income is to account for Host’s ownership, which results in a depreciation expense assuming Host acquired the hotel on January 1 of the respective year.
The following table reconciles net income (loss) to Hotel EBITDA for the 2021 hotel acquisitions, as well as the per key amounts (in millions, except for room count, multiples and per key):
The following table reconciles net income to Hotel EBITDA for the 2021 hotel acquisitions, based on the estimated stabilization date for each hotel (in millions except for room count and multiples):
(1) The pro forma adjustment to net income is to account for Host’s ownership, which results in a depreciation expense assuming Host acquired the hotel on January 1 of the respective year.
HotelNo. of
RoomsPurchase
PriceHotel NetIncome(2) Plus: Depreciation(2) Equals: Hotel EBITDA
Net income multiple
EBITDA multiple
Net income per key
EBITDA per key
Hyatt Regency Austin 448 $ 161 $ 13.6 $ 4.6 $ 18.2 12x 8.8x $ 30,500 $ 40,700Four Seasons Resort Orlando at Walt Disney World® Resort 444 $ 610 $ 19.3 $ 16.9 $ 36.2 32x 16.8x $ 43,500 $ 81,500Baker's Cay Resort 200 $ 200 $ 8.7 $ 5.1 $ 13.8 23x 14.5x $ 43,500 $ 69,000The Laura Hotel 223 $ 65 $ 4.9 $ 2.1 $ 7.0 13x 9.2x $ 22,000 $ 31,400Alila Ventana Big Sur 59 $ 150 $ 10.4 $ 5.7 $ 16.1 14x 9.3x $ 177,000 $ 272,900Alida Savannah 173 $ 103 $ 5.1 $ 3.4 $ 8.5 20x 12.1x $ 29,500 $ 49,300Hotel Van Zandt 319 $ 242 $ 10.8 $ 7.5 $ 18.3 22x 13.2x $ 34,000 $ 57,2002021 Acquisitions(1) 1,866 $ 1,531 $ 72.8 $ 45.3 $ 118.1 21x 13.0x $ 39,000 $ 63,300
HotelNo. of
RoomsPurchase
PriceHotel Net Income(1) Plus: Depreciation(1) Equals: Hotel EBITDA
Net income multiple
EBITDA multiple
Net income per key
EBITDA per key
Hyatt Regency Austin 448 $ 161 $ 13.6 $ 4.6 $ 18.2 12x 9x $ 30,500 $ 40,600Four Seasons Resort Orlando at Walt Disney World® Resort 444 $ 610 $ 33.1 $ 16.9 $ 50.0 18x 12x $ 74,500 $ 112,600Baker's Cay Resort 200 $ 200 $ 10.0 $ 5.1 $ 15.1 20x 13x $ 50,000 $ 75,500The Laura Hotel 223 $ 65 $ 5.6 $ 2.1 $ 7.7 12x 8x $ 25,000 $ 34,500Alila Ventana Big Sur 59 $ 150 $ 10.4 $ 5.7 $ 16.1 14x 9x $ 176,500 $ 272,900The Alida, Savannah 173 $ 103 $ 5.7 $ 3.4 $ 9.1 18x 11x $ 33,000 $ 52,400Hotel Van Zandt 319 $ 242 $ 15.3 $ 7.5 $ 22.8 16x 11x $ 48,000 $ 71,5002021 Acquisitions 1,866 $ 1,531 $ 93.7 $ 45.3 $ 139.0 16x 11x $ 50,000 $ 74,500

59
Acquisitions & Dispositions Metrics
COMPANY OVERVIEW
RECENTPROGRESS
PORTFOLIO UPDATE
GROWTH OPPORTUNITIES
CORPORATE RESPONSIBILITY
RECONCILIATIONS & SUPPLEMENTAL INFO
A-172022 Host Hotels & Resorts, Inc.
(1) 2018-2022 Acquisitions include 11 properties and two Kaanapali golf courses acquired since January 1, 2018, through February 16, 2022. Baker’s Cay Resort Key Largo and Alila Ventana Big Sur are based on 2021 forecast operations at acquisition, as the hotels experienced renovation disruption and closures in 2019. The Laura Hotel is based on estimated normalized results, which assumes results are in-line with the 2019 results of comparable Houston properties, as the property was re-opened with a new manager and brand in 2021. The Alida, Savannah is based on estimated normalized 2019 results, adjusting for construction disruption to the surrounding Plant Riverside District and for initial ramp-up of hotel operations. The other seven properties and Ka’anapali golf courses use full year 2019 results. Due to the impact of COVID-19, results in 2020 are not reflective of normal operations of the hotels. Any forecast incremental increases to net income compared to net income at underwriting would be equal to the incremental increases in Hotel EBITDA. Some operating results are based on actual results from the manager for periods prior to our ownership. Since the operations include periods prior to our ownership, the results may not necessarily correspond to our actual results.
(2) 2018-2022 Dispositions include the sale of 26 hotels since January 1, 2018, through February 16, 2022, as well as the sale of the European Joint Venture and the New York Marriott Marquis retail, theater and signage commercial condominium units. European Joint Venture balances included in this total represent our approximate 33% previous ownership interest, except for the number of rooms of 4,335, which represents the total room count of the European Joint Venture properties. The 2018 and 2019 dispositions use trailing twelve-month results from the disposition date, while the 2020, 2021 and 2022 dispositions use 2019 full year results as the TTM is not representative of normalized operations. For 2018-2022 YTD dispositions, combined avoided capital expenditures over the 5 years following the disposition dates totaled $793 million. For 2021-2022 YTD dispositions, combined avoided capital expenditures over the 5 years following the disposition dates totaled $290 million.
(3) Certain items from our statement of operations are not allocated to individual properties, including interest on our senior notes, corporate and other expenses, and the benefit (provision) for income taxes.
The following tables reconcile net income to Hotel EBITDA for the 2018-2022 acquisitions and dispositions (in millions except for room count and multiples:
The following tables reconcile net income to Hotel EBITDA for the W Hollywood and Sheraton Boston (in millions, except for room count and multiples):
(1) Certain items from our statement of operations are not allocated to individual properties, including interest on our senior notes, corporate and other expenses, and the benefit (provision) for income taxes.
Hotel No. of Rooms Purchase Price Hotel Net Income(3) Plus: Depreciation Equals: Hotel EBITDANet income
multipleEBITDA
multiple2018-2022 YTD Acquisitions (1) 3,743 $ 3,169 $ 140.6 $ 92.8 $ 233.4 23x 14x2021-2022 YTD Acquisitions (1) 1,866 $ 1,559 $ 73.7 $ 46.0 $ 119.7 21x 13x
Hotel No. of RoomsPurchase
PriceHotel Net Income
(Loss) Plus: Depreciation(3)Plus: Interest
ExpensePlus: Income
Tax
Equals: Hotel
EBITDANet income
multipleEBITDA
multiple
2018-2022 YTD Dispositions (2) 16,491 $ 4,453 $ 157.9 $ 142.7 $ 10.4 $ 2.3 $ 313.3 28.2x 16.7x
2021-2022 YTD Dispositions (2) 3,848 $ 981 $ 40.2 $ 42.3 $ - $ - $ 82.5 24.4x 15.4x
Hotel No. of Rooms Purchase Price Hotel Net Income(1) Plus: Depreciation Equals: Hotel EBITDANet income
multipleEBITDA
multipleW Hollywood 305 $ 197 $ 1.4 $ 7.8 $ 9.2 142x 25.0x
Hotel No. of Rooms Purchase Price Hotel Net Income(1) Plus: Depreciation Equals: Hotel EBITDANet income
multipleEBITDA
multipleSheraton Boston 1,220 $ 233 $ 12.8 $ 13.2 $ 26.0 18x 14.2x