hu- the orbitrap a new mass spectrometer, 2005
DESCRIPTION
Scientific paper related to Mass spectrometryTRANSCRIPT

JOURNAL OF MASS SPECTROMETRYJ. Mass Spectrom. 2005; 40: 430–443Published online in Wiley InterScience (www.interscience.wiley.com). DOI: 10.1002/jms.856
SPECIAL FEATURE:PERSPECTIVE
The Orbitrap: a new mass spectrometer
Qizhi Hu,a Robert J. Noll,a Hongyan Li,a Alexander Makarov,b Mark Hardmanc
and R. Graham Cooksa∗
a Purdue University, Chemistry Department, West Lafayette, IN 47907, USAb Thermo Electron (Bremen), Hanna-Kunath-Str. 11, Bremen 28199, Germanyc Thermo Electron (San Jose) 355 River Oaks Parkway, San Jose, CA 95134 USA
Received 4 February 2005; Accepted 15 March 2005
Research areas such as proteomics and metabolomics are driving the demand for mass spectrometersthat have high performance but modest power requirements, size, and cost. This paper describes suchan instrument, the Orbitrap, based on a new type of mass analyzer invented by Makarov. The Orbitrapoperates by radially trapping ions about a central spindle electrode. An outer barrel-like electrode iscoaxial with the inner spindlelike electrode and mass/charge values are measured from the frequency ofharmonic ion oscillations, along the axis of the electric field, undergone by the orbitally trapped ions. Thisaxial frequency is independent of the energy and spatial spread of the ions. Ion frequencies are measurednon-destructively by acquisition of time-domain image current transients, with subsequent fast Fouriertransforms (FFTs) being used to obtain the mass spectra.
In addition to describing the Orbitrap mass analyzer, this paper also describes a complete Orbitrap-based mass spectrometer, equipped with an electrospray ionization source (ESI). Ions are transferredfrom the ESI source through three stages of differential pumping using RF guide quadrupoles. The thirdquadrupole, pressurized to less than 10−3 Torr with collision gas, acts as an ion accumulator; ion/neutralcollisions slow the ions and cause them to pool in an axial potential well at the end of the quadrupole. Ionbunches are injected from this pool into the Orbitrap analyzer for mass analysis. The ion injection processis described in a simplified way, including a description of electrodynamic squeezing, field compensationfor the effects of the ion injection slit, and criteria for orbital stability. Features of the Orbitrap at its presentstage of development include high mass resolution (up to 150 000), large space charge capacity, high massaccuracy (2–5 ppm), a mass/charge range of at least 6000, and dynamic range greater than 10.3
Applications based on electrospray ionization are described, including characterization of transition-metal complexes, oligosaccharides, peptides, and proteins. Use is also made of the high-resolutioncapabilities of the Orbitrap to confirm the presence of metaclusters of serine octamers in ESI mass spectraand to perform H/D exchange experiments on these ions in the storage quadrupole. Copyright 2005 JohnWiley & Sons, Ltd.
KEYWORDS: high resolution; Fourier transform mass spectrometry (FT-MS); proteomics; metabolomics; novel massanalyzers; electrospray ionization; serine octamer
INTRODUCTION
Need for high performance instrumentationA major driving force for innovation in mass spectrometryin the past few decades has been the needs of bioanalytical
ŁCorrespondence to: R. Graham Cooks, Chemistry Department,Purdue University, 560 Oval Drive, West Lafayette, IN47907-2084, USA. E-mail: [email protected]/grant sponsor: National Science Foundation;Contract/grant number: CHE-0216239.Contract/grant sponsor: Office of Naval Research.Contract/grant sponsor: Thermo Electron Corporation.
chemistry. Genomics, proteomics, and metabolomics increas-ingly require the analysis of extremely complex mixtures,such as whole-cell lysates, and detection of analytes of a widevariety of types over a wide range of concentrations—fromhormones and growth regulators present at pmole/L levelsto ubiquitous as well as rare low copy number proteins. Thesechallenges increasingly demand instruments with better per-formance characteristics including resolution, mass accuracy,dynamic range, and tandem mass spectrometry capabilities.They are also forcing the introduction of new analyticalcriteria involving multiplexing, differential measurements,data-dependent data acquisition, and automation.
Copyright 2005 John Wiley & Sons, Ltd.

The orbitrap: a new mass spectrometer 431
Mass spectrometric analysis of complex mixtures forparticular analytes is often facilitated by tandem or multiple-stage mass spectrometry (MSn) as well as by high-resolution/high-mass accuracy measurements. The value ofmultiple-stage mass spectrometry is well established, bothfor characterization of particular compounds using prod-uct ion scans and for recognizing members of classes ofcompounds using neutral loss1 or gain scans,2 and precursorion scans.3 Methods like collision-induced dissociation (CID)and surface-induced dissociation (SID) are needed to activatemolecular ions to generate characteristic fragments in theseMS/MS experiments. Characteristic fragments are essentialfor establishing amino acid or sugar sequences and therebyallowing the inference of peptide, protein, or glycoproteinstructures.4,5
Accurate mass measurement, coupled with sufficient res-olution, makes it possible to greatly restrict the enormousnumber of possible molecular formulas that might be repre-sented by a particular molecular mass. Mass measurementaccuracy of 10 ppm allows useful measurements of molec-ular formulas, although 1 to 2 ppm is preferable. Sub-ppmvalues are now provided by traditional double-focusingsector instruments in the peak matching experiment6 andby Fourier Transform-Ion Cyclotron Resonance (FT-ICR)instruments.7 Time-of-flight (TOF) mass spectrometers havebegun to provide 2 to 5 ppm accuracy.8,9 Quadrupole iontrap mass measurement accuracies are at best 20 ppm,10 asingular limitation on the value of these otherwise veryversatile devices.
Orbital trapping and Kingdon trapsMass spectrometry is unique among instrumental methodsof analysis in that several different physical principles formthe basis for its successful implementation.11,12 Mass/chargeanalysis can be based on the measurements of momentumin magnetic sector13 and kinetic energy in electrostaticsector instruments,14 path stability in linear quadrupoles,15
orbital frequency in both ion cyclotron resonance massspectrometers7,16,17 and quadrupole ion traps,18 and velocityin time-of-flight instruments.19,20 Each method has its ownstrengths and weaknesses. Analyzers can be grouped intoclasses on the basis of many properties, including ionbeam versus ion-trapping types, continuous versus pulsedanalysis, operation using low versus high translationalenergy ions, and on the basis of the time scale of the analysisand the pressure required for optimum performance.
The Orbitrap mass analyzer, the subject of this paper,bears a similarity to an earlier ion storage device, theKingdon trap, as well as to two types of ion-trappingmass analyzers, the Paul trap (quadrupole ion trap), andthe Fourier transform ion cyclotron resonance instrument.The first step in the set of inventions that led to the Orbitrapwas the implementation of orbital trapping, a method ofion trapping, which can itself be used for mass analysis.The Kingdon trap, named after its inventor,21 utilizes apurely electrostatic field for ion trapping, using neithermagnetic nor dynamic (RF) electric fields. It consists of athin-wire central electrode, an electrically isolated coaxialouter cylindrical electrode, and two endcap electrodes. A DC
voltage is applied between the outer and inner electrodes,producing a radial logarithmic potential between the twoelectrodes.
D A lnr C B �1�
Here r is the radial coordinate, and A and B are constants.The axial field component due to the endcap electrodes andcross-terms between r and z are neglected in Eqn 1. If ions arecreated inside the trap, or introduced into it with a velocityperpendicular to the wire electrode, those with appropriateperpendicular velocities will move in stable orbits aroundthe central electrode. Application of a potential to the endcapelectrodes can be used to achieve simultaneous ion trappingin the axial direction. The Kingdon trap has been used tostudy molecular beams22 and to develop the orbitron ionpump.23 It has been used widely for trapping ions in studiesof ion optical spectroscopy.24,25 Trapping times of a fewseconds for singly charged molecular ions can be achievedin the Kingdon trap.
In 1981, Knight modified the shape of the outer electrodeof a Kingdon trap to produce an axial quadrupole term,in addition to the radial logarithmic term, in the electricpotential.26 The pure quadrupole potential, for example, in aquadrupole ion trap (QIT), is18
D A�z2 —r2/2� �2�
The modified potential for Knight’s quadrupole/King-don trap is approximately represented by Eqn 3.
D A�z2 —r2/2 C B lnr� �3�
Here, r and z represent the cylindrical coordinates (theplane of symmetry of the potential is z D 0), while A andB are constants associated with the particular Kingdon trapgeometry and the applied voltages. The logarithmic potentialbetween the outer and central electrodes provides orbital iontrapping in the radial direction, as in the traditional Kingdontrap, while the quadrupolar potential confines ions axially,allowing them to undergo harmonic oscillation in the z-direction. Quadro-logarithmic fields have been used prior tothis by others in energy analyzers27 and proposed for use intime-of-flight mass analyzers.28
Knight used the trap to monitor ions produced bypulsed laser ablation of solid targets. The outer electrodewas split at the middle (z D 0), allowing ions to beinjected into the trap. The device could be used to monitortrapped ions by (i) measuring the time-dependent ion currentdue to continuous axial loss, or (ii) pulsing the centralwire electrode positive and collecting the radially ejectedions. The axial potential is harmonic; so applying an ACfrequency between the split outer electrodes allowed theobservation of resonances in both the axial and radial ionsignals. However, in both cases, observed resonances wereconsiderably weaker, broadened, and shifted in frequencycompared to those observed in a pure quadrupole iontrap. No mass spectra were reported for the device. Knightproposed that the central wire might distort the quadrupolarnature of the axial potential, which suggests that additional
Copyright 2005 John Wiley & Sons, Ltd. J. Mass Spectrom. 2005; 40: 430–443
432 Q. Hu et al.
cross-terms in r and z may be needed in Eqn. 1 to fullydescribe the potential. Other modified Kingdon traps havealso been reported, including a version with two parallelwires29 and another modification known as the ‘dynamicKingdon trap’,30 involving superimposing an AC voltageonto the DC potential to improve trapping efficiency.
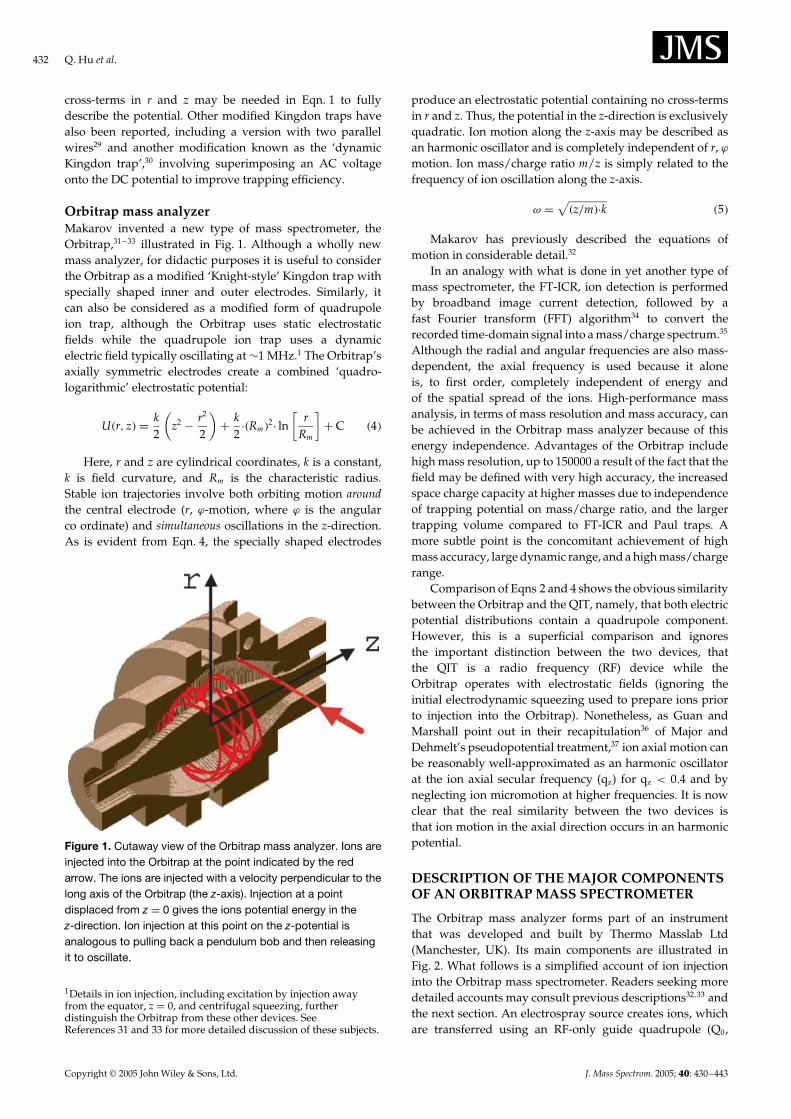
Orbitrap mass analyzerMakarov invented a new type of mass spectrometer, theOrbitrap,31 – 33 illustrated in Fig. 1. Although a wholly newmass analyzer, for didactic purposes it is useful to considerthe Orbitrap as a modified ‘Knight-style’ Kingdon trap withspecially shaped inner and outer electrodes. Similarly, itcan also be considered as a modified form of quadrupoleion trap, although the Orbitrap uses static electrostaticfields while the quadrupole ion trap uses a dynamicelectric field typically oscillating at ¾1 MHz.1 The Orbitrap’saxially symmetric electrodes create a combined ‘quadro-logarithmic’ electrostatic potential:
U�r, z� D k2
(z2 � r2
2
)C k
2�Rm�2Рln
[r
Rm
]C C �4�
Here, r and z are cylindrical coordinates, k is a constant,k is field curvature, and Rm is the characteristic radius.Stable ion trajectories involve both orbiting motion aroundthe central electrode (r, ϕ-motion, where ϕ is the angularco ordinate) and simultaneous oscillations in the z-direction.As is evident from Eqn. 4, the specially shaped electrodes
Figure 1. Cutaway view of the Orbitrap mass analyzer. Ions areinjected into the Orbitrap at the point indicated by the redarrow. The ions are injected with a velocity perpendicular to thelong axis of the Orbitrap (the z-axis). Injection at a pointdisplaced from z D 0 gives the ions potential energy in thez-direction. Ion injection at this point on the z-potential isanalogous to pulling back a pendulum bob and then releasingit to oscillate.
1Details in ion injection, including excitation by injection awayfrom the equator, z D 0, and centrifugal squeezing, furtherdistinguish the Orbitrap from these other devices. SeeReferences 31 and 33 for more detailed discussion of these subjects.
produce an electrostatic potential containing no cross-termsin r and z. Thus, the potential in the z-direction is exclusivelyquadratic. Ion motion along the z-axis may be described asan harmonic oscillator and is completely independent of r, ϕmotion. Ion mass/charge ratio m/z is simply related to thefrequency of ion oscillation along the z-axis.
ω D√
�z/m�Ðk �5�
Makarov has previously described the equations ofmotion in considerable detail.32
In an analogy with what is done in yet another type ofmass spectrometer, the FT-ICR, ion detection is performedby broadband image current detection, followed by afast Fourier transform (FFT) algorithm34 to convert therecorded time-domain signal into a mass/charge spectrum.35
Although the radial and angular frequencies are also mass-dependent, the axial frequency is used because it aloneis, to first order, completely independent of energy andof the spatial spread of the ions. High-performance massanalysis, in terms of mass resolution and mass accuracy, canbe achieved in the Orbitrap mass analyzer because of thisenergy independence. Advantages of the Orbitrap includehigh mass resolution, up to 150000 a result of the fact that thefield may be defined with very high accuracy, the increasedspace charge capacity at higher masses due to independenceof trapping potential on mass/charge ratio, and the largertrapping volume compared to FT-ICR and Paul traps. Amore subtle point is the concomitant achievement of highmass accuracy, large dynamic range, and a high mass/chargerange.
Comparison of Eqns 2 and 4 shows the obvious similaritybetween the Orbitrap and the QIT, namely, that both electricpotential distributions contain a quadrupole component.However, this is a superficial comparison and ignoresthe important distinction between the two devices, thatthe QIT is a radio frequency (RF) device while theOrbitrap operates with electrostatic fields (ignoring theinitial electrodynamic squeezing used to prepare ions priorto injection into the Orbitrap). Nonetheless, as Guan andMarshall point out in their recapitulation36 of Major andDehmelt’s pseudopotential treatment,37 ion axial motion canbe reasonably well-approximated as an harmonic oscillatorat the ion axial secular frequency (qz) for qz < 0.4 and byneglecting ion micromotion at higher frequencies. It is nowclear that the real similarity between the two devices isthat ion motion in the axial direction occurs in an harmonicpotential.
DESCRIPTION OF THE MAJOR COMPONENTSOF AN ORBITRAP MASS SPECTROMETER
The Orbitrap mass analyzer forms part of an instrumentthat was developed and built by Thermo Masslab Ltd(Manchester, UK). Its main components are illustrated inFig. 2. What follows is a simplified account of ion injectioninto the Orbitrap mass spectrometer. Readers seeking moredetailed accounts may consult previous descriptions32,33 andthe next section. An electrospray source creates ions, whichare transferred using an RF-only guide quadrupole (Q0,
Copyright 2005 John Wiley & Sons, Ltd. J. Mass Spectrom. 2005; 40: 430–443

The orbitrap: a new mass spectrometer 433
Figure 2. The experimental Orbitrap mass spectrometer. Ions are produced by the electrospray ion source at the extreme left. Ionsthen proceed through the source, collision quadrupole, selection quadrupole and then pass into the storage quadrupole. Thestorage quadrupole serves as an ion accumulator and buncher, allowing a pulsed mass analyzer such as the Orbitrap to be coupledto a continuous source like an electrospray ionization source. After accumulation and bunching in the storage quadrupole, the exitlens (‘Lens 1’) is pulsed low, the ion bunches traverse the ion transfer lens system and are injected into the Orbitrap mass analyzer(shown end-on).
2.5 MHz, Vop D 0.1–1 kV) into a transport quadrupole (Q1,920 kHz, Vop D ¾300 V). These two quadrupoles bringthe ions through several stages of differential pumpingfrom the atmospheric pressure ion source. The ions thenproceed into a linear quadrupole ion trap (linear Paul trap,Q2, 3.45 MHz, Vop D 3700 V) or ‘storage quadrupole’. Thestorage quadrupole is required to couple the continuouselectrospray ion source with the Orbitrap, which operates ina pulsed fashion.
A ring placed over the end of the storage quadrupolerods can be biased by a DC offset, thereby creating a smallaxial potential well inside the storage quadrupole. Ions sufferjust enough collisions with the bath gas (¾10�4 Torr) to causethem to slow down and ‘pool’ in the axial well as packets ofions of small spatial extent (few mm). After a sufficientnumber of ions has been accumulated (typically taking10–400 ms), the back lens of the storage quadrupole is pulsedopen. This creates a strong electric field along the axis of thestorage quadrupole, causing rapid extraction of the pooledions, and delivering ion packets with remarkably smalltemporal (100–200 ns) and spatial spread at the entrance tothe Orbitrap.33,38 Ions are accelerated through an ion opticaldeflection lens system and delivered to the entrance channel.Injection of ions into the Orbitrap analyzer is accomplishedby switching the voltage applied to the deflector lens locatedon the Orbitrap circumference to an appropriate value.
Once injected into the Orbitrap at a position offset fromits equator (z D 0), these ion bunches start coherent axialoscillations without the need for any additional excitation.All ions have exactly the same amplitude, although ionpackets of different mass/charge ratios will execute theiraxial oscillations at their respective frequencies, as givenby Eqn. 5. The detection of an ion image current due tomotion along the Orbitrap axis is only possible so long asthe ion packets retain their spatial coherence (viz., phasecoherence and small spatial extent) in the axial direction.32
The outer electrode is split in half at z D 0, allowing theion image current due to axial motion to be collected. The
current is differentially amplified from each half of the outerelectrode and then undergoes analog-to-digital conversionbefore processing and collection by customized control andacquisition software (Orbitrap Tune Program, Mike Senko,Thermo Electron, San Jose, CA). Further processing is doneby the MIDAS data analysis program.34 The Orbitrap usedfor these experiments is smaller than those used in previousexperiments.32,33 The largest diameter of the inner electrodeis 8 mm; the largest diameter of the inner surface of the outerelectrode is 20 mm.
Data are collected for up to 1600 ms, after an initial delayof ¾100 ms to allow sufficient time for the stabilization of thehigh-voltage amplifier supplying the voltage to the centralelectrode. The acquired time-domain signal takes the formof a ‘transient’. An example of the transient used to recorda spectrum showing the 5C, 4C, and 3C ions of bovineinsulin appears in Fig. 3. Ion collisions with backgroundgas molecules, even at the ultra high vacuum levels in theOrbitrap (2 ð 10�10 mbar), result in ion packet dephasing(loss of phase coherence), or ion loss from the trap, or both,eventually causing a decrease in the signal intensity of thetransient. Space charge may also play a small role in ionpacket dephasing. The transient is then Fourier-transformedusing the program MIDAS34 to create a mass spectrum (seethe following text for examples).
ION MOTION IN THE ORBITRAPINSTRUMENT
Preparation of the ion packetCapture of ions by the gas-filled storage quadrupole proceedsin a manner similar to that which occurs in other lineartraps.39,40 Ions enter the storage quadrupole and lose theirenergy in collisions with gas molecules, thereby becomingunable to escape. One of the novel features of this setuprelative to previous experiments33 is the ability to maintainboth the ion source and the Orbitrap at near-ground potentialwhile at the same time accelerating ions to >1 keV in
Copyright 2005 John Wiley & Sons, Ltd. J. Mass Spectrom. 2005; 40: 430–443

434 Q. Hu et al.
Expansion Plot
Bovine insulin single spectrum
Time, ms
Time, ms
Sig
nal (
Raw
)S
igna
l (R
aw)
0.0 200.0 400.0
610.00 620.00 630.00 640.00 650.00 660.00 670.00
600.0 800.0 1000.0 1200.0 1400.0 1600.0
5000.0
-5000.0
0.0
8192.0
-8192.0
4915.2
-4915.2
1638.4
-1638.4
(a)
(b)
Figure 3. (a) Typical transient acquired to record the mass spectrum of bovine insulin. The transient acquired is equivalent to the freeinduction decay of FT NMR experiments. Top shows an expanded portion of the transient.
U
x
Sag from ringelectrode
Potentialbarrier formed
by Lens 1
Potential barrierformed by
Intermediate lens
Ions fromthe source
Ions tothe Orbitrap
Figure 4. Schematic of energy lift of the storage quadrupole. Axial voltage distribution during ion capture is denoted by the solid lineand after the energy lift by the dotted line. For ion extraction, the voltage on Lens 1 is pulsed down forming the voltage distributionindicated by the dashed line.
between. This is achieved by using a so-called ‘energy lift’illustrated in Fig. 4. Its operation is based on the fact thatwhile ions are stored inside the storage quadrupole, theystay ‘unaware’ of outside voltages. Therefore, a slow (over20–50 ms) and synchronous increase of the DC offset of thestorage quadrupole and the intermediate lens voltage doesnot affect ion trapping as long as ions are still being repelledby the high voltage applied on Lens 1. After Lens 1 is pulsedopen, ions are able to ‘roll down’ from the new level towardsthe Orbitrap at near-ground potential, thus acquiring thenecessary energy for ion injection and orbital trapping.
Another distinctive feature of this setup is the use ofa static voltage on the ring electrode to form a miniaturepotential well near the exit of the storage quadrupole. Withthin edges of the ring electrode protruding prominently
between the round rods of the storage quadrupole, anyvoltage difference between the ring and the rods resultsin a 3D potential distribution being added to the overallquadrupolar field. When the DC offset of the storagequadrupole exceeds the voltage on the ring electrode, this3D potential distribution leads to a localized potential wellalong the axis of the storage quadrupole, the maximumaxial sag being approximately equal to 1% of the voltagedifference (up to 10–15 V in the current setup). This potentialwell appears and deepens in the later stages of energylift, becoming the lowest point on the potential energysurface seen by the ions. In the presence of collisiongas, ions tend to concentrate near the bottom of thispotential well while they remain confined radially by theRF field applied to the rods. In the last moments before
Copyright 2005 John Wiley & Sons, Ltd. J. Mass Spectrom. 2005; 40: 430–443

The orbitrap: a new mass spectrometer 435
extraction, ions form dense and compact packets, as in Paultraps.
Ion extraction and transport to the OrbitrapPulsed extraction of ions follows the earlier description.33
Stored ions are extracted by supplying a negative voltagepulse to Lens 1 (Fig.2). Lens 1 also forms a differentialpumping aperture, while the length of the ion path fromthe initial location in the potential well to the exit fromLens 1 within the gas-filled storage quadrupole does notexceed 5–8 mm. Therefore, the probability of collisionsand collision-induced dissociation during ion extractionis relatively low. Further lenses perform the final spatialfocusing of the ion beam into the entrance of the Orbitrap.Lens 3 also produces a reduction of gas load by eliminatingdirect gas transport. The latter effect relates to the collision-free penetration of residual gas molecules from the storagequadrupole into the Orbitrap along the line of sight. Atthe short distances employed, this effect might have easilybecome the main source of ion scattering inside the Orbitrap.This effect is eliminated by directing the ion beam along anS-shaped path between two symmetrical deflectors, therebyblocking the line of sight.
Ion capture and squeezing in the OrbitrapBecause of the fast pulsing of ions from the storagequadrupole, ions of each mass/charge ratio arrive at theentrance of the Orbitrap as short packets only few millimeterslong. For each mass/charge population, this corresponds to aspread of flight times of only a few hundred nanoseconds formass/charge ratios of a few hundred Daltons/charge. Suchdurations are considerably shorter than a half-period of axialion oscillation in the trap. When ions are injected into theOrbitrap at a position offset from its equator (Fig. 5), thesepackets start coherent axial oscillations without the need forany additional excitation.
Linear quadrupole ion traps have been used forion packet injection into quadrupole ion traps,41 Fouriertransform-ion cyclotron resonance,42 and time-of-flight massspectrometers,43 and three-dimensional quadrupole iontraps have been used to inject ions into ion mobilityspectrometers;44 however, ion packets in all these exam-ples are 2–3 orders of magnitude longer even for a singlem/z, and extraction and injection processes are much slower.The closest analog to fast injection into the Orbitrap is offered
Figure 5. Principle of electrodynamic squeezing of ions in theorbitrap as the field strength is increased.
by 3D quadrupole ion traps, when used to inject ions in-lineinto time-of-flight mass spectrometers.45
Evolution of ion packet during the increase of electricfield is shown schematically on Fig. 5. By the time injectedions approach the opposite electrode for the first time, theincreased electric field contracts the radius of the ion cloudby a few percent, the voltages having been so chosen toavoid collision with the electrode. A further increase of thefield continues to squeeze the trajectory closer to the axis,meanwhile allowing for newly arriving ions (normally, withhigher m/z) to enter the trap as well. After ions of all m/zvalues of interest have entered the Orbitrap and movedfar enough from the outer electrodes, the voltage on thecentral electrode is stabilized, and image current detectionmay take place. The rise-time of the field strength is selecteddepending on the mass range to be trapped and is usuallywithin 20–100 µs.
It should be noted that squeezing affects both radialand axial amplitudes of ions. Because of the difference inmoments of injection into the Orbitrap for ions of differentm/z, this results in slightly different final amplitudes ofrotation and axial oscillation.
Rotational motion and ion trappingThe rotational (r, ϕ) motion, although not used for massanalysis, is still important because the ions must be trappedradially. This motion, and its relationship to the ion kineticenergy, can be crudely understood if the Orbitrap is regardedas a ‘360° electrostatic analyzer’. In any electrostatic sector,ion motion along a circular trajectory is described by theequation46
r D 2 eV/eE �6�
where r is the radius of the electrostatic analyzer as well asthe radius of the ion trajectory through the analyzer, eV isthe ion’s kinetic energy, and eE is the force due to the electricfield (directed radially inward) experienced by the ion whiletraveling on the ion-optical axis. This equation is derivedby balancing centrifugal and centripetal forces acting onthe ion.46 Significantly, Eqn. 6 is independent of mass. Theelectric sector selects for ion kinetic energy provided thatthe sector radius, rE, is fixed, because when the strength ofthe electric field is set to a particular value, only ions of theappropriate energy, as given by Eqn. 6, will be transmittedthrough the sector.
Similarly, ion kinetic energy before injection into theOrbitrap must be suitably matched to the radial componentof the electric field to result in stable orbital motion. Makarovhas shown that stable ion motion results from nearly circularorbits with very small eccentricities.32 In a sense, every orbitaround the Orbitrap central electrode ‘analyzes’ the kineticenergy of the ion. This situation is somewhat analogous tothe Osaka MULTUM II TOF instrument. This instrumentconsists of four 157.1° electric sectors in a ‘cloverleaf’arrangement, allowing an arbitrary number of cycles throughthe sectors to be used to achieve the desired performance(e.g. resolution).47 – 49
Figure 6 depicts the Orbitrap functioning as a 360°
analyzer using SIMION simulations.50 Orbits are at constant
Copyright 2005 John Wiley & Sons, Ltd. J. Mass Spectrom. 2005; 40: 430–443

436 Q. Hu et al.
(a) (b) (c) (d)
Figure 6. Matching of incoming ion kinetic energy to the radial component of the Orbitrap electric potential. Ion trajectories areshown for z D 0. (a) Incoming ion kinetic energy poorly matched to the radial component of the electric field, resulting in a highlyeccentric, non-circular orbit. A few periods of the orbit, showing the rapid precession of perigee, are shown. (Trajectory trace linethickened to aid visibility). (b) Same incoming ion kinetic energy as in (a) but with hundreds of periods shown. Because of the largeeccentricity and precession of the orbit, the locus of orbits appears as a ‘fat doughnut’. (c) Ion kinetic energy (1620 eV) well matchedto radial component of the electric field. This orbit is nearly circular, resulting in a locus of orbits that appears as a thin ring.Thousands of periods are shown superimposed and a thin trajectory trace line used. (d) Locus of orbits of two ion kinetic energies,1570 and 1670 eV. Nearly circular orbits demonstrate the kinetic energy acceptance range of the Orbitrap.
axial position, z D 0, for singly charged ions of mass 609Da. The central electrode is set at �3400 V. Figure 6a showsthe first few orbits of an ion with kinetic energy 930 eV, avalue that is poorly matched to the radial field. The orbit ishighly elliptical, with the perigee (point of closest approachto the central electrode) precessing very rapidly. Figure 6bshows the same ion, but in an integrated view after hundredsof orbits, so that the accumulated orbits appear collectivelyas a fat doughnut surrounding the inner electrode. Figure 6cshows another ion whose kinetic energy, 1620 eV, is now wellmatched to the central electrode voltage. Figure 6c shows10–100 times more orbits than Fig. 6b, but 6c retains theappearance of a ‘thin ring’ because the ion kinetic energyis now matched to the ‘pass’ energy of the trap. The resultis nearly circular orbit trajectories, varying little from orbitto orbit, which fall atop one another. Figure 6d shows theloci of orbits for ions of the two kinetic energies of 1570and 1620 eV. Although clearly the orbits are not circular,they still have relatively small eccentricities, showing thatthe Orbitrap will be relatively tolerant of a range of incomingion kinetic energies. The fact that ions with a kinetic energydistribution have different orbits in the Orbitrap makes for alarger trapping volume and therefore increases space chargecapacity.
Axial ion motion and ion detectionDuring ion detection, both the central electrode and deflectorare maintained at very stable voltages so that no mass driftcan take place. The voltage on the deflector is switched toa level that minimizes ‘field sag’ caused by the injectionslot. This is necessary to ensure that all ions experiencethe harmonic axial potential in all parts of space, therebyminimizing differences in frequency for ions of a given m/zvalue.
As mentioned previously, stable ion trajectories withinthe Orbitrap combine axial oscillations with rotation aroundthe central electrode and vibrations in the radial direction(Fig. 1). For ions of any given m/z, only the frequency ofaxial oscillations is completely independent of initial ion
Figure 7. The approximate shape of ion packets of differentm/z after stabilization of voltages. The Orbitrap is shown incross-section along the z-axis. Ovals represent cross sectionsfor thin rings of ions of different m/z. The cross-sectional areais exaggerated for illustration purposes.
parameters,32 while rotational and radial frequencies exhibitstrong dependence on initial radius and energy. Therefore,ions of the same mass/charge ratio continue to oscillatealong z together, remaining in-phase for tens and hundredsof thousands of oscillations. Contrary to this, the frequenciesof radial and rotational motion will vary for ions withslightly different initial parameters, which means that inthe radial direction, ions dephase orders of magnitude fasterthan in the axial direction, and the process occurs in aperiod of only 50–100 oscillations. After radial dephasing,the ion packet of a given m/z (and kinetic energy) assumesthe shape of a thin ring, with ions uniformly distributedalong its circumference (Fig. 7). Consequently, oppositesections of this ring produce opposite image currents onthe outer electrodes that ultimately cancel each other out.Therefore, radial and rotational frequencies cannot appearin the measured spectrum in any form. Meanwhile, axialoscillations will persist, with axial thickness of the ion ringremaining small compared with the axial amplitude. Movingfrom one half outer electrode to the other, this ring will induceopposite currents on these halves, thus creating a signal thatis detected by differential amplification.
Copyright 2005 John Wiley & Sons, Ltd. J. Mass Spectrom. 2005; 40: 430–443

The orbitrap: a new mass spectrometer 437
Though initially small, the axial thickness of the ion ringwill grow very slowly because of miniscule imperfectionsof the Orbitrap shape. Also, ion collisions with backgroundgas molecules, even at the ultra high vacuum levels in theOrbitrap (2 ð 10�10 mbar), result in the loss of some ions,or at least displace them outside the initial ring. Spacecharge may also play a small role in mutual repulsion ofions within the ring and therefore in ion packet broadening.Ultimately, all these factors will result in the ion ring’s axialthickness becoming comparable with the amplitude of theaxial oscillations. Then, as for radial or rotational motion,image currents due to different parts of the ion ring will startto cancel each other out, thus reducing the intensity of thesignal until it is completely lost in the noise.
RESULTS
Performance characteristicsPerformance parameters used to characterize a mass spec-trometer include resolution, mass accuracy, mass range orupper mass limit, and ion dynamic range.8 Perhaps the moststriking aspect of the Orbitrap’s performance is the very highresolution obtained. For example, the electrospray ioniza-tion source (ESI) mass spectrum of bovine insulin is shownin Fig. 8. The main spectrum shows the mass region fromm/z 1000 to 2200. In addition to the prominent peaks dueto the three charge states of C3, C4, and C5, peaks due toUltramark oligomers, used as internal mass calibrants,51 arevisible, spaced by 100 mass/charge units. Close-ups above
the full spectrum display both the theoretically expected46
(upper traces, IsoPro 3.0, MS/MS Software52) and the exper-imental isotopic distributions (lower traces) for each of thecharge states. Agreement between the experimental andtheoretical distributions is reasonably good.
As another example of the resolution obtainable, Fig. 9presents the mass spectrum of the tetrapeptide Met-Arg-Phe-Ala (MRFA). The mass spectrum shows the mainisotopic peak at m/z = 524, with the first and secondisotopic peaks at 525 and 526. The inset shows a close-up of the second isotope peak at m/z 526, and itsresolution into two minority isotopomers (13C2 and34S). Thedifference of m/z 0.0109 between these two isotopomersrequires a minimum resolving power of 48 300. This highresolving power and ability to distinguish minor isotopes,coupled with high-mass accuracy, may greatly assist indetermining chemical formulas for peptides and otherspecies.
Another important performance characteristic of a massanalyzer is the upper mass limit. Shown in Fig. 10 is thenanospray mass spectrum of baker’s yeast (Saccharomycescerevisiae) alcohol dehydrogenase (ADH). Though not ofhigh quality, the spectrum compares favorably with thoserecorded using other types of mass spectrometers. The peakscorrespond to the C28, C27, C26, and C25 charge states ofADH tetramers.53,54 The mass spectrum shows the currentupper mass range for this instrument, albeit without thehigh resolution normally obtained at lower masses. Thelimitation in mass range at this point is most likely due
1,1491,1481,147
+5
1,4361,4351,434
+4
1,9141,9131,9121,911
+3
m/z
2,2002,0001,8001,6001,4001,200
Insulin
1,1491,1481,147
1,4361,4351,4341,433
1,9151,9141,9131,9121,9111,910 1,9151,9141,9131,9121,9111,910
+5
+4
+3
calc.
calc.
calc.
expt.
expt.
expt.
1,433
Figure 8. ESI mass spectrum of bovine insulin. Data acquisition parameters include a data sampling rate of 5 MHz, record lengthwas 8 million data points, and the Fourier transform was performed with no apodization function or zero-filling. The lower spectrumshows a wide range mass spectrum including the internal mass calibrant Ultramark 1621 whose oligomers are spaced by 100mass/charge unit intervals. Lower traces in the close-ups show experimentally obtained isotopic distributions for each charge state.Upper traces in the close-ups show the theoretically expected isotopic distributions. The calculated isotope distributions wereobtained from IsoPro 3.0 using Gussian peak shapes with resolution of 100 000.
Copyright 2005 John Wiley & Sons, Ltd. J. Mass Spectrom. 2005; 40: 430–443

438 Q. Hu et al.
34S
MRFA
526
526.28526.26526.24
13C2
∆m=0.0109
m/z
R ∼ 50,000
525524
Figure 9. ESI mass spectrum of the singly protonatedtetrapeptide MRFA. The inset shows the resolution of the twominority isotopomers at nominal m/z 526. The minor isotope34S is at m/z 526.2607, while the higher mass isotopecorresponding to 13C2 is at m/z 526.2716, a mass difference ofm/z 0.0109. The minimum resolving power needed to resolvethese peaks is 48 300.
4000 4500 5000 5000
m/z
Alcohol Dehydrogenase (ADH)
(ADH)427+
m/z =5466)(ADH)4
28+
m/z =5272(ADH)4
26+
m/z =5675
(ADH)425+
m/z =5903
6000 6500 7000
Figure 10. Nanospray mass spectrum of alcoholdehydrogenase (ADH) showing performance at highmass/charge ratio.
to poor high-mass transmission in the double orthogonalgeometry ion source rather than a limitation of the Orbitrapmass analyzer. Poor high-mass transmission in the sourceat least partly accounts for the relatively poor signal/noiseratio of this mass spectrum.
Mass measurement accuracies of 10 ppm or better canprovide useful information about possible analyte molecularformulas. The mass accuracy of the Orbitrap was assessed bymaking measurements of poly(ethylene glycol) oligomers.The oligomer at m/z 1075.648 was used as the internalmass calibration standard. Over the m/z range of 700to 1200, the average root-mean-square (RMS) deviation(theoretical mass vs experimentally measured mass) was2.1 ppm while the mean deviation was 1.7 ppm for a series
of five measurements. This result is robust; similar resultswere obtained on repeating this experiment under the sameor similar conditions on different occasions. Daily calibrationof the instrument was performed using just a single referenceion, either that of reserpine at m/z 609 or that of MRFA atm/z 541.
Also of interest is the mass accuracy observed for theinsulin mass spectrum shown in Fig. 8. Use of the ultramarkoligomers as mass calibrants using a linear calibrationover the range m/z 1121–2021 yielded an average RMSuncertainty in the insulin masses (all isotopomers) of 2.9 ppmfor the C5 charge state centered at m/z 1149, 1.5 ppm forthe C4 charge state at 1436, and 4.9 ppm for C3 at 1915.55
The larger deviation for the C3 charge state may be duepartly to its poor signal/noise characteristics. However,much better agreement is achieved if a linear calibrationis constructed using the lowest m/z insulin isotopomer inthe C5 charge state distribution (theoretical m/z 1148.491)and the highest m/z isotopomer observed in the C4 chargestate (m/z 1437.529). In that case, the RMS deviation becomes0.6 ppm for the C5 and 0.9 ppm for the C4 distribution.
The dynamic range has also been measured for theOrbitrap as a function of analyte (reserpine) concentration.The linear dynamic range is roughly 103 –104, correspondingto 0.5 to 500 ng/µL using a particular electrospray ion source(150 °C, 3000 V, 5 µL/min) and instrument parameters (fixed70 ms accumulation time in the storage quadrupole). Thiscompares favorably with both quadrupole ion traps, withdynamic ranges between 102 and 103, strongly dependingupon the number of ions present (space charge),8 andwith recently reported work on an FT-ICR 3 Tesla analyzercoupled to a linear ion trap that found a range of 103 –104.56
We note that no special arrangement was made to eject matrixions from the storage quadrupole and that the dynamicrange might be limited by the storage quadrupole andthe accumulated chemical noise therein, rather than by theOrbitrap.
ApplicationsThe Orbitrap has been applied to a number of chemicalsystems, chosen because they provide tests of instrumentperformance as well as being of scientific interest. Someof the most interesting results have been obtained instudying the serine octamer. Very briefly, serine octamerhas been observed under electrospray conditions to formthe magic number cluster Ser8HC and related metaclusterions. Conditions can be found in both a quadrupole iontrap instrument (LCQ instrument, ThermoFinnigan)57,58 anda triple quadrupole instrument59 where they are nearly theexclusive ions obtained in the mass spectrum. Even moreintriguingly, through labeling studies and by electrosprayingcombinations of L and D serine, it has been demonstratedthat the octamer preferentially forms from one enatiomer,that is, it is homochiral. The serine cluster is especiallyinteresting because it has been argued57 that it might haveplayed a role in homochirogenesis—the process in whicha single, preferred chirality was selected and transmittedto all biological molecules in the early pre-biotic earth.For example, on earth all biologically synthesized amino
Copyright 2005 John Wiley & Sons, Ltd. J. Mass Spectrom. 2005; 40: 430–443

The orbitrap: a new mass spectrometer 439
acids have L-configurations, whereas all sugars have D-configurations. The possible role of serine and serineclusters in this process is suggested by the observation ofreactions between serine octamers and various biologicalmolecules, such as the preferential formation of mixed L-serine/D-glucose clusters under electrospray conditions fromsolutions containing both L- and D-glucose.60
One area of interest is whether the metaclusters, mostnotably (Ser8H)2C
2 and (Ser8H)3C3 , also contribute to the
observed serine octamer peak.58 Of course, the monoisotopicmass peak for these species will have the same mass/chargeratio as the regular octamer. However, the 13C-substitutedisotopomers of the metaclusters will have different m/zratios and thus will be separately observable given suffi-cient resolution. So, for example, the 13C1-isotopomer of(Ser8H)3C
3 has a mass/charge ratio 1/3 unit higher than themonoisotopic peak. Such a peak is observable in the Orbitrapwith its higher resolution, but not in a quadrupole ion trapinstrument. Figure 11 shows the resulting mass spectrum,with peaks due to the 13C1,13C2 and 13C4 isotopomers of(Ser8H)3C
3 and the 13C1 isotopomer of (Ser8H)2C2 clearly visi-
ble; 13C3-(Ser8H)3C3 is coincident with 13C1-Ser8HC. Although
indirect evidence for the metaclusters was obtained with thequadrupole ion trap, this mass spectrum is the first directobservation of the metaclusters.
Previous research58 strongly suggested that the proto-nated serine metaclusters were relatively unstable. Studiesin the Orbitrap instrument confirm the relative instability ofthe protonated metaclusters. Figure 11 shows the mass spec-trum recorded in the Orbitrap instrument by electrosprayinga 0.01 M L-serine solution (in methanol/water/acetic acid50 : 49 : 1 v/v) at a nitrogen pressure of 3.8 ð 10�3 mbarinside the storage quadrupole. Increasing the pressure to7 ð 10�3 mbar causes the disappearance of the metaclusterpeaks, while the intensity of the protonated serine octamerdoes not change appreciably, confirming both the findings ofrelatively fragile metaclusters and of the exceptional stabil-ity of the serine octamer. Destruction of the serine octamermetaclusters most likely occurs in the storage quadrupole,as the Orbitrap pressure remains virtually constant whilepressure is changed in the storage quadrupole.
The structure of the serine octamer has also been atopic of interest in the literature. Serine-dimer losses fromthe protonated octamer are predominant in MS2 and MS3
experiments,57,61 leading to the proposal that a quartet ofneutral serine dimers comprises the octamer structure.57 Onthe basis of the ion mobility data and ab initio calculations,other structural types have also been suggested, somemade up of zwitterionic monomers.61 – 63 The fundamentaldistinction between these two structures is whether theindividual serine molecules are present in the octamericcluster in the neutral form or in the charge separatedzwitterionic form. These considerations also suggest that theserine octamer might have at least two possible conformers.In the ‘neutral form’ conformer, all the serine moleculesare held together by hydrogen bonding forces. In the‘zwitterionic form’ conformer, all the serine molecules allheld together by ionic forces as well as by hydrogen bonding.Intuitively, the ‘zwitterionic form’ conformer is expected tohave a much more compact structure than the ‘neutral form’conformer due to the stronger ionic binding forces.
Ion/molecule reactions can be used to probe gas-phaseion structures. For example, gas-phase hydrogen/deuterium(H/D) exchange has been successfully applied to obtainstructural information on various types of molecules fromsingly charged small ions to large multiply charged proteinions, especially in distinguishing isomeric ions and identi-fying conformer structures of proteins and peptides.64 – 67 InH/D exchange reactions, the exchangeable protons in the ionof interest are replaced by deuterium present in the neutralreagent gas. The H/D exchange rate is controlled by the typesof exchangeable protons (amine, alcohol, carboxyl etc.), thepresence of intramolecular interactions (hydrogen bonding,ionic forces etc.), steric factors, and the number of collisions.Therefore, H/D exchange can provide insights into the rolesof non-covalent interactions and the resulting ion structurein gas-phase ions. H/D exchange of amino acids, primaryalcohols, peptides, and nucleotides, as well as the role ofzwitterionic structures and internal salt-bridges, has beenstudied in detail.66 – 72
H/D exchange of the serine cluster ions was carried out inthe storage quadrupole, where CH3OD was introduced at apressure of 5 ð 10�3 mbar as the H/D exchange reagent. The
841
m/z
845844843842
13C0-(Ser8+H)+
13C1-(Ser8+H)33+
13C1-(Ser8+H)22+
13C1-(Ser8+H)+
13C3-(Ser8+H
13C2-(Ser8+H)33+
13C2-(Ser8+H)+
13C4-(Ser8+H)33+
Reaction time:125 ms
840 845 850 855 860 865 870 875
A
B
Figure 11. Serine octamer mass spectra. (a) Serine octamer peak and peaks due to clusters of the octamer (‘metaclusters’) showingability to examine non-covalent clusters in the Orbitrap using ESI (0.01 M L-serine in methanol/water/acetic acid 50 : 49 : 1 v/v).(b) H/D exchange mass spectrum of serine octamer using CH3OD. The spectrum shows two populations of serine octamer in the ionbeam. Unexchanged octamer has m/z of 841.
Copyright 2005 John Wiley & Sons, Ltd. J. Mass Spectrom. 2005; 40: 430–443

440 Q. Hu et al.
Orbitrap was used to characterize the exchange products.This arrangement parallels previous work where CID wasperformed in the storage quadrupole.73 The reaction time(120–5000 ms) was varied by changing the ion residencetime in the storage quadrupole prior to injection into theOrbitrap. Figure 11b shows the H/D exchange reaction ofL-serine (electrospray, 0.01 M in 50/50 methanol/water with1% acetic acid) at 125 ms reaction time. The octamer possesses33 exchangeable hydrogen atoms (amine, hydroxy, and acidgroups and charge-carrying proton); clusters can appearat m/z ratios between 841 (no exchange) to 874 (completeexchange). The observed bimodal distribution indicates thatL-serine octamer has at least two structures. The ions inpopulation B have undergone H/D exchange reaction morereadily than ions in population A, judging by the extent ofreaction. Mass spectra were also collected at longer reactiontimes and greater CH3OD pressures. The distribution oflower mass/charge ratio has moved to higher mass/chargeratios due to the higher rates of reaction at higher CH3ODpressures and longer times.
These results are consistent with the earlier findings59
on H/D exchange at atmospheric conditions in both sonicspray and electrospray preparation of serine octamers. Theearlier data also showed two populations and populationB was assigned to the neutral form, a structure arguedto be less tightly bound and therefore more accessibleto the H/D exchange reagent. Moreover, its formationwas favored under more energetic electrospray conditions(perhaps by fast conversion from conformer A). PopulationA was assigned to the zwitterionic form. Other workers haveconfirmed the presence of a second population.74
Mass spectra were recorded for a variety of transitionmetal/ligand complexes, including Zn complexes with his-tidine, citric acid, malic acid, and 1-methyl histidine, Cdcomplexes with histidine and 1-methyl histidine, and Nicomplexes with phenylalanine.75 Such complexes are foundin metal hyper-accumulating plants, which are under studyfor phytoremediation of heavy-metal–contaminated sites.Work is ongoing to understand more about their spatial andtemporal distributions in these plants.76 The complexes wereformed by electrospraying solutions containing ¾10�4 Mmetal cation and 5 ð 10�4 M organic acid. Typical instru-mental conditions included a slightly deeper axial well inthe storage quadrupole, which seemed to favor formation orretention of the complexes. As an example, the electrospraymass spectrum of a solution containing 1 ð 10�4 M Zn2C (aq)and 5 ð 10�4 M histidine (M-His) is shown in Fig. 12. Singlycharged zinc/methyl-histidine complexes with ratios of 1 : 2,1 : 3, 2 : 3, and 3 : 4 were observed, as well as the protonatedmethyl-histidine dimer. The figure inset shows the verycomplicated experimental isotope pattern due to the com-plex [Zn3(MeHis)4(H2O)2]C and its simulation. Observationof the last three isotopomers (m/z 916, 917, and 918) was pre-cluded by the low abundance of this complex and hence poorsignal/noise ratio. Similar results were obtained for the otherZn or Cd/ligand systems as well as the Ni/phenylalaninesystem.
Oligosaccharides are also an area of increasing in-terest,77,78 especially because of their importance in drugs,
200 300 400 500 600 700 800 900 1000
m/z920915910905
920915910905
[(MeHis)2+H]+
[Zn(MeHis)2-H ]+
[Zn(MeHis)3]+
[Zn2(MeHis)3]+
[Zn3(MeHis)4.2H2O]+
1 x 10⁻⁴M Zn(II)
5 x 10⁻⁴M His
calculated
experimental
Figure 12. Electrospray mass spectrum of a solutioncontaining 1 ð 10�4 M Zn(II) and 5 ð 10�4 M 1-methyl-histidine(‘M-His’). Inset: comparison of theoretical (top, IsoPro) andexperimental (bottom) isotope distributions for theZn3(MeHis)4(H2O)C2 complex.
800400200
Na+
1,4001,2001,000600
1,238
1,238
1,240
1,240 1,242
1,242
m/z
noisenoise
n=6
n=5
n=4
n=3
n=2
n=6calculatedLorentzianR = 100,000
experimental
Figure 13. ESI mass spectrum of hexa-N-acetyl chitohexaose.Inset shows a close-up of the experimental (lower trace) andtheoretically expected (upper trace) isotopic distributions.Filled squares denote ions with structure [(saccharide)nOH3]C,while open squares denote fragment ions with structures[(saccharide)nH]C.
nutrition, and protein/carbohydrate interactions. Figure 13shows the mass spectrum obtained for the oligosaccharidehexa-N-acetyl chitohexaose (structure presented in figure).Singlycharged (protonated) fragment ions corresponding to2, 3, 4, and 5 saccharide units (denoted by the filled squaresin Fig. 13) and their dehydration products (open squaresin Fig. 13) were observed, as well as the protonated parentmolecule, its dehydration product, and its NaC complex. Thetheoretically expected isotopic distribution for the parent ioncompares well with that observed experimentally (Figureinset). Fragmentation might be taking place in either our ESIsource or the storage quadrupole (Q2).
As a final example of an application of the performanceof the Orbitrap, Fig. 14 illustrates the ESI mass spectrumof vancomycin, a cyclic glycopeptide. Vancomycin is animportant antibiotic, often used as a last resort in seriousinfections. The mass spectrum shows the protonated parentmolecule at m/z 1448 and several fragment ions. Major
Copyright 2005 John Wiley & Sons, Ltd. J. Mass Spectrom. 2005; 40: 430–443

The orbitrap: a new mass spectrometer 441
[MH]+
1448
[MH – (sugar)1]+
1305
[MH – (sugar)2]+
1143
m/z
1,8001,6001,4001,2001,000800
m/z1,4541,4521,4501,448
calculated
m/z
1,1501,1481,1461,1441,142
1,1501,1481,1461,1441,142
calculated
experimental
1,4541,4521,4501,448
m/z
1,304
m/z1,3141,3121,3101,3081,3061,304
1,3141,3121,3101,3081,306
m/z
calculated
experimental
experimental
m/z
Figure 14. ESI mass spectrum of the antibiotic vancomycin. Insets show experimental (bottom traces) and simulated (IsoPro, toptraces) isotopic distributions for parent ion (MH+) and protonated fragment ions corresponding to the loss of one or two sugarmoieties. The doubly charged cation at m/z 725 was not observed.
fragment ions include m/z 1305, corresponding to the lossof one saccharide; m/z 1277, which corresponds to be theadditional loss of CO; m/z 1143, the loss of both sugars unitsand m/z 1115, which appears to be due to the loss of twosugars and CO. Once again, fragment ions appear in themass spectrum. Intriguingly, all literature spectra show ESIspectra with no fragmentation and show the doubly chargedion MH2C
2 at m/z 725 as the predominant or only ion.79
CONCLUSIONS AND FUTURE WORK
The results described here demonstrate that the Orbitrapis a powerful mass spectrometer that can be used toexamine a variety of types of chemical systems. It provideshigh resolution, high-mass accuracy, and good dynamicrange. In addition to the examples shown, the instrumenthas been applied to a wide range of analytes, especiallyproteins and peptides, oligosaccharides, and glycopeptides.The description provided here of the basis and performanceof the instrument is intended as a preparation for moredetailed understanding of the unique features of this device.Future work includes designing and fabricating the ionoptics necessary for conducting surface induced dissociationas an ion activation method in MS/MS and ion motioncontrol experiments inside the Orbitrap. Simulations of ion
motion in the Orbitrap are also contributing to an improvedunderstanding of its performance and suggesting new typesof experiments.
AcknowledgementsThis work was supported by National Science Foundation GrantCHE-0216239 (Major Research Instrumentation Program), the Officeof Naval Research (ONR), and Thermo Electron Corporation.We also acknowledge technical advice and assistance from JasonDuncan, Andy Guymon, Dr Robert Santini, and Chris Doerge ofthe Jonathan Amy Facility for Chemical Instrumentation, JustinWiseman, and input, in the development of the research Orbitrapsetup, of colleagues from Thermo Electron Corporation: Dr MikeSenko, Alexander Kholomeev, Eduard Denisov, Andrew Hoffmann,Stephen Davis, Silke Strube, and Robert Lawther.
REFERENCES1. Schwartz JC, Wade AP, Enke CG, Cooks RG. Systematic
delineation of scan modes in multidimensional massspectrometry. Anal. Chem. 1990; 62: 1809.
2. Chen H, Zheng X, Cooks RG. Ketalization of phosphonium ionsby 1, 4-dioxane: Selective detection of the chemical warfare agentsimulant dmmp in mixtures using ion/molecule reactions. J. Am.Soc. Mass Spectrom. 2003; 14: 182.
3. deHoffmann E. Tandem mass spectrometry: a primer. J. MassSpectrom. 1996; 31: 129.
4. Reid GE, Shang H, Hogan JM, Lee GU, McLuckey SA. Gas-phase concentration, purification, and identification of whole
Copyright 2005 John Wiley & Sons, Ltd. J. Mass Spectrom. 2005; 40: 430–443

442 Q. Hu et al.
proteins from complex mixtures. J. Am. Chem. Soc. 2002; 124:7353.
5. Woods AS, Huang AYC, Cotter RJ, Pasternack GR, Pardoll DM,Jaffee EM. Simplified high-sensitivity sequencing of a majorhistocompatibility complex class i-associated immunoreactivepeptide using matrix-assisted laser-desorption ionization mass-spectrometry. Anal. Biochem. 1995; 226: 15.
6. Bristow AWT, Webb KS. Intercomparison study on accuratemass measurement of small molecules in mass spectrometry.J. Am. Soc. Mass Spectrom. 2003; 14: 1086.
7. Marshall AG, Hendrickson CL, Jackson GS. Fourier transformion cyclotron resonance mass spectrometry: a primer. Mass.Spectrom. Rev. 1998; 17: 1.
8. McLuckey SA, Wells JM. Mass analysis at the advent of the 21stcentury. Chem. Rev. 2001; 101: 571.
9. Williams JD, Flanagan M, Lopez L, Fischer S, Miller LA. Usingaccurate mass electrospray ionization—time-of-flight massspectrometry with in-source cid to sequence peptide mixtures.J. Chromatogr., A 2003; 1020: 11.
10. Wells JM, Gill LA, Ouyang Z, Patterson GE, Plass W,Badman ER, Amy JW, Cooks RG, Schwartz JC, Stafford GC,Senko MW. Factors affecting the mass measurement accuracyof quadrupole ion trap mass spectrometers. In Proceedings ofthe 46th ASMS Conference on Mass Spectrometry and Allied Topics,Orlando, 1998; 485.
11. Grayson M (ed). Measuring Mass—From Positive Rays to Proteins.Chemical Heritage Press: Philadelphia, 2002.
12. Edmond H, Jean C, Vincent S. Mass Spectrometry Principles andApplications. Johan Wiley & Sons: New York, 1996; 41.
13. Mattauch J, Herzog R. Mass spectrograph. Z. Physik 1934; 89:786.
14. Johnson EG, Nier AO. Angular aberrations in sector shapedelectromagnetic lenses for focusing beams of charged particles.Phys. Rev 1953; 91: 10.
15. Dawson PH (ed). Quadrupole Mass Spectrometry and itsApplications. Elsevier Scientific Publishing: New York, 1976; 349.
16. Comisarow MB, Marshall AG. The early development of fouriertransform ion cyclotron resonance (ft-icr) spectroscopy. J. MassSpectrom. 1996; 31: 838.
17. Amster IJ. Fourier transform mass spectrometry. J. MassSpectrom. 1996; 31: 1325.
18. March R. An introduction to quadrupole ion trap massspectrometry. J. Mass Spectrom. 1997; 32: 351.
19. Wiley WC, McLaren IH. Time of flight mass spectrometer withimproved resolution. Rev. Sci. Instrum. 1955; 26: 1150.
20. Guilhaus M. Principles and instrumentation in time-of-flightmass spectrometry. J. Mass Spectrom. 1995; 30: 1519.
21. Kingdon KH. A method for the neutralization of electron spacecharge by positive ionization at very low gas pressures. Phys.Rev. 1923; 21: 408.
22. Brooks PR, Herschbach DR. Kingdon cage as a molecular beamdetector. Rev. Sci. Instrum. 1964; 35: 1528.
23. Douglass RA, Zabritski J, Herb RG. An orbitron vacuum pump.Rev. Sci. Instrum. 1965; 36: 1.
24. Yang L, Church DA. Confinement of injected beam ions in akingdon trap. Nucl. Instrum. Methods Phys. Res., Sect. B 1991;B56-B57: 1185.
25. Lewis RR. Motion of ions in the kingdon trap. J. Appl. Phys. 1982;53: 3975.
26. Knight RD. Storage of ions from laser-produced plasmas. Appl.Phys. Lett. 1981; 38: 221.
27. Korsunskii MI, Basakutsa VA. A study of the ion-opticalproperties of a sector-shaped electrostatic field of the differencetype. Soviet Phys.-Tech. Phys. 1958; 3: 1396.
28. Gall LN, Golikov YK, Aleksandrov ML, Pechalina YE, HolinNA. USSR Inventor’s Certificate, #1247973, 1986.
29. McIlraith AH. Nature 1966; 212: 1422.30. Bluemel R. Dynamic kingdon trap. Phys. Rev. A: At., Mol., Opt.
Phys. 1995; 51: R30.31. Makarov A. Mass spectrometer. U.S. Patent 5,886,346 1999.
32. Makarov A. Electrostatic axially harmonic orbital trapping: ahigh-performance technique of mass analysis. Anal. Chem. 2000;72: 1156.
33. Hardman M, Makarov A. Interfacing the orbitrap mass analyzerto an electrospray ion source. Anal. Chem. 2003; 75: 1699.
34. Senko MW, Canterbury JD, Guan S, Marshall AG. A high-performance modular data system for fourier transform ioncyclotron resonance mass spectrometry. Rapid Commun. MassSpectrom. 1996; 10: 1839.
35. Marshall AG, Verdun FR. Fourier transforms in nmr, optical, andmass spectrometry: a user’s handbook, Elsevier: Amsterdam, 1990;450.
36. Guan S, Marshall AG. Stored waveform inverse fouriertransform axial excitation/ejection for quadrupole ion trap massspectrometry. Anal. Chem. 1993; 65: 1288.
37. Major FG, Dehmelt HG. Exchange-collision technique for the rfspectroscopy of stored ions. Phys. Rev. 1968; 170: 91.
38. Makarov A, Hardman M, Schwartz J, Senko M. PCT PatentAppl. W002078046, 2002.
39. Schwartz JC, Senko MW, Syka JEP. A two-dimensionalquadrupole ion trap mass spectrometer. J. Am. Soc. MassSpectrom. 2002; 13: 659.
40. Hager JW. A new linear ion trap mass spectrometer. RapidCommun. Mass. Spectrom. 2002; 16: 512.
41. Cha B, Blades M, Douglas D. An interface with a linearquadrupole ion guide for an electrospray-ion trap massspectrometer system. Anal. Chem. 2000; 72: 5647.
42. Syka JEP, Bai DL, Stafford GCJ, Horning S, Shabanowitz J,Hunt DF, Marto JA. A linear quadrupole ion trap fouriertransform mass spectrometer: a new tool for proteomics. InProceedings of the 49th ASMS Conference on Mass Spectrometry andAllied Topics, Chicago, 2001.
43. Wang Y, Park MA, Giessmann UP, Laukien F. In Dual trap q-q-time of flight mass spectrometry. Proceedings of the 49th ASMSConference on Mass Spectrometry and Allied Topics, Chicago, 2001.
44. Badman ER, Hoaglund-Hyzer CS, Clemmer DE. Monitoringstructural changes of proteins in an ion trap over ¾10–200 ms:Unfolding transitions in cytochrome c ions. Anal. Chem. 2001; 73:6000.
45. Doroshenko VM, Cotter RJ. A quadrupole ion trap/time-of-flight mass spectrometer with a parabolic reflectron. J. MassSpectrom. 1998; 33: 305.
46. de Hoffmann E, Stroobant V. Mass Spectrometry: Principles andApplications, 2nd ed. John Wiley & Sons: Chichester, 2002.
47. Okumura D, Toyoda M, Ishihara M, Katakuse I. Applicationof a multi-turn time-of-flight mass spectrometer, multumii, to organic compounds ionized by matrix-assisted laserdesorption/ionization. J. Mass Spectrom. 2004; 39: 86.
48. Sakurai T, Baril M. Ion optics of a high-resolution multipassagemass spectrometer with electrostatic ion mirrors. Nucl. Instrum.Methods Phys. Res., Sect. A 1995; 363: 473.
49. Okumura D, Toyoda M, Ishihara M, Katakuse I. A compactsector-type multi-turn time-of-flight mass spectrometer ‘multumii’. Nucl. Instrum. Methods Phys. Res., Sect. A 2004; 519: 331.
50. Dahl DA. Simion 3d, Version 7.0. Idaho national engineeringlaboratory: Idaho, 2001.
51. Moini M. Ultramark 1621 as a calibration/reference compoundfor mass spectrometry. II. Positive-and negative-ion electrosprayionization. Rapid Commun. Mass Spectrom. 1994; 8: 711.
52. Senko M. Isopro 3.0. http://members.aol.com/msmssoft/2003.53. Strupat K, Carte N, Rogniaux H, Leize E, Dorsselaer AV. Esi-
iontrap-ms of biological non-covalently bound complexes:Feasibility study using an orthogonal source & comparisonto esi-quadrupole-ms using a linear source. In Proceedings of the47th ASMS Conference on Mass Spectrometry and Allied Topics,Dallas, 1999.
54. Rogniaux H, Sanglier S, Strupat K, Azza S, Roitel O, Ball V,Tritsch D, Branlant G, Dorsselaer AV. Mass spectrometryas a novel approach to probe cooperativity inmultimeric enzymatic systems. Anal. Biochem. 2001; 291:48.
Copyright 2005 John Wiley & Sons, Ltd. J. Mass Spectrom. 2005; 40: 430–443

The orbitrap: a new mass spectrometer 443
55. Hu Q, Makarov A, Noll RJ, Cooks RG. Application of theorbitrap mass analyzer to biologically relevant compounds. InProceedings of the 52nd ASMS Conference on Mass Spectrometry andAllied Topics, Nashville, 2004.
56. Syka JEP, Marto JA, Bai DL, Horning S, Senko MW, Schwartz JC,Ueberheide B, Garcia B, Busby S, Muratore T, Shabanowitz J,Hunt DF. Novel linear quadrupole ion trap/ft mass spectrom-eter: performance characterization and use in the comparativeanalysis of histone h3 post-translational modifications. J. Pro-teome Res. 2004; 3: 621.
57. Cooks RG, Zhang D, Koch KJ, Gozzo FC, Eberlin MN.Chiroselective self-directed octamerization of serine:implications for homochirogenesis. Anal. Chem. 2001; 73: 3646.
58. Koch KJ, Gozzo FC, Zhang D, Eberlin MN, Cooks RG. Serineoctamer metaclusters: formation, structure elucidation andimplications for homochiral polymerization. Chem. Commun.2001; 18: 1854.
59. Takats Z, Nanita SC, Cooks RG, Schlosser G, Vekey K. Aminoacid clusters formed by sonic spray ionization. Anal. Chem. 2003;75: 1514.
60. Takats Z, Nanita SC, Cooks RG. Serine octamer reactions:indicators of prebiotic relevance. Angew. Chem., Int. Ed. Engl.2003; 42: 3521.
61. Julian RR, Hodyss R, Kinnear B, Jarrold M, Beauchamp JL.Nanocrystalline aggregation of serine detected by electrosprayionization mass spectrometry: origin of the stable homochiralgas phase serine octamer. J. Phys. Chem. B 2002; 106: 1219.
62. Schalley CA, Weis P. Unusually stable magic number clustersof serine with a surprising preference for homochirality. Int. J.Mass Spectrom. 2002; 221: 9.
63. Counterman AE, Clemmer DE. Magic number clusters of serinein the gas phase. J. Phys. Chem. B 2001; 105: 8092.
64. Wood TD, Chorush RA, Wampler FM, Little DP, Oconnor PB,McLafferty FW. Gas-phase folding and unfolding ofcytochrome-c cations. Proc. Natl. Acad. Sci. U.S.A. 1995; 92: 2451.
65. Suckau D, Shi Y, Beu SC, Senko MW, Quinn JP, Wampler FM,McLafferty FW. Coexisting stable conformations of gaseousprotein ions. Proc. Natl. Acad. Sci. U.S.A. 1993; 90: 790.
66. Campbell S, Rodgers MT, Marzluff EM, Beauchamp JL.Structural and energetic constraints on gas-phase hydrogen-deuterium exchange-reactions of protonated peptides with d2o,cd3od, cd3co2d, and nd3. J. Am. Chem. Soc. 1994; 116: 9765.
67. Campbell S, Rodgers MT, Marzluff EM, Beauchamp JL.Deuterium exchange reactions as a probe of biomoleculestructure. Fundamental studies of cas phase h/d exchange
reactions of protonated glycine oligomers with d2o, cd3od,cd3co2d, and nd3. J. Am. Chem. Soc. 1995; 117: 12 840.
68. Dookeran NN, Harrison AG. Gas-phase h-d exchange-reactionsof protonated amino-acids and peptides with nd3. J. MassSpectrom. 1995; 30: 666.
69. Dookeran NN, Harrison AG. Reactive collisions in quadrupolecells. 3. H/d exchange-reactions of protonated aromatic-amineswith nd(3). J. Am. Soc. Mass Spectrom. 1995; 6: 19.
70. Ustyuzhanin P, Ustyuzhanin J, Lifshitz C. An electrosprayionization—flow tube study of h/d exchange in protonatedserine. Int. J. Mass Spectrom. 2003; 223: 491.
71. Freitas MA, Hendrickson CL, Emmett MR, Marshall AG. High-field fourier transform ion cyclotron resonance massspectrometry for simultaneous trapping and gas-phasehydrogen/deuterium exchange of peptide ions. J. Am. Soc. MassSpectrom. 1998; 9: 1012.
72. Freitas MA, Marshall AG. Rate and extent of gas-phasehydrogen/deuterium exchange of bradykinins: evidence forpeptide zwitterions in the gas phase. Int. J. Mass Spectrom. 1999;183: 221.
73. Hardman M, Denisov E, Makarov A. Ion fragmentation andstorage in an asymmetric trapping quadrupole coupled to theorbitrap mass analyser. In Proceedings of the 50th ASMS Conferenceon Mass Spectrometry and Allied Topics, Orlando, 2002.
74. Mazurek U, Reuben BG, McFarland MA, Marshall AG,Lifshitz C. Elucidating structures of protonated amino acidclusters from H/D exchange experiments: the protonated serineoctamer. In Proceedings of the 52nd ASMS Conference on MassSpectrometry and Allied Topics, Nashville, 2004.
75. Li H, Cooks RJ, unpublished results, 2003.76. Salt DE, Prince RC, Baker AJM, Raskin I, Pickering IJ. Zinc
ligands in the metal hyperaccumulator thlaspi caerulescens asdetermined using x-ray absorption spectroscopy. Environ. Sci.Technol. 1999; 33: 713.
77. Grimm CC, Grimm DA, Bergman CJ (eds). The Analysis ofOligosaccharides by Mass Spectrometry. American ChemicalSociety: Washington, 2003.
78. Zala J. Mass spectrometry of oligosaccharides. Mass. Spectrom.Rev. 2004; 23: 161.
79. Cass RT, Villa JS, Karr DE, Donald E, Schmidt J. Rapidbioanalysis of vancomycin in serum and urine in hplc-tandemmass spectrometry using on-line sample extraction and parallelanalytical columns. Rapid Commun. Mass Spectrom. 2001; 15: 406.
Copyright 2005 John Wiley & Sons, Ltd. J. Mass Spectrom. 2005; 40: 430–443