fileyuting huang and eric d. dodds department of chemistry, university of nebraska – lincoln...
TRANSCRIPT
Y. Huang and E. D. Dodds - Supplementary Information - S1
Supplementary Information to Accompany:
Ion-Neutral Collisional Cross Sections of Carbohydrate Isomers as
Divalent Cation Adducts and their Electron Transfer Products
Yuting Huang and Eric D. Dodds
Department of Chemistry, University of Nebraska – Lincoln
Lincoln, NE 68588-0304 USA
Electronic Supplementary Material (ESI) for Analyst.This journal is © The Royal Society of Chemistry 2015

Y. Huang and E. D. Dodds - Supplementary Information - S2
Collisional Cross Section Calibration Procedure.
1. Absolute ion-neural collisional cross section (CCS, Ω) values of calibration standards were
reduced mass and charge state corrected to obtain normalized CCS values (Ω’) for use in
calibration:
Here, μ is the ion-neutral reduced mass. For ion-neutral collision partners having masses
of m1 and m2, respectively, the reduced mass is defined as:
2. Traveling wave ion mobility spectrometry (TWIMS) arrival time distributions (ATDs) were
centroided to obtain the apparent TWIMS drift times (td) for each calibration standard or
analyte of interest.
3. Corrected drift times (td’) were calculated by subtracting irrelevant ion transit times from
the apparent drift times (td) according to:
Here, tm is mobility dead time, which depends on the length of the mobility cell (dm; in
Synapt G2 HDMS instruments, dm = 25.4 cm) and the mobility cell travelling DC wave
velocity (vm):
Furthermore, tt is the time required for ion transit through the transfer region stacked ring
ion guide (SRIG), which depends on the length of the transfer SRIG (dt; in Synapt G2
HDMS instruments, dt = 13.5 cm) and the transport cell travelling DC wave velocity (vt):
= z
1 2
1 2
= +
m m
m m
= - - - d d m t it t t t t
0.254 m = = m
mm m
dt
v v
0.135 m = = t
tt t
dt
v v

Y. Huang and E. D. Dodds - Supplementary Information - S3
Finally, ti is the time required for ion transit through the TOF interface region, which
depends on the ion m/z:
Here, ki is the TOF interface flight time constant, which is derived from the “enhanced
duty cycle” constant (kEDC) that is empirically determined for each individual instrument
during installation.
4. CCS calibration curves were generated by plotting corrected drift times (td’) as a function
of normalized CCS values (Ω’). A power function of the form td’ = aΩ’b was fitted to the
calibration data.
5. Calibration curves were then used to calculate Ω’ values based on the experimentally
determined td’ values of analytes.
6. Analyte Ω’ values were then converted to Ω values.
7. Further information on this calibration procedure can be found in previous reports by
Huang and Dodds, and by Gelb et al.1, 2
References.
1. Y. Huang and E. D. Dodds, Anal. Chem., 2013, 85, 9728-9735.
2. A. S. Gelb, R. E. Jarratt, Y. Huang and E. D. Dodds, Anal. Chem., 2014, 86, 11396-
11402.
6 = =
10
EDCi i
km mt k
z z
Y. Huang and E. D. Dodds - Supplementary Information - S4
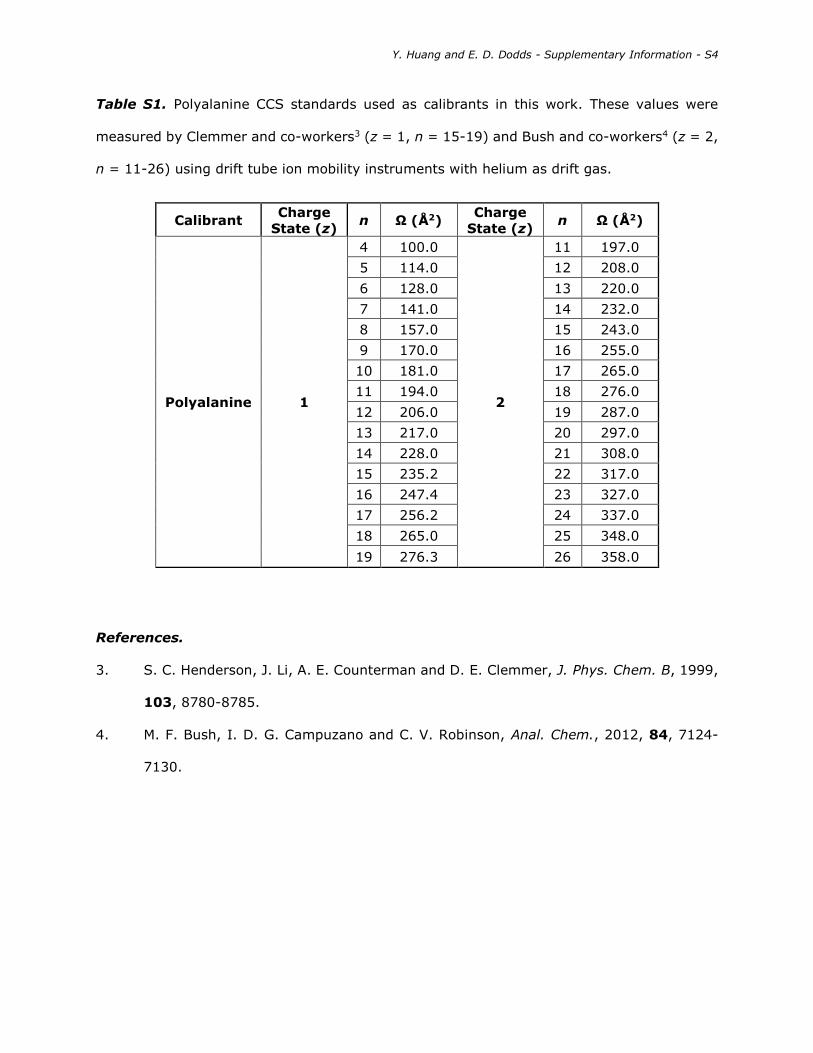
Table S1. Polyalanine CCS standards used as calibrants in this work. These values were
measured by Clemmer and co-workers3 (z = 1, n = 15-19) and Bush and co-workers4 (z = 2,
n = 11-26) using drift tube ion mobility instruments with helium as drift gas.
References.
3. S. C. Henderson, J. Li, A. E. Counterman and D. E. Clemmer, J. Phys. Chem. B, 1999,
103, 8780-8785.
4. M. F. Bush, I. D. G. Campuzano and C. V. Robinson, Anal. Chem., 2012, 84, 7124-
7130.
Calibrant Charge
State (z) n Ω (Å2)
Charge
State (z) n Ω (Å2)
Polyalanine 1
4 100.0
2
11 197.0
5 114.0 12 208.0
6 128.0 13 220.0
7 141.0 14 232.0
8 157.0 15 243.0
9 170.0 16 255.0
10 181.0 17 265.0
11 194.0 18 276.0
12 206.0 19 287.0
13 217.0 20 297.0
14 228.0 21 308.0
15 235.2 22 317.0
16 247.4 23 327.0
17 256.2 24 337.0
18 265.0 25 348.0
19 276.3 26 358.0

Y. Huang and E. D. Dodds - Supplementary Information - S5
Table S2. Data table for generating doubly charged polyalanine CCS calibration curve under
the TWIMS conditions applied to doubly charged metal cation adducts of the FH isomers.
m/z z Ω (Å2) td (ADC
Bins) m (u) µ (u)
Ω'
(Å2∙u1/2∙z-1)
td
(ms)
ti
(ms)
td'
(ms)
400.717 2 197.0 36.7092 801.434 27.067 512.5 2.533 0.028 1.416
436.236 2 208.0 39.2257 872.471 27.142 541.8 2.707 0.029 1.588
471.754 2 220.0 41.9086 943.508 27.206 573.7 2.892 0.031 1.772
507.273 2 232.0 44.7952 1014.55 27.261 605.7 3.091 0.032 1.970
542.791 2 243.0 47.7792 1085.58 27.309 634.9 3.297 0.033 2.175
578.310 2 255.0 50.8579 1156.62 27.351 666.8 3.509 0.034 2.386
613.828 2 265.0 53.8817 1227.66 27.388 693.4 3.718 0.035 2.594
649.347 2 276.0 56.9612 1298.69 27.422 722.6 3.930 0.036 2.805
684.865 2 287.0 59.9813 1369.73 27.452 751.9 4.139 0.037 3.013
720.384 2 297.0 63.1347 1440.77 27.479 778.4 4.356 0.038 3.230
755.903 2 308.0 66.3597 1511.81 27.504 807.6 4.579 0.039 3.451
791.421 2 317.0 69.7374 1582.84 27.526 831.6 4.812 0.040 3.683
826.940 2 327.0 73.2500 1653.88 27.547 858.1 5.054 0.041 3.925
862.458 2 337.0 76.9625 1724.92 27.566 884.7 5.310 0.041 4.180
897.977 2 348.0 80.7811 1795.95 27.583 913.8 5.574 0.042 4.443
933.495 2 358.0 84.8581 1866.99 27.599 940.4 5.855 0.043 4.723

Y. Huang and E. D. Dodds - Supplementary Information - S6
Figure S1. Representative CCS calibration curve determined under the TWIMS conditions
applied to singly charged metal cation adducts of the FH isomers.
y=1.910*10-5
x1.825
R2=0.9998
400 600 800 1000 1200 1400 1600
t' (
ms)
0
2
4
6
8
10
12
Singly Charged Calibration Curve of FH
'Å2)
Y. Huang and E. D. Dodds - Supplementary Information - S7
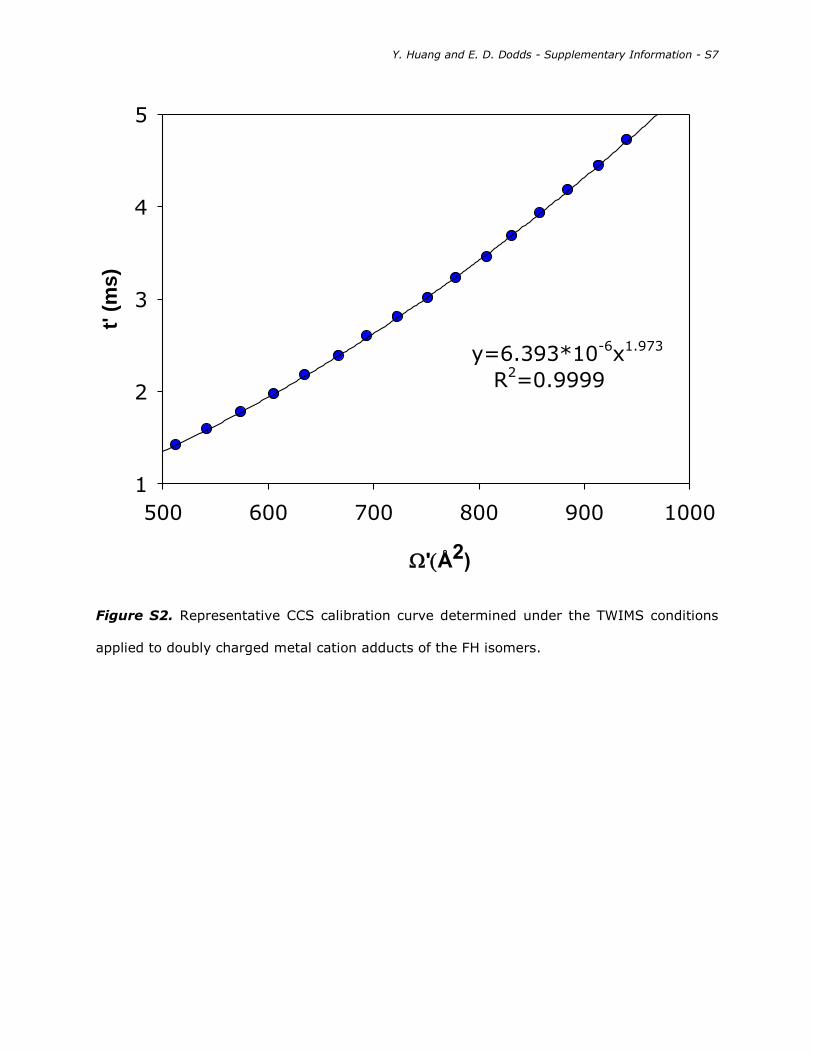
Figure S2. Representative CCS calibration curve determined under the TWIMS conditions
applied to doubly charged metal cation adducts of the FH isomers.
y=6.393*10-6x
1.973
R2=0.9999
500 600 700 800 900 1000
t' (
ms
)
1
2
3
4
5
Doubly Charged Calibration Curve of FH
'Å2)

Y. Huang and E. D. Dodds - Supplementary Information - S8
Figure S3. Molecular structures of the trisaccharide isomers maltotriose (MT1),
isomaltotriose (MT2), melezitose (MLZ), and raffinose (RFN).
Y. Huang and E. D. Dodds - Supplementary Information - S9
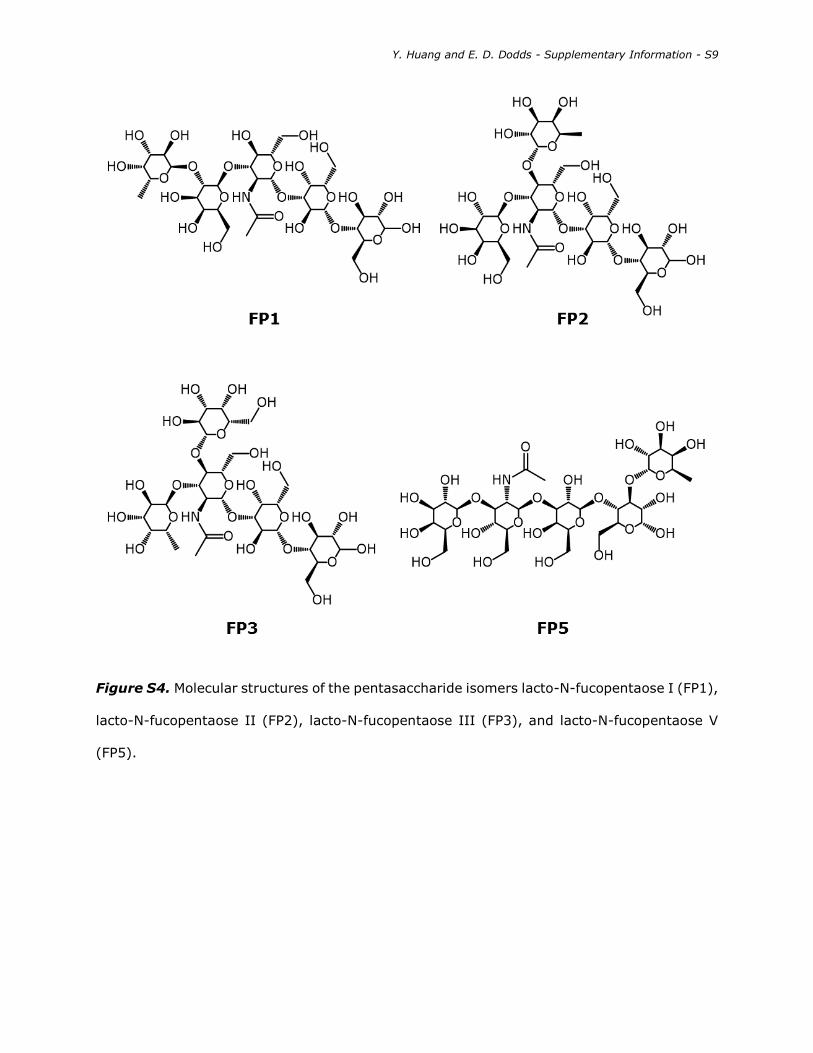
Figure S4. Molecular structures of the pentasaccharide isomers lacto-N-fucopentaose I (FP1),
lacto-N-fucopentaose II (FP2), lacto-N-fucopentaose III (FP3), and lacto-N-fucopentaose V
(FP5).
Y. Huang and E. D. Dodds - Supplementary Information - S10
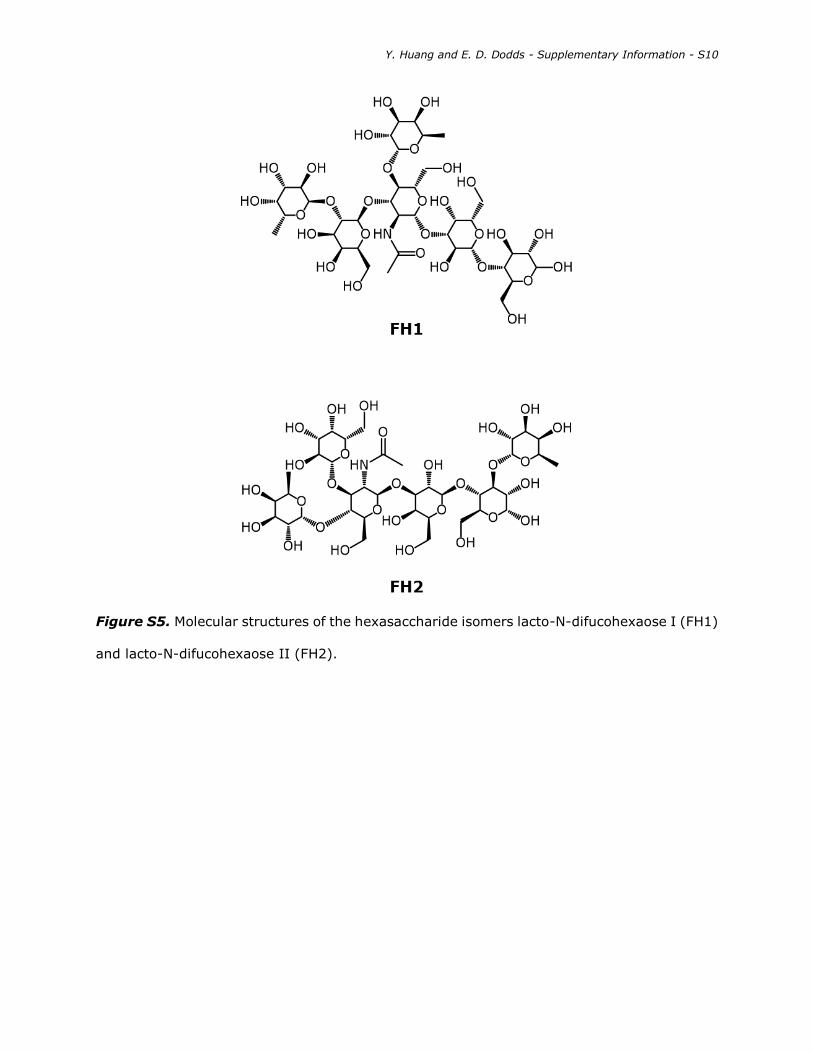
Figure S5. Molecular structures of the hexasaccharide isomers lacto-N-difucohexaose I (FH1)
and lacto-N-difucohexaose II (FH2).

Y. Huang and E. D. Dodds - Supplementary Information - S11
Table S3. Ion-neutral collisional cross sections (CCSs, Ω) of the carbohydrate / group II metal
ion adducts measured in this study. The values are expressed as the mean plus or minus the
standard error of the mean for four replicate measurements. For each group of isomers, the
degree of polymerization (DP) is indicated.
Ω (Å2)
DP Name [M+Be]2+ [M+Mg]2+ [M+Ca]2+ [M+Sr]2+ [M+Ba]2+
3
MT1 - 136.5±0.7 136.0±0.6 139.4±0.7 142.8±1.1
MT2 - 138.3±0.3 136.0±1.0 142.2±0.3 145.5±0.4
MLZ - 137.9±0.5 137.7±0.6 142.6±0.4 146.5±0.3
RFN - 136.2±0.3 133.6±0.4 138.4±0.6 141.3±1.1
5
FP1 204.0±0.3 201.1±0.4 198.2±0.8 200.8±1.0 193.5±0.9
FP2 201.2±0.4 203.2±1.2 201.7±0.5 201.5±0.5 205.5±0.5
FP3 201.3±0.7 199.8±0.8 195.9±0.9 196.2±1.0 197.4±1.1
FP5 197.3±0.3 197.4±0.5 196.7±0.2 197.8±1.1 197.6±0.9
6 FH1 226.5±0.5 226.0±0.5 222.1±0.6 223.1±0.5 220.2±1.1
FH2 226.5±0.4 227.2±0.8 225.5±0.5 225.7±1.4 225.5±0.9
Y. Huang and E. D. Dodds - Supplementary Information - S12
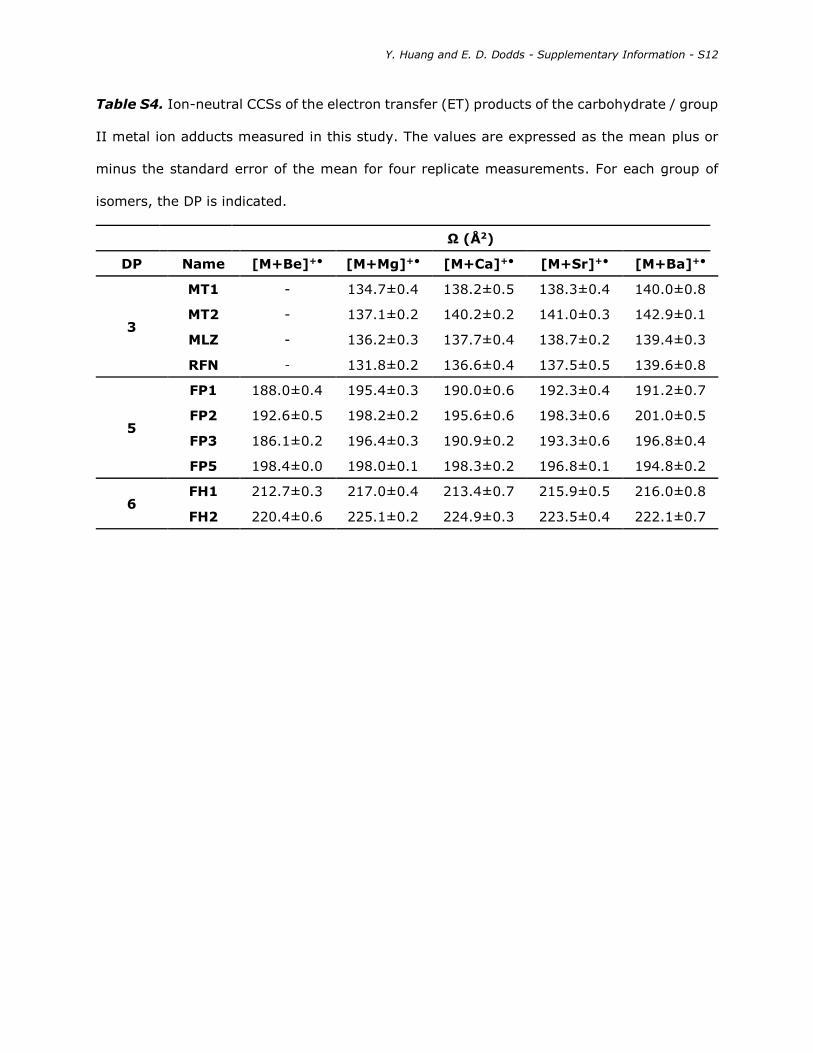
Table S4. Ion-neutral CCSs of the electron transfer (ET) products of the carbohydrate / group
II metal ion adducts measured in this study. The values are expressed as the mean plus or
minus the standard error of the mean for four replicate measurements. For each group of
isomers, the DP is indicated.
Ω (Å2)
DP Name [M+Be]+• [M+Mg]+• [M+Ca]+• [M+Sr]+• [M+Ba]+•
3
MT1 - 134.7±0.4 138.2±0.5 138.3±0.4 140.0±0.8
MT2 - 137.1±0.2 140.2±0.2 141.0±0.3 142.9±0.1
MLZ - 136.2±0.3 137.7±0.4 138.7±0.2 139.4±0.3
RFN - 131.8±0.2 136.6±0.4 137.5±0.5 139.6±0.8
5
FP1 188.0±0.4 195.4±0.3 190.0±0.6 192.3±0.4 191.2±0.7
FP2 192.6±0.5 198.2±0.2 195.6±0.6 198.3±0.6 201.0±0.5
FP3 186.1±0.2 196.4±0.3 190.9±0.2 193.3±0.6 196.8±0.4
FP5 198.4±0.0 198.0±0.1 198.3±0.2 196.8±0.1 194.8±0.2
6 FH1 212.7±0.3 217.0±0.4 213.4±0.7 215.9±0.5 216.0±0.8
FH2 220.4±0.6 225.1±0.2 224.9±0.3 223.5±0.4 222.1±0.7
Y. Huang and E. D. Dodds - Supplementary Information - S13
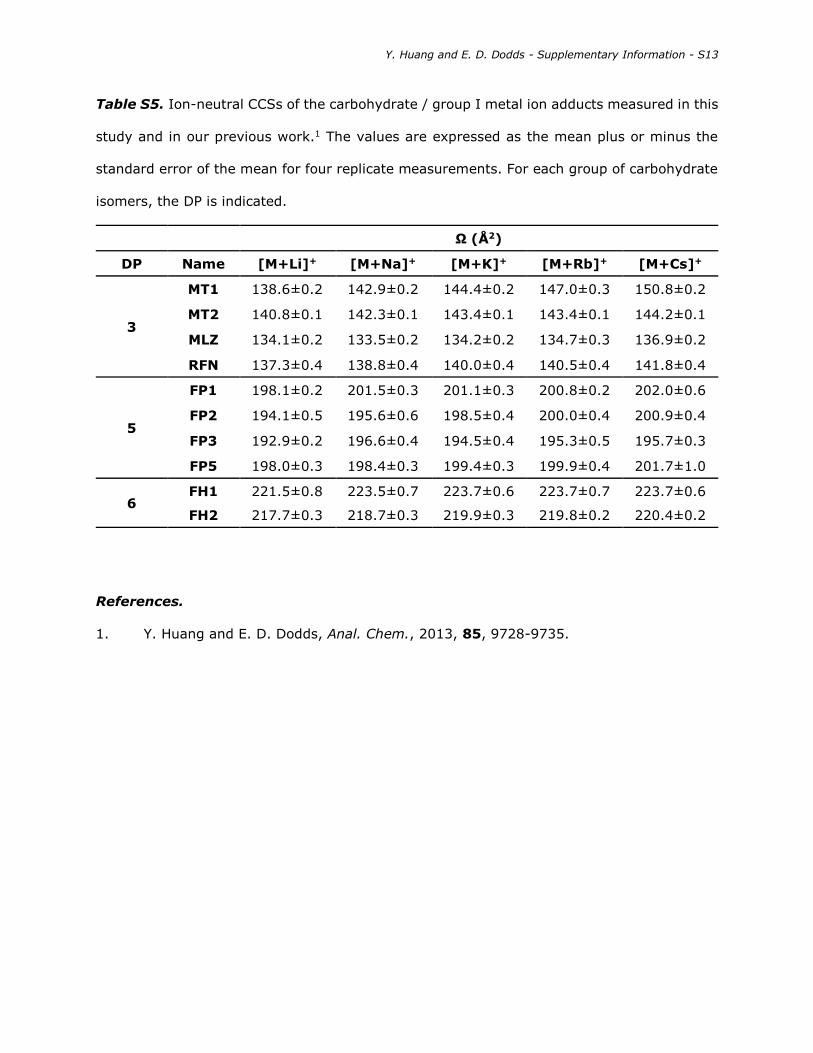
Table S5. Ion-neutral CCSs of the carbohydrate / group I metal ion adducts measured in this
study and in our previous work.1 The values are expressed as the mean plus or minus the
standard error of the mean for four replicate measurements. For each group of carbohydrate
isomers, the DP is indicated.
Ω (Å2)
DP Name [M+Li]+ [M+Na]+ [M+K]+ [M+Rb]+ [M+Cs]+
3
MT1 138.6±0.2 142.9±0.2 144.4±0.2 147.0±0.3 150.8±0.2
MT2 140.8±0.1 142.3±0.1 143.4±0.1 143.4±0.1 144.2±0.1
MLZ 134.1±0.2 133.5±0.2 134.2±0.2 134.7±0.3 136.9±0.2
RFN 137.3±0.4 138.8±0.4 140.0±0.4 140.5±0.4 141.8±0.4
5
FP1 198.1±0.2 201.5±0.3 201.1±0.3 200.8±0.2 202.0±0.6
FP2 194.1±0.5 195.6±0.6 198.5±0.4 200.0±0.4 200.9±0.4
FP3 192.9±0.2 196.6±0.4 194.5±0.4 195.3±0.5 195.7±0.3
FP5 198.0±0.3 198.4±0.3 199.4±0.3 199.9±0.4 201.7±1.0
6 FH1 221.5±0.8 223.5±0.7 223.7±0.6 223.7±0.7 223.7±0.6
FH2 217.7±0.3 218.7±0.3 219.9±0.3 219.8±0.2 220.4±0.2
References.
1. Y. Huang and E. D. Dodds, Anal. Chem., 2013, 85, 9728-9735.

Y. Huang and E. D. Dodds - Supplementary Information - S14
Figure S6. Representative distributions of ion-neutral CCS values for MT1, MT2, MLZ, and
RFN as their lithium ion adducts.
100
50
0
Rela
tive I
nte
nsit
y (
%)
180160140120100
(Å2)
100
50
0180160140120100
100
50
0180160140120100
100
50
0180160140120100
[RFN+Li]+
[MLZ+Li]+
[MT2+Li]+
[MT1+Li]+
Y. Huang and E. D. Dodds - Supplementary Information - S15
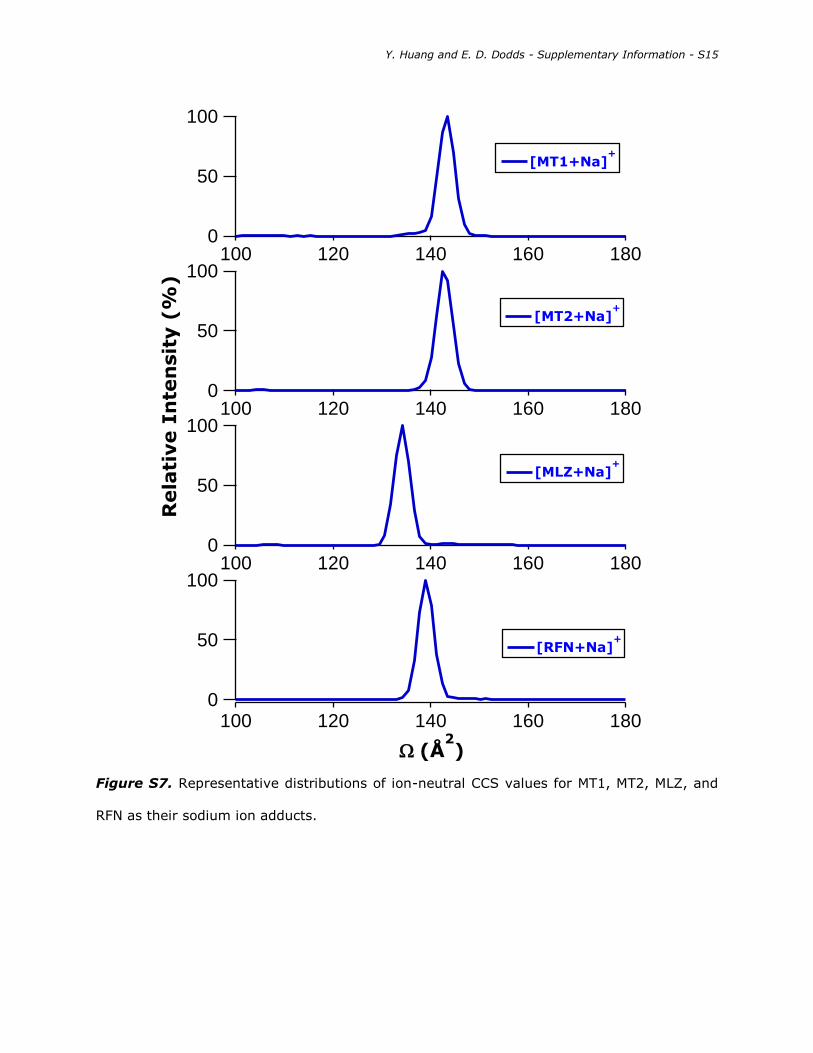
Figure S7. Representative distributions of ion-neutral CCS values for MT1, MT2, MLZ, and
RFN as their sodium ion adducts.
100
50
0
Rela
tive I
nte
nsit
y (
%)
180160140120100
(Å2)
100
50
0180160140120100
100
50
0180160140120100
100
50
0180160140120100
[RFN+Na]+
[MLZ+Na]+
[MT2+Na]+
[MT1+Na]+

Y. Huang and E. D. Dodds - Supplementary Information - S16
Figure S8. Representative distributions of ion-neutral CCS values for MT1, MT2, MLZ, and
RFN as their potassium ion adducts.
100
50
0
Rela
tive I
nte
nsit
y (
%)
180160140120100
(Å2)
100
50
0180160140120100
100
50
0180160140120100
100
50
0180160140120100
[RFN+K]+
[MLZ+K]+
[MT2+K]+
[MT1+K]+
Y. Huang and E. D. Dodds - Supplementary Information - S17
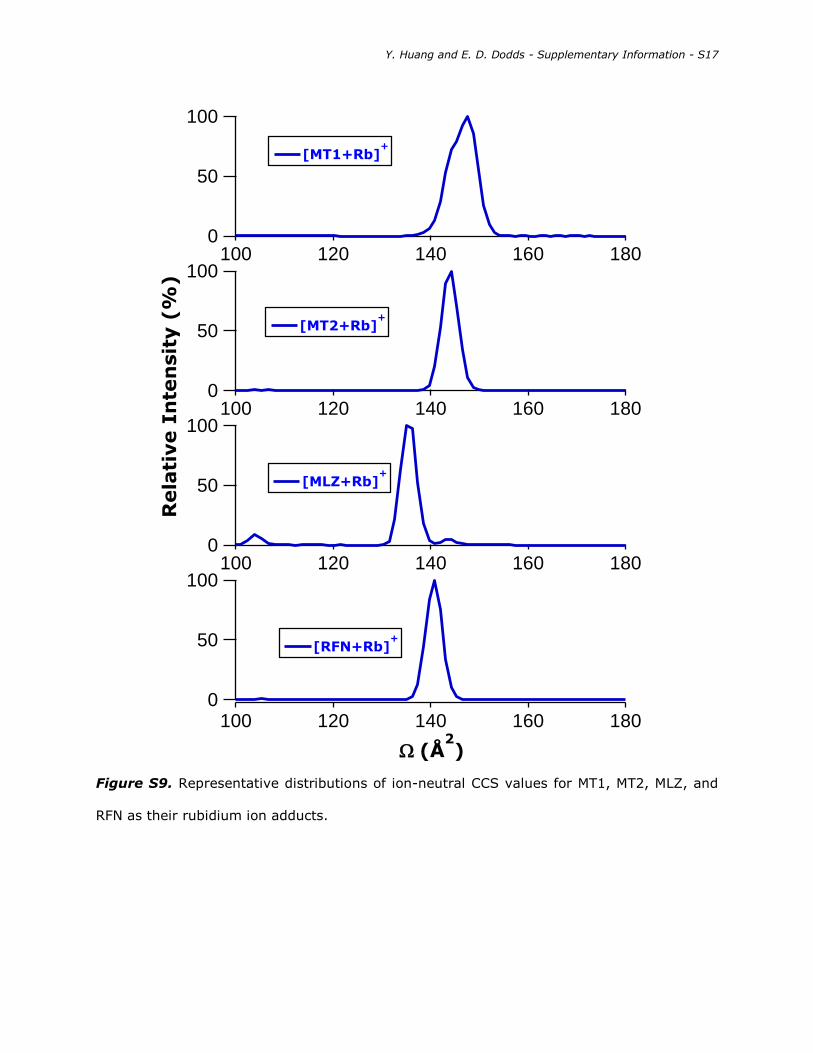
Figure S9. Representative distributions of ion-neutral CCS values for MT1, MT2, MLZ, and
RFN as their rubidium ion adducts.
100
50
0
Rela
tive I
nte
nsit
y (
%)
180160140120100
(Å2)
100
50
0180160140120100
100
50
0180160140120100
100
50
0180160140120100
[RFN+Rb]+
[MLZ+Rb]+
[MT2+Rb]+
[MT1+Rb]+
Y. Huang and E. D. Dodds - Supplementary Information - S18
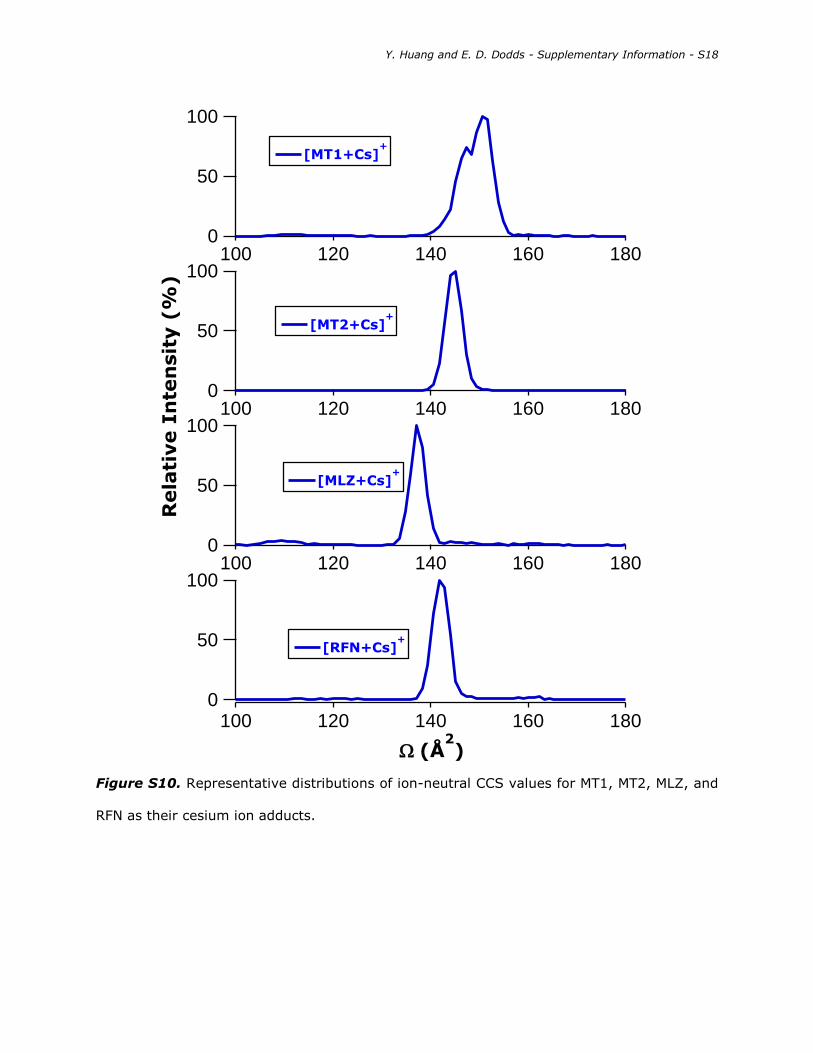
Figure S10. Representative distributions of ion-neutral CCS values for MT1, MT2, MLZ, and
RFN as their cesium ion adducts.
100
50
0
Rela
tive I
nte
nsit
y (
%)
180160140120100
(Å2)
100
50
0180160140120100
100
50
0180160140120100
100
50
0180160140120100
[RFN+Cs]+
[MLZ+Cs]+
[MT2+Cs]+
[MT1+Cs]+

Y. Huang and E. D. Dodds - Supplementary Information - S19
Figure S11. Representative distributions of ion-neutral CCS values for MT1, MT2, MLZ, and
RFN as their magnesium ion adducts.
100
50
0
Rela
tive I
nte
nsit
y (
%)
180160140120100
(Å2)
100
50
0180160140120100
100
50
0180160140120100
100
50
0180160140120100
[MT1+Mg]2+
[MT2+Mg]2+
[MLZ+Mg]2+
[RFN+Mg]2+
Y. Huang and E. D. Dodds - Supplementary Information - S20
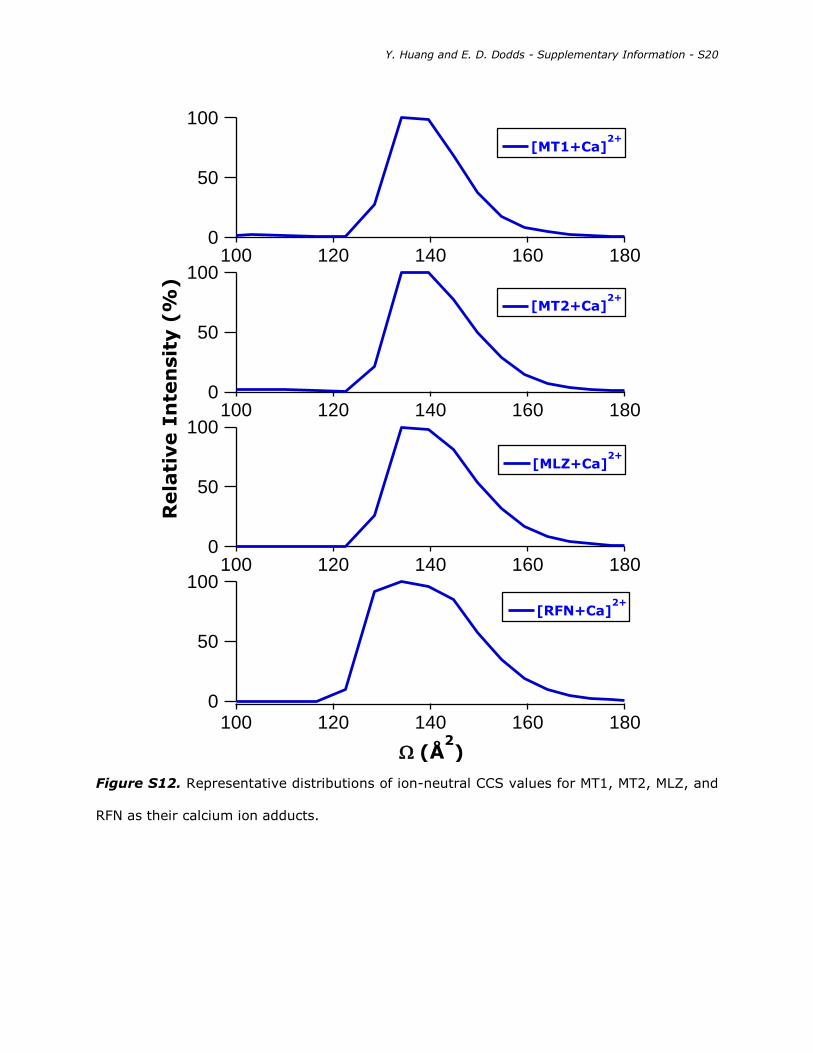
Figure S12. Representative distributions of ion-neutral CCS values for MT1, MT2, MLZ, and
RFN as their calcium ion adducts.
100
50
0
Rela
tive I
nte
nsit
y (
%)
180160140120100
(Å2)
100
50
0180160140120100
100
50
0180160140120100
100
50
0180160140120100
[MT1+Ca]2+
[MT2+Ca]2+
[MLZ+Ca]2+
[RFN+Ca]2+
Y. Huang and E. D. Dodds - Supplementary Information - S21
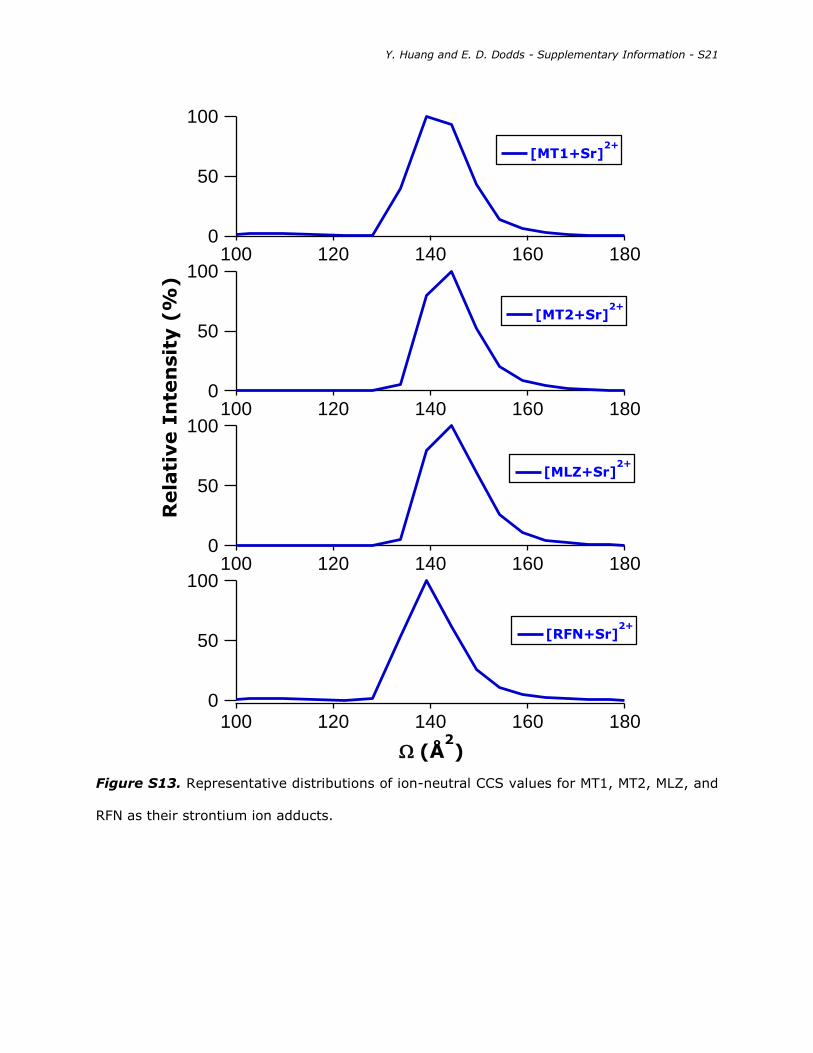
Figure S13. Representative distributions of ion-neutral CCS values for MT1, MT2, MLZ, and
RFN as their strontium ion adducts.
100
50
0
Rela
tive I
nte
nsit
y (
%)
180160140120100
(Å2)
100
50
0180160140120100
100
50
0180160140120100
100
50
0180160140120100
[MT1+Sr]2+
[MT2+Sr]2+
[MLZ+Sr]2+
[RFN+Sr]2+
Y. Huang and E. D. Dodds - Supplementary Information - S22
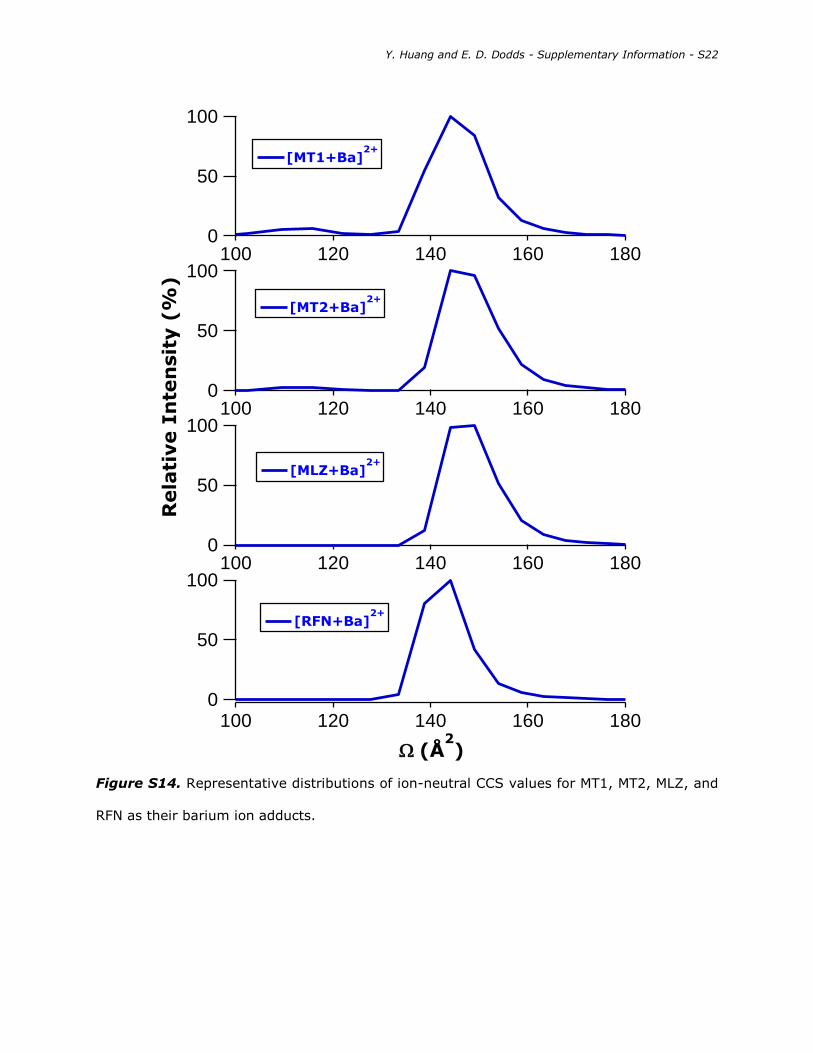
Figure S14. Representative distributions of ion-neutral CCS values for MT1, MT2, MLZ, and
RFN as their barium ion adducts.
100
50
0
Rela
tive I
nte
nsit
y (
%)
180160140120100
(Å2)
100
50
0180160140120100
100
50
0180160140120100
100
50
0180160140120100
[MT1+Ba]2+
[MT2+Ba]2+
[MLZ+Ba]2+
[RFN+Ba]2+
Y. Huang and E. D. Dodds - Supplementary Information - S23
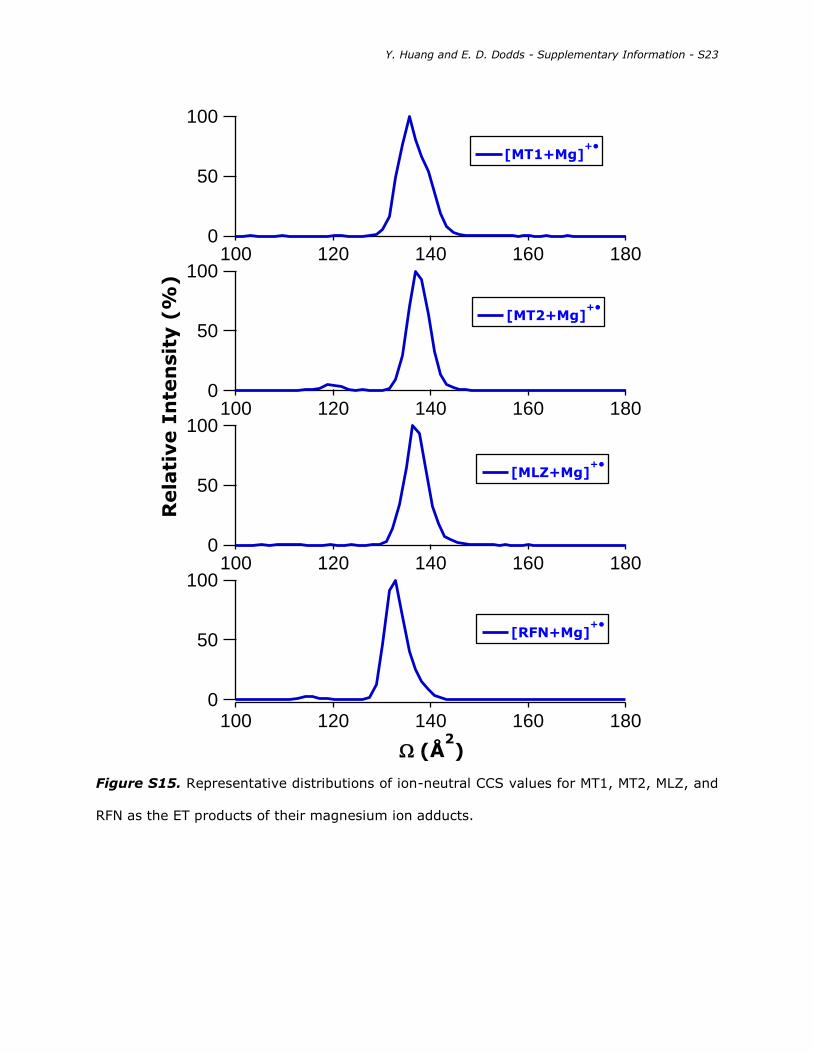
Figure S15. Representative distributions of ion-neutral CCS values for MT1, MT2, MLZ, and
RFN as the ET products of their magnesium ion adducts.
100
50
0
Rela
tive I
nte
nsit
y (
%)
180160140120100
(Å2)
100
50
0180160140120100
100
50
0180160140120100
100
50
0180160140120100
[MT1+Mg]+•
[MT2+Mg]+•
[MLZ+Mg]+•
[RFN+Mg]+•

Y. Huang and E. D. Dodds - Supplementary Information - S24
Figure S16. Representative distributions of ion-neutral CCS values for MT1, MT2, MLZ, and
RFN as the ET products of their calcium ion adducts.
100
50
0
Rela
tive I
nte
nsit
y (
%)
180160140120100
(Å2)
100
50
0180160140120100
100
50
0180160140120100
100
50
0180160140120100
[MT1+Ca]+•
[MT2+Ca]+•
[MLZ+Ca]+•
[RFN+Ca]+•
Y. Huang and E. D. Dodds - Supplementary Information - S25
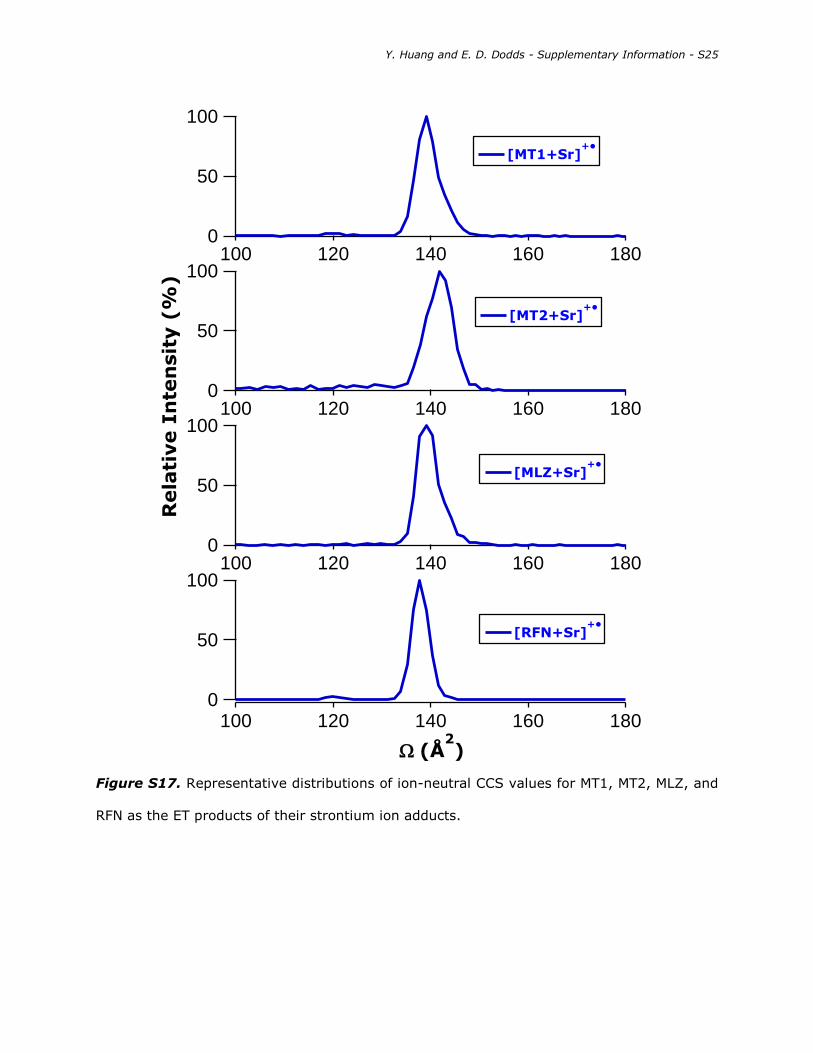
Figure S17. Representative distributions of ion-neutral CCS values for MT1, MT2, MLZ, and
RFN as the ET products of their strontium ion adducts.
100
50
0
Rela
tive I
nte
nsit
y (
%)
180160140120100
(Å2)
100
50
0180160140120100
100
50
0180160140120100
100
50
0180160140120100
[MT1+Sr]+•
[MT2+Sr]+•
[MLZ+Sr]+•
[RFN+Sr]+•

Y. Huang and E. D. Dodds - Supplementary Information - S26
Figure S18. Representative distributions of ion-neutral CCS values for MT1, MT2, MLZ, and
RFN as the ET products of their barium ion adducts.
100
50
0
Rela
tive I
nte
nsit
y (
%)
180160140120100
(Å2)
100
50
0180160140120100
100
50
0180160140120100
100
50
0180160140120100
[MT1+Ba]+•
[MT2+Ba]+•
[MLZ+Ba]+•
[RFN+Ba]+•
Y. Huang and E. D. Dodds - Supplementary Information - S27
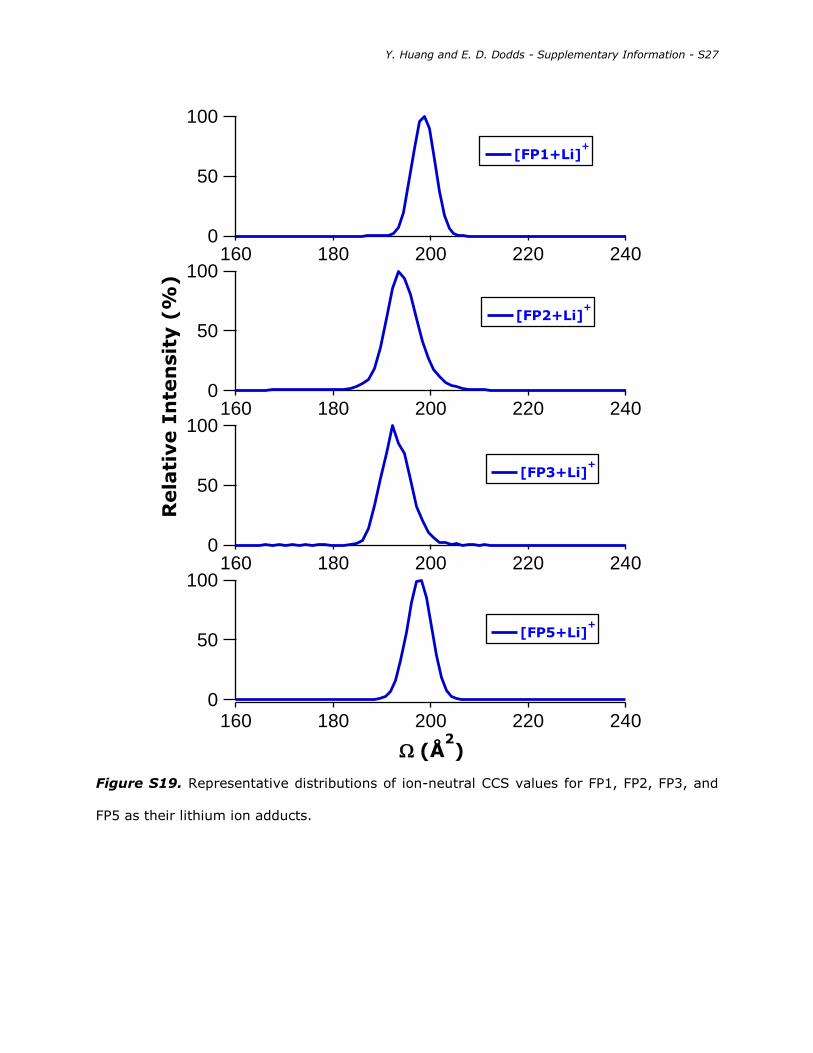
Figure S19. Representative distributions of ion-neutral CCS values for FP1, FP2, FP3, and
FP5 as their lithium ion adducts.
100
50
0240220200180160
100
50
0
Rela
tive I
nte
nsit
y (
%)
240220200180160
(Å2)
100
50
0240220200180160
100
50
0240220200180160
[FP1+Li]+
[FP2+Li]+
[FP3+Li]+
[FP5+Li]+

Y. Huang and E. D. Dodds - Supplementary Information - S28
Figure S20. Representative distributions of ion-neutral CCS values for FP1, FP2, FP3, and
FP5 as their sodium ion adducts.
100
50
0240220200180160
100
50
0
Rela
tive I
nte
nsit
y (
%)
240220200180160
(Å2)
100
50
0240220200180160
100
50
0240220200180160
[FP1+Na]+
[FP2+Na]+
[FP3+Na]+
[FP5+Na]+
Y. Huang and E. D. Dodds - Supplementary Information - S29
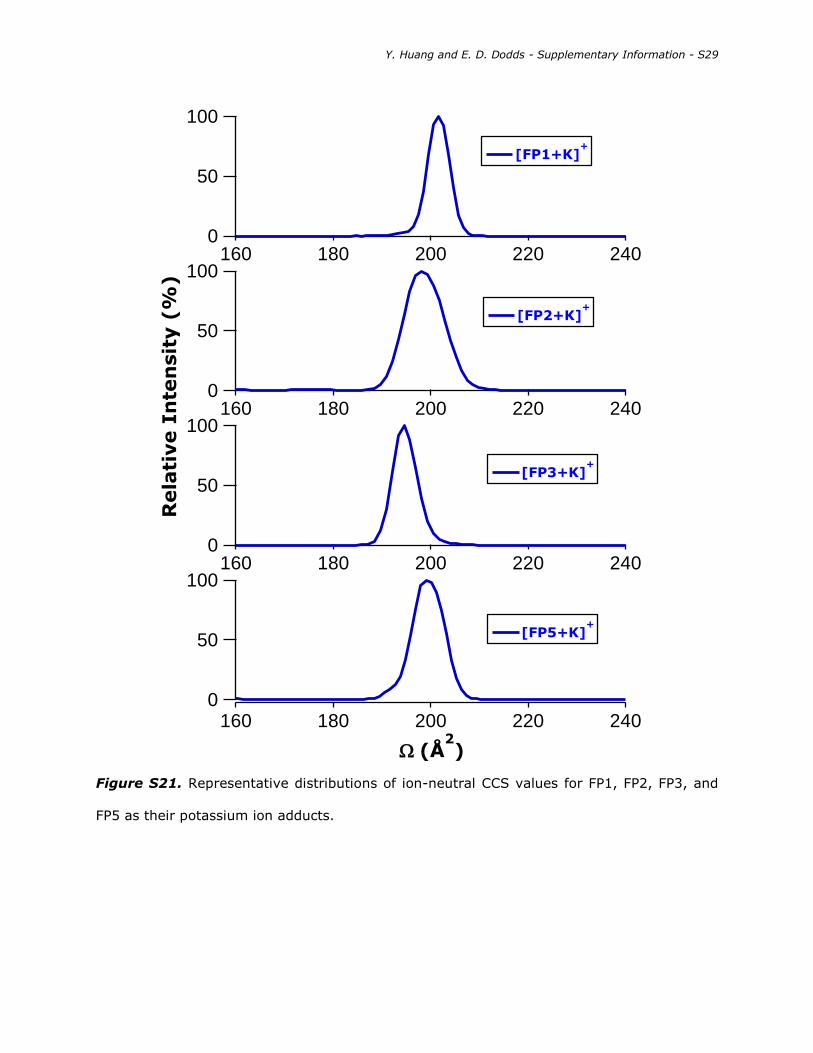
Figure S21. Representative distributions of ion-neutral CCS values for FP1, FP2, FP3, and
FP5 as their potassium ion adducts.
100
50
0240220200180160
100
50
0
Rela
tive I
nte
nsit
y (
%)
240220200180160
(Å2)
100
50
0240220200180160
100
50
0240220200180160
[FP1+K]+
[FP2+K]+
[FP3+K]+
[FP5+K]+
Y. Huang and E. D. Dodds - Supplementary Information - S30
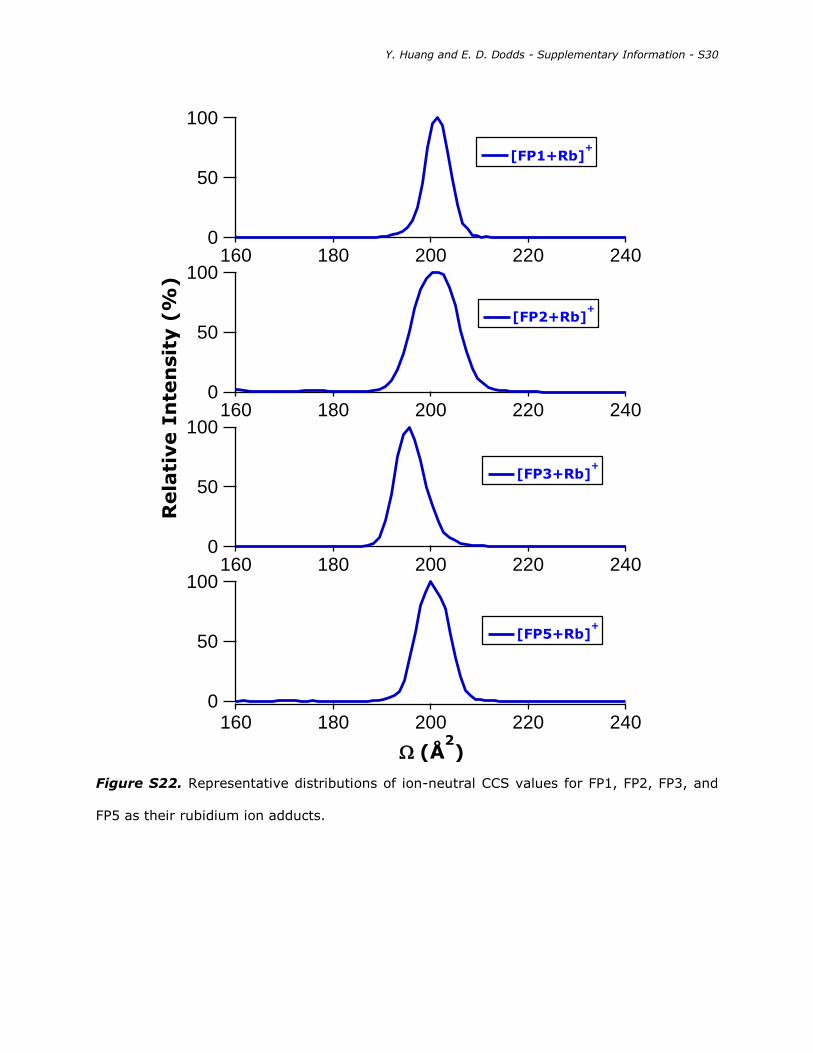
Figure S22. Representative distributions of ion-neutral CCS values for FP1, FP2, FP3, and
FP5 as their rubidium ion adducts.
100
50
0240220200180160
100
50
0
Rela
tive I
nte
nsit
y (
%)
240220200180160
(Å2)
100
50
0240220200180160
100
50
0240220200180160
[FP1+Rb]+
[FP2+Rb]+
[FP3+Rb]+
[FP5+Rb]+
Y. Huang and E. D. Dodds - Supplementary Information - S31
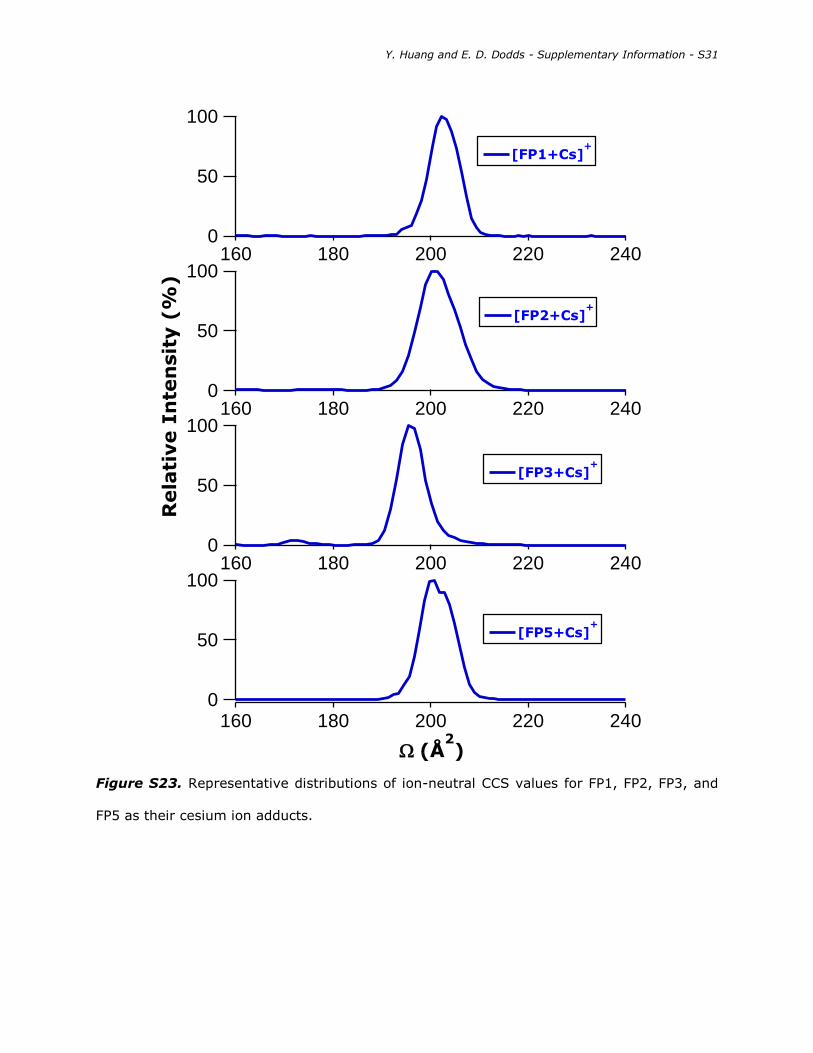
Figure S23. Representative distributions of ion-neutral CCS values for FP1, FP2, FP3, and
FP5 as their cesium ion adducts.
100
50
0240220200180160
100
50
0
Rela
tive I
nte
nsit
y (
%)
240220200180160
(Å2)
100
50
0240220200180160
100
50
0240220200180160
[FP1+Cs]+
[FP2+Cs]+
[FP3+Cs]+
[FP5+Cs]+
Y. Huang and E. D. Dodds - Supplementary Information - S32
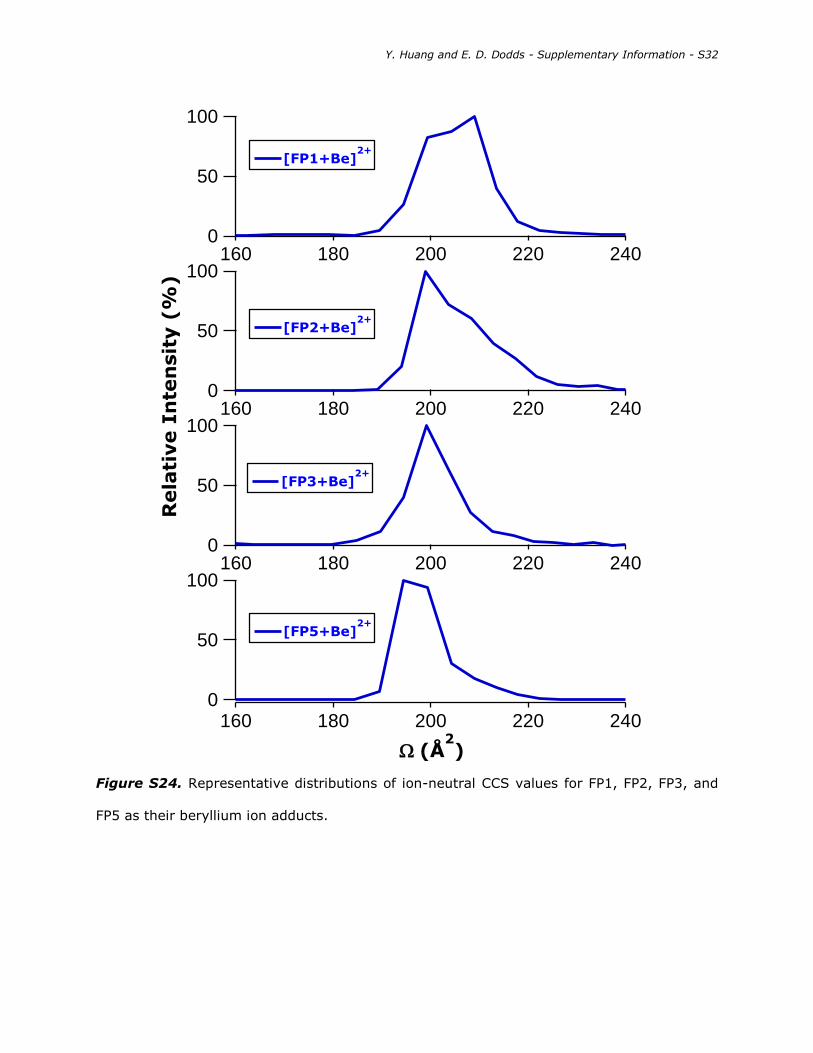
Figure S24. Representative distributions of ion-neutral CCS values for FP1, FP2, FP3, and
FP5 as their beryllium ion adducts.
100
50
0240220200180160
100
50
0
Rela
tive I
nte
nsit
y (
%)
240220200180160
(Å2)
100
50
0240220200180160
100
50
0240220200180160
[FP1+Be]2+
[FP2+Be]2+
[FP3+Be]2+
[FP5+Be]2+

Y. Huang and E. D. Dodds - Supplementary Information - S33
Figure S25. Representative distributions of ion-neutral CCS values for FP1, FP2, FP3, and
FP5 as their magnesium ion adducts.
100
50
0240220200180160
100
50
0
Rela
tive I
nte
nsit
y (
%)
240220200180160
(Å2)
100
50
0240220200180160
100
50
0240220200180160
[FP1+Mg]2+
[FP2+Mg]2+
[FP3+Mg]2+
[FP5+Mg]2+

Y. Huang and E. D. Dodds - Supplementary Information - S34
Figure S26. Representative distributions of ion-neutral CCS values for FP1, FP2, FP3, and
FP5 as their calcium ion adducts.
100
50
0240220200180160
100
50
0
Rela
tive I
nte
nsit
y (
%)
240220200180160
(Å2)
100
50
0240220200180160
100
50
0240220200180160
[FP1+Ca]2+
[FP2+Ca]2+
[FP3+Ca]2+
[FP5+Ca]2+
Y. Huang and E. D. Dodds - Supplementary Information - S35
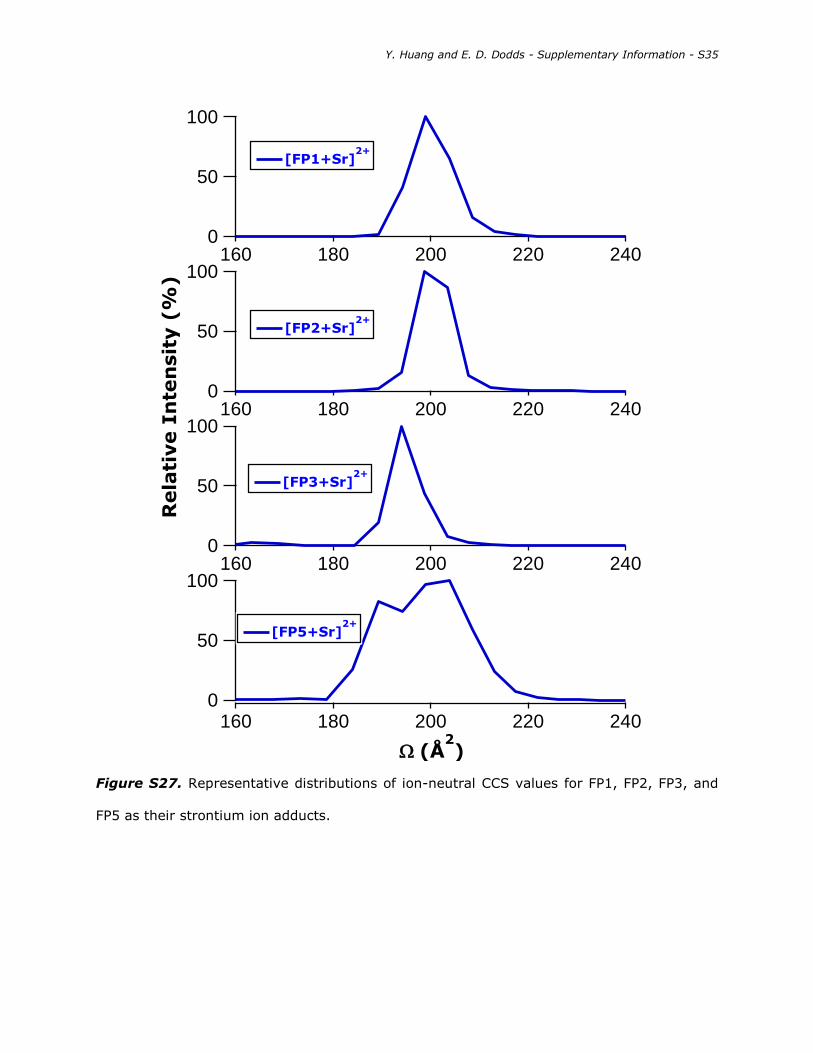
Figure S27. Representative distributions of ion-neutral CCS values for FP1, FP2, FP3, and
FP5 as their strontium ion adducts.
100
50
0240220200180160
100
50
0
Rela
tive I
nte
nsit
y (
%)
240220200180160
(Å2)
100
50
0240220200180160
100
50
0240220200180160
[FP1+Sr]2+
[FP2+Sr]2+
[FP3+Sr]2+
[FP5+Sr]2+
Y. Huang and E. D. Dodds - Supplementary Information - S36
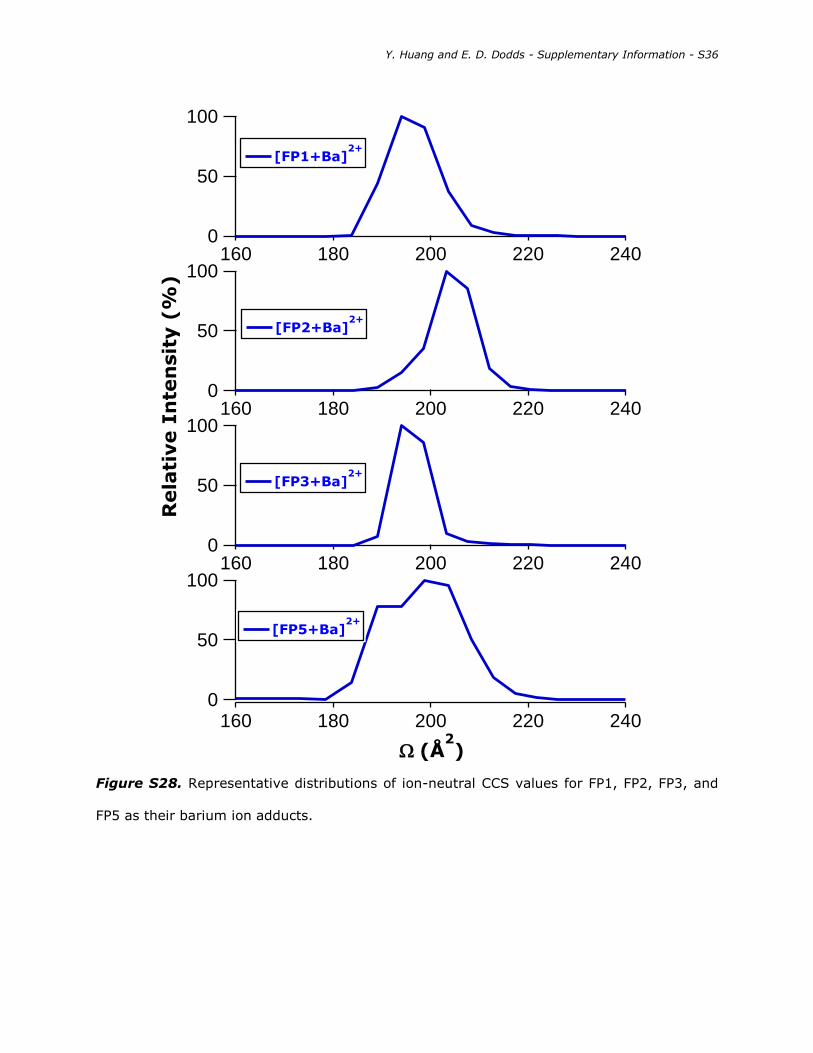
Figure S28. Representative distributions of ion-neutral CCS values for FP1, FP2, FP3, and
FP5 as their barium ion adducts.
100
50
0240220200180160
100
50
0
Rela
tive I
nte
nsit
y (
%)
240220200180160
(Å2)
100
50
0240220200180160
100
50
0240220200180160
[FP1+Ba]2+
[FP2+Ba]2+
[FP3+Ba]2+
[FP5+Ba]2+

Y. Huang and E. D. Dodds - Supplementary Information - S37
Figure S29. Representative distributions of ion-neutral CCS values for FP1, FP2, FP3, and
FP5 as the ET products of their beryllium ion adducts.
100
50
0240220200180160
100
50
0
Rela
tive I
nte
nsit
y (
%)
240220200180160
(Å2)
100
50
0240220200180160
100
50
0240220200180160
[FP1+Be]+•
[FP2+Be]+•
[FP3+Be]+•
[FP5+Be]+•

Y. Huang and E. D. Dodds - Supplementary Information - S38
Figure S30. Representative distributions of ion-neutral CCS values for FP1, FP2, FP3, and
FP5 as the ET products of their magnesium ion adducts.
100
50
0240220200180160
100
50
0
Rela
tive I
nte
nsit
y (
%)
240220200180160
(Å2)
100
50
0240220200180160
100
50
0240220200180160
[FP1+Mg]+•
[FP2+Mg]+•
[FP3+Mg]+•
[FP5+Mg]+•

Y. Huang and E. D. Dodds - Supplementary Information - S39
Figure S31. Representative distributions of ion-neutral CCS values for FP1, FP2, FP3, and
FP5 as the ET products of their calcium ion adducts.
100
50
0240220200180160
100
50
0
Rela
tive I
nte
nsit
y (
%)
240220200180160
(Å2)
100
50
0240220200180160
100
50
0240220200180160
[FP1+Ca]+•
[FP2+Ca]+•
[FP3+Ca]+•
[FP5+Ca]+•
Y. Huang and E. D. Dodds - Supplementary Information - S40
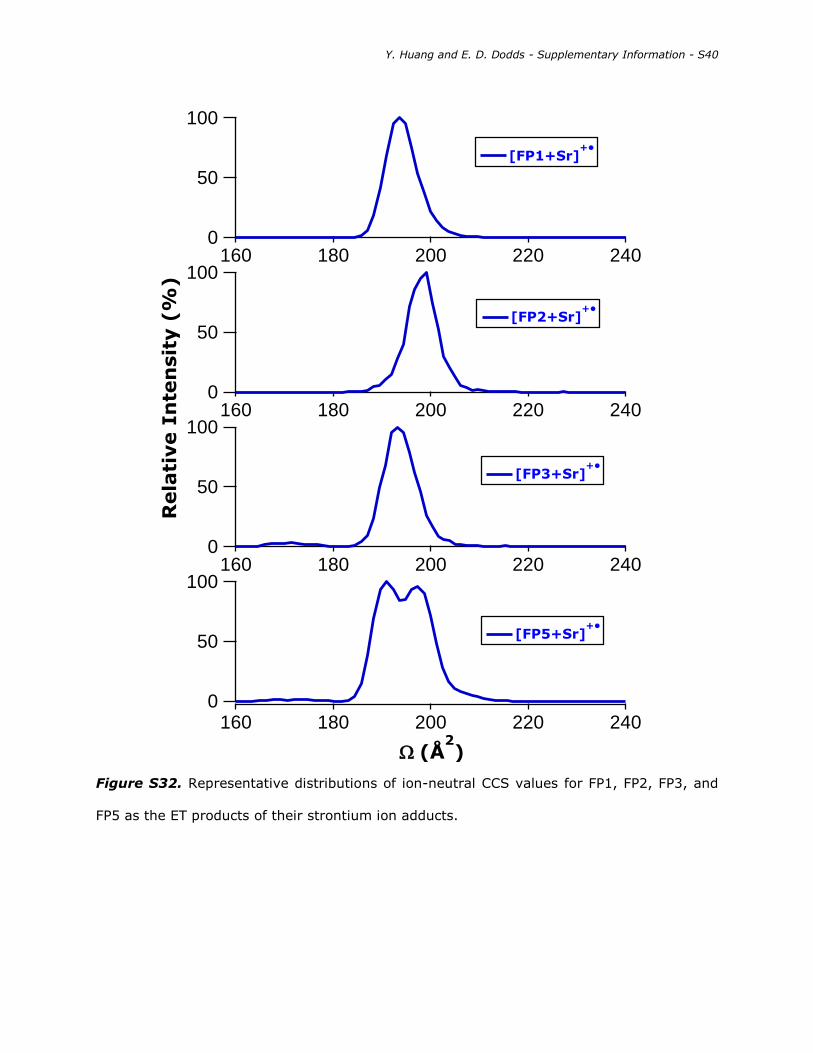
Figure S32. Representative distributions of ion-neutral CCS values for FP1, FP2, FP3, and
FP5 as the ET products of their strontium ion adducts.
100
50
0240220200180160
100
50
0
Rela
tive I
nte
nsit
y (
%)
240220200180160
(Å2)
100
50
0240220200180160
100
50
0240220200180160
[FP1+Sr]+•
[FP2+Sr]+•
[FP3+Sr]+•
[FP5+Sr]+•
Y. Huang and E. D. Dodds - Supplementary Information - S41
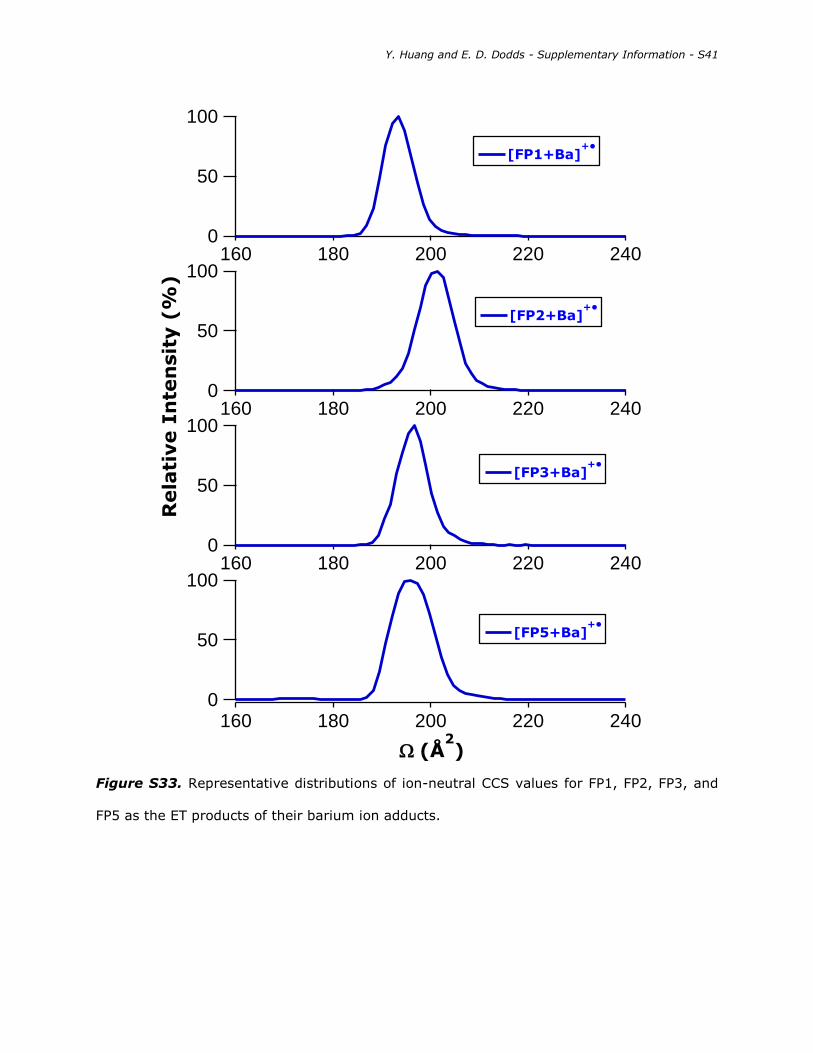
Figure S33. Representative distributions of ion-neutral CCS values for FP1, FP2, FP3, and
FP5 as the ET products of their barium ion adducts.
100
50
0240220200180160
100
50
0
Rela
tive I
nte
nsit
y (
%)
240220200180160
(Å2)
100
50
0240220200180160
100
50
0240220200180160
[FP1+Ba]+•
[FP2+Ba]+•
[FP3+Ba]+•
[FP5+Ba]+•

Y. Huang and E. D. Dodds - Supplementary Information - S42
Figure S34. Representative distributions of ion-neutral CCS values for FH1 and FH2 as their
lithium ion adducts.
100
50
0260240220200180
100
50
0
Rela
tive I
nte
nsit
y (
%)
260240220200180
(Å2)
[FH1+Li]+
[FH2+Li]+

Y. Huang and E. D. Dodds - Supplementary Information - S43
Figure S35. Representative distributions of ion-neutral CCS values for FH1 and FH2 as their
sodium ion adducts.
100
50
0260240220200180
100
50
0
Rela
tive I
nte
nsit
y (
%)
260240220200180
(Å2)
[FH1+Na]+
[FH2+Na]+
Y. Huang and E. D. Dodds - Supplementary Information - S44
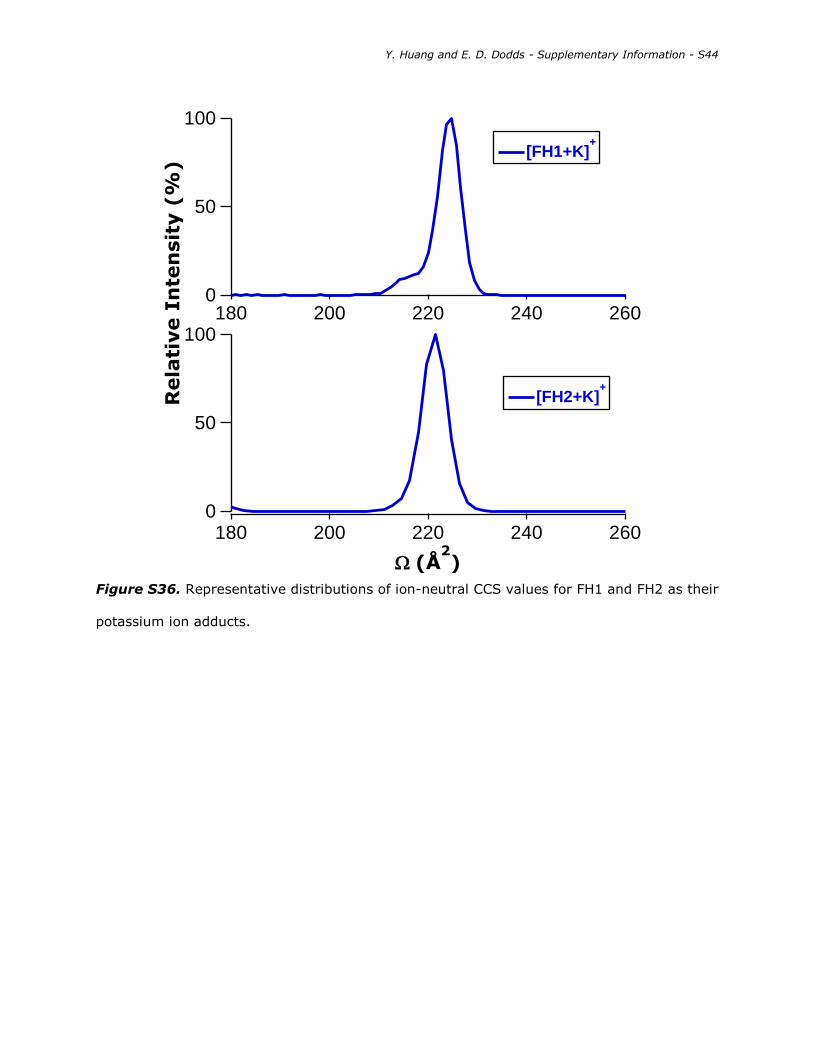
Figure S36. Representative distributions of ion-neutral CCS values for FH1 and FH2 as their
potassium ion adducts.
100
50
0260240220200180
100
50
0
Rela
tive I
nte
nsit
y (
%)
260240220200180
(Å2)
[FH1+K]+
[FH2+K]+
Y. Huang and E. D. Dodds - Supplementary Information - S45
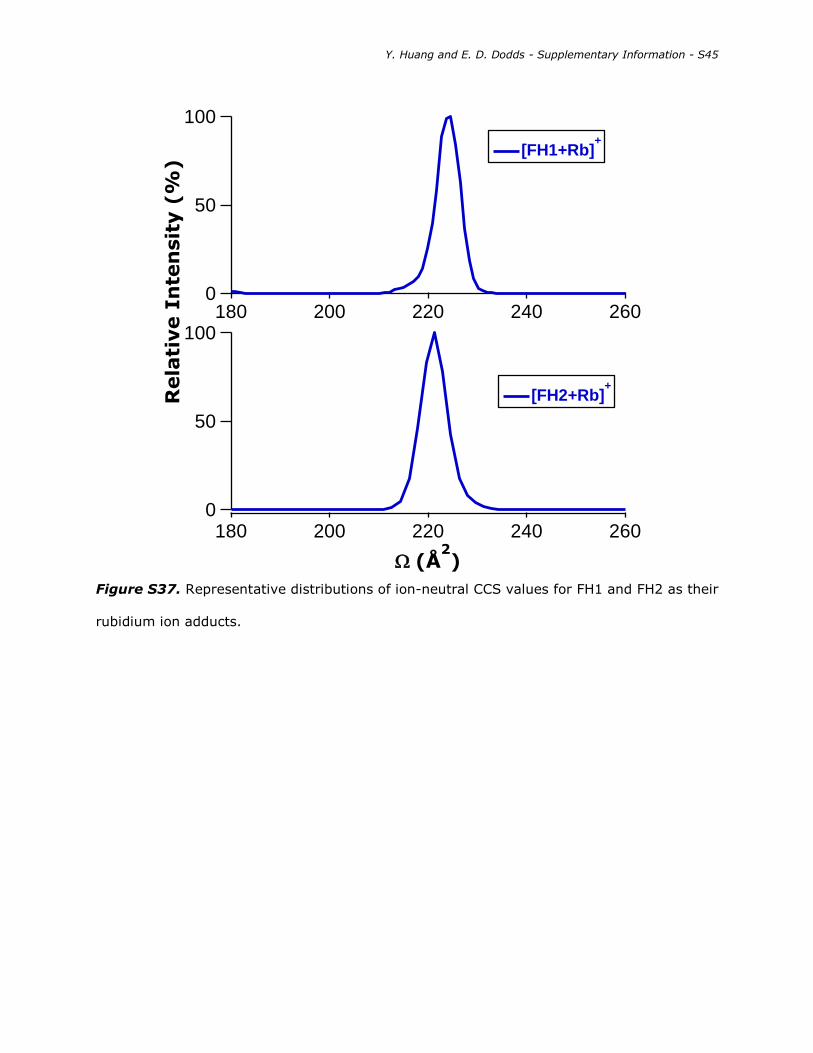
Figure S37. Representative distributions of ion-neutral CCS values for FH1 and FH2 as their
rubidium ion adducts.
100
50
0260240220200180
100
50
0
Rela
tive I
nte
nsit
y (
%)
260240220200180
(Å2)
[FH1+Rb]+
[FH2+Rb]+

Y. Huang and E. D. Dodds - Supplementary Information - S46
Figure S38. Representative distributions of ion-neutral CCS values for FH1 and FH2 as their
cesium ion adducts.
100
50
0260240220200180
100
50
0
Rela
tive I
nte
nsit
y (
%)
260240220200180
(Å2)
[FH1+Cs]+
[FH2+Cs]+

Y. Huang and E. D. Dodds - Supplementary Information - S47
Figure S39. Representative distributions of ion-neutral CCS values for FH1 and FH2 as their
beryllium ion adducts.
100
50
0260240220200180
100
50
0
Rela
tive I
nte
nsit
y (
%)
260240220200180
(Å2)
[FH1+Be]2+
[FH2+Be]2+

Y. Huang and E. D. Dodds - Supplementary Information - S48
Figure S40. Representative distributions of ion-neutral CCS values for FH1 and FH2 as their
magnesium ion adducts.
100
50
0260240220200180
100
50
0
Rela
tive I
nte
nsit
y (
%)
260240220200180
(Å2)
[FH1+Mg]2+
[FH2+Mg]2+

Y. Huang and E. D. Dodds - Supplementary Information - S49
Figure S41. Representative distributions of ion-neutral CCS values for FH1 and FH2 as their
calcium ion adducts.
100
50
0260240220200180
100
50
0
Rela
tive I
nte
nsit
y (
%)
260240220200180
(Å2)
[FH1+Ca]2+
[FH2+Ca]2+

Y. Huang and E. D. Dodds - Supplementary Information - S50
Figure S42. Representative distributions of ion-neutral CCS values for FH1 and FH2 as their
strontium ion adducts.
100
50
0260240220200180
100
50
0
Rela
tive I
nte
nsit
y (
%)
260240220200180
(Å2)
[FH1+Sr]2+
[FH2+Sr]2+
Y. Huang and E. D. Dodds - Supplementary Information - S51
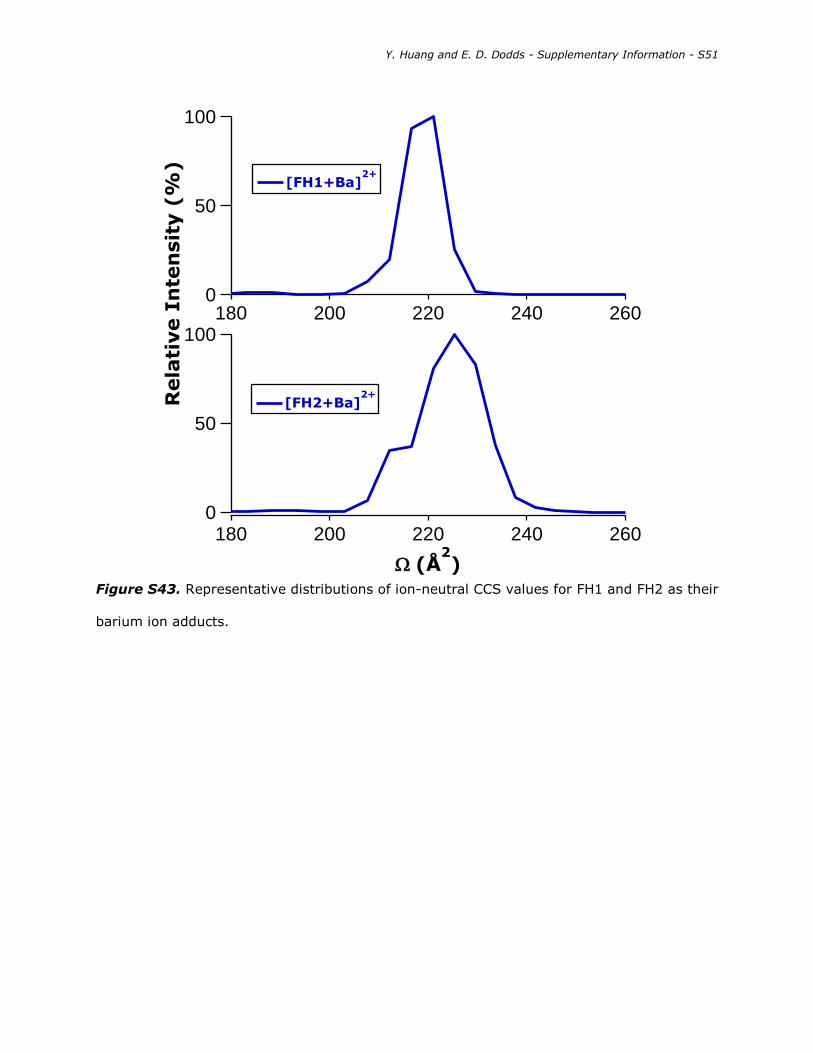
Figure S43. Representative distributions of ion-neutral CCS values for FH1 and FH2 as their
barium ion adducts.
100
50
0260240220200180
100
50
0
Rela
tive I
nte
nsit
y (
%)
260240220200180
(Å2)
[FH1+Ba]2+
[FH2+Ba]2+

Y. Huang and E. D. Dodds - Supplementary Information - S52
Figure S44. Representative distributions of ion-neutral CCS values for FH1 and FH2 as the
ET products of their beryllium ion adducts.
100
50
0260240220200180
100
50
0
Rela
tive I
nte
nsit
y (
%)
260240220200180
(Å2)
[FH1+Be]+•
[FH2+Be]+•
Y. Huang and E. D. Dodds - Supplementary Information - S53
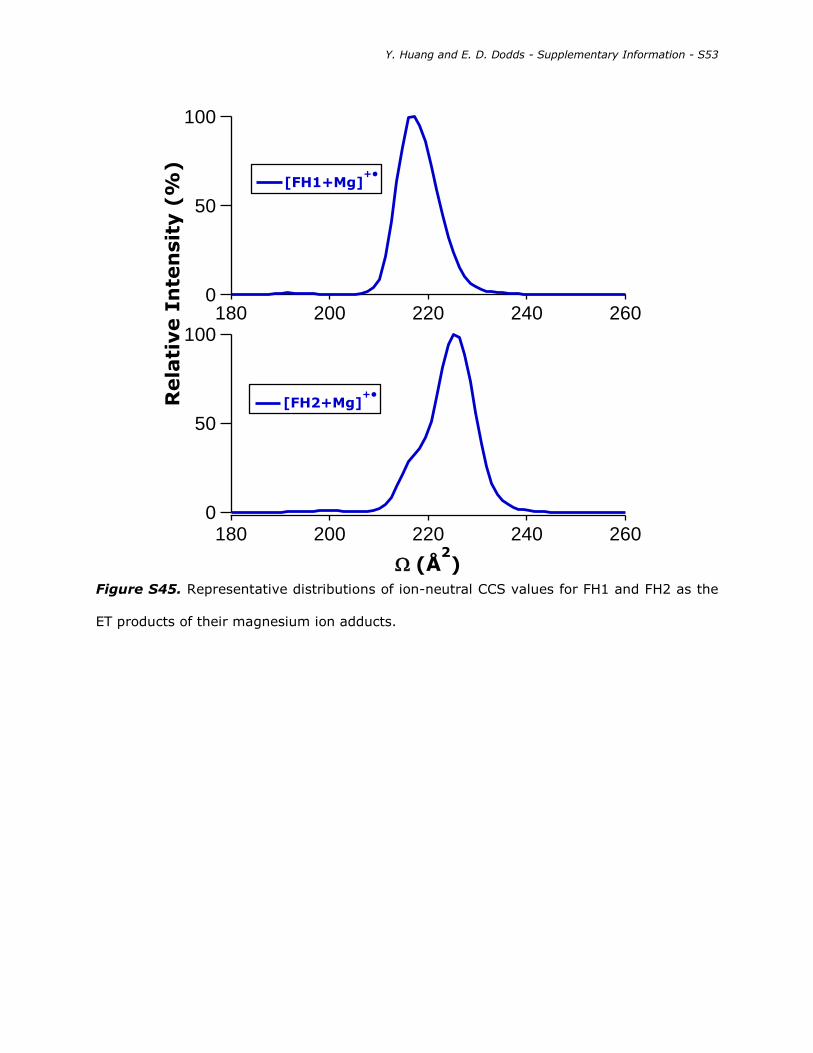
Figure S45. Representative distributions of ion-neutral CCS values for FH1 and FH2 as the
ET products of their magnesium ion adducts.
100
50
0260240220200180
100
50
0
Rela
tive I
nte
nsit
y (
%)
260240220200180
(Å2)
[FH1+Mg]+•
[FH2+Mg]+•

Y. Huang and E. D. Dodds - Supplementary Information - S54
Figure S46. Representative distributions of ion-neutral CCS values for FH1 and FH2 as the
ET products of their calcium ion adducts.
100
50
0260240220200180
100
50
0
Rela
tive I
nte
nsit
y (
%)
260240220200180
(Å2)
[FH1+Ca]+•
[FH2+Ca]+•

Y. Huang and E. D. Dodds - Supplementary Information - S55
Figure S47. Representative distributions of ion-neutral CCS values for FH1 and FH2 as the
ET products of their strontium ion adducts.
100
50
0260240220200180
100
50
0
Rela
tive I
nte
nsit
y (
%)
260240220200180
(Å2)
[FH1+Sr]+•
[FH2+Sr]+•

Y. Huang and E. D. Dodds - Supplementary Information - S56
Figure S48. Representative distributions of ion-neutral CCS values for FH1 and FH2 as the
ET products of their barium ion adducts.
100
50
0260240220200180
100
50
0
Rela
tive I
nte
nsit
y (
%)
260240220200180
(Å2)
[FH1+Ba]+•
[FH2+Ba]+•