hudm4122 probability and statistical inference and statistical inference march 25, 2015 midterms •...
TRANSCRIPT

HUDM4122Probability and Statistical Inference
March 25, 2015

Midterms
• Will be handed back at the end of class

In the last class
• We studied the Flat and Normal Probability Distributions

Flat Distribution
• Also called the uniform distribution

Normal Probability Distribution

“Standardized Normal Distribution” aka Z( = 0, = 1)

For Continuous Probability Distributions such as these
• Probability of value between a and b is area under curve between a and b

Area under curve for flat distribution
• Is the rectangle area formula
• Simply width times height

Area under curve for normal distribution
• Is a bit more complicated
• So we use a stats package or a lookup table– Appendix I, Table 3

Standardized Normal Distribution
P(X<‐1.96)=0.025

Standardized Normal Distribution
P(X>1.96)=0.025

Standardized Normal Distribution
P(X<1.96)=0.975

Warm‐up question
• Assuming a Z distribution
• What is P(Z<1.23)?

Before we move on…
• Any questions about the flat or normal probability distributions?

Comments? Questions?

Experimental Designs

Experimental Designs
• IMHO should be at the beginning of Ch. 9, not the beginning of Ch.7
• But since you just read this, let’s discuss this now…

Experimental Designs
• So far, the authors of the book have used “experiment” in a rather casual fashion
• Let’s rigorize that a little bit

Experiment• An experiment compares two (or more) groups to each other
• The groups differ in terms of a treatment, a different way the groups (“conditions”) are treated
• The two groups are treated identically aside from the treatment
• The groups are selected in a fashion that allows valid inference– Typically, random selection

Controlled Experiment• An experiment compares two (or more) groups to each
other– One group is a control
• The groups differ in terms of a treatment, a different way the groups (“conditions”) are treated – The control receives regular treatment– “Business as usual curriculum”, placebo, etc.
• The two groups are treated identically aside from the treatment
• The groups are selected in a fashion that allows valid inference– Typically, random selection
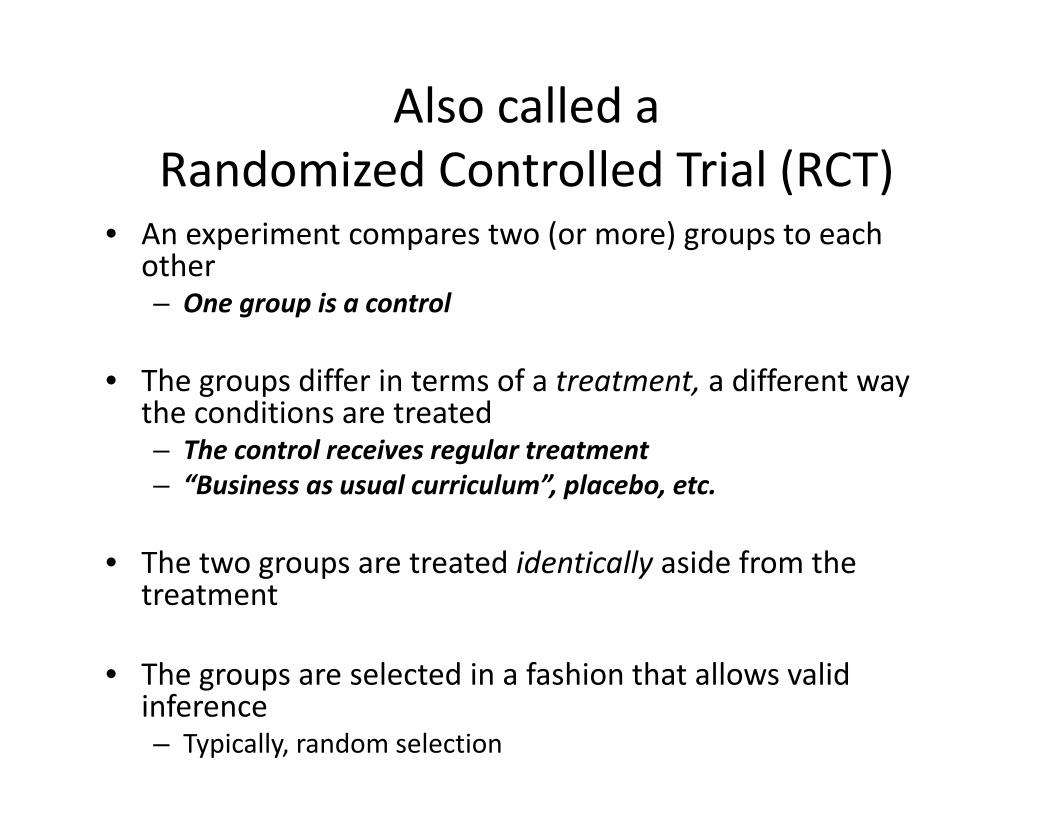
Also called a Randomized Controlled Trial (RCT)
• An experiment compares two (or more) groups to each other– One group is a control
• The groups differ in terms of a treatment, a different way the conditions are treated – The control receives regular treatment– “Business as usual curriculum”, placebo, etc.
• The two groups are treated identically aside from the treatment
• The groups are selected in a fashion that allows valid inference– Typically, random selection

Is this an experiment? A controlled experiment?
• I take 90 students and assign each student randomly to– Use traditional classroom curriculum– Use Reasoning Mind software
• The students take the exact same pre‐test and post‐test, and use either curriculum for 1 hour

Is this an experiment? A controlled experiment?
• I take 90 students and assign each student randomly to– Use traditional classroom curriculum– Use Reasoning Mind software
• The students take a pre‐test and post‐test tailored to their specific curriculum, and use either curriculum for 1 hour

Is this an experiment? A controlled experiment?
• I take 60 patients and assign each patient randomly to– Receive fworplomycin, an experimental medication
– Receive penicillin
• The patients take the medicine for one week and then return for further evaluation

Is this an experiment? A controlled experiment?
• I take 60 patients who have reported taking St. John’s Wort in the past month
• I ask each patient how many SJW pills they took each day
• I use a standard measure to test their degree of depression symptoms
• I study the relationship between SJW dosage and depression

This is an observational study
• The data already existed before you decided to study it
• You didn’t apply any treatments to subjects

Nothing inherently wrong with observational studies…
• Sometimes they are the only feasible way to study a research question
• But they do not allow for true causal inference
• Correlation is not causation!

Is this an experiment? A controlled experiment?
• I take 60 heroes and give each hero iocainepowder. Some of the heroes previously had spent two years building up an immunity to iocaine powder.
• The heroes take the iocaine powder and then return for further evaluation

Is this an experiment? A controlled experiment?
• I take 60 heroes and give each hero iocainepowder. I then randomly select heroes to– Receive the antidote– Receive a sugar pill
• The heroes take the treatment and then return for further evaluation

Is this an experiment? A controlled experiment?
• 45 students at Canterlot High School are already using Reasoning Mind
• 45 student at Yonkers High School are already using Dreambox
• The students take the exact same pre‐test and post‐test, and use either curriculum for 1 hour

This one’s a quasi‐experiment
• Like an experiment in all ways
• Except assignment is not random or designed to facilitate inference in another way
• There is some factor that leads to assignment – it’s not entirely arbitary – but it’s not random

Examples of quasi‐experiments
• Two high schools choose different curricula; you compare those high schools
• Doctors in the USA prescribe fworplomycinbut doctors in Canada can’t prescribe it, so they use trantorcillin
• People individually decide whether to drive or take the train

Why are experiments better than quasi‐experiments?

Why are experiments better than quasi‐experiments?
• Easier to make true causal inference• Only one thing is being varied

Why are quasi‐experiments better than experiments?

Why are quasi‐experiments better than experiments?
• A *lot* more feasible to conduct

What about this study?
• I take 90 students, organized into 6 classrooms, and assign each classroom randomly to– Use traditional classroom curriculum– Use Reasoning Mind software
• The students take the exact same pre‐test and post‐test, and use either curriculum for 1 hour

It’s an controlled experiment
• But only at the level of whole classrooms
• It’s outside the scope of this class, but the method properly used in situations like this one is Hierarchical Linear Models

Questions? Comments?
More advanced sampling

Stratified Sampling
• If your data has two or more meaningful subpopulations, called strata
• You can also sample at the level of these subpopulations, called stratified sampling

Example• You are conducting a study on the effects of using dragon wands or phoenix wands
• There are four houses at Hogwarts: Gryffindor, Ravenclaw, Hufflepuff, and Slytherin
• Professor Snape believes that different types of wands will work differently for different Houses
• Therefore, you sample randomly into condition within each House

Example
• Of the 8 Gryffindors, you randomly sample 4 into dragon and 4 into phoenix
• Of the 12 Ravenclaws, you randomly sample 6 into dragon and 6 into phoenix
• Of the 20 Hufflepuffs, you randomly sample 10 into dragon and 10 into phoenix
• Of the 9 Slytherins, you randomly sample 5 into dragon and 4 into phoenix

Any questions?

Cluster Sampling
• The population is divided into a set of clusters• It is easy to sample an entire cluster• It is hard to sample within each cluster
• You randomly choose a set of clusters

Example
• There are 3000 colleges in the USA• You randomly choose 10 colleges and sample all the students in these colleges
• Note, your unit of analysis now becomes the colleges rather than the students, and you should use methods like HLM

Non‐randomized samples
• Convenience sample– Ask whoever is convenient
• Snowball sample– Ask your friends to ask their friends
• Judgment sample– You just pick
• Quota sample– You just pick, but you try to make the sample resemble the proportions in the overall population

Non‐randomized samples• Convenience sample
– Ask whoever is convenient• Snowball sample
– Ask your friends to ask their friends• Judgment sample
– You just pick• Quota sample
– You just pick, but you try to make the sample resemble the proportions in the overall population
• The book says you cannot make inferences from these• But I would instead say that • You cannot generalize to overall population from these

Questions? Comments?

Sampling distribution of the mean

Sampling distribution of the mean
• In previous weeks, we’ve talked about the distribution of a variable’s values
• But there’s also the sampling distribution of the mean of that variable itself

Sampling distribution of the mean
• In previous weeks, we’ve talked about the distribution of a variable’s values
• But there’s also the sampling distribution of the mean of that variable itself
• In other words, how certain are we that =M?

Sampling distribution of the mean
• If we want to know the mean• And we have a sample
• Then the population mean’s value may not be the same as the sample mean’s value
• Instead, we have a probability distribution for that mean
• Called the sample distribution of the mean

In visual terms

Here’s the distribution of a variable

Here’s the population mean

But in an actual finite sample

The sample mean might be

Or

Or even

There’s a probability distribution for where the mean actually is

Any questions?

How do we find that probability distribution?
• Again, called the sample distribution of the mean

Three methods
• Use the laws of probability• Use a monte carlo simulation• Use statistical theorems to approximate the answer

The book gives an example of this one
• Use the laws of probability• Use a monte carlo simulation• Use statistical theorems to approximate the answer

It becomes rather painful rather quickly
• Use the laws of probability• Use a monte carlo simulation• Use statistical theorems to approximate the answer

Much of advanced statistics comes from applying this method
• Use the laws of probability• Use a monte carlo simulation• Use statistical theorems to approximate the answer
Monte Carlo simulation
• Simulate the process that you want to estimate the value for a huge number of times (100,000+)

Monte Carlo simulation
• Gives imprecise answers (unless your N is truly gigantic)
• Time‐consuming• Often the only option for very hard problems• Those problems are relatively uncommon

Monte Carlo simulation
• The core problems you’re likely to encounter don’t require Monte Carlo simulation

Monte Carlo simulation
• The core problems you’re likely to encounter don’t require Monte Carlo simulation
• Or, to put it another way, most fields have shaped themselves around types of inference that don’t require Monte Carlo simulation

Third approach
• Use the laws of probability• Use a monte carlo simulation• Use statistical theorems to approximate the answer

This is most of what we’ll do the rest of this semester
• Use the laws of probability• Use a monte carlo simulation• Use statistical theorems to approximate the answer

And in the classes immediately following this one
• Use the laws of probability• Use a monte carlo simulation• Use statistical theorems to approximate the answer

Here’s a handy tool
• For finding the sampling distribution of the mean

Central Limit Theorem

Central Limit Theorem
• Take a population with– True mean – True standard deviation
• Even if it is non‐normal in its distribution– For certain violations of normality
• If you take a large enough random sample of n observations
• Then the sampling distribution of the sample mean • Will be approximately normally distributed

And
• The degree to which this sampling distribution approximates the normal distribution
• Will increase
• As n becomes increasingly larger

Let’s say you roll a 6‐sided die
• What is the probability of each possible result? – (We’re not talking about the sample distribution of the mean yet)

The Flat Distribution!
• Does everyone see why this is?
0
0.02
0.04
0.06
0.08
0.1
0.12
0.14
0.16
0.18
1 2 3 4 5 6
Prob
ability
Mean

Let’s say you roll a 6‐sided die one time
• What will be the sampling distribution of the mean?

The Flat Distribution!
• Does everyone see why this is?
0
0.02
0.04
0.06
0.08
0.1
0.12
0.14
0.16
0.18
1 2 3 4 5 6
Prob
ability
Mean

Let’s say you roll a 6‐sided die two times
• What will be the sampling distribution of the mean?

Let’s say you roll a 6‐sided die two times
• What will be the sampling distribution of the mean?
• 3.5 = 1&6, 2&5, 3&4, 4&3, 5&2, 6&1 ‐> 6/36• 3 = 1&5, 2&4, 3&3, 4&2, 5&1 ‐> 5/36• 4 = 2&6, 3&5, 4&4, 5&3, 6&2 ‐> 5/36• And so on…

Let’s say you roll a 6‐sided die two times
• What will be the sampling distribution of the mean?

Let’s say you roll a 6‐sided die three times
• What will be the sampling distribution of the mean?

Let’s say you roll a 6‐sided die three times
• What will be the sampling distribution of the mean?

Let’s say you roll a 6‐sided die four times
• What will be the sampling distribution of the mean?

Let’s say you roll a 6‐sided die four times
• What will be the sampling distribution of the mean?

So…
• Even when n=4• And a flat distribution for each trial
• We get a reasonable approximation of a normal distribution

Pretty cool, right?

Questions? Comments?

And moreso, by CLT,
• The sampling distribution of the sample mean
• Will have mean
• And standard deviation

Note
• Even though the sampled population can be expected to have standard deviation
• The standard deviation for the sampling distribution of the mean will equal
• Our estimation of the mean is tighter than the population’s overall standard deviation

Which makes sense…
• The more data you have, the more certain you can be about the mean

For n=2 and dice rolling
• There’s about a 55% chance the sample mean will be below 3 or above 4

For n=3 and dice rolling
• There’s about a 50% chance the sample mean will be below 3 or above 4
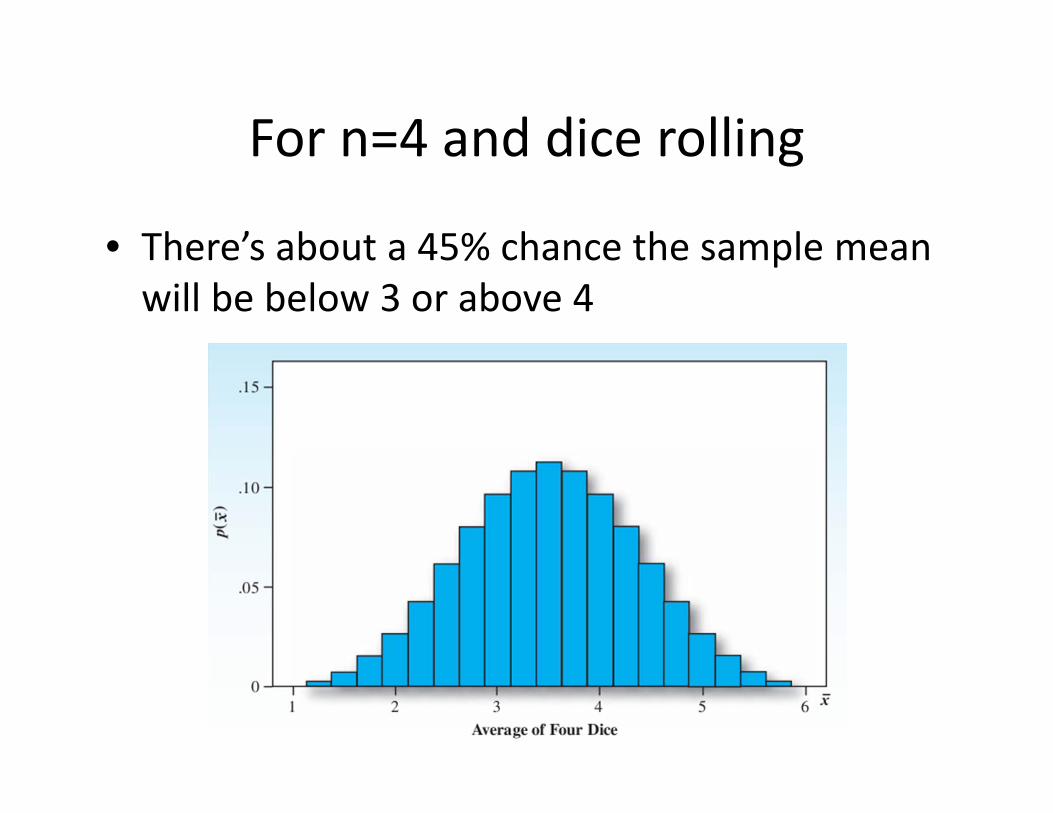
For n=4 and dice rolling
• There’s about a 45% chance the sample mean will be below 3 or above 4

Note…
• The distribution looks normal a lot faster than the standard deviation of the mean’s value collapses towards 0

Questions? Comments?

So why is this useful?
• If you want to know how certain you are about a mean (or the difference between two means)
• You can use normal distributions to do that• And there are well‐known stat tables and stat tools that can help you compute probabilities based on that

But I’m getting a couple lectures ahead of myself…

When does central limit theorem break?
• When data is skewed– The more skewed, the more data you need– MBB say N>=30 – But there are more advanced ways to find out if your data is too skewed for your sample size

When does central limit theorem break?
• When data is binomial and heavily imbalanced– E.g. p is close to 0 or 1

When does central limit theorem break?
• When data is hypermodal• This is the big one

Standard Error
• The standard deviation of a statistic is called its standard error
• E.g. the standard deviation of the mean is called the standard error of the mean– SE most commonly

Standard Error
• The standard deviation of a statistic is called its standard error
• E.g. the standard deviation of the mean is called the standard error of the mean– SE most commonly– Although MBB recommend the rather awkward

Standard Error
• The standard deviation of a statistic is called its standard error
• E.g. the standard deviation of the mean is called the standard error of the mean– SE most commonly– Although MBB recommend the rather awkward
• Do not use this one in the Journal of Ed Psych

Standard Error
• So, since the standard deviation of the mean is
• The Standard Error is

Calculating the standard error
• Let’s say we have a Z distribution and we sample 16 times from it
• What is the standard error?

Calculating the standard error
• Let’s say we have a Z distribution and we sample 16 times from it
• What is the standard error?
• = =

A harder example
• Let’s say we are looking at learning gains within 49 students using Cognitive Tutor
• Students gain between 0 and 60 points on the state test
• The average learning is 45• The standard deviation for learning is 5

What is the standard error?
• Let’s say we are looking at learning gains within 49 students using Cognitive Tutor
• Students gain between 0 and 60 points on the state test
• The average learning is 45• The standard deviation for learning is 5

= =
• Let’s say we are looking at learning gains within 49 students using Cognitive Tutor
• Students gain between 0 and 60 points on the state test
• The average learning is 45• The standard deviation for learning is 5

You try it: what is the standard error?
• Let’s say we are looking at the time taken for 16 learners to respond to algebra problems under transcranial magnetic stimulation of the lateral bithalamus
• Students take between 5 and 200 seconds to complete algebra problems
• The average time is 30 seconds• The standard deviation for time is 20 seconds

You can go from this to probabilities

What is the probability that sampled average learning gain is less than 44?
• Let’s say we are looking at learning gains within 49 students using Cognitive Tutor
• Students gain between 0 and 60 points on the state test
• The true average learning is 45• The standard deviation for learning is 5

What is the probability that sampled average learning gain is less than 44?
• True average learning is 45
• Standard error is = 0.714
• Z = .
= ‐1.4
• p=0.081

Questions? Comments?

You try it: what is the probability the average time is under 20 seconds?
• Let’s say we are looking at the time taken for 16 learners to respond to algebra problems under transcranial magnetic stimulation of the lateral bithalamus
• Students take between 5 and 200 seconds to complete algebra problems
• The true average time is 30 seconds• The standard deviation for time is 20 seconds

Questions? Comments?

Standard error of the binomial distribution
• SE =
• Can be approximated by the normal distribution where np>5 and nq>5

Example

23% of people prefer Pepsi to Coke
• Let’s say we survey 100 people as to their preference
• What is the standard error?
• What is the probability that 30% or more of people will say they prefer Pepsi?

23% of people prefer Pepsi to Coke
• Let’s say we survey 100 people as to their preference
• What is the standard error?
• What is the probability that 30% or more of people will say they prefer Pepsi?
• Is np>5? (100)(.23) = 23 Yes!• Is nq>5? (100)(.77) = 77 Yes!

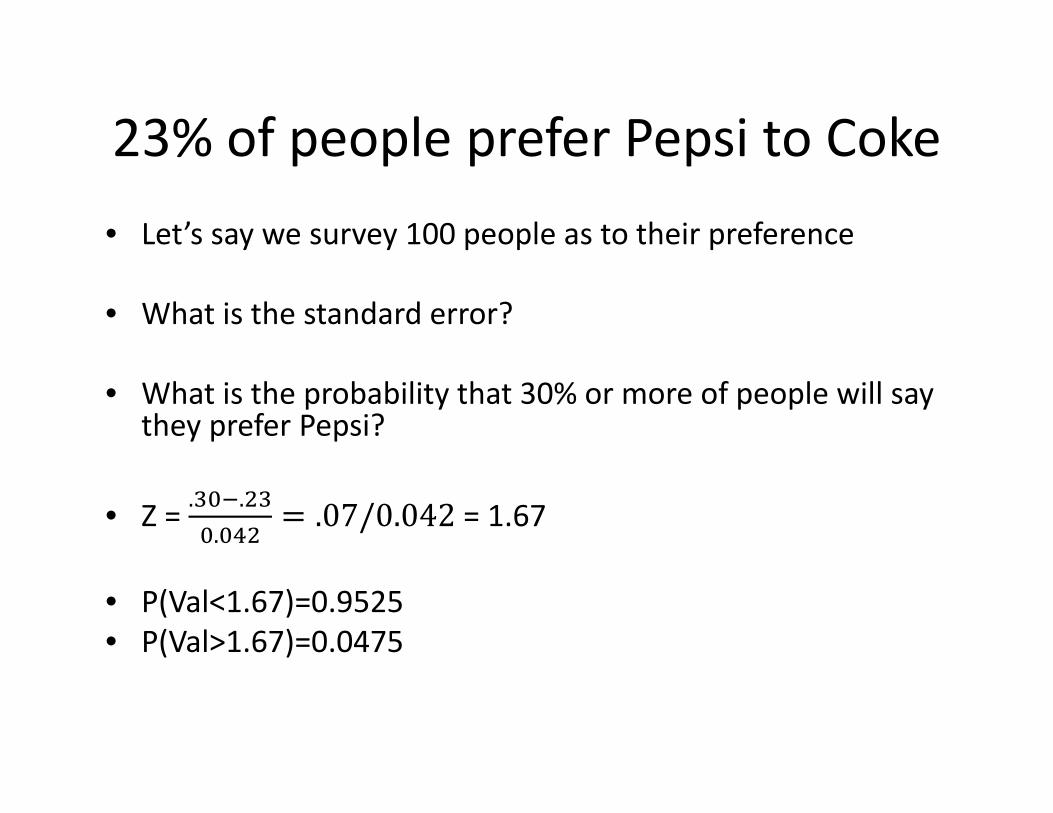
23% of people prefer Pepsi to Coke
• Let’s say we survey 100 people as to their preference
• What is the standard error?
• What is the probability that 30% or more of people will say they prefer Pepsi?
• SE = . . = . = = 0.042
23% of people prefer Pepsi to Coke• Let’s say we survey 100 people as to their preference
• What is the standard error?
• What is the probability that 30% or more of people will say they prefer Pepsi?
• Z = . ..
.07/0.042 = 1.67
• P(Val<1.67)=0.9525• P(Val>1.67)=0.0475

You try it!

Two politicians, Gush and Bore, are running for office.
• 49.9% prefer Gush; 50.1% prefer Bore• Let’s say 25 actually bother to vote
• What is the standard error?
• What is the probability that Gush will win the election?

Questions? Comments?

Final questions or comments for the day?

Upcoming Classes
• 3/30 Estimation and Confidence Intervals– HW6 due
• 4/1 Estimating Differences

Midterms
• If you have questions, or want to discuss your grade, email me and we’ll set up a meeting