hugo gontijo
TRANSCRIPT
Application of image analysis in
flotation control
Hugo Montalvão GontijoHugo Montalvão Gontijo
CEMI – Process Technology and Engineering
Minas Gerais, Brazil
Objectives
Demonstrate tools applicability for advanced
process control and online image analysis in
flotation circuits
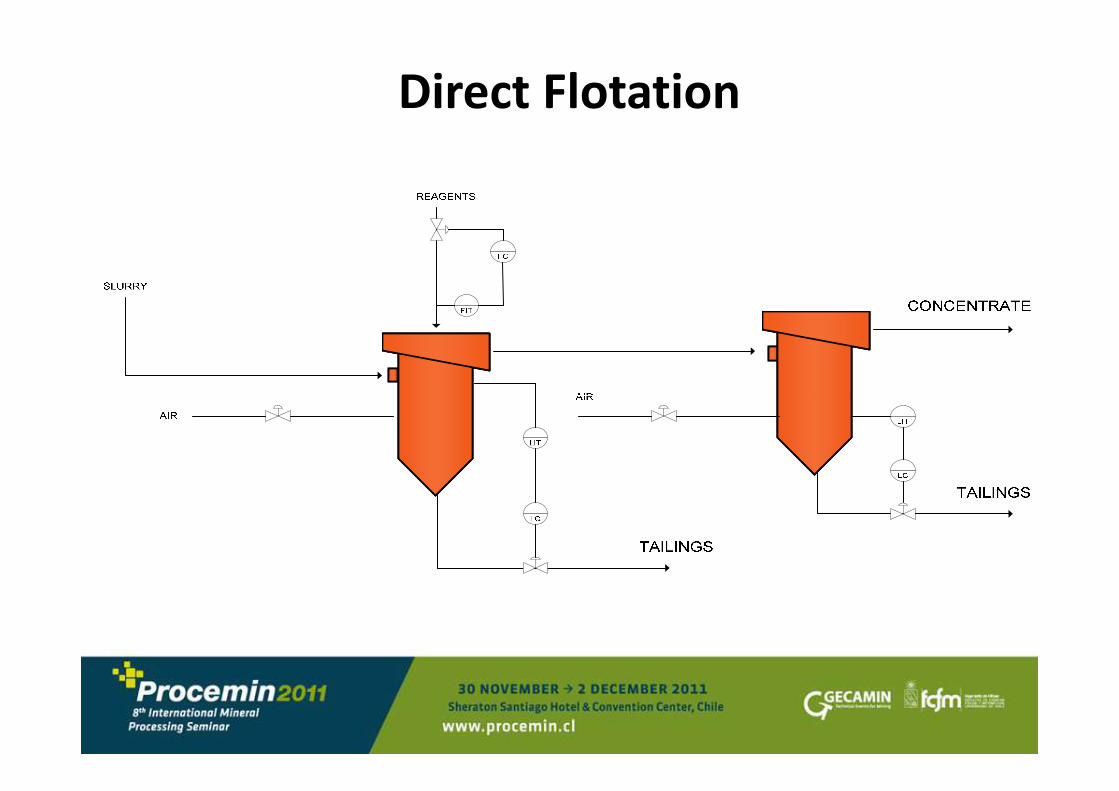
Direct Flotation
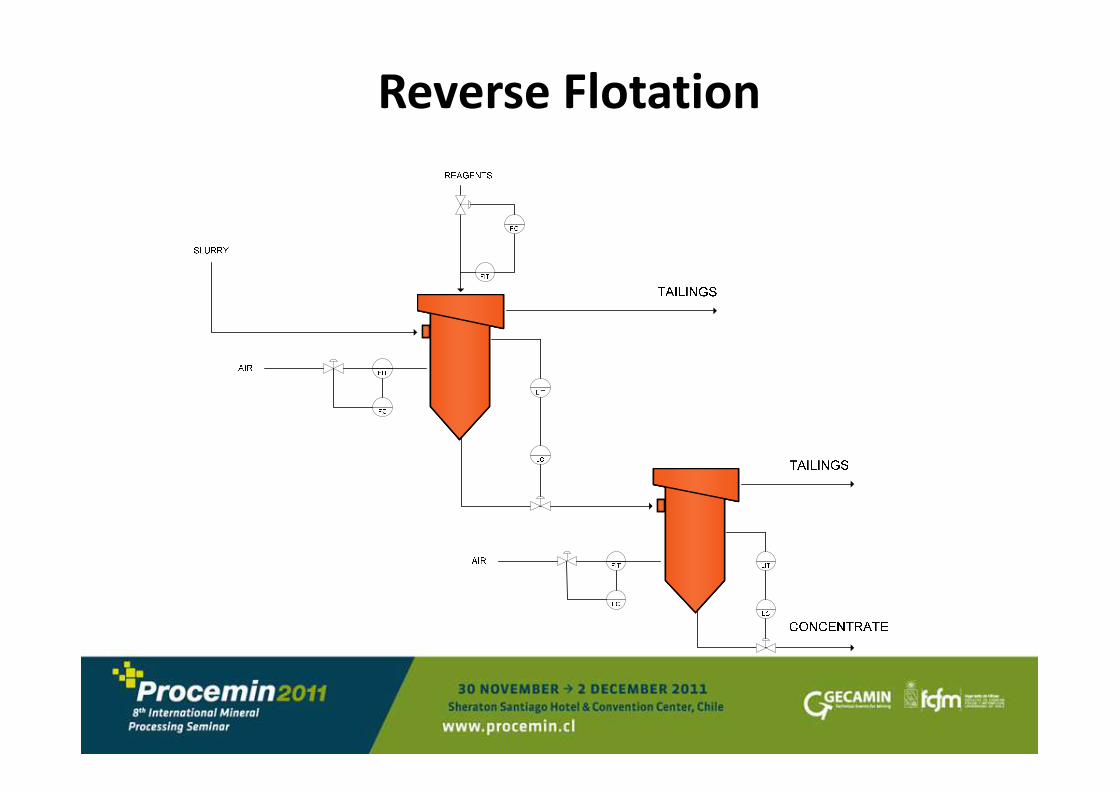
Reverse Flotation
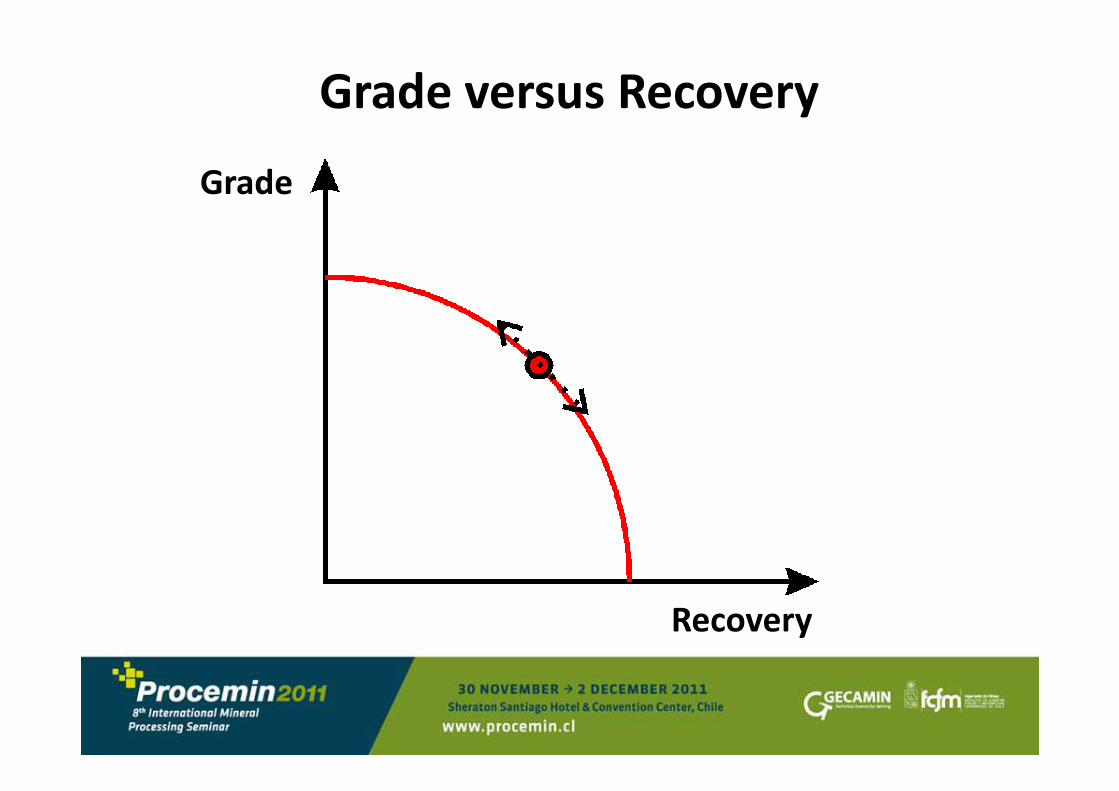
Grade versus Recovery
Grade
Recovery
Vision Systems
There are systems that use image analysis to infer
characteristics of the froth.
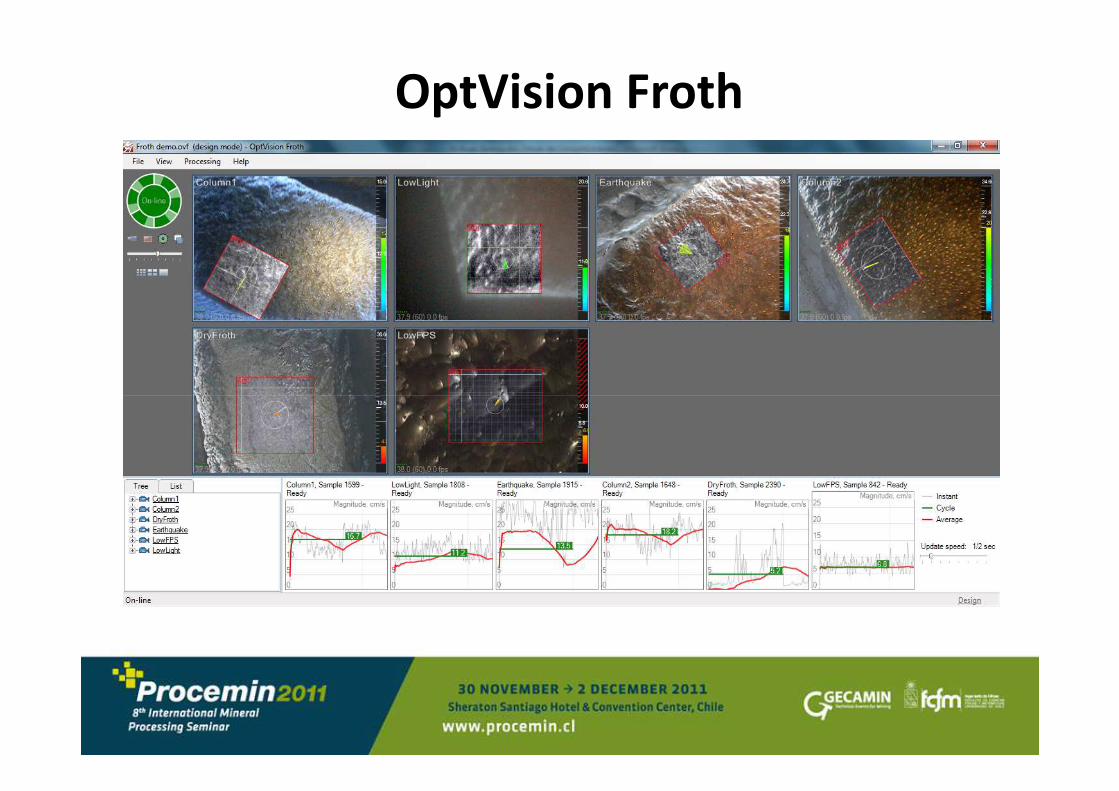
OptVision Froth
Vision Systems Features
• OPC communication, allowing easy
communication with PLC, DCS, PIMS and APC
systems;
• IP Network Cameras;
• Multiple cameras processing simultaneously;
• Led Lighting.
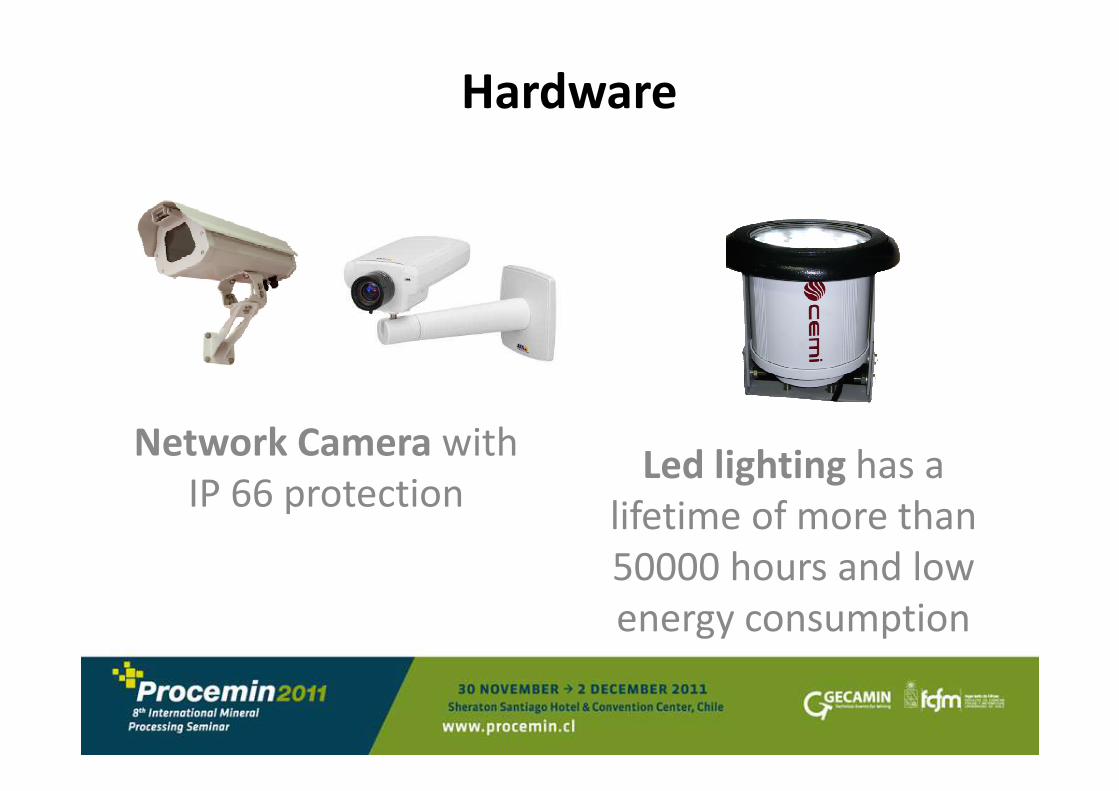
Hardware
Network Camera with
IP 66 protectionLed lighting has a
lifetime of more than
50000 hours and low
energy consumption
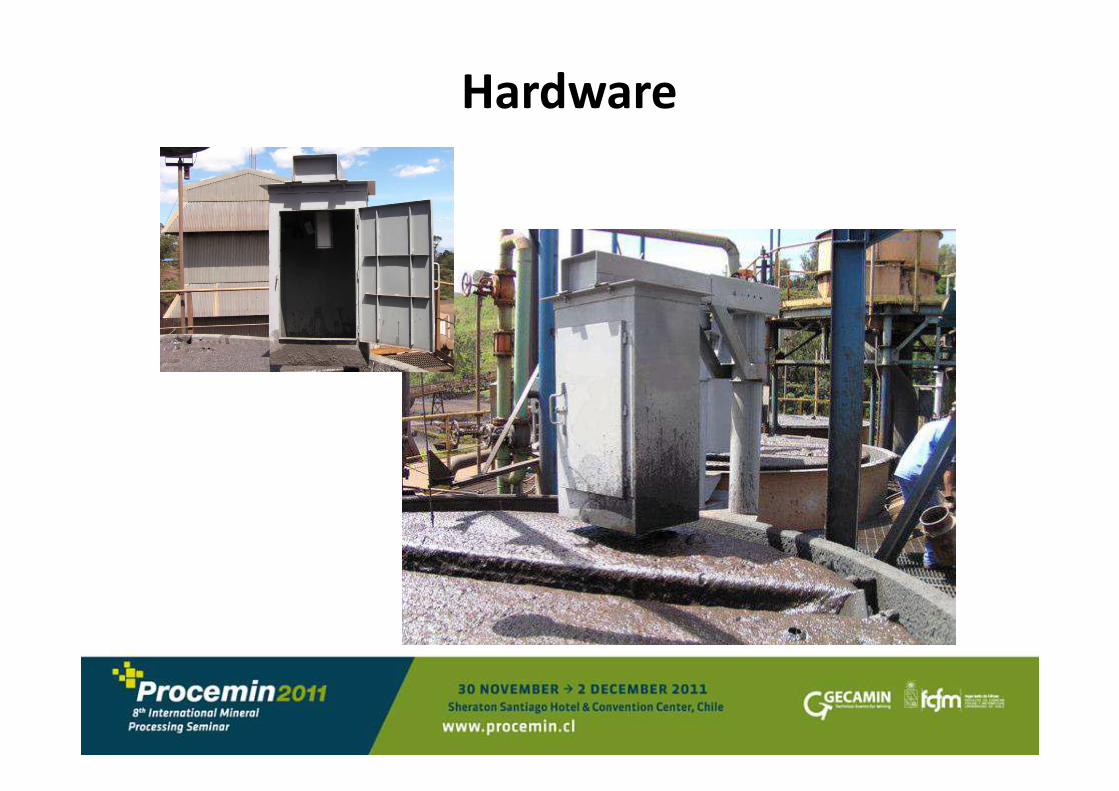
Hardware
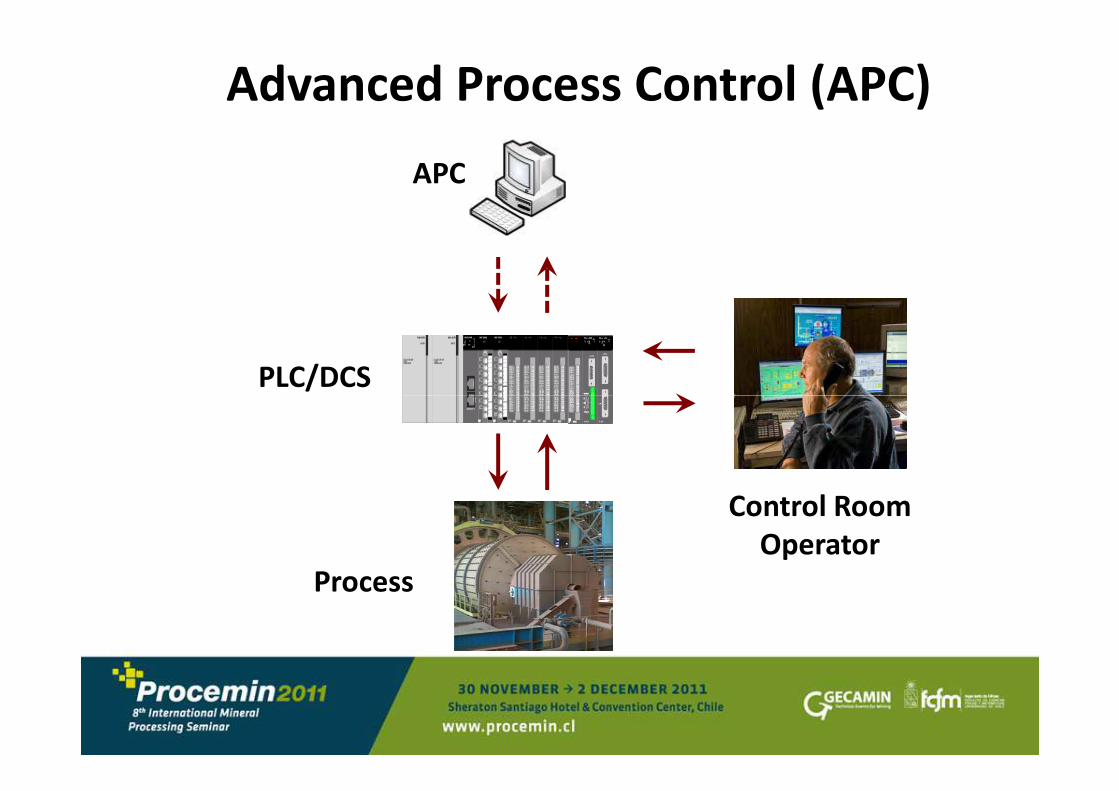
Advanced Process Control (APC)
PLC/DCS
APC
Control Room
Operator
Process
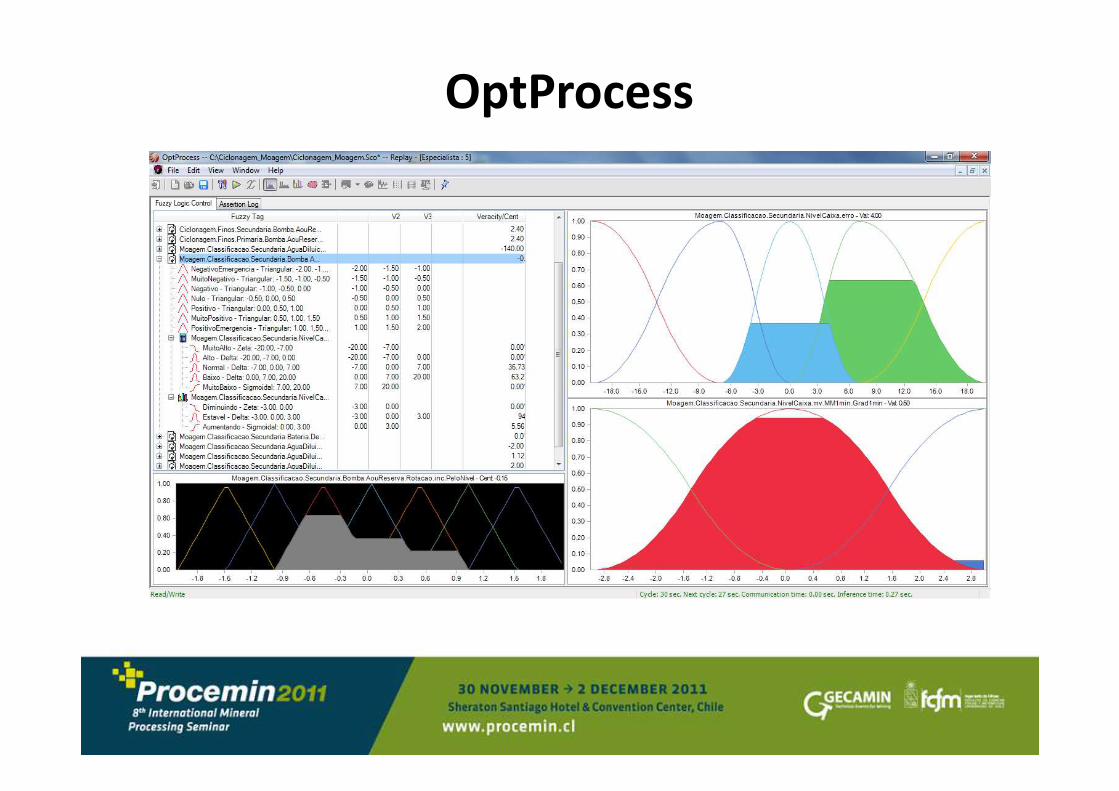
OptProcess
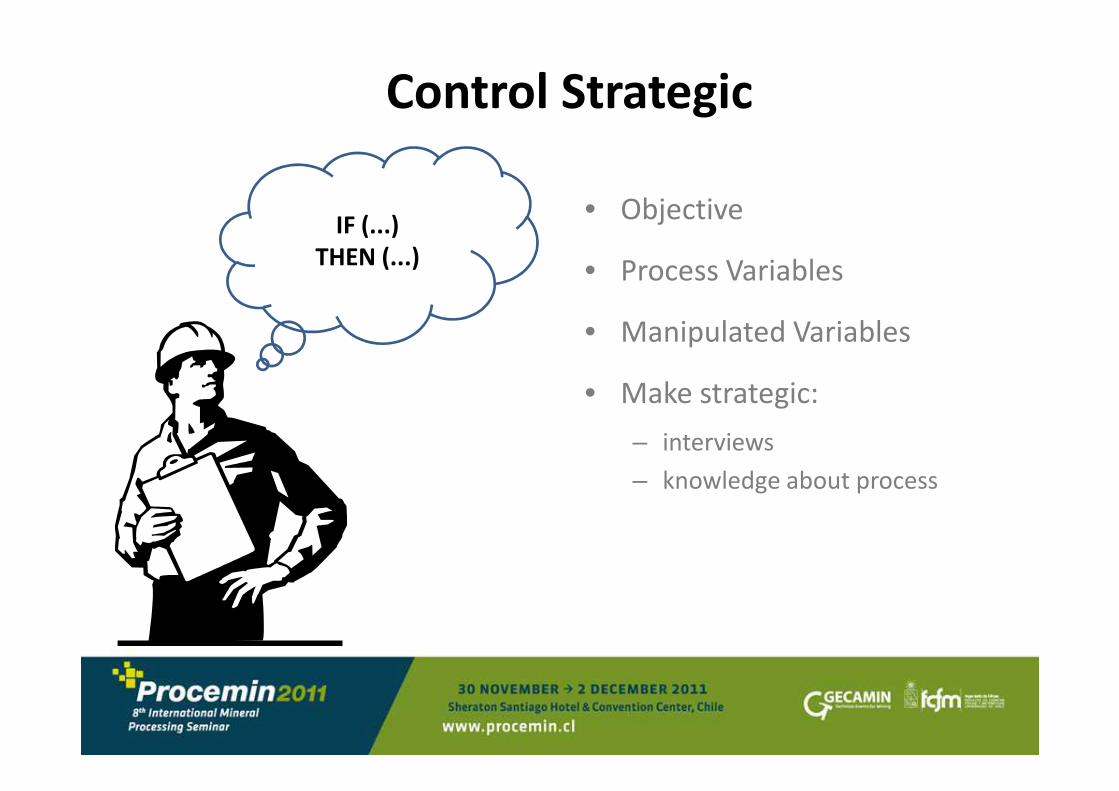
Control Strategic
• Objective
• Process Variables
• Manipulated Variables
• Make strategic:
IF (...)
THEN (...)
• Make strategic:
– interviews
– knowledge about process
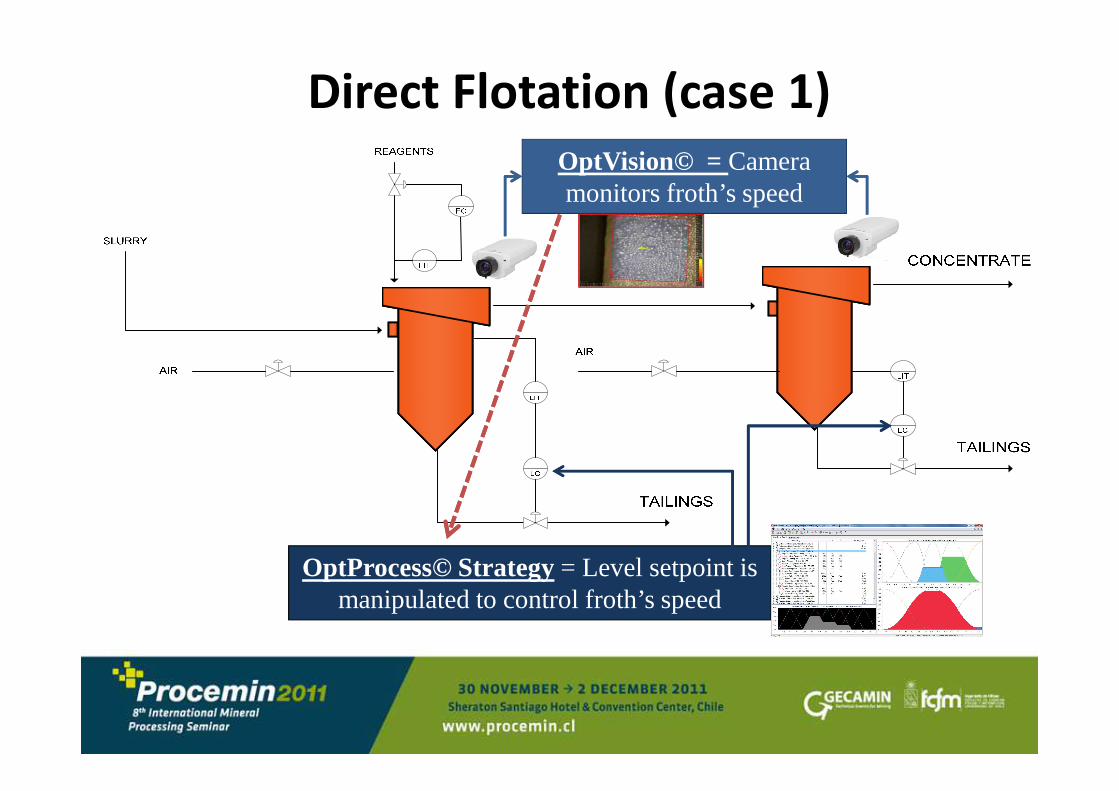
Direct Flotation (case 1)
OptVision© = Cameramonitors froth’s speed
OptProcess© Strategy= Level setpoint is manipulated to control froth’s speed
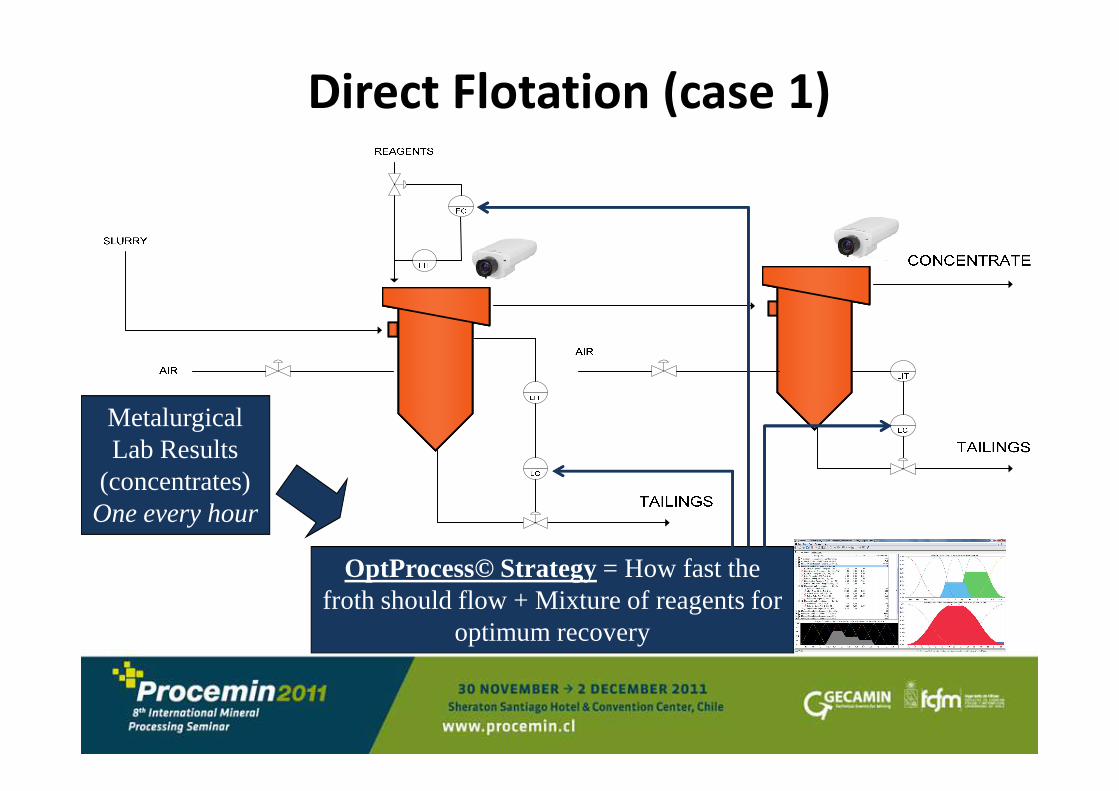
Direct Flotation (case 1)
MetalurgicalLab Results
(concentrates) One every hour
OptProcess© Strategy= How fast the froth should flow + Mixture of reagents for
optimum recovery
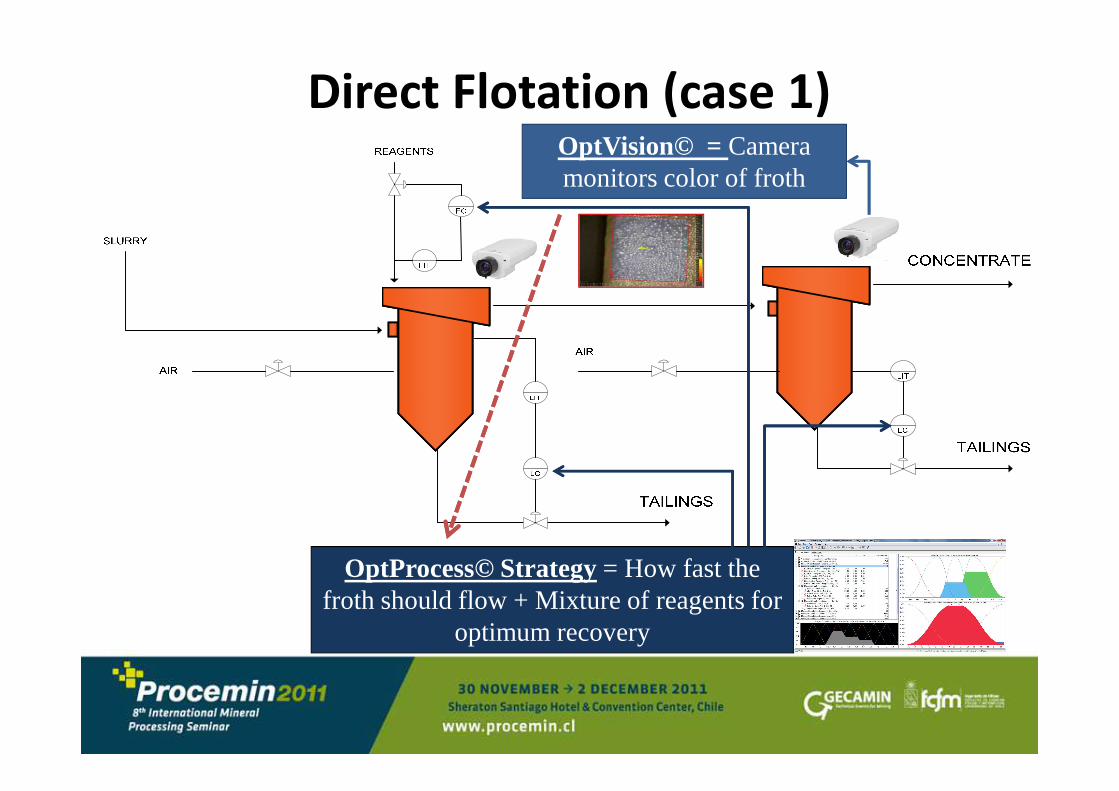
Direct Flotation (case 1)OptVision© = Cameramonitors color of froth
OptProcess© Strategy= How fast the froth should flow + Mixture of reagents for
optimum recovery
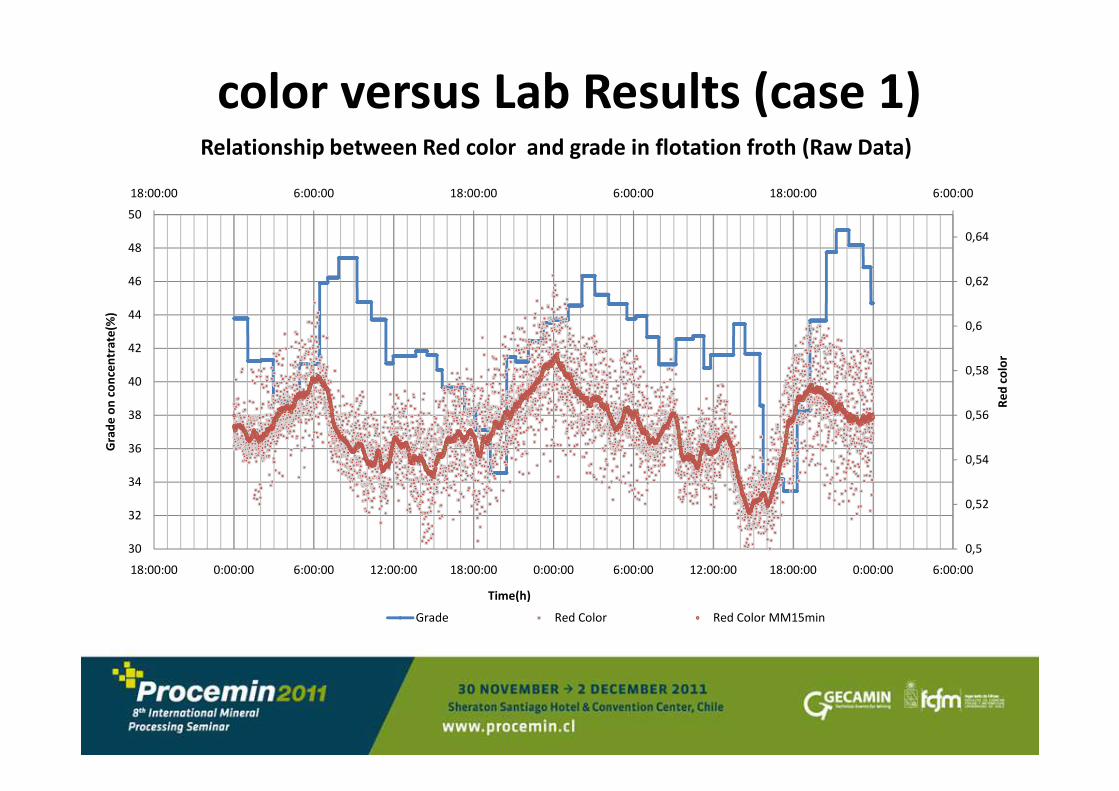
color versus Lab Results (case 1)
18:00:00 6:00:00 18:00:00 6:00:00 18:00:00 6:00:00
0,58
0,6
0,62
0,64
40
42
44
46
48
50
Re
dco
lor
con
cen
tra
te(%
)
Relationship between Red color and grade in flotation froth (Raw Data)
0,5
0,52
0,54
0,56
30
32
34
36
38
18:00:00 0:00:00 6:00:00 12:00:00 18:00:00 0:00:00 6:00:00 12:00:00 18:00:00 0:00:00 6:00:00
Re
d
Gra
de
on
con
cen
tra
te
Time(h)
Grade Red Color Red Color MM15min
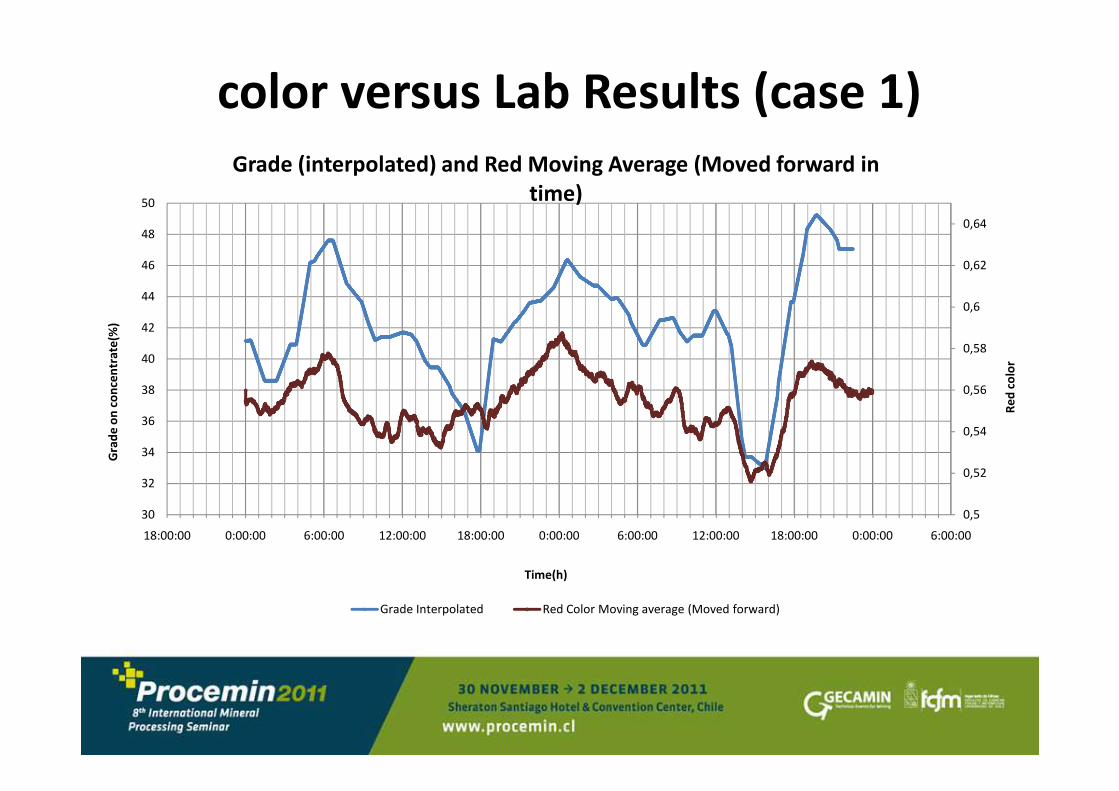
color versus Lab Results (case 1)
0,56
0,58
0,6
0,62
0,64
38
40
42
44
46
48
50
Grade (interpolated) and Red Moving Average (Moved forward in
time)
con
cen
tra
te(%
)
Re
dco
lor
0,5
0,52
0,54
0,56
30
32
34
36
38
18:00:00 0:00:00 6:00:00 12:00:00 18:00:00 0:00:00 6:00:00 12:00:00 18:00:00 0:00:00 6:00:00
Grade Interpolated Red Color Moving average (Moved forward)
Gra
de
on
con
cen
tra
te
Re
d
Time(h)
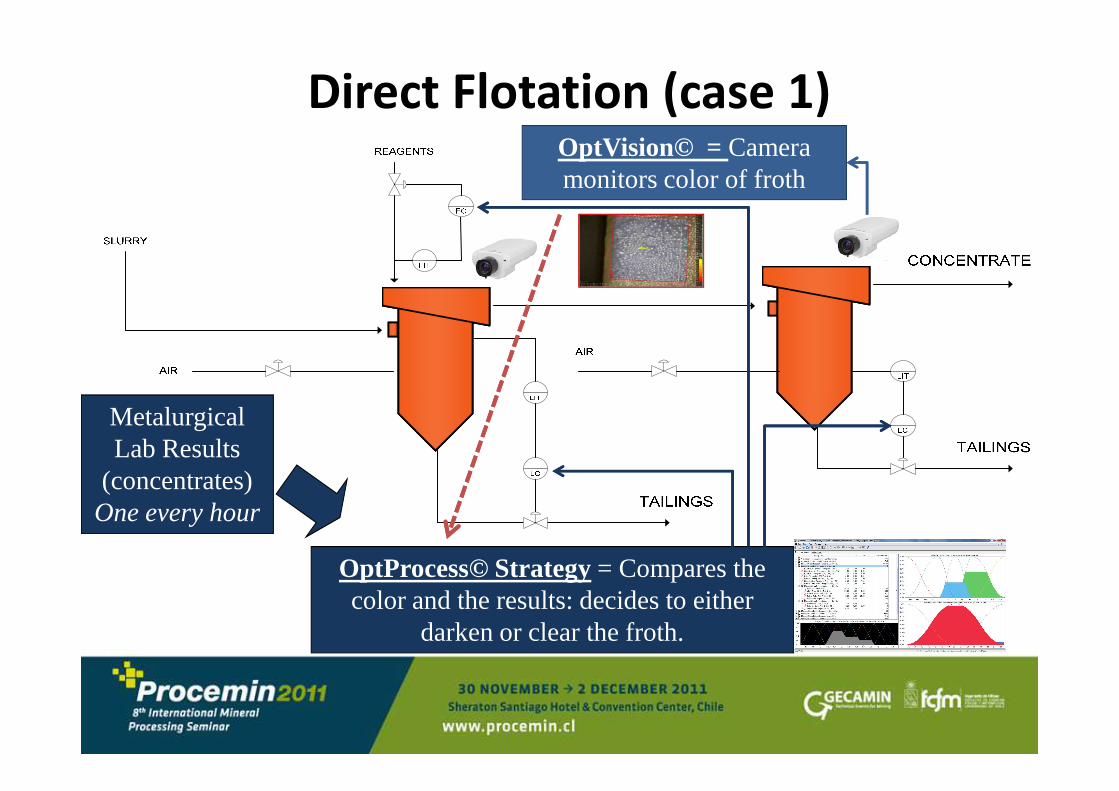
Direct Flotation (case 1)OptVision© = Cameramonitors color of froth
OptProcess© Strategy= Compares the color and the results: decides to either
darken or clear the froth.
MetalurgicalLab Results
(concentrates) One every hour
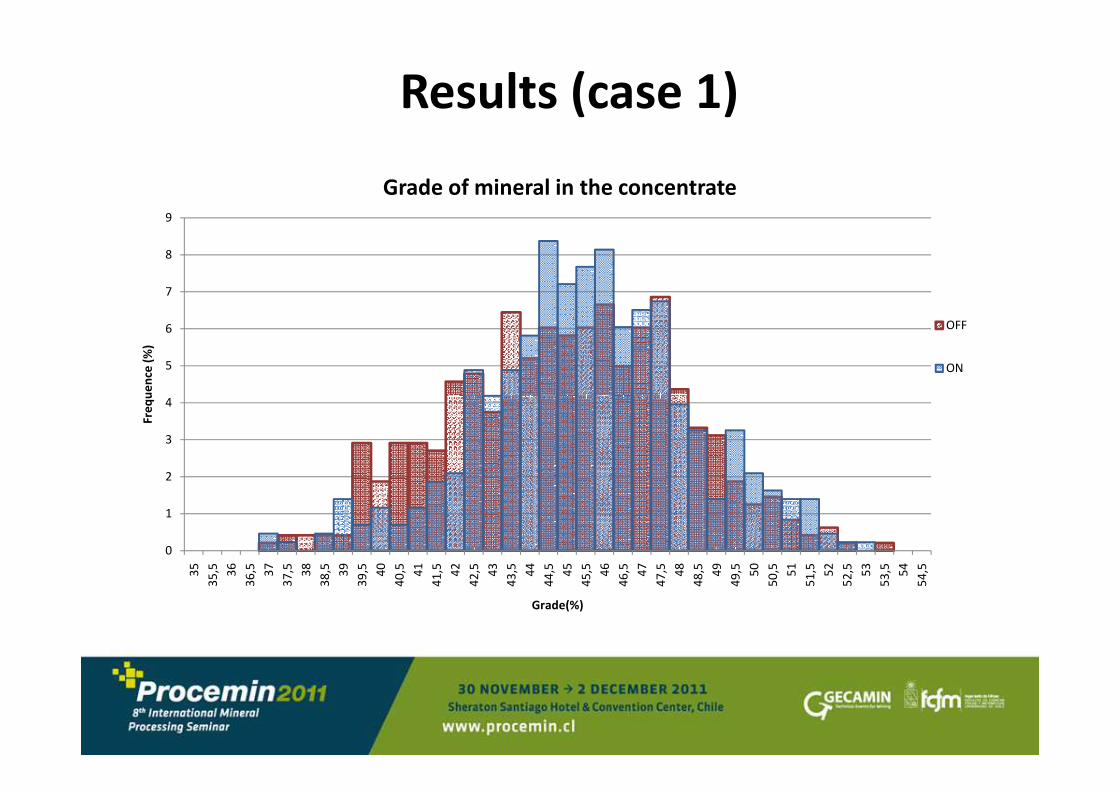
Results (case 1)
4
5
6
7
8
9
Fre
qu
en
ce (
%)
Grade of mineral in the concentrate
OFF
ON
0
1
2
3
4
35
35
,5 36
36
,5 37
37
,5 38
38
,5 39
39
,5 40
40
,5 41
41
,5 42
42
,5 43
43
,5 44
44
,5 45
45
,5 46
46
,5 47
47
,5 48
48
,5 49
49
,5 50
50
,5 51
51
,5 52
52
,5 53
53
,5 54
54
,5
Fre
qu
en
ce (
%)
Grade(%)
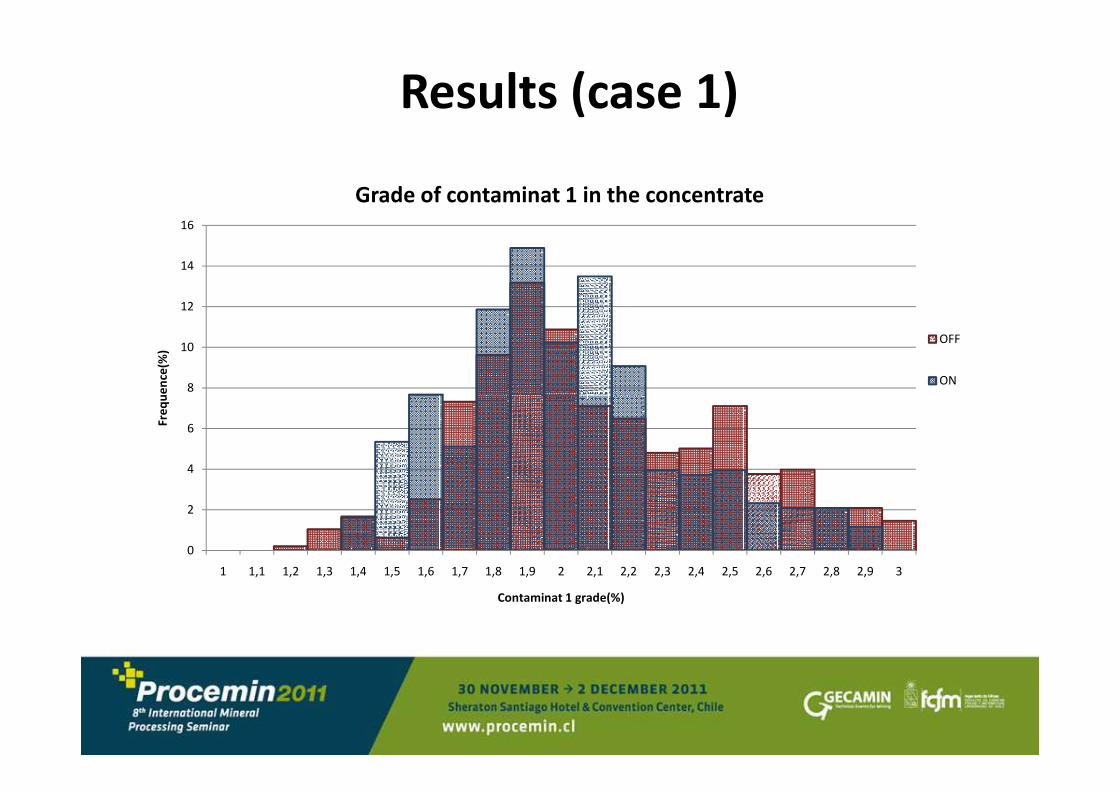
Results (case 1)
8
10
12
14
16
Fre
qu
en
ce(%
)
Grade of contaminat 1 in the concentrate
OFF
ON
0
2
4
6
1 1,1 1,2 1,3 1,4 1,5 1,6 1,7 1,8 1,9 2 2,1 2,2 2,3 2,4 2,5 2,6 2,7 2,8 2,9 3
Fre
qu
en
ce(%
)
Contaminat 1 grade(%)
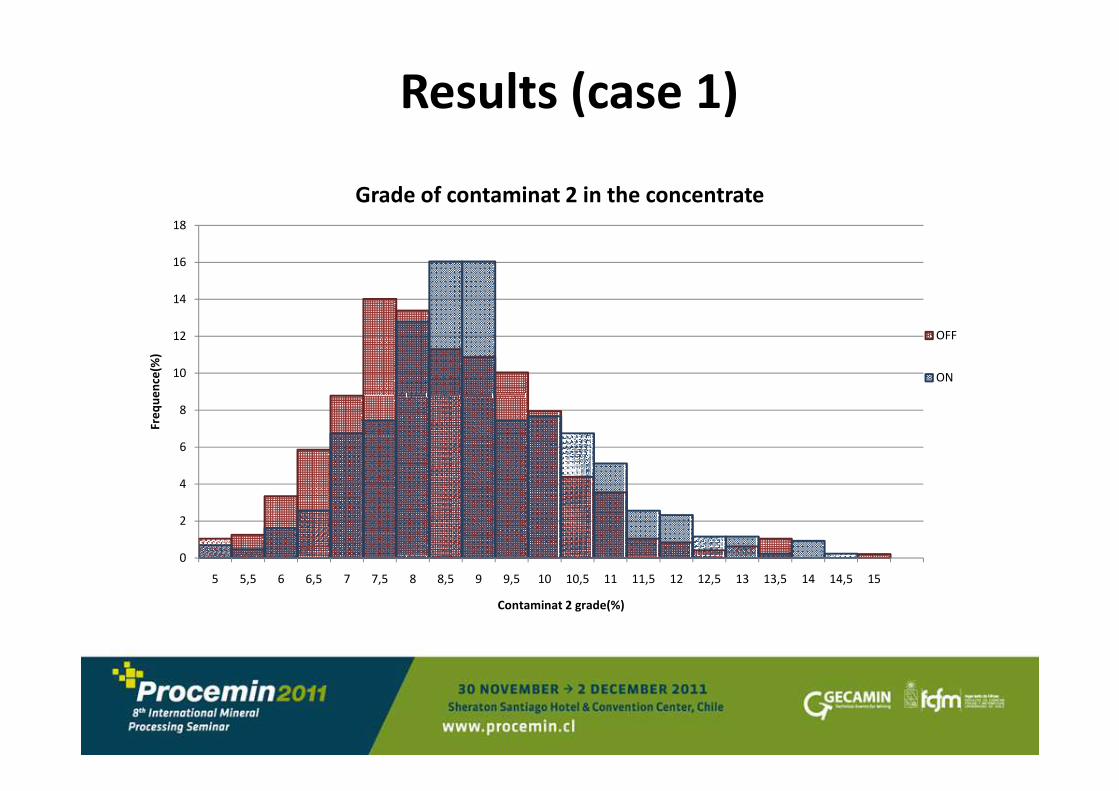
Results (case 1)
10
12
14
16
18
Fre
qu
en
ce(%
)
Grade of contaminat 2 in the concentrate
OFF
ON
0
2
4
6
8
5 5,5 6 6,5 7 7,5 8 8,5 9 9,5 10 10,5 11 11,5 12 12,5 13 13,5 14 14,5 15
Fre
qu
en
ce(%
)
Contaminat 2 grade(%)
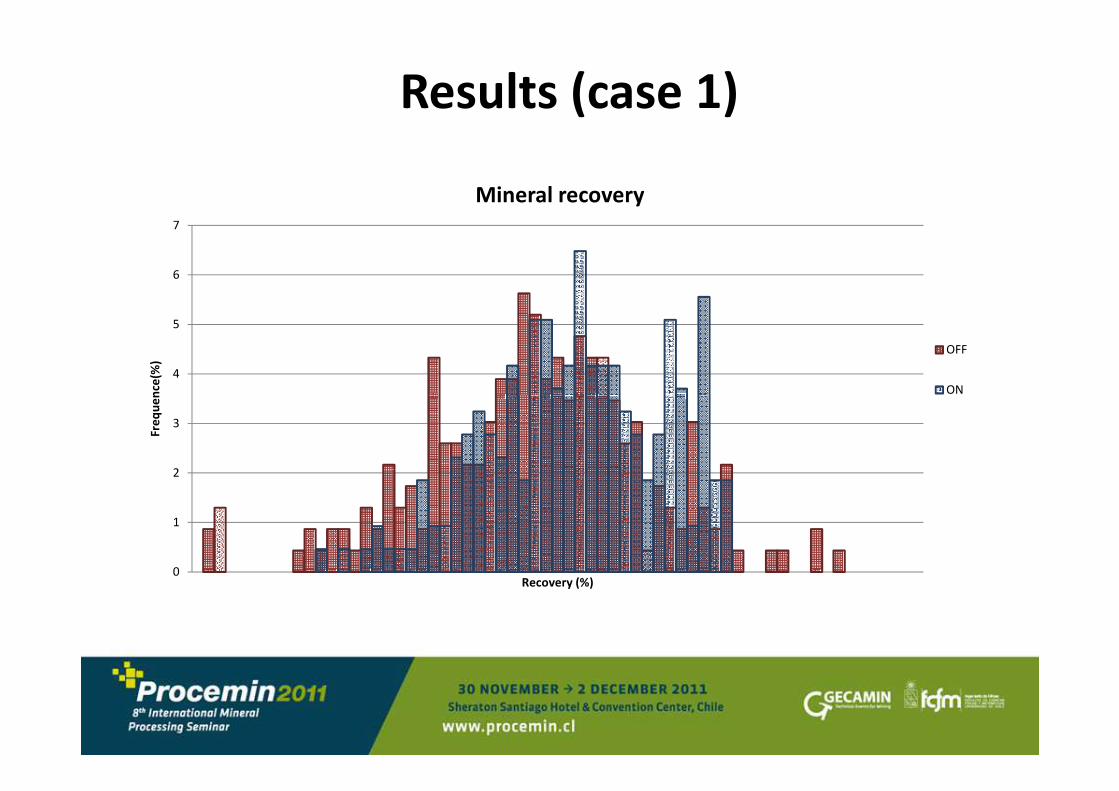
Results (case 1)
4
5
6
7
Fre
qu
en
ce(%
)
Mineral recovery
OFF
ON
0
1
2
3
Fre
qu
en
ce
Recovery (%)
ON
Results (case 1)
• Decrease standard deviation
• Increase recovery
• Increase production (10%)
Reverse Flotation (Case 2)
• Iron flotation
• Timbopeba and Fábrica Nova
• VALE (Mariana, Minas Gerais, Brazil)
Silva C. G., Miquelanti E., Silva M. C., Martins M. A. S., Santos S. C. R., Aplicação de
sistema especialista para controle das flotações de Fábrica Nova e Timbopeba, 41º
Seminário de Redução de Minério de Ferro e Matérias-primas e 12º Seminário
Brasileiro de Minério de Ferro, 12 a 26 de setembro de 2011, Vila Velha, ES.
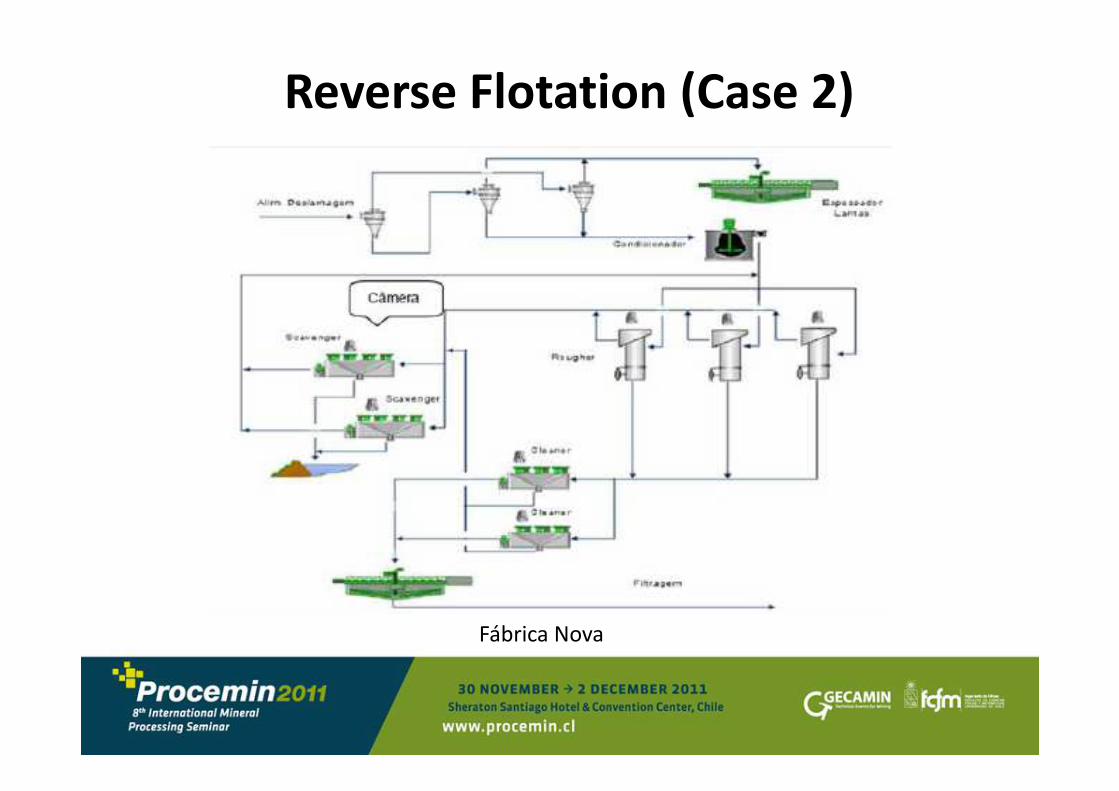
Reverse Flotation (Case 2)
Fábrica Nova
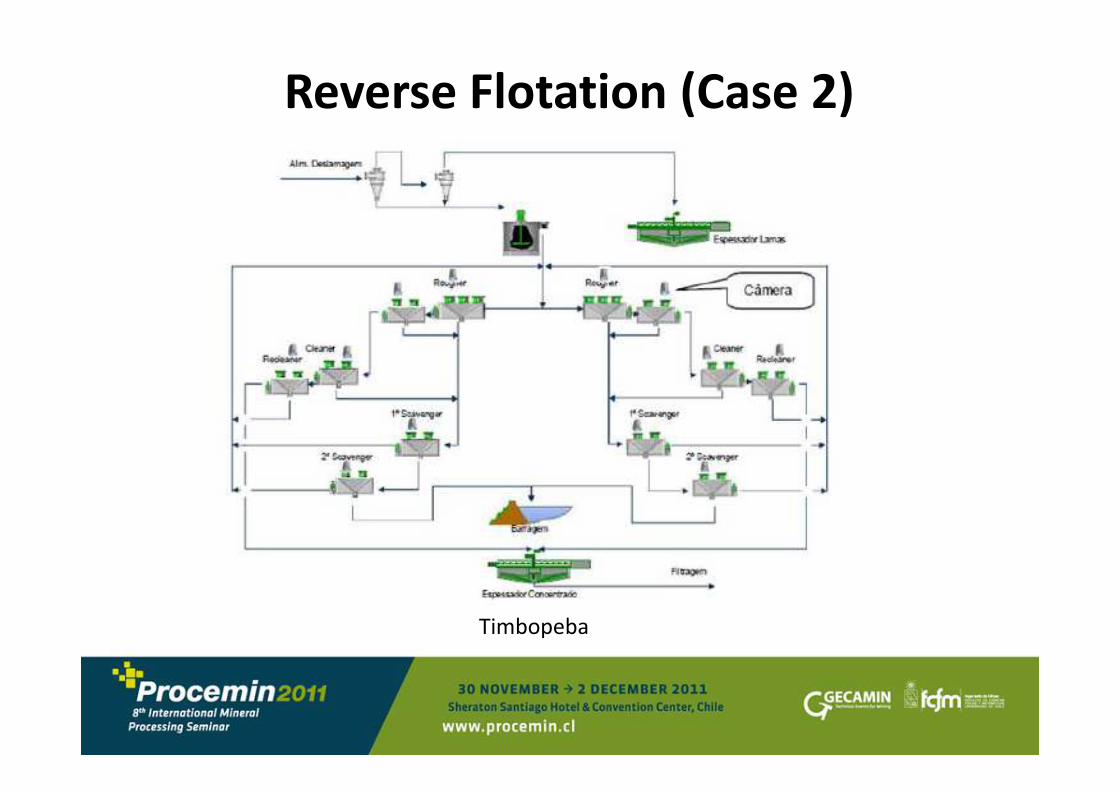
Reverse Flotation (Case 2)
Timbopeba
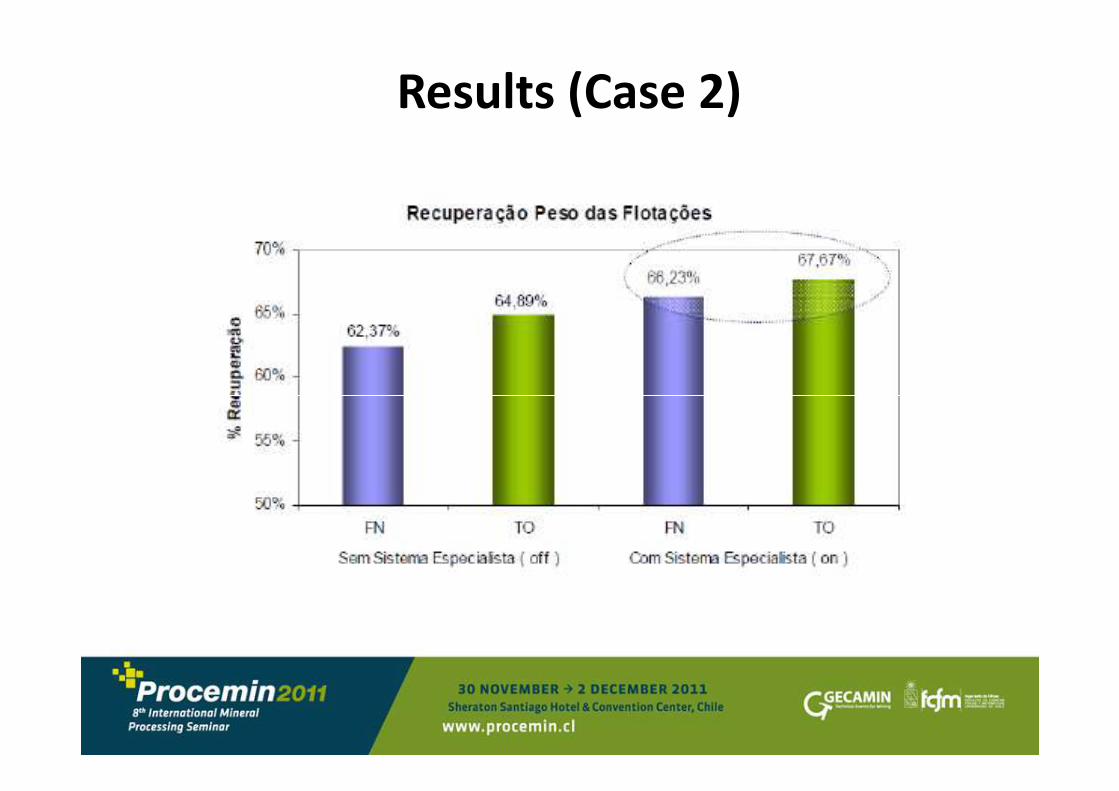
Results (Case 2)
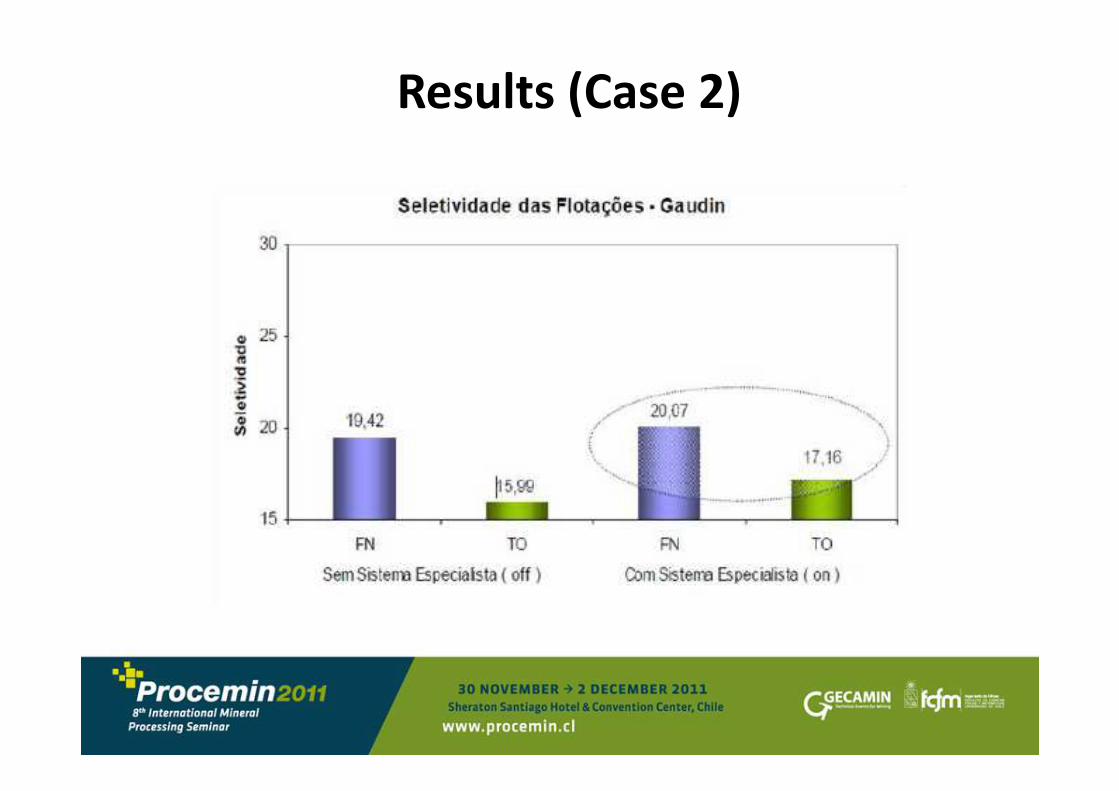
Results (Case 2)
Conclusions
• Advanced process control and online image
analysis in flotation circuits can increase recovery,
production and quality.
Projects
• Vale – Mina do Pico (ITM-I)
OptProcess/OptVision Froth (24 cameras)
• Vale – Vargem Grande
OptProcess/OptVision Froth (7 cameras)
• Vale – Timbopeba
OptProcess/OptVision Froth (19 cameras)OptProcess/OptVision Froth (19 cameras)
• Anglo American
OptProcess/OptVision Froth (9 cameras)
Projects
• Vale – Mutuca
OptProcess/OptVision Rock (4 cameras)
• Hydro – Paragominas
OptProcess/OptVision Rock (5 cameras)
• Vale – Salobo
OptVision Rock (6 cameras)OptVision Rock (6 cameras)
• Vale – TIG
OptVision Rock (1 camera)
Projects
• Votorantim Metais – Niquelândia
OptProcess
• Anglo American – Amapá
OptProcess

Projects
• Samarco – Ubu (Usina 3)
OptProcess/OptVision Pellet (3 cameras)
• Vale DIPE – Tubarão (Usinas I, II, III e IV)
OptVision Pellet (24 cameras)
• Vale DIPE – Vargem Grande
OptVision Pellet (12 cameras)OptVision Pellet (12 cameras)
• Vale DIPE – Fábrica
OptVision Pellet (7 cameras)
• Vale DIPE – São Luís
OptVision Pellet (12 cameras)