human and natural controls of the variation in...
TRANSCRIPT

Human and natural controls of the variation in aboveground treebiomass in African dry tropical forests
JOHANNE PELLETIER,1,6 ABEL SIAMPALE,2 PIERRE LEGENDRE,3 PATRICK JANTZ,4
NADINE T. LAPORTE,5 AND SCOTT J. GOETZ1,4
1Woods Hole Research Center, 149 Woods Hole Road, Falmouth, Massachusetts 02540-1644 USA2Zambia Forestry Department, Ministry of Lands, Natural Resources and Environmental Protection,
P.O. Box 50042, Lusaka, Zambia3D�epartement de Sciences Biologiques, Universit�e de Montr�eal, C.P. 6128, succursale Centre-ville, Montr�eal, Qu�ebec H3C 3J7 Canada
4School of Informatics, Computing and Cyber Systems, Northern Arizona University, Flagstaff, Arizona 86011 USA5School of Forestry, Northern Arizona University, Flagstaff, Arizona 86011 USA
Abstract. Understanding the anthropogenic and natural controls that affect the patterns,distribution, and dynamics of terrestrial carbon is crucial to meeting climate change mitigationobjectives. We assessed the human and natural controls over aboveground tree biomass densityin African dry tropical forests, using Zambia’s first nationwide forest inventory. We identifiedpredictors that best explain the variation in biomass density, contrasted anthropogenic andnatural sites at different spatial scales, and compared sites with different stand structure char-acteristics and species composition. In addition, we evaluated the effects of different manage-ment and conservation practices on biomass density. Variation in biomass density was mostlydetermined by biotic processes, linked with both species richness and dominance (evenness),and to a lesser extent, by land use, environmental controls, and spatial structure. Biomass den-sity was negatively associated with tree species evenness and positively associated with speciesrichness for both natural and human-modified sites. Human influence variables (including dis-tance to roads, distance to town, fire occurrence, and the population on site) did not explainsubstantial variation in biomass density in comparison to biodiversity variables. The relation-ship of human activities to biomass density in managed sites appears to be mediated by effectson species diversity and stand structure characteristics, with lower values in human-modifiedsites for all metrics tested. Small contrasts in carbon density between human-modified and nat-ural forest sites signal the potential to maintain carbon in the landscape inside but also outsideforestlands in this region. Biodiversity is positively related to biomass density in both humanand natural sites, demonstrating potential synergies between biodiversity conservation andclimate change mitigation. This is the first evidence of positive outcomes of protected areasand participatory forest management on carbon storage at national scale in Zambia. Thisresearch shows that understanding controls over biomass density can provide policy relevantinputs for carbon management and on ecological processes affecting carbon storage.
Key words: aboveground biomass; biodiversity and ecosystem function; carbon management andconservation; Miombo woodlands; reducing emissions from deforestation and forest degradation; spatialvariability of biomass; variation partitioning.
INTRODUCTION
With the Paris Agreement in 2015 (UNFCCC 2015),countries have agreed to put into place ambitious mea-sures to mitigate climate change. One key mitigationapproach in the tropics is through conserving andenhancing carbon dioxide sinks and reservoirs via man-agement of terrestrial carbon stocks, especially in forestecosystems, and by reducing emissions from deforesta-tion and forest degradation in developing countries(REDD+; UNFCCC 2015). Improving our knowledgeof the factors affecting the distribution of terrestrial
carbon stocks, engendered by both anthropogenic andnatural controls, is important to support carbon man-agement and conservation efforts (Lewis et al. 2013,Tyukavina et al. 2015).Variation in biomass density can be the result of
anthropogenic actions through land use and land coverchange, including the replacement of forests throughdeforestation for agriculture or mining as well asthrough forest degradation for selective logging, shiftingcultivation, charcoal production, or fuelwood collection(Lewis et al. 2015, Bustamante et al. 2016). It can alsobe the result of environmental gradients (Larjavaara andMuller-Landau 2012, Lewis et al. 2013), natural distur-bances (fires, droughts, hurricanes; Phillips et al. 2009)or biological processes related to forest structure (Bakeret al. 2004, Malhi et al. 2006), species composition, anddiversity (Ruiz-Jaen and Potvin 2010, Cavanaugh et al.
Manuscript received 20 December 2016; revised 8 February2017; accepted 8 March 2017. Corresponding Editor: John B.Bradford.
6 E-mail: [email protected]
1578
Ecological Applications, 27(5), 2017, pp. 1578–1593© 2017 by the Ecological Society of America

2014, Fauset et al. 2015). Global change also affects for-est ecosystem functioning directly and indirectly, con-tributing to current variations in biomass density(Alencar et al. 2015, Trumbore et al. 2015).While much work has been done to identify tree bio-
mass correlates and associated spatial patterns forhumid tropical forests, knowledge of the human and nat-ural controls over biomass density remains relativelylimited for the dry tropical forests of the eastern andsouthern African region. Although these forests arecharacterized by lower aboveground biomass (AGB)density than dense humid forests, they play an importantrole in the global carbon cycle because they cover largeareas. They are also essential for biodiversity conserva-tion and for the livelihoods of more than 100 millionpeople (Campbell et al. 2007, Dewees et al. 2011). Forinstance, the Miombo woodlands that dominate theregion are the most extensive tropical seasonal woodlandand dry forest formation in Africa, covering around 2.4–3.6 million km2 (Dewees et al. 2010, Munishi et al.2010). The Miombo-mopane woodland is also one ofthe five global ecological zones that have been priori-tized for biodiversity conservation and species endemism(Mittermeier et al. 2003). Earlier studies have identifiedkey ecological processes related to biomass accumula-tion and storage (Frost 1996) and the effect of humanactivities on carbon stocks in the region (Chidumayo1993, 2002, 2013), including fire and other disturbances(Ribeiro et al. 2008, Williams et al. 2008, Ryan and Wil-liams 2011). Yet, little is known of the factors that mayaffect the distribution of biomass at broader geographicscales that are relevant for carbon management and con-servation planning for climate change mitigation.To improve REDD+ planning and implementation, it
is essential to develop understanding of the human andnatural controls that can explain variations in forest bio-mass density, some of them being drivers of deforesta-tion and forest degradation, or conversely, appropriatecarbon conservation and management approaches (e.g.,through reforestation). Effectively, human land use andmanagement can have positive or negative impacts onbiomass density or carbon storage. Important factorscan then be mitigated or reinforced through appropriatepolicy approaches and provide useful guidance for con-servation and management decision-making.In this study, we aim to understand the human and
natural factors that best explain variation in tree AGBdensity, using Zambia as a case study. First, we comparevariation in AGB density, using a large set of predictorvariables, at different spatial scales as well as sites withhuman land uses (anthropogenic or human-modifiedsites) and without human land uses (non-anthropogenicsites, hereafter referred to as natural sites). In naturalforest sites, we expect biodiversity and environmentalvariables to contribute the most to explaining variationin tree AGB density, while in human-modified sites, weexpect land use and management activities to bestexplain the observed variation. Second, we compare the
diversity, species composition, and stand structurebetween sites with and without human land uses in orderto test the effect of biodiversity on biomass density andobtain insights on potential underlying ecologicalprocesses at play. We expect a positive association ofdiversity to biomass density in both natural and human-modified sites. Third, we evaluate the influence of differ-ent management and conservation practices on biomassdensity to determine if our findings can be used to gener-ate policy recommendation for carbon conservation andmanagement. This study informs carbon managementand conservation efforts of the Zambian government byfocusing on the causes of variability in biomass densitywithin forest ecosystems, which has been identified as animportant knowledge gap (Day et al. 2014).
METHODS
The Republic of Zambia, located in the SouthernAfrica region, is one of 14 pilot countries of theUnited Nations Collaborative Programme on REDD+(UN-REDD). The country has been developing itsREDD+ national strategy, forest monitoring system andforest reference emission levels with the goal of reducingland-based emissions and increasing carbon storage forclimate change mitigation. We used Zambia’s IntegratedLand Use Assessment (ILUA), the first nation-wideinventory sponsored by the Food and Agriculture Orga-nization (FAO), which covers both human-dominatedlandscapes and remote areas. A large range of biophysi-cal and socioeconomic variables were collected as partof ILUA. We use these data to explore variation in treeAGB over the country at three spatial scales: the tractlevel, the plot level, and the land-use level (Fig. 1). Ateach scale, tree AGB density was calculated based on theChave et al. (2014) allometric models, and was related todifferent sets of explanatory variables (see Explanatoryvariables). Further details on ILUA sampling design,biomass calculation, and specific methodologies areprovided in Appendix S1.
Explanatory variables
We extracted total annual precipitation, mean mini-mum temperature, mean maximum temperature, andelevation at the tract and plot levels from global datasets (Appendix S1). Distance to major towns (market)and roads were calculated from GIS layers provided bythe Zambia Forestry Department. Household surveydata collected during the ILUA project were used toidentify the number of inhabitants near the sampling site(in a 5 km radius) and to create a binary variable forpresence–absence of population.Measurements collected during the ILUA project
included aspect and slope as quantitative variables, aswell as relief, texture, drainage, and soil organic matteras categorical variables. We calculated the median forquantitative variables and the mode for categorical
July 2017 ABOVEGROUND TREE BIOMASS VARIATION 1579

variables based on three measurements at the plot leveland 12 measurements at the tract level.We calculated common alpha (a) biodiversity indices
(hereafter diversity variables) including tree species rich-ness, Shannon’s entropy, Simpson’s index, the Shannonand the Simpson diversity numbers, as well as the Pielou,Shannon, and Simpson evenness indices for each level ofanalysis. For representing stand structure, we calculateddifferent measures of community structure per level ofanalysis including species abundance, maximum diame-ter at breast height (dbh), height, wood specific gravity(WSG), and basal area, as well as stand-level means ofdbh, height, and WSG. These indicators of forest struc-ture (stand-level mean, maximum) are indirectly relatedto biomass density, the sum of all tree biomasses perarea, and some relationship is expected since biomassallometric models are based on the height, dbh, andWSG of each individual tree. For this reason, we testedmodels with and without stand structure characteristics.We constructed Moran’s eigenvector maps (MEM) to
model spatial structures at all relevant scales, retainingthose positively correlated with tree AGB density(Borcard et al. 2011). MEM are the result of a spectraldecomposition of the spatial relationships among thesampling sites, creating variables that correspond to all
spatial scales that can be observed in a given data set(Borcard et al. 2004). These spatial variables were usedto detect the most meaningful underlying spatial struc-tures by which tree AGB density is organized and inte-grate this information into our models at the tract andthe plot levels.At the land-use/forest level, management characteris-
tics were tested for their influence on AGB density,including the land designation or protection status, landownership, fire occurrence, fire area, fire type, and thepercent tree canopy coverage. In addition, for forest andother wooded lands, other variables were tested includ-ing vegetation stratification (layers), shrub coverage,shrub height, type of management plan, type of manage-ment agreement, level of disturbance due to humanactivities, and timber exploitation. A list of the variablesused at the different levels is provided in Appendix S2.
Statistical analysis
We stratified the sampling sites a priori into anthro-pogenic and natural forest sites in order to identify keycontrols with and without direct human land use. Thisstratification was performed to gain insights into howunderlying mechanisms that may affect these sites
FIG. 1. Distribution of tract center points for the Integrated Land Use Assessment project (ILUA) overlaying the 2010 landcover map of the Republic of Zambia and the schematic of the sampling design for the ILUA inventory. Using a systematic sam-pling design, the ILUA inventory surveyed vegetation in 221 tracts of 1 9 1 km. In each tract, four plots of 20 m by 250 m (or5,000 m2) were surveyed. The sub-plots (three per plot) shown here were used to collect information on aspect, slope, relief, texture,drainage, and soil organic matter and used in this study as descriptors. Data source: ILUA project data set and RCMRD/NASAland-cover map. [Color figure can be viewed at wileyonlinelibrary.com]
1580 JOHANNE PELLETIER ET AL.Ecological Applications
Vol. 27, No. 5

differently. The separation between anthropogenic andnatural sites was defined for the three levels of analysisusing land use information. At the tract level, naturaltracts were selected to be represented by “forest” classonly. At the plot level, the entire plot area had to be cov-ered by a forest class. At the land-use level, the naturalsites were the sections classified as forest land use. Theanthropogenic tracts and plots are characterized byhuman land uses or a mix of forests and human landuses. Other models were also developed with all the sitesand the results are provided in Appendix S1: Fig. S6–S9.
Multiple regression and variation partitioning.—We usedmultiple regression models to explain variation in treeAGB density between anthropogenic and natural forestsites at three scales (tract level, plot level, and land-uselevel). For each level, given the large number of explana-tory variables, we proceeded by creating separate modelsby type of descriptors, as these are more likely to be colli-near (e.g., environmental data, diversity indices), and byusing forward selection to retain only the significant vari-ables at 95% confidence level from each type of descriptortested. AGB density was normalized using the square-root transformation (tract level) or log-transformation(plot and land-use levels) prior to analysis, as were otherquantitative variables if they departed from the normaldistribution. Statistically significant explanatory variableswere then used to compute a model for each level. Weused a forward selection procedure based on Akaike’sInformation Criterion (AIC) to identify variables thatcontributed to best explaining the variation in AGB den-sity. We used a variance inflation factor (VIF) to removeany descriptor displaying strong collinearity, that is, allexplanatory variables included in the final model hadVIF indices lower than 10 (Borcard et al. 2011). When aparsimonious model was obtained, we conducted a varia-tion partitioning analysis to quantify the unique andshared fractions of variation explained by all subsets ofthe explanatory variables when controlling for the effectof the other subsets (Borcard et al. 2011, Legendre andLegendre 2012). To assess model fit and explained varia-tion, we used the adjusted R2, which controls for samplesize and number of predictors (Peres-Neto et al. 2006).We compared models for anthropogenic and natural sites,and with or without stand structure characteristics. Onlysites with no missing values were integrated into the mul-tiple regression models.
Boosted regression trees.—We used boosted regressiontrees (BRT) to compare to the results obtained usingmultiple regression models. BRT combines twoapproaches: regression trees, which are models that asso-ciate a response variable to predictor variables usingrecursive binary partitioning, and boosting, a machine-learning approach used here to combine a large numberof simple regression tree models that are fitted similar toindividual terms in an additive regression model in a for-ward and stage-wise fashion to improve the predictive
performance (Elith et al. 2008). The advantage of usingthis approach in our case was that it can accommodatemissing values in predictor variables; some of ourdescriptors could not be tested with multiple regressionswithout a large decrease in observations, thus in degreesof freedom, due to missing values. BRT also accommo-date variables of different types including quantitative,semi-quantitative, and categorical.We followed the guidance developed by Elith et al.
(2008) to identify optimal settings for the learning rate(lr), determining the contribution of each tree to thegrowing model, and the tree complexity (tc) controllinghow interactions are modelled (the number of nodes in atree). BRT were constructed with all predictors at eachlevel, with or without stand structure characteristics andMEM spatial variables, and separating between anthro-pogenic and natural sites at the plot and land-use levels.For each model, we evaluated the relative importance ofpredictor variables and the percentage of the devianceexplained by the predictors.
Analysis of variance, species ranking, and correlationtest.—We used one-way analysis of variance (ANOVA)with permutation test (Legendre 2007) followed byTukey HSD post hoc test in order to test for significantdifferences in biomass density between classes for landdesignation and ownership at the land-use level, as wellas the type of management agreement, the type of man-agement, the level of disturbance and fire occurrence forforest sites.We used Pearson’s product-moment correlation to
look at the relationships between biomass density anddifferent measures of the stand structure and diversitycharacteristics for all tracts, as well as separating theanthropogenic and natural variables at the plot and thetract levels. We used ANOVA with permutation test tocompare anthropogenic and natural plots for these char-acteristics.Species were ranked based on their contributions to
AGB density to assess species dominance and composi-tion between anthropogenic and natural plots. We esti-mated the mean percent (with confidence intervals)contribution to per plot biomass for each species and thecontribution of each species to the total biomass densityfor anthropogenic plots and for natural plots. For forestsites, the species contributing the most to the total bio-mass per forest types was calculated. All analyses wereperformed with R software (RCore Team 2013).
RESULTS
Explaining variation in biomass density
We found that diversity variables are key factorsexplaining variation in AGB density in Zambia (Fig. 2),when stand structure characteristics are not included inthe models. For anthropogenic sites, the variation parti-tioning results showed that diversity variables are of
July 2017 ABOVEGROUND TREE BIOMASS VARIATION 1581

foremost importance in predicting biomass density.Land-use variables explain an important share of thevariation in biomass density, but mostly in conjunctionwith diversity variables. These results are similar to whatis observed in models combining all the sites, though thevariation explained by land-use alone is somewhat
higher (13–16%; Appendix S1: Fig. S6, S8). In contrast,for natural sites, diversity or environmental variablesalone and in combination explain most of the variationin biomass density. Overall, AGB density was better pre-dicted in anthropogenic sites (from 62.6% to 75.8%)than natural sites (from 48.2% to 56.9%).
Diversity Environment
Management
0.13 0.15
0.04
0.13
0.010.04
Residuals = 0.52
Diversity Environment
Space
0.11 0.12
0.05
0.11
0.100.020.01
Residuals = 0.48
Diversity
Environment Land Use
Space
0.23
0.06 0.09
0.05
0.09
0.04
0.04
0.01
0.01
0.05
0.01
Residuals = 0.37Values <0 not shown
Diversity Environment
Land Use
0.30 0.02
0.05
0.03
0.030.210.09
Residuals = 0.27
Diversity Environment
Space
0.29 0.10
0.01
0.04
0.060.020.06
Residuals = 0.43
Diversity
Environment Land Use
Stand
0.20
0.03 0.02
0.01
0.00
0.04
0.03
0.00
0.05
0.00
0.00 0.01
0.29
0.07
Residuals = 0.24
Values <0 not shown Values <0 not shown
Anthropogenic Natural
Tract level
Land-use level
Plot level
FIG. 2. Venn diagram of the variation partitioning following the forwardly selected multiple regression models explaining varia-tion in biomass density. The left column presents variation partitioning for anthropogenic sampling sites at the tract level, the plotlevel and the land-use level. The right column shows variation partitioning of natural forest sites at the same scale of analysis. Vari-ables tested in regression models vary between levels and between anthropogenic and natural sites. These models do not includestand structure variables. “Space” refers to the Moran’s Eigenvector Maps variables forwardly selected. [Color figure can be viewedat wileyonlinelibrary.com]
1582 JOHANNE PELLETIER ET AL.Ecological Applications
Vol. 27, No. 5

Shannon evenness index, which combines the samplesizes of all species present at one site, was selectedthrough the forward selection procedure for all modelsexcept for natural sites when stand structure and MEMvariables are included, at the tract level (Table 1) and atthe plot level (Table 2). Shannon evenness index wasnegatively associated with biomass density. That is, spe-cies evenness was lower in sites with high biomass. In themultiple regression and BRT models, richness, Shannondiversity number and Shannon entropy were positivelyassociated with high biomass values.Among the environmental variable selected, the pro-
vince is one categorical predictor most frequentlyselected in models, which may signal indirect effects ofdifferent drivers on biomass acting in different ways indistinct areas of the country. Other environmental vari-ables selected include soil texture, elevation, mean maxi-mum temperature, and distance to roads (Tables 1, 2).At the land-use level, the percentage of tree canopy
coverage, jointly with land use and diversity, explain thegreatest share of the variation in AGB density (29%),followed by diversity alone, explaining 20% of the varia-tion. Environmental variables, including elevation andaverage maximum temperature, explain 11% of the vari-ation alone and with its shared fractions (Fig. 2e).For natural forested sites, diversity and environment
(including drainage and aspect) alone explain 13% and15% of the variation, respectively, as well as a sharedfraction of 13% (Fig. 2f). Management, including landdesignation, fire area, and levels of human disturbance,explains at best 9% of the variation in biomass density.When stand structure characteristics are included in
the models (including abundance, stand-level mean andmaximum height, dbh and WSG), those variablesexplain most of the variation in biomass density aloneand/or shared with diversity (Fig. 3). For anthropogenictracts and plots, as well as natural plots, about half ofthe variation in biomass density is explained by standstructure and half is shared by diversity measures andstand structure (Fig. 3a, c, d). For natural forest tracts,71% of the variation is explained by stand structure vari-ables, with only a small fraction explained jointly bydiversity and stand structure, and jointly by spatialstructure (MEM) and stand structure (Fig. 3b). Whenstand structure variables are included as explanatoryvariables, models for natural forest sites performed aswell as those for anthropogenic sites, both at the tract(Table 1) and at the plot level (Table 2).In general, there is a high level of concordance
between the results obtained with multiple regressionand BRT models. Other predictive variables were identi-fied with BRT models including the human populationnear the sites, distance to market and total annual pre-cipitation. We looked more closely at human interven-tion-related variables between anthropogenic andnatural sites, including distance to road, distance tonearest town (market), and the population near sitesusing separate linear regressions (Fig. 4a, b, c).
Significant relationships were identified, except for thedistance to town (market) that was not significant fornatural forest plots and the number of inhabitants nearsites was not significant for anthropogenic plots.
Management and conservation
Important differences relevant to biomass manage-ment and conservation emerged using ANOVAwith per-mutation tests and Tukey’s HDS post-hoc comparisons.For land designation or protection status, we found thatnatural/wildlife reserves, national parks, and other pro-tected and multipurpose areas have significantly higherAGB density than production, undefined, or other areas,with the highest biomass density measured in protectedareas managed for conservation (Fig. 5a). Land owner-ship status revealed that other private ownership(defined as land owned by private co-operatives, corpo-rations, religious and educational institutions, pensionor investment funds, NGOs, nature conservation soci-eties and other private institutions ) and state-ownedland have significantly higher biomass than customarylands (land tenure and management based on tradi-tional common rule or practice and determined at thelocal level, rather than by law or contract, often basedon oral agreements), which in turn has significantlyhigher biomass than land with unknown ownership orowned by individuals (Fig. 5b).Biomass density was found to be significantly higher
in forest sites for which the management has beendevolved (i.e., transferred) to communities, and was sig-nificantly different than other types of ownership ormanagement agreement, except in the case where a jointforest management (JFM) with the private sector wasestablished (Fig. 5c). Compared to JFM, the devolutionof forest management to communities can be defined asthe transfer of power and assets to non-state bodies(e.g., citizens, forest user organizations) not created orcontrolled by the state (Charnley and Poe 2007). Thereis also a significant difference between the types of forestmanagement plan, that is, any existing forest or wood-land management plan applied in forest lands. Forestsunder a formal management plan both formulated andimplemented showed significantly higher biomass den-sity than those under traditional management where noformal management plan is formulated or where a for-mal management plan is formulated but not imple-mented (Fig. 5d).Fire area was negatively correlated to AGB density but
we found no significant difference between groups usingANOVA for fire occurrence between forest sites withoutevidence of fire, with fire in the current year or fire in pre-vious years. The vast majority of fires (n = 770) were sur-face fires, that is fire spreading through the ground coverwhere it consumes litter and ground vegetation withoutreaching the tree canopies. We found a significant differ-ence in AGB density between the levels of human distur-bances in forest sites (Fig. 4d).
July 2017 ABOVEGROUND TREE BIOMASS VARIATION 1583

TABLE1.
Multipleregression
mod
elsforan
thropo
genican
dna
turalsites
andbo
ostedregression
tree
mod
elsat
thetractlevel,withor
witho
utstan
dstructurean
dMoran
eigenv
ectors
m-
aps(M
EM)spatialv
ariables.
Param
eter
Multipleregression
mod
els
Relativecontribu
tion
tobo
osted
regression
tree
mod
els(%
)
All+MEM
All+MEM
+SS
Anthrop
ogenic
Natural
Anthrop
ogenic
Natural
All
All+SS
All+SS
+MEM
bP
bP
bP
bP
Intercept
4.15
910
05.59
10�6
8.02
910
01.66
910
�12
�6.069
100
6.80
910
�6
�5.679
100
1.35
910
�7
Richn
ess
7.93
910
�2
4.05
910
�6
3.96
910
�2
4.46
910
�2
12.9
Shan
nonevenness
�3.669
100
1.32
910
�4
�4.139
100
2.95
910
�3
�1.699
100
7.25
910
�3
15.2
2.3
1.6
Shan
nonentrop
y7.91
910
�1
1.58
910
�6
Simpson
evenness
11.1
0.8
Simpson
index
4.8
Elevation
�5.379
10�1
2.63
910
�2
2.6
Province:Lusak
a�2
.449
100
1.92
910
�2
15.0†
4.2†
2.7†
Province:
Southern
�2.259
100
4.16
910
�3
Soiltexture:
Loa
m�1
.609
100
3.33
910
�2
2.0‡
0.7‡
Distanceto
road
5.32
910
�1
4.00
910
�3
1.77
910
�1
6.64
910
�2
2.2
Semi-evergreen
forest
9.63
910
�5
5.33
910
�5
2.29
910
�5
2.14
910
�2
14.3
1.3
1.1
Deciduo
usforest
6.52
910
�5
3.36
910
�2
2.7
Other
natural
forest
1.20
910
�3
3.62
910
�2
Abu
ndan
ce1.90
910
�2
1.71
910
�6
2.88
910
�2
<2.00
910
�16
41.1
37.4
Meandb
h6.35
910
�2
5.67
910
�5
3.59
910
�2
7.10
910
�2
5.2
4MeanHeigh
t2.86
910
�1
<2.00
910
�16
2.10
910
�1
1.63
910
�9
30.3
27.7
MeanWSG
6.44
910
01.45
910
�5
2.9
1.5
Dom
inan
tdb
h1.44
910
�2
5.88
910
�3
2.09
910
�2
1.44
910
�4
5.2
4.3
Spatialstructure
1�1
.659
10�2
4.35
910
�2
�1.049
10�2
3.07
910
�3
Spatialstructure
2�1
.329
10�2
6.84
910
�3
�5.399
10�3
4.18
910
�2
Spatialstructure
31.4
Spatialstructure
4�4
.229
10�3
3.93
910
�2
Spatialstructure
57.68
910
�3
2.65
910
�2
AdjustedR2
0.63
0.52
0.89
0.90
56.0§
82.8§
82.4§
Notes:db
h,diam
eter
atbreastheight;W
SG,w
oodspecificgravity.
†Factorof
prov
ince.
‡Factorof
texture.
§Devianceexplained.
1584 JOHANNE PELLETIER ET AL.Ecological Applications
Vol. 27, No. 5

TABLE2.
Multipleregression
andbo
ostedregression
tree
mod
elsforan
thropo
genican
dna
turalsites
attheplot
levelincluding
Moran
eigenv
ectors
map
s(M
EM)spatialv
ariables,w
ithor
witho
utstan
dstructure.
Param
eter
Multipleregression
mod
els
Relativecontribu
tion
tobo
ostedregression
tree
mod
els(%
)
All+MEM
All+MEM
+SS
Anthrop
ogenic
Natural
Anthrop
ogenic
Natural
Anthrop
ogenic
Natural
All
All+SS
All+SS
+MEM
All
All+SS
All+SS
+MEM
bP
bP
bP
bP
(Intercept)
9.39
100
3.39
10�4
�2.5
910
�1
3.49
10�1
4.63.4
910
�1
2.09
10�2
Richn
ess
1.49
10�1
<29
10�16
3.29
10�2
1.59
10�4
19.7
1.9
1.6
9.3
Shan
non
evenness
6.69
10�1
3.89
10�7
�2.7
910
0<29
10�16
�9.5
910
�1
6.29
10�6
4.5
1.1
0.6
9.5
Simpson
evenness
�8.5
910
�1
<29
10�16
4.5
1.2
0.6
4.0
Shan
non
number
9.29
10�2
<29
10�16
2.99
10�2
9.99
10�10
Shan
non
index
4.3
0.9
0.7
Elevation
�2.8
910
�3
2.29
10�6
�1.2
910
�3
7.19
10�11
�2.6
910
�4
3.49
10�4
3.4
9.1
Province:
Cop
perbelt
6.69
10�1
2.49
10�4
10.1
2.2
0.5
21.0
0.9
0.5
Province:
Eastern
�7.4
910
�1
6.09
10�5
Province:
Nortw
estern
3.39
10�1
3.29
10�4
Province:
Southern
�3.5
910
�1
1.89
10�3
Soiltexture:
Clay
5.89
10�1
8.79
10�4
2.19
10�1
9.59
10�3
3.2
7.1
0.5
Soiltexture:
Rock
�5.1
910
�1
7.39
10�4
�1.5
910
�1
3.19
10�2
Mean
maxim
umtemperature
�2.1
910
�1
3.49
10�3
Exp
osition
3.5
0.8
4.5
0.2
Slop
e5.3
0.6
0.1
Distance
toroad
3.5
3.4
Distanceto
market
2.6
3.5
Popu
lation
near
site
5.0
0.1
Semi-evergreen
forest
2.29
10�4
1.29
10�12
1.19
10�4
4.89
10�12
19.1
6.1
5.6
Deciduo
usforest
1.79
10�4
1.39
10�5
5.09
10�5
1.79
10�2
Evergreen
3.69
10�4
2.49
10�3
(Con
tinued)
July 2017 ABOVEGROUND TREE BIOMASS VARIATION 1585

TABLE2.
(Con
tinu
ed)
Param
eter
Multipleregression
mod
els
Relativecontribu
tion
tobo
ostedregression
tree
mod
els(%
)
All+MEM
All+MEM
+SS
Anthrop
ogenic
Natural
Anthrop
ogenic
Natural
Anthrop
ogenic
Natural
All
All+SS
All+SS
+MEM
All
All+SS
All+SS
+MEM
bP
bP
bP
bP
Stem
density
7.59
10�3
3.89
10�8
8.29
10�3
<29
10�16
19.8
21.6
25.8
26.9
Meanheight
8.19
10�2
3.79
10�12
7.49
10�2
<29
10�16
25.5
26.2
24.0
22.7
Meandb
h1.99
10�2
3.79
10�5
5.0
2.8
19.2
16.8
MeanWSG
1.69
100
2.29
10�15
8.7
Dom
inan
tdb
h1.49
10�2
1.39
10�12
1.39
10�2
<29
10�16
7.8
6.8
13.2
14.2
Dom
inan
theight
2.49
10�2
2.99
10�4
1.49
10�2
7.19
10�4
21.2
19.6
3.5
3.3
Dom
inan
tWSG
4.69
10�1
1.59
10�2
1.7
1.7
Spatial
structure1
�4.1
910
�3
1.39
10�2
�2.2
910
�3
8.99
10�3
Spatial
structure2
3.69
10�3
1.29
10�2
Spatial
structure3
3.49
10�3
1.39
10�2
AdjustedR2
orDeviance
explained
0.73
0.57
0.88
0.89
64.7†
82.2†
79.8†
61.8†
86.8†
85.6†
†Devianceexplained.
1586 JOHANNE PELLETIER ET AL.Ecological Applications
Vol. 27, No. 5

Relation of diversity, stand-level characteristics andspecies ranking with biomass density
We found a significant difference between anthro-pogenic and natural forest sites for all diversity andstand structure variables tested, with natural forest plotshaving higher mean values for all stand characteristics,including richness, abundance, dominant tree dbh,height, WSG, and basal area, and stand-level mean dbh,height, and WSG (Table 3).Stand characteristics were positively correlated with
the biomass density at the plot level, while evennessindices showed significant negative correlations(Table 3). Species abundance appears to be morestrongly correlated with biomass in natural plots (0.74vs. 0.64), while richness was more correlated to biomassin anthropogenic plots than in forest plots (0.59 vs.0.43). Height was more highly correlated to AGB densitythan any other tree measurements in plots with or with-out human land use. Stand-level mean WSG was not
correlated in anthropogenic plots. Similar results wereobtained at the tract level (Appendix S1: Fig. S3).We found little overlap when comparing the first 20
species ranked based on the average percentage of bio-mass by species in each plot with and without humanland use (Appendix S1: Fig. S4a, b), with only one spe-cies in common. In anthropogenic plots, dominant spe-cies obtained from this ranking were characterized byunique value (no error) or large error bars, characteristicof limited sample size. This indicates that a few plotswere dominated by uncommon species that might reflectdisturbed sites and other land use types than forestland.When comparing the percent of the total biomass for
the 20 species contributing the most to total AGB den-sity, anthropogenic and natural forest plots shared 15species in common (Appendix S1: Fig. S4c, d). For natu-ral plots, Colophospermum mopane ranks first in bothrankings, showing its overall dominant contribution tobiomass, followed by Julbernardia paniculata andBrachystegia spiciformis.
Diversity Structure
Land Use
0.01 0.31
0.02
0.31
0.090.000.13
Residuals = 0.12
Anthropogenic Natural
Tract level
Plot level
Diversity
Structure Land Use
Space
0.71 0.01
0.01
0.06
0.00
0.10
0.00
0.03
0.00
Residuals = 0.10
Values <0 not shown
Diversity
Structure Environment
Space
0.03
0.39 0.00
0.01
0.300.03
0.080.05
0.02
0.00
0.00
Residuals = 0.11
Values <0 not shown
Diversity
Structure Environment
Space
0.02
0.45 0.01
0.00
0.390.06
0.00
0.00
0.00
0.01
0.01
Residuals = 0.11Values <0 not shown
FIG. 3. Venn diagram of the variation partitioning following the forwardly selected multiple regression models explaining thevariation in biomass density including stand structure characteristics as explanatory variables, including abundance, dominantheight, diameter at breast height (dbh), and wood specific gravity (WSG) and stand-level mean height, dbh, and WSG. The left col-umn presents variation partitioning for anthropogenic sampling sites at the tract level and the plot level. The right column showsvariation partitioning of natural forest sites at the tract and the plot level. Variables tested in regression models vary between levelsand between anthropogenic and natural sites. [Color figure can be viewed at wileyonlinelibrary.com]
July 2017 ABOVEGROUND TREE BIOMASS VARIATION 1587

We also looked at the five species contributing themost to total biomass per forest type in the natural plotsinventoried (Appendix S1: Fig. S5) and we foundC. mopane contributed to more than 35% of the biomassin deciduous forests whereas Pterocarpus angolensis
contributed to more than 25% of the biomass in theevergreen forests (although sample size was small for thelatter). Brachystegia boehmii and B. spiciformis con-tributed a substantial fraction of the biomass in all threeforest types, while B. spiciformis and J. paniculata both
0
1
2
3
4
5
0 50 100 150 200Distance to road (m)
AGB
den
sity
(Mg/
ha)
a
0
1
2
3
4
5
50 100 150 200Distance to nearest town (m)
AGB
den
sity
(Mg/
ha)
Natural Anthropogenic
c
0
1
2
3
4
5
0 2 4 6 8Population near site (no. inhabitants)
AGB
den
sity
(Mg/
ha)
b
a ab b c0
50
100
150
1 2 3 4Level of disturbances
AGB
den
sity
(Mg/
ha)
None Slight Moderate Heavy
d
FIG. 4. Human effects on aboveground biomass (AGB) density. (a–c) Scatterplots of AGB square-root or log-transformed datawith transformed distance to road, population near site, and distance to nearest town (market) descriptors, respectively, with trend linesand 95% confidence intervals. Green dots show natural sites and pink triangles display anthropogenic sites at the plot level. For panel a,we obtained a significant positive relation between biomass density and distance to road for both natural (R2 adjusted = 0.0138,P = 0.005) and anthropogenic sites (R2 adjusted = 0.0247, P = 0.024). For panel b, for population near sites, the relation is slightly sig-nificant for natural sites (R2 adjusted = 0.0241, P = 0.012), but not for anthropogenic sites. When all sites are combined, there is no sig-nificant relation between population near sites and AGB density. For panel c with distance to nearest town, there is a significantpositive relation for anthropogenic sites (R2 adjusted = 0.0450, P = 0.003), but not for natural sites. These three variables do not explainwell the variation in biomass density. (d) A box plot of AGB density and the level of human disturbances, showing the median, thelower and upper hinges corresponding to the first and third quartiles, the upper and lower whiskers corresponding to 1.5 * interquartilerange, and the outlying points. We found a significant difference between groups using ANOVAwith permutation test (F3, 688 = 10.38,P = 0.001), indicating a significant decrease in AGB density with increase in disturbance level. The difference between groups obtainedwith Tukey HSD pairwise comparison is shown by lowercase letter. [Color figure can be viewed at wileyonlinelibrary.com]
1588 JOHANNE PELLETIER ET AL.Ecological Applications
Vol. 27, No. 5

represented more than 10% of the total biomass in semi-evergreen Miombo forests.
DISCUSSION
By comparing human and natural forest sites in Zam-bia across spatial scales, this study brings some funda-mental insights into the factors controlling variability inAGB density in this ecoregion, which is representativeof eastern and southern Africa tropical dry forestecosystems. One of our key findings is that variation intree biomass density is mostly explained by biotic pro-cesses related to tree diversity and composition, includ-ing stand structure, in both anthropogenic and naturalsites. Tree diversity and structure variables explainedmore of the variation than environment, spatial struc-ture modelled with MEM or even land use variables.The positive association of diversity to biomass densityin both human and natural sites demonstrates synergies
between biodiversity conservation and climate changemitigation.The relationship between diversity and ecosystem func-
tion has received a great deal of attention as an underlyingmechanisms determining tropical forest carbon storage(Balvanera et al. 2005, Poorter et al. 2015). This relation-ship has been shown to vary between forest biomes(Paquette andMessier 2011), and has not yet been directlyexplored in the dry tropical forests of Africa at a largescale. We found AGB density was positively correlatedwith species richness, but negatively with evenness (domi-nance structure), emphasizing not only the complementar-ity of these two diversity metrics but also the underlyingdifferences in mechanisms that determine the influence ofdiversity on biomass density. Two underlying mechanismshave been proposed to generate positive effect of biodiver-sity on ecosystem functioning, including on biomass den-sity (or carbon storage): the complementarity effect, i.e.,through (1) niche partitioning and facilitation and (2) the
a a a a b b b0
50
100
150
200
1 2 4 6 7 90 99Land designation
Protection statusNatural/wildlife reserve
National park
Protected area
Multiple purpose
Production
Not known
Other
a
a abc cd bd ce a0
50
100
150
200
1 2 3 4 6 90Land ownership
Land ownershipIndividuals
Industries
Other private
State
Customary
Not known
b
a a ab b a a0
50
100
150
200
1 2 3 4 90 99Type of management agreement
Management agreementManaged by owner
JFM with communities
JFM with private sector
Devolution to communities
Devolution to private sector
Not Known
c
a b ab0
50
100
150
200
1 2 90Type of management plan
Management planFormal
Traditional
Not Known
d
Bio
mas
s de
nsity
(Mg/
ha)
Bio
mas
s de
nsity
(Mg/
ha)
Bio
mas
s de
nsity
(Mg/
ha)
Bio
mas
s de
nsity
(Mg/
ha)
FIG. 5. Box plots of the log-transformed biomass density with (a) land designation (F7, 1105 = 10.75, P = 0.001) and (b) landownership (F,6, 1111 = 13.69, P = 0.001) for all land use sections as well as with (c) the types of management agreement(F5, 715 = 2.36, P = 0.048) and (d) the type of management plan (F2, 715 = 5.90, P = 0.004) for forest and other wooded lands.Significant differences in biomass density were found between groups for these four variables using ANOVAwith permutation test.The Tukey HSD pairwise comparison results are illustrated below each group. JFM, joint forest management. [Color figure can beviewed at wileyonlinelibrary.com]
July 2017 ABOVEGROUND TREE BIOMASS VARIATION 1589

sampling effects, by favoring the selection of certain func-tional traits (Loreau 1998, Turnbull et al. 2016). Most ofthe variation in AGB density was explained by standstructure trait-based variables, jointly with diversity mea-sures, highlighting the role of tree species dominance andspecies composition in determining patterns of tree bio-mass density. Dominance (or evenness) can directly affectcarbon storage via species identity (dominant trait) andevenness (the frequency distribution of those traits), butalso indirectly through its effect on species richness (e.g.,competition), which, in turn, influences ecosystem pro-cesses (Hillebrand et al. 2008). These results are consistentwith findings from hyper-diverse humid tropical forestsites, where both richness and dominance are importantin explaining variation in tree biomass density (Ruiz-Jaenand Potvin 2010, Cavanaugh et al. 2014).Many forest ecosystem functions are dominated by a
few species (Balvanera et al. 2005). In the Amazonianforest, this phenomenon has been described as hyper-dominance in forest function, including in carbon storage(Fauset et al. 2015). In the case of Zambia’s dry forests,different species contributed disproportionately to carbonstorage, with Colophospermum mopane contributing themost to biomass density in deciduous forests, and Jul-bernardia paniculata and Brachystegia spiciformis in semi-evergreen Miombo forests. These defining Miombo treespecies have important adaptive features, including exten-sive root systems with ectomycorrhizal associations thatenhance their ability to access limited soil nutrients, aswell as high recovery rates following moderate distur-bance from early dry season fires (Chidumayo 1993, Frost1996, Ryan and Williams 2011). A recent study suggeststhat, because of these characteristics, dominant miombotrees may be suppressing non-dominant species (Shirimaet al. 2015). The “selection effect,” by which species withthese particular traits are favored in comparison with
other species without those traits, may therefore be animportant mechanism at play in enhancing biomass den-sity in these ecosystems (Hillebrand et al. 2008).Land use and management were not the driving influ-
ences determining the variation in AGB density. Thisresult was surprising since we expected land use to explaina larger share of the variation in biomass density. Weidentified three factors that may explain these findings.First, the dominant drivers of deforestation and forestdegradation reducing AGB density are the slow expan-sion of subsistence agriculture, and the extraction ofwood fuel, timber, and charcoal production (Fisher 2010,Hosonuma et al. 2012). These drivers are likely to leavemore residual trees on sites, and so biomass, than mecha-nized agriculture would. There would therefore be morecarbon distributed in the landscape generally, regardlessof the land use. Second, AGB density is generally muchlower in tropical dry forests than in humid tropical for-ests, so the differences in AGB density between the siteswith or without human intervention is necessarily smallerthan in the humid tropical forests. Third, there is evidencethat Miombo forests are resilient to some intermediatelevel of disturbances (Chidumayo 2013, Jew et al. 2016).For example, Miombo woodlands in Tanzania havingmedium utilization levels retain key Miombo species, andmaintain tree species diversity and carbon storage com-pared to low utilization sites (Jew et al. (2016). In termsof carbon conservation and management, the limited con-trast in biomass density between human-modified andnatural sites highlights the potential for maintaining car-bon in the landscape outside forestland, and for forests tobe managed to fulfill multiple purposes.The impact of land use on biomass density in sites
with human land uses appear to be mediated by its influ-ence on tree diversity and stand structure, since a largefraction of the explained variation is shared between
TABLE 3. Correlations of aboveground tree biomass per plot with different stand characteristics for anthropogenic plots andnatural forest plots and comparison of the stand-level characteristics between anthropogenic and natural plots using ANOVAwith permutation test, with significant difference obtained for all characteristics.
Characteristic
Correlation of tree biomass per plotwith stand characteristics
ANOVAwith permutationtest between anthropogenic
and natural plots
Anthropogenic plots, n = 256 Natural plots, n = 478 F df P
Richness 0.594 0.434 37.38 1, 732 0.001Abundance 0.642 0.744 125.45 0.001Shannon evenness �0.486 �0.499 90.07 0.001Simpson evenness �0.515 �0.484 84.02 0.001Stand-level mean dbh 0.410 0.286 38.52 0.001Stand-level mean height 0.658 0.579 127.59 0.001Stand-level mean wood specific gravity �0.032* 0.136 6.58 0.006Dominant tree dbh 0.606 0.504 38.60 0.001Dominant tree height 0.719 0.575 80.59 0.001Dominant tree wood specific gravity 0.236 0.314 13.35 0.001Dominant tree basal area 0.606 0.504 25.56 0.001
Note: The asterisks (*) indicate that the Pearson’s product-moment correlations is not significant.
1590 JOHANNE PELLETIER ET AL.Ecological Applications
Vol. 27, No. 5
diversity and land use variables. Human activities havedetectable impacts by reducing biomass density, rich-ness, abundance, and other stand structure characteris-tics. We also detected a significant difference in biomassdensity in response to different levels of human distur-bances. Our results from species ranking of total percentbiomass show similar species composition in anthro-pogenic sites and natural forest sites, but the contribu-tion to biomass, or biomass dominance, differs betweenthose same species. This similarity in species composi-tion provides insights into the ecological processes actingafter anthropogenic disturbance where sites retain thesame species instead of switching to a different succes-sional stage. In effect, all tree species of the Miombohave the capacity to resprout by coppicing or by rootsuckering after logging or fire (Chidumayo 1997, Syam-pungani et al. 2016). Despite the apparent resiliency ofMiombo to different perturbations, species compositiondoes not always recover and may be replaced by sec-ondary species (Williams et al. 2008, Ribeiro et al. 2015)as we also detected when ranking species by the meanpercentage contribution to biomass. This change in spe-cies composition may or may not affect carbon storageover time.The disturbance history, including the effect of land
use, fire and elephants, is known to affect tree speciesdiversity and carbon storage. Time since disturbancewas shown to be an important factor promoting forestsstructure complexity and diversity in Tanzania (Mwam-pamba and Schwartz 2011), as well as biomass recoverywithin two to three decades following farm land aban-donment in the tropical dry forests of Mozambique(Williams et al. 2008). Fire control has been identified ascrucial to maintaining woody biomass in dry forests andwoodlands in a previous study in Zambia (Chidumayo2013), though we found no significant difference of treebiomass, possibly due to the overwhelming presence ofsurface fires. More information on site disturbance his-tory, including disturbance frequency and intensity,would be needed to obtain more in-depth understandingof its effects on carbon storage over time.Overall, environmental controls were more important
in natural forests and appear to play a limited role inexplaining the AGB density variation at sites where landuse and management controls dominate. At natural for-est sites, AGB is explained by both diversity factors andenvironmental drivers including elevation and soil tex-ture. These results are similar to the findings from casestudies looking at environmental covariates of tree AGBin the Miombo woodlands in Mozambique (Ryan et al.2011, Woollen et al. 2012). However, as it has beenreported in other studies of African savanna ecosystems(Colgan and Asner 2014) as well as in humid tropicalforests (Cavanaugh et al. 2014), environmental controlsplayed a relatively minor role compared to biotic pro-cesses (e.g., resulting from competition).From a management perspective, our results indicate
that protected areas in Zambia have higher biomass
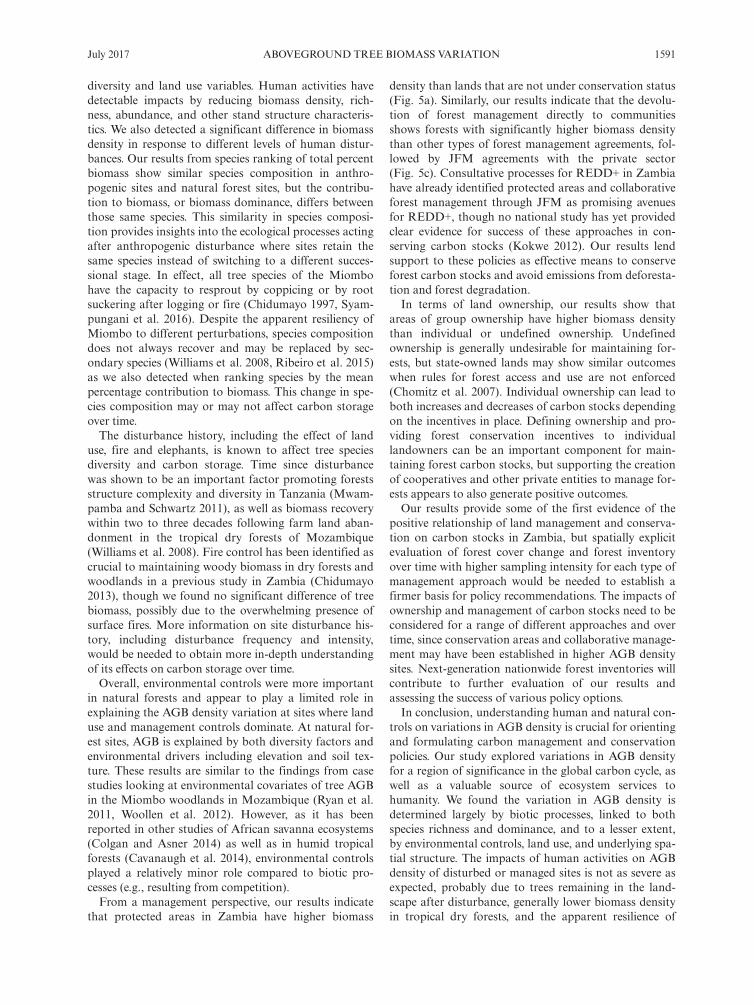
density than lands that are not under conservation status(Fig. 5a). Similarly, our results indicate that the devolu-tion of forest management directly to communitiesshows forests with significantly higher biomass densitythan other types of forest management agreements, fol-lowed by JFM agreements with the private sector(Fig. 5c). Consultative processes for REDD+ in Zambiahave already identified protected areas and collaborativeforest management through JFM as promising avenuesfor REDD+, though no national study has yet providedclear evidence for success of these approaches in con-serving carbon stocks (Kokwe 2012). Our results lendsupport to these policies as effective means to conserveforest carbon stocks and avoid emissions from deforesta-tion and forest degradation.In terms of land ownership, our results show that
areas of group ownership have higher biomass densitythan individual or undefined ownership. Undefinedownership is generally undesirable for maintaining for-ests, but state-owned lands may show similar outcomeswhen rules for forest access and use are not enforced(Chomitz et al. 2007). Individual ownership can lead toboth increases and decreases of carbon stocks dependingon the incentives in place. Defining ownership and pro-viding forest conservation incentives to individuallandowners can be an important component for main-taining forest carbon stocks, but supporting the creationof cooperatives and other private entities to manage for-ests appears to also generate positive outcomes.Our results provide some of the first evidence of the
positive relationship of land management and conserva-tion on carbon stocks in Zambia, but spatially explicitevaluation of forest cover change and forest inventoryover time with higher sampling intensity for each type ofmanagement approach would be needed to establish afirmer basis for policy recommendations. The impacts ofownership and management of carbon stocks need to beconsidered for a range of different approaches and overtime, since conservation areas and collaborative manage-ment may have been established in higher AGB densitysites. Next-generation nationwide forest inventories willcontribute to further evaluation of our results andassessing the success of various policy options.In conclusion, understanding human and natural con-
trols on variations in AGB density is crucial for orientingand formulating carbon management and conservationpolicies. Our study explored variations in AGB densityfor a region of significance in the global carbon cycle, aswell as a valuable source of ecosystem services tohumanity. We found the variation in AGB density isdetermined largely by biotic processes, linked to bothspecies richness and dominance, and to a lesser extent,by environmental controls, land use, and underlying spa-tial structure. The impacts of human activities on AGBdensity of disturbed or managed sites is not as severe asexpected, probably due to trees remaining in the land-scape after disturbance, generally lower biomass densityin tropical dry forests, and the apparent resilience of
July 2017 ABOVEGROUND TREE BIOMASS VARIATION 1591

these forest ecosystems to some level of utilization. Theconsequence of human activities on AGB density islargely mediated through its effects on diversity andstand structure characteristics. Additional research onthe role of tree functional diversity, as well as distur-bance history is needed in these African dry tropicalforest ecosystems. More information about the specifichuman activities that lead to biomass change is alsoneeded to inform forest management policies. Ourresults highlight the potential for positive outcomesfrom policies that emphasize forest management formultiple purposes including participatory managementand conservation in Africa’s dry forest ecosystems, sup-porting climate change mitigation, ecosystem functionsand human livelihoods.
ACKNOWLEDGMENTS
We thank the Forestry Department of the Government ofZambia for their support of this study. We gratefully acknowl-edge support from the FQRNT and the FAO to J. Pelletier, theNASA Applied Sciences Program – USAID SERVIR ProjectGrant No. NNX12AL27G to N. T. Laporte, and NASAEarth Ventures Grant NNL15AA03C (Global Ecosystem Dyn-amics Investigation) to S. J. Goetz. We warmly thank Dr. MariaDel Carmen Ruiz-Jaen for inputs and suggestions on the analy-sis of the diversity measures and stand structure, as well asDr. Jane Elith for her help in applying the boosted regressiontrees approach.
LITERATURE CITED
Alencar, A., P. M. Brando, G. Asner, and F. E. Putz. 2015.Landscape fragmentation, severe drought and the newAmazon forest fire regime. Ecological Applications 25:1493–1505.
Baker, T. R., et al. 2004. Variation in wood density determinesspatial patterns in Amazonian forest biomass. Global ChangeBiology 10:545–562.
Balvanera, P., C. Kremen, and M. Martinez-Ramos. 2005.Applying community structure analysis to ecosystem func-tion: examples from pollination and carbon storage. Ecologi-cal Applications 15:360–375.
Borcard, D., F. Gillet, and P. Legendre. 2011. Numerical ecol-ogy with R. Springer Science+Business Media, LLC, NewYork, USA.
Borcard, D., P. Legendre, C. Avois-Jacquet, and H. Tuomisto.2004. Dissecting the spatial structure of ecological data atmultiple scales. Ecology 85:1826–1832.
Bustamante, M., I. Roitman, T. M. Aide, A. Alencar, L. O.Anderson, L. Arag~ao, G. P. Asner, J. Barlow, E. Berenguer,and J. Chambers. 2016. Toward an integrated monitoringframework to assess the effects of tropical forest degradationand recovery on carbon stocks and biodiversity. GlobalChange Biology 22:92–109.
Campbell, B., A. Angelsen, A. Cunningham, Y. Katerere,A. Sitoe, and S. Wunder. 2007. Miombo woodlands—oppor-tunities and barriers to sustainable forest management.CIFOR, Bogor, Indonesia. http://www.cifor.cgiar.org/miombo/docs/Campbell_BarriersandOpportunities.pdf
Cavanaugh, K. C., et al. 2014. Carbon storage in tropical for-ests correlates with taxonomic diversity and functional domi-nance on a global scale. Global Ecology and Biogeography23:563–573.
Charnley, S., and M. R. Poe. 2007. Community forestry in the-ory and practice: Where are we now? Annual Review ofAnthropology 36:301–336.
Chave, J., et al. 2014. Improved allometric models to estimatethe above ground biomass of tropical trees. Global ChangeBiology 20:3177–3190.
Chidumayo, E. N. 1993. Zambian charcoal production:Miombo woodland recovery. Energy Policy 21(5):586–597.
Chidumayo, E. N. 1997. Miombo ecology and management: anintroduction. Intermediate Technology Publications Ltd(ITP), London, UK.
Chidumayo, E. N. 2002. Changes in miombo woodland struc-ture under different land tenure and use systems in centralZambia. Journal of Biogeography 29:1619–1626.
Chidumayo, E. N. 2013. Forest degradation and recovery in amiombo woodland landscape in Zambia: 22 years of observa-tions on permanent sample plots. Forest Ecology and Man-agement 291:154–161.
Chomitz, K. M., P. Buys, G. De Luca, T. Thomas, andS. Wertz-Kanounnikoff. 2007. At loggerheads?: agriculturalexpansion, poverty reduction, and environment in the tropi-cal forests. The International Bank for Reconstruction andDevelopment/The World Bank, Washington, D.C., USA.
Colgan, M. S., and G. P. Asner. 2014. Coexistence and environ-mental filtering of species-specific biomass in an Africansavanna. Ecology 95:1579–1590.
Day, M., D. Gumbo, K. B. Moombe, A. Wijaya, and T. Sunder-land. 2014. Zambia country profile: monitoring, reportingand verification for REDD+. CIFOR, Bogor, Indonesia.
Dewees, P. A., B. M. Campbell, Y. Katerere, A. Sitoe, A. B.Cunningham, A. Angelsen, and S. Wunder. 2010. Managingthe Miombo woodlands of Southern Africa: policies, incen-tives and options for the rural poor. Journal of NaturalResources Policy Research 2:57–73.
Dewees, P., B. Campbell, Y. Katerere, A. Sitoe, A. B. Cunning-ham, A. Angelsen, and S. Wunder. 2011. Managing theMiombo woodlands of Southern Africa: policies, incen-tives, and options for the rural poor. Program on Forests(PROFOR), Washington, D.C., USA
Elith, J., J. R. Leathwick, and T. Hastie. 2008. A working guide toboosted regression trees. Journal of Animal Ecology 77:802–813.
Fauset, S., M. O. Johnson, M. Gloor, T. R. Baker, A. Mon-teagudo, R. J. Brienen, T. R. Feldpausch, G. Feldpausch,Y. Malhi, and H. Ter Steege. 2015. Hyperdominance in Ama-zonian forest carbon cycling. Nature Communications 6:6857. DOI: 10.1038/ncomms7857
Fisher, B. 2010. African exception to drivers of deforestation.Nature Geoscience 3:375–376.
Frost, P. 1996. The ecology of the miombo woodlands. Pages11–58 in B. Campbell, editor. The Miombo in transition:woodlands and welfare in Africa. Center for InternationalForestry Research, Bogor, Indonesia.
Hillebrand, H., D. M. Bennett, and M. W. Cadotte. 2008. Con-sequences of dominance: a review of evenness effects on localand regional ecosystem processes. Ecology 89:1510–1520.
Hosonuma, N., M. Herold, V. De Sy, R. S. De Fries, M. Brock-haus, L. Verchot, A. Angelsen, and E. Romijn. 2012. An assess-ment of deforestation and forest degradation drivers indeveloping countries. Environmental Research Letters 7:044009.
Jew, E. K., A. J. Dougill, S. M. Sallu, J. O’Connell, and T. G.Benton. 2016. Miombo woodland under threat: consequencesfor tree diversity and carbon storage. Forest Ecology andManagement 361:144–153.
Kokwe, M. 2012. Forest management practices with potentialfor REDD+ in Zambia. UN-REDD programme. Republic ofZambia, Ministry of Lands, Natural Resources and Environ-mental Protection, FAO, NIRAS, Lusaka, Zambia
1592 JOHANNE PELLETIER ET AL.Ecological Applications
Vol. 27, No. 5

Larjavaara, M., and H. C. Muller-Landau. 2012. Temperatureexplains global variation in biomass among humid old-growth forests. Global Ecology and Biogeography 21:998–1006.
Legendre, P. 2007. One-way anova with permutation test. http://adn.biol.umontreal.ca/~numericalecology/FonctionsR/anova.1way.R
Legendre, P., and L. Legendre. 2012. Numerical ecology. ThirdEnglish edition. Elsevier Science BV, Amsterdam, TheNetherlands.
Lewis, S. L., D. P. Edwards, and D. Galbraith. 2015. Increasinghuman dominance of tropical forests. Science 349:827–832.
Lewis, S. L., et al. 2013. Above-ground biomass and structureof 260 African tropical forests. Philosophical Transactions ofthe Royal Society of London B: Biological Sciences 368:20120295; DOI: 10.1098/rstb.2012.0295
Loreau, M. 1998. Biodiversity and ecosystem functioning: amechanistic model. Proceedings of the National Academy ofSciences USA 95:5632–5636.
Malhi, Y., et al. 2006. The regional variation of abovegroundlive biomass in old-growth Amazonian forests. GlobalChange Biology 12:1107–1138.
Mittermeier, R. A., C. G. Mittermeier, T. M. Brooks, J. D. Pil-grim, W. R. Konstant, G. A. B. da Fonseca, and C. Kormos.2003. Wilderness and biodiversity conservation. Proceedingsof the National Academy of Sciences USA 100:10309–10313.
Munishi, P. K., S. Mringi, D. D. Shirima, and S. K. Linda.2010. The role of the Miombo woodlands of the SouthernHighlands of Tanzania as carbon sinks. Journal of Ecologyand the Natural Environment 2:261–269.
Mwampamba, T. H., and M. W. Schwartz. 2011. The effects ofcultivation history on forest recovery in fallows in the EasternArc Mountain, Tanzania. Forest Ecology and Management261:1042–1052.
Paquette, A., and C. Messier. 2011. The effect of biodiversity ontree productivity: from temperate to boreal forests. GlobalEcology and Biogeography 20:170–180.
Peres-Neto, P. R., P. Legendre, S. Dray, and D. Borcard. 2006.Variation partitioning of species data matrices: estimationand comparison of fractions. Ecology 87:2614–2625.
Phillips, O. L., et al. 2009. Drought sensitivity of the Amazonrainforest. Science 323:1344–1347.
Poorter, L., M. Sande, J. Thompson, E. Arets, A. Alarc�on,J. �Alvarez-S�anchez, N. Ascarrunz, P. Balvanera, G. Barajas-Guzm�an, and A. Boit. 2015. Diversity enhances carbon stor-age in tropical forests. Global Ecology and Biogeography24:1314–1328.
R Core Team. 2013. R: a language and environment for statisti-cal computing. Vienna, Austria. http://www.R-project.org/
Ribeiro, N. S., H. H. Shugart, and R. Washington-Allen. 2008.The effects of fire and elephants on species composition and
structure of the Niassa Reserve, northern Mozambique. For-est Ecology and Management 255:1626–1636.
Ribeiro, N. S., S. Syampungani, N. M. Matakala, D. Nangoma,and A. I. Ribeiro-Barros. 2015. Miombo woodlands researchtowards the sustainable use of ecosystem services in SouthernAfrica. In J. A. Blanco, editor. Biodiversity in ecosystems—linking structure and function. DOI: 10.5772/59288.Available from: https://www.intechopen.com/books/biodiversity-in-ecosystems-linking-structure-and-function/miombo-woodlands-research-towards-the-sustainable-use-of-ecosystem-services-in-southern-africa
Ruiz-Jaen, M. C., and C. Potvin. 2010. Tree diversity explainsvariation in ecosystem function in a Neotropical forest inPanama. Biotropica 42:638–646.
Ryan, C. M., and M. Williams. 2011. How does fire intensityand frequency affect Miombo woodland tree populations andbiomass? Ecological Applications 21:48–60.
Ryan, C. M., M. Williams, and J. Grace. 2011. Above- andbelowground carbon stocks in a Miombo woodland land-scape of Mozambique. Biotropica 43:423–432.
Shirima, D., Ø. Totland, P. Munishi, and S. Moe. 2015. Doesthe abundance of dominant trees affect diversity of a wide-spread tropical woodland ecosystem in Tanzania? Journal ofTropical Ecology 31:345–359.
Syampungani, S., C. J. Geldenhuys, and P. W. Chirwa. 2016.Regeneration dynamics of Miombo woodland in response todifferent anthropogenic disturbances: forest characterisationfor sustainable management. Agroforestry Systems 90:563–576.
Trumbore, S. E., P. M. Brando, and H. Hartmann. 2015. Foresthealth and global change. Science 349:814–818.
Turnbull, L. A., F. Isbell, D. W. Purves, M. Loreau, and A. Hec-tor. 2016. Understanding the value of plant diversity forecosystem functioning through niche theory. Proceedings ofthe Royal Society B 283:20160536.
Tyukavina, A., A. Baccini, M. C. Hansen, P. V. Potapov, S. V.Stehman, R. A. Houghton, A. M. Krylov, S. Turubanova,and S. J. Goetz. 2015. Aboveground carbon loss in naturaland managed tropical forests from 2000 to 2012. Environ-mental Research Letters 10:074002.
United Nations Convention on Climate Change. 2015. Adop-tion of the Paris Agreement (ANNEX-Paris Agreement),FCCC/CP/2015/L.9. Conference of the Parties Twenty-First Session. United Nations Office at Geneva, Geneva,Switzerland
Williams, M., C. M. Ryan, R. M. Rees, E. Sarnbane,J. Femando, and J. Grace. 2008. Carbon sequestration andbiodiversity of re-growing Miombo woodlands in Mozam-bique. Forest Ecology and Management 254:145–155.
Woollen, E., C. M. Ryan, and M. Williams. 2012. Carbonstocks in an African woodland landscape: spatial distribu-tions and scales of variation. Ecosystems 15:804–818.
SUPPORTING INFORMATION
Additional supporting information may be found online at: http://onlinelibrary.wiley.com/doi/10.1002/eap.1550/full
July 2017 ABOVEGROUND TREE BIOMASS VARIATION 1593