human capital, innovation capability and ... - working …
TRANSCRIPT

FACULDADE DE ECONOMIA
UNIVERSIDADE DO PORTO
Faculdade de Economia do Porto - R. Dr. Roberto Frias - 4200-464 Porto - Portugal Tel . +351 225 571 100 - Fax. +351 225 505 050 - http://www.fep.up.pt
WORKING PAPERS DA FEP
HUMAN CAPITAL,INNOVATION CAPABILITYAND ECONOMIC GROWTH
Portugal, 1960 - 2001
Aurora TeixeiraNatércia Fortuna
Investigação - Trabalhos em curso - nº 131, Julho de 2003
www.fep.up.pt

FEP Working Paper no. 131, July 2003
1
HUMAN CAPITAL, INNOVATION CAPABILITY AND ECONOMIC GROWTH PORTUGAL, 1960 - 2001
AURORA TEIXEIRA and NATÉRCIA FORTUNA
CEMPRE ∗, Faculdade de Economia, Universidade do Porto Rua Dr. Roberto Frias, 4200-464 Porto, Portugal
e-mail: [email protected]
ABSTRACT
In this paper, we study human capital effects on economic growth of Portugal from 1960 to 2001. By using VAR and cointegration analyses, we obtain 0.42 long-run estimate for human capital elasticity, 0.30 long-run estimate for internal knowledge elasticity, and 0.40 long-run estimate for the elasticity related with the composite variable that measures the interaction between human capital and innovation capability. These estimates seem to confirm that human capital and indigenous innovation efforts are enormously important to the process of Portuguese economic growth during the period 1960-2001, though the relevance of the former overpasses that involving the creation of an internal basis of R&D. In addition, the indirect effect of human capital, through innovation, emerges here as critical, showing that a reasonably higher stock of human capital is important to enable a country to reap the benefits of its innovation indigenous efforts.
Keywords: human capital, innovation, economic growth
JEL-Classification: J24; O30; O40
RESUMO Neste artigo estudamos os efeitos do capital humano no crescimento económico português entre 1960 e 2001. Utilizando as metodologias VAR e de cointegração, obtemos as estimativas de longo prazo para as elasticidades do capital humano (0,42), do conhecimento interno (0,30) e da variável compósita que mede a interacção entre capital humano e capacidade de inovação (0,40). Estas estimativas parecem confirmar que o capital humano e os esforços internos de inovação foram extremamente importantes no processo e crescimento económico português durante o período 1960-2001, embora a relevância do primeiro ultrapasse o da criação de uma base interna de I&D. Adicionalmente, o efeito indirecto do capital humano, através da inovação, surge aqui como crítico, demonstrando que a detenção de um stock de capital humano razoavelmente elevado é importante para permitir a um país colher os benefícios dos seus esforços internos de inovação.
Palavras-chave: capital humano, inovação, crescimento económico
JEL-Classificação: J24; O30; O40
∗ CEMPRE - Centro de Estudos Macroeconómicos e Previsão - is supported by the Fundação para a Ciência e a Tecnologia, Portugal, through the Programa Operacional Ciência, Tecnologia e Inovação (POCTI) of the Quadro Comunitário de Apoio III, which is financed by FEDER and Portuguese funds.

FEP Working Paper no. 131, July 2003
2
1. INTRODUCTION Neither classical nor neoclassical authors on economic growth gave much attention to
the role of human capital as one of the sources of growth. In contrast, other authors, for
example, Mankiw et al. (1992), postulated later that there is a significant relationship
between investment in human capital and economic growth. In theory, since human
capital is related to knowledge and qualifications, and since economic growth depends
on the progress of technological and scientific knowledge, it is reasonable to expect that
growth is a function of human capital.
In the 1980’s, seminal works of Romer (1986) and Lucas (1988) revolutionized the
neoclassical theory of economic growth by introducing endogenous growth models. The
‘new neoclassical theories’ put emphasis not on direct sources of economic growth but
on mechanisms and incentives linked to dynamics of the growth itself. This new
methodology set human capital as a critical factor to generate technological progress
and, as a consequence, steady-state economic growth.
We follow the argument of Pack (1994), for whom tests concerning endogenous models
have to be applied using economic time series data from each country separately. The
present study involves an empirical application to the economy of Portugal, during the
period 1960-2001. Our goal is therefore to empirically evaluate the importance of
human capital as a direct or indirect (through innovation) cause for Portuguese
economic growth since 1960’s till present. This is achieved by using cointegration
techniques.
The rest of the paper is structured as follows. In Section 2, we briefly portray, in
theoretical terms, the relationship between human capital, technological progress and
economic growth. In Section 3, we provide an overview of related empirical work. In
Section 4, we describe the data set that we use. The empirical analysis of a long-run
stable relationship between productivity, human capital and innovation capability is
presented in Section 5. Finally, in Section 6, we conclude with a summary of estimation
results for the Portuguese economy during the period 1960-2001.

FEP Working Paper no. 131, July 2003
3
2. HUMAN CAPITAL, INNOVATION AND ECONOMIC GROWTH: BRIEF REVIEW OF THE THEORETICAL LITERATURE
In spite of contributions of authors, preceding1 and contemporary2 with Solow, it was
with his seminal publication “A contribution to the theory of economic growth” of 1956
that one has truly engaged in a systematic and quantified analysis of questions related to
economic growth, clearly separating economic growth and economic development.
The basic neoclassical model of economic growth, associated with the pioneering of
Solow (1956), assumes however that disembodied technological progress (as the
population growth and the workforce) is exogenous to the model.3 New theories of
economic growth (Romer 1986, Lucas 1988) went beyond the limitations of exogenous
technological innovation underlying the work of Solow, by considering accumulation of
human capital as a determinant source of economic growth. This change of focus is well
expressed by Lucas:
The main engine of growth is the accumulation of human capital - of knowledge - and the main source of differences in living standards among nations is differences in human capital. Physical capital accumulation plays an essential but decidedly subsidiary role. Human capital takes place in schools, in research organizations, and in the course of producing goods and engaging in trade.” (Lucas, 1993: 270)
For most neoclassical models, a determinant factor of economic growth is endogenous
innovation. However, this innovative action is itself influenced by human capital
endowment of the economy. These models of endogenous growth share the idea of
Arrow (1962) of existence of important externalities inherent to accumulation process
1 Smith (1776), Malthus (1798), Ricardo (1817), Ramsey (1928), Young (1928), Schumpeter (1912) and Knight (1944) provided basic ideas that were a starting point of the modern theory of economic growth: competitive behavior, equilibrium dynamics, the role of decreasing revenues and its relation to accumulation of human and physical capital, interactions between revenues per capita and rate of population growth, effect of technological progress on either a better form of labor specialization or discovery of new goods and processes, etc. See Barro and Sala-i-Martin (1995, Chapter 1) for a more detailed description of contributions before Solow. 2 Stiglitz and Uzawa (1969) constitute an excellent collection of articles of some of the most important authors of the time of Solow, representing not only neoclassical growth theory but also other theoretical alternatives. See, for example, Part III of the collection referring to contributions of the Cambridge (England) school (e.g., Kahn, Kaldor e Robinson). 3 The term “disembodied” means that the pace of investment does not influence the rate that technology improves. It is as “... all technical progress were something like time-and-motion study, a way of improving the organization and operation of inputs without reference to the nature of the inputs themselves.” [Solow (1959: 90-91)].

FEP Working Paper no. 131, July 2003
4
of technological knowledge.4 These externalities take the form of generic technological
knowledge that can be used to develop new production methods and be available to all
the firms. For Lucas (1988), the externalities take the form of public learning that
increases the stock of human capital. In addition to the effects of individual on one’s
own productivity or an “internal effect” of human capital, Lucas also considered, on a
general skill level, an “external effect” expressed by the level of human
capital/aggregated qualification that contributed to the productivity of all factors.5
In technical terms, the general form of the models of Romer (1986) and Lucas (1988)
assumes that technological progress enters into the production function of some given
firm in two distinct ways: a term that describes the effect of private investments on
knowledge and that exhibit the usual characteristics (decreasing marginal revenues); a
second term, describes existence of knowledge spillovers that are linked to the
investments in knowledge by other firms. Formally, we have:
( )Y F H L Hi i i i= , ,
where Yi is the output of the ith firm, Hi is the stock of investment in technological
progress (representing the human capital in Lucas (1988)) of the ith firm, Li is the
quantity of labor force used by the ith firm, H is the total amount of stock of investment
in technological progress available to all firms of the economy (in Romer (1986),
represented by a sum of all individual Hi’s, and in Lucas (1988), expressed by an
average level of human capital). The production function of the economy follows from a
simple aggregation of firms that are considered identical (or, alternatively, the ith firm is
considered a representative agent).
The works on endogenous growth of the second wave, Romer (1990a), Grossman and
Helpman (1990, 1991), and Aghion and Howitt (1992), try to end the excessive
aggregation of the previous approaches by attesting microeconomic reasons for
economic growth. These models retake the hypothesis of catch-up by suggesting a
4 The publication of the article of Arrow (1962) on learning-by-doing caused an increase of interest in dynamic models of economic growth induced by increasing revenues. In his model, Arrow supposed that the productivity of a given firm was an increasing function of cumulative aggregated investment of industry. Arrow advocated that increasing revenues occur as a result of discoveries of new knowledge, as investments and production take place. The revenues will be external to firms, considered separately, if not such knowledge will have turned public. Arrow (1962) calls knowledge acquisition ‘learning’, this being a result of experience and, therefore, only having place as a consequence of productive actions. 5 Lucas (1988) calls this effect “external” given that no decision on human capital accumulation has a noticeable effect over aggregated level of human capital whence an individual does not take into account this effect in his decision of distributing time.

FEP Working Paper no. 131, July 2003
5
possibility of higher productivity growth in countries that are initially behind, as a result
of the diffusion of knowledge already available in industrialized countries, that is, “their
initial backwardness offers an opportunity to be exploited.” (Pack, 1994: 62). Moreover,
the growth of productivity in these countries depends simultaneously on the intensity of
international trade and the capacity of internal technological adoption, only possible for
higher levels of human capital, as suggested by Lucas (1988) and Romer (1990a, b).6
3. HUMAN CAPITAL, INNOVATION AND ECONOMIC GROWTH: REVIEW OF MAIN EMPIRICAL RESULTS
3.1. Human capital and economic growth
At the world level, there is substantial empirical evidence that accumulation of human
capital constitutes an important determinant of economic growth. This evidence is so
numerous that, according to Romer (1990b: 273), “... it is a challenge for a non
specialist to read even the surveys in the area.”.
In a study of 98 countries during the period from 1960 to 1985, Barro (1991) concluded
that the rate of output growth is strongly related to the initial quantity of human capital.
Levine and Renelt (1992) confirmed the results of Barro concerning the effect of human
capital on the rate of real growth of output per capita, by using the initial rate of high
school education as an indicator for human capital. Based on the empirical analysis for
South Korea and Taiwan in the framework of dynamic equilibrium, Lee, Liu and Wang
(1994) showed that economic growth is facilitated by improvement of aggregate supply,
this being translated into technological progress and formation of human (and physical)
capital.
In a more complex approach, Benhabib and Spiegel (1994) modeled technological
progress (growth of total factor productivity) as a function of education level, and, as in
Romer (1990a), considered the hypothesis that human capital affects growth not only
directly – influencing the rate of technological innovation of a country -, but also
indirectly – influencing the pace of adoption of technologies that come from the
outside.7 This last aspect is particularly important for small countries as Portugal where
6 Nelson and Phelps (1966) have already advocated that human capital will only be productive when changes occur in technology – education will increase the individual capacity to react to rapid changes in knowledge. 7 This idea is not novel. Nelson and Phelps (1966) have already suggested that technical progress (or residual of Solow) depends on the gap between the knowledge level of a country, A(t), and the level of “theoretical knowledge”, T(t). For these authors, the rate at which this gap reduces depends on the level of

FEP Working Paper no. 131, July 2003
6
growth process is essentially based on diffusion of technology rather than its creation.
Verspagen (1993: 101) refer precisely to this feature, when characterizing the “catching-
up countries” (among which Portugal is included): “These countries ... combine low
population growth with high investment ratios, but relatively low R&D intensities.
Thus, they appear to rely on diffusion of knowledge rather than on creation of
knowledge.”
The results obtained by Benhabib and Spiegel from a cross-country sample of 78
countries during the period 1960-1985, suggest that the role of human capital, as a
necessary condition for adoption and creation of technology adapted to internal needs, is
more important than that of being a production factor.
Although at cross-country level there is reasonable evidence on the effect of human
capital on economic growth, studies specific to one country are rare. For instance,
concerning the Portuguese economy, and according to Pina and St. Aubyn (2002), the
studies of Dias (1992) and Teixeira (1997) are the only ones (before Pina and St.
Aubyn’s) that estimate the contribution of human capital to economic growth. Similarly
to Teixeira (1997), Pina and St. Aubyn (2002) conclude that there is statistical evidence
of a (meaningful) long-run economic relationship between output and human capital,
that is, human capital emerges as an important variable for explaining economic growth.
Despite no presentation of any quantification of human capital, Nunes, Mata and
Valério (1989) pointed out that the real problem inherent to the weak performance of
Portugal in respect to other European economies, during the period 1833-1985, is
associated with incipient basic and technical education, and also with a lack of
entrepreneurial initiative. These authors thus suggested that inefficiency of education
system, translated into increased illiteracy, lack of engineers and capable managers,
contributed to Portugal falling behind during that period. In addition, they also brought
up the decisive role of structural policies in implementing education, during the
Republican Regime (1910-1926), to tackle the problem of lack of human resources,
with positive effects on economic growth.
human capital (H), via a function c (H), where ∂
∂
c
H> 0 :
dA
Ac H
T t A t
A t= ⋅
−
( )
( ) ( )
( ). But, despite that the
growth of total factor productivity dA
A
is influenced by H in the short run, this growth will tend to
stabilize at the level of the (exogenous) rate of theoretical knowledge growth in the long run.

FEP Working Paper no. 131, July 2003
7
3.2. Innovation and economic growth
Presently, it is common to suppose that new technologies are the driving force of the
long run productivity growth. Countries can benefit from a high degree of external
R&D, without great internal expenditures on R&D, through acquisition of rights for
patents, franchising and exchange of goods in which external R&D is incorporated.
Various authors identified these international spillovers of R&D and of learning-by-
doing. In addition to Coe, Helpman and Hoffmaister (1995), Griliches (1995), Caballero
and Jaffe (1993) and Coe and Helpman (1993) among others, Englander and Gurney
(1994) estimate that the US were responsible for 56% of industrial R&D in most OECD
countries in 1973, and for 47.5% in 1990.8 According to these authors, this reduction of
productivity gap between the US and other countries was a sign that R&D of other
countries had been in part directed by the adoption and acquisition of technologies from
the US.
Concerning the importance of technological innovation capacity in the context of new
models of exogenous growth, respective empirical implementation turns out to be
complex. An appropriate test requires a system of equations, including one for the
sector of technological production. A less ambitious approach consists of trying an
equation of reduced form, having efforts in R&D and/or human capital as possible
explanatory variables. By using this latter approach, Coe and Helpman (1993) studied
the relation between R&D and productivity in twenty-two industrialized economies,9
from 1971 to 1990, relating increase in “total factor productivity” (TFP) – that is, gains
on the output level that are not derived from the use of additional capital or labor – to
changes in stock of R&D (estimated by the cumulative cost of R&D, taking into
account depreciation). Their results confirmed a positive relationship between R&D
stock of a country and its own productivity – typically, a 1 percentage point increase in
stock of R&D of the seven main industrialized countries leads to 0.23 percentage points
increase in productivity; the fifteen economies of smaller size enjoy proportionally
smaller gains: typically, a 1 percentage point increase in R&D stock of one of these
economies raises the respective productivity merely by 0.07 percentage points. In
addition, they also found that expenditures on research of each country significantly
influence productivities of other countries – about ¼ of gains of investment in R&D of
larger size countries return to other countries. Major spillovers come from the US, 8 See Englander and Gurney (1994: 62). 9 Twenty-one OECD economies plus Israel.

FEP Working Paper no. 131, July 2003
8
which has the highest R&D stock – each percentage point increases in stock raises the
productivity of other countries by 0.04 percentage points (estimated value).
Complementary, small economies benefit more from external R&D stock than big
economies. According those same authors, in small-industrialized economies,
expenditures on external R&D (those made in other countries) have a bigger effect on
the respective productivity rather than their own research effort. For example, it was
estimated that a 1 percentage point increase in external R&D stock of Portugal in 1990,
raised the Portuguese productivity (TFP) by about 0.12 percentage points.10
In this study, we explore the relation of internal knowledge stock (capability of
innovation) and human capital to productivity. Not neglecting the fundamental
importance of international spillovers, we are interested here in internal spillovers, that
is, those of innovation production/diffusion sectors to others.
4. THE PROXIES OF RELEVANT VARIABLES 11
4.1. Total factor productivity
In theoretical literature on economic growth, technological progress has been viewed in
three ways: as a free good,12 as a by-product (externality) of other economic activities,13
and also as a result of R&D activities undertaken by private firms.14 Despite that the
first two forms of technological progress share some merits – on one hand, the basic
research at universities and other public R&D institutions supply substantial inputs for
technological progress; on the other hand, learning-by-doing, practice and interaction
constitute important factors for technological progress -, the third form of technological
progress – innovation as a result of activities undertaken by private firms – is
increasingly considered as the most relevant source of technological progress in
capitalist economies.
The most often used measures of economic growth are output per worker (or hours per
worker) and total factor productivity (TFP) or “residual of Solow”. The first measures 10 Coe et al. (1995) specified this asymmetry in distribution of spillovers, suggesting that small economies can greatly benefit from external R&D by international trade. By importing from technologically more advanced countries, small economies acquire inputs of advance technology that make their own industries more efficient. 11 In Appendix, we present the series used in estimation in this paper. 12 For example, in the model of Solow (1956). 13 The models of learning-by-doing of Arrow (1962) and Romer (1986). 14 Romer (1990a), Grossman and Helpman (1991), Aghion and Howitt (1992), Segerstrom (1991), Caballero and Jaffe (1993), among others.
FEP Working Paper no. 131, July 2003
9
the productivity growth as the difference between the rate of growth of output index
based on gross domestic product (GDP) at constant prices and an employed population
index or the number of hours per worker. The second measure, TFP, subtracts from the
first measure an estimate of the contribution of physical capital to productivity growth,
based on the growth of capital/labor ratio, weighted by capital factor share on total
returns relative to all the factors.15
In this study, TFP is used as a proxy of technological progress. We do so but also
realize its limitations, as put by Abramovitz (1994), “… TFP [total factor productivity]
… it is properly interpreted as reflecting the influence of all the unmeasured sources of
growth … it includes, besides technological advance, also changes in labor quality due
to education or otherwise, gains from the better allocation of resources and those from
the economies of scale - unless these are somehow measured.”
4.2. Human capital stock
The modern theories of economic growth consider accumulation of human capital (as
that of physical capital) a driving force of economic growth, but recognize that its
quantification, at the aggregate level, is more complex than that of physical capital. To
evaluate effects of human capital, however, economists need to know how to measure it.
A great part of theoretical models of endogenous growth, as those of Lucas (1988),
Becker et al. (1990), Romer (1990a), Mulligan and Sala-i-Martin (1993), Caballé and
Santos (1993) and Upadhay (1994), bring the role of human capital in the form of
education levels. Empirical studies behind these models as Romer (1990b), Barro
(1991), Kyriacou (1991), Nunes (1993), Barro and Lee (1993), Benhabib and Spiegel
(1994), Villanueva (1994) use educational proxies for human capital. However, as
realized by Barro and Lee (1993: 363-364), “[t]hese studies ... have been hampered by
the limited educational data that are available on a consistent basis...”.
The use of literacy rates as a proxy of human capital (Romer, 1990b; Nunes, 1993) is
unsatisfactory. The literacy rates measure only the current human capital component,
not reflecting the qualifications obtained beyond the basic level of education. Literacy
constitutes only the first phase of human capital creation. There exist also other aspects
as or more important to labor productivity, for example, analytical, logical and
15 Both measures are associated with the problems of determining an adequate price index as a GDP deflator, and of measuring the quantity and quality of labor factor; the second measure has an additional problem, that is the quantification of capital and its rate of use (Griliches, 1988).

FEP Working Paper no. 131, July 2003
10
monetary reasoning in addition to various types of technological knowledge. Thus,
using literacy to measure human capital stock implies the implicit assumption that
education beyond the most basic level does not significantly contribute to productivity.
Another way to measure human capital is through schooling rates (schooling enrolment
ratios). Since these rates are easily available in many countries they have been used in
numerous studies (Barro, 1991; Levine and Renelt, 1992; Easterly and Rebelo, 1993;
Barro and Sala-i-Martin, 1995). The main drawback of these rates (real or gross) is that
they only reflect the current flows of education. The accumulation of these flows is an
element of human capital stock that will be available in the future.16 As education
process evolves over various years, temporal lag between flows and stocks is generally
very high. Even if an adequate temporal lag is considered, determining human capital
stock requires an estimate of initial stock.
Unsatisfied by schooling and literacy rates, many authors, such as Psacharopoulos and
Arriagada (1986), Kyriacou (1991) and Barro and Lee (1993), constructed more
elaborate measures for human capital stock. The most elaborate attempt to quantify the
stock of human capital for different countries is that of Barro and Lee (1993). These
authors present a comparison of schooling ratios for 129 countries during the period
1960-1985. These ratios show the percentage of men and women, 25 years old or older,
which attained different schooling levels (that is, no schooling, primary school, high
school or university).
Empirical studies of Portuguese economic growth have generally used literacy rates as
the proxy for human capital. This is in large part justified by the already mentioned
broader availability of this indicator and the fact that Portuguese development level is
low enough that illiteracy may still be considered a hurdle. To our best knowledge,
Teixeira (1997, 1998) was the first attempt to estimate a time series of human capital for
Portugal. By using a methodology similar to that of Barro and Lee (1993), the author
estimated an average time of schooling for the population of 25 years old or older,
during the period from 1960 to 1992.
16 Other drawbacks inherent to these rates are related to mortality and migration. In addition, since real rates are in general not available, another source of error is introduced, that caused by repetition of the years and withdrawal from the schooling process.

FEP Working Paper no. 131, July 2003
11
This study follows the methodology of Teixeira (1997) to extend the series of human
capital till 2001.17 By using available data of census as a reference, we estimate the
lacking observations by a permanent inventory method (considering the census values
as stock reference and using the schooling rates to estimate the variations related to that
stock), using the following formulas:
( )
( )
( ) , 2525
1
, 2525
1
, 2525
1
55,3,3
5105,2,2
10155,1,1
−−
−−−
−−−
⋅+⋅
−=
−⋅+⋅
−=
−⋅+⋅
−=
tt
tt
t
tt
ttt
tt
t
tt
ttt
tt
t
tt
UNIVL
Lh
LL
h
UNIVHIGHL
Lh
LL
h
HIGHPRIML
Lh
LL
h
where hHLjt
jt
t= is the proportion of the adult population for which j was the highest
level of schooling attained; Lt is the size of the population of 25 years or older, at the
moment t; Hjt is the number of individuals whoa are 25 years or more for which j is the
highest level of schooling obtained [j: no school (0), primary school (1), high school (2)
and university (3)]; PRIMt-τ, HIGHt-τ, UNIVt-τ are the ratios of gross enrolment in
primary school, high school and university, respectively, observed at the moment t-τ;
and L25t is the size of the population in the age group [25, 29] at the moment t;
representing the individuals that entered, during the past five years, into the population
group of 25 years or older.
The average number of schooling years (for all levels of schooling) for the population of
25 years or older is given by:
tttt hhhH ,3,2,1 18124 ++= .
Estimation of ht is achieved by using census data, the formulas given above and filling
in the missing values with econometric estimates.
17 Pina and St. Aubyn (2002) also provide a series of human capital constructed by using the methodology of Teixeira (1997). They, however, introduced some methodological changes and considered a more comprehensive concept of human capital that includes, besides schooling, professional training. The authors recognized, however, that this use of a more comprehensive concept does not significantly change the results obtained.

FEP Working Paper no. 131, July 2003
12
4.3. Stock of knowledge or innovation capability
Knowledge stock has been approximated by various proxies: the number of scientists
and engineers (Jones, 1993; Kortum, 1994), patented inventions (Fagerberg, 1987,
1988; Kortum, 1994), strength of R&D - R&D/GDP ratio – (Griliches, 1988), expenses
accumulated in R&D (Coe and Helpman, 1993; Coe et al. 1995) and others.
Quantifying R&D contribution to economic growth has turned to be particularly
complicated, on one hand, caused by actual impossibility to measure productivity
precisely, especially in sectors intensive in R&D and services (that have increased in
respect to the rest of economy); on the other hand, caused by inability to estimate
correctly the dimension of R&D spillovers between firms, industries and countries.
Fagerberg (1987) divides measures of technological level and technological activities
into two types: technological input measures (expenses in education, expenses in R&D,
employment of scientists and engineers); technological output measures (patents).
Measures of the first type are directly related to innovation capacity of a country and
also to its own imitation capacity, in the way that a certain scientific basis is necessary
for imitation process to be successful. Technological output measures are only related to
innovation activity – innovation of processes and products.
In this study, we favor technological input measures (more precisely, accumulated
expenditures in R&D) because Portuguese economic growth has been characterized by
adoption and diffusion of knowledge, and not so much by its creation (Verspagen,
1993). Similarly to the empirical work of Coe and Helpman (1993), we use accumulated
expenditures in R&D as a proxy for knowledge stock (innovation capability). Thus, we
constructed a proxy of internal knowledge stock for Portugal, based on internal
expenditures in research and development of firms (R&D).18
18 The estimates of capital stock in R&D, Total and of Firms, were constructed from the data of R&D published by Junta Nacional de Investigação Científica (JNICT), later replaced by the Observatório para a Ciência e Tecnologia (OCT), and Instituto Nacional de Estatística (INE): for 1964-72, we used the Indicadores de Ciência e Tecnologia para Portugal of JNICT (1986); for 1976-90, we use the Anuário Estatístico do INE (1973-93) and for 1992-2001, the Folhas Informativas of JNICT (1995), of Observatório para a Ciência e Tecnologia and Observatório do Ensino Superior related to Potencial Cientifíco e Tecnológico Nacional.

FEP Working Paper no. 131, July 2003
13
5. SPECIFICATION AND ESTIMATION OF THE ECONOMETRIC MODEL
5.1. Specification of the econometric model
The purpose of this section is to estimate the long run structural relations between total
factor productivity, human capital and innovation capacity (knowledge stock) for the
Portuguese economy in the period 1960-2001.
These structural relations are based on a log-linear specification of the joint evolution of
total factor productivity (proxy of technological progress), internal knowledge stock
(accumulated expenses in R&D) and human capital stock (average number of years of
schooling): 11
211
10 tttt uISKHF +++= βββ
where Ft is the (natural) logarithm of the total factor productivity (TFP) level, for the
year t; Ht is the logarithm of the average number of years of schooling (proxy of human
capital), for the year t; ISKt is the logarithm of the accumulated expenses in R&D
(proxy of internal stock of knowledge or internal innovation capability), for the year t;
β1 and β2 are the TFP elasticities of human capital stock and internal stock of
knowledge, respectively; and, finally, ut is a random perturbation term.
Theory suggests that productivity tends to increase when human capital stock (H)
grows, ceteris paribus. It also suggests that a larger innovation capability, reflected by a
larger internal stock of knowledge (ISK), is associated with a greater productivity.
Therefore, productivity will be positively related to human capital stock and innovation
capability, that is, β1 > 0 e β2 > 0.
In case the theory is valid, we expect that any departure in productivity, concerning long
run equilibrium (expressed by the equation above), will necessarily be of temporary
nature. Therefore, an additional basic assumption of the theory is that the sequence ut is
stationary.
In order to analyze potential interactions between human capital and innovation
capability (internal stock of knowledge), we estimate in addition the following relations:
222
21
20 tttt uHISKHF +++= βββ
333
32
31
30 ttttt uHISKISKHF ++++= ββββ ,
where HISKt = ht×ISKt with an index ht of the average number of years of schooling,
for the year t. If β β22
33, > 0, then the effect of internal stock of knowledge on

FEP Working Paper no. 131, July 2003
14
productivity tends to be greater when the population is more educated; equivalently, the
effect of human capital stock on productivity is directly related to the magnitude of
internal stock of knowledge.
Total factor productivity, human capital and internal stock of knowledge proxies exhibit
strong trends, that is, they are nonstationary. In this case, the use of conventional
estimation methods (based on the classical hypotheses on perturbation terms) in the
models that include such variables, tend to lead to erroneous statistical inference (Rao,
1994). Thus, in the presence of nonstationary variables, the use of conventional
estimation methods brings the danger of obtaining “spurious regression” (Granger and
Newbold, 1974) whose estimates are deprived of any economic meaning. Recent studies
of time series analysis (Engle and Granger, 1987; Johansen, 1988), point to
cointegration techniques as the most adequate estimation method when variables of a
model are non-stationary.
5.2. Estimation of the model by cointegration
Cointegration allows estimate equilibrium, or long run parameters in a relationship that
includes unit root (nonstationary) variables. In this study, the use of this econometric
analysis is motivated, on one hand, by interest in estimating long run relationships
between total factor productivity, human capital and innovation capability of Portuguese
economy, and, on the other hand, by statistical properties of considered time series. The
three considered time series exhibit strong trend, easily noticeable in Plots 1-4 (in the
appendix) and confirmed by tests for nonstationarity (presented in Tables 1-3 in the
appendix).
The basic idea behind cointegration is that, in a long run, if two or more series evolve
together, then a linear combination of them might be stable around a fixed mean, despite
of their individual trends (that cause nonstationarity). Thus, when there is a long run
relationship between variables, the regression of all the variables (cointegrating
regression) has stationary perturbation terms, even though no variable, individually
considered, is stationary.19
19 In technical terms, the class of nonstationary series contains a special group composed of integrated known variables, having important statistical properties of consequence at the level of economics relationships. A series yt is said to be integrated of order d, denoted by I(d), if t
dt
d yLy )1( −=∆ is a stationary series (where L is a backshift operator: Lyt = yt-1). In other words, a series is integrated of order d if it becomes stationary when differenced d times.

FEP Working Paper no. 131, July 2003
15
The results of Dickey-Fuller (DF), Augmented Dickey-Fuller (ADF) and Phillips-
Perron (PP) tests applied to the variables of the study, indicate that twice differenced
series are stationary, that is, the variables will be integrated of at most second order, i.e.
I(2). Comparing the values of obtained test statistics to the corresponding critical
values, we conclude that all variables differenced once are stationary (that is, they do
not have unit roots). Thus, it is reasonable to suppose that all the series in the model are
at most I(1). Finally, we can conclude from Table 3 that the (level) variables of the
model are nonstationary (the statistical evidence does not reject nonstationarity
hypothesis – existence of a unit root).
From the above we conclude that the series of the model are integrated of order 1 [I(1)].
Consequently, the series could perhaps be cointegrated (Dickey, Jansen e Thornton,
1994), that is, there could be one or more stationary linear combination of the series,
suggesting stable long run relationship between them.
Since the number of cointegration vectors in unknown and since it is necessary to
guarantee that all variables are potentially endogenous (and then to test for exogeneity),
it seems wise to use the methodology developed by Johansen.
Let zt be a vector of n potentially endogenous variables. In our case, we have zt = [Ft SIt
Ht]. The VAR representation of the data generation process of zt, having k lags, can be
written as:20
tktktt uzAzAz +++= −− ...11 ; ut ~ IN(0, Σ) .
Reformulated as a Vector Error-Correction Model (VECM), this becomes:
tktktktt uzzzz +Π+∆Γ++∆Γ=∆ −+−−− 1111 ... ,
where
( )( )
'......
1
1
αβ=Π−−−−Π−−−−=Γ
k
ii
AAI=1-k1,...,=i AAI
with the matrix β of long run parameters and the matrix α of parameters of velocity
adjustment. Thus, VECM contains information on adjustments of the variations of zt
20 The VAR model is a way of estimating dynamic relationships between potentially endogenous variables, not imposing, à priori, strong restrictions on exogeneity of the variables and on their structural relationships.

FEP Working Paper no. 131, July 2003
16
both in short and long runs, via Γi and Π, respectively. Assuming that zt is a vector of
nonstationary series I(1), the series ∆zt-k are I(0). For ut to be white noise, Πzt-k has also
to be stationary [that is, I(0)]. This happens when there are r ≤ (n-1) cointegrating
vectors in β, that is, when r columns of β form r linearly independent combinations
between the variables included in zt, each of these combinations being stationary.
In the methodology of Johansen, determining the number of vectors r is equivalent to
testing for the reduced rank of the matrix Π. Thus, the number of cointegrating vectors
can be obtained by testing for significance of the eigenvalues of the matrix Π. These
tests can be carried out, for example, through the following test statistics:
( )( )1
1
ˆ1ln)1,(
ˆ1ln)(
+
+=
−−=+
−−= ∑
rMax
n
riiTrace
Trr
Tr
λλ
λλ
where $λi are the eigenvalue estimates obtained from $Π and T is the number of
observations.21
As mentioned above, the structural regression to be estimated involve a relationship
between productivity, human capital stock and innovation capability (internal stock of
knowledge) for Portuguese economy in the period 1960-2001, expressed by
tttt uHISKISKHF ++++= 3210 ββββ .
In cointegration notation, the vectors of potentially endogenous variables (zt) and the
normalized cointegrating vectors (β’s) can be represented as
[ ]ttttt HISK ISK H Fz = ; [ ]iiii 321 1 ββββ −−−=
Actually, we estimate three regressions, the basic one, mentioned above, and two
additional ones, which include time dummies for 1980 and 1985. The option for
including these latter derived from Chow tests that indicated statistically significant
changes in structure for the time series in analysis.
For the econometric specification considered, by using the diagnostic tests and the
Pandula procedure, we estimate VECM with two lags, including a trend component for
21 The λ-Trace statistic tests the null hypothesis that the number of cointegrating vectors is less than or equal to r against the alternative hypothesis that there are n vectors. The λ-Max statistic tests the null hypothesis that the number of cointegration vectors is r, against the alternative hypothesis that there are r+1 vectors.

FEP Working Paper no. 131, July 2003
17
the (level) variables. In the period 1960-2001, the λ−Trace and λ−Max tests do not to
reject the hypothesis that there is one cointegrating vector. Choosing r = 1, we obtain
the following estimates of the cointegrating vectors.
Table 1: Estimates of the long-run total factor productivity elasticities. Portugal, 1960-2001
Variables Without time dummy Time dummy for 1985
Human capital (direct effect) 0.4186 0.4205
Internal stock of knowledge (indigenous innovation efforts) 0.3040 0.2781
Innovation absorption capability (human capital indirect effect, through innovation) 0.4021 0.3610
According to the economic theory underlying the model, total factor productivity is
positively related to human capital stock and innovation capability (internal stock of
knowledge) of an economy. Moreover, the long run parameter associated with the
variable that takes into account interactions between human capital stock and innovation
capability (HISK) is theoretically expected to be also positive meaning that the elasticity
of total factor productivity with respect to internal stock of knowledge ( hi ×3β ) is larger
for greater level of schooling of the population. In other words, the influence of internal
stock of knowledge on productivity is a positive function of human capital stock of the
economy.
Therefore, the estimated cointegration relationships estimated are consistent with
theoretical presumptions. The evidence shows that Portuguese productivity has
benefited from human capital (education) more than from investments in internal
innovation capability. More precisely, focusing on the period 1960-2001, we estimate
that 1 percentage point increase in the average number of years of schooling for
Portuguese population (with 25 years or older) leads, for a fixed level of knowledge, to
an increase of productivity of the economy by about 0.42 percentage point. The
importance of indigenous innovation efforts, even if in lesser extent than that of the
human capital, appears here as well highlighted. In fact, a 1 percentage point increase in
the internal stock of knowledge tends, ceteris paribus, to increase productivity by 0.30
percentage points. In addition to the direct effect mentioned above, human capital also
influences total factor productivity indirectly, through innovation; specifically, results
obtained demonstrate that the elasticity of total factor productivity with respect to
internal stock of knowledge is larger for greater level of schooling of the population

FEP Working Paper no. 131, July 2003
18
(i.e., the long-run elasticity of innovation absorption capability is 0.40 point
percentage). The introduction of the time dummy did not change the results in a
fundamental way. Human capital continues to emerge as the essential variable.
These results are, in some way, confirmed by other recent empirical studies. Concerning
human capital elasticity, Pina and St. Aubyn (2002) obtained estimates similar to ours
(between 0.396 and 0.4073, respectively without or with training included, for the
tradable sector of the Portuguese economy). Concerning the greater importance of
human capital compared to that of indigenous innovation efforts, Coe and Helpman
(1993) and Verspagen (1993) already had reported that the internal stock of knowledge
is not the fundamental variable in the process of economic growth of small open
economies, such as Portugal. As our results show, in these economies, the capability of
absorption of innovation seems indeed to be more important.
In summary, based on our estimation results, it is possible to deduce existence of stable
structural (long run) relationships. The estimates of the parameters seem to confirm that
human capital and indigenous innovation efforts are enormously important to the
process of Portuguese economic growth during the period 1960-2001 though the
relevance of the former overpasses that involving the creation of an internal basis of
R&D. In addition, the indirect effect of human capital, through innovation, emerges
here as critical denoting the importance of having a reasonably higher stock of human
capital to enable a country to reap the benefits of its innovation indigenous efforts.
6. CONCLUSIONS
The main goal of this work was to investigate effects of human capital on economic
growth, measured by growth of total factor productivity, roughly considered as an
approximation of technological progress. This goal was achieved by empirically testing
for the main hypotheses found in the literature of this area, namely that a greater
aggregated economic activity will be caused by a higher endowment in human capital
and/or a greater innovation capability (these two factors being interrelated, as more
human capital tends to stimulate innovation capability of an economy). We estimated
structural (long run) relationship between total factor productivity (proxy of
technological progress), human capital stock (average number of years of schooling),
internal innovation capability (internal stock of knowledge – measured by the real
accumulated expenditures on firms R&D), and absorption capability (composite

FEP Working Paper no. 131, July 2003
19
variable involving human capital stock and the internal stock of knowledge). Due to
inherent characteristics associated with variables (evidence of strong trends), this
estimation was carried out by using cointegration techniques, specifically the Johansen
methodology.
Main estimation results emphasize that human capital stock is more important than
internal innovation capability (internal stock of knowledge) to explain the Portuguese
productivity (1960-1991). More precisely, the estimate of elasticity of total factor
productivity with respect to human capital stock is 0.42 percentage points, against 0.30
percentage points of the analogous estimate for internal stock of knowledge. Moreover,
elasticity of total factor productivity with respect to innovation absorption capability is
0.40 percentage points. These values, in addition to confirming a stable long run
relationship between productivity, human capital and internal innovation capability, also
indicate that human capital is extremely important to the Portuguese economic growth,
directly, through its impact on productivity and, indirectly, via its relation with
innovation efforts.
REFERENCES
Abramovitz, M. (1993), “The search for sources of growth: areas of ignorance, old and new”,
The Journal of Economic History, 53(2), pp. 217-243.
Aghion, P. and Howitt, P. (1992), “A model of growth through creative destruction”,
Econometrica, 60 (2), pp. 323-351.
Arrow, K. J. (1962), “The economic implications of learning by doing”, Review of Economic
Studies, 29, pp. 155-173; in Readings in the modern theory of economic growth, Edited by
J.E. Stiglitz and H.Uzawa, The MIT Press, 5th Ed., 1979.
Barro, R.J. (1991), “Economic growth in a cross-section of countries”, The Quarterly Journal of
Economics, Vol. CVI, 2, pp. 407-443.
Barro, R.J. and Lee, J.-W. (1993), “International comparisons of educational attainment”,
Journal of Monetary Economics, 32, pp. 363-394.
Barro, R.J. and Sala-i-Martin, X. (1995), Economic growth, New York: McGraw-Hill,
Advanced Series in Economics.
Becker, G.S., Murphy, K.M. and Tamura, R. (1990), “Human capital, fertility, and economic
growth”, Journal of Political Economy, Vol. 98 (5), S12-S37.

FEP Working Paper no. 131, July 2003
20
Benhabib, J. and Spiegel, M.M.(1994), “The role of human capital in economic development:
evidence from aggregate cross-country data”, Journal of Monetary Economics, 34, pp. 143-
173.
Caballé, J. and Santos, M. (1993), “On endougenous growth with physical and human capital”,
Journal of Political Economy, 101 (6), 1042-1067.
Caballero, R. and Jaffe, A. (1993), “How high are the giants’ shoulders: an empirical
assessment of knowledge spillovers and creative destruction in a model of economic
growth”, in National Bureau of Economic Research Macroeconomics Annual Meeting, MIT
Press, Cambridge, Mass., pp. 15-74.
Coe, D.T. and Helpman, E. (1993), “International R&D spillovers”, National Bureau of
Economic Research, Working Paper Nº 4444.
Coe, D.T., Helpman, E. and Hoffmaister, A. W. (1995), “North and South spillovers”, National
Bureau of Economic Research, Working Paper Nº 5048.
Dias, A.M. (1992), “Avaliação do QCA do lado da oferta”, mimeo, DPP, Lisboa.
Dickey, D.A. and Fuller, W.A. (1987), “Co-integration and error correction: representation,
estimation and testing”, Econometrica, 55, pp. 251-276.
Easterly, W. and Rebelo, S. (1993), “Fiscal policy and economic growth: an empirical
investigation”, Journal of Monetary Economics, 32, pp. 417-58.
Englander, A.S. and Gurney, A. (1994), “Medium-term determinants of OECD productivity”,
OECD Economic Studies, Nº 22, pp. 49-109.
Fagerberg, J. (1987), “A technology gap approach to why growth rates differ”, Research Policy,
Vol. 16, pp. 87-99, in The Economics of innovation, C. Freeman, 1990, pp. 55-67.
Fagerberg, J. (1988), “Why growth rates differ?”, in G. Dosi, C. Freeman, R. Nelson, G.
Silverberg and L. Soete, eds., Technical Change and Economic Theory, Pinter Publishers,
London, pp. 432-457.
Granger, C. and Newbold, P. (1974), “Spurious regressions in econometrics”, Journal of
Econometrics, 2, pp. 111-120.
Griliches, Z. (1988), “Productivity puzzles and R&D: another nonexplanation”, Journal of
Economic Perspectives, Vol. 2, Nº 4, pp. 9-21.
Griliches, Z. (1995), “R&D and productivity: econometric results and measurements issues” in
Handbook of the economics of innovation and technological change, Ed. by P.Stonemen:
Blackwall.
Grossman, G.M. and Helpman, E. (1990), “Comparative advantage and long-run growth”, The
American Economic Review, Vol. 80, Nº 4, pp. 796-815.

FEP Working Paper no. 131, July 2003
21
Grossman, G.M. and Helpman, E. (1991), “Quality ladders in the theory of growth”, Review of
Economic Studies, 58, pp. 43-61.
Grossman, G.M. and Helpman, E. (1992), Innovation and growth in the global economy,
Cambridge, Mass.; and London England: MIT Press, 2nd edition.
Johansen, S. (1988), “Statistical analysis of cointegration vector”, Journal of Economic
Dynamics and Control, 12, pp. 231-254.
Jones, C.I. (1993), “Time series tests of endogenous growth models”, Preliminary Version,
Department of Economics, MIT, Cambridge, MA 02139.
Knight, F. H. (1994), “Diminishing returns from investment”, Journal of Political Economy,
Vol. 52, pp. 26-47.
Kortum, S. (1994), “A model of research, patenting, and productivity growth”, National Bureau
of Economic Research, Working Paper Nº 4646.
Kyriacou, G.A. (1991), Level and growth effects of human capital: a cross-country study of the
convergence hypothesis, C.V. Starr Center for Applied Economics, New York University,
New York.
Lee, M.-L., Liu, B.-C. and Wang, P. (1994), “Education, human capital enhancement and
economic development: comparison between Korea and Taiwan”, Economics of Education
Review, Vol. 13, Nº 4, pp. 275-288.
Levine, R. and Renelt, D. (1992), “A sensitivity analysis of cross-country growth regressions”,
The American Economic Review, Vol. 82, Nº 4, pp. 942-963.
Lucas, R.E. (1988), “On the mechanics of economic development”, Journal of Monetary
Economics, 22, pp. 3-42.
Lucas, R.E. (1993), “Making a miracle”, Econometrica, Vol.61, Nº2, pp. 251-272.
Malthus, T. R. (1798), An essay on the principle of population, London: W. Pickering, 1986
edition.
Mankiw, N.G., Romer, D. and Weil, D.N. (1992), “A contribution to the empirics of economic
growth”, The Quarterly Journal of Economics, Vol. CVI, 2, pp. 407-437.
Mulligan, C. and Sala-i-Martin, X. (1993), “Transitional dynamics in two-sector models of
endogenous growth”, The Quarterly Journal of Economics, pp. 739-773.
Nelson, R. R. and Phelps, E. S. (1966), “Investment in humans, technological diffusion and
economic growth”, The American Economic Review, Vol. LVI, Nº2, pp. 69-75.
Nunes, A. (1993), “Education and economic growth in Portugal: a simple regression approach”,
Estudos de Economia, XIII (2), pp. 181-205.

FEP Working Paper no. 131, July 2003
22
Nunes, A., Mata, E. and Valério, N. (1989), “Portuguese economic growth 1833-1985”, The
Journal of European Economic History, Vol. 18, Nº 2, pp. 291-330.
Pack, H. (1994), “Endogenous growth theory: intellectual appeal and empirical shortcomings”,
Journal of Economic Perspectives, Vol. 8, Nº 1, pp. 55-72.
Pina, A. and St. Aubyn, M. (2002), “Public capital, human capital and economic growth:
Portugal 1977-2001”, Departamento de Prospectiva e Planeamento, Ministério das
Finanças, Outubro 2002.
Psacharopoulos, G. and Arriagada, A.M. (1986), “La composition de la population active par
niveau d`instruction: une comparaison internationale”, Revue Internationale du Travail, Vol.
125, Septembre-Octobre 1986, pp. 617-631.
Ramsey, F. (1928), “A mathematical theory of saving”, Economic Journal, 38, pp. 543-559.
Also in Readings in the Modern Theory of Economic Growth, Edited by J. E. Stiglitz and H.
Uzawa, The MIT Press, 5th Ed., 1979.
Rao, B. B. (1994), Cointegration: for the applied economist, Basingstoke: Macmillan.
Ricardo, D. (1817), Princípios de economia política e de tributação, Lisboa: Fundação Calouste
Gulbenkian, 1975.
Romer, P. (1986), “Increasing returns and long-run growth”, Journal of Political economy, 94
(5), pp. 1002-1037.
Romer, P.M. (1990a), “Endogenous technological change”, Journal of Political Economy,
Vol.98, Nº 5, pt. 2, pp. S71-S101.
Romer, P.M. (1990b), “Human capital and growth: theory and evidence”, Carnegie-Rochester
Conference Series on Public Policy, 32, pp. 251-286.
Schumpeter, J. A. (1912), The theory of economic development: an inquiry into profits, capital,
credit, interest, and business cycle, Harvard University Press, Cambridge, Mass., 1968
edition.
Segerstrom, P.S. (1991), “Innovation, imitation, and economic growth”, Journal of Political
Economy, Vol. 99, Nº 4, pp. 807-827.
Smith, A. (1776), Inquérito sobre a natureza e as causas da riqueza das nações, Vol. I, II e III,
Lisboa: Fundação Calouste Gulbenkian, 1981.
Solow, R.M. (1956), “A contribution to the theory of economic growth”, The Quarterly Journal
of Economics, 70, pp. 65-94.
Solow, R.M. (1959), Investment and technical progress, in K. arrow, S. Karbin & P. Suppes,
eds., Mathematical models in the Social Sciences, Stanford University Press. Also in
Readings in the modern theory of economic growth, Edited by J.E. Stiglitz and H.Uzawa,
The MIT Press, 5th Ed., 1979.

FEP Working Paper no. 131, July 2003
23
Stiglitz, J. E. and Uzawa, H. U. (1979), Readings in the modern theory of economic growth, The
MIT Press, 5th Ed.
Teixeira, A. (1997), Capacidade de inovação e capital humano. Contributos para o estudo do
crescimento económico português, 1960-1991, Master Thesis, Faculdade de Economia,
Universidade do Porto.
Teixeira, A. (1998), “Human capital stock: an estimation of a time series for Portugal”, Estudos
de Economia, Vol. XVIII, No. 4, pp. 423-441.
Upadhyay, M. P. (1994), “Accumulation of human capital in LDCs in the presence of
unemployment”, Economica, 61, pp. 355-378.
Verspagen, B. (1993), Uneven growth between interdependent economies: A evolutionary view
on technology gaps, trade and growth, Aldershot: Avebury 1993.
Villanueva, D.(1994), “Openness, human development, and fiscal policies: effects on economic
growth and speed of adjustment”, IMF Staff Papers, Vol. 41, Nº 1, pp. 1-29.
Young, A. (1928), “increasing returns and economic progress”, Economic Journal, 38, pp. 527-
542.
24
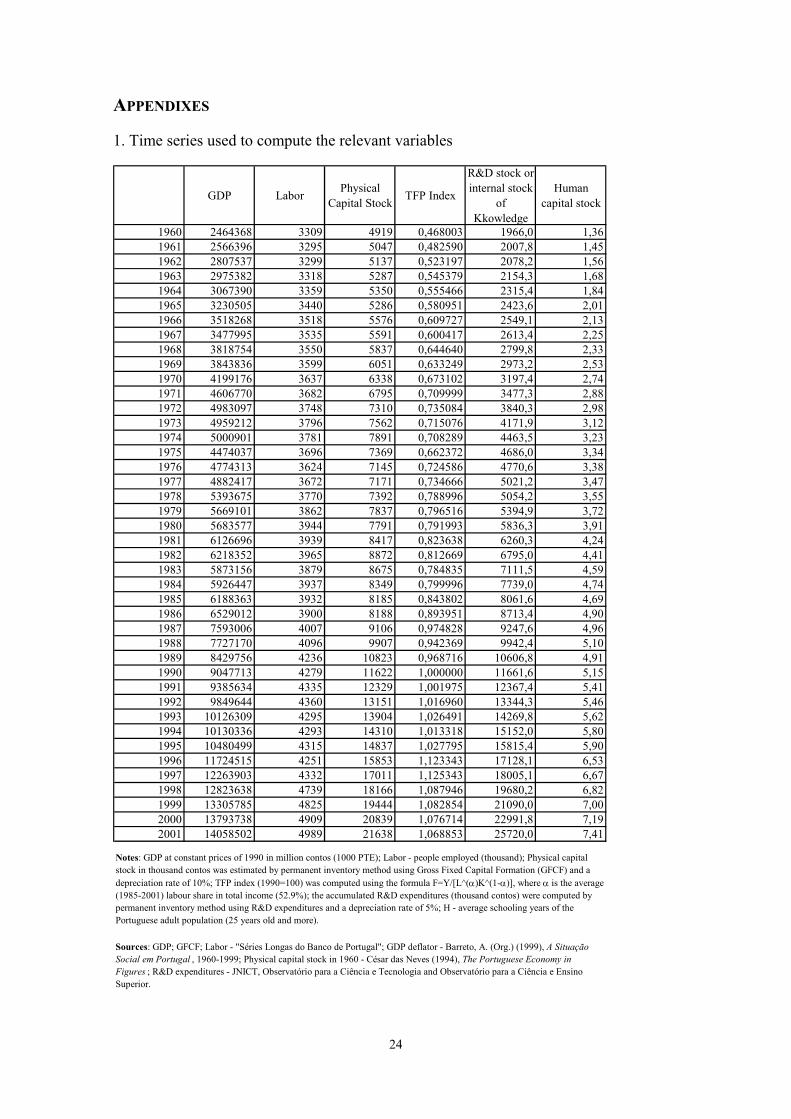
APPENDIXES
1. Time series used to compute the relevant variables
GDP Labor Physical Capital Stock TFP Index
R&D stock or internal stock
of Kkowledge
Human capital stock
1960 2464368 3309 4919 0,468003 1966,0 1,361961 2566396 3295 5047 0,482590 2007,8 1,451962 2807537 3299 5137 0,523197 2078,2 1,561963 2975382 3318 5287 0,545379 2154,3 1,681964 3067390 3359 5350 0,555466 2315,4 1,841965 3230505 3440 5286 0,580951 2423,6 2,011966 3518268 3518 5576 0,609727 2549,1 2,131967 3477995 3535 5591 0,600417 2613,4 2,251968 3818754 3550 5837 0,644640 2799,8 2,331969 3843836 3599 6051 0,633249 2973,2 2,531970 4199176 3637 6338 0,673102 3197,4 2,741971 4606770 3682 6795 0,709999 3477,3 2,881972 4983097 3748 7310 0,735084 3840,3 2,981973 4959212 3796 7562 0,715076 4171,9 3,121974 5000901 3781 7891 0,708289 4463,5 3,231975 4474037 3696 7369 0,662372 4686,0 3,341976 4774313 3624 7145 0,724586 4770,6 3,381977 4882417 3672 7171 0,734666 5021,2 3,471978 5393675 3770 7392 0,788996 5054,2 3,551979 5669101 3862 7837 0,796516 5394,9 3,721980 5683577 3944 7791 0,791993 5836,3 3,911981 6126696 3939 8417 0,823638 6260,3 4,241982 6218352 3965 8872 0,812669 6795,0 4,411983 5873156 3879 8675 0,784835 7111,5 4,591984 5926447 3937 8349 0,799996 7739,0 4,741985 6188363 3932 8185 0,843802 8061,6 4,691986 6529012 3900 8188 0,893951 8713,4 4,901987 7593006 4007 9106 0,974828 9247,6 4,961988 7727170 4096 9907 0,942369 9942,4 5,101989 8429756 4236 10823 0,968716 10606,8 4,911990 9047713 4279 11622 1,000000 11661,6 5,151991 9385634 4335 12329 1,001975 12367,4 5,411992 9849644 4360 13151 1,016960 13344,3 5,461993 10126309 4295 13904 1,026491 14269,8 5,621994 10130336 4293 14310 1,013318 15152,0 5,801995 10480499 4315 14837 1,027795 15815,4 5,901996 11724515 4251 15853 1,123343 17128,1 6,531997 12263903 4332 17011 1,125343 18005,1 6,671998 12823638 4739 18166 1,087946 19680,2 6,821999 13305785 4825 19444 1,082854 21090,0 7,002000 13793738 4909 20839 1,076714 22991,8 7,192001 14058502 4989 21638 1,068853 25720,0 7,41
Notes: GDP at constant prices of 1990 in million contos (1000 PTE); Labor - people employed (thousand); Physical capital stock in thousand contos was estimated by permanent inventory method using Gross Fixed Capital Formation (GFCF) and a depreciation rate of 10%; TFP index (1990=100) was computed using the formula F=Y/[L^(α)K^(1-α)], where α is the average (1985-2001) labour share in total income (52.9%); the accumulated R&D expenditures (thousand contos) were computed by permanent inventory method using R&D expenditures and a depreciation rate of 5%; H - average schooling years of the Portuguese adult population (25 years old and more).
Sources: GDP; GFCF; Labor - "Séries Longas do Banco de Portugal"; GDP deflator - Barreto, A. (Org.) (1999), A Situação Social em Portugal , 1960-1999; Physical capital stock in 1960 - César das Neves (1994), The Portuguese Economy in Figures ; R&D expenditures - JNICT, Observatório para a Ciência e Tecnologia and Observatório para a Ciência e Ensino Superior.

25
2. Plots of the variables in levels
3. Tests for nonstationarity or unit roots Table 1: Unit roots tests - variables in second differences
Series Mean Teste DF Teste PP Teste ADF (lags) F -0.000950 -11.474* -14.262* -4.805* (7) H -0.000821 -10.792* -13.507* -10.792* (0)
ISK 0.002277 -12.766* -12.309* -12.766* (0) HISK 0.005346 -12.358* -11.934* -12.358* (0)
Notes: For these series we specify a random walk (i.e., the AR model); MacKinnon critical values for rejection of hypothesis of a unit root, that is nonstationarity at * 1%, ** 5% and *** 10%.
Legend: F: natural logarithm of Portuguese TFP index 1960-2001; H: natural logarithm of the index of average years of schooling of Portuguese adult population, 1960-2001; ISK: natural logarithm of the index of Portuguese internal stock of knowledge, 1960-2001; HISK = h*ISK: where h is the index of the average years of schooling of Portuguese adult population.
Table 2: Unit roots tests - variables in first differences
Series Mean Teste DF Teste PP Teste ADF (lags) F 0.020143 -6.410* -6.419* -6.410* (0) H 0.041294 -4.505* -4.557* -4.505* (0)
ISK 0.062714 -4.674* -4.746* -2.353 (1) HISK 0.039209 -5.213* -5.500* -1.576 (1)
Notes: For these series, excluding HISK, we specify a random walk with drift (i.e., the AR model with constant). In the case of HISK the AR model with constant and time trend was used instead; MacKinnon critical values for rejection of hypothesis of a unit root, that is nonstationarity at * 1%, ** 5% and *** 10%.
Legend: F: natural logarithm of Portuguese TFP index 1960-2001; H: natural logarithm of the index of average years of schooling of Portuguese adult population, 1960-2001; ISK: natural logarithm of the index of Portuguese internal stock of knowledge, 1960-2001; HISK = h*ISK: where h is the index of the average years of schooling of Portuguese adult population.
Table 3: Unit roots tests - variables in levels
Series Mean DF Test Teste PP Teste ADF (lags) F -0.235272 -2.741 -2.677 -2.741 (0) H -0.324377 -2.747 -2.775 -2.747 (0)
ISK -0.603531 -1.802 -2.129 -1.867 (2) HISK -0.229400 2.907 2.925 2.907 (0)
Notes: For these series we specify a trend stationary form (i.e., the AR model with constant and time trend); MacKinnon critical values for rejection of hypothesis of a unit root, that is nonstationarity at * 1%, ** 5% and *** 10%.
Legend: F: natural logarithm of Portuguese TFP index 1960-2001; H: natural logarithm of the index of average years of schooling of Portuguese adult population, 1960-2001; ISK: natural logarithm of the index of Portuguese internal stock of knowledge, 1960-2001; HISK = h*ISK: where h is the index of the average years of schooling of Portuguese adult population.
Human capital stock (H)(logarithm of the index)
-1,6
-1,4
-1,2
-1
-0,8
-0,6
-0,4
-0,2
0
0,2
0,4
0,6
1960
1962
1964
1966
1968
1970
1972
1974
1976
1978
1980
1982
1984
1986
1988
1990
1992
1994
1996
1998
2000
Internal stock of knowledge (ISK)(logarithm of the index)
-2
-1,5
-1
-0,5
0
0,5
1
1960
1962
1964
1966
1968
1970
1972
1974
1976
1978
1980
1982
1984
1986
1988
1990
1992
1994
1996
1998
2000
Total Factor Productivity (TFP)(logarithm of the index)
-0,9
-0,8
-0,7
-0,6
-0,5
-0,4
-0,3
-0,2
-0,1
0
0,1
0,2
1960
1962
1964
1966
1968
1970
1972
1974
1976
1978
1980
1982
1984
1986
1988
1990
1992
1994
1996
1998
2000
HISK=H*lnISK
-1
-0,5
0
0,5
1
1,5
1960
1962
1964
1966
1968
1970
1972
1974
1976
1978
1980
1982
1984
1986
1988
1990
1992
1994
1996
1998
2000