human electroencephalograms seen as fractal time … · computers in biology and medicine 36 ......
TRANSCRIPT

Computers in Biology and Medicine 36 (2006) 291–302www.intl.elsevierhealth.com/journals/cobm
Human electroencephalograms seen as fractal time series:Mathematical analysis and visualization
Vladimir Kulisha,∗, Alexei Sourinb, Olga Sourinac
aSchool of Mechanical and Production Engineering, Nanyang Technological University, Singapore 639798, SingaporebSchool of Computer Engineering, Nanyang Technological University, Singapore 639798, Singapore
cSchool of Electrical and Electronic Engineering, Nanyang Technological University, Singapore 639798, Singapore
Received 20 October 2004; accepted 27 December 2004
Abstract
The paper presents a novel technique of nonlinear spectral analysis, which has been used for processing encephalo-grams of humans. This technique is based on the concept of generalized entropy of a given probability distribution,known as the Rényi entropy that allows defining the set of generalized fractal dimensions of encephalogram (EEG)and determining fractal spectra of encephalographic signals. Unlike the Fourier spectra, the spectra of fractal di-mensions contain information of both frequency and amplitude characteristics of EEG and can be used togetherwith well-accepted techniques of EEG analysis as an enhancement of the latter. Powered by volume visualizationof the brain activity, the method provides new clues for understanding the mental processes in humans.� 2005 Elsevier Ltd. All rights reserved.
Keywords: Fractal time series; Generalized entropy; EEG; Visualization; FRep; Implicit functions
1. Introduction
For a deeper understanding of the phenomena of life and consciousness, it is very important to obtainas much information as possible while decoding signals recorded during measurements of physiologicalprocesses. In particular, developing new methods of processing data recorded by well-established tech-niques, such as, for instance, electroencephalogram, may prove to be useful while deeper penetrating intothe mystery of human consciousness.
∗ Corresponding author. Tel.: +65 6790 4950; fax: +65 6792 4062.E-mail addresses: [email protected] (V. Kulish), [email protected] (A. Sourin), [email protected] (O. Sourina).
0010-4825/$ - see front matter � 2005 Elsevier Ltd. All rights reserved.doi:10.1016/j.compbiomed.2004.12.003
292 V. Kulish et al. / Computers in Biology and Medicine 36 (2006) 291–302
A number of recent studies showed that well-accepted means of processing EEG might not alwaysbe applicable, more than ever if one endeavors to discover the relation of cognitive ability to so-calledbrain dynamics [1]. For instance, the averaged EEG response of the brain (the nonlinear output of thebrain) to an evoked potential (EP) is usually subjected to spectral analysis employing the fast Fouriertransform (FFT). However, the brain is a highly complex, nonlinear system, whereas FFT is a linearoperation. Therefore, there is indeed a discrepancy between these two systems, and one may expect theincidence of some inaccuracies when responses of the brain are subjected to spectral analysis. In fact,it has been shown that the input EP (model signal) and the output EP (from the brain), albeit similar informs, exhibited completely different spectral power curves [1]. Hence, one can conclude that the spectralanalysis of the brain responses by the use of FFT (linear operation) in relation to brain (highly complex,nonlinear system) may mislead neuroscientists. Consequently, there is a need to develop a method ofspectral analysis that would be suitable for nonlinear systems, such as brain.
This paper is an attempt to offer an illustration of how such a technique as the analysis of fractal timeseries can provide researchers with a suitable means for extracting information from EEG, in addition tothe well-accepted ways of the EEG decoding.
Furthermore, volume visualization of the brain activity proves to be a useful instrument when combinedwith the abovementioned method. This visualization tool allows making conclusions about the brainactivity, which were impossible to make by the existing methods.
2. Mathematical analysis
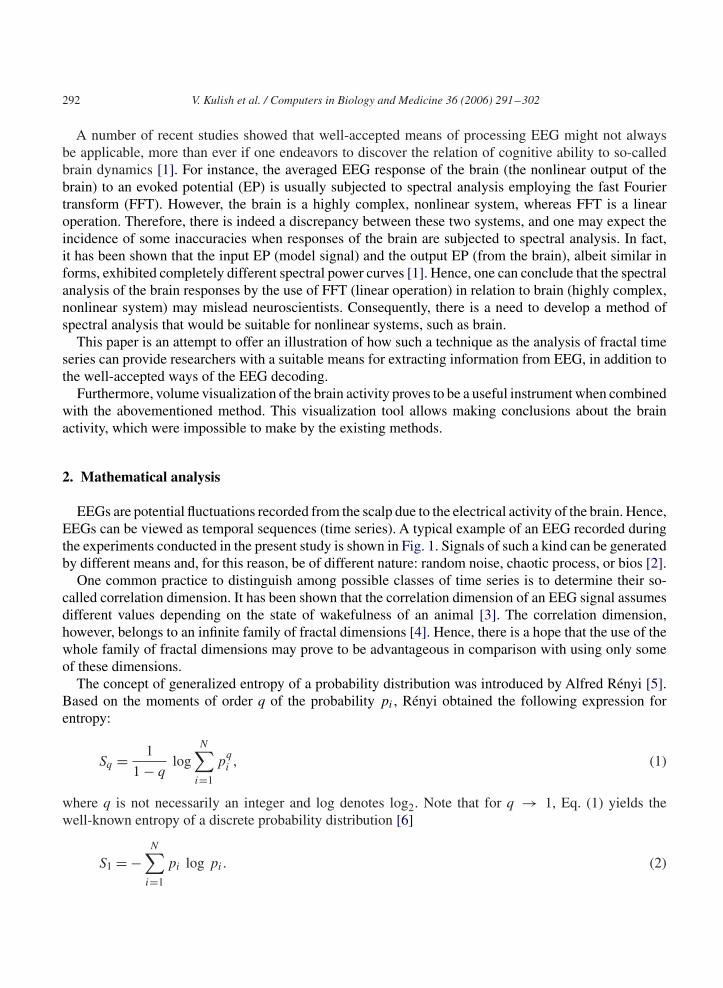
EEGs are potential fluctuations recorded from the scalp due to the electrical activity of the brain. Hence,EEGs can be viewed as temporal sequences (time series). A typical example of an EEG recorded duringthe experiments conducted in the present study is shown in Fig. 1. Signals of such a kind can be generatedby different means and, for this reason, be of different nature: random noise, chaotic process, or bios [2].
One common practice to distinguish among possible classes of time series is to determine their so-called correlation dimension. It has been shown that the correlation dimension of an EEG signal assumesdifferent values depending on the state of wakefulness of an animal [3]. The correlation dimension,however, belongs to an infinite family of fractal dimensions [4]. Hence, there is a hope that the use of thewhole family of fractal dimensions may prove to be advantageous in comparison with using only someof these dimensions.
The concept of generalized entropy of a probability distribution was introduced by Alfred Rényi [5].Based on the moments of order q of the probability pi , Rényi obtained the following expression forentropy:
Sq = 1
1 − qlog
N∑i=1
pqi , (1)
where q is not necessarily an integer and log denotes log2. Note that for q → 1, Eq. (1) yields thewell-known entropy of a discrete probability distribution [6]
S1 = −N∑
i=1
pi log pi . (2)

V. Kulish et al. / Computers in Biology and Medicine 36 (2006) 291–302 293
-15
-10
-5
0
5
10
15
0 1 2 3 4 5
-15
-10
-5
0
5
10
15
5 6 7 8 9 10
V, m
VV
, mV
t, s
t, s
Fig. 1. An encephalogram.
The probability distribution of a given time series can be recovered by the following procedure. The totalrange of the signal is divided into N bins such that
N = Vmax − Vmin
�V, (3)
where Vmax and Vmin are the maximum and the minimum values of the signal achieved in the courseof measurements, respectively; �V represents the sensitivity (uncertainty) of the measuring device. Theprobability that the signal falls into the ith bin of size �V is computed as
pi = limN→∞
Ni
N, (4)
where Ni equals the number of times the signal falls into the ith bin. On the other hand, in the case of atime series, the same probability can be found from the ergodic theorem, that is
pi = limT →∞
ti
T, (5)
where ti is the time spent by the signal in the ith bin during the total time span of measurements T.

294 V. Kulish et al. / Computers in Biology and Medicine 36 (2006) 291–302
Further, the generalized fractal dimensions of a given time series with the known probability distributionare defined as
Dq = lim�V →0
1
q − 1
log∑N
i=1 pqi
log �V, (6)
where the parameter q ranges from −∞ to +∞. Note that for a self-similar fractal time series with equalprobabilities pi = 1/N , the definition Eq. (6) yields Dq = D0 for all values of q [7]. Note also that fora constant signal, all probabilities except one become equal to zero, whereas the remaining probabilityvalue equals unity. As a result, for a constant signal, Dq = D0 = 0. The fractal dimension
D0 = − log N
log �V(7)
is nothing else than the Hausdorff–Besicovitch dimension [8].The correlation dimension, mentioned previously, is the fractal dimension with q = 2.As q → 1, Eq. (6) yields the so-called information dimension
D1 = lim�V →0
−∑Ni=1 pi log pi
log(1/�V ), (8)
where the numerator is Shannon’s entropy given by Eq. (2).Note also that
D∞ = lim�V →0
log pmax
log �V(9)
and
D−∞ = lim�V →0
log pmin
log �V(10)
such that D−∞�D∞. In general, if a < b, Da �Db, such that Dq is a monotone non-increasing functionof q [7]. For a given time series (“signal”), the function Dq , corresponding to the probability distributionof this signal, is called the fractal spectrum. Such a name is well-justified, because the fractal spectrumprovides information about both frequencies and amplitudes of the signal. Indeed, for two probabilitydistributions, a larger value of a fractal dimension of a given order corresponds to the presence of morepronounced spikes (sharper spikes, less expected values of the signal) than in the signal for which thevalue of the fractal dimension of the same order is less. Furthermore, signals with a wider range of fractaldimensions, D−∞–D∞, can be termed more fractal than signals whose range of fractal dimensions isnarrower, so that signals with the zero range are self-similar fractals. In other words, the range of a fractalspectrum is a value associated with the range of frequencies in the signal.
Now, if the unexpectedness of an event is defined as the inverse of the probability of this event, thensteeper spectra correspond to the signals in which unexpected values are more dominant, whereas flatterspectra represent those signals in which less unexpectedness occurs.

V. Kulish et al. / Computers in Biology and Medicine 36 (2006) 291–302 295
3. Experimental technique and signal processing
The method was tested on EEG samples measured from 20 healthy humans—10 females and 10males—each of whom was to answer either ‘yes’ or ‘no’ to 12 questions by clicking either ‘YES’ or ‘NO’button on a computer screen.
EEG signals were recorded in the course of each answering by means of Mindset24, a 24-channelEEG recording device. The sampling frequency was 256 Hz, whereas the sensitivity (uncertainty) of themeasuring equipment was �V = 0.01 mV. The probes (electrodes) were placed on the scalp according tothe international 10–20 standard. The electrode impedance was minimized by applying ECI Electro-Gel,so that all electrode impedances were below 3 k�.
The noise problem was addressed by placing the equipment far from any other equipment that couldinduce AC or 50 Hz noise. In addition, Mindest24 case was connected to the earth point. Furthermore,each subject was grounded by connecting the subject to earth ground using an appropriate groundingstrap on both subject’s wrists. The presence of 50 Hz noise was monitored during all measurements byoutputting the instantaneous result of spectral analysis on the computer screen. The noise level neverexceeded 0.07 �V, so that the signal to noise ratio always was less than 0.1 percent.
ECG artifacts were not observed during measurements. These artifacts were eliminated by placingcotton balls behind the subject’s earlobes. In addition, all subjects were restricted in their movements, inorder to eliminate any artifacts associated with muscle impulses and subsequent movements.
For each subject, the data were recorded from 24 electrodes connected to the 24 corresponding channelsof Mindset24. The data were then filtered to show only the channel activation above what was termedthe “zero” activation level, the threshold value of which was set at 16 mV. The filtered data were thenprocessed in such a way that the probability distribution of the signal recorded for each channel wasrecovered between Vmax and Vmin with �V = 0.01 mV [see Eq. (5)], after which the fractal spectra werecomputer following Eqs. (6)–(10).
No significant difference has been observed between EEGs taken from females and males.The data obtained from all the subjects were statistically processed and the significance test was
performed.
4. Fractal spectra of EEGs
Fig. 2 shows two representative EEG samples obtained in the course of the experiment that wasdescribed in the previous section. The top part of Fig. 2 depicts the brain response while the personis answering ‘YES’, whereas the bottom part shows the same person’s response while answering ‘NO’.Although the Fourier spectra of the EEG signals shown on both parts of the figure are practically identical,even a simple visual inspection of these records shows that the “YES” signal is less smooth than the “NO”signal, because its amplitude is on average larger. However, the Fourier transform provides one with theenergy distribution over the range of frequencies only, whereas any information related to the signalamplitude and fractionality is lost.
The probability distribution of each of the signals was obtained and the corresponding fractal spec-tra were found using the method described in Section 2 of this paper. The fractal spectra of the tworepresentative signals are shown in Fig. 3.

296 V. Kulish et al. / Computers in Biology and Medicine 36 (2006) 291–302
-15
-10
-5
0
5
10
0 1 2 3 4 5t, s
t, s
-10
-5
0
5
10
5 6 7 8 9 10
V, m
VV
, mV
Fig. 2. Representative EEG samples of the same person answering ‘YES’ (top) and ‘NO’ (bottom).
0.6
0.8
1
1.2
1.4
1.6
1.8
-50 0 50
YESNO
Dq
q
Fig. 3. Fractal spectra of the representative EEG samples.

V. Kulish et al. / Computers in Biology and Medicine 36 (2006) 291–302 297
0.6
0.8
1
1.2
1.4
1.6
-50 0 50
YESNO
Dq
q
Fig. 4. The sample averaged fractal spectra of EEGs.
The Hausdorff–Besicovitch dimensions of these spectra are D0,YES = 1.286 and D0,NO = 0.903,respectively. The asymptotic dimensions are D−∞,YES = 1.759 and D∞,YES = 0.679 for the “YES”spectrum, whereas the asymptotic dimensions are D−∞,NO and D∞,NO = 0.612 for the “NO” spectrum.The ranges of the spectra are, therefore, �DYES = 1.080 and �DNO = 0.481, respectively. Hence, the“YES” spectrum is more fractal than the “NO” spectrum. This implies that the brain is more active whileanswering “YES” question. In addition, it is evident from Fig. 3 that more unexpected values are presentin the “YES” signal, whereas the “NO” signal is more predictable and uniform.
Fig. 4 shows the averaged fractal spectra of the whole sample of the patients. The fractal spectra wereobtained for each of the 20 patients, upon which the average of all those spectra was found.
The Hausdorff–Besicovitch dimensions of the sample averaged spectra are 〈D0,YES〉 = 1.170 and〈D0,NO〉=1.042, respectively. The asymptotic dimensions are 〈D−∞,YES〉=1.539 and 〈D∞,YES〉=0.694for the “YES” spectrum, whereas the asymptotic dimensions are 〈D−∞,NO〉=1.365 and 〈D∞,NO〉=0.645for the “NO” spectrum. Thus, the average ranges of the spectra are 〈�DYES〉=0.845 and 〈�DNO〉=0.720,respectively. Hence, the “YES” spectra are on the average more fractal than the “NO” spectra. This impliesthat the brain is on the average more active while answering “YES” question. In addition, it is evidentfrom Fig. 4 that, on the average, more unexpected values are present in the “YES” signal, whereas the“NO” signal is on the average more predictable and uniform.
From observing Fig. 4, another interesting conclusion can be drawn. On the average, the “YES” EEGsignal is more informative (the information dimension 〈D1,YES〉 = 0.921) than the “NO” EEG signal(the information dimension 〈D1,NO〉 = 0.853). This conclusion may be quite unexpected, because oneanticipated “YES” and “NO” answers to have an equal informational content.Yet this content is different,perhaps due to some intrinsic asymmetry of the brain. This result also can be viewed as an indirect proofof the fact that the operation of the brain is fuzzy, that is, there is an overlap between the set in question(“YES”) and its complement (“NO”). Were there no such an overlap, the sum of the informational contentsof the two sets would be two bits, whereas it equals 1.774 bit. Therefore, the “missing” 0.226 bit (theamount of “gray” information) should be the informational content of the set formed by the overlap ofthe “YES” set and its complement—the “NO” set.

298 V. Kulish et al. / Computers in Biology and Medicine 36 (2006) 291–302
Curiously enough, the fractal spectra obtained in this study can be quite well (with the error of about2 percent) approximated by the solution of the logistic equation, namely
Dq = D−∞ − D−∞ − D∞1 + ((D0 − D∞)/(D−∞ − D0)) exp (−Kq)
, (11)
where K is the parameter that characterizes the steepness of a given fractal spectrum. For both spectrashown in Fig. 4, the best curve fitting was achieved at K = 0.36.
5. Visualization
We used 3D visualization of the EEG. We employed a concept of a dynamic 3D volumetric shape forillustrating how the electrical signal changes through time. For the shape, a time-dependent “blobby”object was used. This object is defined using so-called FRep representation [9] by the following formula:
f (x, y, z, t) =24∑i
aie−ri ·bi(t) − g�0,
ri =√
(x − xi)2 + (y − yi)
2 + (z − zi)2, (12)
where a is a scale factor, b is an exponent scale factor and g is a threshold value.At any given point (x, y, z, t), function f can take negative, positive or zero values. The point is
considered on the surface of the object if the function value is zero, inside the object if the function valueis positive, and outside the object otherwise. In our case, the blobby function is built on the 24 potentialfunctions resulting from the EEG electrodes. The shape changes through time due to the variable valuesof the exponent factor b. Its size and appearance visually reflect the brain activity. For a better visualimpression, the blobby shape is superimposed with a 3D head.VTK visualization toolkit [10] was used fordeveloping the visualization software. The developed software is an interactive program (Fig. 5), whichvisualizes one or several signals by modeling the respective time-dependent blobby surfaces around the3D human head. The locations of electrodes and the surfaces of the moving EEG shapes are visualizedwith different colors.
Two different semi-opaque moving blobby shapes corresponding to two different EEG signals canbe visualized concurrently to visually analyze the difference between the respective brain activities. Infact, this method of visualization let us notice several phenomena, which could not be possibly noticedif we used common ways of analyzing the EEG. Thus, we noticed that the brain is more active whilegiving positive responses. Also, we observed that although it requires less mental activity in the course ofresponding, giving a negative response is more stressful, because it is followed by prolonged activationof the cerebral cortex and partial activation of the visual cortex of the brain (Fig. 6). It is necessary topoint out here that the latter conclusion can be drawn only due to the volume visualization; by meansof the methods discussed in the preceding sections, such a conclusion cannot be drawn, whereas otherobservations are confirmed with the mathematical method presented in the previous sections.
Besides just a visual comparison, we can apply set-theoretic (“Boolean”) operations to the movingshapes to isolate activities common for both of them, as well as those that are unique for either one.Furthermore, the group set-theoretic operations applied to the individual frames of the moving shapeallow us to isolate idle parts of the brain as well as to estimate an average level of the brain activity. The

V. Kulish et al. / Computers in Biology and Medicine 36 (2006) 291–302 299
Fig. 5. Graphical-user interface of the visualization program.
set-theoretic operations over two moving shapes defined with functions f1(x, y, z, t) and f2(x, y, z, t)
are implemented as follows:Union:
funion(x, y, z, t) = max(f1(x, y, z, t), f2(x, y, z, t))�0
or group union:
fgroup_union(x, y, z) = t2max
t1(f (x, y, z, t))�0.
Intersection:
fintersection(x, y, z, t) = min(f1(x, y, z, t), f2(x, y, z, t))�0

300 V. Kulish et al. / Computers in Biology and Medicine 36 (2006) 291–302
Fig. 6. Several frames of dynamic simulation of the brain activity for “YES” and “NO” cases.
or group intersection:
fgroup_intersection(x, y, z, t) = t2min
t1(f (x, y, z, t))�0.

V. Kulish et al. / Computers in Biology and Medicine 36 (2006) 291–302 301
Fig. 7. Minimum (intersection) and maximum (union) brain’s activity for the given time interval.
Difference:
fdifference(x, y, z, t) = min(f1(x, y, z, t),−f2(x, y, z, t))�0.
Thus, in Fig. 7 we display the minimum and maximum brain’s activity by intersecting and unifyingthrough the given time all the EEG shapes. The intersection (left image) shows those parts of the brain,which are engaged all the time. The right image (union) shows the maximum activity ever registered forthe given time interval. It also shows that there are certain parts of the brain which are always idle for thegiven case and time interval.
6. Conclusion
The technique that involves analysis of fractal time series has been used to process encephalogramsof humans. Based on the Rényi entropy, spectra of the generalized fractal dimensions of the processedEEG signals have been recovered. These spectra show an intrinsic asymmetry of the brain activity, asthe brain is involved in tasks that differ only in their emotional content and not in their complexitydegree. Therefore, one may conclude that otherwise symmetric tasks may cause a noticeable asymmetryin the brain response only due to their emotional content. Moreover, there is a strong indication that acertain overlap exists between the positive and negative estimates made by the brain. This overlap canbe quantified by the amount of the “gray” information found when the fractal spectrum of the “YES”set (“white” information) is compared with the fractal spectra of the corresponding “NO” set (“black”information).
Furthermore, the “YES” signals are found to be more fractal than the corresponding “NO” signals.The analysis of fractal time series, applied to human encephalograms, may prove to be a powerful tool
in achieving a better understanding of the brain functioning.3D visualization of the brain activity proved to be a useful instrument while combined with the above-
mentioned method. In particular, the visualization tool provides a clear picture of the asymmetric activity
302 V. Kulish et al. / Computers in Biology and Medicine 36 (2006) 291–302
of the brain while performing symmetrical tasks with different emotional content. Furthermore, it isnecessary to point out here that the volume visualization, rendered in this study, allows drawing the con-clusion that otherwise would be impossible to draw, namely: giving a negative response is more stressful,because it is followed by prolonged activation of the cerebral cortex and partial activation of the visualcortex of the brain.
References
[1] A.V. Kramarenko, Uner Tan, Validity of spectral analysis of evoked potentials in brain research, Int. J. Neurosci. 112 (2002)489–499.
[2] L. Kauffman, H. Sabelli, Mathematical bios, Kybernetes 31 (2003) 1418–1428.[3] J. Röschke, Eine Analyse der nichtlinearen EEG-Dynamik, Ph.D. Dissertation, University of Göttingen, Germany, 1986.[4] H.G.E. Hentschel, I. Procaccia, The infinite number of generalized dimensions of fractals and strange attractors, Physica
8D (1983) 435–444.[5] A. Rényi, On a new axiomatic theory of probability, Acta Math. Hungar. 6 (1995) 285–335.[6] C.E. Shannon, The Mathematical Theory of Communication, University of Illinois Press, Champaign, IL, 1998, p. 50.[7] M.R. Schroeder, Fractals, Chaos, Power Laws, W.H. Freeman & Co., New York, 1991, pp. 203–224.[8] B.B. Mandelbrot, The Fractal Geometry of Nature, W.H. Freeman & Co., New York, 1983, pp. 15,29,364.[9] A.A. Pasko, V.D. Adzhiev, A.I. Sourin, V.V. Savchenko, Function representation in geometric modeling: concepts,
implementations and applications, The Visual Comput. 11 (8) (1995) 429–446.[10] The Visualization Toolkit, http://www.vtk.org.
Vladimir Kulish was born in 1966 in Marioupol (Ukraine). In 1992, Dr. Kulish received a Ph.D. in Physics and Mathematics fromthe Russian Academy of Sciences and, in 1999, his Ph.D. in Mechanical Engineering from the Southern Methodist University(Dallas, Texas). In 2002, Dr. Kulish was awarded an Honorary Doctor of Divinity by the Universal Life Church (Modesto,California). At present, Vladimir V. Kulish is an Associate Professor of the School of Mechanical & Production Engineeringat Nanyang Technological University in Singapore. Prof. Kulish’s main research interest is in the area of energy-informationaltransport processes and biomedical engineering. The author of six books and more than 70 publications in professional journalsand peer-reviewed conference proceedings, Prof. Kulish is a holder of several prestigious awards for his scientific achievements.His name was included in 2000 Outstanding Scientists of the 21st Century by the International Biographical Institute (Cambridge,UK) for outstanding achievements in biomedical engineering. The American Biographical Institute selected Prof. Kulish Manof the Year 2003. On April 26, 2004, Prof. Kulish was elected a corresponding member and the President of the Asian Branchof the International Academy of Sciences “Collegium”. At the same time, Prof. Kulish the Founding Editor-in-Chief of theinternational journal Works of the International Academy of Sciences “Collegium”.
Alexei Sourin is an Associate Professor at the Nanyang Technological University (NTU), Singapore. He received his M.Sc.and Ph.D. degrees in Computer Science (Computer Graphics) from the Moscow Engineering Physics Institute (MEPhI) in 1983and 1988, respectively. From 1983 to 1993 he was researcher at MEPhI, and since 1993, a professor at NTU. Dr. Sourin is amember of the IEEE Computer Society and ACM SIGGRAPH. His research interests include computer graphics, shared virtualenvironments, shape modeling, and web visualization. Dr. Sourin authored a book “Computer Graphics. From a Small Formula toVirtual Worlds”, Singapore: Prentice-Hall, 2004. He is a Program Chair of the annual International Conferences on Cyberworlds.More details are available at http://www.ntu.edu.sg/home/assourin.
Olga Sourina is an Assistant Professor at the Nanyang Technological University (NTU), Singapore. She earned her M.Sc. inComputer Engineering from the Moscow Engineering Physics Institute (MEPhI) in 1983 and her Ph.D. in Computer Sciencefrom NTU in 1998. Dr. Sourina was a Research Scientist at MEPhI, a Research Fellow at CGIT, NTU, and a Senior Scientistat the Institute of Computing for Physics and Technology. She is a member of the IEEE Computer Society. Dr. Sourina’sresearch interests are in data mining, databases, bioinformatics, computer graphics, scientific visualization, virtual reality, andbioengineering. For her scientific achievements, Dr. Sourina was awarded the honorary diploma of the Academy of Sciences ofthe USSR, the Silver Medal of the National Exhibition Centre of the USSR, and the Medal of the Ministry of Education of theUSSR.