human (in-)ability to forecast environmental uncertainty10.1007/s00163-012-0145...flexibility on...
TRANSCRIPT

1
Lecture Slides
09/20/11
1
Flexibility In Infrastructure Design and Management
Spring 2011
2
Definitions of Uncertainty
�Anything that can impact promises or business objectives in the future� (Verbraeck, 2010)
Uncertainty types (McManus and Hasting, 2005) ! Exogenous: out of managerial control ! Endogenous: managers/designers can control ! Statistically characterized: price or demand ! Known unknowns: future budget, system
performance ! Unknown unknowns: hard to quantify, not
considered in design
3
Human (In-)ability to Forecast
Heavier-than-air flying machine are impossible. Lord Kelvin – British Mathematician, Physicist, and President of the British Royal Society, c. 1895
Everything that can be invented has been invented.
Charles H. Duell – Commissioner of the U.S. Patent Office, 1899
Reagan doesn�t have the presidential look.
United Artists Executive – dismissing Ronald Reagan for the starring role in the movie of THE BEST MAN, 1964
4
Environmental Uncertainty
http://www.jordoncooper.com
http://www.hurricanekatrinanews.org
http://www.washingtonpost.com
5
Market, Technology, and Others…
http://www.growthstock.com
http://images.angelpub.com
http://img.gsmarena.com
Stock Market
Crude Oil Price
Technology
6
Uncertainty and Design Forecast can be (severely) wrong ! No escape from this ! … infrastructure are long-lived, undergo much variations ! … analysis based on too many assumptions ! … inevitable surprises ! … typically over-optimistic about outcomes ! … over-confident about prediction errors
There are many design choices beyond obvious ones ! Typically, combining different characteristics ! … enabling different future designs ! … and are thus more flexible
modified from de Neufville, 2008
Fig. 1 Explicit training on flexibility slides 1-6

2
09/20/11
2
7
Current Design Process
Very successful, BUT…
Based on deterministic forecasts, heuristics, point value estimates (e.g. $60/oil barrel, $1/pound of copper)
Optimized for limited set of conditions
Uncertainty considered ex post through sensitivity analysis �Compartmentalized� engin. and manag�t
Often focused on risk minimization
OPPORTUNITY TO DO BETTER!
http://www.orchardscotts.com.sg/
8
Issues with Current Process Uncertainty affects performance ! Downside scenarios ! risk of losses, lower performance ! Upside scenarios ! opportunities for additional gains
�Fixed� design and management miss opportunities to recognize additional value! ! Can be sub-optimal… when reality departs from forecast! ! Cannot “reduce” exposure to risk easily ! Cannot “seize” good opportunities easily ! Adapting project can be more costly ! Typical project valuation does not account for flexibility
9
Better Approach
Recognize uncertainty a priori ! Range, distribution of possible outcomes Plan for flexibility in design and management ! E.g. vertical building expansion in Chicago
Start smaller
Reduce exposure to
downside market risk
Expand when needed
Extra gains on upside
market opportunity
Guma, 2008
10
Better Approach (cont.)
Find designs acting on outcome distribution, rather than optimizing point forecast
Value Outcomes
Freq
uenc
y
Cut bad, downside outcomes
Improve on good, upside
outcomes
Aim at shifting whole distribution towards better value
http://www.useit.com
11
Why Better with Flexibility? Forces considering downsides explicitly ! And prepare for it ! Prevents over-optimism
Forces considering upsides as well ! Position to capture upside opportunities
Both improve expected (or �average�) performance compared to fixed design
No absolute best guaranteed, but can do BETTER THAN FIXED (INFLEXIBLE) DESIGN!
12
Example Flexible Strategies
Flexibility �on� system: managerial ! Defer investment until favorable conditions ! Growth through R&D investment ! Abandon temporarily or permanently
Flexibility �in� system: technical ! Phase asset deployment over time ! Alter operating scale (expand or reduce
capacity) ! Switch input/output
Fig. 2 Explicit training on flexibility slides 7-12

3
09/20/11
3
13
Criteria for �Good� Flexibility 1. Identify major uncertainty source(s) affecting anticipated
performance
2. Suggest relevant flexible strategies to deal with uncertainties
3. Identify early on appropriate design variables and parameters enabling flexibility ! E.g. stronger structure to support expansion, additional piece of land,
legal/financial/contractual arrangements if necessary
4. Identify relevant management decision rule to �exercise� flexibility ! “Trigger” based on some observations ! E.g. if demand > capacity for 2 years, expand ! Price threshold, regulatory change, etc
14
Examples from Industry
Satellite communication network (de Weck et al., 2004) ! ‘90s award-winning system, $4BN development cost ! Wrong market forecasts: did not plan for land cell
phones. Led to over-capacity design! ! Sold for $25M in bankruptcy
Expected cost saved if used flexible phased deployment strategy: ~$0.8BN (~20%)
15
Examples from Industry (cont.)
Offshore oil platform (Lin, 2009) ! Multi-billion project off coast of Angola ! Typical design to “most likely” oil reserves
estimate ! Production capacity expansion flex.: connect
more sub sea tiebacks as more oil discovered
Study shows 80% expected NPV improvement!
http://www.offshore-technology.com http://msnmoney.brand.edgar-online.com
http://www.w-industries.com
Sub sea tiebacks
Lin, 2009
16
Take Aways
Uncertainty has downsides… BUT ALSO PROVIDES UPSIDE OPPORTUNITIES!
Flexibility in design and management = best approach to deal with uncertainty
Flexibility helps harvest EXTRA value from uncertainty
Not easy however to identify and value it…
Fig. 3 Explicit training on flexibility slides 13-16

4
Prompting Procedure Uncertainty
What are the major sources of uncertainty affecting the future performance of this system? Examples:
- Exogenous uncertainties (e.g. demand markets, natural catastrophes, etc.)
- Endogenous uncertainties (e.g. technology failure rates, etc.)
- Scenarios where things go really bad (e.g. prices drop, economic crisis, etc.)
- Scenarios where things go really well (e.g. demand rises suddenly, etc.)
Flexibility
What flexible strategies would enable the system to change and adapt if the uncertainty scenarios you just
discussed occur during operations? Examples:
- Defer the initial capital investment until favorable market conditions
- Abandon the project to get out of bad, negative market situations
- Invest in R&D to support growth and future opportunities
- Phase capacity deployment over time instead of deploying initially all capacity at once
- Alter operating scale by expanding or reducing production capacity depending on market conditions
- Switch production output and/or input depending on observed demand
Design
How should you prepare, engineer, and design this particular system to enable the flexibilities you just
discussed? Think about how to best engineer the system so it can react to:
- Negative or bad scenarios (e.g. start with a smaller initial design, and reduce risk of over-capacity and
losses)
- Positive or good scenarios (e.g. engineer ability to switch product output easily, write legal contract to
enable physical expansion later on if needed)
- Completely unexpected scenario (e.g. plan ahead for emergency procedure in case of hurricane)
Management
How should you manage and decide when it is appropriate to use, or exercise, the flexibilities in this system?
Examples:
- If demand is lower than capacity for two years, I will shutdown operations for 6 months
- If market price gets above a certain threshold, I will expand production capacity

5
Design Problem Description
09/20/11
1
A Multi-Family Residential Development Project
Spring 2011
2
Introduction
Thanks for being here!
Personal background
About design experiments ! Test under different contexts ! Might wonder: “why this procedure?” ! Can’t answer all questions… unfortunately!
3
Example Project: Cambridge, MA
http://www.northpointcambridge.com
http://www.northpointcambridge.com
4
Setup
You are lead design team at renown real estate development firm
Specialize in multi-family residential real estate ! Condo and apartment buildings
Firm�s objective: sell building at highest profit ! Performance metric: Net Present Value (NPV)
Land already bought
Zoning obtained for either condos and/or apartments
Building permit for 310 units maximum over 3 years
5
Data and Assumptions
Current demand expectations: ! 100 condo units ! 100 apartment units
Current selling price expectations: ! $205,000/unit as condo ! $200,000/unit as apartment
Current construction cost estimate per unit (not inclusive of land) ! $152,000/unit as condo ! $150,000/unit as apartment
Demand, price, and construction cost all projected to increase linearly at 3%/year with annual volatility ~20%
6
Market Projections
LIGHT GREEN: condo
DARK RED: apart.
Fig. 4 Introduction and design problem description slides 1-6

6
09/20/11
2
7
Analysis and Suggested Design
Go with condo building design ! NPV $12.4M > $11.6M (8% discounting)
All 309 units developed in phase 1 (incl. 3% growth) Sold over 3 years (1 year/phase)
8
The Situation
Management wants design offering best expected (or �average�) future performance over range of possible scenarios
Not convinced suggested design is best ! Market demand and price may change; differ from
projections ! Costs may increase, construction delayed
Your team is asked to investigate alternative design(s) that can improve expected performance compared to current design
9
Your Task Brainstorm collectively about design alternatives in this simplified infrastructure project ! Only conceptually, no quantitative assessment
necessary
Not much time, Management wants suggestions by the end of business day!
Plan two 25 minutes sessions using Group Support System software
GOOD LUCK!
Fig. 5 Introduction and design problem description slides 7-9

7
Survey Questions
Answer scale for each question (1 to 7): 1 = Strongly disagree 4 = Neutral 7 = Strongly agree
Process Satisfaction (PS)
- I feel satisfied with the way the first/second session was conducted.
- I appreciated the techniques we used in the first/second session.
- I liked the way the first/second session progressed today.
- I feel satisfied with the methods we used in the first/second session.
- I feel satisfied about the way we carried out activities in the first/second session.
Results Satisfaction (RS)
- I feel happy with what we achieved in the first/second session.
- I feel satisfied with the things we achieved in the first/second session.
- I am happy with the results of the first/second session.
- Our accomplishments in the first/second session give me a feeling of satisfaction.
- When the first/second session was over, I felt satisfied with the results.
Quality Assessment (QA)
- The result of the first/second session had the required quality.
- What we achieved in the first/second session met the goal.
- We achieved what we intended to achieve in the first/second session.
- The result in the first/second session has the quality we intended to achieve.
- The result in the first/second session was in line with the goal set for this workshop.
- I feel confident the top five (5) design alternatives recommended in the first/second session provide
better anticipated performance than the current benchmark design

8
Computer Model Assumptions
Multi-Family Residential Development Project: All input parameters on this page! Assume zero time-to-build
RA - RB
Years per Phase 1.00
Construction Cost Expected Growth Rate (each phase) (gCC) 3%
Construction Cost Expectations (as of completion, each phase):
Phase 1 Phase 2 Phase 3
Base Cost (BCt) 130,000 133,900 137,917 per unit
Added Cost Expectation to Finish & Sell:
As Condos (FCCt) 22,000 22,660 23,340 per unit
As Apts (FCAt) 20,000 20,600 21,218 per unit
Total Construction and Sales Cost ExpectationsAs Condos (CCCt) 152,000 156,560 161,257 per unit
As Apts (CCAt) 150,000 154,500 159,135 per unit
Land Cost ExpectationUp-front Cost Expectation to Enable Switching Flexibility (Cswitch) 0 per unit
Up-front Cost Expectation to Enable Expansion Flexibility (Cexpand) 0 per unit
Selling Price Expected Growth Rate (each phase) (gP) 3%
Selling Price Expectations:
Phase 1 Phase 2 Phase 3As Condos (PCt) 205,000 211,150 217,485 per unit
As Apts (PAt) 200,000 206,000 212,180 per unit
Units Demand Expected Growth Rate (each phase) (gD) 3%
Units Demand Expectations (each phase) Phase 1 Phase 2 Phase 3
As Condos (DCt) 100 103 106
As Apts (DAt) 100 103 106
Planned capacity deployment strategy (each phase) Phase 1 Phase 2 Phase 3
As Condos (KCt) 309 0 0
As Apts (KAt) 309 0 0
Maximum capacity allowed (Kmax) 309
OCC Built Property (rP) 8.00% <== Note: Should include spec premium.
OCC Construction Costs (rC) 8.00% <== Note: Should be near riskfree rate.
Resulting Canonical OCC (r)* 8.00% <==Note: Devlpt project contains operational leverage. This rate will be used as discount rate (see GM Ch 29).
*Blended rate over all phases and uses (approximation of GM 29.4).
Overall Volatility Factor (!) 20%
Uncertainty Factor in Cost (!CC): Volatility factor around expectated growth rate
As Condos 20%
As Apts 20%
Uncertainty factor around initial cost value
As Condos 20%
As Apts 20%
Uncertainty Factor in Price (!P): Volatility factor around expectated growth rate
As Condos 20%
As Apts 20%
Uncertainty factor around initial selling price
As Condos 20%
As Apts 20%
Uncertainty Factor in Units Demand (!D) Volatility factor around expectated growth rate
As Condos 20%
As Apts 20%
Uncertainty factor around initial units demand
As Condos 20%
As Apts 20%
Fig. 6 DCF model assumptions

9
Flexible Design Concept Examples These examples summarize flexible design concepts elicited in experiments. They are all subject to the same
uncertainty sources: demand, price, and construction costs. Only enablers and decision rules are summarized.
Phase the development planning from one phase to another
- Enablers: phase horizontally by keeping land or preparing land, developing modular “blocks” of units,
keeping cash reserves for future expansion, and/or contracting agreements to have workers easily
hired/laid off if needed.
- Decision rule: if demand (price) is higher than planned capacity (observed cost) in this phase, build
next phase.
Expand unit capacity
- Enabler: expand vertically by reinforcing the structure, starting with small capacity to add more units,
preparing shared infrastructures (e.g. laundry, power, water, ventilation) for expansion, hedging
materials costs for expansion.
- Decision rule: expand if demand (observed price) is higher than capacity (observed cost) within the
same phase.
Reduce unit capacity
- Enabler: because this is managerial flexibility “on” the project, one can always reduce or slow down
unit capacity allocation. No specific enabler was needed.
- Decision rule: reduce capacity if demand (observed price) was lower than capacity (observed cost)
within the same phase.
Adjust unit capacity “just in time”
- Enabler: given this flexibility is very difficult to implement in practice, teams had to demonstrate
sufficient understanding of how to implement this in practice. This was typically a mixture of enablers
listed in the phasing and expansion strategies.
- Decision rule: if demand isdifferent than planned capacity, match capacity to demand exactly.
Temporarily abandon the project
- Enabler: because this is managerial flexibility “on” the project, one can always stop it, however with
the stated goal of resuming at some point.
- Decision rule: do not develop a phase if demand in the previous phase was lower than planned.
Completely abandon the project - Enabler: because this is managerial flexibility “on” the project, one can always stop it.
- Decision rule: abandon the project if demand in phase 1 is lower than a minimum threshold.
10
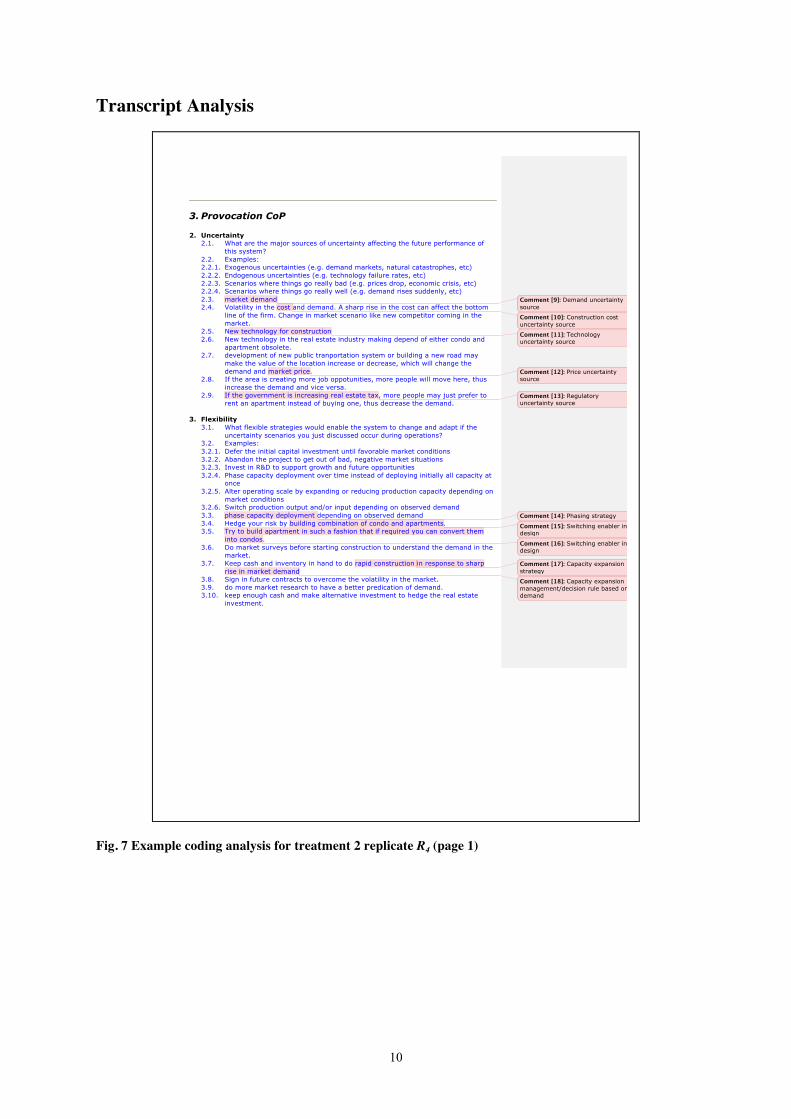
Transcript Analysis
3. Provocation CoP 2. Uncertainty
2.1. What are the major sources of uncertainty affecting the future performance of this system?
2.2. Examples: 2.2.1. Exogenous uncertainties (e.g. demand markets, natural catastrophes, etc) 2.2.2. Endogenous uncertainties (e.g. technology failure rates, etc) 2.2.3. Scenarios where things go really bad (e.g. prices drop, economic crisis, etc) 2.2.4. Scenarios where things go really well (e.g. demand rises suddenly, etc) 2.3. market demand 2.4. Volatility in the cost and demand. A sharp rise in the cost can affect the bottom
line of the firm. Change in market scenario like new competitor coming in the market.
2.5. New technology for construction 2.6. New technology in the real estate industry making depend of either condo and
apartment obsolete. 2.7. development of new public tranportation system or building a new road may
make the value of the location increase or decrease, which will change the demand and market price.
2.8. If the area is creating more job oppotunities, more people will move here, thus increase the demand and vice versa.
2.9. If the government is increasing real estate tax, more people may just prefer to rent an apartment instead of buying one, thus decrease the demand.
3. Flexibility
3.1. What flexible strategies would enable the system to change and adapt if the uncertainty scenarios you just discussed occur during operations?
3.2. Examples: 3.2.1. Defer the initial capital investment until favorable market conditions 3.2.2. Abandon the project to get out of bad, negative market situations 3.2.3. Invest in R&D to support growth and future opportunities 3.2.4. Phase capacity deployment over time instead of deploying initially all capacity at
once 3.2.5. Alter operating scale by expanding or reducing production capacity depending on
market conditions 3.2.6. Switch production output and/or input depending on observed demand 3.3. phase capacity deployment depending on observed demand 3.4. Hedge your risk by building combination of condo and apartments. 3.5. Try to build apartment in such a fashion that if required you can convert them
into condos. 3.6. Do market surveys before starting construction to understand the demand in the
market. 3.7. Keep cash and inventory in hand to do rapid construction in response to sharp
rise in market demand 3.8. Sign in future contracts to overcome the volatility in the market. 3.9. do more market research to have a better predication of demand. 3.10. keep enough cash and make alternative investment to hedge the real estate
investment.
Comment [9]: Demand uncertainty source
Comment [10]: Construction cost uncertainty source
Comment [11]: Technology uncertainty source
Comment [12]: Price uncertainty source
Comment [13]: Regulatory uncertainty source
Comment [14]: Phasing strategy
Comment [15]: Switching enabler in design
Comment [16]: Switching enabler in design
Comment [17]: Capacity expansion strategy
Comment [18]: Capacity expansion management/decision rule based on demand
Fig. 7 Example coding analysis for treatment 2 replicate R4 (page 1)

11
4. Design 4.1. How should you prepare, engineer, and design this particular system to enable
the flexibilities you just discussed? 4.2. Think about how to best engineer the system so it can react to: 4.2.1. Negative or bad scenarios (e.g. start with a smaller initial design, and reduce risk
of over-capacity and losses) 4.2.2. Positive or good scenarios (e.g. engineer ability to switch product output easily,
write legal contract to enable physical expansion later on if needed) 4.2.3. Completely unexpected scenario (e.g. plan ahead for emergency procedure in
case of hurricane) 4.3. I will maintain an inventory to build both condo and apartment. 4.4. I will closely follow the changes in market so that I can chnage my strategies
according to the market 4.5. Design my apartmens such that it is possible to upgrade them to condo if
required. 4.6. Sign contracts with the suppliers to safeguard yourself against a sharpe price rise
in the cost. 4.7. Condo should be the major source of sales but use sales of apartment to
supplement that of condo. 4.8. make alternative investment, such as funds and stock, to hedge the real estate
investment. For example, if expecting the raw material cost will go up, we can buy related stock in advance.
4.9. research on the demand of condo and apartment seperately. 5. Management
5.1. How should you manage and decide when it is appropriate to use, or exercise, the flexibilities in this system?
5.2. Examples: 5.2.1. If demand is lower than capacity for two years, I will shutdown operations for 6
months 5.2.2. If market price gets above a certain threshold, I will expand production capacity 5.3. If you see the price rise is steady, stick to your strategy 5.4. If you see a shard rise in prices of condo and no change in the price of the
apartment then think about upgrading your apartment to condos. 5.5. 20% drop in apartment price will mean the selling price is ~$160,000 and 20%
rise in cost will mean construction cost is ~$180,000. This will mean loss. So if construction cost goes above $160,000 stop construction for a while unless you are sure that selling price and demand will remain intact.
5.6. React to any change in the government policy. 5.7. If the demand is less than 10% of expected, decrease the construction for next
year to 80% of original plan. 5.8. if demand is less than expected for a year than it might be possible that demand
can overshoot in the next year. We should build up our inventory and plan ourself to
5.9. face this situation. 5.10. If the demand is increasing, increase the proportion of condo construction, which
will bring more revenue.
Comment [19]: Switching enabler in design
Comment [20]: Switching management/decision rule based on price
Comment [21]: Temporary abandonment strategy
Comment [22]: Temporary abandonment management/decision rule
Comment [23]: Capacity reduction flexible strategy
Comment [24]: Capacity reduction management/decision rule
Fig. 8 Example coding analysis for treatment 2 replicate R4 (page 2)

12
Summary of Entire Dataset Expt Rep Complete Complete ENPV Good Total ENPV Total !ENPV Complete NEW Complete NEW Percent. total ENPV NEW good Percent. total Total ENPV Total !ENPV Change total Percentage
flex. ideas ideas? attained idea? flex.(millions) (millions) flex. Ideas idea? complete ideas attained idea? good ideas flex.(millions) (millions) !ENPV (millions) total !ENPVS1 S1 S1 S1 S1 S1 S2 S2 from S2 S2 S2 from S2 S2 S2 S1 to S2 from S2
1 1 NO 9.3 NO 9.3 0.0 switching YES 10.5 YES 10.5 1.2 1.2 100%TOTAL 0 0 1 100% 1 100%
1 2 switching YES 12.4 YES 12.4 3.1 NO 13.0 3.7 0.6 54%TOTAL 1 1 0 0% 0 0%
1 3 NO 9.3 NO 9.3 0.0 NO 9.3 NO 9.3 0.0 0.0 0%TOTAL 0 0 0 0% 0 0%
1 4 NO 9.3 NO 9.3 0.0 NO NO 9.3 0.0 0.0 0%TOTAL 0 0 0 0% 0 0%
1 5 NO 9.3 NO 9.3 0.0 switching YES 10.8 YES 10.8 1.5 1.5 100%TOTAL 0 0 1 100% 1 100%
1 6 NO 9.3 NO 9.3 0.0 NO NO 9.3 0.0 0.0 0%TOTAL 0 0 0 0% 0 0%
1 7 capacity "just in time" YES 12.7 YES 12.7 3.4 NO NO 12.7 3.4 0.0 0%TOTAL 1 1 0 0% 0 0%
1 8 NO 9.3 NO 9.3 0.0 NO NO 9.3 0.0 0.0 0%TOTAL 0 0 0 0% 0 0%
2 1 NO 9.3 NO 9.3 0.0 temp. abandonment YES 9.7 YES 11.3 2.0 2.0 100%capacity expansion YES 11.3 YES
TOTAL 0 0 2 100% 2 100%2 2 switching YES 12.3 YES 12.3 3.0 temp. abandonment YES 11.7 YES 13.2 3.9 0.9 57%
capacity expansion YES 11.6 YESTOTAL 1 1 2 67% 2 67%
2 3 switching YES 14.6 YES 14.6 5.3 capacity "just in time" YES 11.4 YES 14.6 5.3 0.0 50%TOTAL 1 1 1 50% 1 50%
2 4 NO 9.3 NO 9.3 0.0 temp. abandonment YES 10.5 YES 12.8 3.5 3.5 100%switching YES 12.8 YEScapacity reduction YES 0.0 NO
TOTAL 0 0 3 100% 2 100%2 5 NO 9.3 NO 9.3 0.0 switching YES 14.4 YES 14.4 5.1 5.1 100%
TOTAL 0 0 1 100% 1 100%2 6 NO 9.3 NO 9.3 0.0 temp.abandonment YES 12.0 YES 12.0 2.7 2.7 100%
TOTAL 0 0 1 100% 1 100%2 7 NO 9.3 NO 9.3 0.0 switching YES 12.5 YES 12.5 3.2 3.2 100%
TOTAL 0 0 1 100% 1 100%2 8 NO 9.3 NO 9.3 0.0 switching YES 9.3 NO 11.0 1.7 1.7 100%
capacity expansion YES 10.7 YEStemp. abandonment YES 10.1 YES
TOTAL 0 0 3 100% 2 100%3 1 NO 9.3 NO 9.3 0.0 phasing YES 12.3 YES 12.3 3.0 3.0 100%
TOTAL 0 0 1 100% 1 100%3 2 NO 9.3 NO 9.3 0.0 abandonment YES 10.2 YES 10.2 0.9 0.9 100%
TOTAL 0 0 1 100% 1 100%3 3 capacity reduction YES 11.3 YES 11.3 2.0 abandonment YES 10.9 YES 11.3 2.0 0.0 50%
TOTAL 1 1 1 50% 1 50%3 4 NO 9.3 NO 9.3 0.0 NO 9.3 NO 9.3 0.0 0.0 0%
TOTAL 0 0 0 0% 0 0%3 5 NO 9.3 NO 9.3 0.0 switching YES 14.7 YES 14.7 5.4 5.4 100%
TOTAL 0 0 1 100% 1 100%3 6 NO 9.3 NO 9.3 0.0 capacity "just in time" YES 11.0 YES 11.0 1.7 1.7 100%
TOTAL 0 0 1 100% 1 100%3 7 switching YES 13.2 YES 13.2 3.9 temp. abandonment YES 10.9 YES 13.2 3.9 0.0 50%
TOTAL 1 1 1 50% 1 50%3 8 NO 9.3 NO 9.3 0.0 NO 9.3 NO 9.3 0.0 0.0 0%
TOTAL 0 0 0 0% 0 0%4 1 NO 9.3 NO 9.3 0.0 capacity expansion YES 11.0 YES 13.0 3.7 3.7 100%
phasing/switching YES 12.6 YESTOTAL 0 0 2 100% 2 100%
4 2 NO 9.3 NO 9.3 0.0 phasing YES 9.3 NO 11.4 2.1 2.1 100%switching YES 11.4 YESabandonment YES 9.8 YES
TOTAL 0 0 3 100% 2 100%4 3 NO 9.3 NO 9.3 0.0 abandonment YES 12.2 YES 12.2 2.9 2.9 100%
TOTAL 0 0 1 0% 1 0%4 4 NO 9.3 NO 9.3 0.0 temp. abandonment YES 11.2 YES 11.4 2.1 2.1 100%
capacity expansion YES 11.4 YESswitching YES 9.3 NOphasing YES 11.1 YES
TOTAL 0 0 4 100% 3 100%4 5 perm. abandonment YES 10.2 YES 10.2 0.9 capacity "just in time" YES 11.0 YES 12.2 2.9 2.0 76%
TOTAL 1 1 1 50% 1 50%4 6 NO 9.3 NO 9.3 0.0 capacity expansion YES 11.2 YES 11.2 1.9 1.9 100%
phasing YES 11.1 YESTOTAL 0 0 2 100% 2 100%
4 7 NO 9.3 NO 9.3 0.0 switching YES 15.2 YES 16.0 6.7 6.7 100%phasing YES 12.2 YES
TOTAL 0 0 2 100% 2 100%4 8 NO 9.3 NO 9.3 0.0 capacity expansion YES 11.0 YES 14.6 5.3 5.3 100%
switching YES 14.6 YEStemp. abandonment YES 9.3 NO
TOTAL 0 0 3 100% 2 100%
Fig. 9 Dataset summary