human mito. dna haplotyping tm · 5 clear supernatant, containing chromosomal dna, is combined with...
TRANSCRIPT

21-1339 21-1341 21-1342 21-1343 21-1344 21-1345
Human MitochondrialDNA Haplotyping Kit AT
Instructor’s Manual
For Teaching Purposes OnlyFor technical assistance call 800.227.1150 x4381
World-Class Support for Science & Math
Note: Upon receipt of the kit, store proteinase K, restriction enzymeMseI, 10× restriction buffer, 10× BSA, mtDNA Primer/Loading Dye Mix,and pBR322/BstNI markers in freezer (approximately –20°C). Othermaterials may be stored at room temperature (approximately 25°C).
3
Human Mitochondrial DNA Haplotyping AT(Advanced Technology)
In addition to the 46 chromosomes found in the nucleus of human cells,each mitochondrion in the cell cytoplasm has several copies of its owngenome. The mitochondrial (mt) genome contains only 37 genes, whichare involved in the process of oxidative phosphorylation—the productionof energy and its storage in ATP.
There is strong evidence that mitochondria once existed as free-livingbacteria, which were taken up by primitive ancestors of eukaryotic cells.The host cell provided a ready source of energy-rich nutrients, and themitochondrion provided a means to extract energy using oxygen. Thisattribute was key to survival, as oxygen accumulated in the primitiveatmosphere. Mitochondria are physically in the same size range asbacteria, and the mt genome retains bacteria-like features. Like bacterialchromosomes and plasmids, the mt genome is a circular molecule. Also,very few noncoding sequences, or introns interrupt mt genes. Thesefeatures are contrary to those of eukaryotic chromosomes, which arelinear, and eukaryotic genes, which have numerous introns.
The entire DNA sequence of the mt genome (16,569 nucleotides) wasdetermined in 1981, well in advance of the Human Genome Project. Genestake up the majority of the mt genome. However, a noncoding region ofapproximately 1200 nucleotides contains signals that control replication ofthe chromosome and transcription of the mt genes. The DNA sequence ofthe “control region” is termed “hypervariable,” because it accumulatesmutations at approximately 10 times the rate of nuclear DNA. This highmutation rate results in unique patterns of single nucleotidepolymorphisms (SNPs), which are inherited through generations.
In the 1980s, Alan Wilson and coworkers at the University of California atBerkeley used mtDNA polymorphisms to create a “family tree” showingancestral relationships between modern populations. Reasoning that allhuman populations arose from a common ancestor in the distantevolutionary past, Wilson’s group calculated how long it would take toaccumulate the pattern of mutations observed in modern populations.They concluded that the ancestor of all modern humans arose in Africaabout 200,000 years ago. This common ancestor was widely reported asthe “mitochondrial Eve.” This confusing simplification—which appeared toleave out Adam—is due to the peculiar inheritance of mtDNA.Mitochondria are inherited exclusively from the mother, with no paternalcontribution. Normally, at fertilization, only the male pronucleus (with
4
23 chromosomes) enters the egg cell. In addition to 23 nuclearchromosomes, the egg cell contributes all the cytoplasm and organelles to a zygote. Hundreds of maternal mitochondria are passed on to eachdaughter cell when the cytoplasm divides during the final stages of mitosis.
While each cell contains only two copies of a given nuclear gene (one oneach of the paired chromosomes), there are hundreds to thousands ofcopies of a given mitochondrial gene in each cell. Thus, mtDNA analysis isimportant in forensic biology, especially in cases where the tissue samplesare very old or in cases where the DNA is badly degraded. For example,control region polymorphisms have been used to
• Identify the remains of the Unknown Soldier killed in the Vietnam War.
• Identify the remains of the Romanov royal family killed in the Russian Revolution.
• Determine the relationship of Neandertal remains (30,000+ years old) to modern humans.
In this experiment, the polymerase chain reaction (PCR) is used to amplifya 1070-base-pair nucleotide sequence within the control region of the mtgenome. This is the easiest experiment to allow a person to visualize adiscrete region of his or her own genetic material. An mtDNA sequence isamplified several thousand-fold over a nuclear sequence that has only twocopies. Because of the large number of mtDNA molecules per cell, cyclingtime can be shortened, and hand cycling is a realistic alternative toautomated thermal cyclers. On the negative side, because each student isamplifying the same region, the results (with respect to the size of the DNAproduct) will also be the same for each. Therefore, the purpose of thisamplification is to produce enough of the desired genetic region for furtheranalysis. In this lab, you will perform a restriction enzyme analysis of themt control region.
The source of template DNA for this procedure is a sample of severalthousand squamous cells obtained from either hair sheaths or cheek cells.Either procedure is bloodless and noninvasive. Hairs are pulled from thescalp, eyebrow, or arm, and the root ends are mixed withChelex®/proteinase K. With incubation at 50°C, the proteinase K digests themembrane that contains the sheath cells; vortexing then releases cells insmall clumps. Alternatively, cheek cells are obtained by a salinemouthwash, collected by centrifugation, and resuspended in Chelex®.
In either case, the samples then are boiled to lyse the squamous cells andliberate the chromosomal DNA. The Chelex® binds metal ions that arereleased from the cells and that inhibit the PCR reaction. A sample of the

5
clear supernatant, containing chromosomal DNA, is combined with abuffered solution of heat-stable Taq polymerase, oligonucleotide primers,the four deoxynucleotide (dNTP) building blocks of DNA, and the cofactormagnesium chloride (MgCl2). The PCR mixture is placed in a DNA thermalcycler and taken through 35 cycles consisting of
• a 30-second incubation at 94°C, to denature the chromosomal DNA intosingle strands,
• a 40-second incubation at 58°C, for the primers to form hydrogen bondswith their complementary sequences on either side of the mt controlregion, and
• a 45-second incubation at 72°C, for the Taq polymerase to makecomplementary DNA strands that begin with each primer.
You may set up an experiment as a time course to show the accumulationof amplification products with increased number of cycles.
The primers used in the experiment bracket the mt control region andresult in selective amplification, or copying, of that region of the mtchromosome. As an optional preliminary step, a fraction (5 µL) of thestudent amplification products can be loaded side by side on a 2% agarosegel, along with size markers, and electrophoresed. After staining with avisible dye, each student will show the same 1070-bp band. Because of thehigh yield, amplification products can be readily stained with methyleneblue or CarolinaBLU™ stain.
To carry the experiment to the next level, 15 µL of each amplified studentsample may be digested with the restriction enzyme MseI. In humanpopulations, the mitochondrial genome contains a polymorphic MseI siteat nucleotide position 16,297. This will generate one of two possible cuttingpatterns: one for one mtDNA type that has the MseI restriction enzymerecognition sequence and one for the mtDNA type that lacks the MseI site.(Note: Other cutting patterns may also be seen.) The mtDNA types are termedhaplotypes. After incubation at 37ºC, digests are loaded side-by-side on a 2%agarose gel, along with size markers, and are electrophoresed. After stainingwith a visible dye, each student will determine his or her haplotype. Becauseof the high yield, amplification products can be readily stained withmethylene blue or with CarolinaBLU™ stain.
Visit the Dolan DNA Learning Center at http://dnalc.org to view ordownload animations on PCR, RFLPs, and DNA fingerprinting (click onResources and then Biology Animation Library). Explore online genomeresources, test theories of human evolution, and solve forensic DNA casesdrawn from current research literature. All these facilities can be found onthe Dolan DNALC Web site. Many of these resources can be linked throughthe Genetic Origins icon on their home page.
16
Successful amplification is closely correlated to presence of a sheath. Mostpeople find sheaths only on some hairs, and some people are unable tofind any sheaths at all. Hair roots usually yield little DNA because the cellmass is not digested by proteinase K and only cells at the edge of the massare lysed by boiling.
However, hair sheaths and roots work almost equally well in mtDNAamplifications. This is because the large amount of mtDNA in each cellcompensates for the relatively low number of cells obtained from roots.Furthermore, forensic scientists agree that mitochondria are also found onthe hair shaft, although their origin is not known. For these reasons, hairpreparations yield 85–95% interpretable results, on par with results fromcheek cells.
Each method works best with one piece of relatively inexpensiveequipment. The mouthwash method requires a clinical centrifuge (for 15-mL tubes) that develops 500–1000 × g. DNA isolation from hair sheathsrequires a vortexer.
3. Ready-to-Go PCR Beads™Each PCR bead contains reagents so that when brought to a final volumeof 25 µL, the reaction contains 1.5 units of Taq polymerase, 10 mM Tris-HCl(pH 9.0), 50 mM KCl, 1.5 mM MgCl2, and 200 µM of each dNTP.
4. mtDNA Primer/Loading Dye MixThis mix includes mt control region primers (0.25 pmol/µL of each primer),13.8% sucrose, and 0.0081% cresol red in tris-low EDTA (TLE) buffer (4 mMTris-HCl, pH 8.0; 0.04 mM EDTA).
5. Storing Squamous Cell DNA SamplesStudent DNA samples isolated in Procedure A1 or Procedure A2 areunstable and must be kept on ice prior to setting up PCR reactions.Samples may be stored at –20°C for several weeks without significant DNAdegradation.
6. Setting Up PCR ReactionsThe lyophilized Taq polymerase in the Ready-to-Go PCR Bead™ becomesactive immediately upon addition of the mtDNA primer/loading mix. In theabsence of thermal cycling, “nonspecific priming” allows the polymeraseto begin generating erroneous products, which can show up as extrabands in gel analysis. Therefore, work quickly, and initiate thermal cyclingas soon as possible after mixing PCR reagents. Be sure the thermal cycleris set and have all experimenters set up PCR reactions coordinately. Addprimer/loading dye mix to all reaction tubes, then add each student DNA
18
10. DNA Size MarkersPlasmid pBR322 digested with the restriction endonuclease BstNI producesfragments that are useful as size markers in this experiment: 1857 bp, 1058bp, 929 bp, 383 bp, and 121 bp (this last band may be faint or not visible,especially if CarolinaBLU™ is used). Use 20 µL of the DNA marker per gel.
11. Viewing and Photographing GelsView and photograph gels as soon as possible after appropriate stainingand destaining. Over time (especially when ethidium bromide is used),PCR products disappear as stained bands, because they slowly diffusethrough the gel.
Laboratory ProceduresNote: The following are the laboratory procedure steps in the StudentGuide, along with italicized responses to some of the Results andDiscussion questions and directions.
Note: You will do either Procedure A1 or Procedure A2.
Procedure A1: Isolate Hair Sheath DNA
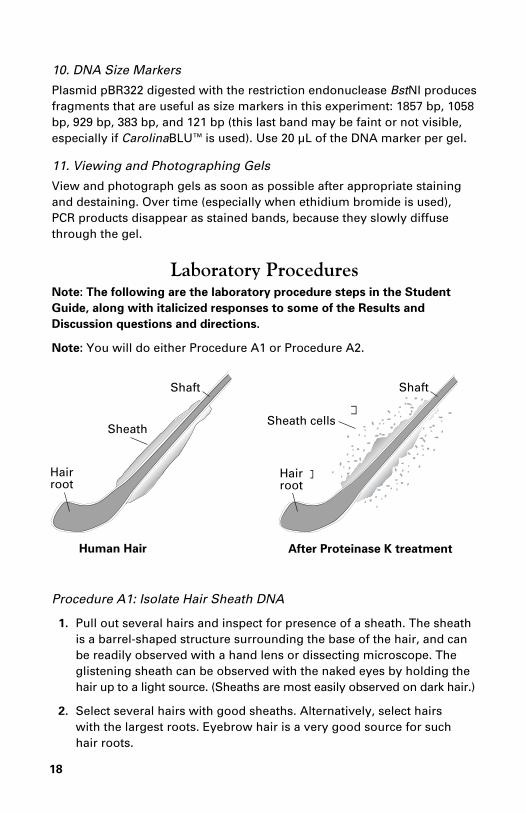
1. Pull out several hairs and inspect for presence of a sheath. The sheathis a barrel-shaped structure surrounding the base of the hair, and canbe readily observed with a hand lens or dissecting microscope. Theglistening sheath can be observed with the naked eyes by holding thehair up to a light source. (Sheaths are most easily observed on dark hair.)
2. Select several hairs with good sheaths. Alternatively, select hairs with the largest roots. Eyebrow hair is a very good source for such hair roots.
HAIR�ROOT
SHEATH
SHAFT
HAIR�ROOT
SHEATH�CELLS
SHAFT
HUMAN HAIR AFTER PROTEINASE K TREATMENT
Shaft
Sheath
Hairroot
Hairroot
Sheath cells
Shaft
Human Hair After Proteinase K treatment

19
3. Use a fresh razor blade or scalpel to cut off hair shafts just above the sheath.
4. Use forceps to transfer hairs to a 1.5-mL tube containing 100 µL ofproteinase K/Chelex® mixture. Make sure the sheaths are submerged inthe solution and not stuck on the test tube wall.
5. Incubate the sample tube in a 50°C water bath for 10 minutes.
6. Remove sample tube to room temperature. Vortex by machine orvigorously with your finger for 15 seconds to dislodge cells from hair shafts.
7. Place your sample in a floating tube rack in the boiling water bath for 8 min. Do not submerge or drop the tube into the water. Use forceps toremove your tube from the boiling water bath and allow samples tocool for 2 min. The tube may be placed on ice for faster cooling.
8. Vortex by machine or vigorously with finger for 15 seconds.
9. Put your assigned number on your sample tube and place it, alongwith the others, in a balanced configuration in the microcentrifuge andspin at full speed for 30 sec (1 min in nanofuge). Alternatively, let thetube sit for 5 min to allow the debris to settle.
10. Use a fresh tip to transfer 50 µL of the clear supernatant to a clean 1.5-mL tube. Be careful not to remove or disturb the Chelex®/cell debrisat the bottom of the tube.
11. Store your sample on ice or in the freezer until you are ready to beginProcedure B.
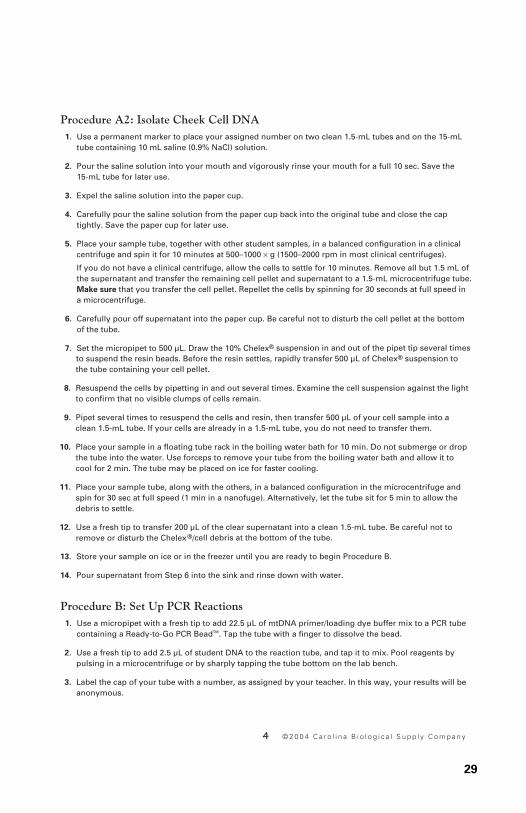
Procedure A2: Isolate Cheek Cell DNA
1. Use a permanent marker to place your assigned number on two clean1.5-mL tubes and on the 15-mL tube containing 10 mL saline (0.9%NaCl) solution.
2. Pour the saline solution into your mouth and vigorously rinse yourmouth for a full 10 sec. Save the 15-mL tube for later use.
3. Expel the saline solution into the paper cup.
4. Carefully pour the saline solution from the paper cup back into theoriginal tube and close the cap tightly. Save the paper cup for later use.
5. Place your sample tube, together with other student samples, in abalanced configuration in a clinical centrifuge and spin it for 10minutes at 500–1000 × g (1500–2000 rpm in most clinical centrifuges).
If you do not have a clinical centrifuge, allow the cells to settle for 10 minutes. Remove all but 1.5 mL of the supernatant and transfer the

20
remaining cell pellet and supernatant to a 1.5-mL microcentrifugetube. Make sure that you transfer the cell pellet. Repellet the cells byspinning for 30 seconds at full speed in a microcentrifuge.
6. Carefully pour off supernatant into the paper cup. Be careful not todisturb the cell pellet at the bottom of the tube.
7. Set the micropipet to 500 µL. Draw the 10% Chelex® suspension in andout of the pipet tip several times to suspend the resin beads. Beforethe resin settles, rapidly transfer 500 µL of Chelex® suspension to thetube containing your cell pellet.
8. Resuspend the cells by pipetting in and out several times. Examine theresuspended cells in the tube against the light to confirm that novisible clumps of cells remain.
9. Pipet several times to resuspend the cells and resin, then transfer 500 µL of your cell sample into a clean 1.5-mL tube. If your cells arealready in a 1.5-mL tube, you do not need to transfer them.
10. Place your sample in a floating tube rack in the boiling water bath for10 min. Do not submerge or drop the tube into the water. Use forcepsto remove your tube from the boiling water bath and allow it to coolfor 2 min. The tube may be placed on ice for faster cooling.
11. Place your sample tube, along with the others, in a balancedconfiguration in the microcentrifuge and spin for 30 sec at full speed (1 min in a nanofuge). Alternatively, let the tube sit for 5 min to allowdebris to settle.
12. Use a fresh tip to transfer 200 µL of the clear supernatant into a clean1.5-mL tube. Be careful not to remove or disturb the Chelex®/celldebris at the bottom of the tube.
13. Store your sample on ice or in the freezer until you are ready to beginProcedure B.
14. Pour supernatant from Step 6 into the sink and rinse down with water.
Procedure B: Set Up PCR Reactions
1. Use a micropipet with a fresh tip to add 22.5 µL of mtDNAprimer/loading dye buffer mix to a PCR tube containing a Ready-to-GoPCR Bead™. Tap the tube with a finger to dissolve the bead.
2. Use a fresh tip to add 2.5 µL of student DNA to the reaction tube, andtap it to mix. Pool reagents by pulsing in a microcentrifuge or bysharply tapping the tube bottom on the lab bench.
21
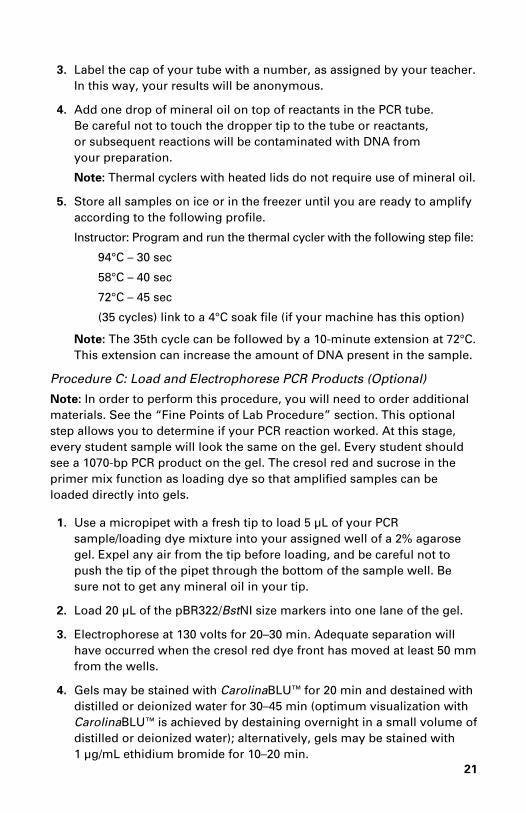
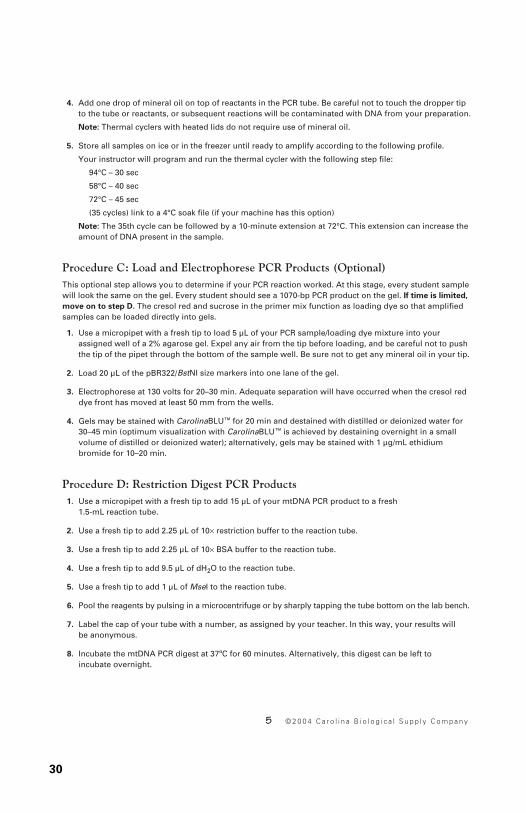
3. Label the cap of your tube with a number, as assigned by your teacher.In this way, your results will be anonymous.
4. Add one drop of mineral oil on top of reactants in the PCR tube. Be careful not to touch the dropper tip to the tube or reactants, or subsequent reactions will be contaminated with DNA from your preparation.
Note: Thermal cyclers with heated lids do not require use of mineral oil.
5. Store all samples on ice or in the freezer until you are ready to amplifyaccording to the following profile.
Instructor: Program and run the thermal cycler with the following step file:
94°C – 30 sec
58°C – 40 sec
72°C – 45 sec
(35 cycles) link to a 4°C soak file (if your machine has this option)
Note: The 35th cycle can be followed by a 10-minute extension at 72°C.This extension can increase the amount of DNA present in the sample.
Procedure C: Load and Electrophorese PCR Products (Optional)Note: In order to perform this procedure, you will need to order additionalmaterials. See the “Fine Points of Lab Procedure” section. This optionalstep allows you to determine if your PCR reaction worked. At this stage,every student sample will look the same on the gel. Every student shouldsee a 1070-bp PCR product on the gel. The cresol red and sucrose in theprimer mix function as loading dye so that amplified samples can beloaded directly into gels.
1. Use a micropipet with a fresh tip to load 5 µL of your PCRsample/loading dye mixture into your assigned well of a 2% agarosegel. Expel any air from the tip before loading, and be careful not topush the tip of the pipet through the bottom of the sample well. Besure not to get any mineral oil in your tip.
2. Load 20 µL of the pBR322/BstNI size markers into one lane of the gel.
3. Electrophorese at 130 volts for 20–30 min. Adequate separation willhave occurred when the cresol red dye front has moved at least 50 mmfrom the wells.
4. Gels may be stained with CarolinaBLU™ for 20 min and destained withdistilled or deionized water for 30–45 min (optimum visualization withCarolinaBLU™ is achieved by destaining overnight in a small volume ofdistilled or deionized water); alternatively, gels may be stained with 1 µg/mL ethidium bromide for 10–20 min.

22
Procedure D: Restriction Digest PCR Products
1. Use a micropipet with a fresh tip to add 15 µL of your mtDNA PCRproduct to a fresh 1.5-mL reaction tube.
2. Use a fresh tip to add 2.25 µL of 10× restriction buffer to the reactiontube.
3. Use a fresh tip to add 2.25 µL of 10× BSA buffer to the reaction tube.
4. Use a fresh tip to add 9.5 µL of dH2O to the reaction tube.
5. Use a fresh tip to add 1 µL of MseI to the reaction tube.
6. Mix gently and pool the reagents by pulsing in a microcentrifuge or bysharply tapping the tube bottom on the lab bench.
7. Label the cap of your tube with a number, as assigned by your teacher.In this way, your results will be anonymous.
8. Incubate mtDNA PCR digest at 37ºC for 60 minutes. Alternatively, thisdigest can be left to incubate overnight.
Procedure E: Load and Electrophorese mtDNA PCR Digests
1. Use a micropipet with a fresh tip to add 3 µL of 10× loading dye toyour mtDNA PCR digest tube.
2. Use a micropipet with a fresh tip to add entire mtDNA PCR digestsample/loading dye mixture (33 µL) into your assigned well of a 2%agarose gel. Expel any air from the tip before loading, and be carefulnot to push the tip of the pipet through the bottom of the sample well.
3. Load 20 µL of the pBR322/BstNI size markers into one lane of the gel.
4. Electrophorese at 130 volts for 20–30 min. Adequate separation willhave occurred when the cresol red dye front has moved at least 50 mm from the wells.
5. Gels may be stained with CarolinaBLU™ for 20 min and destained withdistilled or deionized water for 30–45 min (optimal visualization withCarolinaBLU™ occurs after destaining the gel overnight in a smallamount of distilled or deionized water); alternatively, gels may bestained with 1 µg/mL ethidium bromide for 10–20 min.

23
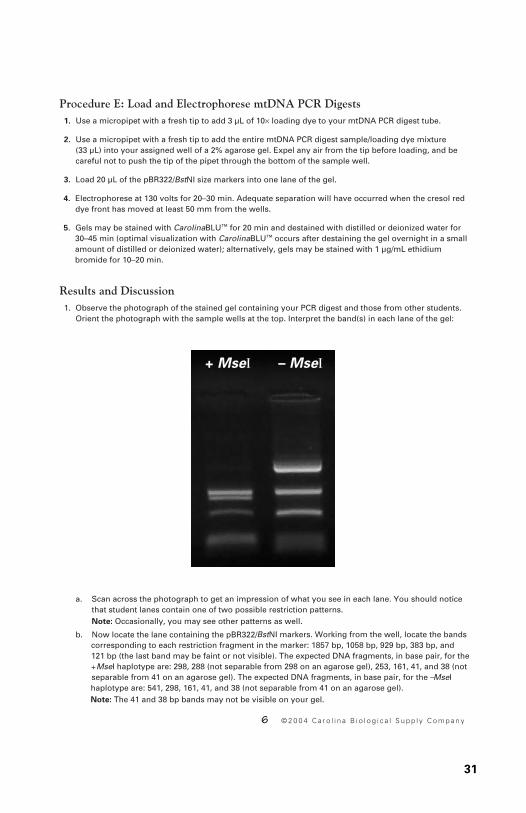
Results and Discussion1. Observe the photograph of the stained
gel containing your PCR digest andthose from other students. Orient thephotograph with the sample wells atthe top. Interpret the band(s) in eachlane of the gel:
a. Scan across the photograph to get an impression of what you see in each lane. You should notice that student lanes contain one of two possible restriction patterns.
Note: Occasionally, you may see other patterns as well.
b. Now locate the lane containing the pBR322/BstNI markers. Working from the well, locate the bands corresponding to each restriction fragment: 1857 bp, 1058 bp, 929 bp, 383 bp, and 121 bp (the last band may be faint or not visible if you stain with CarolinaBLU™). Working from the well, locate the bands corresponding to each restriction fragment: (the last band(s) may be faint or not visible). The expected DNA fragments, in base pair, for the +MseI haplotype are: 298, 288 (not separable from 298 on an agarose gel), 253, 161, 41, and 38 (not separable from 41 on an agarose gel). The expected DNA fragments, in base pair, for the –MseI haplotype are: 541, 298, 161, 41, and 38 (not separable from 41 on an agarose gel).
2. How would you use the size marker to interpret your restriction patternfragment sizes?
Use the size marker as a guide to locate the expected restrictionfragments.
3. Do you have the MseI restriction site in your mitochondrial genome atnucleotide position 16,297? How can you tell?
Students that are negative for the MseI site will observe a 541-bp bandon their gel. Students that are positive for the MseI site will notobserve this band. Instead, they will observe a 253-bp band on theirgel. This band results from the cleavage of the 541-bp fragment into253 bp and 288 bp. The 288-bp band will not be visible because it co-migrates with the 298-bp fragment on the gel.
+ MseΙ – MseΙ

24
4. The mt control region mutates at approximately 10 times the rate ofnuclear DNA. Propose a biological reason for the high mutation rate of mtDNA.
The mitochondrial genome is housed within the cell’s energyproducing factory, where it is exposed to reactive by-products ofoxidative phosphorylation. Notably, oxygen free radicals are potentmutagens. The number of reactive by-products, in turn, increases asenzymes involved in energy production accumulate mutations thatmake them function less efficiently. It is hypothesized that this declinein mitochondrial efficiency is a major contributor to aging.
5. The high mutability of the mt control region genome means that itevolves more quickly than the nuclear genome. This makes the mtcontrol region a laboratory for the study of DNA evolution. However,can you think of any drawbacks to this high mutation rate with respectto studying evolution?
The mutation rate is so high that some nucleotides have mutatedseveral times over evolutionary history. This makes it difficult todetermine the actual mutation rate and to ascertain the ancestral(original) state of a DNA sequence. This makes it difficult to accuratelycalibrate the “mutation clock.”
6. What is the frequency of each haplotype in your class?
To calculate the frequency, first determine the number of students thatwere positive for the MseI site. Divide this number by the total numberof students in the class. Do the same thing with the number ofstudents who were negative for the MseI site.
7. What does this tell you about how different people in the class may berelated? Are you surprised by what you find?
Although all students share a common maternal ancestor, studentswho are positive for the MseI site share a closer maternal relationshipthan those students who do not. Students are often confused thatmaternal genetic relationships do not always agree with racialclassifications of man.
8. How are mitochondrial restriction haplotypes limited in investigatinggenetic relationships and human evolution?
Restriction haplotypes are limited in that restriction enzymes onlyanalyze a small region of the mitochondrial genome. This can onlyprovide general relationship data. For a more detailed analysis,scientists sequence the DNA of the entire mitochondrial genome.

25
Further ReadingBloom, M. 1994. Polymerase Chain Reaction. Carolina Tips 57: 13–18.
Bloom, M., G. Freyer, and D. Micklos. 1995. Laboratory DNA Science.Benjamin/Cummings, Menlo Park, CA.
Cann, R.L., W. M. Brown, and A. C. Wilson. 1984. Polymorphic sites and themechanism of evolution in human mitochondrial DNA. Genetics 106(3): 479–499.
Kreuzer, H., and A. Massey. 2001. Recombinant DNA and Biotechnology: A Guide for Teachers. American Society for Microbiology Press,Washington, DC.
Micklos, D., and G. Freyer. 2003 (2nd Edition). DNA Science, a First Course.Cold Spring Harbor Laboratory Press, Cold Spring Harbor, NY.
Mullis, K. 1990. The unusual origin of the Polymerase Chain Reaction.Scientific American 262(4): 56–65.
National Research Council. 1996. The Evaluation of Forensic DNA Evidence.National Academy Press, Washington, DC.
Zischler, H., H. Geisert, A. von Haeseler, and S. Paabo. 1995. A nuclear‘fossil’ of the mitochondrial D-loop and the origin of modern humans.Nature, vol. 378(6556):489–92.
26
1 © 2 0 0 4 C a r o l i n a B i o l o g i c a l S u p p l y C o m p a n y
In addition to the 46 chromosomes found in the nucleus of human cells, each mitochondrion in the cellcytoplasm has several copies of its own genome. The mitochondrial (mt) genome contains only 37 genes,which are involved in the process of oxidative phosphorylation—the production of energy and its storage in ATP.
There is strong evidence that mitochondria once existed as free-living bacteria, which were taken up byprimitive ancestors of eukaryotic cells. The host cell provided a ready source of energy-rich nutrients, andthe mitochondrion provided a means to extract energy using oxygen. This attribute was key to survival, asoxygen accumulated in the primitive atmosphere. Mitochondria are physically in the same size range asbacteria, and the mt genome retains bacteria-like features. Like bacterial chromosomes and plasmids, themt genome is a circular molecule. Also, very few noncoding sequences, or introns interrupt mt genes.These features are contrary to those of eukaryotic chromosomes, which are linear, and eukaryotic genes,which have numerous introns.
The entire DNA sequence of the mt genome (16,569 nucleotides) was determined in 1981, well in advanceof the Human Genome Project. Genes take up the majority of the mt genome. However, a noncoding region of approximately 1200 nucleotides contains signals that control replication of the chromosome and transcription of the mt genes. The DNA sequence of the “control region” is termed “hypervariable,”because it accumulates mutations at approximately 10 times the rate of nuclear DNA. This high mutation rate results in unique patterns of single nucleotide polymorphisms (SNPs), which are inheritedthrough generations.
In the 1980s, Alan Wilson and coworkers at the University of California at Berkeley used mtDNApolymorphisms to create a “family tree” showing ancestral relationships between modern populations.Reasoning that all human populations arose from a common ancestor in the distant evolutionary past,Wilson’s group calculated how long it would take to accumulate the pattern of mutations observed in modernpopulations. They concluded that the ancestor of all modern humans arose in Africa about 200,000 years ago.This common ancestor was widely reported as the “mitochondrial Eve.” This confusing simplification—whichappeared to leave out Adam—is due to the peculiar inheritance of mtDNA. Mitochondria are inheritedexclusively from the mother, with no paternal contribution. Normally, at fertilization, only the male pronucleus(with 23 chromosomes) enters the egg cell. In addition to 23 nuclear chromosomes, the egg cell contributes allthe cytoplasm and organelles to a zygote. Hundreds of maternal mitochondria are passed on to each daughtercell when the cytoplasm divides during the final stages of mitosis.
While each cell contains only two copies of a given nuclear gene (one on each of the paired chromosomes),there are hundreds to thousands of copies of a given mitochondrial gene in each cell. Thus, mtDNA analysisis important in forensic biology, especially in cases where the tissue samples are very old or in cases wherethe DNA is badly degraded. For example, control region polymorphisms have been used to
• Identify the remains of the Unknown Soldier killed in the Vietnam War.
• Identify the remains of the Romanov royal family killed in the Russian Revolution.
• Determine the relationship of Neandertal remains (30,000+ years old) to modern humans.
In this experiment, the polymerase chain reaction (PCR) is used to amplify a 1070-base-pair nucleotidesequence within the control region of the mt genome. Amplifying mitochondrial DNA is the easiestexperiment that allows people to visualize a discrete region of their own genetic material. An mtDNAsequence is amplified several thousand-fold over a nuclear sequence that has only two copies. Because ofthe large number of mtDNA molecules per cell, cycling time can be shortened, and hand cycling is arealistic alternative to automated thermal cyclers. On the negative side, because each student is amplifyingthe same region, the results (with respect to the size of the DNA product) will also be the same for each.Therefore, the purpose of this amplification is to produce enough of the desired genetic region for furtheranalysis. In this lab, you will perform a restriction enzyme analysis of the mt control region.
Student Guide Name
21-1339, 21-1341, 21-1342 Date
21-1343, 21-1344, 21-1345
Human Mitochondrial DNA Haplotyping Kit AT

27
2 © 2 0 0 4 C a r o l i n a B i o l o g i c a l S u p p l y C o m p a n y
The source of template DNA for this procedure is a sample of several thousand squamous cells obtainedfrom either hair sheaths or cheek cells. Either procedure is bloodless and noninvasive. Hairs are pulled fromthe scalp, eyebrow, or arm, and the root ends are mixed with Chelex®/proteinase K. With incubation at37°C, the proteinase K digests the membrane that contains the sheath cells; vortexing then releases cells insmall clumps. Alternatively, cheek cells are obtained by a saline mouthwash, collected by centrifugation,and resuspended in Chelex®.
In either case, the samples then are boiled to lyse the squamous cells and liberate the chromosomal DNA.The Chelex® binds metal ions that are released from the cells and that inhibit the PCR reaction. A sample ofthe clear supernatant, containing chromosomal DNA, is combined with a buffered solution of heat-stableTaq polymerase, oligonucleotide primers, the four deoxynucleotide (dNTP) building blocks of DNA, and thecofactor magnesium chloride (MgCl2). The PCR mixture is placed in a DNA thermal cycler and taken through35 cycles consisting of
• a 30-second incubation at 94°C, to denature the chromosomal DNA into single strands,
• a 40-second incubation at 58°C, for the primers to form hydrogen bonds with their complementarysequences on either side of the mt control region, and
• a 45-second incubation at 72°C, for the Taq polymerase to make complementary DNA strands thatbegin with each primer.
The primers used in the experiment bracket the mt control region and result in selective amplification, orcopying, of that region of the mt chromosome. As an optional step, a fraction (5 µL) of the studentamplification products can be loaded side by side on a 2% agarose gel, along with size markers, andelectrophoresed. After staining with a visible dye, each student will show the same 1070-bp band. Becauseof the high yield, amplification products can be readily stained with methylene blue or CarolinaBLU™ stain.
To carry the experiment to the next level, 15 µL of each amplified student sample is digested with therestriction enzyme MseI. In human populations, the mitochondrial genome contains a polymorphic MseIsite at nucleotide position 16,297. This will generate one of two possible cutting patterns: one for themtDNA type that has the MseI restriction enzyme recognition sequence and one for the mtDNA type thatlacks the MseI site. The two mtDNA types are termed haplotypes. After incubation at 37ºC, digests areloaded side-by-side on a 2% agarose gel, along with size markers, and electrophoresed. After staining witha visible dye, each student will determine his or her haplotype. Because of the high yield, amplificationproducts can be readily stained with methylene blue or CarolinaBLU™ stain.
Visit the Dolan DNA Learning Center at http://dnalc.org to view or download animations on PCR, RFLPs, andDNA fingerprinting (click on Resources and then Biology Animation Library). Explore online genomeresources, test theories of human evolution, and solve forensic DNA cases drawn from the current researchliterature. All these facilities can be found on the Dolan DNALC Web site. Many of these resources can belinked through the Genetic Origins icon on their home page.

28
3 © 2 0 0 4 C a r o l i n a B i o l o g i c a l S u p p l y C o m p a n y
Laboratory ProceduresNote: You will do either Procedure A1 or Procedure A2.
Procedure A1: Isolate Hair Sheath DNA1. Pull out several hairs and inspect for presence of a sheath. The sheath is a barrel-shaped structure
surrounding the base of the hair, and can be readily observed with a hand lens or dissectingmicroscope. The glistening sheath can be observed with the naked eyes by holding the hair up to a lightsource. (Sheaths are most easily observed on dark hair.)
2. Select several hairs with good sheaths. Alternatively, select hairs with the largest roots. Eyebrow hair isa very good source for such hair roots.
3. Use a fresh razor blade or scalpel to cut off hair shafts just above the sheath.
4. Use forceps to transfer hairs to a 1.5-mL tube containing 100 µL of proteinase K/ Chelex® mixture. Makesure the sheaths are submerged in the solution and not stuck on the test tube wall.
5. Incubate the sample tube in a 50°C water bath for 10 minutes.
6. Remove sample tube to room temperature. Vortex by machine or vigorously with your finger for 15 seconds to dislodge cells from hair shafts.
7. Place your sample in a floating tube rack in the boiling water bath for 8 min. Do not submerge or dropthe tube into the water. Use forceps to remove your tube from the boiling water bath and allowsamples to cool for 2 min. The tube may be placed on ice for faster cooling.
8. Vortex by machine or vigorously with your finger for 15 seconds.
9. Put your assigned number on your sample tube and place it, along with the others, in a balancedconfiguration in the microcentrifuge and spin at full speed for 30 sec (1 min in nanofuge). Alternatively,let the tube sit for 5 min to allow the debris to settle.
10. Use a fresh tip to transfer 50 µL of the clear supernatant to a clean 1.5-mL tube. Be careful not toremove or disturb the Chelex®/cell debris at the bottom of the tube.
11. Store your sample on ice or in the freezer until you are ready to begin Procedure B.
HAIR�ROOT
SHEATH
SHAFT
HAIR�ROOT
SHEATH�CELLS
SHAFT
HUMAN HAIR AFTER PROTEINASE K TREATMENT
Shaft
Sheath
Hairroot
Hairroot
Sheath cells
Shaft
Human Hair After Proteinase K treatment
29
4 © 2 0 0 4 C a r o l i n a B i o l o g i c a l S u p p l y C o m p a n y
Procedure A2: Isolate Cheek Cell DNA1. Use a permanent marker to place your assigned number on two clean 1.5-mL tubes and on the 15-mL
tube containing 10 mL saline (0.9% NaCl) solution.
2. Pour the saline solution into your mouth and vigorously rinse your mouth for a full 10 sec. Save the 15-mL tube for later use.
3. Expel the saline solution into the paper cup.
4. Carefully pour the saline solution from the paper cup back into the original tube and close the captightly. Save the paper cup for later use.
5. Place your sample tube, together with other student samples, in a balanced configuration in a clinicalcentrifuge and spin it for 10 minutes at 500–1000 × g (1500–2000 rpm in most clinical centrifuges).
If you do not have a clinical centrifuge, allow the cells to settle for 10 minutes. Remove all but 1.5 mL ofthe supernatant and transfer the remaining cell pellet and supernatant to a 1.5-mL microcentrifuge tube.Make sure that you transfer the cell pellet. Repellet the cells by spinning for 30 seconds at full speed ina microcentrifuge.
6. Carefully pour off supernatant into the paper cup. Be careful not to disturb the cell pellet at the bottomof the tube.
7. Set the micropipet to 500 µL. Draw the 10% Chelex® suspension in and out of the pipet tip several timesto suspend the resin beads. Before the resin settles, rapidly transfer 500 µL of Chelex® suspension tothe tube containing your cell pellet.
8. Resuspend the cells by pipetting in and out several times. Examine the cell suspension against the lightto confirm that no visible clumps of cells remain.
9. Pipet several times to resuspend the cells and resin, then transfer 500 µL of your cell sample into aclean 1.5-mL tube. If your cells are already in a 1.5-mL tube, you do not need to transfer them.
10. Place your sample in a floating tube rack in the boiling water bath for 10 min. Do not submerge or dropthe tube into the water. Use forceps to remove your tube from the boiling water bath and allow it tocool for 2 min. The tube may be placed on ice for faster cooling.
11. Place your sample tube, along with the others, in a balanced configuration in the microcentrifuge andspin for 30 sec at full speed (1 min in a nanofuge). Alternatively, let the tube sit for 5 min to allow thedebris to settle.
12. Use a fresh tip to transfer 200 µL of the clear supernatant into a clean 1.5-mL tube. Be careful not toremove or disturb the Chelex®/cell debris at the bottom of the tube.
13. Store your sample on ice or in the freezer until you are ready to begin Procedure B.
14. Pour supernatant from Step 6 into the sink and rinse down with water.
Procedure B: Set Up PCR Reactions1. Use a micropipet with a fresh tip to add 22.5 µL of mtDNA primer/loading dye buffer mix to a PCR tube
containing a Ready-to-Go PCR Bead™. Tap the tube with a finger to dissolve the bead.
2. Use a fresh tip to add 2.5 µL of student DNA to the reaction tube, and tap it to mix. Pool reagents bypulsing in a microcentrifuge or by sharply tapping the tube bottom on the lab bench.
3. Label the cap of your tube with a number, as assigned by your teacher. In this way, your results will beanonymous.
30
5 © 2 0 0 4 C a r o l i n a B i o l o g i c a l S u p p l y C o m p a n y
4. Add one drop of mineral oil on top of reactants in the PCR tube. Be careful not to touch the dropper tipto the tube or reactants, or subsequent reactions will be contaminated with DNA from your preparation.
Note: Thermal cyclers with heated lids do not require use of mineral oil.
5. Store all samples on ice or in the freezer until ready to amplify according to the following profile.
Your instructor will program and run the thermal cycler with the following step file:
94°C – 30 sec
58°C – 40 sec
72°C – 45 sec
(35 cycles) link to a 4°C soak file (if your machine has this option)
Note: The 35th cycle can be followed by a 10-minute extension at 72°C. This extension can increase theamount of DNA present in the sample.
Procedure C: Load and Electrophorese PCR Products (Optional)This optional step allows you to determine if your PCR reaction worked. At this stage, every student samplewill look the same on the gel. Every student should see a 1070-bp PCR product on the gel. If time is limited,move on to step D. The cresol red and sucrose in the primer mix function as loading dye so that amplifiedsamples can be loaded directly into gels.
1. Use a micropipet with a fresh tip to load 5 µL of your PCR sample/loading dye mixture into yourassigned well of a 2% agarose gel. Expel any air from the tip before loading, and be careful not to pushthe tip of the pipet through the bottom of the sample well. Be sure not to get any mineral oil in your tip.
2. Load 20 µL of the pBR322/BstNI size markers into one lane of the gel.
3. Electrophorese at 130 volts for 20–30 min. Adequate separation will have occurred when the cresol reddye front has moved at least 50 mm from the wells.
4. Gels may be stained with CarolinaBLU™ for 20 min and destained with distilled or deionized water for30–45 min (optimum visualization with CarolinaBLU™ is achieved by destaining overnight in a smallvolume of distilled or deionized water); alternatively, gels may be stained with 1 µg/mL ethidiumbromide for 10–20 min.
Procedure D: Restriction Digest PCR Products1. Use a micropipet with a fresh tip to add 15 µL of your mtDNA PCR product to a fresh
1.5-mL reaction tube.
2. Use a fresh tip to add 2.25 µL of 10× restriction buffer to the reaction tube.
3. Use a fresh tip to add 2.25 µL of 10× BSA buffer to the reaction tube.
4. Use a fresh tip to add 9.5 µL of dH2O to the reaction tube.
5. Use a fresh tip to add 1 µL of MseI to the reaction tube.
6. Pool the reagents by pulsing in a microcentrifuge or by sharply tapping the tube bottom on the lab bench.
7. Label the cap of your tube with a number, as assigned by your teacher. In this way, your results will be anonymous.
8. Incubate the mtDNA PCR digest at 37ºC for 60 minutes. Alternatively, this digest can be left to incubate overnight.
31
6 © 2 0 0 4 C a r o l i n a B i o l o g i c a l S u p p l y C o m p a n y
Procedure E: Load and Electrophorese mtDNA PCR Digests1. Use a micropipet with a fresh tip to add 3 µL of 10× loading dye to your mtDNA PCR digest tube.
2. Use a micropipet with a fresh tip to add the entire mtDNA PCR digest sample/loading dye mixture (33 µL) into your assigned well of a 2% agarose gel. Expel any air from the tip before loading, and becareful not to push the tip of the pipet through the bottom of the sample well.
3. Load 20 µL of the pBR322/BstNI size markers into one lane of the gel.
4. Electrophorese at 130 volts for 20–30 min. Adequate separation will have occurred when the cresol reddye front has moved at least 50 mm from the wells.
5. Gels may be stained with CarolinaBLU™ for 20 min and destained with distilled or deionized water for30–45 min (optimal visualization with CarolinaBLU™ occurs after destaining the gel overnight in a smallamount of distilled or deionized water); alternatively, gels may be stained with 1 µg/mL ethidiumbromide for 10–20 min.
Results and Discussion1. Observe the photograph of the stained gel containing your PCR digest and those from other students.
Orient the photograph with the sample wells at the top. Interpret the band(s) in each lane of the gel:
a. Scan across the photograph to get an impression of what you see in each lane. You should notice that student lanes contain one of two possible restriction patterns. Note: Occasionally, you may see other patterns as well.
b. Now locate the lane containing the pBR322/BstNI markers. Working from the well, locate the bands corresponding to each restriction fragment in the marker: 1857 bp, 1058 bp, 929 bp, 383 bp, and 121 bp (the last band may be faint or not visible). The expected DNA fragments, in base pair, for the+MseI haplotype are: 298, 288 (not separable from 298 on an agarose gel), 253, 161, 41, and 38 (not separable from 41 on an agarose gel). The expected DNA fragments, in base pair, for the –MseI haplotype are: 541, 298, 161, 41, and 38 (not separable from 41 on an agarose gel).Note: The 41 and 38 bp bands may not be visible on your gel.
+ MseΙ – MseΙ

32
7 © 2 0 0 4 C a r o l i n a B i o l o g i c a l S u p p l y C o m p a n y
2. How would you use the size marker to interpret your restriction pattern fragment sizes?
3. Do you have the MseI restriction site in your mitochondrial genome at nucleotide position 16,297? How can you tell?
4. The mt control region mutates at approximately 10 times the rate of nuclear DNA. Propose a biologicalreason for the high mutation rate of mtDNA.
5. The high mutability of the mt control region genome means that it evolves more quickly than thenuclear genome. This makes the mt control region a laboratory for the study of DNA evolution.However, can you think of any drawbacks to this high mutation rate with respect to studying evolution?
6. What is the frequency of each haplotype in your class?

33
7. What does this tell you about how different people in the class may be related? Are you surprised bywhat you find?
8. How are mitochondrial restriction haplotypes limited in investigating genetic relationships and human evolution?
Further ReadingBloom, M. 1994. Polymerase Chain Reaction. Carolina Tips 57: 13–18.
Bloom, M., G. Freyer, and D. Micklos. 1995. Laboratory DNA Science. Benjamin/Cummings, Menlo Park, CA.
Cann, R.L., W. M. Brown, and A. C. Wilson. 1984. Polymorphic sites and the mechanism of evolution inhuman mitochondrial DNA. Genetics 106(3): 479–499.
Kreuzer, H., and A. Massey. 2001. Recombinant DNA and Biotechnology: A Guide for Teachers. AmericanSociety for Microbiology Press, Washington, DC.
Micklos, D., and G. Freyer. 2003 (2nd Edition). DNA Science, a First Course. Cold Spring Harbor LaboratoryPress, Cold Spring Harbor, NY.
Mullis, K. 1990. The unusual origin of the Polymerase Chain Reaction. Scientific American 262(4): 56–65.
National Research Council. 1996. The Evaluation of Forensic DNA Evidence. National Academy Press,Washington, DC.
Zischler, H., H. Geisert, A. von Haeseler, and S. Paabo. 1995. A nuclear ‘fossil’ of the mitochondrial D-loopand the origin of modern humans. Nature, vol. 378(6556):489–92.
Carolina Biological Supply Company2700 York Road • Burlington, NC 27215
800.334.5551 • www.carolina.comCB000000000