human-nonhuman animal relationships in australia: an … · sydney ble m bane isr b h tre p dela...
TRANSCRIPT

Human-Nonhuman Animal Relationships in Australia: An Overview of Results
from the First National Survey and Follow-up Case Studies 2000-2004
Adrian Franklin1
University of Tasmania, Hobart, Tasmania, Australia
Abstract Th is paper provides an overview of results from an Australian Research Council-funded project “Sentiments and Risks: Th e Changing Nature of Human-Animal Relations in Australia.” Th e data discussed come from a survey of 2000 representative Australians at the capital city, state, and rural regional level. It provides both a snapshot of the state of involvement of Australians with nonhuman animals and their views on critical issues: ethics, rights, animals as food, risk from animals, native versus introduced animals, hunting, fishing, and companionate relations with animals. Its data point to key trends and change. Th e changing position of animals in Australian society is critical to under-stand, given its historic export markets in meat and livestock, emerging tourism industry with its strong wildlife focus, native animals’ place in discourses of nation, and the centrality of animal foods in the national diet. New anxieties about risk from animal-sourced foods and the endangerment of native animals from development and introduced species, together with tensions between animals’ rights and the privileging of native species, contribute to the growth of a strongly contested animal politics in Australia.
Keywords Animals, Australia, human-nonhuman relationships, companion animals, wildlife, national survey
Introduction
Th is paper is based on the first national study of human-nonhuman animals’ relationships ever conducted in Australia. Of course it is not the first study to collect data on human-animal relationships; however, it is the first comprehen-sive survey that spans relationships with companion species, wildlife, sporting species, food species, “risk” species as well as key topics such as ethics, rights, and animal-related social movements and politics. Th at such a survey was conducted in Australia ought not to be surprising:
Society and Animals 15 (2007) 7-27
© Koninklijke Brill NV, Leiden, 2007 DOI: 10.1163/156853007X169315
www.brill.nl/soan
S & A 15,1_f3_6-27.indd 7S & A 15,1_f3_6-27.indd 7 2/13/07 1:29:39 PM2/13/07 1:29:39 PM

8 A. Franklin / Society and Animals 15 (2007) 7-27
1. Historically, the Australian economy has been supported strongly by its meat and livestock industries;
2. Increasingly, animals and wildlife feature in Australian tourism marketing; 3. Australia faces the possibility of at least a similar range of significant
animal-related risks as have occurred elsewhere; and 4. Tensions over the eradication policies for introduced animals have pro-
duced conflict in Australian environmental politics.
Our findings confirm that animals form a backcloth to a great deal of Australian life, both embodied and symbolic.
Th e study, an Australian Research Council (ARC)-funded project, “Senti-ments and Risks: Th e Changing Nature of Human-Animal Relations,” took place between 2000 and 2004. It combined a nationally representative survey of 2000 respondents with a series of case studies focused around veterinary practice and relationships with wildlife. Th e survey was conducted by phone with Aus-tralians over the age of 16, and we randomized the choice of respondent in each household by asking to speak with the person whose birthday was next. Th is guaranteed that all ages and genders are represented. We also created statistically representative interview targets for all capital cities and state rural areas. Th e main survey was administered by NCS Pearson, and the survey instrument was comprised of 13 key questions, 5 of which established key data on the type of animal with whom respondents shared their lives; 7 were Likert-type questions that investigated values and practices with respect to animals generally; and one question was comprised of a battery of sub-questions obtaining key social, eco-nomic, and demographic data. Th e overall response rate was 35% (calculated as a proportion of answered calls).
Keeping Nonhuman Animals
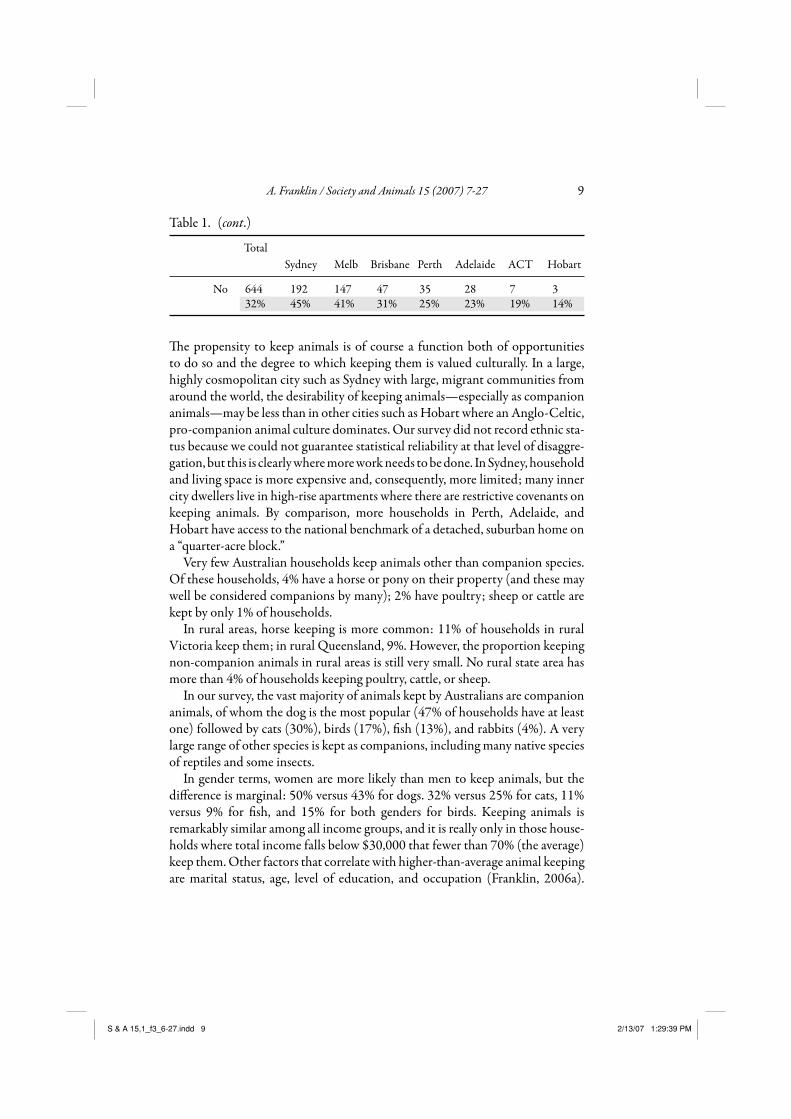
An overwhelming majority (68%) of Australians keep at least one animal on their property. Th e range of ownership is wide, from 55% in Sydney to 81% and 86%, respectively, in the Australian Capital Territory and Hobart (Table 1).
Table 1. Do You Keep Animals on Your Property?
Total Sydney Melb Brisbane Perth Adelaide ACT Hobart
Respondents 2000 430 361 153 140 122 36 21 100% 100% 100% 100% 100% 100% 100% 100% Yes 1356 238 214 106 105 94 29 18 68% 55% 59% 69% 75% 77% 81% 86%
S & A 15,1_f3_6-27.indd 8S & A 15,1_f3_6-27.indd 8 2/13/07 1:29:39 PM2/13/07 1:29:39 PM
A. Franklin / Society and Animals 15 (2007) 7-27 9
Table 1. (cont .)
Total Sydney Melb Brisbane Perth Adelaide ACT Hobart
No 644 192 147 47 35 28 7 3 32% 45% 41% 31% 25% 23% 19% 14%
Th e propensity to keep animals is of course a function both of opportunities to do so and the degree to which keeping them is valued culturally. In a large, highly cosmopolitan city such as Sydney with large, migrant communities from around the world, the desirability of keeping animals—especially as companion animals—may be less than in other cities such as Hobart where an Anglo-Celtic, pro-companion animal culture dominates. Our survey did not record ethnic sta-tus because we could not guarantee statistical reliability at that level of disaggre-gation, but this is clearly where more work needs to be done. In Sydney, household and living space is more expensive and, consequently, more limited; many inner city dwellers live in high-rise apartments where there are restrictive covenants on keeping animals. By comparison, more households in Perth, Adelaide, and Hobart have access to the national benchmark of a detached, suburban home on a “quarter-acre block.”
Very few Australian households keep animals other than companion species. Of these households, 4% have a horse or pony on their property (and these may well be considered companions by many); 2% have poultry; sheep or cattle are kept by only 1% of households.
In rural areas, horse keeping is more common: 11% of households in rural Victoria keep them; in rural Queensland, 9%. However, the proportion keeping non-companion animals in rural areas is still very small. No rural state area has more than 4% of households keeping poultry, cattle, or sheep.
In our survey, the vast majority of animals kept by Australians are companion animals, of whom the dog is the most popular (47% of households have at least one) followed by cats (30%), birds (17%), fish (13%), and rabbits (4%). A very large range of other species is kept as companions, including many native species of reptiles and some insects.
In gender terms, women are more likely than men to keep animals, but the difference is marginal: 50% versus 43% for dogs. 32% versus 25% for cats, 11% versus 9% for fish, and 15% for both genders for birds. Keeping animals is remarkably similar among all income groups, and it is really only in those house-holds where total income falls below $30,000 that fewer than 70% (the average) keep them. Other factors that correlate with higher-than-average animal keeping are marital status, age, level of education, and occupation (Franklin, 2006a).
S & A 15,1_f3_6-27.indd 9S & A 15,1_f3_6-27.indd 9 2/13/07 1:29:39 PM2/13/07 1:29:39 PM
10 A. Franklin / Society and Animals 15 (2007) 7-27
Households of married or de facto partners are more likely to keep animals, and those with children under the age of 18 are even more likely to keep an animal. Respondents between 30 and 55 years of age are more likely to keep animals than those younger than 30 or older than 50. Again, this seems to confirm that companion-animal keeping tends to link with the family or dependent children stage of the lifecycle and then to dwindle away. However, we should also note the high proportions (approximately 62%) of those in their 20s who keep ani-mals as well as those in their 70s (50%). In both groups, it is most likely that the animals were bought to assist their keepers in coping with new circum - stanc es, on or around leaving home or retiring. Indeed, dogs or cats kept by those aged 71-75 are—in almost every case—at least 10 years old. As we shall see, con-temporary lifestyles leave many Australians alone aft er long and rich periods of family living. We are very prone to loneliness these days, and significant animals are a remarkable substitute when it is just not feasible to surround ourselves with significant humans, (Soares, 1985; Wilson & Turner, 1998; Beck & Katcher, 1983; Katcher & Beck, 1983; Garrity, Stallones, Marx, & Johnson, 1988; Coun-cil for Science & Society, 1988; Salmon & Salmon, 1983) .
Th ere is also an interesting correlation between keeping animals and educa-tional attainment. Crudely, the lower the educational attainment of household members, the higher the proportion of households in which animals are kept. Th e range is quite significant as between 38% of those with doctorates and 79% of those with no educational attainments; however, this inverse relationship var-ies smoothly across the range of attainment levels. Th is is confirmed by data on occupations that show a difference between the unskilled blue-collar (79%) and the white-collar professionals (64%). Even the unemployed have above-average levels of animal keeping (74%), and this might be partly explained by their dis-proportionate origin from lower socio-economic groups where companion animal keeping is very popular and partly because they do have the time neces-sary to look aft er them. Th ese findings are at least consistent with what we dis-covered about involvements and values in what could be called the “animal politics” field. So, for example, the Wilderness Society (WS) runs a hard line on introduced animals who escape and become feral and on introduced animals generally. Almost 90% of the sample with doctorates and 78% of those who have tertiary qualifications were WS supporters. However, more than half the sample had either no qualifications or only school-leaving certificates; among those, only 57% were members of WS. Another way to look at this is by examining the results we obtained for attitudes to native animals around the home. Again, they show that the most highly educated take a pro-native animal position as com-pared with the less well-educated, particularly when it comes to action to keep native animals off their property.
S & A 15,1_f3_6-27.indd 10S & A 15,1_f3_6-27.indd 10 2/13/07 1:29:39 PM2/13/07 1:29:39 PM
A. Franklin / Society and Animals 15 (2007) 7-27 11
Hybrid Families?
Sociologists of contemporary societies such as Australia have documented increasing individualization, fragmentation of family and community, and frailty of the human bond—at all levels of society. Extensive loneliness in society and high degrees of ontological insecurity are widely reported (Giddens, 1984; Bau-man, 2003, Furedi, 2005).2 As Bauman (2000, 2003) has repeatedly claimed, human marriage, friendship, partnership, community ties, and even love have become insecure, ephemeral, and fugitive: In his own poetic words, they have become “until further notice.”
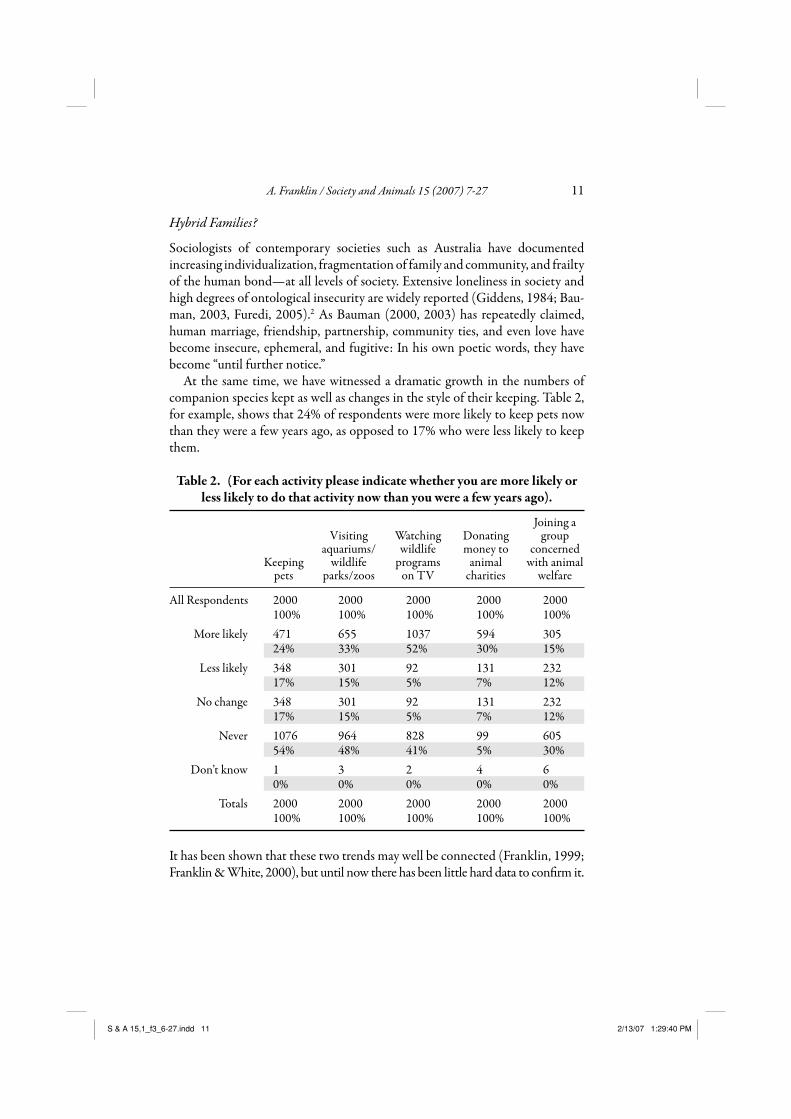
At the same time, we have witnessed a dramatic growth in the numbers of companion species kept as well as changes in the style of their keeping. Table 2, for example, shows that 24% of respondents were more likely to keep pets now than they were a few years ago, as opposed to 17% who were less likely to keep them.
Table 2. (For each activity please indicate whether you are more likely or less likely to do that activity now than you were a few years ago).
Joining a Visiting Watching Donating group aquariums/ wildlife money to concerned Keeping wildlife programs animal with animal pets parks/zoos on TV charities welfare
All Respondents 2000 2000 2000 2000 2000 100% 100% 100% 100% 100% More likely 471 655 1037 594 305 24% 33% 52% 30% 15% Less likely 348 301 92 131 232 17% 15% 5% 7% 12% No change 348 301 92 131 232 17% 15% 5% 7% 12% Never 1076 964 828 99 605 54% 48% 41% 5% 30% Don’t know 1 3 2 4 6 0% 0% 0% 0% 0% Totals 2000 2000 2000 2000 2000 100% 100% 100% 100% 100%
It has been shown that these two trends may well be connected (Franklin, 1999; Franklin & White, 2000), but until now there has been little hard data to confirm it.
S & A 15,1_f3_6-27.indd 11S & A 15,1_f3_6-27.indd 11 2/13/07 1:29:40 PM2/13/07 1:29:40 PM

12 A. Franklin / Society and Animals 15 (2007) 7-27
Th e data from the survey appear to further suggest that many Australian families have become hybridized: Th e constitution of family membership, the sharing of intimate household space, and the nature of companionability no longer seem exclusively human.
Table 3 shows where the animals belonging to my respondents are allowed in their homes. A lot of evidence (Franklin, forthcoming, 2006) points to a period in the mid-twentieth century when dogs and cats were largely kept outside. Th is is no longer true. Th e most intimate spaces previously exclusively reserved for humans are now shared with companion animals. More than 50% allow animals into their bedrooms; 75% of respondents allow animals into the family or lounge room; and almost 50% allow their animals on the furniture. Indeed, a minimum of more than one-third of all households allowed animals the full run of the house. Does this spatial shift register anything more important? I think it does.
Table 3. Where Are Animals Allowed in the Home?
In the In the In the On the room family or In back veranda/ In the In the where lounge In your childrens On the yard balcony laundry kitchen you eat room bedroom bedroom furniture
Yes 1277 1060 972 892 833 1028 707 468 647 95% 79% 72% 66% 62% 76% 52% 35% 48%
No 66 258 373 456 514 322 640 844 700 5% 19% 28% 34% 38% 24% 47% 63% 52%
Don’t know 7 32 5 2 3 3 38 3 3 1% 2% 0% 0% 0% 0% 3% 0% 0%
Totals 1350 1350 1350 1350 1350 1350 1350 1350 1350 100% 100% 100% 100% 100% 100% 100% 100% 100%
Table 4 shows that the vast majority of Australian adults have recruited an ani-mal for company; it is overwhelmingly so in the case of dogs (82%) and cats (79%). In a previous book (Franklin, 1999), I argued that those in Western Anglophone societies who have suffered family trauma and who find themselves alone and possibly socially and physically insecure or isolated oft en acquire com-panion animals, particularly dogs and cats. Divorce, separation, single parent-hood, economic depression, the migration of young people from country areas, and insecure local labor markets all serve to increase the numbers of people liv-ing alone or in households, stranded away from former kin. Th e numbers of lone or small household units has increased dramatically in the past 30 years, to the point where the building industry now builds for a different, lonelier demogra-
S & A 15,1_f3_6-27.indd 12S & A 15,1_f3_6-27.indd 12 2/13/07 1:29:40 PM2/13/07 1:29:40 PM

A. Franklin / Society and Animals 15 (2007) 7-27 13
phy. “According to U.S. Census Bureau projections, by 2010, 31 million Ameri-cans will be living alone, a 40% increase from 1980” (Schonwold, 2002). According to the BBC, “the independent Family Policy Studies Centre (FPSC) findings show that more than 6.5 million people in Britain—about 28% of households—now live on their own, 3 times as many as 40 years ago.” (Britain singled out, 2000).
Table 4. Why Keep Animals?
Amusement and entertainment of children 91 143 207 91 30% 24% 22% 45% For competitive showing 7 3 18 1 2% 1% 2% 0% For other competition or sport 3 2 16 1 1% 0% 2% 0% For work 4 4 54 1 1% 1% 6% 0% For security and protection 4 13 452 1% 2% 48% As company for yourself 153 468 775 25 50% 79% 82% 12% As company for children 112 259 410 32 37% 44% 43% 16%
In Australia, things are no different. In an Address to the Sydney Institute, Lindsay Tanner, MP for Melbourne, describes it as, “a crisis of loneliness.” (L. Tanner, personal communication, May 4, 1999), citing significant proportions of the elderly and young as being at risk. Th e latest survey on loneliness among Austra-lians aged 25-44—the group that has experienced the highest increase in solitary living—found that 16% of both men and women agreed with the statement, “I oft en feel lonely” (Flood, 2005, p. 11). However, 33% of men and 23% of women living alone reported feeling lonely oft en. Clearly, people believe that their lone-liness will be alleviated by animal companionship (and as I will show, compan-ionship is the single, biggest reason given for acquiring a dog, a cat, or a bird); indeed, the most sophisticated research using the “Revised UCLA Loneliness Scale” found that participants living entirely alone were more lonely than those living with pets.
S & A 15,1_f3_6-27.indd 13S & A 15,1_f3_6-27.indd 13 2/13/07 1:29:40 PM2/13/07 1:29:40 PM
14 A. Franklin / Society and Animals 15 (2007) 7-27
Even those who are currently setting up new households put off having chil-dren for longer and are far more likely to have no children or only one. Such households frequently buy dogs or cats to fill out their household, to provide a focus for their relationship, or to provide surrogate siblings for “only children.” Our survey data support the notion that pet keeping responds to transforma-tions in family and lifecycle change. In married and de facto households the pro-portion of dog owners who chose dogs for their company was 80%; in divorced or separated households, the proportion rose to 88%; in widowed households, to 90%; and among the retired, 91%. Similarly the divorced and separated are more likely to choose a dog for security and protection than are married/de facto households (Franklin, 2006a).
In Franklin (1999), I also argued that a number of indicators show that com-panion animals had been increasingly brought closer to their human friends in emotional and social terms, indeed, that they were now oft en reckoned to be part of the family. We therefore asked whether respondents considered any of their animals to be members of their families. Th is not only indicates the surro-gacy of animals for significant human relationships, but it also indicates a break-down in the perceived difference between humans and nonhumans.
We also asked about animals as family members because this ascription came up spontaneously and frequently in a series of focus groups conducted in advance of the national survey. Th is translation is commonly referred to as anthropomor-phism, or the attribution of human-like qualities to animals that are merely whimsical fantasies of the human imagination. Th is may be so, but it is not nec-essarily so. If people are merely extending to animals as animals, the notion of belonging and recognizing close bonds with them as equivalent to those within human families, then this is not a case of anthropomorphism; it is a case of hybridization, hybridization of the family.
Unproblematic similarities might include co-residence, enduring ties, emo-tional inter-dependence, friendship, company, and shared activities. Where this happens, it is important to realize that it is not a one-way, human-orchestrated attribution but one built of close feelings and emotions self evidently expressed also by the animals themselves. We see with birds—especially of the parrot and cockatiel family—emotions such as jealousy, dependence, and embodied prac-tices such as cuddling and kissing. Some of these of course are parrot expressions, translations of courtship, and pair-bonding behaviors that can be observed between parrots; however, the critical point is that some of them are not. Some of them are specific to the bonds between humans and animals, unique to them (Anderson, 2001; 2004). A good example of this is the vocal expressions between cats and humans. Cats are largely mute in their dealing with each other in the wild, but they seem to have learned of the significance of vocalization between
S & A 15,1_f3_6-27.indd 14S & A 15,1_f3_6-27.indd 14 2/13/07 1:29:40 PM2/13/07 1:29:40 PM

A. Franklin / Society and Animals 15 (2007) 7-27 15
humans and the fact that humans vocalize to them. Th e cat’s meow is the most significant (though it has many variations): Cats do not meow to each other. It is also true that the breeds who have been domesticated the longest are also the most vocal in their dealings with their human companions. According to Th e truth about cats and dogs (2003), “we really should understand cats better as they’ve gone to the trouble of developing special forms of communication just to talk to humans, using body language and vocalisation which they’d never use with other cats” (press release, no page number).
As Table 5 shows, the overwhelming majority of Australians did ascribe family membership to their pets. Th is may not be so new, but what seems to be new is the willingness to express it. As part of a follow-up study, 10 veterina rians were interviewed. One of the 10, a veterinarian in an affluent suburb in Sydney, had this to say about companion animals as substitute children or just children:
Well funny enough people are actually willing to admit that it’s a substitute child. Th ey’re not embarrassed to actually say that. A lot of them actually say it is a substi-tute child. I notice that—I don’t recall that so much in the past, but in recent years I have noticed that people actually refer to it as their child in many ways, you know. (Veterinarian 2)
Table 5. Animals as Members of the Family oy City (Do You Th ink of Any Animals You Keep as Members of Your Family?)
Total Sydney Melb Brisbane Perth
All Respondents 2000 430 361 153 140 100% 100% 100% 100% 100% Asked Respondents 1350 237 214 105 105 Yes 1188 199 196 95 99 % Asked Respondents 88% 84% 92% 90% 94% No 159 37 18 10 6 % Asked Respondents 12% 16% 8% 10% 6% Don’t know 3 3 % Asked Respondents 0% 1% Not asked 650 193 147 48 35 33% 45% 41% 31% 25% Totals 2000 430 361 153 140 100% 100% 100% 100% 100%
S & A 15,1_f3_6-27.indd 15S & A 15,1_f3_6-27.indd 15 2/13/07 1:29:41 PM2/13/07 1:29:41 PM

16 A. Franklin / Society and Animals 15 (2007) 7-27
On average, 88% thought that the animals they keep were part of their family, and this varied between the capital cities—from a low of 84% in Sydney to 94% in Hobart. Variation does not seem to range across an urban-rural continuum: For example, the figure was low in the ACT (78%), which is dominated by Can-berra, and high in rural Victoria (91%). Arguably, this signals something dra-matically new in family life in Australia, although clearly more qualitative work needs to be done to follow up these findings.
Wildlife
In Low (2003), it is clear that even the largest Australian cities are teeming with a wide range of wildlife; so it is not surprising that respondents confirmed this impression. Large numbers of respondents in east coast cities of all scales reported a broad range of localized wildlife. It is notable perhaps that snakes are experi-enced locally by more than half of our respondents.
Th e density of wildlife in ordinary Australians’ lives is further illustrated by Table 6, which shows the extent to which different species are tolerated, encouraged, or discouraged around their homes. More than half our sample actively encouraged birds and butterflies, 46% encouraged frogs, 38% encour-aged lizards, 23% encouraged wallabies and a further 34% encouraged other native animals.
Equally noteworthy is the degree to which some species that can cause prob-lems in homes and gardens are tolerated. Fift y-eight% of respondents tolerated bats, 50% tolerated kangaroos, 38% tolerated possums, 26% tolerated snakes, and 23% tolerated toads (of whom cane toads made up a large proportion). However, it was also toads who were most actively kept off home properties (69%). Snakes (71%), dogs (61%), and cats (61%) were significantly discouraged. Other orientations to wildlife are summarized in Table 7. In common with the main finding that Australians live cheek-by-jowl with animals, it is no surprise that 78% reported observing wildlife at least once in the past year; 50% reported observing frequently. More surprising, perhaps, is the extent to which feeding featured in interactions with animals: A total of 60% reported feeding wildlife at least once in the last year, with 32% feeding frequently. Th e data cannot be disag-gregated by species, but it is suspected that birds account for a large proportion of species fed. Next in order of significance is photographing wildlife. Altogether, 39% reported this activity in the past year, with 13% being frequent photogra-phers of wildlife.
One-third of the sample reported visits to wildlife parks, aquariums, and zoos at least once a year. Th at very few visited more than that suggests that it is pre-dominantly a vacation activity.
S & A 15,1_f3_6-27.indd 16S & A 15,1_f3_6-27.indd 16 2/13/07 1:29:41 PM2/13/07 1:29:41 PM

A. Franklin / Society and Animals 15 (2007) 7-27 17 Ta
ble 6
. N
ativ
e Ani
mal
s and
the H
ome
Type
of a
nim
al
O
ther
Butt
er-
na
tive
Ba
ts
Bird
s fli
es
Cat
s D
ogs
Frog
s K
anga
roo
Liza
rds
Poss
um
Snak
es
Toad
s W
alla
by
anim
al
R
espo
nden
ts
2000
20
00
2000
20
00
2000
20
00
2000
20
00
2000
20
00
2000
20
00
2000
10
0%
100%
10
0%
100%
10
0%
100%
10
0%
100%
10
0%
100%
10
0%
100%
10
0%
O
nly f
ound
loca
l are
a 85
6 19
80
1852
19
19
1920
13
11
410
1703
16
11
1185
72
9 39
1 10
41
En
cour
age
51
1231
97
0 11
3 13
1 60
3 88
64
7 23
7 29
33
90
35
7
% L
ocal
area
6%
62
%
52%
6%
7%
46
%
21%
38
%
15%
2%
5%
23
%
34%
To
lerat
e 49
3 67
1 83
3 62
6 60
8 57
1 20
3 94
8 61
3 30
6 17
1 19
1 47
1
% L
ocal
area
58
%
34%
45
%
33%
32
%
44%
50
%
56%
38
%
26%
23
%
49%
45
%
Tr
y to
keep
off
297
73
34
1170
11
66
130
115
99
298
844
503
105
152
%
Loc
al ar
ea
35%
4%
2%
61
%
61%
10
%
28%
6%
18
%
71%
69
%
27%
15
%
D
on’t
know
15
5
15
10
15
7 4
9 13
6
22
5 61
% L
ocal
area
2%
0%
1%
1%
1%
1%
1%
1%
1%
1%
3%
1%
6%
N/A
Not
foun
d
loca
l are
a 11
44
20
148
81
80
689
1590
29
7 38
9 81
5 12
71
1609
95
9
57
%
1%
7%
4%
4%
34%
80
%
15%
19
%
41%
64
%
80%
48
%
To
tal
2000
20
00
2000
20
00
2000
20
00
2000
20
00
2000
20
00
2000
20
00
2000
10
0%
100%
10
0%
100%
10
0%
100%
10
0%
100%
10
0%
100%
10
0%
100%
10
0%
S & A 15,1_f3_6-27.indd 17S & A 15,1_f3_6-27.indd 17 2/13/07 1:29:41 PM2/13/07 1:29:41 PM

18 A. Franklin / Society and Animals 15 (2007) 7-27
Tabl
e 7.
Ani
mal
s Rel
ated
Act
iviti
es
Pe
t
show
s
(cat
,
Fi
shin
g
do
g, et
c Pe
t
Visi
t
(riv
ers
Hun
ting
Hun
ting
Ph
oto-
as
sh
ows
Visi
t to
a V
isit
Fe
edin
g or
) Fi
shin
g H
orse
fe
ral
nativ
e O
bser
ving
gr
aphi
ng
com
pet-
(as
to an
w
ildlif
e to
a
wild
life
lake
s (s
ea)
ridin
g an
imal
s an
imal
s w
ildlif
e w
ildlif
e ito
r)
visit
or)
aqua
rium
pa
rk
zoo
Res
pond
ents
20
00
2000
20
00
2000
20
00
2000
20
00
2000
20
00
2000
20
00
2000
20
00
100%
10
0%
100%
10
0%
100%
10
0%
100%
10
0%
100%
10
0%
100%
10
0%
100%
Fr
eque
ntly
63
2 26
5 20
9 10
1 47
7
998
263
30
56
79
158
85
32%
13
%
10%
5%
2%
0%
50
%
13%
2%
3%
4%
8%
4%
A
t lea
st
on
ce
569
343
327
184
59
21
557
519
30
380
616
762
655
28%
17
%
16%
9%
3%
1%
28
%
26%
2%
19
%
31%
38
%
33%
N
ever
79
6 13
92
1464
17
15
1894
19
72
444
1216
19
40
1563
13
04
1076
12
59
40%
70
%
73%
86
%
95%
99
%
22%
61
%
97%
78
%
65%
54
%
63%
D
on’t
know
3
1
2
1 1
4 1
0%
0%
0%
0%
0%
0%
0%
To
tal
2000
20
00
2000
20
00
2000
20
00
2000
20
00
2000
20
00
2000
20
00
2000
10
0%
100%
10
0%
100%
10
0%
100%
10
0%
100%
10
0%
100%
10
0%
100%
10
0%
S & A 15,1_f3_6-27.indd 18S & A 15,1_f3_6-27.indd 18 2/13/07 1:29:41 PM2/13/07 1:29:41 PM
A. Franklin / Society and Animals 15 (2007) 7-27 19
Although pet shows are not a major draw, they did attract approximately one-fift h of the respondents over the past year, most likely to annual, regional, rural Show days, where they have had a presence at least for the past 60 years.
Consumptive wildlife activities (fishing, hunting) are less significant, although 56% of our sample fished at least once in the past year, and 23% reported being more serious anglers. Hunting is done by a tiny minority of men. Only 2% hunted feral animals frequently; a further 3% hunted at least once. Although a total of 107 respondents hunted feral or introduced species, only 8 hunted native species.
Risk
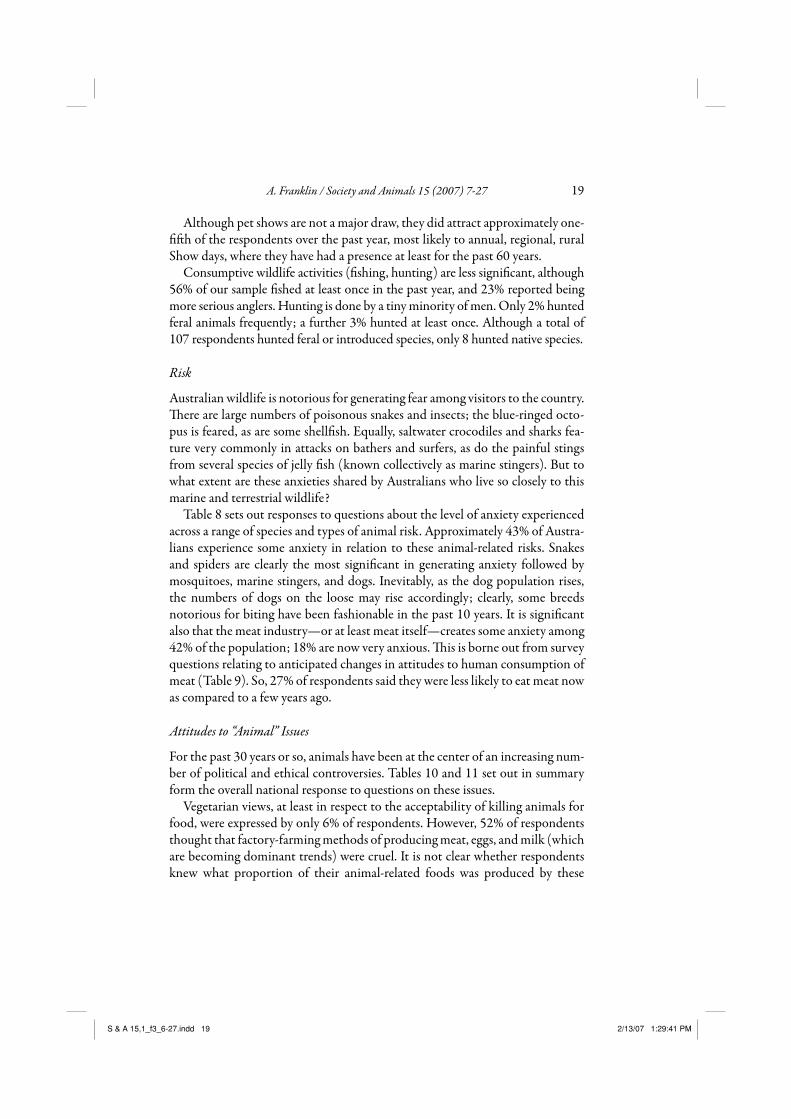
Australian wildlife is notorious for generating fear among visitors to the country. Th ere are large numbers of poisonous snakes and insects; the blue-ringed octo-pus is feared, as are some shellfish. Equally, saltwater crocodiles and sharks fea-ture very commonly in attacks on bathers and surfers, as do the painful stings from several species of jelly fish (known collectively as marine stingers). But to what extent are these anxieties shared by Australians who live so closely to this marine and terrestrial wildlife?
Table 8 sets out responses to questions about the level of anxiety experienced across a range of species and types of animal risk. Approximately 43% of Austra-lians experience some anxiety in relation to these animal-related risks. Snakes and spiders are clearly the most significant in generating anxiety followed by mosquitoes, marine stingers, and dogs. Inevitably, as the dog population rises, the numbers of dogs on the loose may rise accordingly; clearly, some breeds notorious for biting have been fashionable in the past 10 years. It is significant also that the meat industry—or at least meat itself—creates some anxiety among 42% of the population; 18% are now very anxious. Th is is borne out from survey questions relating to anticipated changes in attitudes to human consumption of meat (Table 9). So, 27% of respondents said they were less likely to eat meat now as compared to a few years ago.
Attitudes to “Animal” Issues
For the past 30 years or so, animals have been at the center of an increasing num-ber of political and ethical controversies. Tables 10 and 11 set out in summary form the overall national response to questions on these issues.
Vegetarian views, at least in respect to the acceptability of killing animals for food, were expressed by only 6% of respondents. However, 52% of respondents thought that factory-farming methods of producing meat, eggs, and milk (which are becoming dominant trends) were cruel. It is not clear whether respondents knew what proportion of their animal-related foods was produced by these
S & A 15,1_f3_6-27.indd 19S & A 15,1_f3_6-27.indd 19 2/13/07 1:29:41 PM2/13/07 1:29:41 PM
20 A. Franklin / Society and Animals 15 (2007) 7-27
Tabl
e 8.
Ani
mal
s and
Ris
k (P
leas
e Tel
l Me W
heth
er Y
ou F
eel A
nxio
us ab
out t
he F
ollo
win
g R
isks
)
Type
of r
isk
Stin
gs
or b
ites
Stin
gs
Stin
gs
Stin
gs
A
ttac
k A
ttac
k fro
m
or b
ites
or b
ites
or b
ites
Dise
ase
Mos
quito
D
iseas
e D
iseas
e
Att
ack
by fa
rm
by n
ativ
e M
arin
e fro
m
from
fro
m
carr
ied
born
ca
rrie
d in
anim
al
by d
og
anim
al
anim
als
sting
ers
Snak
es
Spid
ers
Mos
quito
es
in m
eat
dise
ases
by
pet
s dr
oppi
ngs
Res
pond
ents
20
00
2000
20
00
2000
20
00
2000
20
00
2000
20
00
2000
20
00
100%
10
0%
100%
10
0%
100%
10
0%
100%
10
0%
100%
10
0%
100%
Ve
ry an
xiou
s 31
6 79
13
0 30
3 69
5 65
8 29
5 36
1 45
2 18
6 21
0
16
%
4%
7%
15%
35
%
33%
15
%
18%
23
%
9%
11%
Qui
te an
xiou
s 60
3 21
3 30
2 64
2 51
7 61
5 55
7 47
3 70
9 47
1 50
8
30
%
11%
15
%
32%
26
%
31%
28
%
24%
35
%
24%
25
%
N
ot an
xiou
s 10
69
1688
15
49
1037
77
8 72
0 11
43
1142
82
5 13
32
1260
53
%
84%
77
%
52%
39
%
36%
57
%
57%
41
%
67%
63
%
D
on’t
know
12
20
19
18
10
7
5 24
14
11
22
1%
1%
1%
1%
1%
0%
0%
1%
1%
1%
1%
To
tal
2000
20
00
2000
20
00
2000
20
00
2000
20
00
2000
20
00
2000
10
0%
100%
10
0%
100%
10
0%
100%
10
0%
100%
10
0%
100%
10
0%
S & A 15,1_f3_6-27.indd 20S & A 15,1_f3_6-27.indd 20 2/13/07 1:29:42 PM2/13/07 1:29:42 PM

A. Franklin / Society and Animals 15 (2007) 7-27 21Ta
ble 9
. (F
or ea
ch ac
tivit
y ple
ase i
ndic
ate w
heth
er yo
u ar
e mor
e lik
ely
or le
ss li
kely
to d
o th
at ac
tivit
y now
than
you
wer
e a fe
w ye
ars a
go).
Eatin
g fish
Ea
ting
mea
t
Buyi
ng
free r
ange
eg
gs
Buyi
ng
prod
ucts
th
at h
ave
been
te
sted
on
anim
als
Fish
ing
Hun
ting
Kee
ping
pe
ts
Visi
ting
aqua
rium
s/w
ildlif
e pa
rks/
zoos
Wat
chin
g w
ildlif
e pr
ogra
ms
on T
V
Don
atin
g m
oney
to
anim
al
char
ities
Join
ing
a gro
up
conc
erne
d w
ith
anim
al
wel
fare
All
Res
pond
ents
20
00
2000
20
00
2000
20
00
2000
20
00
2000
20
00
2000
20
00
100%
10
0%
100%
10
0%
100%
10
0%
100%
10
0%
100%
10
0%
100%
M
ore l
ikel
y 71
3 22
5 96
3 68
28
2 32
47
1 65
5 10
37
594
305
36%
11
%
48%
3%
14
%
2%
24%
33
%
52%
30
%
15%
Le
ss li
kely
12
4 53
8 85
74
2 37
5 28
7 34
8 30
1 92
13
1 23
2
6%
27
%
4%
37%
19
%
14%
17
%
15%
5%
7%
12
%
N
o ch
ange
12
4 53
8 85
74
2 37
5 28
7 34
8 30
1 92
13
1 23
2
6%
27
%
4%
37%
19
%
14%
17
%
15%
5%
7%
12
%
N
ever
11
05
1202
76
3 64
1 77
4 25
3 10
76
964
828
99
605
55%
60
%
38%
32
%
39%
13
%
54%
48
%
41%
5%
30
%
D
on’t
know
1 28
11
3 1
1 1
3 2
4 6
0%
0%
1%
6%
0%
0%
0%
0%
0%
0%
0%
To
tals
2000
20
00
2000
20
00
2000
20
00
2000
20
00
2000
20
00
2000
10
0%
100%
10
0%
100%
10
0%
100%
10
0%
100%
10
0%
100%
10
0%
S & A 15,1_f3_6-27.indd 21S & A 15,1_f3_6-27.indd 21 2/13/07 1:29:42 PM2/13/07 1:29:42 PM

22 A. Franklin / Society and Animals 15 (2007) 7-27
Tabl
e 10.
Att
itude
s to
Ani
mal
Issu
es
It is
quite
ac
cept
able
to
eat m
eat s
o lo
ng as
the
anim
als a
re
rear
ed an
d ki
lled
hum
anel
y
Th e m
eat
prod
uctio
n an
d pr
oces
sing
indu
strie
s can
be
trus
ted
to
ensu
re th
e sa
fety
of t
he
mea
t pro
duct
Mod
ern
met
hods
of
“fac
tory
fa
rmin
g”
in th
e pr
oduc
tion
of
eggs
, milk
and
mea
t are
un
natu
ral
Mod
ern
met
hods
of
“fac
tory
f a
rmin
g” in
the
prod
uctio
n of
eg
gs, m
ilk an
d m
eat a
re cr
uel
It is
wro
ng to
us
e nat
ive
Aus
tral
ian
anim
als s
uch
as
Kan
garo
o an
d W
alla
by as
fo
od
Peop
le w
ho ar
e ki
lled
or
inju
red
by
anim
als h
ave
usus
ally
br
ough
t the
ir m
isfor
tune
on
them
selv
es
Hun
ting i
s an
exte
nsio
n of
na
tura
l pr
oces
ses t
hat
take
pla
ce in
th
e wild
and
is th
eref
ore q
uite
ac
cept
able
All
Res
pond
ents
20
00
2000
20
00
2000
20
00
2000
20
00
100%
10
0%
100%
10
0%
100%
10
0%
100%
St
rong
ly ag
ree
520
191
293
380
241
301
86
26%
10
%
15%
19
%
12%
15
%
4%
A
gree
13
44
1067
71
2 66
8 47
8 97
5 52
6
67
%
53%
36
%
33%
24
%
49%
26
%
D
isagr
ee
90
493
676
691
964
488
842
5%
25%
34
%
35%
48
%
24%
42
%
Stro
ngly
disa
gree
26
12
8 11
4 98
24
1 82
45
5
1%
6%
6%
5%
12
%
4%
23%
Hav
e no
opin
ion/
DK
20
12
1 20
5 16
3 76
15
4 91
1%
6%
10
%
8%
4%
8%
5%
To
tal
2000
20
00
2000
20
00
2000
20
00
2000
10
0%
100%
10
0%
100%
10
0%
100%
10
0%
S & A 15,1_f3_6-27.indd 22S & A 15,1_f3_6-27.indd 22 2/13/07 1:29:42 PM2/13/07 1:29:42 PM

A. Franklin / Society and Animals 15 (2007) 7-27 23Ta
ble 1
1. A
ttitu
des t
o A
nim
al Is
sues
It is
quite
ac
cept
able
to
hunt
fera
l an
imal
s suc
h as
pi
gs an
d w
ild
hors
es th
at
degr
ade t
he
envi
ronm
ent
It is
wro
ng
to h
unt
nativ
e A
ustr
alia
n an
imal
s
Fish
ing f
or
recr
eatio
n is
mor
e acc
ept-
able
than
hu
ntin
g for
re
crea
tion
Kee
ping
an
imal
s as
pet
s is
unna
tura
l and
de
mea
ning
to
both
the
hum
ans a
nd
the a
nim
al
Peop
le w
ho
mist
reat
thei
r an
imal
s sh
ould
be
puni
shed
in
the s
ame w
ay as
pe
ole w
ho
mist
reat
Ani
mal
s sh
ould
hav
e th
e sam
e m
oral
righ
ts as
hu
man
bei
ngs
It is
right
to
use a
nim
als
for m
edic
al
testi
ng if
it
mig
ht sa
ve
hum
an li
ves
A
ll R
espo
nden
ts
2000
20
00
2000
20
00
2000
20
00
2000
10
0%
100%
10
0%
100%
10
0%
100%
10
0%
St
rong
ly ag
ree
392
701
396
44
908
293
152
20%
35
%
20%
2%
45
%
15%
8%
A
gree
95
3 71
7 11
58
166
772
799
949
48%
36
%
58%
8%
39
%
40%
47
%
D
isagr
ee
428
381
319
958
245
675
529
21%
19
%
16%
48
%
12%
34
%
26%
St
rong
ly d
isagr
ee
147
125
62
756
50
125
242
7%
6%
3%
38%
3%
6%
12
%
Hav
e no
opin
ion/
DK
80
76
65
76
25
40
8 12
8
4%
4%
3%
4%
1%
20
%
6%
To
tal
2000
20
00
2000
20
00
2000
20
00
2000
10
0%
100%
10
0%
100%
10
0%
100%
10
0%
S & A 15,1_f3_6-27.indd 23S & A 15,1_f3_6-27.indd 23 2/13/07 1:29:42 PM2/13/07 1:29:42 PM
24 A. Franklin / Society and Animals 15 (2007) 7-27
methods or—if they did know—what proportion of those respondents would continue to eat such foods. However, that is a moot question. Even so, more than 30% of respondents felt that the production and processing industries could not be trusted to ensure the safety of meat, adding to the controversy and doubt sur-rounding what was once felt to be a foundational aspect of Australian life: His-torically, by global standards, Australians are very high consumers of meat (Franklin, 1999, p. 151).
Th ere is a degree of ambiguity surrounding the position of native animals in Australia, at least as far as their consumption is concerned. On the one hand, they are totemic of Australian nationhood, and there is a strong conservation impulse. Th is is borne out when 71% of respondents agree that it is wrong to hunt native animals. On the other hand, many native animal species are abun-dant and oft en experience localized population explosions. Th is may account for the relatively small number of Australians (36%) who agree that it is wrong to use native animals such as wallabies and kangaroos as food. However, it does of course depend on the native species concerned. Fishing for recreation is a good deal more acceptable (it is acceptable to 78% of respondents) than hunting for recreation.
Relatively few Australians (10%) are supportive of the claim by some animal rights writers that pet keeping is demeaning, but a solid majority (55%) agreed with the proposition that animals should have the same moral rights as human beings. Moreover, the proportion who thinks this has increased since this ques-tion was asked the first time in 1993. Back then, only 42% of Australians agreed with the proposition (Zentralarchiv für empirische, 1995).
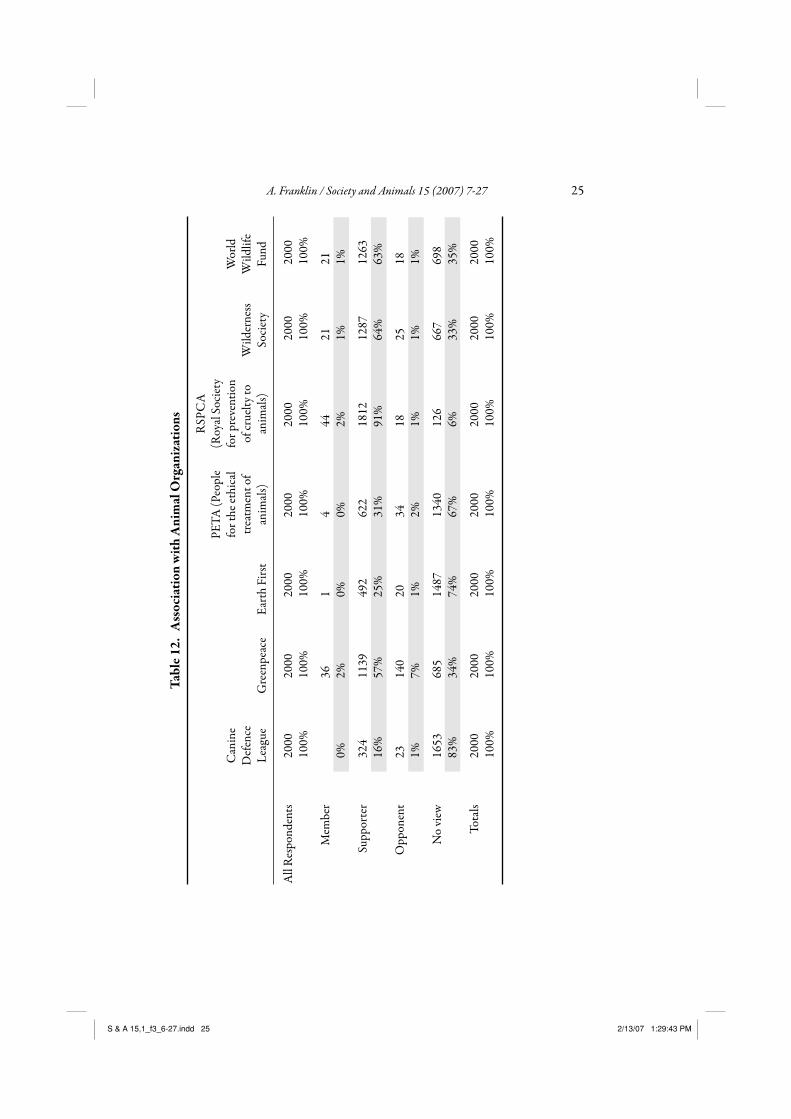
Th e unanticipated growth in this animal rights orientation makes sense when we look at data from questions relating to membership and support for a variety of animal organizations. Table 12 demonstrates that a large proportion of sup-port goes to those organizations that do uphold and represent some, albeit lim-ited, animal rights principles. Th e Royal Society for the Prevention of Cruelty to Animals, which fought to save the introduced wild horse, or Brumby, from erad-ication by aerial shooting in Guy Fawkes River National Park, New South Wales, is the most significant organization among our respondents: Of our respondents, 2% were members; 91% were supporters. On the other hand, the Wilderness Society, which does not support the notion of animal rights but instead privi-leges the rights of native over introduced species, has only 1% respondent mem-bership and only 64% supporters.
Across all these organizations, there was only a very small proportion of mem-bers, but the support claimed by respondents was robust and opposition to them, negligible. As Table 9 shows, 15% of respondents felt they were more likely to join a group concerned with animal welfare than they had been in the past; 37% said they were less likely to buy products that had been tested on animals.
S & A 15,1_f3_6-27.indd 24S & A 15,1_f3_6-27.indd 24 2/13/07 1:29:42 PM2/13/07 1:29:42 PM
A. Franklin / Society and Animals 15 (2007) 7-27 25Ta
ble 1
2. A
ssoc
iatio
n w
ith A
nim
al O
rgan
izat
ions
Can
ine
Def
ence
Le
ague
G
reen
peac
e Ea
rth
Firs
t
PETA
(Peo
ple
for t
he et
hica
l tr
eatm
ent o
f an
imal
s)
RSP
CA
(R
oyal
Soc
iety
fo
r pre
vent
ion
of cr
uelty
to
anim
als)
W
ilder
ness
So
ciet
y
Wor
ld
Wild
life
Fund
All
Res
pond
ents
20
00
2000
20
00
2000
20
00
2000
20
00
100%
10
0%
100%
10
0%
100%
10
0%
100%
M
embe
r
36
1 4
44
21
21
0%
2%
0%
0%
2%
1%
1%
Su
ppor
ter
324
1139
49
2 62
2 18
12
1287
12
63
16%
57
%
25%
31
%
91%
64
%
63%
O
ppon
ent
23
140
20
34
18
25
18
1%
7%
1%
2%
1%
1%
1%
N
o vi
ew
1653
68
5 14
87
1340
12
6 66
7 69
8
83
%
34%
74
%
67%
6%
33
%
35%
To
tals
2000
20
00
2000
20
00
2000
20
00
2000
10
0%
100%
10
0%
100%
10
0%
100%
10
0%
S & A 15,1_f3_6-27.indd 25S & A 15,1_f3_6-27.indd 25 2/13/07 1:29:43 PM2/13/07 1:29:43 PM

26 A. Franklin / Society and Animals 15 (2007) 7-27
Conclusion
Th is paper has reported some of the key findings from a national survey of human-animal relationships in Australia. It suggests that Australia is quite typi-cal of trends in human-animal relationships observed in other Western societies, particularly in the extent to which emotional bonds between humans and com-panionate species have developed a familial, home-centered focus. Australians relate to animals in a number of spheres and with similar intensities noted for other countries (Franklin, 1999).
Australians live very closely with a wide range of wildlife, and this co-habita-tion extends into its large cities. Th eir relationships with wildlife are encouraging on the whole, and only a few species that cause problems are discouraged. Despite this degree of familiarity and contiguity, Australians are not complacent with regard to risks posed from dangerous, wild animals; a very significant proportion of them experience animal-related risk anxiety.
Although Australians are among the highest consumers of meat, recent con-cerns about ethics and risk issues have created a significant minority who appear to question established practices and change their own values and habits.
Australia is among those post-colonial countries in which there is a distinct biopolitical tension between native and introduced species. Although nativism (a totemic, pro-native stance) is pronounced and evident in a range of data collected in this survey, it is also true that a more generic animal rights trend can be detected both in terms of questions related to moral equivalence with humans and product testing and in terms of organizational support and membership.
Notes
1. Requests for reprints should be sent to Adrian S. Franklin, School of Sociology and Social Work, University of Tasmania, Private Bag 17, Hobart, Tasmania 7001 Australia. E-mail: [email protected]
2. According to Abercrombie, Hill and Turner (Th e Penguin Dictionary of Sociology, 2005), ontological security “refers to the security, order and regularity that people feel in their lives, which are likely to be most clearly experienced in a stable sense of personal identity over time”. Clearly, divorce, spatial mobility, labour market change and cultural change produce a churn-ing of ontological security or ontological insecurity.
References
Abercrombie, N., Hill, S., & Turner, B. (2005). Th e Penguin dictionary of sociology: Fift h edition. New York: Penguin.
Anderson, P. K. (2001) Th e social dimensions of avian companionship. Paper given to the 96th American Sociological Asociation, Anaheim, August 18-21, 2001.
S & A 15,1_f3_6-27.indd 26S & A 15,1_f3_6-27.indd 26 2/13/07 1:29:43 PM2/13/07 1:29:43 PM

A. Franklin / Society and Animals 15 (2007) 7-27 27
——. (2004). A bird in the house: An anthropological perspective on companion parrots, Society and Animals, 11(4), 1568-5306.
Bauman, Z. (2000). Liquid modernity. Cambridge: Polity. ——. (2003). Liquid love. Cambridge: Polity. Beck, A., & Katcher, A. (1983). Between pets and people: Th e importance of animal companionship.
New York: Putnam Publishing Group. Britain singled out as lonely nation. (2000, March 27). London: BBC News Council for Science and Society. (1988). Companion animals in society. Oxford, Oxford University
Press. Flood, M. (2005). Mapping loneliness in Australia. Canberra: Th e Australia Institute. Franklin, A. S. (1999). Animals and modern cultures. London: Sage. ——. (2006a). Animal nation: How animals made Australia. Sydney: University of NSW Press. ——. (2006b, forthcoming). Beware the dog: A posthumanist approach to housing. Housing, Th e-
ory and Society. Franklin, A. S., & White, R. D. (2001). Animals and modernity: Changing human-animal rela-
tions 1945-1998. Journal of Sociology, 37 (3) pp. 219-223. Furedi, F. (2005). Th e politics of fear. London: Continuum. Garrity, T. F., Stallones, L., Marx, M. B., & Johnson, T. P. (1988). Pet ownership and attachment as
supportive factors in the health of the elderly. Anthrozoös, 3 (1), 35-44. Garrity, T. F., & Stallones, L. (1998). Effects of pet contact on human well-being: Review of recent
research. In C. Wilson & D. Turner (Eds.), Companion animals in human health. Th ousand Oaks, CA: Sage.
Giddens, A. (1984). Th e constitution of society. Cambridge: Polity. Katcher, A. H., & Beck, A. M. (Eds.). (1983). New perspectives in our lives with companion animals.
Philadelphia: University of Pennsylvania Press. Low, T. (2003). New nature. Sydney: Penguin. Salmon, P. W., & Salmon, I. M. (1983). Who owns who: Psychological research into the human pet
bond in Australia. In A. H. Katcher & A. M. Beck (Eds.), New perspectives in our lives with com-panion animals. Philadelphia: University of Pennsylvania Press.
Schonwold, J. (2001) NIA will fund a study about loneliness, its physical risks. University of Chi-cago Chronicle, 21 (5), 5-9.
Soares, C. J. (1985). Th e companion animal in the context of the family system. Marriage and Fam-ily Review, 8 (1), 32-50.
Tanner, L. (1999) ‘Th e loneliness crisis: Address to the Sydney Institute’ http.www.lindsaytanner.com/archive/Th e Loneliness Crisis.doc
Th e truth about cats and dogs. (2003, May 14). [Press release] Auckland: Royal New Zealand Soci-ety for the Prevention of Cruelty to Animals.
Wilson, C., & Turner, D. (Eds.). (1998). Companion animals in human health. Th ousand Oaks, CA: Sage.
Zentralarchiv für empirische sozialforschung. (1995) Machine readable codebook. [za stut 2450], ISSP 1993 Environment. Köln: Zentralarchiv für Empirische Sozialforschung.
S & A 15,1_f3_6-27.indd 27S & A 15,1_f3_6-27.indd 27 2/13/07 1:29:43 PM2/13/07 1:29:43 PM

S & A 15,1_f4_28-42.indd 28S & A 15,1_f4_28-42.indd 28 2/13/07 1:30:51 PM2/13/07 1:30:51 PM