human perception and performance journal of experimental
TRANSCRIPT

Journal of Experimental Psychology:Human Perception and PerformanceDistractor Probability Changes the Shape of theAttentional TemplateJoy J. Geng, Nicholas E. DiQuattro, and Jonathan HelmOnline First Publication, April 20, 2017. http://dx.doi.org/10.1037/xhp0000430
CITATIONGeng, J. J., DiQuattro, N. E., & Helm, J. (2017, April 20). Distractor Probability Changes the Shape ofthe Attentional Template. Journal of Experimental Psychology: Human Perception andPerformance. Advance online publication. http://dx.doi.org/10.1037/xhp0000430
Distractor Probability Changes the Shape of the Attentional Template
Joy J. Geng, Nicholas E. DiQuattro, and Jonathan HelmUniversity of California, Davis
Theories of attention commonly refer to the “attentional template” as the collection of features in workingmemory that represent the target of visual search. Many models of attention assume that the templatecontains a veridical representation of target features, but recent studies have shown that the targetrepresentation is “shifted” away from distractor features in order to optimize their distinctiveness andfacilitate visual search. Here, we manipulated the probability of target-similar distractors during a visualsearch task in 2 groups, and separately measured the contents of the attentional template. We hypothe-sized that having a high probability of target-similar distractors would increase pressure to shift and/orsharpen the target representation in order to increase the distinctiveness of targets from distractors. Wefound that the high-similarity group experienced less distractor interference during visual search, but onlyfor highly target-similar distractors. Additionally, while both groups shifted the target representationaway from the actual target color, the high-similarity group also had a sharper representation of the targetcolor. We conclude that the contents of the attentional template in working memory can be flexiblyadjusted with multiple mechanisms to increase target-to-distractor distinctiveness and optimize atten-tional selection.
Public Significance StatementThe present study suggests that the features we look for during visual search are affected by thephysical properties of other objects in the visual world and their frequency. This work highlights theflexibility of our brains in tuning cognitive goals to the particularities of the current sensoryenvironment.
Keywords: attentional template, distractor probability, featured-based attention, visual search, distractorsuppression
Supplemental materials: http://dx.doi.org/10.1037/xhp0000430.supp
Current theories of visual attention refer to the collection oftask-related features held in working memory as the “attentionaltemplate” (Bundesen, 1990; Bundesen, Habekost, & Kyllingsbaek,2005; Carlisle, Arita, Pardo, & Woodman, 2011; Desimone &Duncan, 1995; Duncan & Humphreys, 1989). The template isthought to express attentional priority in visual areas by increasingthe gain of sensory neurons that encode relevant features(Martinez-Trujillo & Treue, 2004; Maunsell & Treue, 2006; Reyn-olds & Heeger, 2009; Treue & Martínez Trujillo, 1999). Gainmodulation increases the signal-to-noise ratio between targets anddistractors and therefore the contents of the attentional template
determine the efficiency of target selection (Eckstein, 1998; Eck-stein, Thomas, Palmer, & Shimozaki, 2000; Irons & Leber, 2016;Kim & Basso, 2008; Palmer, Verghese, & Pavel, 2000; Peltier &Becker, 2016; Verghese, 2001). The quality of the template rep-resentations is particularly important when target-to-distractorsimilarity is high and distractors tend to interfere with targetselection (Becker, 2010a; Duncan & Humphreys, 1989; Folk,Remington, & Johnston, 1992; Kiyonaga & Egner, 2016; Nagy &Sanchez, 2008; Wang, Miller, & Liu, 2015; Wolfe, 1994; Wolfe &Horowitz, 2004). Despite the importance of the template in deter-mining the success of attentional selection, little is known abouthow information within the attentional template is flexibly shapedin response to contextual pressures.
The expectation that information within the attentional templateshould be malleable to the sensory context is supported by evidencethat information in working memory (WM) is affected by temporallyor spatially adjacent perceptual information (Dubé, Zhou, Kahana, &Sekuler, 2014; Fischer & Whitney, 2014; Haberman & Whitney,2009; Kang, Hong, Blake, & Woodman, 2011; Kiyonaga & Egner,2016). For example, Dubé et al. (2014) found that the memory of twopotential test items shown in sequence is biased toward their averagewhen both items are held in working memory. Moreover, Kang et al.(2011) reported that the perceived direction of motion was influencedby concurrent motion information held in working memory. These
Joy J. Geng and Nicholas E. DiQuattro, Department of Psychology andCenter for Mind and Brain, University of California, Davis; JonathanHelm, Center for Mind and Brain, University of California, Davis.
This study was made possible by NSF Grant BCS-1230377-0. We thankNicole Cheng, Mursal Habibzadah, and Jessica Nguyen for their help indata collection. We also thank Risa Sawaki and Jeongmi Lee for theircomments.
Correspondence concerning this article should be addressed to Joy J.Geng, Center for Mind & Brain, University of California, Davis, CA95618. E-mail: [email protected]
Thi
sdo
cum
ent
isco
pyri
ghte
dby
the
Am
eric
anPs
ycho
logi
cal
Ass
ocia
tion
oron
eof
itsal
lied
publ
ishe
rs.
Thi
sar
ticle
isin
tend
edso
lely
for
the
pers
onal
use
ofth
ein
divi
dual
user
and
isno
tto
bedi
ssem
inat
edbr
oadl
y.
Journal of Experimental Psychology:Human Perception and Performance
© 2017 American Psychological Association
2017, Vol. 0, No. 999, 0000096-1523/17/$12.00 http://dx.doi.org/10.1037/xhp0000430
1

findings suggest that the contents of working memory are malleableand shape ongoing perception.
In addition, there is evidence that the malleability of represen-tations may enhance attentional selection by exaggerating the truetarget feature in order to increase its distinctiveness from distrac-tors. For example, Navalpakkam and Itti (2007) found that whensearching for a target line oriented at 55° among distractors lessthan 55°, the target was represented as being 60° in orientation.The contents of the attentional template were “distorted” to en-hance target-to-distractor distinctiveness. Similarly, Becker et al.(2010b) found that a “red” cue produced faster selection of an“orange” target when it appeared with “yellow” distractors. Theauthors proposed a relational model for attentional guidance thatencodes targets in relational terms to the distractors (e.g., the targetis the “reddest” or “greenest” object) instead of an absolute featurevalue. These findings demonstrate that information in the atten-tional template can be “shifted” to accentuate the feature elementsof the target that optimally distinguish it from distractors (Becker,Harris, Venini, & Retell, 2014), Such shifting along a dimensiondoes not occur when distractor features are sampled from bothsides of the target feature (Ansorge & Becker, 2014; Harris,Remington, & Becker, 2013).
In addition to shifting the target representation away fromdistractors, there is also evidence that more precise target repre-sentations facilitate attentional selection. Increased precision mayoccur in the form of greater target specificity. For example, searchperformance is better when an exact image of an object is given asthe search template compared to only a verbal name or a super-ordinate category label (Malcolm & Henderson, 2009; Vickery,King, & Jiang, 2005; Wolfe, Horowitz, Kenner, Hyle, & Vasan,2004), or a less precise (e.g., rotated image) of the same object(Hout & Goldinger, 2015).
In addition to target information, greater specificity can also bedue to information about distractors. For example, Arita, Carlisle,and Woodman (2012) found that presenting participants with aprecue of the distractor facilitated visual search compared to a“neutral” cue, although performance was still slower than witha target cue. This suggests that a “template for rejection” wasformed and used to guide attention away from predictable nontar-gets. Similarly, others have found that the strength of interferencefrom perceptually salient distractors diminished with repeated ex-posure, suggesting that rejection templates could be built fromexplicit instruction or learned implicitly over time (Becker, 2007;Gaspelin, Leonard, & Luck, 2015; Geng & DiQuattro, 2010; Geng,Blumenfeld, Tyson, & Minzenberg, 2015; Ruff & Driver, 2006;Sayim, Grubert, Herzog, & Krummenacher, 2010; Töllner, Conci,& Müller, 2015; Vatterott & Vecera, 2012).
Together, these results suggest that construction of a specific andprecise attentional template is critical for efficient search, but theremay be more than one way to increase the specificity and precision.Here, we test the hypothesis that the probability of target-similardistractors, modulate the contents of the attentional template. Statis-tical regularities are known to impact attentional priority (Chun &Jiang, 1998; Druker & Anderson, 2010; Drummond & Shomstein,2010; Geng & Behrmann, 2005; Jiang, Schmajuk, & Egner, 2012).Therefore, it is possible that a higher frequency of target-similardistractors would create more pressure to increase the distinctivenessof the target representation from experienced distractors. A strongeradjustment may be realized by a more extreme shift in the target
representation away from distractors as described by Navalpakkamand Itti (2007) and Becker et al. (2010), or it could result in asharpening the “tuning” of the target representation (Dosher & Lu,2000a, 2000b; Figure 1A). A sharper target template is more exclu-sive and would result in fewer target-similar distractors erroneouslymatching the target template and capturing attention.
Shifting and sharpening are two possible mechanisms for ad-justing the target template and are illustrated in Figure 1. Impor-tantly, however, the two are not mutually exclusive and a combi-nation of both mechanisms would lead to the most efficientselection of targets.
Experiment 1
The goal of the experiment was to determine if the probabilityof target-similar distractors affected performance in visual search.We hypothesized that a high probability of target-similar distrac-tors would produce less distractor interference from target-similardistractors, but did not expect differences between groups on trialswith target-dissimilar distractors, which are more easily sup-pressed in the first place. To test this hypothesis, we used atwo-part linear spline mixed model to analyze the data (Cudeck &Klebe, 2002). These models confer many advantages for analyzingbehavioral responses to continuous stimuli because they estimatemultiple parameters of nonlinear data. For this experiment, thecritical parameters of interest were the inflection, or “knot,” pointat which RTs reach asymptote; and the difference between pre-and post-knot slopes, which characterize the change in the strengthof competition as a function of the physical color of the distractor.
Method
Participants. Forty UC Davis undergraduates (17 male, oneleft-handed, ages 18–25) participated for class credit. Each pro-
Figure 1. Illustration of conceptual ways in which the attentional tem-plate may be adjusted. “Shifting” moves the template away from thedistractor set to increase dissimilarity between target and distractor.“Sharpening” produces a narrower shape that excludes distractor colorsfrom matching the template. In this example the distractor colors/shadesare positive values. See the online article for the color version of thisfigure.
Thi
sdo
cum
ent
isco
pyri
ghte
dby
the
Am
eric
anPs
ycho
logi
cal
Ass
ocia
tion
oron
eof
itsal
lied
publ
ishe
rs.
Thi
sar
ticle
isin
tend
edso
lely
for
the
pers
onal
use
ofth
ein
divi
dual
user
and
isno
tto
bedi
ssem
inat
edbr
oadl
y.
2 GENG, DIQUATTRO, AND HELM

vided written informed consent in accordance with the local ethicsclearance as approved by the National Institutes of Health. All hadnormal or corrected-to-normal vision.
Procedure. A fixation dot (subtending .25° of visual angle;black; .4 cd/m2) was centrally presented throughout the experimenton a gray background (28.6 cd/m2). Prior to the start of theexperiment an example of the target color was presented. Each trialbegan with the presentation of two circles (3° of visual angle indiameter) for 150 ms. One circle was always the target color andwas presented randomly at one of 6 locations along an imaginarycircle (radius of 4° of visual angle; target could appear at 60°in-tervals) while the distractor circle always appeared at the target’santipode location. Centrally located within each circle was a dis-crimination “t” (.5° of visual angle; black), which was orientedupright or inverted in the target-colored circle and rotated 90°to theleft or right in the distractor circle. Participants were instructed tolocate the target-colored circle and report the orientation of the “t”within it by pressing “j” for up and “n” for down with their righthand after which the participant was given auditory feedback(800hz tone for correct; 400z tone for incorrect). A central fixationdot was presented for 800–1,500 ms before the next trial began(Figure 2B). All stimuli were created and presented using Psy-choPy (Peirce, 2007, 2009).
The colors used for target and distractors are referred to by theirlocation on a color wheel defined in LAB color space (a, bcoordinates � 0, 0; luminance � 70; radius � 39; see Figure 5Afor illustration of color space). Four target colors (0°, 90°, 180°,270°) were counterbalanced across subjects with the distractorspace being constructed in steps of 5° from the target-color to 60°counterclockwise from the target color, resulting in 13 distractor
colors (see Figure 2A). This color space was chosen to avoidstrong canonical color values that might differently affect atten-tional processing (Fortier-Gauthier, Dell’acqua, & Jolicœur,2013). Analysis was collapsed across target colors such that dis-tractor colors were referred to by their relative difference from thetarget color (set to 0°). Prior to the beginning of the experiment,participants completed 15 practice trials to ensure understanding ofthe task. Participants were instructed to maintain their fixation onthe central dot throughout the experiment.
The presentation frequencies of distractor colors were based on atruncated normal distribution (M � 0, SD � 25, limited to between 0and 60) sampled 100,000 times independently for each participant tocreate 1,000 task trials (i.e., percentages based on 100,00 sampleswere applied to 1,000 trials). Participants were assigned to either the“high-similarity” group, which experienced distractor distributionsskewed toward the target color, or the “low-similarity” group, whichexperienced the mirror reversed frequencies (n � 20 for each group;see Figure 2C). Presentation frequency for an example high-similaritygroup subject was as follows: 0° � 12.9%, 5° � 12.48%, 10° �11.88%, 15° � 11.09%, 20° � 10.14%, 25° � 9.12%, 30° � 7.68%,35° � 6.58%, 40° � 5.5%, 45° � 4.56%, 50° � 3.49%, 55° �2.58%, 60° � 1.99%. The low-similarity group was reversed at the30° color (i.e., the percentage of trials at 30° was identical for bothgroups).
After the visual search task, participants completed independentcolor discrimination and categorization tasks. These tasks wereconducted to control for the possibility of between group differ-ences in the just noticeable difference (JND) and/or color catego-rization. There were no differences between groups in JND (over-all M � 3.51, SD � 2.04; t (73) � �0.8, p � .425) or color
Figure 2. A: Illustration of target colors (in bold) and corresponding distractor set for each subject. Distractor colorsare counterclockwise from the target color. B: Task design for Experiment 1. Participants were instructed to locate thetarget colored circle (pink in this example, located bottom-right in the Trial 1 illustration and top-right in the Trial 2illustration.) and report the orientation of the cross within (upright or inverted). Two visual search trials are shown toillustrate rotation of stimulus locations on a trial-by-trial basis. C: Presentation frequencies for each distractor color inthe high- and low-similarity groups. See the online article for the color version of this figure.
Thi
sdo
cum
ent
isco
pyri
ghte
dby
the
Am
eric
anPs
ycho
logi
cal
Ass
ocia
tion
oron
eof
itsal
lied
publ
ishe
rs.
Thi
sar
ticle
isin
tend
edso
lely
for
the
pers
onal
use
ofth
ein
divi
dual
user
and
isno
tto
bedi
ssem
inat
edbr
oadl
y.
3SHAPE OF THE ATTENTIONAL TEMPLATE

categorization (overall M � 25.05, SD � 5.07; t [76] � 0.27, p �.785), suggesting that the effects observed in the visual search taskwere not due to spurious differences in perceptual discriminabilityor category representations (see supplementary materials for a fulldescription of the discrimination and categorization tasks andresults).
Apparatus. Participants were seated in a sound attenuatedroom 70 cm away from a 24-in Dell LCD monitor with a spatialresolution of 1,900 � 1,200 pixels and a refresh rate of 60hz. Priorto the start of each trial, fixation of the centrally presented dot wasenforced for 100 ms via an Eyelink 1,000 (SR Research, ON)desk-mounted system sampling at 500 hz.
Statistical analysis. The primary analysis consisted of enter-ing reaction time (RT) from each trial into a two-part linear splinemixed model. Only RT data from correct trials after outlier re-moval were included in these analyses. The two-part spline modelestimates the location of a transition, or “knot,” point that demar-cates a change in the slope of a continuous measurement; more-over, the model identifies if the location of the knot point differssignificantly between experimental groups. Equation 1 gives themathematical model for estimating a two-part linear spline with anunknown transition, and equation 2 extends equation 1 by incor-porating the between experiment information (Cudeck & Klebe,2002). Equation 1 is written as
yit � b0 � �b1(colorit) if colorit � knotb1(colorit) � b2(colorit � knot) if colorit � knot (1)
Equation 1 has four fixed coefficients (b0, b1, b2 knot). Here, yit
refers to the RT of individual i in trial t, and colorit refers to thenumeric indicator for the color of the distractor stimulus forindividual i in trial t. Equation 1 may be conceptualized as atwo-part spline, or two straight lines with different slopes thatconnect at a single transition point. In this case, the transition pointis estimated from the data, and referred to in the model as knot.More specifically, if the value of colorit is less than knot, thenyict � b0 � b1�colorit�, which defines a linear relation betweencolorit and yit. On the other hand, if colorit is greater or equal toknot, then yit � b0 � b1�colorit� � b2�colorit � knot�, whichindicates that the linear function before the knot point (i.e., yit �b0 � b1�colorit�) is shifted by the new term (i.e., b2�colorit �knot�). For example, if knot � 4, b0 � 2 for individual i, b1 � 3,b2 � �3, then yit � 2 � 3�color� � 3�color � knot� for individuali. Thus, if color � {2, 3, 4, 5,6} then yit � {8, 11, 14, 14, 14},respectively. Therefore, for this specific case, there is a 3-unitincrease in yit before the knot for every 1 unit increase in colorit, andthere is a no increase in yit after the knot for every 1 unit increase incolorit. Generalizing the example, coefficient b0 refers to the averageestimate of yit for individual i when colorit equals to 5 (i.e., thedistractor is 5° from the target); b1 represents the slope before theestimated knot; and b2 indicates the change in the slope after the knot(i.e., the slope after the knot equals b1 � b2).
Extending equation 1 to include grouping information leads toequation 2,
yit � b0 � b0g(grpi)
� �(b1 � b1g(grpi))(colorit) if colorit � knot
(b1 � b1g(grpi))(colorit) � (b2 � b2g(grpi))
(colorit � (knot � bkg(grpi)))if colorit � knot
(2)
which is the same as equation 1 with four added coefficients (b0g,b1g, b2g, bkg,) and one added variable (grpi). Variable grpi equals0 for one group (in these experiments, the low-similarity group)and 1 for the other group (i.e., the high-similarity group). Themodel parameters are estimated directly for the reference group(i.e., the low-similarity group), and are estimated as changes fromthe reference group for the high-similarity group. Each of thecoefficients with subscript g refers to the difference between thelow-similarity group and the high-similarity group for a givencoefficient. Therefore, bkg, refers to the difference in the transitionpoint between conditions. All models were fitted within R (CoreTeam, 2015) using package nlme (Pinheiro, Bates, DebRoy,Sarkar, & Core Team, 2015).
The two-part spline model is a statistical model for describingthe visual search RT data. We use it to infer the presence ofchanges in performance as a function of distractor similarity andthe between-groups manipulation of probability. There is no the-oretical interpretation for the resulting “knot” points, as they areused to approximate the inflection point of a decay function. Thisprocedure is appropriate for our visual search data given the densesampling of distractor colors, which would otherwise be prone toincreased family wise error due to multiple comparisons of colordistractor pairs calculated between groups.
Results
Overall accuracy was high (M � .91, SD � .04), indicating thatparticipants understood the task. For RT, increasing distractordissimilarity produced a monotonic decline in RTs until a transi-tion point, after which RTs reached asymptote. RT1 data from thetwo groups were entered into equation 2, which allowed estimationof knot points, an intercept, pre- and post-knot slopes for eachgroup and the difference between them. The data from the 0condition was excluded because it involved two “targets”; how-ever, the data are plotted for reference (see Figure 3). Importantly,the knot point serves as a statistical analogue (not a theoreticalparameter) for the edge of the attentional template because itidentifies the point in color space after which distractor interfer-ence was minimal and remained constant. The distractor colors inthe “pre-knot” area are expected to interfere with task completion(lengthening RT), because they partially match the attentionaltemplate, while colors in the “post-knot” area are expected to causeminimal interference because they fall outside of the attentionaltemplate. We chose the low-similarity group as the reference levelin our model. This resulted in estimation of the knot and slopeparameters for the low-similarity group and estimation of thechange from those parameters in the high-similarity group. Be-cause the knot point is the parameter of primary interest, wedescribe the results for the knot point first, followed by the slopeparameters.
A significant knot point for the low-similarity group wasfound at color 16.30° [95% CI � .70], t (31438) � 45.97, p �.0001, with a significant change in knot point in the high-similarity group of �4.08° (equivalent to color 12.21°),
1 Identical models were run using log RT. The significance of eachparameter was identical to those reported for RT unless otherwise stated(see Exp. 3). We report the RT data in the main text in order to simplifyinterpretation of the absolute values.
Thi
sdo
cum
ent
isco
pyri
ghte
dby
the
Am
eric
anPs
ycho
logi
cal
Ass
ocia
tion
oron
eof
itsal
lied
publ
ishe
rs.
Thi
sar
ticle
isin
tend
edso
lely
for
the
pers
onal
use
ofth
ein
divi
dual
user
and
isno
tto
bedi
ssem
inat
edbr
oadl
y.
4 GENG, DIQUATTRO, AND HELM

t(31438) � �8.33, p � .00012 (Figure 3A). Performance in thehigh-similarity group reached an asymptote in RT earlier in colorspace compared to the low-similarity group. This indicates thatparticipants in the high-similarity group experienced less interferencefor the most target-similar distractor colors. Additionally, the interceptfor the high-similarity group was significantly smaller than the low-similarity group, t (31438) � �2.24, p � .02.
To confirm that the high-similarity group performed better onpre-knot distractor colors overall, RT and accuracy from eachgroup were averaged into high and low target-similarity distractorbins and entered into a 2 � 2 repeated measures ANOVA to testfor differences between group (low-similarity, high-similarity) andknot area (pre-knot, post-knot). This analysis is complementary toinformation derived from the intercept and knot-point estimates inthe spline model and addresses the question of whether perfor-mance in the high-similarity group was overall better on trials withhighly similar distractors compared to low-similarity distractorsusing standard random-effects analyses. To keep the number ofdistractor colors in each condition equivalent across groups, theknot point for the low-similarity group was used to divide the datasince it was the more inclusive threshold. We refer to the highlysimilar distractor bin as “pre-knot” and the low-similarity distrac-tor bin as “post-knot.”
For RT, there was a nonsignificant main effect of group, F(1,38) � 3.66, p � .063, �p
2 � .09, a significant main effect of knot
area, F (1, 38) � 107.25, p � .0001, �p2 � .74, and a significant
interaction, F (1, 38) � 14.56, p � .0005, �p2 � .27. Post hoc t tests
(using Bonferroni correction for two comparisons between groups)found a significant difference between groups in the pre-knot area,t (38) � 2.44, p � .019, d � .7, but not in the post-knot area, t(38) � 1.12, p � .267 (Figure 3B). For accuracy, we found nosignificant difference between groups, F (1, 38) � .69, p � .411,a significant difference between knot area, F (1, 38) � 36.06, p �.001, �p
2 � .49, and no significant interaction, F (1, 38) � 0.28,p � .60 (Figure 3C). These results showed that the high-similarity group responded faster on trials with target-similardistractors, but only for the pre-knot bin. Additionally, the lackof pre-knot differences in between group accuracy ruled out thepossibility of a speed–accuracy trade-off as the source of thedifference found in RT.
For the low-similarity group, a significant pre-knot slopeof �63.30, t (31,438) � �7.26, p � .001, was found as well as asignificant change in slope of 60.99 post-knot, t (31,438) � 6.91,p � .001. We found no between group differences in pre- orpost-knot slopes, all ts (31,438) � 0.79, all ps .437. Theseresults indicate that distractor interference decreased substantiallyas a function of physical similarity post-knot compared to pre-knotfor both groups.
Discussion
The goal of Experiment 1 was to determine if the frequency ofdistractor exposure affected visual search performance. Specifi-cally, we tested the hypothesis that the high-similarity group wouldperform better on target-similar distractor trials and this hypothesiswas confirmed. The knot point for the high-similarity group wassignificantly closer to the target-color than for the low-similaritygroup, demonstrating that a narrower region of the distractor colorspace interfered with target selection. This suggests that the com-petitive pressure of frequent target-similar distractors changed therepresentation of the target and distractors in order to better sup-press a greater range of distractors. Additionally, RT was overallshorter for the pre-knot distractors in the high-similarity group, butthere was no difference in post-knot RT between groups. Thissuggests that the pre-knot distractors (i.e., target-similar distrac-tors) were better suppressed when they were more frequent, butthere was no concomitant additional suppression of infrequentdissimilar distractors. The lack of a difference between groups forpost-knot distractors presumably occurred because those colorswere always highly distinct and poor competitors for attention.Together the results suggest that the contents of the attentionaltemplate were adjusted in response to frequent target-similar dis-tractors and this adjustment improved performance in the presenceof target-similar distractors (Folk & Remington, 1998). However,the template representation was not directly measured. Thus, weused a new task to independently measure the target template inExperiment 2, along with conducting a replication of the basicfindings from Experiment 1.
2 The same model was also run using a more conservative approach inwhich the degrees of freedom were calculated by the sample size minus thenumber of parameter estimates, that is, 32 (Bolger & Laurenceau, 2014).The significance value of each parameter was identical to the currentmodel. The same results were found in all three experiments.
Figure 3. A: Reaction time for each group and distractor color in Exper-iment 1. Lines are spline model fits. Note that the 0°data were excludedfrom the spline model (and ANOVAs plotted in BC) because both objectswere potential targets (i.e., there was no real distractor). Black circles arethe estimated knot points. B: Reaction time split into pre- and post-knotareas based on estimated knot point of the low-similarity group. C: Accu-racy split into pre- and post-knot areas based on estimated knot point of thelow similarity group. All error bars SEM. See the online article for thecolor version of this figure.
Thi
sdo
cum
ent
isco
pyri
ghte
dby
the
Am
eric
anPs
ycho
logi
cal
Ass
ocia
tion
oron
eof
itsal
lied
publ
ishe
rs.
Thi
sar
ticle
isin
tend
edso
lely
for
the
pers
onal
use
ofth
ein
divi
dual
user
and
isno
tto
bedi
ssem
inat
edbr
oadl
y.
5SHAPE OF THE ATTENTIONAL TEMPLATE

Experiment 2
Experiment 1 suggested that the contents of the attentionaltemplate were modulated based on distractor probability. How-ever, we did not measure the template directly and it was unknownwhether this modulation was due to a shifting of the target repre-sentation farther away from the distractor color space (Navalpak-kam & Itti, 2007), a sharpening of the target representation toexclude a wider range of nontarget colors, or some combination ofboth (see Figure 1). To address this in Experiment 2, we measuredthe participant’s internal representation of the target using a colorwheel on which they indicated the target color from a continuousdistribution. This allowed us to “probe” the attentional templatedirectly and determine participants’ representation of the targetcolor hue.
In addition, the target in the discrimination task in Experiment1 was not entirely independent of the target identity. The task wasto identify if a “t” stimulus was upright or inverted and distractorsalways contained a 90° rotated version of the “t.” It was thereforepossible that the between-groups difference in performance wasdue to the high-similarity group having learned to select the targetbased on the shape of the “t” instead of selecting the target bycolor. This would suggest that the target representation did notchange (as we had concluded), but that the dimension of informa-tion used to select the target changed. In order to confirm ourconclusions and replicate our previous findings (see Ledgerwood,2014; Nosek et al., 2015), the discrimination task in Experiment 2was adjusted so that the target could only be identified by color.
Method
Participants. Forty UC Davis undergraduates (nine male, twoleft-handed, ages 19–32) participated for class credit. Each pro-vided written informed consent in accordance with the local ethicsclearance as approved by the National Institutes of Health. All hadnormal or corrected-to-normal vision.
Procedure. All stimuli and procedures were identical to Ex-periment 1, except for the following changes to the discriminationtask. Instead of a “t,” one of three numbers was presented withineach circle without duplication (4, 5, or 6; subtending 1° of visualangle). Participants were instructed to report the number within thetarget-colored circle by pressing the matching key. On trials witha 0° distractor, a response for either number presented was con-sidered correct (Figure 4A).
After the visual search task, participants completed a second-ary task designed to measure the position of their target repre-sentation in color space (Figure 5A). On each trial a color wheel(7° of visual angle radius; 1.5° of visual angle thickness)defined by the same LAB space coordinates as described inExperiment 1 methods was displayed. The color wheel wasrandomly rotated on each presentation and remained on screenuntil response. Participants were instructed to report the targetcolor on the wheel by clicking on its location with a mouse. Acentral fixation dot was presented for 800 ms between trials.The task consisted of 15 trials. Finally, participants were pre-sented with the same JND and color categorization tasks as inExperiment 1 (see Supplemental Materials).
Results
Overall accuracy was high (M � .94, SD � .04) indicating thatparticipants understood and were able to perform the task. Theanalysis strategy was identical to that of Experiment 1. RT fromeach trial was entered into equation 2 to estimate the knot point,intercept, pre- and post-knot slopes, and between group differencesof each term. RT and accuracy were averaged into two factors splitby the knot point.
A significant knot point for the low-similarity group was foundat color 21.33° [95% CI � .50], t (32,669) � 83.09, p � .001, witha significant change of knot point in the high-similarity groupof �5.30° (equivalent to color 16.03°), t (32,669) � �13.75, p �.001. These results replicate our results from Experiment 1, findingthat the high-similarity group reached an asymptote in RT earlierin color space compared to the low-similarity group. As in Exper-iment 1, the intercept for the high-similarity group was signifi-cantly smaller than the low-similarity group, t (39) � �2.42, p �.020. And while there was a significant pre-knot slope of �70.20in the low-similarity group, t (32,669) � �8.32, p � .001, and asignificant change in slope of 68.32 post-knot, t (32,669) � 8.45,p � .001, there were no between group differences, all ts(32,669) � 1.6, all ps .113 (Figure 4B). Together, these resultsdemonstrate that the high-similarity group was better able toactively suppress distractors that were target-similar (Figure 4B),but that both groups experienced greater interference as a functionof color similarity for the pre-knot compared to post-knot colors.
RT and accuracy were then split into two factors based on theknot point and tested for between group and knot area differencesusing a mixed repeated measures ANOVA. Post hoc t tests thatfollowed up on the ANOVA results were corrected for multiplecomparisons using the Bonferroni method for two comparisons.For RT, there was a marginally significant effect of group, F (1,38) � 3.32, p � .08, �p
2 � .08, a significant main effect of knotarea, F (1, 38) � 63.67, p � .001, �p
2 � .63, and a significantinteraction, F (1, 38) � 8.92, p � .005, �p
2 � .19. Post hoc t testsfound a significant between groups difference in the pre-knot area,t (38) � 2.33, p � .025, d � .73, but not in the post-knot area, t(38) � 0.70, p � .488 (Figure 4C).
For accuracy, no significant difference between groups wasfound, F (1, 38) � 2.32, p � .136, but a significant differencebetween knot area was found, F (1, 38) � 113.27, p � .001, �p
2 �.76, along with a significant interaction, F (1, 38) � 4.47, p �.041, �p
2 � .11. Post hoc t tests found a marginally significantdifference between groups in the pre-knot data, t (38) � �1.92,p � .062, d � �.60, but no difference post-knot, t (38) � �0.1,p � .92 (Figure 4D). These results replicate those reported inExperiment 1, again showing shorter RTs and higher accuracy, ontrials with the more target-similar distractors in the high-similaritygroup compared to the low.
In contrast to Experiment 1, the 3AFC number response in thisexperiment allowed us to explore the likelihood that errors werebased on selection of the distractor number (rather than beingunaccountable). Recall that overall accuracy was high (around94%), but of the errors made, 64.7% were “distractor errors.”Distractor errors were calculated as the number of trials per con-dition, that involved a response to the distractor number instead ofthe target number. These data were entered into a 12-distractor-color � 2 group mixed-effects ANOVA. There was a significant
Thi
sdo
cum
ent
isco
pyri
ghte
dby
the
Am
eric
anPs
ycho
logi
cal
Ass
ocia
tion
oron
eof
itsal
lied
publ
ishe
rs.
Thi
sar
ticle
isin
tend
edso
lely
for
the
pers
onal
use
ofth
ein
divi
dual
user
and
isno
tto
bedi
ssem
inat
edbr
oadl
y.
6 GENG, DIQUATTRO, AND HELM

effect of color, F (1, 38) � 74.10, p � .001, �p2 � .66, no effect of
group, F (1, 38) � 1.50, p � .23, and a significant interactionbetween color and group, F (1, 38) � 5.11, p � .05, �p
2 � .12(Figure 4E). Exploratory post hoc t tests found none of the com-
parisons significant with correction (for 12 comparisons) and onlythe 5° and 10° colors were marginally significant at uncorrectedlevels, t (38) 1.8, p � .08 days .57; all other t (38) � 1.1.These results are exploratory, but support the knot based accuracy
Figure 4. A: Task design for Experiments 2 and 3. Participants were instructed to locate the target circle (pinkin this example) and report the number within. B: Reaction time for each group and distractor color inExperiment 2. Lines are spline model fits. The 0°data are plotted as a reference, but were not included in themodel. Black circles are estimated knot points. C: Reaction time split into pre- and post-knot areas based onestimated knot point of the low-similarity group. D: Accuracy split into pre- and post-knot areas based onestimated knot point of the low similarity group. All error bars SEM. E: Percentage of trials in each distractorcolor condition on which errors involved responses to the number inside the distractor object. See the onlinearticle for the color version of this figure.
Thi
sdo
cum
ent
isco
pyri
ghte
dby
the
Am
eric
anPs
ycho
logi
cal
Ass
ocia
tion
oron
eof
itsal
lied
publ
ishe
rs.
Thi
sar
ticle
isin
tend
edso
lely
for
the
pers
onal
use
ofth
ein
divi
dual
user
and
isno
tto
bedi
ssem
inat
edbr
oadl
y.
7SHAPE OF THE ATTENTIONAL TEMPLATE

analysis and further suggest that the low-similarity group wasmore likely to mistake the most similar distractors as the targetthan the high-similarity group.
The main results replicate the findings from Experiment 1demonstrating that the effects of interest were not due to thespecific discrimination task in Experiment 1. They go beyond byshowing that the most similar distractors were more likely to bemistaken as the target in the low-similarity group. Next, we ana-lyzed the post-visual search color wheel task to see if there werebetween group differences in the color value selected as the target.We had hypothesized that the high-similarity group would have amore shifted and a sharper distribution of color wheel clickscompared to the low-similarity group. The distribution of colorwheel clicks was estimated for each person by fitting a normaldistribution to each person’s data using the normfit function inMATLAB. By doing this, we acquire continuous estimated click
proportions for each color value on the color wheel and avoid theproblem of missing data. Missing data is inevitable because sub-jects do not click on all color values.
The size of the shift in each group was compared with t testscomparing the estimated means between groups and also of eachgroup to the true target color. In contrast to the hypothesis that thehigh-similarity group would shift their target representation fartheraway from the distractor set than the low-similarity group, wefound that the mean click of both groups was significantly shiftedfrom the true target color (i.e., shifted away from the distractor set;low-similarity group: M � �14.13; SEM � 3.84; t (39) � �3.66,p � .001, d � .82, high-similarity group: M � �11.7; SEM �2.65; t(39) � �4.72, p � .001, d � 1.06). Moreover, there was nodifference between groups in the magnitude of the shift, t(38) � �0.33, p � .741. This indicates that the magnitude of theshift in the central tendency of clicks away from the true targetcolor was similar in both groups. This would be expected if thedistractor set, but not the specific probabilities of distractors withinthe set, triggered the mechanism to shift the target.
Next, to assess whether the distribution of clicks between twogroups were somehow different, we compared the shapes of thedistributions using a two-sample Kolmogorov–Smirnov (K-S test;Massey, 1951; Wilcox, 1997). The K-S test is a nonparametric testof the shape of two distributions. Differences in the shape of twodistributions can be detected even when the metrics of centraltendency are the same. Using the grand mean of estimated datafrom each subject produced a significant difference betweengroups (D � .175, p � .05). A similar “fixed effects” analysiscomparing the raw data from all subjects within a group was alsosignificant (D � .116, p � .05). This suggests that the two groupshad distributions that differed in shape, even though the magnitudeof the shift was similar between groups (Figure 5B). Although thisresult indicates that the pattern of clicks differed between groups,the K-S test does not specify how the distributions differ. This wasinvestigated in the next Experiment using a more precise task.
Discussion
The goal for Experiment 2 was twofold: to control for a possibleconfound in Experiment 1 based on learning of the specific dis-crimination task; and to measure between-groups differences in therepresentation of the target color within the attentional template.The search task in Experiment 2 eliminated the possibility oflocating the target based on the discrimination task, yet replicatedour results from Experiment 1. This replication is consistent withthe idea that the attentional template is adjusted by the frequencyof target-similar distractors.
We also used a color wheel task to assess the fidelity of thetarget representation within the attentional template. We found thatthe target representation was shifted away from the true color inthe direction opposite that of the set of distractor colors in bothgroups and that the central tendency of the magnitude of the shiftdid not differ between groups. Interestingly, the shape of thedistribution of the color wheel data did differ between groups, andvisual inspection suggested that the high-similarity group had ashaper representation of the target color. The central tendency ofthe target representations did not differ between groups, but theshape of the distributions did.
Figure 5. A: Task design for postvisual search target identification taskin Experiment 2. Two color wheel trials are shown to illustrate randomchange in color wheel orientation on a trial-by-trial basis. Participantsclicked on the wheel to indicate the target color’s location. B: Groupaverages of relative click distance from the true target color in color wheeltarget identification task. Raw data divided into 5° bins (solid lines shownwith SEM); estimated data for 1° bins plotted in dotted lines. Vertical linesindicate group mean distances and the true target color (black line).Negative numbers indicate a counterclockwise click away from the dis-tractor set. See the online article for the color version of this figure.
Thi
sdo
cum
ent
isco
pyri
ghte
dby
the
Am
eric
anPs
ycho
logi
cal
Ass
ocia
tion
oron
eof
itsal
lied
publ
ishe
rs.
Thi
sar
ticle
isin
tend
edso
lely
for
the
pers
onal
use
ofth
ein
divi
dual
user
and
isno
tto
bedi
ssem
inat
edbr
oadl
y.
8 GENG, DIQUATTRO, AND HELM

In Experiment 3, we sought to replicate our visual search resultsonce again, and test the central tendency and shape of the targetrepresentation using a new discrimination task. The discriminationtask differed from the color wheel task in Experiment 2 in that itsampled only a narrow range of colors around the actual targetcolor. The goal was to test with more precision the “confusability”of those colors with the target. The probability of a nontarget colorbeing confused with the target color is therefore taken as a metricof the likelihood of that color being within the shape of the targettemplate.
Experiment 3
In Experiment 2, we found that both groups shifted their targetrepresentation away from the distractor set and that the shape ofthe distributions were different, but we could not determine sta-tistically how they differed given missing data from the uncon-strained responses. Therefore, the goal of Experiment 3 was to usea two-alternative forced-choice target discrimination task to testwhether the high-similarity group had a more precise representa-tion of the target, particularly for colors that were very near thetrue target color. The goal of this discrimination task was not tomap the full distribution of the target representation, as in Exper-iment 2. Instead, this task measured the precision of the targetrepresentation by assessing the likelihood of a highly similarnontarget color hue, �20° to 20° colors around the true colorvalue, being misidentified as the target (i.e., producing a falsealarm). If the high-similarity group developed a more preciserepresentation of the target, then they should be less likely tomisidentify highly similar distractor color hues as the target, whichmust be rejected frequently during the visual search task. This tasktargets a narrower range of colors compared to the color wheel inExperiment 2, but acquires a response for each color tested. Thisaffords a more precise measurement of the target representationwithin a limited color range.
Method
Participants. Forty UC Davis undergraduates (9 male, threeleft-handed, ages 18–25) participated for class credit. Each pro-vided written informed consent in accordance with the local ethicsclearance as approved by the National Institutes of Health. All hadnormal or corrected-to-normal vision.
Procedure. All stimuli and procedure were identical to Ex-periment 2 with the following additions: At the half-way point andat the end of the visual search task, participants completed a newsingle item 2AFC target discrimination task. Each trial consisted ofa centrally presented circle (same dimensions as the search task)for 400 ms, after which a circular checkerboard mask was dis-played for 66 ms. The circle was one of nine colors that rangedfrom �20° to 20° in steps of 5°, relative to the target color. Notethat this represents a relatively small range of colors around thetrue target color compared to the size of the shift (in Experiment2). Thus, we were testing specifically for an increase in precisionwithin a range of colors that were highly similar to the target color.Within each session, each color was presented 10 times for a totalof 90 trials (2 sessions in total). Participants were instructed toindicate whether the presented color was the target color bypressing “g” or not the target color by pressing “h.” After response,
a central fixation dot was presented for 800–1,500 ms (Figure 7A).This target discrimination task was acquired in two sessions oc-curring at the half-way point and at the end in order to minimizeresponse contamination by sequential trials that are unrelated tothe memory of the target stimulus from the main search task (e.g.,responding “no” because of a “yes” response on the previous trial,rather than the remembered target color).
Analysis. Analysis of the visual search data was identical toExperiments 1 and 2. For the target discrimination task, betweengroups differences in the proportion of “target present” responsesfor each color were tested against chance using a permutationtechnique. This method was chosen as a sensible procedure forcomparing differences at each color, while controlling for familywise error. For 10,000 iterations, group labels were randomized onthe subject level and between group differences were calculatedfor each color. The magnitude of our observed differences wasthen validated by comparing them to the likelihood of differencesfound by chance at any of the colors.
Results
Overall accuracy was high (M � .96, SD � .02), indicating thatparticipants understood and were able to perform the task. Identi-cal to Experiments 1 and 2, we entered RT from each trial intoequation 2 to estimate knot points, intercepts, pre- and post-knotslopes, along with between groups differences for each term. RTand accuracy were then split into two factors based on knot point.
A significant knot point for the low-similarity group was foundat color 21.28° [95% CI � .63], t (32,975) � 66.61, p � .001, witha significant change of knot point in the high-similarity groupof �5.36° (equivalent to color 15.92°), t(32,975) � �14.27, p �.001. Replicating our critical results from Experiments 1 and 2, thehigh-similarity group reached an asymptote in RT earlier in colorspace compared to the low-similarity group (Figure 6A). In con-trast to previous experiments, no significant difference betweenintercepts was found, t (32,975) � �1.22, p � .223.
We next split RT and accuracy into two factors based on theknot point and tested for between group and knot area differencesusing a mixed repeated measures ANOVA. Post hoc t tests thatfollowed up on the ANOVA results were corrected for multiplecomparisons using the Bonferroni method for the two compari-sons. For RT, there was a significant effect of group, F (1, 38) �6.49, p � .015, �p
2 � .15, a significant main effect of knot area, F(1, 38) � 129.36, p � .001, �p
2 � .77, and a significant interaction,F (1, 38) � 6.05, p � .05, �p
2 � .14 (Figure 6B). The comparisonbetween groups in the pre-knot area was significant, t(38) � 2.89,p � .01, d � .91, but only marginally so in the post-knot area, t(38) � 1.86, p � .071 d � .59 (Figure 6C). These results replicatethose of Experiments 1 and 2.
Similarly, accuracy produced a significant main effect of group,F (1, 38) � 4.59, p � .05, �p
2 � .11, a significant main effect ofknot area, F (1, 38) � 83.48, p � .001, �p
2 � .69, and a significantinteraction, F (1, 38) � 7.44, p � .01, �p
2 � .16. Post hoc t testsfound a significant between groups difference in the pre-knot area,t(38) � �2.52, p � .02, d � �.80, but not in the post-knot area,t (38) � �0.31, p � .75 Together the accuracy and RT resultsdirectly replicate the results in the two previous experiments andshow that the high-similarity group performed better in the pre-knot, but not the post-knot, distractor conditions. However, it
Thi
sdo
cum
ent
isco
pyri
ghte
dby
the
Am
eric
anPs
ycho
logi
cal
Ass
ocia
tion
oron
eof
itsal
lied
publ
ishe
rs.
Thi
sar
ticle
isin
tend
edso
lely
for
the
pers
onal
use
ofth
ein
divi
dual
user
and
isno
tto
bedi
ssem
inat
edbr
oadl
y.
9SHAPE OF THE ATTENTIONAL TEMPLATE

remains unclear why the effects were distributed between RT andaccuracy in this experiment only.
For the low-similarity group, a significant pre-knot slopeof �72.13 was found, t (32,975) � �7.91, p � .001, as well as asignificant change in slope of 70.75 post-knot, t(32,975) � 7.90,p � .001. No between group differences in pre- or post-knot slopeswere found, all ts(35,739) � 1.4, all ps .113. These resultsreplicate our findings from Experiments 1 and 2 of having distrac-tor interference substantially decrease post-knot, but similarly forthe two groups.
Similar to Experiment 2, the response procedure in this exper-iment (i.e., determining which of three numbers appeared in thetarget color) allowed us to explore the likelihood that errors werebased on selection of the distractor. Overall accuracy was high(around 96%), but of the errors made, 64.0% were “distractorerrors.” These distractor errors were divided by distractor colorand group and entered into a mixed-effects ANOVA. There was asignificant main effect of color, F (1, 38) � 69.17, p � .001, �p
2 �
.65, and of group, F (1, 38) � 4.87, p � .05, �p2 � .11, and a
significant interaction between color and group, F (1, 38) � 7.80,p � .01, �p
2 � .17 (Figure 6D). Exploratory post hoc t tests showedno significant difference with Bonferroni correction for 12 com-parisons, but significant differences without correction for the 5°color, t (38) � 2.79, p � .008, d � .88, and the 10° color, t (38) �2.5, p � .016 days .80; all other t (38) � .66. These results wereexploratory, but are consistent with the knot-based ANOVA re-ported above and the results from Experiment 2; they suggest thatthe reason individuals in the low-similarity group were less accu-
3 The change in pre-knot slope using logRT was negative and marginallysignificant, p � .057, suggesting that the pre-knot slope was more negativein the high-similarity group compared to the low-similarity group. Thepost-knot change in slope for the high-similarity group was similarlysignificant, p � .0435, given that the change in slope was equal andopposite to the pre-knot value.
Figure 6. A: Reaction time for each group and distractor color in Experiment 3. Lines are spline model fit.Black circles represent knot points. B: Reaction time split into pre- and post-knot areas based on estimated knotpoint of the low similarity group. C: Accuracy split into pre- and post-knot areas based on estimated knot pointof the low similarity group. All error bars SEM. D: Percentage of trials in each distractor color condition onwhich errors involved responses to the number inside the distractor object. See the online article for the colorversion of this figure.
Thi
sdo
cum
ent
isco
pyri
ghte
dby
the
Am
eric
anPs
ycho
logi
cal
Ass
ocia
tion
oron
eof
itsal
lied
publ
ishe
rs.
Thi
sar
ticle
isin
tend
edso
lely
for
the
pers
onal
use
ofth
ein
divi
dual
user
and
isno
tto
bedi
ssem
inat
edbr
oadl
y.
10 GENG, DIQUATTRO, AND HELM
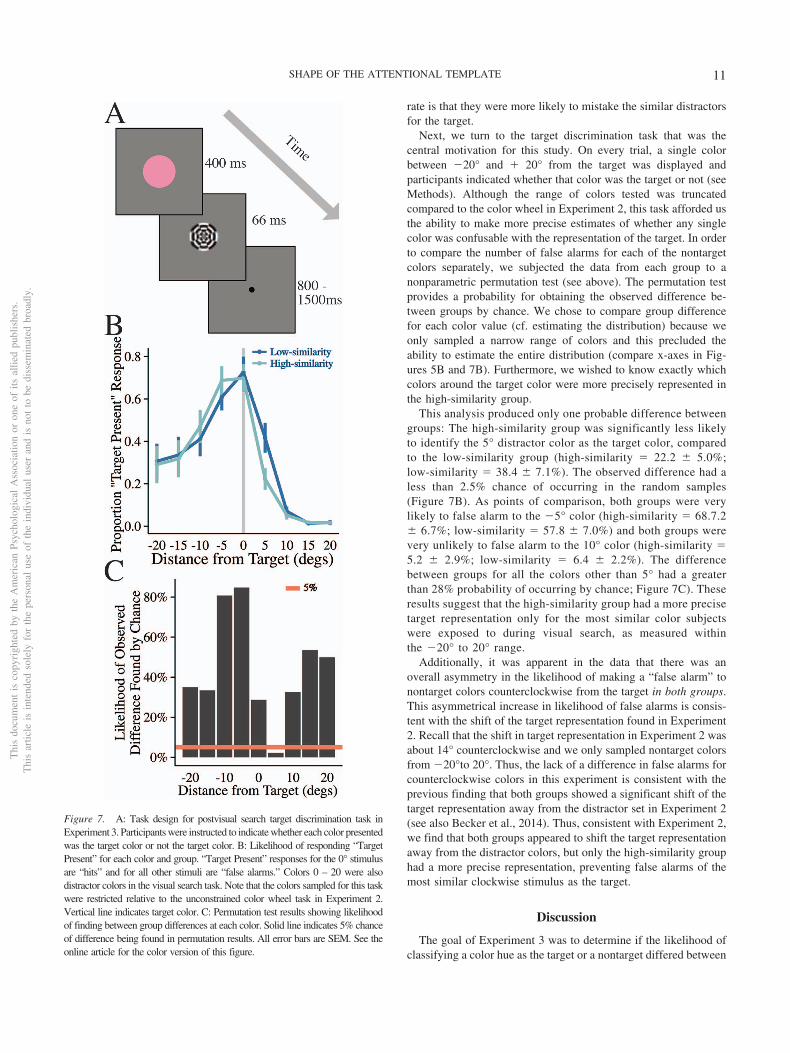
rate is that they were more likely to mistake the similar distractorsfor the target.
Next, we turn to the target discrimination task that was thecentral motivation for this study. On every trial, a single colorbetween �20° and � 20° from the target was displayed andparticipants indicated whether that color was the target or not (seeMethods). Although the range of colors tested was truncatedcompared to the color wheel in Experiment 2, this task afforded usthe ability to make more precise estimates of whether any singlecolor was confusable with the representation of the target. In orderto compare the number of false alarms for each of the nontargetcolors separately, we subjected the data from each group to anonparametric permutation test (see above). The permutation testprovides a probability for obtaining the observed difference be-tween groups by chance. We chose to compare group differencefor each color value (cf. estimating the distribution) because weonly sampled a narrow range of colors and this precluded theability to estimate the entire distribution (compare x-axes in Fig-ures 5B and 7B). Furthermore, we wished to know exactly whichcolors around the target color were more precisely represented inthe high-similarity group.
This analysis produced only one probable difference betweengroups: The high-similarity group was significantly less likelyto identify the 5° distractor color as the target color, comparedto the low-similarity group (high-similarity � 22.2 � 5.0%;low-similarity � 38.4 � 7.1%). The observed difference had aless than 2.5% chance of occurring in the random samples(Figure 7B). As points of comparison, both groups were verylikely to false alarm to the �5° color (high-similarity � 68.7.2� 6.7%; low-similarity � 57.8 � 7.0%) and both groups werevery unlikely to false alarm to the 10° color (high-similarity �5.2 � 2.9%; low-similarity � 6.4 � 2.2%). The differencebetween groups for all the colors other than 5° had a greaterthan 28% probability of occurring by chance; Figure 7C). Theseresults suggest that the high-similarity group had a more precisetarget representation only for the most similar color subjectswere exposed to during visual search, as measured withinthe �20° to 20° range.
Additionally, it was apparent in the data that there was anoverall asymmetry in the likelihood of making a “false alarm” tonontarget colors counterclockwise from the target in both groups.This asymmetrical increase in likelihood of false alarms is consis-tent with the shift of the target representation found in Experiment2. Recall that the shift in target representation in Experiment 2 wasabout 14° counterclockwise and we only sampled nontarget colorsfrom �20°to 20°. Thus, the lack of a difference in false alarms forcounterclockwise colors in this experiment is consistent with theprevious finding that both groups showed a significant shift of thetarget representation away from the distractor set in Experiment 2(see also Becker et al., 2014). Thus, consistent with Experiment 2,we find that both groups appeared to shift the target representationaway from the distractor colors, but only the high-similarity grouphad a more precise representation, preventing false alarms of themost similar clockwise stimulus as the target.
Discussion
The goal of Experiment 3 was to determine if the likelihood ofclassifying a color hue as the target or a nontarget differed between
Figure 7. A: Task design for postvisual search target discrimination task inExperiment 3. Participants were instructed to indicate whether each color presentedwas the target color or not the target color. B: Likelihood of responding “TargetPresent” for each color and group. “Target Present” responses for the 0° stimulusare “hits” and for all other stimuli are “false alarms.” Colors 0 – 20 were alsodistractor colors in the visual search task. Note that the colors sampled for this taskwere restricted relative to the unconstrained color wheel task in Experiment 2.Vertical line indicates target color. C: Permutation test results showing likelihoodof finding between group differences at each color. Solid line indicates 5% chanceof difference being found in permutation results. All error bars are SEM. See theonline article for the color version of this figure.
Thi
sdo
cum
ent
isco
pyri
ghte
dby
the
Am
eric
anPs
ycho
logi
cal
Ass
ocia
tion
oron
eof
itsal
lied
publ
ishe
rs.
Thi
sar
ticle
isin
tend
edso
lely
for
the
pers
onal
use
ofth
ein
divi
dual
user
and
isno
tto
bedi
ssem
inat
edbr
oadl
y.
11SHAPE OF THE ATTENTIONAL TEMPLATE
groups. We found that the high-similarity group was better able tocorrectly reject the 5° color as the target, suggesting that subjectshad a more precise representation of that color as a nontarget.Additionally, colors counterclockwise from the target color wereoverall more likely to be classified as a target than colors clock-wise from the target in both groups, suggesting that the change intarget representation reflected a combination of adjustments. Thetarget representation was broadened in the direction opposite tothe distractors in both groups and sharpened to better excluded themost similar distractor in the high-similarity group. The dataindicate that distractor probabilities contribute to the flexible ad-justment of the contents of the attentional template by increasingthe precision of target-distractor boundary that leads to moreefficient distractor suppression.
General Discussion
Most theories of attention propose that task-relevant informationis held in an attentional template in working memory (Bundesen etal., 2005; Carlisle et al., 2011; Chelazzi, Miller, Duncan, & Desi-mone, 1993; Desimone & Duncan, 1995). The contents of thetemplate are frequently assumed to contain the features of thetarget that are used to set attentional priority by modulating gain insensory neurons (Martinez-Trujillo & Treue, 2004; Maunsell &Treue, 2006; Reynolds & Heeger, 2009; Treue & Trujillo, 1999).However, some recent theories have suggested that the attentionaltemplate contains not only information about target features, butalso distractors. Moreover, it has been shown that knowledge ofthe distractor features may shift the representation of the target tobe more distinct from the distractor set; and doing so increases thesignal-to-noise ratio of incoming sensory information and facili-tates visual search (Becker, 2010a; Navalpakkam & Itti, 2007).This work suggests that experience with distractors alters therepresentation of target features within the attentional template andis consistent with other work demonstrating the malleability of thetemplate based on context (Bravo & Farid, 2016; Mast & Frings,2014; Zelinsky et al., 2013). However, these studies have typicallyused a flat distribution of distractor presentation, such that allpossible distractors were equally likely. Most have also used alimited number of distractors, precluding the ability to measurechanges in the precision of the template. It therefore remainedunclear how the probability of seeing distractors that vary contin-uously in target-similarity might change the attentional templateand enhance distractor suppression.
We addressed this question in three experiments using a visualsearch task in which the distractor colors were sampled betweentarget-color and 60° from the target in LAB color space with atruncated normal distribution. The critical manipulation wasthat sampling of the distractors was mirrored across participantssuch that some were exposed to mostly target-similar distractors(high-similarity group), or mostly target-dissimilar distractors(low-similarity group). Although the demonstration of distrac-tor probabilities influencing feature-based attention is novel,there is evidence that the attentional system is highly sensitiveto statistical regularities (Awh, Belopolsky, & Theeuwes, 2012;Geng & Behrmann, 2002, 2005; Stankevich & Geng, 2014;Turk-Browne, Scholl, Chun, & Johnson, 2009).
RT from this task was entered into a two-part spline model,which estimated a knot point in color space that indicates the
distance from the target color at which task interference fromdistractors reaches asymptote. This model is ideal for testingcontinuous measurements because it captures the nonlinearity ofthe data by estimating an inflection, ”knot,” point along with thepre-knot slope and change in slope post-knot. However, it is notmeant to be a theoretical model of attention. In our data, the knotpoint served as a statistical analogue for the edge of the attentionaltemplate because distractors beyond the knot point had uniformlyshort RTs, reflecting minimal distractor competition on targetselection (Duncan & Humphreys, 1989; Wolfe, 2004). Distractorsthat produce little or no competition are assumed to have little, orno, overlap with the target representation within the attentionaltemplate.
There were three main findings. First, in all three experimentswe found the high-similarity group had a knot point significantlycloser to the target, suggesting better distractor suppression. More-over, performance of the high-similarity group in the pre-knot binwas significantly better (i.e., faster in all Experiments and moreaccurate in Experiments 2 and 3) than that of the low-similaritygroup, but there was no difference between groups in performanceon post-knot trials. This is a novel demonstration that more prob-able distractors are suppressed more efficiently, but only if they aretarget-similar (i.e., pre-knot) and compete for attention. Therewere no group differences in performance for dissimilar distrac-tors. This was most likely because performance was already nearceiling on those trials, masking any benefit of increased exposure.This finding was replicated in all three experiments.
Second, in Experiment 2, we used a color wheel target identi-fication task to measure the average representation of the targetcolor. While we found that the representation of the target, inreplication of previous work, was shifted away from the distractorcolors, there was no difference in the magnitude of this shiftbetween groups. Thus, the mechanism that causes the shift in thetarget representation appears to be insensitive to the probability ofdistractors and only sensitive to their entire feature space. How-ever, an analysis of the shape of the distribution of clicks showeda difference between groups. The shape of the distribution wasnarrower in the high-similarity group, suggesting a more precisetarget representation. Taken together with the visual search data,we conclude that the better visual search performance was drivenby greater precision in the target representation.
Third, in Experiment 3, we added a target discrimination taskthat asked subjects to classify a narrow range of colors as the targetor nontarget. We found that the high-similarity group was lesslikely to false alarm to 5° nontarget than those in the low-similaritygroup. This suggests that the frequent need to suppress a verytarget-similar distractor (i.e., the 5° distractor) in the high-similarity group led to greater precision in distinguishing it fromtargets. Interestingly, this increase in precision was asymmetricalsuch that nontarget colors in the opposite direction from distractors(i.e., �5° to �20°) had a higher false alarm rate overall and wasnot different between groups. The fact that there was a reductionin false alarms to actual distractor colors from the visual searchtask suggests that the attentional template may also contain arejection template for distractor colors in addition to the targetrepresentation (Arita et al., 2012). Moreover, the rejection tem-plate for distractors was more precise in the inclusion of the 5°distractor. This is consistent with the models of attentional controlin which explicit modeling of both the target and distractor distri-
Thi
sdo
cum
ent
isco
pyri
ghte
dby
the
Am
eric
anPs
ycho
logi
cal
Ass
ocia
tion
oron
eof
itsal
lied
publ
ishe
rs.
Thi
sar
ticle
isin
tend
edso
lely
for
the
pers
onal
use
ofth
ein
divi
dual
user
and
isno
tto
bedi
ssem
inat
edbr
oadl
y.
12 GENG, DIQUATTRO, AND HELM
butions produces more optimal behavior (Navalpakkam & Itti,2007). However, future work will be necessary to tease apartcontributions of the target versus distractor templates on visualsearch (Störmer & Alvarez, 2014) and the role of intertrial priming(Becker, 2010a; Lamy & Kristjánsson, 2013).
Together these results suggest that being exposed to moretarget-similar distractors enhances the ability to suppress thosedistractors. This suggests that attentional templates are notstatic recreations of the target item, but are flexible represen-tations that change based on the distractor set and their frequen-cies. Interestingly, this flexibility manifested in multiple ways:the first caused a shift in the target representation and thesecond caused a sharpening of the target-to-distractor decisionboundary. This suggests that there are multiple mechanisms thatcan be used to optimize the ability to distinguish targets fromdistractors and that these may not be mutually exclusive of eachother (see Figure 1).
One question that remains open regards the degree to whichtemplate flexibility depends on decisional, memory, or perceptualchanges. Although it is impossible to fully address this questionwith the current behavioral data, the results suggest that there maybe a combination of perceptual factors that result in a betterrepresentation of the specific target color as well as decisionalfactors related to confidence that the target was selected. Forexample, the results of the discrimination task suggest that thehigh-similarity group had a perceptual representation of the targetcolor that was more precise and likely to exclude a very similardistractor; however, the visual search data also suggested overalldifferences in performance between groups at the 0° condition (seeFigures 3, 4, 6), possibly due to an enhanced ability to decide thata target had been selected. Our data suggest that distractor statisticsmodulate representations that “cascade” through different stages ofprocessing.
This perspective is consistent with neurobiological data inwhich the contents of working memory are thought to be computedand maintained in both sensory regions (Ester, Anderson, Ser-ences, & Awh, 2013; Harrison & Tong, 2009) as well as prefrontaland parietal regions (Feredoes, Heinen, Weiskopf, Ruff, & Driver,2011; Suzuki & Gottlieb, 2013; Wallis, 2007). Instead of being atodds with each other, there is now evidence that sensory anddecision regions may form a network that optimizes the ability tomaintain task-specific and task-relevant representations for targetrecognition and selection (Lee & Baker, 2016). Similarly, whilethe exact mechanisms of perceptual decision-making are still de-bated, it appears that both sensory and decisional regions of thebrain interact reciprocally (Bizley et al., 2016; Rahnev et al., 2011;Romo & Lafuente, 2013).
In conclusion, in a series of three experiments, we report datademonstrating that attentional control mechanisms are sensitive todistractor probabilities. When the pressure on attentional selectionwas increased by frequent high-similarity distractors, mechanismsof distractor suppression were enhanced by sharpening the repre-sentational boundary between targets and highly similar distrac-tors. This resulted in faster and better visual search performancewhen those highly similar distractors appeared. We conclude thatattentional templates are flexibly defined in response to task con-text with the goal of optimizing performance at multiple levels ofprocessing.
References
Ansorge, U., & Becker, S. I. (2014). Contingent capture in cueing: The roleof color search templates and cue-target color relations. PsychologicalResearch, 78, 209–221. http://dx.doi.org/10.1007/s00426-013-0497-5
Arita, J. T., Carlisle, N. B., & Woodman, G. F. (2012). Templates forrejection: Configuring attention to ignore task-irrelevant features. Jour-nal of Experimental Psychology: Human Perception and Performance,38, 580–584. http://dx.doi.org/10.1037/a0027885
Awh, E., Belopolsky, A. V., & Theeuwes, J. (2012). Top-down versusbottom-up attentional control: A failed theoretical dichotomy. Trends inCognitive Sciences, 16, 437–443. http://dx.doi.org/10.1016/j.tics.2012.06.010
Becker, S. I. (2007). Irrelevant singletons in pop-out search: Attentionalcapture or filtering costs? Journal of Experimental Psychology: HumanPerception and Performance, 33, 764–787. http://dx.doi.org/10.1037/0096-1523.33.4.764
Becker, S. I., Folk, C. L., & Remington, R. W. (2010). The role ofrelational information in contingent capture. Journal of ExperimentalPsychology: Human Perception and Performance, 36, 1460–1476.
Becker, S. I. (2010a). Oculomotor capture by colour singletons depends onintertrial priming. Vision Research, 50, 2116–2126. http://dx.doi.org/10.1016/j.visres.2010.08.001
Becker, S. I. (2010b). The role of target-distractor relationships in guidingattention and the eyes in visual search. Journal of Experimental Psy-chology: General, 139, 247–265. http://dx.doi.org/10.1037/a0018808
Becker, S. I., Dell’acqua, R., & Jolicœur, J. D. (2014). Visual search forcolor and shape: When is the gaze guided by feature relationships, whenby feature values? Journal of Experimental Psychology: Human Per-ception and Performance, 40, 264 –291. http://dx.doi.org/10.1037/a0033489
Bizley, J. K., Jones, G. P., & Town, S. M. (2016). Where are multisensorysignals combined for perceptual decision-making? Curr Opin Neurobiol,40, 31–37.
Bravo, M. J., & Farid, H. (2016). Observers change their target templatebased on expected context. Attention, Perception & Psychophysics, 78,829–837. http://dx.doi.org/10.3758/s13414-015-1051-x
Bolger, N., & Laurenceau, J. P. (2014). Intensive longitudinal methods: Anintroduction to diary and experience sampling research. New York, NY:Guilford Press.
Bundesen, C. (1990). A theory of visual attention. Psychological Review,97, 523–547. http://dx.doi.org/10.1037/0033-295X.97.4.523
Bundesen, C., Habekost, T., & Kyllingsbaek, S. (2005). A neural theory ofvisual attention: Bridging cognition and neurophysiology. PsychologicalReview, 112, 291–328. http://dx.doi.org/10.1037/0033-295X.112.2.291
Carlisle, N. B., Arita, J. T., Pardo, D., & Woodman, G. F. (2011).Attentional templates in visual working memory. The Journal of Neu-roscience, 31, 9315–9322. http://dx.doi.org/10.1523/JNEUROSCI.1097-11.2011
Chelazzi, L., Miller, E. K., Duncan, J., & Desimone, R. (1993). A neuralbasis for visual search in inferior temporal cortex. Nature, 363, 345–347.http://dx.doi.org/10.1038/363345a0
Chun, M. M., & Jiang, Y. (1998). Contextual cueing: Implicit learning andmemory of visual context guides spatial attention. Cognitive Psychology,36, 28–71. http://dx.doi.org/10.1006/cogp.1998.0681
Cudeck, R., & Klebe, K. J. (2002). Multiphase mixed-effects models forrepeated measures data. Psychological Methods, 7, 41–63. http://dx.doi.org/10.1037/1082-989X.7.1.41
Desimone, R., & Duncan, J. (1995). Neural mechanisms of selective visualattention. Annual Review of Neuroscience, 18, 193–222. http://dx.doi.org/10.1146/annurev.ne.18.030195.001205
Dosher, B. A., & Lu, Z. L. (2000a). Mechanisms of perceptual attention inprecuing of location. Vision Research, 40(10–12), 1269–1292. http://dx.doi.org/10.1016/S0042-6989(00)00019-5
Thi
sdo
cum
ent
isco
pyri
ghte
dby
the
Am
eric
anPs
ycho
logi
cal
Ass
ocia
tion
oron
eof
itsal
lied
publ
ishe
rs.
Thi
sar
ticle
isin
tend
edso
lely
for
the
pers
onal
use
ofth
ein
divi
dual
user
and
isno
tto
bedi
ssem
inat
edbr
oadl
y.
13SHAPE OF THE ATTENTIONAL TEMPLATE

Dosher, B. A., & Lu, Z. L. (2000b). Noise exclusion in spatial attention.Psychological Science, 11, 139–146. http://dx.doi.org/10.1111/1467-9280.00229
Druker, M., & Anderson, B. (2010). Spatial probability AIDS visualstimulus discrimination. Frontiers in Human Neuroscience, 4, 63.
Drummond, L., & Shomstein, S. (2010). Object-based attention: Shiftingor uncertainty? Attention, Perception, & Psychophysics, 72, 1743–1755.http://dx.doi.org/10.3758/APP.72.7.1743
Dubé, C., Zhou, F., Kahana, M. J., & Sekuler, R. (2014). Similarity-baseddistortion of visual short-term memory is due to perceptual averaging.Vision Research, 96, 8–16. http://dx.doi.org/10.1016/j.visres.2013.12.016
Duncan, J., & Humphreys, G. W. (1989). Visual search and stimulussimilarity. Psychological Review, 96, 433– 458. http://dx.doi.org/10.1037/0033-295X.96.3.433
Eckstein, M. P. (1998). The Lower Visual Search Efficiency for Conjunc-tions Is Due to Noise and not Serial Attentional Processing. Psycholog-ical Science, 9, 111–118. http://dx.doi.org/10.1111/1467-9280.00020
Eckstein, M. P., Thomas, J. P., Palmer, J., & Shimozaki, S. S. (2000). Asignal detection model predicts the effects of set size on visual searchaccuracy for feature, conjunction, triple conjunction, and disjunctiondisplays. Perception & Psychophysics, 62, 425–451. http://dx.doi.org/10.3758/BF03212096
Ester, E. F., Anderson, D. E., Serences, J. T., & Awh, E. (2013). A neuralmeasure of precision in visual working memory. Journal of CognitiveNeuroscience, 25, 754–761. http://dx.doi.org/10.1162/jocn_a_00357
Feredoes, E., Heinen, K., Weiskopf, N., Ruff, C., & Driver, J. (2011).Causal evidence for frontal involvement in memory target maintenanceby posterior brain areas during distracter interference of visual workingmemory. Proceedings of the National Academy of Sciences, USA of theUnited States of America, 108, 17510–17515. http://dx.doi.org/10.1073/pnas.1106439108
Fischer, J., & Whitney, D. (2014). Serial dependence in visual perception.Nature Neuroscience, 17, 738–743. http://dx.doi.org/10.1038/nn.3689
Folk, C. L., & Remington, R. (1998). Selectivity in Distraction by Irrele-vant Featural Singletons: Evidence for Two Forms of Attentional Cap-ture. Journal of Experimental Psychology: Human Perception and Per-formance, 24, 847–858.
Folk, C. L., Remington, R. W., & Johnston, J. C. (1992). Involuntarycovert orienting is contingent on attentional control settings. Journal ofExperimental Psychology: Human Perception and Performance, 18,1030–1044. http://dx.doi.org/10.1037/0096-1523.18.4.1030
Fortier-Gauthier, U., Dell’acqua, R., & Jolicœur, P. (2013). The “red-alert”effect in visual search: Evidence from human electrophysiology. Psy-chophysiology, 50, 671–679. http://dx.doi.org/10.1111/psyp.12050
Gaspelin, N., Leonard, C. J., & Luck, S. J. (2015). Direct Evidence forActive Suppression of Salient-but-Irrelevant Sensory Inputs. Psycholog-ical Science, 26, 1740 –1750. http://dx.doi.org/10.1177/0956797615597913
Geng, J. J., & Behrmann, M. (2002). Probability cuing of target locationfacilitates visual search implicitly in normal participants and patientswith hemispatial neglect. Psychological Science, 13, 520–525. http://dx.doi.org/10.1111/1467-9280.00491
Geng, J. J., & Behrmann, M. (2005). Spatial probability as an attentionalcue in visual search. Perception & Psychophysics, 67, 1252–1268.http://dx.doi.org/10.3758/BF03193557
Geng, J. J., Blumenfeld, Z., Tyson, T. L., & Minzenberg, M. J. (2015).Pupil diameter reflects uncertainty in attentional selection during visualsearch. Frontiers in Human Neuroscience, 9, 435.
Geng, J. J., & DiQuattro, N. E. (2010). Attentional capture by a percep-tually salient non-target facilitates target processing through inhibitionand rapid rejection. Journal of Vision, 10, 5. http://dx.doi.org/10.1167/10.6.5
Haberman, J., & Whitney, D. (2009). Seeing the mean: Ensemble codingfor sets of faces. Journal of Experimental Psychology: Human Percep-tion and Performance, 35, 718–734. http://dx.doi.org/10.1037/a0013899
Harris, A. M., Remington, R. W., & Becker, S. I. (2013). Feature speci-ficity in attentional capture by size and color. Journal of Vision, 13, 12.http://dx.doi.org/10.1167/13.3.12
Harrison, S. A., & Tong, F. (2009). Decoding reveals the contents of visualworking memory in early visual areas. Nature, 458, 632–635. http://dx.doi.org/10.1038/nature07832
Hout, M. C., & Goldinger, S. D. (2015). Target templates: The precision ofmental representations affects attentional guidance and decision-makingin visual search. Attention, Perception & Psychophysics, 77, 128–149.http://dx.doi.org/10.3758/s13414-014-0764-6
Irons, J. L., & Leber, A. B. (2016). Choosing attentional control settings ina dynamically changing environment. Attention, Perception, & Psycho-physics, 78, 2031–2048. http://dx.doi.org/10.3758/s13414-016-1125-4
Jiang, J., Schmajuk, N., & Egner, T. (2012). Explaining neural signals inhuman visual cortex with an associative learning model. BehavioralNeuroscience, 126, 575–581. http://dx.doi.org/10.1037/a0029029
Kang, M.-S., Hong, S. W., Blake, R., & Woodman, G. F. (2011). Visualworking memory contaminates perception. Psychonomic Bulletin &Review, 18, 860–869. http://dx.doi.org/10.3758/s13423-011-0126-5
Kim, B., & Basso, M. A. (2008). Saccade target selection in the superiorcolliculus: A signal detection theory approach. The Journal of Neuro-science, 28, 2991–3007. http://dx.doi.org/10.1523/JNEUROSCI.5424-07.2008
Kiyonaga, A., & Egner, T. (2016). Center-Surround Inhibition in WorkingMemory. Current Biology, 26, 64–68. http://dx.doi.org/10.1016/j.cub.2015.11.013
Lamy, D. F., & Kristjánsson, A. (2013). Is goal-directed attentional guid-ance just intertrial priming? A review. Journal of Vision, 13, 14. http://dx.doi.org/10.1167/13.3.14
Ledgerwood, A. (2014). Introduction to the special section on movingtoward a Cumulative science: Maximizing what our research can tell us.Perspectives on Psychological Science, 9, 610–611. http://dx.doi.org/10.1177/1745691614553989
Lee, S.-H., & Baker, C. I. (2016). Multi-Voxel Decoding and the Topog-raphy of Maintained Information During Visual Working Memory.Frontiers in Systems Neuroscience, 10, 2. http://dx.doi.org/10.3389/fnsys.2016.00002
Malcolm, G. L., & Henderson, J. M. (2009). The effects of target templatespecificity on visual search in real-world scenes: Evidence from eyemovements. Journal of Vision, 9, 8. http://dx.doi.org/10.1167/9.11.8
Martinez-Trujillo, J. C., & Treue, S. (2004). Feature-based attention in-creases the selectivity of population responses in primate visual cortex.Current Biology, 14, 744–751. http://dx.doi.org/10.1016/j.cub.2004.04.028
Massey, F. J., Jr. (1951). The Kolmogorov-Smirnov test for goodness of fit.Journal of the American Statistical Association, 46, 68–78. http://dx.doi.org/10.1080/01621459.1951.10500769
Mast, F., & Frings, C. (2014). The impact of the irrelevant: The taskenvironment modulates the impact of irrelevant features in responseselection. Journal of Experimental Psychology: Human Perception andPerformance, 40, 2198–2213. http://dx.doi.org/10.1037/a0038182
Maunsell, J. H. R., & Treue, S. (2006). Feature-based attention in visualcortex. Trends in Neurosciences, 29, 317–322. http://dx.doi.org/10.1016/j.tins.2006.04.001
Nagy, A. L., & Sanchez, R. R. (2008). Chromaticity and luminance ascoding dimensions in visual search. Vision Research, 48, 1315–1326.
Navalpakkam, V., & Itti, L. (2007). Search goal tunes visual featuresoptimally. Neuron, 53, 605– 617. http://dx.doi.org/10.1016/j.neuron.2007.01.018
Nosek, B. A., Alter, G., Banks, G. C., Borsboom, D., Bowman, S. D.,Breckler, S. J., . . . Yarkoni, T. (2015). Promoting an open research
Thi
sdo
cum
ent
isco
pyri
ghte
dby
the
Am
eric
anPs
ycho
logi
cal
Ass
ocia
tion
oron
eof
itsal
lied
publ
ishe
rs.
Thi
sar
ticle
isin
tend
edso
lely
for
the
pers
onal
use
ofth
ein
divi
dual
user
and
isno
tto
bedi
ssem
inat
edbr
oadl
y.
14 GENG, DIQUATTRO, AND HELM

culture. Science, 348, 1422–1425. http://dx.doi.org/10.1126/science.aab2374
Palmer, J., Verghese, P., & Pavel, M. (2000). The psychophysics of visualsearch. Vision Research, 40(10–12), 1227–1268. http://dx.doi.org/10.1016/S0042-6989(99)00244-8
Peirce, J. W. (2007). PsychoPy—Psychophysics software in Python. Jour-nal of Neuroscience Methods, 162(1–2), 8–13. http://dx.doi.org/10.1016/j.jneumeth.2006.11.017
Peirce, J. W. (2009). Generating stimuli for neuroscience using PsychoPy.Frontiers in Neuroinformatics, 2, 10.
Peltier, C., & Becker, M. W. (2016). Decision processes in visual search asa function of target prevalence. Journal of Experimental Psychology:Human Perception and Performance, 42, 1466–1476. http://dx.doi.org/10.1037/xhp0000248
Pinheiro, J., Bates, D. DebRoy, S., Sarkar, D., & R Core Team. (2015).nlme: Linear and nonlinear mixed effects models. Retrieved from http://CRAN.R-project.org/package�nlme
R Core Team. (2015). R: A language and environment for statisticalcomputing. Vienna, Austria. Retrieved from http://www.R-project.org/
Rahnev, D., Lau, H., & de Lange, F. P. (2011). Prior expectation modulatesthe interaction between sensory and prefrontal regions in the humanbrain. Journal of Neuroscience, 31, 10741–10748.
Reynolds, J. H., & Heeger, D. J. (2009). The normalization model ofattention. Neuron, 61, 168–185. http://dx.doi.org/10.1016/j.neuron.2009.01.002
Romo, R., & de Lafuente, V. (2013). Conversion of sensory signals intoperceptual decisions. Progress in Neurobiology, 103, 41–75.
Ruff, C. C., & Driver, J. (2006). Attentional preparation for a lateralized visualdistractor: Behavioral and fMRI evidence. Journal of cognitive Neurosci-ence, 18, 522–538. http://dx.doi.org/10.1162/jocn.2006.18.4.522
Sayim, B., Grubert, A., Herzog, M. H., & Krummenacher, J. (2010).Display probability modulates attentional capture by onset distractors.Journal of Vision, 10, 1–8. http://dx.doi.org/10.1167/10.3.10
Stankevich, B. A., & Geng, J. J. (2014). Reward associations and spatialprobabilities produce additive effects on attentional selection. Attention,Perception, & Psychophysics, 76, 2315–2325. http://dx.doi.org/10.3758/s13414-014-0720-5
Störmer, V. S., & Alvarez, G. A. (2014). Feature-based attention elicitssurround suppression in feature space. Current Biology, 24, 1985–1988.http://dx.doi.org/10.1016/j.cub.2014.07.030
Suzuki, M., & Gottlieb, J. (2013). Distinct neural mechanisms of distractorsuppression in the frontal and parietal lobe. Nature Neuroscience, 16,98–104. http://dx.doi.org/10.1038/nn.3282
Töllner, T., Conci, M., & Müller, H. J. (2015). Predictive distractor contextfacilitates attentional selection of high, but not intermediate and low,
salience targets. Human Brain Mapping, 36, 935–944. http://dx.doi.org/10.1002/hbm.22677
Treue, S., & Martínez Trujillo, J. C. (1999). Feature-based attention influ-ences motion processing gain in macaque visual cortex. Nature, 399,575–579. http://dx.doi.org/10.1038/21176
Turk-Browne, N. B., Scholl, B. J., Chun, M. M., & Johnson, M. K. (2009).Neural evidence of statistical learning: Efficient detection of visualregularities without awareness. Journal of Cognitive Neuroscience, 21,1934–1945. http://dx.doi.org/10.1162/jocn.2009.21131
Vatterott, D. B., & Vecera, S. P. (2012). Experience-dependent attentionaltuning of distractor rejection. Psychonomic Bulletin & Review, 19,871–878. http://dx.doi.org/10.3758/s13423-012-0280-4
Verghese, P. (2001). Visual search and attention: A signal detection theoryapproach. Neuron, 31, 523–535. http://dx.doi.org/10.1016/S0896-6273(01)00392-0
Vickery, T. J., King, L.-W., & Jiang, Y. (2005). Setting up the targettemplate in visual search. Journal of Vision, 5, 81–92. http://dx.doi.org/10.1167/5.1.8
Wallis, J. D. (2007). Neuronal mechanisms in prefrontal cortex underlyingadaptive choice behavior. Annals of the New York Academy of Sciences,1121, 447–460. http://dx.doi.org/10.1196/annals.1401.009
Wang, Y., Miller, J., & Liu, T. (2015). Suppression effects in feature-basedattention. Journal of Vision, 15, 15. http://dx.doi.org/10.1167/15.5.15
Wilcox, R. R. (1997). Some practical reasons for reconsidering theKolmogorov-Smirnov test. British Journal of Mathematical and Statis-tical Psychology, 50, 9–20. http://dx.doi.org/10.1111/j.2044-8317.1997.tb01098.x
Wolfe, J. M. (1994). Guided search 2.0: A revised model of visual search.Psychonomic Bulletin & Review, 1, 202–238. http://dx.doi.org/10.3758/BF03200774
Wolfe, J. M., & Horowitz, T. S. (2004). What attributes guide the deploy-ment of visual attention and how do they do it? Nature Reviews Neu-roscience, 5, 495–501. http://dx.doi.org/10.1038/nrn1411
Wolfe, J. M., Horowitz, T. S., Kenner, N., Hyle, M., & Vasan, N. (2004).How fast can you change your mind? The speed of top-down guidancein visual search. Vision Research, 44, 1411–1426. http://dx.doi.org/10.1016/j.visres.2003.11.024
Zelinsky, G. J., Peng, Y., Berg, A. C., & Samaras, D. (2013). Modelingguidance and recognition in categorical search: Bridging human andcomputer object detection. Journal of Vision, 13, 30. http://dx.doi.org/10.1167/13.3.30
Received September 20, 2016Revision received March 15, 2017
Accepted March 16, 2017 �
Thi
sdo
cum
ent
isco
pyri
ghte
dby
the
Am
eric
anPs
ycho
logi
cal
Ass
ocia
tion
oron
eof
itsal
lied
publ
ishe
rs.
Thi
sar
ticle
isin
tend
edso
lely
for
the
pers
onal
use
ofth
ein
divi
dual
user
and
isno
tto
bedi
ssem
inat
edbr
oadl
y.
15SHAPE OF THE ATTENTIONAL TEMPLATE