human psa(prostate specific antigen) elisa kit
TRANSCRIPT
8th Edition, revised in October, 2018
(FOR RESEARCH USE ONLY. DO NOT USE IT IN CLINICAL DIAGNOSTICS !)
Human PSA(Prostate Specific Antigen) ELISA Kit Catalog No: E-EL-H0091
96T
This manual must be read attentively and completely before using this product.
If you have any problems, please contact our Technical Service Center for help (info in the header of
each page).
Phone: 240-252-7368(USA) 240-252-7376(USA)
Email: [email protected]
Website: www.elabscience.com
Please kindly provide us with the lot number(on the outside of the box) of the kit for more efficient
service.
Copyright ©2018-2020Elabscience Biotechnology Inc.All Rights Reserved

8th Edition, revised in October, 2018
www.elabscience.com 2
Intended use
This ELISA kit applies to the in vitro quantitative determination of Human PSA concentrations in
serum, plasma and other biological fluids.
Specification
●Sensitivity: 0.19ng/mL.
●Detection Range: 0.31-20ng/mL
●Specificity: This kit recognizes Human PSA in samples. No significant cross-reactivity or interference
between Human PSA and analogues was observed.
●Repeatability: Coefficient of variation is <10%.
Background
PSA stands for prostate-specific antigen. It is a protein produced by the cells of the prostate gland. This
antigen helps keep the semen liquefied so that sperm can swim freely. The antigen is usually found in
the prostate gland and semen, but small amounts of it can also move into the bloodstream and can be
measured by a blood test called a PSA test. Prostate cancer cells usually produce more PSA than do
benign cells, causing the levels in your blood to rise. However levels can also be elevated in men with
enlarged or inflamed prostate glands [1]. Prostate cancer has come to share the oncological centrestage
among male cancers. The availability of Serum Prostate Specific Antigen, PSA, as a marker has
encouraged its use to diagnose both cancer and cancer recurrence [2]. PSA is a sensitive serum marker
for prostate cancer but its specificity is limited by a high frequency of falsely elevated values in men
with benign prostatic hyperplasia (BPH).
1. Balk, Steven P., Yoo-Joung Ko, and Glenn J. Bubley. "Biology of prostate-specific antigen." Journal of Clinical
Oncology 21.2 (2003): 383-391.
2. Adhyam, Mohan, and Anish Kumar Gupta. "A review on the clinical utility of PSA in cancer prostate." Indian journal
of surgical oncology 3.2 (2012): 120-129.

8th Edition, revised in October, 2018
www.elabscience.com 3
Test principle
This ELISA kit uses the Sandwich-ELISA principle. The micro ELISA plate provided in this kit has
been pre-coated with an antibody specific to Human PSA. Standards or samples are added to the micro
ELISA plate wells and combined with the specific antibody. Then a biotinylated detection antibody
specific for Human PSA and Avidin-Horseradish Peroxidase (HRP) conjugate are added successively to
each micro plate well and incubated. Free components are washed away. The substrate solution is
added to each well. Only those wells that contain Human PSA, biotinylated detection antibody and
Avidin-HRP conjugate will appear blue in color. The enzyme-substrate reaction is terminated by the
addition of stop solution and the color turns yellow. The optical density (OD) is measured
spectrophotometrically at a wavelength of 450 nm ± 2 nm. The OD value is proportional to the
concentration of Human PSA. You can calculate the concentration of Human PSA in the samples by
comparing the OD of the samples to the standard curve.
Kit components & Storage
An unopened kit can be stored at 4℃ for 1 month. If the kit is not used within 1 month, store the items
separately according to the following conditions once the kit is received.
Item Specifications Storage
Micro ELISA Plate (Dismountable) 8 wells ×12 strips
-20℃, 6 months Reference Standard 2 vials
Concentrated Biotinylated Detection Ab (100×) 1 vial, 120 uL
Concentrated HRP Conjugate (100×) 1 vial, 120 μL -20℃(Protect from light), 6 months
Reference Standard & Sample Diluent 1 vial, 20 mL
4℃, 6 months Biotinylated Detection Ab Diluent 1 vial, 14 mL
HRP Conjugate Diluent 1 vial, 14 mL
Concentrated Wash Buffer (25×) 1 vial, 30 mL
Substrate Reagent 1 vial, 10 mL 4℃(Protect from light)
Stop Solution 1 vial, 10 mL 4℃
Plate Sealer 5 pieces
Product Description 1 copy
Certificate of Analysis 1 copy
Note: All reagent bottle caps must be tightened to prevent evaporation and microbial pollution.
The volume of reagents in partial shipments is a little more than the volume marked on the label,
please use accurate measuring equipment instead of directly pouring into the vial(s).

8th Edition, revised in October, 2018
www.elabscience.com 4
Other supplies required
Microplate reader with 450 nm wavelength filter
High-precision transfer pipette, EP tubes and disposable pipette tips
Incubator capable of maintaining37℃
Deionized or distilled water
Absorbent paper
Loading slot for Wash Buffer
Note
1. Please wear lab coats, eye protection and latex gloves for protection. Please perform the experiment
following the national security protocols of biological laboratories, especially when detecting blood
samples or other bodily fluids.
2. A freshly opened ELISA Plate may appear to have a water-like substance, which is normal and will
not have any impact on the experimental results.
3. Do not reuse the reconstituted standard, biotinylated detection Ab working solution, concentrated
HRP conjugate working solution. The unspent undiluted concentrated biotinylated detection Ab
(100×) and other stock solutions should be stored according to the storage conditions in the above
table.
4. The microplate reader should have a 450(±10 nm) filter installed and a detector that can detect the
wavelength. The optical density should be within 0~3.5.
5. Do not mix or use components from other lots.
6. Change pipette tips in between adding standards, in between sample additions, and in between
reagent additions. Also, use separate reservoirs for each reagent.
Sample collection
1. Serum: Allow samples to clot for 2 hours at room temperature or overnight at 4℃ before
centrifugation for 20 min at 1000×g at 2~8℃. Collect the supernatant to carry out the assay. Blood
collection tubes should be disposable and be non-endotoxin.
2. Plasma: Collect plasma using EDTA-Na2 as anticoagulant. Centrifuge samples for 15 min at 1000×
g at 2~8℃ within 30 min of collection. Collect the supernatant to carry out the assay. Hemolysed
samples are not suitable for ELISA assay!
3. Saliva: Remove particulates by centrifugation for 10 minutes at 4000×g at 2-8°C. Collect the
supernatant to carry out the assay. Recommend to use fresh saliva samples.
4. Urine: Use a sterile container to collect urine samples. Remove particulates by centrifugation for 15
minutes at 1000×g at 2-8°C. Collect the supernatant to carry out the assay.

8th Edition, revised in October, 2018
www.elabscience.com 5
Note for sample
1. Samples should be assayed within 7 days when stored at 4℃, otherwise samples must be divided up
and stored at -20℃ (≤1 month) or -80℃ (≤3 months). Avoid repeated freeze-thaw cycles.
2. Please predict the concentration before assaying. If the sample concentration is not within the range
of the standard curve, users must determine the optimal sample dilutions for their particular
experiments.
3. If the sample type is not included in the manual, a preliminary experiment is suggested to verify the
validity.
4. If a lysis buffer is used to prepare tissue homogenates or cell culture supernatant, there is a possibility
of causing a deviation due to the introduced chemical substance.
5. Some recombinant protein may not be detected due to a mismatching with the coated antibody or
detection antibody.

8th Edition, revised in October, 2018
www.elabscience.com 6
Reagent preparation
1. Bring all reagents to room temperature (18~25℃) before use. Follow the Microplate reader manual
for set-up and preheat it for 15 min before OD measurement.
2. Wash Buffer: Dilute 30 mL of Concentrated Wash Buffer with720 mL of deionized or distilled
water to prepare 750 mL of Wash Buffer. Note: if crystals have formed in the concentrate, warm it in a
40℃water bath and mix it gently until the crystals have completely dissolved.
3. Standard working solution: Centrifuge the standard at 10,000×g for 1 min. Add 1.0 mL of
Reference Standard &Sample Diluent, let it stand for 10min and invert it gently several times. After it
dissolves fully, mix it thoroughly with a pipette. This reconstitution produces a working solution of
20ng/mL. Then make serial dilutions as needed. The recommended dilution gradient is as follows: 20、
10、5、2.5、1.25、0.63、0.31、0 ng/mL.
Dilution method: Take 7 EP tubes, add 500uL of Reference Standard & Sample Diluent to each tube.
Pipette 500uL of the 20ng/mL working solution to the first tube and mix up to produce a 10ng/mL
working solution. Pipette 500uL of the solution from the former tube into the latter one according to
these steps. The illustration below is for reference. Note: the last tube is regarded as a blank. Don’t pipette
solution into it from the former tube.
20 10 5 2.5 1.25 0.63 0.31 0
4. Biotinylated Detection Ab working solution: Calculate the required amount before the experiment
(100 μL/well). In preparation, slightly more than calculated should be prepared. Centrifuge the stock
tube before use, dilute the 100× Concentrated Biotinylated Detection Ab to 1×working solution with
Biotinylated Detection Ab Diluent.
5. Concentrated HRP Conjugate working solution: Calculate the required amount before the
experiment (100 μL/well). In preparation, slightly more than calculated should be prepared. Dilute
the 100×Concentrated HRP Conjugate to 1×working solution with Concentrated HRP Conjugate
Diluent.
8th Edition, revised in October, 2018
www.elabscience.com 7
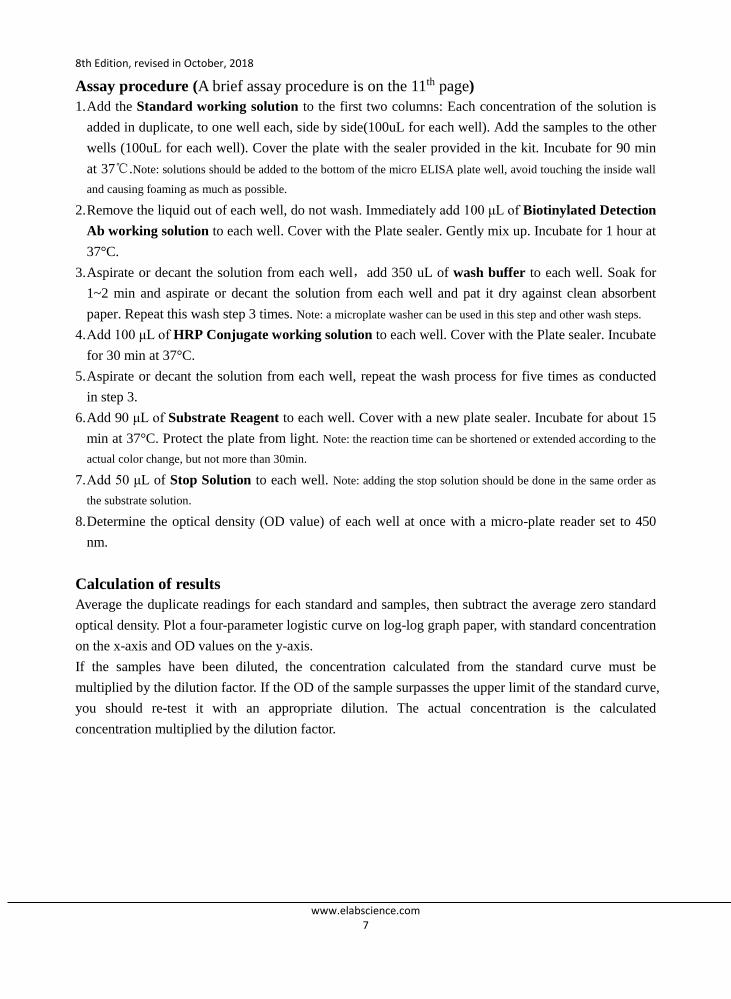
Assay procedure (A brief assay procedure is on the 11th page)
1. Add the Standard working solution to the first two columns: Each concentration of the solution is
added in duplicate, to one well each, side by side(100uL for each well). Add the samples to the other
wells (100uL for each well). Cover the plate with the sealer provided in the kit. Incubate for 90 min
at 37℃.Note: solutions should be added to the bottom of the micro ELISA plate well, avoid touching the inside wall
and causing foaming as much as possible.
2. Remove the liquid out of each well, do not wash. Immediately add 100 μL of Biotinylated Detection
Ab working solution to each well. Cover with the Plate sealer. Gently mix up. Incubate for 1 hour at
37°C.
3. Aspirate or decant the solution from each well,add 350 uL of wash buffer to each well. Soak for
1~2 min and aspirate or decant the solution from each well and pat it dry against clean absorbent
paper. Repeat this wash step 3 times. Note: a microplate washer can be used in this step and other wash steps.
4. Add 100 μL of HRP Conjugate working solution to each well. Cover with the Plate sealer. Incubate
for 30 min at 37°C.
5. Aspirate or decant the solution from each well, repeat the wash process for five times as conducted
in step 3.
6. Add 90 μL of Substrate Reagent to each well. Cover with a new plate sealer. Incubate for about 15
min at 37°C. Protect the plate from light. Note: the reaction time can be shortened or extended according to the
actual color change, but not more than 30min.
7. Add 50 μL of Stop Solution to each well. Note: adding the stop solution should be done in the same order as
the substrate solution.
8. Determine the optical density (OD value) of each well at once with a micro-plate reader set to 450
nm.
Calculation of results
Average the duplicate readings for each standard and samples, then subtract the average zero standard
optical density. Plot a four-parameter logistic curve on log-log graph paper, with standard concentration
on the x-axis and OD values on the y-axis.
If the samples have been diluted, the concentration calculated from the standard curve must be
multiplied by the dilution factor. If the OD of the sample surpasses the upper limit of the standard curve,
you should re-test it with an appropriate dilution. The actual concentration is the calculated
concentration multiplied by the dilution factor.

8th Edition, revised in October, 2018
www.elabscience.com 8
Typical data
As the OD values of the standard curve may vary according to the conditions of the actual assay
performance (e.g. operator, pipetting technique, washing technique or temperature effects), the operator
should establish a standard curve for each test. Typical standard curve and data is provided below for
reference only.
Concentration(ng/mL) 20 10 5 2.5 1.25 0.63 0.31 0
OD 2.273 1.519 0.847 0.399 0.246 0.155 0.108 0.058
Corrected OD 2.215 1.461 0.789 0.341 0.188 0.097 0.05 -
Sample values
Serum/Plasma–Samples from apparently healthy volunteers were evaluated for the presence of Human
PSA in this assay. No medical histories were available for the donors used in this study.
Sample Type Source Range Dilution Factor
Serum Healthy human ND-1.16 ng/mL 1-2
Plasma Healthy human ND-5.42 ng/mL 1-2

8th Edition, revised in October, 2018
www.elabscience.com 9
Precision
Intra-assay Precision (Precision within an assay): 3 samples with low, mid range and high level Human
PSA were tested 20 times on one plate, respectively.
Inter-assay Precision (Precision between assays): 3 samples with low, mid range and high level Human
PSA were tested on 3 different plates, 20 replicates in each plate.
Intra-assay Precision Inter-assay Precision
Sample 1 2 3 1 2 3
n 20 20 20 20 20 20
mean(ng/mL) 1 2.88 7.1 1.05 2.78 7.63
Standard deviation 0.07 0.17 0.26 0.05 0.13 0.34
CV (%) 7 5.9 3.66 4.76 4.68 4.46
Recovery
The recovery of Human PSA spiked at three different levels in samples throughout the range of the
assay was evaluated in various matrices.
Sample Type Range (%) Average Recovery (%)
Serum (n=5) 87-101 93
EDTA plasma (n=5) 91-102 96
Cell culture media (n=5) 91-106 97
Linearity
Samples were spiked with high concentrations of Human PSA and diluted with Reference Standard &
Sample Diluent to produce samples with values within the range of the assay.
Serum (n=5) EDTA plasma (n=5) Cell culture media (n=5)
1:2 Range (%) 94-108 85-96 87-97
Average (%) 101 91 92
1:4 Range (%) 89-102 85-99 86-100
Average (%) 94 90 91
1:8 Range (%) 91-106 84-95 85-97
Average (%) 98 89 91
1:16 Range (%) 88-99 83-98 87-99
Average (%) 93 90 94

8th Edition, revised in October, 2018
www.elabscience.com 10
Troubleshooting
Problem Causes Solutions
Poor standard
curve
Inaccurate pipetting Check pipettes.
Improper standard dilution
Ensure briefly spin the vial of standard and
dissolve the powder thoroughly by gentle
mixing.
Wells are not completely
aspirated Completely aspirate wells in between steps.
Low signal
Insufficient incubation time Ensure sufficient incubation time.
Incorrect assay temperature
Use recommended incubation temperature.
Bring substrate to room temperature before
use.
Inadequate reagent volumes Check pipettes and ensure correct
preparation. Improper dilution
HRP conjugate inactive or TMB
failure
Mix HRP conjugate and TMB, rapid
coloring.
Deep color but
low value Plate reader setting is not optimal
Verify the wavelength and filter setting on
the Microplate reader.
Open the Microplate Reader ahead to
pre-heat.
Large CV Inaccurate pipetting Check pipettes.
High
background
Concentration of target protein is
too high Use recommended dilution factor.
Plate is insufficiently washed
Review the manual for proper wash. If using
a plate washer, check that all ports are
unobstructed.
Contaminated wash buffer Prepare fresh wash buffer.
Low
sensitivity
Improper storage of the ELISA
kit
All the reagents should be stored according
to the instructions.
Stop solution is not added Stop solution should be added to each well
before measurement.
8th Edition, revised in October, 2018
www.elabscience.com 11
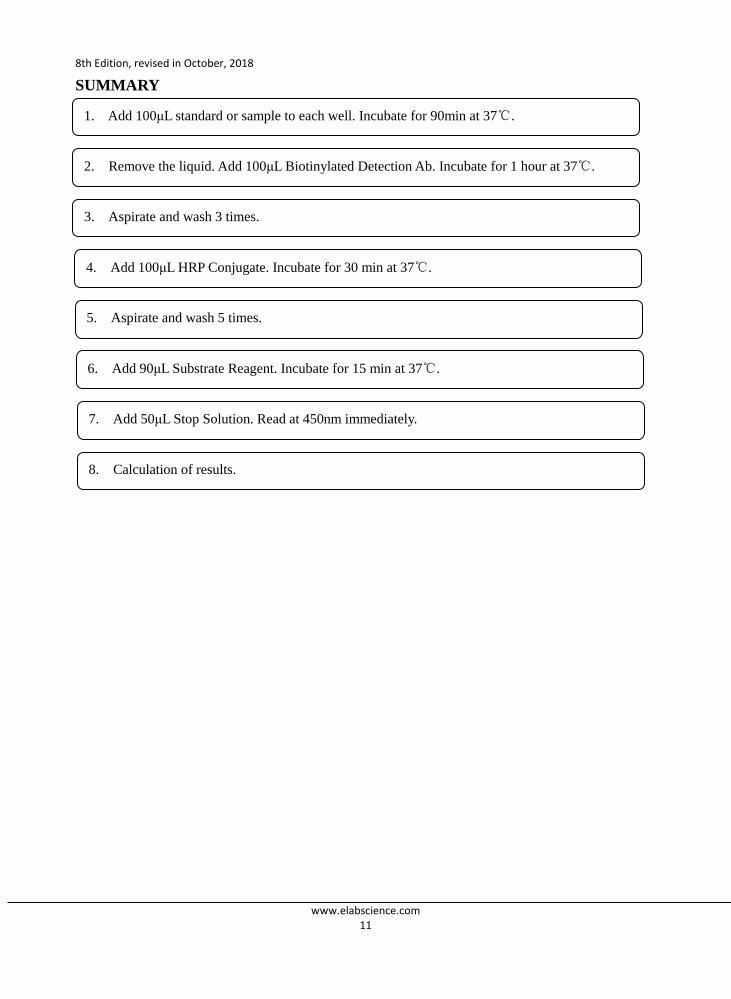
SUMMARY
1. Add 100μL standard or sample to each well. Incubate for 90min at 37℃.
2. Remove the liquid. Add 100μL Biotinylated Detection Ab. Incubate for 1 hour at 37℃.
3. Aspirate and wash 3 times.
4. Add 100μL HRP Conjugate. Incubate for 30 min at 37℃.
5. Aspirate and wash 5 times.
6. Add 90μL Substrate Reagent. Incubate for 15 min at 37℃.
7. Add 50μL Stop Solution. Read at 450nm immediately.
8. Calculation of results.

8th Edition, revised in October, 2018
www.elabscience.com 12
Declaration
1. Limited by current conditions and scientific technology, we can't conduct comprehensive
identification and analysis on all the raw material provided. So there might be some qualitative and
technical risks for users using the kit.
2. The final experimental results will be closely related to the validity of products, operational skills of
the operators and the experimental environments. Please make sure that sufficient samples are
available.
3. To get the best results, please only use the reagents supplied by the manufacturer and strictly comply
with the instructions!
4. Incorrect results may occur because of incorrect operations during the reagents preparation and
loading, as well as incorrect parameter settings of the Micro-plate reader. Please read the instructions
carefully and adjust the instrument prior to the experiment.
5. Even the same operator might get different results in two separate experiments. In order to get
reproducible results, the operation of every step in the assay should be controlled.
6. Every kit has strictly passed QC test. However, results from end users might be inconsistent with our
data due to some variables such as transportation conditions, different lab equipments, and so on.
Intra-assay variance among kits from different batches might arise from the above reasons, too.
Copyright ©2018-2020Elabscience Biotechnology Inc.All Rights Reserved