human resources development (hrd) … · the importance of intermediate and high skills development...
TRANSCRIPT
HUMAN RESOURCES DEVELOPMENT (HRD) BACKGROUND PAPER ONE
The importance of Intermediate and High Skills Development in the Western Cape
HUMAN SCIENCES RESEARCH COUNCIL Fabian Arends
HSRC Client Report
ii
EXPLANATORY FOREWORD
This is one of three Background Papers written to inform the HSRC’s report on the significance of intermediate and high-level skills development for a micro-economic development strategy in the Western Cape. Each Background Paper attempts to provide a comprehensive profile of key trends over the past ten years, to highlight current strengths, constraints and gaps, and to identify potential areas for intervention in order to grow the knowledge and skills base of a ‘Learning Cape’ province. The three areas of focus for this project are:
1. The underpinning infrastructure: public schooling in the Western Cape
2. The challenges of intermediate skilling in the Western Cape
3. The contribution of higher education to a Western Cape regional innovation system
The focus of this paper is on schooling as it provides the basic infrastructure for human resources development in the Western Cape. The three Background Papers were used as source documents for a synthesis report that argues for a multi-level skills strategy in the province, and identifies areas for engagement through a micro-economic strategy at the level of schooling, at the intermediate skills level, and in relation to harnessing the potential of higher education institutions to contribute to a regional system of innovation. These Background Papers represent the first phase of the project, and contain a wealth of empirical data. To understand the full significance of this data for a micro-economic strategy, the papers need to be read in conjunction with the synthesis report, and vice versa. As its starting point, each paper benefited from a wide range of research papers produced in 2003 on behalf of the Western Cape Department of Economic Development and Tourism, to inform a framework for a provincial Human Resources Development strategy. The papers that were used specifically for Background Paper 1 are on Early Childhood Development (Biersteker 2003) and General and Further Education and Training (Western Cape Department of Economic Development and Tourism 2003). The aim was to avoid ‘reinventing the wheel’, but rather to deepen and broaden the existing research coverage of key areas of education and training provision and human resources development in the province. So, in some cases, existing data tables were updated, and in other cases, significant issues that had not been covered were identified as a specific focus, to deepen existing coverage. For example, in Background Paper 1, we have focused on the issue of migration and its impact on schooling in the province.
HSRC Client Report
iii
In general then, each paper draws on the most up-to-date statistical data available, analysing provincial data in relation to national trends. Each paper also benefits from a number of national studies recently conducted by the HSRC in relation to areas that are not well researched, such as enterprise based training, or higher education-industry partnerships. These were mined to provide a fresh new analysis of provincial trends, to increase breadth of coverage.
Background Paper 1 THE UNDERPINNING INFRASTRUCTURE: PUBLIC SCHOOLING IN THE WESTERN CAPE
INTRODUCTION
The intent of this background paper is primarily descriptive, to identify key trends over the past six years which have implications for the transition of young people in the Western Cape through their educational and working lives.
The public provision of schooling contributes fundamentally to human resources development by laying the basis of the life skills needed to function in society, as well as preparing people for the labour market and higher education. This paper investigates the extent and quality of school coverage in the Western Cape from 1998 to 2003. It assesses the size of the school system over the last 6 years as well as its output. Its focus is a quantitative overview of access to education, the efficiency of the school system, and issues of equity in the provision and outcomes of schooling.
Access of children to schooling is shown through the growth in school enrolment and indicators such as the gross and net enrolment. The paper assesses internal efficiency by studying the dynamics of student flows and by measuring dropout and repetition. An analysis of enrolments resulting from intra-provincial and inter-provincial transfers and the impact it will have on the human and physical resources of the Western Cape is undertaken. Finally, indicators of learning achievement are investigated and include scores on international testing instruments and output from the Senior Certificate Examination.
Analysis will demonstrate that relative to national trends, the education system in the Western Cape is performing satisfactorily. The Western Cape schooling system ensures virtually universal access to schooling for children between the ages of 7 and 14, and on a key exit indicator, its learners have consistently achieved the highest provincial pass rate in the matriculation examination in recent years. However, there remain significant problems in relation to the efficiency and equity of the system, which have implications for the number and quality of school leavers available to enter the workforce, Further Education colleges and higher education institutions.

HSRC Client Report
2
The background paper itself does not propose strategies and interventions that may engage with the considerable challenges that still face the province. That will be the task of the synthesis report that is the culmination of this contribution to a micro-economic development strategy in the Western Cape.
LEARNER ENROLMENT BETWEEN 1993 AND 2001 IN THE WESTERN CAPE
This section looks in some detail at the learner enrolment in the Western Cape. It is important to monitor the extent to which the size of provincial education is changing, and whether the growth or shrinkage is due to increased enrolment, efficiency gains or learners dropping out. A decrease in learner enrolment due to declining demand has serious implications for the province’s human resources.
Table 1 shows the number of learners enrolled in the primary and secondary phases in 1993, 1998, 2000 and 2003 as well as the total growth and the average annual growth rate for each period. A major trend to emerge in relation to primary and secondary provision in the Western Cape and its impact on the Human Resources Development of the province is the increase in the numbers of learners in the schooling system. In 1993 there were 747 964 learners in public ordinary schools, and this number has increased to 898 034 in 2003. The most consistent growth was in the secondary phase, which increased by an average of 2 per cent per annum from 1998 to 2003.
Table 1: Number of learners and growth rates in ordinary public schools, 1993, 1998, 2000 and 2003
Year School Phase
Enrolment
Total percentage growth over previous period
Average annual percentage growth rate
1993 Primary 524,009
Secondary 223,955
Total 747,964
1998 Primary 590,015 13% 2%
Secondary 293,508 31% 6%
Total 883,523 18% 3%
2000 Primary 573,193 -3% -1%
Secondary 304,430 4% 2%
Total 877,623 -1% 0%
2003 Primary 570,551 0% 0%
Secondary 327,483 8% 2%
Total 898,034 2% 1% Source: 1993 data from Verwey and Munzhedzi (1994); 1998,2000 and 2003 data EMIS WC
Table 2 shows the learner enrolment and growth rates for successive years in public ordinary schools in the Western Cape for the period 1998 to 2003. The Western Cape saw a

HSRC Client Report
3
decline in primary enrolment for the period 1999-2000 and 2000-2001 followed by a slight increase for the period 2001-2002. While enrolment in Grade 1 grew annually by 2 per cent from 1993 to 1998 it experienced a 12 per cent decline in 1999 and then a 26 per cent decline in 2000 due to the policy change of that year, which precluded the entry of children under age 7. In 2002, the age policy was reversed/amended (DoE 1998b), and entry into Grade 1 grew by 6.3 per cent. The stable pattern of primary enrolment since 2002 suggests a recovery but trends are distorted by policy change to the extent that any firm conclusion is difficult.
The dynamics in secondary enrolment are also noteworthy. Secondary enrolment in the Western Cape has shown a year-to-year growth of more than 2 per cent, except for the 1999-2000 period where enrolment growth dropped to about 1 per cent. Grade 12 enrolments seem to fluctuate slightly from year to year with either an increase or a decrease in a two-year cycle. Grade 12 enrolment has dropped relative to overall secondary enrolment. Table 2 shows a substantial drop in learner numbers after Grade 10, for all the years indicated. The phenomenon referred to as ‘gate-keeping’, that is, preventing at-risk Grade 10 or 11 learners from proceeding, is not sufficient enough to contribute to the massive loss of learners in the Western Cape (see below for further elaboration of the phenomenon). Part of the problem of high dropouts can be attributed to the transition within the GET phase, usually from Grade 7 to Grade 8, and from GET to FET. Do students encounter difficulties adjusting socially to a new school? To what extent do students benefit from school transition programmes? Importantly, how does the junior secondary level prepare students for the academic demands of the FET curriculum?
Table 2: Number of learners and growth rates in ordinary public schools, 1998 - 2003
1998 1999 2000 2001 2002 2003
1998- 1999
1999- 2000
2000- 2001
2001- 2002
2002- 2003
GR 1 98,969 87,430 64,835 81,790 86,962 86,912 -11.7 -25.8 26.2 6.3 -0.1
GR 2 89,824 92,922 81,860 62,960 77,018 82,447 3.4 -11.9 -23.1 22.3 7.0
GR 3 85,295 88,605 92,334 81,832 64,129 75,930 3.9 4.2 -11.4 -21.6 18.4
GR 4 84,883 88,010 91,940 94,302 83,015 66,029 3.7 4.5 2.6 -12.0 -20.5
GR 5 80,621 83,068 85,757 89,254 93,176 82,381 3.0 3.2 4.1 4.4 -11.6
GR 6 76,549 78,492 80,654 83,305 86,786 92,338 2.5 2.8 3.3 4.2 6.4
GR 7 73,874 74,661 75,813 77,778 80,865 84,514 1.1 1.5 2.6 4.0 4.5
Total Primary 590,015 593,188 573,193 571,221 571,951 570,551 0.5 -3.4 -0.3 0.1 -0.2
GR 8 76,901 79,043 80,026 82,190 75,601 81,154 2.8 1.2 2.7 -8.0 7.3
GR 9 67,586 69,674 70,634 71,966 80,450 73,200 3.1 1.4 1.9 11.8 -9.0
GR 10 61,926 63,479 63,840 67,034 69,752 81,739 2.5 0.6 5.0 4.1 17.2
GR 11 46,115 49,247 48,934 50,206 51,618 51,746 6.8 -0.6 2.6 2.8 0.2
GR 12 40,980 40,206 40,996 39,910 40,468 39,644 -1.9 2.0 -2.6 1.4 -2.0
Total Secondary 293,508 301,649 304,430 311,306 317,889 327,483 2.8 0.9 2.3 2.1 3.0
Total GR 1 - 12 883,523 894,837 877,623 882,527 889,840 898,034 1.3 -1.9 0.6 0.8 0.9 Source: Data EMIS WC
HSRC Client Report
4
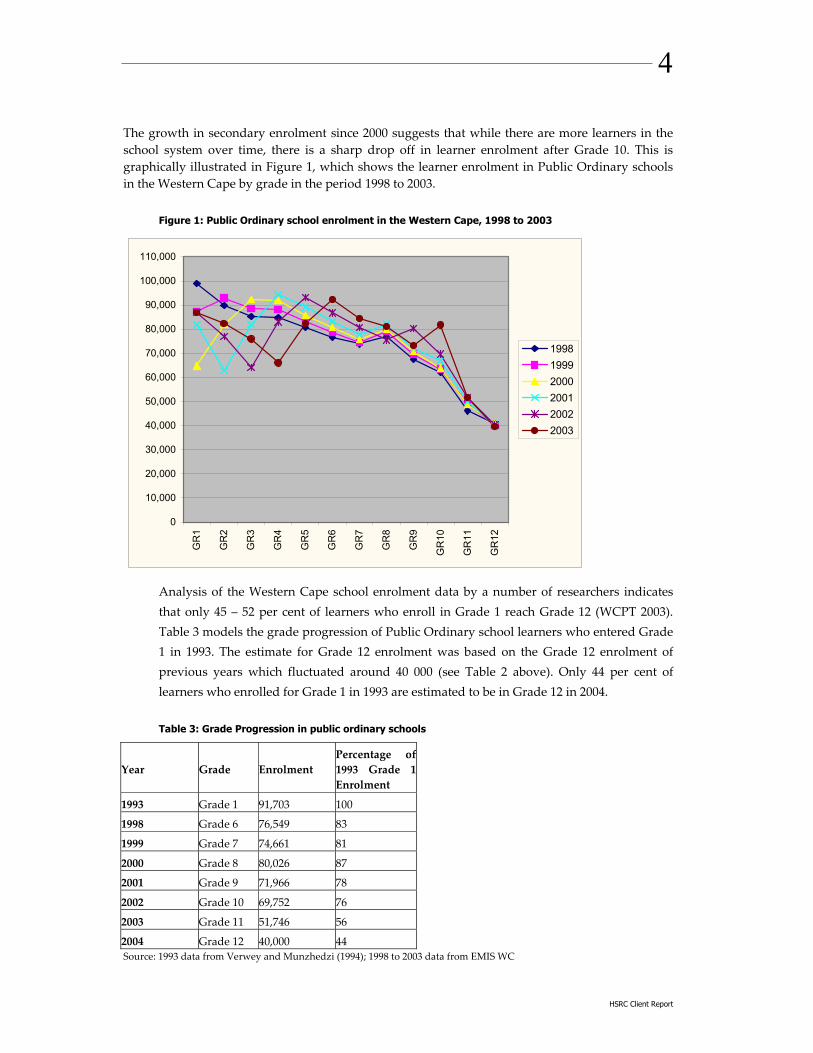
The growth in secondary enrolment since 2000 suggests that while there are more learners in the school system over time, there is a sharp drop off in learner enrolment after Grade 10. This is graphically illustrated in Figure 1, which shows the learner enrolment in Public Ordinary schools in the Western Cape by grade in the period 1998 to 2003.
Figure 1: Public Ordinary school enrolment in the Western Cape, 1998 to 2003
0
10,000
20,000
30,000
40,000
50,000
60,000
70,000
80,000
90,000
100,000
110,000
GR
1
GR
2
GR
3
GR
4
GR
5
GR
6
GR
7
GR
8
GR
9
GR
10
GR
11
GR
12
199819992000200120022003
Analysis of the Western Cape school enrolment data by a number of researchers indicates that only 45 – 52 per cent of learners who enroll in Grade 1 reach Grade 12 (WCPT 2003). Table 3 models the grade progression of Public Ordinary school learners who entered Grade 1 in 1993. The estimate for Grade 12 enrolment was based on the Grade 12 enrolment of previous years which fluctuated around 40 000 (see Table 2 above). Only 44 per cent of learners who enrolled for Grade 1 in 1993 are estimated to be in Grade 12 in 2004.
Table 3: Grade Progression in public ordinary schools
Year Grade Enrolment Percentage of 1993 Grade 1 Enrolment
1993 Grade 1 91,703 100
1998 Grade 6 76,549 83
1999 Grade 7 74,661 81
2000 Grade 8 80,026 87
2001 Grade 9 71,966 78
2002 Grade 10 69,752 76
2003 Grade 11 51,746 56
2004 Grade 12 40,000 44 Source: 1993 data from Verwey and Munzhedzi (1994); 1998 to 2003 data from EMIS WC

HSRC Client Report
5
EDUCATION COVERAGE
The Gross and Net Enrolment Ratios are standard education indicators of access and coverage and provide some indication of the internal efficiency of the education system. When read together and looked at over time, they paint a picture of the extent to which the school system accommodates the youth of the country.
Gross enrolment ratio
Table 4 shows the gross enrolment ratio for both Public and Independent schools in primary and secondary schooling for 1997, 2000 and 2001 for the Western Cape. Primary education coverage has been extensive since 1985, covering far more than the population of school-going age (Perry and Arends, 2003). The decrease in the primary school GER between 1997 and 2000 is primarily due to the implementation of the age grade admissions policy in 2000 (DoE 1998b). The increase in the GER at secondary level between 1997 and 2000 is an indication of the growth of learner numbers relative to the population growth of 14 –18 year-olds.
The implementation of the age grade admissions policy was expected to bring stability to Grade 1 enrolment after 2000. What is of concern is the huge difference in the primary GER for 2000 and 2001 in the Western Cape. Ordinary school enrolment decreased from 585 770 in 2000 to 585 361 in 2001, a negligible amount. At the same time Stats SA projections for the primary Appropriately School Age Population, 7 – 13 years, showed a decrease of 612 252 in 2000 to 529 153 in 2001, that is by 14 per cent. While ordinary school’ enrolment remained constant over this period the statistical techniques employed by Stats SA to project population numbers indicated a substantial reduction in the appropriately school aged population for the primary phase, resulting in the high GER for 2001.
Table 4: Gross enrolment ratio (percentage) in the ordinary public and independent school sector, 1997, 2000 and 2001
Year Primary Secondary
7-13 years 14-18 years Total
1997 111% 77% 97%
2000 96% 84% 91%
2001 111% 82% 99% Source: 1997 data from DoE’s 1997 Annual School Survey database; 2000 data from DoE (2002a); 2001 data from DoE (2003a)
Table 5 shows the GER for Public Ordinary school learners for the years 2000 – 2003. “Education Statistics in South African at a Glance in 2001”(DoE 2002a) indicates that 96.8 per cent of Western Cape learners attended public schools in 2001. This proportion was calculated from the appropriate age data in Census 2001, and the 2000 and 2002 Labour Force Surveys to arrive at an estimate that was used to determine the GER by grade for Public Ordinary schools.

HSRC Client Report
6
Grades with more than 100 per cent coverage reflect a situation where more children are accommodated than children of the appropriate age in the population.
Table 5: Gross enrolment ratio (percentage) by grade in the ordinary public school sector, 2000 - 2003
Grades 2000 2001 2002 2003
GR1 74.6% 103.4% 107.5% 105.0%
GR2 95.4% 80.7% 96.5% 101.0%
GR3 108.7% 100.9% 77.4% 89.7%
GR4 109.1% 112.2% 96.9% 75.6%
GR5 102.4% 105.2% 108.1% 94.1%
GR6 96.6% 102.6% 105.7% 111.1%
GR7 90.8% 98.6% 101.8% 105.6%
Total Primary 96.7% 100.7% 99.1% 97.2%
GR8 110.9% 103.2% 94.7% 101.3%
GR9 97.4% 86.4% 96.8% 88.1%
GR10 87.4% 77.6% 81.3% 95.9%
GR11 66.7% 58.9% 61.1% 61.8%
GR12 55.8% 45.0% 45.9% 45.2%
Total Secondary 83.5% 73.5% 75.4% 78.0%
Total Gr1-12 91.7% 89.1% 89.1% 89.2% Source: WC EMIS; Census 2001, Labour Force Surveys 2000 and 2002
Net enrolment ratio
The Net Enrolment Ratio (NER) is a measure of the internal efficiency of the schooling system and only measures those learners who are of the appropriate age for the primary and secondary phase. The NER of 86.2 per cent in the primary phase in 2003 indicates that only that proportion of the population aged 7 – 13 were accommodated in the primary phase. The higher GER of 97.2 per cent is a reflection of the repetition rates in primary school, resulting in a high percentage of over-aged learners in the primary phase. The NER for the secondary phase for the same period is 63.6 per cent and the GER 78 per cent. The higher GER reflects the high repetition rates in secondary schools and the presence of over-aged learners.
Table 6: Net enrolment ratio (percentage) in the ordinary public school sector, 2001, 2002 and 2003
School enrolment Population Net Enrolment Ratio
Primary Secondary Total 7-13 14-18 Total Primary Secondary Total
2000 504,102 248,231 752,333 592,660 364,470 957,130 85.1% 68.1% 78.6%
2001 516,937 250,757 767,694 567,224 423,301 990,524 91.1% 59.2% 77.5%
2002 521,058 256,260 777,318 576,988 421,470 998,458 90.3% 60.8% 77.9%
2003 505,891 267,118 773,009 587,093 419,826 1,006,919 86.2% 63.6% 76.8% Source: WC EMIS; Census 2001, Labour Force Surveys 2000 and 2002

HSRC Client Report
7
The Gender Parity Index
The Gender Parity Index (GPI) is used to indicate the level of access of females to education compared to that of males. Table 7 shows the GPI for 2000 and 2001 in primary education was 0.99 and for the same years 1.15 and 1.13 respectively in secondary education. This means that there were 1 per cent fewer female learners than male learners at the primary school level, whilst, on the other hand there were 15 per cent and 13 per cent more female learners than male learners at secondary school level for the years 2000 and 2001 respectively. Although no analysis was done with regard to the throughput rates by gender (data not available), it seems as if the repetition and dropout rates for boys is higher than that of girls in the secondary level.
Table 7: Gross Enrolment Ratio (GER) and Gender Parity Index (GPI) for 2000 and 2001
GER GPI
Year
Gender Primary (as
a %) Secondary (as a %)
Total (as a %) Primary Secondary Total
2000 Female 95 90 93
Male 96 78 89
Total 96 84 91 0.99 1.15 1.04
2001 Female 110 87 100
Male 111 77 97
Total 111 82 99 0.99 1.13 1.03 Source: 2000 data from DoE (2002a); 2001 data from DoE (2003a)
INTERNAL EFFICIENCY
Access to education is tempered by the inefficient flow-through of learners due to repetition and dropout. This section looks at a number of indicators of internal efficiency, namely dropout and repeater rates and the number of year’s effort to complete schooling. Promotion, repetition and dropout are essentially the three paths of student flow from grade to grade, which characterise the efficiency of the education system in producing graduates. These rates are therefore used for evaluation, monitoring and projection of student flow in an education system.
Repetition and dropout rates
Table 8 shows the 2000/2001, 2001/2002 and 2002/2003 promotion, repetition and dropout rates. Grade 1 has the lowest promotion rate and the highest repetition rate (except for the 2000/2001 period) of the primary grades, probably because of inadequate preparation or school readiness. Many teachers believe that retention, particularly in the early grades, is an effective strategy to remedy poor school performance and may reduce the likelihood of later school failure. Although it is difficult to ascertain the real reasons for this, Roderick as cited

HSRC Client Report
8
by Hunter and May (2003) argues that retention rates have been found to depend largely upon school system policies and educators’ attitudes toward the benefits of retention.
What is of concern is the dynamics in the Further Education and Training section of the secondary phase. The declining promotion rates in Grades 10 and 11 from 2000 to 2002 have been accompanied with increasing repetition and dropout rates.
The national Department of Education report on ‘Trends in Senior Certificate Enrolment’ (2002c) attributed the decline in candidate numbers in Grade 12 to four factors: a reduction in the number of repeaters, the discouragement of ‘at risk’ grade 11 learners from progressing to grade 12, the failure of candidates who registered to write the exams, and the introduction of age-grade norms. According to the Department, the bulk of the reduction was because of the last factor. The high repetition and dropout rates in Grades 10 and 11 are evidence of the practice of ‘gate-keeping’ and ‘constriction’ of learners in these grades.
Table 8: Promotion, Repetition and Dropout rates, 2000, 2001 and 2002
Year: 2000-2001 Year: 2001-2002 Year: 2002-2003
Promotion
Rate
Repetition
Rate
Dropout
Rate
Promotion
Rate
Repetition
Rate
Dropout
Rate
Promotion
Rate
Repetition
Rate
Dropout
Rate
Gr 1 92.1 5.2 2.7 91.6 5.1 3.3 91.4 5.5 3.1
Gr 2 95.9 4.0 0.2 97.4 3.4 -0.8 95.9 3.8 0.3
Gr 3 96.5 3.6 -0.2 97.2 3.5 -0.6 97.9 3.0 -1.0
Gr 4 93.6 5.6 0.8 95.7 3.7 0.6 95.9 3.8 0.2
Gr 5 94.7 3.8 1.6 95.0 3.3 1.6 96.5 2.9 0.6
Gr 6 95.2 2.6 2.1 95.6 2.4 2.0 95.7 2.7 1.7
Gr 7 97.0 1.3 1.7 94.3 1.5 4.2 94.8 1.8 3.4
Gr 8 79.5 10.8 9.7 90.0 2.8 7.2 89.0 5.9 5.0
Gr 9 82.0 11.8 6.2 83.2 9.0 7.8 85.9 7.3 6.8
Gr 10 70.5 14.3 15.2 68.9 14.7 16.4 64.8 18.2 17.0
Gr 11 77.9 10.6 11.5 77.0 10.9 12.1 75.3 12.7 12.0 Source: WC EMIS
Possible factors that lead to repetition and dropout in developing countries, and appear to be of relevance to explaining the problem in the Western Cape are:
• Schooling that cuts the young children off from the home language (UNESCO, 1998, 2000a, and 2000b)
• Children without access to early childhood development in the form of pre-school preparation (Bot 2000; Bot, Gordon and Patel, 2001; UNESCO, 1998, 2000b)
• Heavy domestic responsibilities for girls including care of siblings
• Teenage pregnancy (HSRC, 2001b; Truscott, 1994; UNICEF 1999, Wolpe et al, 1997)
HSRC Client Report
9
• Health and Nutrition (UNESCO 1998)
• Level of educators’ qualifications (Crouch & Mabogoane 2001)
• Management of schools, and in particular management of the available resources (Crouch & Mabogoane 2001)
Years of effort to complete primary and attain Grade 11 and 12
Seekings (WCPT 2003) found that up to the age of seventeen, enrolment in school was almost 100 per cent among White adolescents, while enrolment was lower among African adolescents, and even lower among Coloured adolescents. Seekings also found that African adolescents remained in primary school long past the age when White and Coloured adolescents had moved into secondary school. Young African adults also remained in secondary school long past the age when Coloured and White young adults had left. African children not only started school later than White and Coloured children, but also were more likely to fail or repeat grades. By the age of 18 years, African and Coloured children were 5 times as likely to have failed a grade than their White counterparts.
Significant proportions of African and Coloured adolescents and youths also left school without completing matric. African adolescents tended to drop out at older ages (older than 17) having completed Grades 9, 10 or 11, but without completing matric. Coloured adolescents dropped out at younger ages (especially 15 and 16 years), having completed only Grade 7, 8 or 9. Almost half of dropouts occurred during the school year. The most commonly cited reasons given for dropping out included the family’s inability to afford to keep the learner in school or because the learner found a job or wanted to look for a job (WCPT 2003).
Yamauchi (2003) argues that grade repetition induces early transition to the labour force and worsens employment prospects in labour markets. Since those who have repeated and participate in labour markets are young and uneducated, grade repetition deteriorates labour markets, by worsening the quality of labour supply, increasing the unemployment rate and ultimately strengthening downward pressures on wage distribution.
RACIAL COMPOSITION OF SCHOOLS AND MIGRATION
This section looks in some detail at the racial composition of Western Cape schools and the intra-provincial and inter-provincial transfer of learners. The section will first look at the extent of racial integration in Western Cape schools and then will consider whether this can be attributed to intra-provincial or inter-provincial migration of learners.
HSRC Client Report
10
Racial composition
Table 9 shows the number of Public Ordinary schools according to former department and racial categories. A school is classified in a particular “race type” if more than 50% of pupils are from that particular race group. Schools classified as “Other” are schools where no race dominated in this way and schools, which refused to divulge race information in the Annual Schools Survey. The number of schools where African and Coloured learners constitute a majority of more than 50 per cent have increased when compared to schools where these learners were enrolled according to apartheid racial categorisation. African learners were historically enrolled in former Department of Education and Training (DET) schools, Coloured learners in former House of Representative (HOR) schools, and Indian learners in former House of Delegate (HOD) schools and White learners in former Cape Education Department (CED) schools.
Table 9: Number of public ordinary schools according to former department and race, 2003
Former categorisation of schoolsbefore 1994
Schools, 2003, where race group is the majority
Ex-Department Total Race Total
DET 179 African 216
HOR 953 Coloured 974
HOD 6 Indian 2
CED 319 White 186
Total 1,457 Other 79
Total 1,457 Source: Western Cape EMIS
Migration
Blanchard (1974) defines migration as driven by economic pressures, where households move in order to seek employment, which produces a secondary movement of school age dependents. There is also a form of education driven migration – the movement of school age students in order to seek school access or to seek access to institutions perceived to be of better quality that offer a wider range of curriculum (Paterson and Kruss 1998). Students now also migrate to urban areas, which are seen as environments that are more supportive of school attendance, or that of better prospects for post-school employment.
Table 10 shows the number of intra provincial and inter provincial transfers of learners as well as learners transferring out of Western Cape schools for the years 2002 and 2003. Former DET schools experienced the highest number of inter provincial transfers, possibly from the Eastern Cape, which constitute 6.8 per cent of total enrolment. The high number of intra provincial transfers and transfers out of schools, could be of pupils searching for schools or the high rate of urbanisation experienced in the Western Cape.

HSRC Client Report
11
Table 10: Transfers in public ordinary schools, 2002 and 2003
2002 2003
Ex-Department Inter Provincial
Intra Provincial
Transferring Out
Inter Provincial
Intra Provincial
Transferring Out
DET 11,022 13,895 6,858 12,506 10,474 5,632
HOR 2,650 36,120 21,877 2,647 27,351 17,259
HOD 26 252 161 17 214 123
CED 2,472 13,129 12,012 2,351 9,843 9,192
Total 16,170 63,396 40,908 17,521 47,882 32,206 Source: Western Cape EMIS
Former HOR schools have the largest numbers of learners in terms of intra provincial transfers and learners transferring out of these schools. A recent study on migration in the Western Cape states that it is clear that concern for children’s schooling remains strong in rural Coloured communities, and is capable of affecting migration flows for the Coloured population. In Coloured households, most migration was local. This result is supported by qualitative data in Cape Town, where Coloured learners often lodge with kin to be able to access better schools in the metro (Mongwe as cited by Cloete 2002).
Mongwe as cited by Cloete (2002) reports on the power of perceptions and how they influence decisions taken by both parents and learners. Middle class African township residents tend to be very critical of township schools and prefer to send their children to former white and coloured school. The standard of education in the Western Cape is perceived as superior to that offered in the Eastern Cape, schools in formerly coloured neighbourhoods are perceived to be superior to schools in African townships and schools in formerly white neighbourhoods are again perceived to be superior to schools in both formerly coloured and black townships.
The perceptions are that the Western Cape has a significantly better infrastructure and also offers a relatively better quality of life than the two neighbouring provinces, the Eastern Cape and Northern Cape, the two provinces from where most of the in migrants come (Cloete 2002).
The intra provincial transfers into former White (CED) schools can be attributed to the enrolment of mostly Coloured learners in these schools. According to the Western Cape migration study mentioned above, White respondents sampled, had a relatively low concern over schooling, and not as high in the rural districts as in the metro itself. The study concludes that outside of the West Coast, it does not appear that perceived deficiencies in children’s schooling are likely to drive significant on-migration among rural Whites in the Western Cape. The possibility then exist that White learners either transfer to other CED schools within the province or perhaps enroll in private schools.
HSRC Client Report
12
Further analysis reveals that approximately 52 per cent of the total Indian/Asian learner population in the province is enrolled in former CED schools and 15 per cent in former HOR schools. Coloured learners make up 27.9 per cent of total learners in former HOD schools. This gives a picture of the intra provincial migration of learners in the Western Cape.
A study by Van der Berg and Achterbosch (2001) based on education statistics for 2000 draws the following conclusions:
That transfers are high and enrolments ‘volatile’
The mobility between schools is more connected to “school searching” (intra provincial migration) than migration into the Western Cape from other provinces.
Consequently, they argue that the extent of intra provincial transfers should be more of a concern than inter provincial transfers.
However, the arguments can be understood as speculative given the difficulty of tracking migration on school level data.
SCHOOL RESOURCES
According to the White Paper on Education and Training, the state’s resources must be deployed according to the principle of equity, so that they are used to provide essentially the same quality of learning opportunities for all citizens. This is an inescapable duty of government in the light of South Africa’s history and its legacy of inequality. It is also a constitutional requirement (DoE 1995). This section looks at the extent of resource inequality inherited and the extent to which the government has been able to address this since 1996.
One of the most significant and costly inputs to education is an educator. Nationally the number of state-paid educators decreased between 1996 and 2000 by 6.6 per cent. The decreases in the number of state paid educators occurred at a faster rate than the decrease in the number of learners between 1996 and 2000 resulting in an increase in the learner educator ratio over that period.
The Western Cape showed a significant drop in educator numbers during this period. While educator numbers decreased by 20 per cent, learner enrolment increased by 5.1 per cent, resulting in the learner educator ratio increasing from 27:1 in 1996 to 35:1 in 2000. The drop in educator numbers between 1996 and 2000, nationally, was due to redeployment and rationalisation.

HSRC Client Report
13
Policy allowing schools to employ governing-body educators was enacted in the early 1990s and by 1996 there were 10 931 governing-body paid educators nationally. This constitutes eight per cent of all educators employed in public schools. In the Western Cape the number of governing-body paid educators increased by 187 per cent from 1 399 in 1996 to 4 012 in 2000 and increased between 2000 and 2003 by 35 per cent.
Table 11: Number of State-paid and governing body-paid educators, 1996, 2000 and 2003 in the Western Cape
Year Number of state-paid educators
Number of SGB-paid educators
Total number of educators
Learner/educator ratio of state-paid educators
Learner/educator ratio of SGB-paid educators
1996 32,315 1,399 33,714 27 26
2000 25,861 4,012 29,873 35 31
2003 25,401 5,411 30,812 35 31 Source: 1996 and 2000 data from DoE (2001c); 2003 from WC EMIS
The dramatic increase in the number of governing-body paid educators had a significant impact on the learner educator ratio in public ordinary schools in the province. The 2003 learner educator ratio for the Western Cape is 35:1, when considering state-paid educators only. When governing body-paid educators are included in the equation, the learner educator ratio decreases to 31:1.
EQUITY IN LEARNING ACHIEVEMENT
The measurement of learning achievement has relied almost entirely on the Senior Certificate Examination (SCE). There have been a number of initiatives supported by the international agencies in collaboration with the Department of Education to test a nationally valid sample of South African learners in mathematics, literacy and life skills. This section looks at the findings of two of the most recent of these instruments – the Third International Mathematics and Science Study Repeat (TIMMS-R) and the Monitoring Learning Achievement (MLA) project, as well as the Senior Certificate Examination.
Mathematics and Science Foundations
The Third International Mathematics and Science Study Repeat (TIMMS-R) was conducted in 1998 and 1999 in 38 participating countries and tested Grade 8 learners in mathematics and science competence. South Africa’s test scores in both mathematics and science were significantly lower than all the other tested. The mean scores of 275 and 243 for mathematics and science respectively are well below the international average of 487 and 488 for these two subjects. The result is significantly below the mean scores of all other participating countries, including the two other African countries of Morocco and Tunisia as well as that of other developing and newly developed countries such as Malaysia, the Philippines, Indonesia and Chile.
HSRC Client Report
14
The Western Cape had the highest scale scores for both mathematics (393) and science (381) of all provinces. Overall, it appears that boys did better than girls, although the differences in most cases are not significant. The Western Cape was the only province where girls did better than boys in both mathematics and science. Perhaps this has to do with the more liberal attitudes towards girls and their studies at schools, as well as the greater or equal access to materials related to mathematics because of its highly urbanised population (Howie 2001).
The Monitoring Learning Achievement (MLA) is a project of the Unesco/Unicef’s Education for All campaign, which aims to monitor education quality. The testing of a national sample of Grade 4 learners in literacy, numeracy and life skills is one aspect of this project and was conducted in South Africa in 1999 in conjunction with a number of African countries.
A large proportion of South African Grade 4 pupils scored below 25 per cent for the numeracy task, while about 2 per cent obtained scores in the 75 – 1000 per cent range. The Western Cape scores in numeracy, literacy and life skills were well above the national average. The MEC for Education in the Western Cape in 2001 mentioned that while the Western Cape achieved the highest average mark in the MLA study of 37.9 per cent, it was still far from satisfactory. The mark also hid the desperate situation in many disadvantaged schools where the average mark was significantly lower.
A Joint Education Trust (JET) study of Grade 3 learners in 28 disadvantaged schools in 2000 found that most Grade 3 learners at these schools could not handle mathematics at Grade 3 level, and experienced difficulty with mathematics at Grade 1 and Grade 2 levels. A separate study by the German Technical Organisation (GTZ) in 2000 found that performance in mathematics declined significantly in disadvantaged schools between Grades 3 and 6 (WCED 2001). The studies showed that most children in primary schools in disadvantaged areas are not acquiring the numeracy skills they so desperately need for high school. This reflects a growing crisis in mathematics and science education in Western Cape schools.
Senior Certificate Examinations
The Matriculation or Senior Certificate (SCE) is regarded as the main outcome indicator of the education system. However, Meyer and Motala (1997) argue that as the focus shifts away from the academic bias in our schooling system to vocational education and other exit points from the system, new indicators will have to be developed. Among the major problems with using the matric pass rates as an indicator of performance are, firstly, that many pupils do not get as far as Grade 12, and, secondly, that the pass rate does not indicate the how many years the successful pupils took in getting to Grade 12 (Seeking, 2002).

HSRC Client Report
15
Nevertheless, the number and profile of learners who sit for and write the SCE continues to provide some indication of the contribution of schooling to human resource development and more specifically to the stock of learners who are eligible to proceed to higher education and training opportunities.
Overall performance in the SCE
Only three provinces (Gauteng, Northern Cape and Western Cape) experienced an increase in the number of candidates writing the examinations between 2002 and 2003. All provinces recorded an increase in their pass rate in 2003. Increases ranged from less than one percentage point in the Western Cape to a high of nine percentage points in the Free State and eight in the Eastern Cape. The Western Cape achieved the second highest past rate, 87 per cent, and had the highest proportion of candidates who passed with university endorsement, 27 per cent.
Table 21 shows the national and Western Cape enrolment and pass rates disaggregated by gender in 2002 and 2003. Both years show substantially more female than male candidates enrolled for the SCE. While there are more females than males passing the examination, their performance as measured by the pass rate has been poorer than their male counterparts. This holds true for both the national and Western Cape SCE results. This gap in performance has remained constant at the national level with the female pass rate only 3.3 percentage points lower than the male pass rate in 2002 and 2003. This gap in performance in the Western Cape shows the female pass rate as 1.4 and 2.6 percentage points lower than the male pass rate in 2002 and 2003 respectively. Although the gap has remained unchanged at the national level, in the Western Cape it shows a slight increase.
Table 12: Number of SCE candidates enrolled and passing and as a percentage of the total, 2002 and 2003.
Province Year Gender
Candidates Percentage of total
Candidates passing
Percentage pass rate
Candidates gaining and endorsement
Percentage endorsement rate
2002 M 17125 44.9 14948 87.3 4438 25.9
F 20992 55.1 18037 85.9 5680 27.1
T 38117 100.0 32985 86.5 10118 26.5
2003 M 17095 44.1 15154 88.6 4611 27.0
F 21655 55.9 18615 86.0 5712 26.4 Western Cape T 38750 100.0 33769 87.1 10323 26.6
2002 M 202730 45.7 143289 70.7 35392 17.5
F 241091 54.3 162485 67.4 39656 16.4
T 443821 100.0 305774 68.9 75048 16.9
2003 M 201408 45.7 151127 75.0 39124 19.4
National
F 238859 54.3 171365 71.7 42886 18.0
HSRC Client Report
16
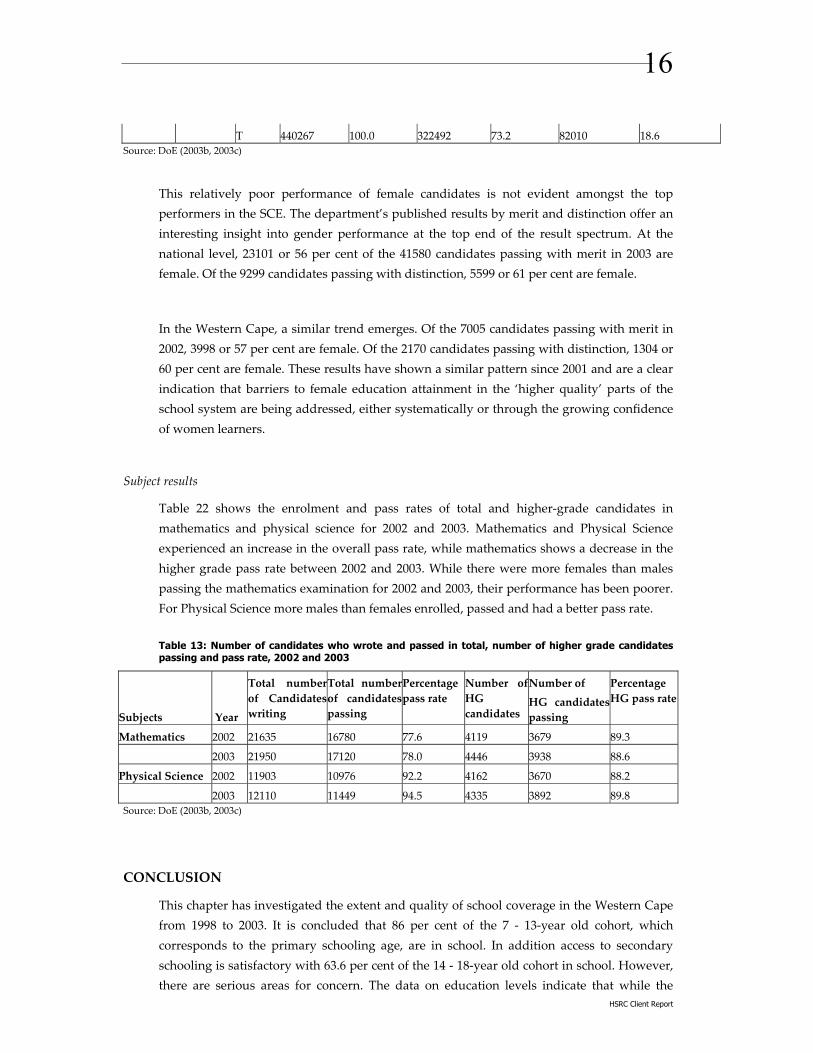
T 440267 100.0 322492 73.2 82010 18.6 Source: DoE (2003b, 2003c)
This relatively poor performance of female candidates is not evident amongst the top performers in the SCE. The department’s published results by merit and distinction offer an interesting insight into gender performance at the top end of the result spectrum. At the national level, 23101 or 56 per cent of the 41580 candidates passing with merit in 2003 are female. Of the 9299 candidates passing with distinction, 5599 or 61 per cent are female.
In the Western Cape, a similar trend emerges. Of the 7005 candidates passing with merit in 2002, 3998 or 57 per cent are female. Of the 2170 candidates passing with distinction, 1304 or 60 per cent are female. These results have shown a similar pattern since 2001 and are a clear indication that barriers to female education attainment in the ‘higher quality’ parts of the school system are being addressed, either systematically or through the growing confidence of women learners.
Subject results
Table 22 shows the enrolment and pass rates of total and higher-grade candidates in mathematics and physical science for 2002 and 2003. Mathematics and Physical Science experienced an increase in the overall pass rate, while mathematics shows a decrease in the higher grade pass rate between 2002 and 2003. While there were more females than males passing the mathematics examination for 2002 and 2003, their performance has been poorer. For Physical Science more males than females enrolled, passed and had a better pass rate.
Table 13: Number of candidates who wrote and passed in total, number of higher grade candidates passing and pass rate, 2002 and 2003
Subjects Year
Total numberof Candidateswriting
Total number of candidates passing
Percentage pass rate
Number of HG candidates
Number of
HG candidates passing
Percentage HG pass rate
Mathematics 2002 21635 16780 77.6 4119 3679 89.3
2003 21950 17120 78.0 4446 3938 88.6
Physical Science 2002 11903 10976 92.2 4162 3670 88.2
2003 12110 11449 94.5 4335 3892 89.8 Source: DoE (2003b, 2003c)
CONCLUSION
This chapter has investigated the extent and quality of school coverage in the Western Cape from 1998 to 2003. It is concluded that 86 per cent of the 7 - 13-year old cohort, which corresponds to the primary schooling age, are in school. In addition access to secondary schooling is satisfactory with 63.6 per cent of the 14 - 18-year old cohort in school. However, there are serious areas for concern. The data on education levels indicate that while the
HSRC Client Report
17
majority of the children in the Western Cape enter school and are increasingly staying in the system for longer, less than half are retained in the system to Grade 12. Decreases in demand for schooling that are not due to learners exiting for other educational opportunities are cause for concern.
It is also important to understand the extent to which learners are advancing effectively through the system and exiting with a reasonable quality of learning achievement. In this regard, the background paper investigated a number of indicators of efficiency and quality. In terms of efficiency, repetition and dropout are both a concern in the province. Apartheid quality and resources inherited by the province from the former education departments are still playing themselves out. The Western Cape inherited school systems from former departments with high number of learners dropping out, particularly from the former House of Representatives. In general, this has led to the kind of wastage, which means that it takes more than the average 12 years for a learner to complete Grade 12.
Therefore, the province has a long way to go before the most effective usage of resources is harnessed in the schooling sector. Reducing repetition should be a high priority for policy-makers in the province because of the substantial wastage of resources involved.
Indicators such as the high GER and NER, and the GPI which indicates significant levels of female participation in secondary education, presents a healthy situation for Western Cape education. That is not to say that there is not significant intra-provincial inequality which is being masked by the aggregating effect of a historically well-resourced segment. The extent to which these inefficiencies are the direct result of inequitable resource inputs is not investigated in this chapter. Great strides have been made in addressing resource inequality, most particularly in the equalisation of learner educator ratios. However, former Cape Education Department (CED) schools have more resources available to appoint more governing-body paid educators to reduce the learner educator ratio substantially from 35:1 to 23:1.
Similarly, the inherited inequality in the quality of learning achievement is a legacy that will take years to overcome. This means that learners in the most poorly resourced schools are not able to achieve their full potential, and that education attainment in South Africa is not yet close to the learning achievements of some of its economic competitors or other countries in Africa.
In monitoring the output of the SCE there have been some encouraging developments. The number of learners attaining an SCE pass has been growing over the last decade and the pass rates have been steadily climbing in the past few years. Learners appear to be more realistic about the level at which they take their examinations and are more likely to achieve

HSRC Client Report
18
a pass. Of particular note is the high level of participation by female learners in the SCE and the closing of the gap between male and female performance – to such an extent that since 2001 more female students attained the merit and distinction categories. However, the proportion of the Grade 1 cohort that is retained until Grade 12, and the total number of matriculants, particularly in key subjects of Mathematics and Physical Science, remain too low to meet future human resource development needs in the province.
In summary, relative to national trends, the provision of schooling in the Western Cape is extensive and the outlook for improved levels of basic and further education for the population, as a whole is positive. A majority of Grade 12 learners write and attain their SCE, but the high rate of dropout after Grade 10 is a significant future barrier. A major challenge for the province in future years is the continuous improvement of the quality, efficiency and equity of education output in order to ensure that the school system contributes effectively to HRD as well as increasing the pool of candidates available for further and higher education and training.
HSRC Client Report
19
References
Biersteker, L (2003) Early Childhood Development – An analysis of the current provincial realities. Developing a Provincial Human Resource Development Strategy. Unpublished paper commissioned by the Human Resources & Social Development Task Team, PAWC to contribute to A Framework for Developing a Human Resource and Skills Development Strategy in the Western Cape: Final Report. November 2003.
Blanchard, F (1974) The education of migrant workers – Where do we stand? A world wide overview of migratory movements. Prospects 4: 348-356
Bot, M (2000) Macro Indicators in Education, 1994 – 2000. Centre for Education Policy Development. Johannesburg.
Bot, M, Gordon, A & Patel, E (2001) Macro-Indicators of Racism in the Schooling System.
Chinapah et al. (2000) With Africa for Africa: Towards Quality Education for All. Human Sciences Research Council. Pretoria.
Cloete, P (2002) Migration Study in the Western Cape 2001: The influence of state educational and health facilities on migration into the Western Cape. Provincial Government of the Western Cape. Cape Town.
Crouch, L & Mabogoane, T (2001) No Magic Bullets, Just Tracer Bullets: The role of learning resources, social advantage, and education management in improving the performance of South African schools. Social Dynamics 27:1 (60-78)
De Souza, C (2003) Senior Certificate Exams 2002: Plausible Progress of Passes Below Par?, EduSource Data News 39 May. The Education Foundation. Houghton.
Department of Education, South Africa (1995) White Paper on Education and Training.
Department of Education, South Africa (1997b) 1996 Examination Results.
Department of Education, South Africa (1998a) Preliminary Report of the 1997 Senior Certificate Examinations.
Department of Education, South Africa (1998b) Age Requirements for Admission to an Ordinary Public Government School. Notice No. 2433 of 1998.
Department of Education, South Africa (1999) Preliminary Report of the 1998 Senior Certificate Examinations.
Department of Education, South Africa (2000) Report on the Senior 1999 Certificate Examinations.
Department of Education, South Africa (2001a) Report on the 2000 Senior Certificate Examinations.
Department of Education, South Africa (2001b) Education Statistics in South Africa at a Glance in 1999.

HSRC Client Report
20
Department of Education, South Africa (2001c) Report on the School Register of Needs 2000 Survey.
Department of Education, South Africa (2002a) Education Statistics in South Africa at a Glance in 2000.
Department of Education, South Africa (2002b) Report on the 2001 Senior Certificate Examinations.
Department of Education, South Africa (2002c) Trends in Senior Certificate Enrolment: An investigation by the Department of Education, December 2002. Quoted in EduSource Data News No 43/May
Department of Education, South Africa (2003a) Education Statistics in South Africa at a Glance in 2001.
Department of Education, South Africa (2003b) Report on the 2002 Senior Certificate Examinations.
Department of Education, South Africa (2003c) Report on the 2003 Senior Certificate Examinations.
Eisemon, TO (1997) Reducing Repetition: Issues and Strategies. UNESCO/IIEP. Paris.
Howie, S (2001) Mathematics and Science Performance in Grade 8 in South Africa 1998/1999. HSRC. Pretoria.
Human Sciences Research Council (2001a) Grade 12 Learner Choice Survey. Database.
Human Sciences Research Council, CYFD (2001b) A Study of School Responses to Violence and Harassment of Girls. Pretoria.
Hunter, N and May, J (2003) Poverty, Shocks and School Distruption among Adolescents in South Africa, CSDS Working Paper No 35. School of Development Studies. University of Natal. Durban.
Kitaev, I (1999) Private Education in Sub-Saharan Africa: A Re-examination of Theories and Concepts Related to Its Development and Finance. UNESCO/IIEP. Paris.
Meyer, S & Motala, S (1997) National Workshop on the quality and the use of indicators to Monitor and Evaluate School Performance. 25-26 November 1997 Workshop Report.
Paterson, A & Kruss, G (1998) Educational migration and its effect on access to schooling in South Africa. South African Journal of Education 18:3.
Perry, H. & Arends, F. (2003) Public Schooling In Human resources Development Review 2003: Education, Employment and Skills in South Africa. HSRC Press. Cape Town.
Republic of South Africa (1996) The Bill of Rights, Chapter 2, section 29(1) of the Constitution of the Republic of South Africa 1996. Government Gazette. No. 17678.
Seekings, J (2002) Indicators for performance in South Africa’s Public School System. Centre for Social Science Research.Working Paper No. 10.

HSRC Client Report
21
Shindler, J (2004) An Analysis of the 2003 Senior Certificate Examination. EduSource Data News No. 43 May. The Education Foundation. Houghton.
Statistics South Africa, South Africa (1998) October Household Survey 1997.
Statistics South Africa, South Africa (2001) Labour Force Survey 2000.
Statistics South Africa, South Africa (2002) Labour Force Survey 2002.
Statistics South Africa, South Africa (2003) Census 2001.
Strauss and Burger (2000) Monitoring Learning Achievement Project. Department of Education. Pretoria.
Truscott, K. (1994) Gender in Education. WITS Education Policy Unit.
UNESCO (1997) Basic indicators of education systems performance: A manual for statisticians and planners. Unesco. Paris.
UNESCO (1998) Education For All, Status and Trends Wasted Opportunities: When schools fail. Paris.
UNESCO (2000a) Education For All, Status and Trends Assessing Learning Achievement. Paris.
UNESCO (2000b) Thematic Studies, Education for All and children who are excluded. Paris.
UNESCO (2000c) World Education Report 2000: The Right to Education, Towards Education for All Throughout Life. Unesco. Paris.
UNICEF, NIPILAR & DoE (1999) The rights of the girl-child in South Africa Documentation and Analysis of a gender research methodology within the CRC and CEDAW framework (prepared by Changu Mannathoko).
Unterhalter, E (1991) Changing aspects of reformism in Bantu education 1953-1989. In Apartheid Education and Popular Struggles ed. By E. Unterhalter et al. Zed Books. London.
Van der Berg, S & Achterbosch, T (2001) School Education in the Western Cape: Matching Supply to Demand. Unpublished report prepared for he Western Cape Education Department.
Verwey and Munzhedzi (1994) Education in the Western Cape: Data, indicator and scenarios Centre for Policy and Information. Development Bank of Southern Africa.
Visser, M (1999) School Register of Needs Survey 1996. HSRC. Pretoria.
Western Cape Department of Economic Development and Tourism (2003) Building the Foundations – GET, ABET & ECD. Unpublished paper commissioned by the Human Resources & Social Development Task Team, PAWC to contribute to A Framework for Developing a Human Resource and Skills Development Strategy in the Western Cape: Final Report. November 2003.
Western Cape Education Department (2001) WCED launches initiatives to boost Maths results. Media Release. 28 September 2001.
HSRC Client Report
22
Western Cape Provincial Treasury(2003) Socio-Economic Review. Western Cape Provincial Treasury. Cape Town.
Wolpe, A, Quinlan, O & Martinez, L (1997) Gender Equity in Education, Report of the Gender Equity Task Team, Department of Education South Africa. (GETT report)
Yamauchi, F (2003) Early Transition from School to Labor Markets: School Inefficiency Causing Labour Market Inefficiency in South Africa. International Food Policy Research Institute. Washington D. C.