human resources trends for 2018 - morneau shepell · human resources trends for 2018 insights on...
TRANSCRIPT

Human Resources Trends for 2018 Insights on what HR leaders are expecting in the coming year Comprehensive reportSeptember 2017

Table of contents
1 Executive Summary
3 HR priorities for 2018
6 Expected changes in compensation
8 Improving health, engagement and productivity
11 Reducing the cost of absence and disability
13 Optimizing retirement plans
17 Appendix: Detailed results of survey
17 Organizational profile
18 Priorities for 2018
19 Compensation
22 Workplace health and engagement
23 Absence and disability management
24 Retirement and savings plans
26 Other retirement benefits

1Human Resources Trends for 2017, Insights on what HR leaders are expecting in the coming year | September 2016
Executive Summary Morneau Shepell’s annual Trends in Human Resources survey canvasses Canadian employers on what they are planning for the coming year, and asks HR Leaders about the opportunities and challenges they face. This year’s survey suggests they are cautiously optimistic about the coming year, and are focused on building high performing and resilient workforces. Highlights of the survey include:
• Human Resources (HR) leaders identified their top three areas of interest as improving employee engagement (65%), attracting and retaining employees with the right skills (56%), and helping their organizations adapt better to ongoing change (55%).
• Almost half (47%) of respondents said that improving the physical and/or mental health of their workforce was also a priority for the coming year.
• HR leaders want to spend more time delivering value, and less time on tactical activities. Forty-three per cent (43%) said that streamlining the administration of HR programs was a key priority for 2018.
• HR leaders also identified other ways for reducing costs and improving efficiency. Two of the top five targets for cost reduction in 2018 are reducing short-term disability costs (40%) and long-term disability costs (38%).
• Salaries are expected to rise by an average of 2.3% in Canada in 2018, up from 2.2% in 2017. This higher number likely reflects optimism about the coming year: 92% of respondents indicated financial performance in 2018 was likely to be the same or better than in 2017. Despite this optimism, employers are still cautious about salary increases, perhaps reflecting a concern that rising interest rates may dampen economic growth next year.
• More than a third (37%) of HR leaders identified complex mental health claims as their top challenge in managing absence and disability costs. Almost two-thirds (65%) saw better training for their managers as a key strategy for improving disability management.
• In dealing with mental health, HR leaders saw a lack of knowledge on the part of managers (58%), lack of knowledge on the part of employees (55%), and stigma (55%) as their top challenges.

2HR Trends for 2018, Insights on what HR leaders are expecting in the coming year | September 2017
• The survey also picked up some important changes in attitudes toward retirees. As employers move away from defined benefit retirement plans, 91% of HR leaders said they were concerned about the financial preparedness of their employees for retirement. Along with education, there is a growing interest in providing decumulation and health insurance options for retirees.
The results of the survey are discussed in greater detail in the body of this report, as are the results of related research in these areas and a review of tools and services that may be helpful in HR planning for 2018.
Morneau Shepell’s 35th annual Trends in Human Resources survey was conducted in June and July 2017, with input from 370 organizations employing 894,000 Canadians in a broad cross-section of industry sectors.

3HR Trends for 2018, Insights on what HR leaders are expecting in the coming year | September 2017
HR priorities for 2018Building a high-performing and resilient workforce is a priority for employersHR leaders identified their top three areas of interest as improving employee engagement (65%), attracting and retaining employees with the right skills (56%), and helping their organizations adapt better to ongoing change (55%).
The rapid pace of change is a challenge to organizations as they reconsider traditional approaches to human capital management. HR Leaders are looking for ways to build more resilient workforces - the most successful organizations will be those that can adapt best to change.
To build more resilient workforces, HR leaders are implementing a range of solutions including training employees to have stronger coping skills, and providing better tools and training for managers to ensure that employees facing challenges get the help they need.
Almost half (47%) of respondents said that improving either physical and/or mental health was also a priority for the coming year. This response with respect to mental health was an increase from 41% in last year’s survey, highlighting the growing importance of a proper mental health strategy and support tools in overall HR planning.
Table A
Top 5 priorities for improving health, engagement and productivity in 20187 % who see this as a priority
Improve employee engagement 65%
Improve attraction and retention of employees with the right skills 56%
Help the organization adapt better to ongoing change 55%
Improve learning and development programs 48%
Improve the physical and/or mental health of employees 47%

4HR Trends for 2018, Insights on what HR leaders are expecting in the coming year | September 2017
Additional insights:
Research from Morneau Shepell’s Mental Health Priorities: 2016, indicated that organizational change is a potential risk to employee health, engagement and productivity. Forty-three per cent (43%) of employees indicated that the most recent organizational change negatively impacted their perception of the company, while 40% stated that it negatively impacted their health and well-being. Further, 40% saw more co-worker absenteeism following an organizational change, and 17% indicated that they took more time off work themselves.
These insights make it clear that organizations need to increase their attention to the human aspect of organizational change or risk diminishing the anticipated benefits of change. A critical step is to invest in the capabilities of people managers.
Absence management and streamlining HR administration continue to be focus areas to reduce costs and improve productivityThe survey showed that employers are also looking for ways to improve efficiency and reduce costs. Forty-three per cent (43%) of survey respondents reported that streamlining the administration of HR programs is a key priority for 2018. HR leaders clearly want to spend more time delivering value to their business stakeholders and less time on tactical activities that have minimal impact.
In addition to streamlining administration, employers are seeking ways to reduce costs and improve efficiencies in the area of absence and disability management. Their priorities include: reducing short-term disability costs (40%), reducing long-term disability costs (38%), reducing workers’ compensation costs (29%), and reducing the cost of incidental absence (27%).
Table B
Top 5 priorities for reducing costs and improving efficiency in 2018 % who see this as a priority
Streamline administration of HR programs 43%
Reduce short-term disability costs 40%
Reduce employee turnover 39%
Reduce long-term disability costs 38%
Reduce the cost of health and dental plans 32%

5HR Trends for 2018, Insights on what HR leaders are expecting in the coming year | September 2017
Additional insights:
According to Statistics Canada’s Work Absence Statistics of Full-Time Employees, 2016, the total days lost per worker in 2016 for the private sector had rebounded to 2012 levels after declining in 2013–2015. The 2016 rate for public sector workers was actually higher than in 2012. This suggests that more attention needs to be paid to both the typical and emerging drivers of absenteeism, as well as the manner in which absences are managed.
Given these numbers, it is not surprising that this year’s HR Trends survey shows a concern among employers regarding the direct cost of employees’ absence. In addition, work absence is a source of productivity loss, as well as a loss of skill and experience. Given increasingly competitive market conditions, such losses can have significant impact on organizations and their potential for growth.
A problem-solving approach to absence management, rather than a solely administrative one, is critical to addressing the issue of employee absence in a sustainable way. The strategic use of technology is fundamental to streamlining processes, getting better reports and insights and improving problem solving. Employers are focusing in two main areas: engaging employees and supervisors with the support of a skilled case manager, and removing systematic barriers by providing access to recovery support services for mental health conditions.
You may also want to read:
The true picture of workplace absence
Best practices in absence & disability management
Solutions to consider:
• Abiliti: Absence and Disability Management software
• Optimizing your disability management strategy with InfluenceCare

6HR Trends for 2018, Insights on what HR leaders are expecting in the coming year | September 2017
Expected changes in compensation Salaries expected to increase by 2.3 per cent in 2018Employers in Canada are expecting salaries to rise by an average of 2.3% in 2018. This is up from a 2.2% average increase in salaries for 2017.
The survey identified some industry sectors that are expecting higher-than-average salary increases in 2018. They include utilities at 2.9%, and manufacturing and wholesale trade at 2.7%. These industries may be catching up after lower-than-average increases over the past few years.
Lower-than-average increases are expected in certain industry groups that face more uncertain economic circumstances. They include mining and oil and gas extraction where average salary increases of 0.8% are expected. Salary increases in the public sector are also expected to be below average.
Table C
Compensation changes by industryActual 2017 increases
as a % of payrollExpected 2018 increases
as % of payroll
Arts, Entertainment and Recreation 2.3% 2.1%
Educational Services 1.4% 1.9%
Finance and Insurance 2.8% 2.7%
Health Care and Social Assistance 1.5% 1.7%
Manufacturing 2.8% 2.7%
Mining and Oil and Gas Extraction 1.3% 0.8%
Other services (except Public Administration) 2.2% 2.1%
Professional, Scientific and Technical Services 2.5% 2.6%
Public Administration 1.6% 1.7%
Retail Trade 1.9% 2.0%
Transportation and Warehousing 1.7% 2.6%
Utilities 2.6% 2.9%
Wholesale Trade 2.6% 2.7%
Utilities 2.0% 1.9%
National average 2.2% 2.3%
Reflecting the mix of industries in the provinces, Alberta is expected to have the lowest salary increases next year, at 1.8%, followed by Prince Edward Island and the Territories at 1.9%. In contrast, Quebec is expecting higher-than-average increases in the 2.6% range. Salary increases in other provinces will be close to the overall average.

7HR Trends for 2018, Insights on what HR leaders are expecting in the coming year | September 2017
Table D
Compensation changes by provinceActual 2017 increases
as a % of payrollExpected 2018 increases
as % of payroll
British Columbia 2.0% 2.4%
Alberta 2.1% 1.8%
Saskatchewan 2.3% 2.2%
Manitoba 2.2% 2.3%
Ontario 2.3% 2.2%
Québec 2.4% 2.6%
New Brunswick 2.0% 2.1%
Nova Scotia 1.9% 2.1%
Prince Edward Island 2.1% 1.9%
Newfoundland and Labrador 2.3% 2.4%
Territories 1.7% 1.9%
National average 2.2% 2.3%
Within the overall 2.3% budget for salary increases, employers are expecting to increase their salary scales by an average of 1.8% in 2018, with an additional allowance of 0.5% for merit adjustments. Expected salary increases in 2018 compare favourably to the current rate of inflation, which is currently about 1.2%.
The average adjustments in this report include expected salary freezes, and exclude promotional or special salary adjustments.
8HR Trends for 2018, Insights on what HR leaders are expecting in the coming year | September 2017
Improving health, engagement and productivityWith the increasing pace of organizational change and industry disruption, organizations increasingly understand the importance of employee health, engagement and productivity as they position, reposition and grow. While there remains room for improvement, there is a clear movement toward increased use of data in these areas, to support strategic planning.
There is increased use of information from EFAP and several other sources of employee health, engagement and productivity dataWhile employers are increasingly leveraging data, the majority still do not leverage the full value of integrating their data.
• The data sources most often monitored by employers were from EFAP programs (72%) and engagement surveys (62%) – up from 54% and 50% respectively, in the prior year
• The least-used data source remains Health Risk Assessments (HRAs) at (14%). This is up slightly from 11% in the prior year
• 21% of employers have access to an integrated analysis of their data, which is up from 12% in the prior year.
Solutions to consider:
• Total Health Index (THI) for measuring the total health of an organization

9HR Trends for 2018, Insights on what HR leaders are expecting in the coming year | September 2017
Figure A. How does your organization monitor the health and engagement of its employees?
Additional insights:
Any employee strategy requires data, but that is especially so in a high-demand, rapidly changing business environment. Decisions, investments and programming that are data-driven reduce the risk of wasted time and effort, which most organizations can ill afford if they want to ensure their objectives are fully met.
The challenge is that data from different sources typically only tell part of the story. Engagement data alone may not fully reflect looming disability issues; absence data alone may not provide insight into the root cause of productivity loss. Each point of data contributes only a part of the puzzle, but when integrated, offers deeper insights by connecting the various points of data. When considering strategy, these connections provide value in a way that individual data points never can.
EFAP reporting – 72%
Health RiskAssessments - 14%
Disabilityclaims – 45%
Medicalclaims – 36%
Integratedanalytics – 21%
Engagementsurveys – 62%
You may also want to read:
The next evolution of strategic HR: Measuring program value through business results
Employers are increasingly investing in workplace mental healthGiven the pace of change, employers are recognizing the critical importance of coping skills and resilience in their workforce.
Employers reported that their primary motivation for focusing on mental health was to reduce absenteeism (66%), and increase employee engagement and retention (63%). These factors are strongly aligned with their goal of building a high high-performing and resilient workforce.
When asked what employers saw as the most significant challenges in managing mental health in the workplace, they cited a combination of lack of knowledge coupled with stigma. Interestingly, the number of respondents

10HR Trends for 2018, Insights on what HR leaders are expecting in the coming year | September 2017
reporting these factors increased significantly since last year, suggesting greater awareness of mental health issues by employers. The top three challenges were:
1. Inadequate manager knowledge and behaviour when an employee is struggling (58%, up from 48% last year).
2. Lack of employee knowledge and/or willingness to use counselling and resources (55%, up from 49% last year).
3. Stigma regarding mental health issues (55%, up from 46% last year).
Additional insights:
Organizations are increasingly looking at approaches to help them adapt to the current and evolving business environment. One example is Agile Business Management, which borrows concepts from agile and iterative software development. It encourages a less structured, and more responsive approach to the workplace that focuses on communication, collaboration, and continuous development. While this approach offers several benefits, it may intensify the experience of constant change for employees, and increases the need for an adaptive and resilient workforce.
Morneau Shepell’s report Workplace Mental Health Priorities: 2016 indicates that investment in a workplace where employees are supported in dealing with problems is a key predictor of a positive outcome in an environment of change.
You may also want to read:
Workplace Mental Health Priorities: 2016
Why supporting employees to develop their coping skills and resiliency is good business
Coping skills can help mental health
Solutions to consider:
• Workplace Mental Health strategy
• Workplace Mental Health Leadership certificate program

11HR Trends for 2018, Insights on what HR leaders are expecting in the coming year | September 2017
Reducing the cost of absence and disabilityEmployers continue to view the cost of absenteeism, and helping people get back to work sooner, as priorities. Sixty-six per cent (66%) of employers in the survey said that reducing absenteeism is an objective for the coming year. The survey found two main areas of focus among employers: managing mental health claims, and training managers.
Disability claims related to mental health are a key area of concernSimilar to the last two years’ surveys, complex mental health claims continue to be the top disability management concern for employers. In fact, two of the top three challenges reported by respondents relate to mental health:
• Number and length of complex mental health claims (37%).
• Accommodation and modified work requests as part of a return to work plan (35%).
• Difficulty for employees to get the right kind of care for mental health issues (29%).
The last point is a significant issue because there can often be considerable delays in getting help for employees who are off work due to mental health issues. Employers are looking for help, including expedited referrals for proper psychiatric assessment and treatment for employees, with a focus on return to work. They are also looking for help to better monitor mental health conditions. This is a critical factor: it can be difficult to stabilize mental health conditions, which increases the risk of relapse and recurring periods of disability.
Solutions to consider:
• InfluenceCare: Proactive support for mental health claims
• Integrated absence and disability management

12HR Trends for 2018, Insights on what HR leaders are expecting in the coming year | September 2017
Equipping managers to play a stronger role in absence and disability management is a focusEmployees’ experience at work is largely shaped by their direct supervisor. Employers are recognizing that managers have a significant impact on the process of getting employees back to work. Almost two-thirds of employers (65%) indicated that they are considering manager training to improve their disability management outcomes. This is a very significant increase over the 33% reported in last year’s survey.
Employers are also looking to make better use of technology to improve the effectiveness of absence and disability management, and to lower costs. Thirty-six per cent (36%) of employers are looking at a change in their policies or processes to improve disability management. This is also a very significant increase over the 20% reported last year.
Additional insights:
When selecting a training program for managers, a critical factor is how well it aligns with and enhances the manager’s current role. Aligned and practical training will not only be well received, it will provide skills and a framework that managers can use to address any employee issue, and in particular issues that may emerge prior to a disability leave.
Absence and disability issues are often an indicator of overall workplace health. In most situations, employees have been struggling with a particular health issue for months or even years prior to the disability leave. There is often deterioration in work productivity prior to the absence, which may result in absenteeism and/or performance issues. Attendance recording, attendance support programs and Stay at Work programs for employees with chronic conditions, all provide the opportunity to prevent undue disability costs. They also increase the health and productivity of the workforce by dealing with issues before they worsen.
You may also want to read:
Five tips for successful workplace mental-health training.
Four keys to an effective absence & disability management solution
Solutions to consider:
• The Queens Certificate Program
• Absence reporting
13HR Trends for 2018, Insights on what HR leaders are expecting in the coming year | September 2017
Optimizing retirement plansEmployers are concerned that their employees are not adequately prepared for retirementWhen asked about their concerns with respect to their employees’ retirement, an overwhelming 91% of organizations responded that they were concerned about their employees’ overall financial preparedness for retirement. Lesser, though still significant, concerns were about employees being able to understand and plan for the decumulation of their DC (defined contribution) retirement plans (32%), and being able to manage the cost of health issues in retirement (24%).
To address their concerns, employers are considering a number of changes in strategy for the coming year.
Employers with DB plans are looking for ways to improve performance or lower costsDB (defined benefit) plan sponsors are continuing to use a mix of investment and plan design strategies to improve the performance of their plans, address the needs of a changing workforce and to lower costs. They include:
• Reviewing investment strategy (49%). This is up from 31% last year.
• Reviewing employer/employee cost sharing (29%).
• Reviewing plan design, such as removing indexing or early retirement subsidies (28%).
Despite much discussion about annuity buy-outs for retirees and longevity risk transfers, interest in these options remains relatively low, at 19% and 6% respectively. Interest in converting from a DB to a DC pension plan also remains relatively low (17%). The reduced interest in these options likely reflects the cost of making these changes when interest rates are at historic lows, and changes in the regulatory environment that reduce risk to plan sponsors.
Upcoming enhancements to the Canada Pension Plan (CPP) provide a special one-time de-risking opportunity for DB plans, since sponsors can integrate the CPP enhancement into the existing pension formulas of their plans. In addition, the possibility that some provinces will no longer require solvency funding will significantly reduce funding volatility for DB plan sponsors. The recent or imminent changes (depending on province) to funding requirements and other aspects of pension regulatory frameworks across Canada may warrant a review of a plan’s investment policy, de-risking strategy, administration and other aspects of plan management.

14HR Trends for 2018, Insights on what HR leaders are expecting in the coming year | September 2017
DC plan sponsors are concerned about engaging members and improving retirement incomeThe fact that such a large percentage of HR leaders were concerned about the financial preparedness of their employees for retirement suggests that many retirement-eligible workers have not participated long enough in DC plans to accumulate an adequate account balance or that contributions and investment returns have been lower than needed. The solution, according to 40% of the DC plan sponsors who responded to our survey, lies in improving member engagement, while another 28% were focused on improving levels of retirement income. Employers identified some specific strategies to meet these objectives:
• 58% said they were currently providing or considering education/information to assist employees after retirement.
• 27% said they were currently providing or considering decumulation options (such as group LIF, RRIF, or payout options) to assist employees after retirement. Decumulation options within pension plans are now permitted in the majority of federal and provincial jurisdictions, though notably not yet in Ontario.
It is likely that there will be a continued trend in this area as the number of retirees from DC plans increases in the future. If income levels are inadequate, this will create a potential risk of increased cost and workforce management challenges for plan sponsors.
In light of the upcoming changes to CPP which will translate into increased benefits at retirement as well as increased annual CPP contributions, an opportunity to consider focused education on retirement income outcomes for members is expected. This has implications for enrolment, contribution and investment decisions that members are asked to make. This development also presents an opportunity for plan sponsors to revisit their DC designs and reconfirm their alignment with their goals and objectives for the plan, particularly in the context of ensuring retirement readiness for their members.
49%
19%
6%
29%
28%
17%
Review investmentstrategy
Financial strategies
Plan designstrategies
Fundamental change in plan
Annuity buy-out forretirees
Longevity risktransfer
Review cost sharing
Review plan design
Convert to DC plan

15HR Trends for 2018, Insights on what HR leaders are expecting in the coming year | September 2017
Additional insights:
In the past, sponsors of DC plans left it up to their employees to fend for themselves when they retired.
The retirees often struggled to choose amongst relatively expensive investment options, and figure out how much of their savings they could safely withdraw each year to avoid running out of income later in life. Poor decisions can have a very significant impact on retirement income and plans sponsors are taking notice.
Investment fees paid by retirees can be up to 2% higher than they pay in their DC plans during their working lives. The following analysis shows that these additional charges can wipe out up to 30% of an employee’s retirement income – equivalent to losing about 6 years of retirement income.
65 70 75 80 85 90
Retir
emem
t inc
ome
Age
Retail expensesEmployer planexpenses
CAPSA’s (Canadian Association of Pension Supervisory Authorities) DC guideline suggests that sponsors should consider providing retirement income projections and information and education on options at retirement for converting their accumulated balances to a retirement income. While CAPSA doesn’t go so far as to require that sponsors provide options, it signals that regulators are becoming more interested in this issue. The fact that many of the provincial regulators have amended legislation to allow pensions to be paid out of decumulation arrangements is also a sign that regulators are focusing on this point.
You may also want to read:
The benefits of offering a decumulation program - Video
The Canada Pension Plan: Part 1 – Past and Present and Part 2 – The Future

16HR Trends for 2018, Insights on what HR leaders are expecting in the coming year | September 2017
Employers are also concerned about the health care needs of their retireesWhen asked whether employees are prepared to deal with the loss/reduction in coverage in their group health benefits plan when they retire, 78% of employers said they did not believe their employees were prepared, or were not sure they were.
Additional insights:
According to Morneau Shepell’s Forgotten decisions: The disconnect between the plan and reality of Canadians regarding Health and Finances in Retirement, almost three in four employees are concerned about not being able to afford health services when they retire. Declining health is their number one non-financial concern, and health care cost is second only to shelter in what employees believe will be their primary expense in their seventies. Furthermore, as health care costs climb, almost one half of organizations with post–employment benefits indicated they are likely to change their retiree benefits plan in the next five years.
Their concern is well founded. Health care costs increase with age, and an increasing number of employers are discontinuing health coverage after retirement. This means that retirees need to be prepared to bear these increasing costs themselves. Furthermore, government-funded seniors‘ coverage is rarely comparable to an employer-sponsored health plan. Typical options for retirees include individual health plans, which are often costly and may have exclusions for pre-existing conditions. As such, employers are moving toward solutions like hybrid models that are structured like group plans, but are designed to meet retiree needs, and provide the option of being fully retiree-funded or partially funded by the retiree. One example of a hybrid solution is a Retiree Benefits Marketplace, and this type of solution has recently been introduced in Canada.
With a Retiree Benefits Marketplace, employees are not restricted to a single insurance provider, and can compare prices and features across a range of providers to ensure they get the best coverage and cost for their needs. Costs can be paid as a deduction from pension income or by bank deduction. If the employer chooses to subsidize retiree benefits, the retiree would pay the difference between employer contribution and the cost of the plan.
You may also want to read:
Forgotten decisions: The disconnect between the plan and reality of Canadians regarding Health and Finances in Retirement
Solutions to consider:
MyFuture. Canada’s first online retiree benefits marketplace
17HR Trends for 2018, Insights on what HR leaders are expecting in the coming year | September 2017
Appendix: Detailed results of survey
Organizational profile
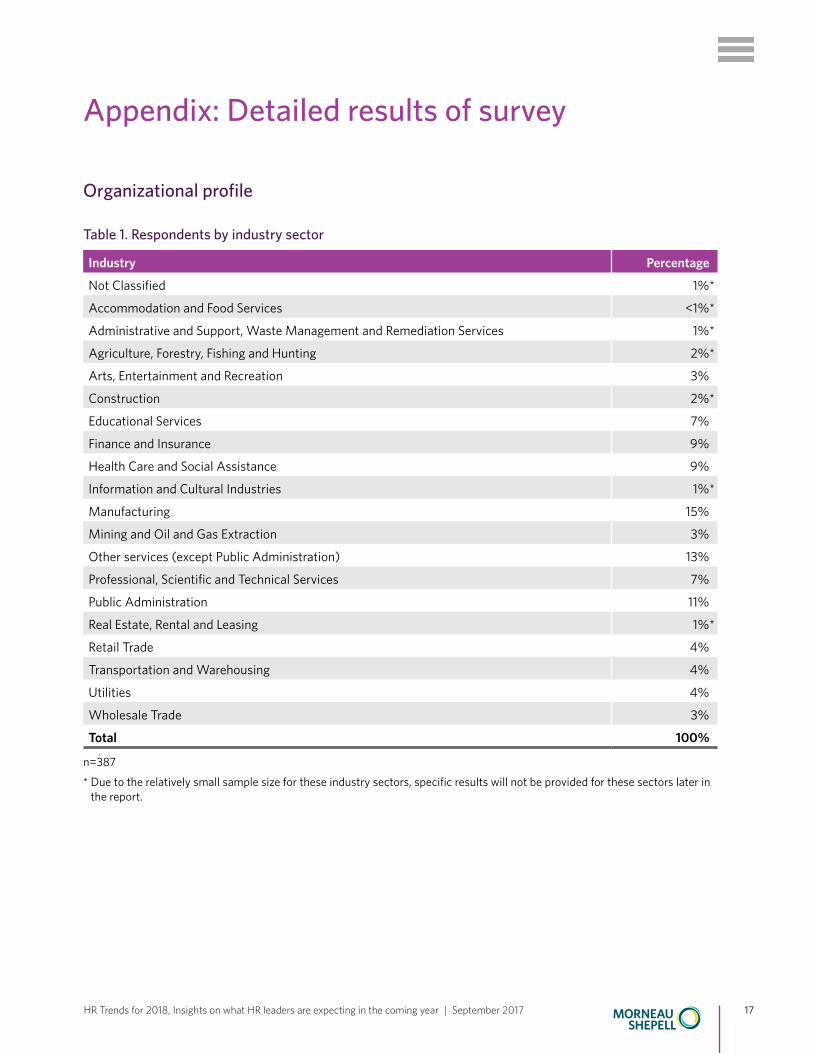
Table 1. Respondents by industry sector
Industry Percentage
Not Classified 1%*
Accommodation and Food Services <1%*
Administrative and Support, Waste Management and Remediation Services 1%*
Agriculture, Forestry, Fishing and Hunting 2%*
Arts, Entertainment and Recreation 3%
Construction 2%*
Educational Services 7%
Finance and Insurance 9%
Health Care and Social Assistance 9%
Information and Cultural Industries 1%*
Manufacturing 15%
Mining and Oil and Gas Extraction 3%
Other services (except Public Administration) 13%
Professional, Scientific and Technical Services 7%
Public Administration 11%
Real Estate, Rental and Leasing 1%*
Retail Trade 4%
Transportation and Warehousing 4%
Utilities 4%
Wholesale Trade 3%
Total 100%
n=387
* Due to the relatively small sample size for these industry sectors, specific results will not be provided for these sectors later in the report.

18HR Trends for 2018, Insights on what HR leaders are expecting in the coming year | September 2017
Priorities for 2018
Table 2. Priorities for improving engagement & productivity, by region
Atlantic Québec Ontario Prairies BC National
Improve employee engagement 67% 69% 69% 52% 65% 65%Improve attraction and retention of employees with the right skills 48% 69% 58% 48% 53% 56%Help the organization adapt better to ongoing change 62% 52% 56% 59% 50% 55%Improve learning and development programs 45% 52% 50% 37% 56% 48%Improve the physical health/ wellness of your employees 53% 43% 51% 41% 41% 47%Improve the mental health of your employees 57% 34% 56% 44% 21% 47%
Improve communication of Total Rewards 22% 29% 31% 19% 24% 27%Allow more choice and flexibility in benefit programs 10% 22% 17% 11% 12% 16%
Improve benefit programs 12% 11% 18% 11% 18% 14%Improve the financial health of your employees 7% 7% 22% 22% 6% 14%
Increase cash compensation 9% 10% 12% 26% 24% 13%
n=352
Table 3. Priorities for reducing costs & improving efficiency, by region
Atlantic Québec Ontario Prairies BC NationalStreamline the administration of human resources programs 39% 37% 48% 44% 37% 43%
Reduce short term disability costs 31% 55% 41% 36% 20% 40%
Reduce employee turnover 27% 40% 40% 32% 57% 39%
Reduce long-term disability costs 40% 48% 39% 32% 17% 38%Reduce the cost of health and dental plans 27% 37% 30% 28% 40% 32%
Reduce workers compensation costs 46% 42% 24% 12% 13% 29%Reduce the cost of incidental absences (1, 2 days) 25% 19% 35% 16% 23% 27%Improve integration between service providers 14% 12% 19% 20% 17% 16%Reduce the cost and risk of retirement plans 8% 19% 12% 8% 10% 13%
n=324

19HR Trends for 2018, Insights on what HR leaders are expecting in the coming year | September 2017
Compensation
Table 4. Actual compensation increase in 2017 and expected increase in 2018, by industry
IndustryActual 2017 increases
as a % of payrollExpected 2018 increases
as % of payroll
Arts, Entertainment and Recreation 2.3% 2.1%
Educational Services 1.4% 1.9%
Finance and Insurance 2.8% 2.7%
Healthcare and Social assistance 1.5% 1.7%
Manufacturing 2.8% 2.7%
Mining and Oil and Gas Extraction 1.3% 0.8%
Other services (except Public Administration) 2.2% 2.1%
Professional, Scientific and Technical Services 2.5% 2.6%
Public Administration 1.6% 1.7%
Retail Trade 1.9% 2.0%
Transportation and Warehousing 1.7% 2.6%
Utilities 2.6% 2.9%
Wholesale Trade 2.6% 2.7%
National average 2.2% 2.3%
n=249
Table 5. Actual compensation increase in 2017 and expected increase in 2018, by province
ProvinceActual 2017 increases
as a % of payrollExpected 2018 increases
as % of payroll
British Columbia 2.0% 2.4%
Alberta 2.1% 1.8%
Saskatchewan 2.3% 2.2%
Manitoba 2.2% 2.3%
Ontario 2.3% 2.2%
Quebec 2.4% 2.6%
New Brunswick 2.0% 2.1%
Nova Scotia 1.9% 2.1%
Prince Edward Island 2.1% 1.9%
Newfoundland and Labrador 2.3% 2.4%
Canadian Territories 1.7% 1.9%
National average 2.2% 2.3%
n=249

20HR Trends for 2018, Insights on what HR leaders are expecting in the coming year | September 2017
Table 6. Increase in salary structures, by industry
Industry
Actual 2017 increases in salary
scale as a % of payroll
Expected 2018 increases in salary
scale as % of payroll
Arts, Entertainment and Recreation 1.8% 1.8%
Educational Services 1.0% 1.3%
Finance and Insurance 1.8% 2.1%
Healthcare and Social assistance 1.3% 1.4%
Manufacturing 2.0% 2.2%
Mining and Oil and Gas Extraction 1.0% 0.0%
Other services (except Public Administration) 1.6% 1.6%
Professional, Scientific and Technical Services 1.7% 2.0%
Public Administration 1.6% 1.7%
Retail Trade 1.5% 1.6%
Transportation and Warehousing 1.6% 1.6%
Utilities 1.4% 1.7%
Wholesale Trade 1.8% 2.3%
National average 1.6% 1.8%
n=249
Table 7. Increase in salary structures, by province
Province
Actual 2017 increases in salary
scale as a % of payroll
Expected 2018 increases in salary
scale as % of payroll
British Columbia 1.5% 2.1%
Alberta 1.0% 1.3%
Saskatchewan 1.0% 1.6%
Manitoba 1.2% 1.5%
Ontario 1.7% 1.8%
Quebec 1.8% 2.0%
New Brunswick 1.5% 1.7%
Nova Scotia 1.3% 1.6%
Prince Edward Island 1.5% 1.4%
Newfoundland and Labrador 1.1% 1.6%
Canadian Territories 1.3% 1.4%
National average 1.6% 1.8%
n=249
21HR Trends for 2018, Insights on what HR leaders are expecting in the coming year | September 2017
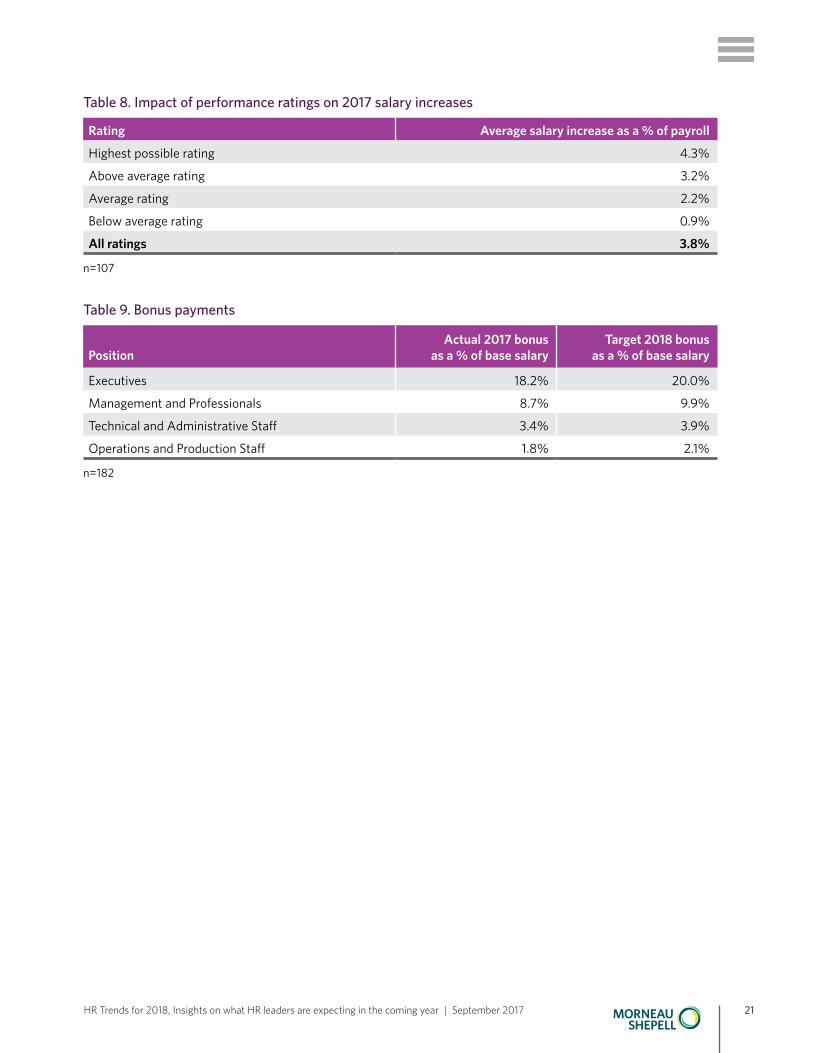
Table 8. Impact of performance ratings on 2017 salary increases
Rating Average salary increase as a % of payroll
Highest possible rating 4.3%
Above average rating 3.2%
Average rating 2.2%
Below average rating 0.9%
All ratings 3.8%
n=107
Table 9. Bonus payments
PositionActual 2017 bonus
as a % of base salaryTarget 2018 bonus
as a % of base salary
Executives 18.2% 20.0%
Management and Professionals 8.7% 9.9%
Technical and Administrative Staff 3.4% 3.9%
Operations and Production Staff 1.8% 2.1%
n=182

22HR Trends for 2018, Insights on what HR leaders are expecting in the coming year | September 2017
Workplace health and engagement
Table 10. How does your organization monitor the health and engagement of its employees?
Response Percentage
Analysis of EAP utilization 72%
Employee engagement surveys 62%
Analysis of disability claims 45%
Analysis of medical claims 36%
Integrated analysis of the above 21%
Health risk assessments completed by employees 14%
n=247
Table 11. If mental health is an area of focus for your organization, what objectives are you trying to achieve?
Response Percentage
Reduce absenteeism 66%
Increase engagement and retention 63%
Meet social responsibility 57%
Meet standards 35%
Increase productivity 29%
Improve reputation 27%
Respond to encouragement from employees 15%
Mental health is not a focus 13%
n=246
Table 12. Which do you see as the most significant challenges in managing mental health in the workplace?
Response Percentage
Inadequate manager knowledge and behavior when employee is struggling 58%
Lack of employee knowledge and or willingness to use counselling and resources 55%
Stigma 55%
Inadequate manager knowledge how to support a mentally healthy workplace 50%
Work demands 48%
Limited access to care 19%
Inadequate co-worker knowledge 42%
Poor employee coping skills 25%Workplace culture 21%
n=254

23HR Trends for 2018, Insights on what HR leaders are expecting in the coming year | September 2017
Absence and disability management
Table 13. If reducing disability costs is an area of focus, what do you see as your most significant challenges?
Response Percentage
Number and length of complex mental health claims 37%
Accommodation and modified work requests as part of the return to work plan 35%
Difficulty for employees to get the right kind of care for mental health issues 29%
Reducing disability costs is not an area of focus for our organization 23%
Gaining the support from our people leaders for return-to-work plans 23%
Difficulty getting insurer/provider to be proactive in promoting return to work 21%
Number and length of complex physical health claims 20%
Difficulty getting forms completed in a timely manner 17%
Number and length of complex mental health claims 13%
Issues with unions and collective agreements 11%
n=223
Table 14. Is your organization considering any action to improve disability management?
Response Percentage
Training of managers 65%
Change in policy or process 36%
Change in return-to-work or workplace-accommodation practices 29%Change in the resources available to employees (e.g. availability of specialized mental health resources) 23%
Change in the provider or the type of staff who does case management 23%
n=164

24HR Trends for 2018, Insights on what HR leaders are expecting in the coming year | September 2017
Retirement and savings plans
Table 15. Retirement arrangements offered
Response Percentage
Defined contribution (DC) plans and other capital accumulation plans (e.g. deferred profit sharing plan, tax-free savings account or group registered retirement savings plan) 68%
Defined benefit (DB) pension plans 53%
Company paid health benefits and other benefits after retirement 23%
Voluntary health benefits and other benefits after retirement 23%
n=247
Table 16. Which of the following are concerns with respect to the retirement of your employees?
Response Percentage
Employees’ overall financial preparedness for retirement 91%Employees being able to understand and plan for the decumulation of their DC retirement plans 32%
Employees being able to manage the cost of health issues in retirement 24%
n=238
DB plans
Table 17. For DB pension plans, are you considering any of the following strategies for the coming year?
Response Percentage
Review investment strategy 49%
Review employer/employee cost sharing 29%
Review plan design (e.g. remove indexing or early retirement subsidies) 28%
Annuity buy-out for retirees 19%
Convert to DC plan 17%Longevity risk transfer with a financial institution 6%
n=69
DC plans (dpsp, tfsa, group rrsp)
Table 18. For DC plans, are you considering any of the following strategies for the coming year?
Response Percentage
Design changes to improve the competitiveness of the plan 48%
Investment strategy changes 43%
Design changes that reflect increasing Canada Pension Plan costs 24%
The addition of decumulation options 12%
n=69.

25HR Trends for 2018, Insights on what HR leaders are expecting in the coming year | September 2017
Table 19. For DC plans, which of the following best describes your strategy to assist plan members after retirement?
Response Percentage
No specific approach 42%
Provide education/information only. We have decided not to offer decumulation options 31%Provide education/information as well as decumulation options (such as group life income funds, registered retirement income funds or payout options) 16%
Provide education/information and we are considering providing decumulation options as well 11%
Total 100%
n=153
Table 20. What do you view as the primary challenge you face as sponsor of DC plans?
Response Percentage
Improving member engagement 40%
Improving levels of retirement income 28%
Managing the costs of the plan 19%
Maintaining competitiveness 13%
Total 100%
n=131
26HR Trends for 2018, Insights on what HR leaders are expecting in the coming year | September 2017
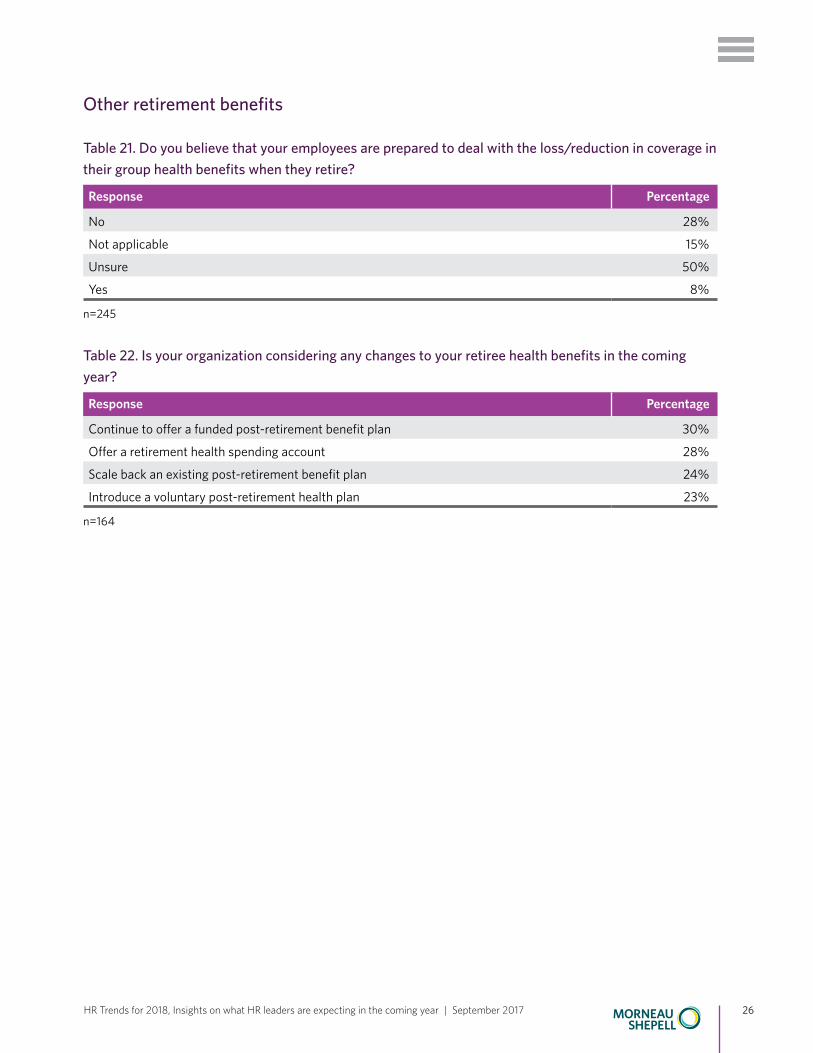
Other retirement benefits
Table 21. Do you believe that your employees are prepared to deal with the loss/reduction in coverage in their group health benefits when they retire?
Response Percentage
No 28%
Not applicable 15%
Unsure 50%
Yes 8%
n=245
Table 22. Is your organization considering any changes to your retiree health benefits in the coming year?
Response Percentage
Continue to offer a funded post-retirement benefit plan 30%
Offer a retirement health spending account 28%
Scale back an existing post-retirement benefit plan 24%
Introduce a voluntary post-retirement health plan 23%
n=164

27HR Trends for 2018, Insights on what HR leaders are expecting in the coming year | September 2017
NoticeThis document is intended for general informational purposes only and is not intended to be professional advice. The information contained in this document is based on sources that are believed to be reliable. Morneau Shepell, however, makes no representations or warranties as to the accuracy or completeness of such information and shall not be liable for any loss or damage (including direct, indirect, consequential, punitive, exemplary or incidental damages) for any error, omission or inaccuracy in such information.
Morneau Shepell logos and other trademarks are the property of Morneau Shepell Ltd. in Canada and/or other countries. No part of this document may be reproduced in any manner without the prior written permission of Morneau Shepell.
For more informationPaula Allen VP, Health Solutions & Research Group [email protected] 416.355.5495
Morneau Shepell Research Group: [email protected]
Morneau Shepell is the only human resources consulting and technology company that takes an integrated approach to employee assistance, health, benefits and retirement needs. The Company is the leading provider of employee and family assistance programs, the largest administrator of retirement and benefits plans and the largest provider of integrated absence management solutions in Canada. As a leader in strategic HR consulting and innovative pension design, the Company helps clients solve complex workforce problems and provides integrated productivity, health and retirement solutions. Established in 1966, Morneau Shepell serves approximately 20,000 clients, ranging from small businesses to some of the largest corporations and associations. With more than 4,000 employees in offices across North America, Morneau Shepell provides services to organizations across Canada, in the United States and around the globe. Morneau Shepell is a publicly-traded company on the Toronto Stock Exchange (TSX: MSI).
@Morneau_Shepell
Morneau Shepell
©2017 Morneau Shepell Ltd. | MS-HR-TRENDS-COMPREHENSIVE-09-2017