human services needs assessment - pinellas … a cover letter, questionnaire, and a preaddressed,...
TRANSCRIPT

The Louis de la Parte Florida Mental Health Institu te
December 2004Roger A. Boothroyd, Ph.D.
REPORT TO PINELLAS COUNTY HUMAN SERVICES
Human Services Needs Assessment Provider and Citizen Survey Results

The University of South Florida
The University of South Florida (USF), established in 1956 as a public university, is a comprehensive multi-campus research university serving more than 47,000 students. With four campuses, USF is home to medical clinics and hospitals, a major mental health research institute, and two public broadcasting stations. The University employs more than 3,112 full-time instructional faculty and 2,977 full-time staff. USF generates over $290 million annually in sponsored research. Its endowment exceeds $244 million and includes 55 endowed chairs. USF is classified as a Doctoral/Research University-Extensive, which is the highest classification by the Carnegie Foundation.
Louis de la Parte Florida Mental Health Institute
The Louis de la Parte Florida Mental Health Institute at the University of South Florida has a mission to strengthen mental health services throughout the state. The Institute provides research, training, education, technical assistance, and support services to mental health professionals and agencies as well as consumers, consumer organizations, and behavioral health advocates statewide. At the state level, the Institute works closely with the Departments of Children and Families (DCF), Corrections (DOC), Elder Affairs (DOEA), Education (DOE), and the Agency for Health Care Administration (AHCA), as well as with members and staff of the State Legislature and providers of mental health services throughout Florida.
Comprised of three primary research departments, Mental Health Law & Policy, Child & Family Studies, and Aging & Mental Health and a number of specialized centers, the Institute conducts research and program evaluations, provides training and consultations, and offers a number of academic courses at the masters and doctoral levels.
This publication was produced by
The Louis de la Parte Florida Mental Health Institute
University of South Florida
13301 Bruce B. Downs Blvd. Tampa, FL 33612-3807
For more information, call 813-974-1915or visit the website: www.fmhi.usf.edu
©December 2004
Acknowledgments
We would like to thank Ronnie White, Aquiles Pietri, and Rhonda Ort in the Department of Mental Health Law & Policy, Louis de la Parte Florida Mental Health Institute, University of South Florida who translated the questionnaire, prepared the mailings, completed data entry, and provided logistic support for this component of the needs assessment.
Contents
This document may be reproduced in whole or part without restriction as long as the Louis de la Parte Florida Mental Health Institute, University of South Florida is credited for the work.

Human Services Needs Assessment • Provider and Citizen Survey Results • iii
EXECUTIVE SUMMARY 1
INTRODUCTION 2
METHODOLOGY 3
RESULTS 6
SUMMARY 22
REFERENCES 22
Appendix A - Response to Provider Survey 23
Appendix B - Response to Citizen Survey 28
Appendix C - Provider and Citizen Survey Letters and Postcard Text 34
Human Services Needs Assessment Provider and Citizen Survey Results
Final Report To Pinellas County Human Services Department
Contents

Human Services Needs Assessment • Provider and Citizen Survey Results • 1
This report provides a brief summary of the methods and findings from the survey component of the Pinellas County human services needs assessment completed by the Louis de la Part Florida Mental health Institute (FMHI) during the summer and fall of 2004. The goal of the survey component was to obtain both providers’ and citizens’ perspectives regarding the need for, accessibility to, and effectiveness of 1) homelessness, 2) health, 3) mental health/substance abuse, and 4) basic needs (e.g., food, shelter) services in Pinellas County.
Needs assessment questionnaires were mailed to 1,000 providers listed on the County’s 211 and senior helpline service provider lists. Responses were obtained from 326 providers, representing a response rate of 32.6%. Questionnaires were also mailed to 300 county residents who were randomly selected from telephone directories. A total of 84 surveys were returned for a response rate of 28.0%. Services users recruited by program staff at selected provider agencies/organizations yielded responses from 162 of 200 (81.0% response rate). Additionally, other citizens were invited to participate by completing the on-line web-based version of the survey or by completing questionnaires disseminated at the community forums. Completed responses were received from a 149 community members.
Citizens’ and provider’s perceptions suggest a high rate of need across each of the four service domains examined. In addition, respondents also reported a relatively low level of services accessibility and effectiveness. Housing and transportation were two needs consistently identified by both citizens and providers across service domains. In addition, providers consistently reported a need for improved service coordination across domains while citizens perceived a high need for job/vocational training. Providers also reported current funding levels as less than “somewhat adequate” and that current functioning and cooperation levels within the four service domains as “somewhat adequate”.
EXECUTIVE SUMMARY

2 • Louis de la Parte Florida Mental Health Institute • December 2004
During the summer and fall of 2004, investigators at the Louis de la Parte Florida Mental Health Institute (FMHI) completed a survey of Pinellas County residents and providers as part of a human service needs assessment conducted under a contract with the Pinellas County Department of Social Services. This report provides a summary of the methods and findings from this survey component of the needs assessment. The goal of the survey component was to obtain both providers’ and citizens’ perspectives regarding the need for, accessibility to, and effectiveness of Pinellas County human services in four domains: homelessness, health, mental health/substance abuse, and basic needs (e.g., food, shelter). In conjunction with the other components of this needs assessment, the results of the mail survey should assist county officials in identifying and prioritizing the county’s human services needs.
INTRODUCTION

Human Services Needs Assessment • Provider and Citizen Survey Results • 3
Respondents: Insights from several stakeholder groups were sought using survey techniques. A total of 1,500 questionnaires were distributed to three distinct target audiences; 1) 1,000 service providers identified from the County’s 211 service provider contact list and the senior helpline provider contact list given to FMHI by county officials, 2) 200 service users recruited by program staff at selected provider agencies/ organizations designated by county officials, and 3) 300 Pinellas County citizens randomly selected from current telephone directories. Within each respondent group special efforts were undertaken to ensure participation from respondents living or operating in different geographic regions of Pinellas County (i.e., north, mid, and south).
In addition to individuals whose participation was specifically solicited through the survey component of this needs assessment, broader citizen participation was invited in three ways: 1) by completing questionnaires provided at the four community forums conducted as part of this needs assessment, 2) by completing questionnaires provided to county officials by FMHI for distribution directly to service providers, and 3) by completing an on-line web-based version of the survey.
Questionnaire Design. Copies of both the citizen and provider questionnaires were drafted based on
systematic review of previously conducted needs assessment surveys from other jurisdictions. The draft surveys solicited information in the four human service areas identified by the advisory group for study. These areas included: 1) homelessness, 2) health care, 3) mental health/substance abuse, and 4) basic needs (e.g., food, rent, housing, financial). Additionally, questions were asked about various “Other” services. The draft questionnaires were circulated to the advisory group members for their review and comment.
The provider survey (See Appendix A) contained 89 questions and asked respondents to indicate their perceptions regarding the need, accessibility, and effectiveness of a variety of services within the four human service domains using a four-point Likert-type scale. Providers were also asked to report on the adequacy of funding, system functioning, and interagency cooperation related to homelessness, health care, mental health/substance abuse, and basic needs services.
METHODOLOGY

4 • Louis de la Parte Florida Mental Health Institute • December 2004
The content of the citizen questionnaire (See Appendix B) closely paralleled that of the provider survey although it differed somewhat (e.g., citizens were not asked about issues such as the level of providers’ coordination or about some specific service types). The questionnaire contained 69 items. Similar to the provider questionnaire, citizens were asked to provide their perceptions regarding the need, accessibility, and effectiveness of a variety of services within the four human service domains using a four-point Likert-type scale. Citizens were also asked about their personal use of human services and their familiarity with how they could access services if needed, as well as a variety of demographic questions.
Mailing and Recruitment Procedures. Mail survey techniques have been used with varying results in differing
settings. For this needs assessment a highly systematic and structured mailing approach was used to solicit input from providers and the general citizen community sample that was similar to those recommended by Dillman (1978) and Salant and Dillman (1994). In total, five separate mailings were conducted. The first mailing consisted of a prenotification postcard informing the Pinellas County service providers and general citizens who were sampled that we were conducting a needs assessment study and that they would receive a mail questionnaire within about a week. One week later a second mailing was conducted. This mailing included a letter address to the executive director or program administrator (or to the community citizen) and a questionnaire with an explanation of the purpose of the needs assessment and information about the days and hours of operation of the toll-free telephone number (See Appendix C for copies of postcard text and the letters). A preaddressed stamped return envelope was also included in the mailing. One week later, a postcard reminder was sent to each provider or citizen who had not yet responded. This reminder emphasized the importance of the needs assessment and again included information on the toll-free telephone number they could call with questions. Two weeks after the postcard reminder was mailed, a fourth mailing containing a cover letter, questionnaire, and return envelope was mailed to each non-responding provider. Finally, four weeks later, a fifth mailing was sent providers and to citizens in the general community sample who had not yet responded. As with the second and fourth mailing, recipients received a cover letter, questionnaire, and a preaddressed, stamped return envelope. As recommended by Dillman (1978), first class postage was used on both the outgoing and return envelopes of each mailing and address correction was requested from the post office so that mailing lists could be updated.
The 300 individuals included as part of the general citizen community sample were offered $8.00 as compensation for completing and returning the needs assessment questionnaire. Providers were not compensated for their participation in the needs assessment.

Human Services Needs Assessment • Provider and Citizen Survey Results • 5
Individuals solicited as part of the 200 citizen’s service user sample were recruited to participate in a different manner to protect and maintain their confidentiality. Selected service providers from each of the four human service domains of interest were identified by county personnel and agreed to recruit a small number (between 4 to 8) of service users to complete and return the citizen’s version of the needs assessment questionnaire. FMHI distributed to each of these selected providers packets containing a cover letter explaining the purpose of the needs assessment and including the toll free number to call with any questions, a pre-addressed stamped return enveloped so respondents could mail the questionnaires back to FMHI, and funds so that providers could pay each service user $8.00 for completing the needs assessment questionnaire.
Analysis. The data used in these analyses were compiled and downloaded on November
22, 2004. Questionnaires submitted after that date while included in the data file provided to the county, are not included in the analyses conducted for this report. For respondents to both the provider and citizen’s versions of the questionnaire, aggregate need, accessibility, and effectiveness scores were calculated within each of the human services domains by averaging individuals’ responses across the series of services listed within that domain. Respondents who rated less than two thirds of the services listed within a domain were excluded from that analysis. In addition, descriptive analyses were performed on each question in the survey. Among providers, responses were analyzed relative to the type of services their agency/organization offered. This analysis was conducted to assess whether providers of specific services rated the need for these service significantly higher relative to services their agency/organization did not provide. In addition, provider responses were also examined according to the location of the agency/organization (i.e., south county, mid county, north county) based on zip codes, to determine if levels of reported need, accessibility, and effectiveness differed across geographic locations.
In terms of the citizen version of the questionnaire, analyses were conducted by respondent subgroups (i.e., solicited general community sample, solicited service user sample, and unsolicited citizen sample). Similar to the providers analysis, citizens’ responses were also analyzed by region of the county (i.e., south county, mid county, north county) based on zip codes, to determine if levels of reported need, accessibility, and effectiveness differed across locations.

6 • Louis de la Parte Florida Mental Health Institute • December 2004
Service Providers Questionnaire
Respondent Characteristics
A total of 326 service providers responded to the provider version of the needs assessment questionnaire, representing an unadjusted response rate of 32.6%. When adjusted for incorrect addresses (n=72 or 7.2%), the response rate was 35.1%. These results are presented in Table 1. Providers were categorized according to three groups based on the geographic location of their agency/ organization within the county (i.e., north county, mid county, and south county). Overall, 9% of the responses were from providers in north county, 44% from mid county, while 47% were from south county. Approximately 22% of the providers offered services for homeless individuals, 26% health-related services, 21% mental health and substance abuse services, 42% basic needs services, and 48% “other” human services (Note. Percentages exceed 100% given that many agencies/organizations offer more than one type of assistance).
Table 1. Provider Survey Respondent Characteristics
Estimated Service Need and Units Provided
Providers were asked to estimate the number of individuals per month in Pinellas County that are in need of assistance within each of the four human services domains examined in this needs assessment as well as the unduplicated number of service units their agency/organization provides each month. Results from these questions are summarized in Table 2. Caution is advised when interpreting these numbers given the vast difference in the types of service units likely being reported (e.g., meals versus counseling sessions) and the extreme variability reported across providers. As can be seen in this table, the standard deviations exceed the means on each estimate.
Characteristic N % Services offered: Homelessness Health Mental health/Substance abuse Basic needs Other
71 83 68 137 157
21.8%1 25.5 20.9 42.0 48.2
Region: North county Mid county South county
29 141 151
9.0 44.0 47.0
1P ecentages add to more than 100% because the agencies/ organizations surveyed can provide more than one service type.
RESULTS

Human Services Needs Assessment • Provider and Citizen Survey Results • 7
Estimated # of people/per month
Estimated # of units/per month
Domain
Mean SD Mean SD Homeless 2210 2649 369 1003
Health 5274 6629 3839 13967
Mental health/Substance Abuse 4652 7165 484 1330
Basic Needs 6116 7957 728 2617
Other NA NA 1409 3677
Given these cautions, within each human service domain providers estimated that the number of people in need of assistance each month exceeded the number of units of service they reported providing in that domain. Specifically, providers estimated that over 2,200 individuals are in need of homeless services each month in Pinellas County yet reported providing only 369 unduplicated units of service. This number is substantially less than the 4,000 individuals estimated by the Pinellas County Coalition for the Homeless (2004) in their one-day point-in-time enumeration.
In terms of health-related services, over 5,200 county residents were estimated to need assistance each month with about 3,800 unduplicated units of health services being provided. In excess of 4,500 individuals were estimated to be in need of mental health/substance abuse services each month with unduplicated count of 484 units of service being provided. Over 6,100 residents were estimated in need assistance with basic needs while 728 unduplicated units of service were being provided. Additionally, providers estimated that about 1,400 unduplicated units of “other” services were provided to county residents each month.
Table 2. Providers’ Estimated Need and Service Provision
Assessment of the Adequacy of Funding, Functioning, & Coordination.
Providers were asked to assess the adequacy of current levels of funding, functioning, and coordination in each of the four human service domains using a four-point Likert-type scale. Table 3 provides a summary of the means and standard deviations in each area for each domain. Across each of the four human service domains, providers assessed current funding levels as less than “somewhat adequate.” In terms of the current functioning within each human service domain, providers’ assessment was about “somewhat adequate.” Similarly, providers reported the current level of cooperation among providers within each domain as “somewhat adequate”.

8 • Louis de la Parte Florida Mental Health Institute • December 2004
Table 3. Providers’ Perceptions Regarding the Adequacy of Funding, Functioning, & Coordination by Service Domain
Providers’ assessments of the adequacy of funding, functioning, and coordination within each domain were also analyzed by the location of their agency/organization to determine if providers reported differential assessments on these issues based on the geographic region. Although not statistically significant, provider located in the northern section of the county generally assessed the current funding, functioning, and coordination of services as less adequate relative to providers located in mid and south county.
Service Need, Accessibility, and Effectiveness.
Providers were asked to assess the need, accessibility, and effectiveness of various services within each domain using a four-point Likert-type scale. A summary of the responses to each question can be found in Appendix A. Aggregate responses by domain are presented graphically in Figure 1.
As can be seen in this figure, providers indicated a high level of need existed within each of the human service domain examined. Their assessment of need was also consistent across service domains. Ratings of accessibility were in the “somewhat accessible” range with the exception of the health domain which was rated as slightly more accessible compared to the other domains. The overall effectiveness of available services was also rated by providers in the “somewhat effective” range with the exception of the health domain which was rated a slightly more effective compared to the other domains.
Funding Functioning Cooperation Domain Mean1
SD Mean1 SD Mean1 SD
Homeless 1.72 .70 1.94 .75 2.04 .84
Health 1.84 .77 2.05 .78 2.09 .80
Mental health/ Substance abuse
1.74 .77 1.93 .76 2.01 .80
Basic need 1.81 .75 2.00 .77 2.02 .81 1 1=Not at all Adequate; 2=Somewhat Adequate; 3=Moderately Adequate; 4=Very Adequate

Human Services Needs Assessment • Provider and Citizen Survey Results • 9
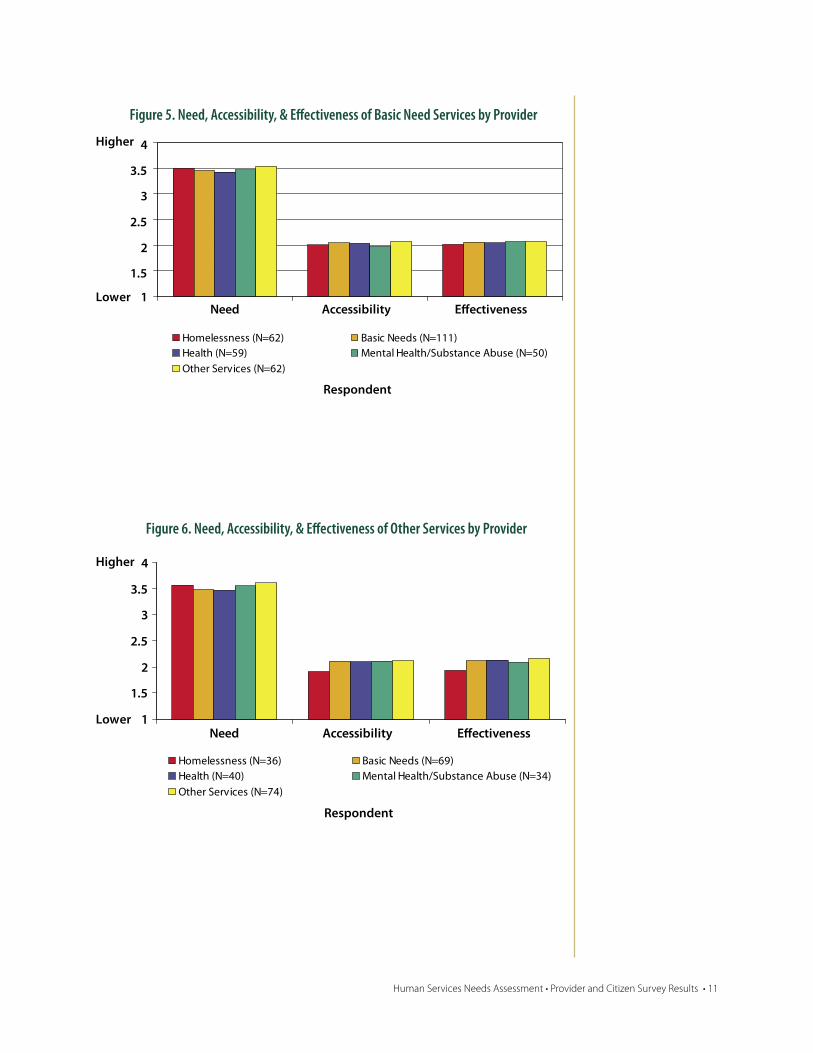
Analyses were also conducted to determine if providers’ assessment of need, accessibility, and effectiveness was associated with the type of services their agency/organization offered. This analysis was conducted to determine if providers of specific services rated the need for these services significantly higher relative to services their agency/organization did not provide. In general, little variability was found among providers of different services with respect to their assessments of need, accessibility, and effectiveness of services within the various human services domains. Figure 2 portrays these results for services in the homeless domain. Although not discussed in detail below, results related to the other domains were quite similar and are presented in Figures 3-6.
Figure 1. Need, Accessibility, Effectiveness Across Human Service Domains (Providers)
Figure 2: Need, Accessibility, & Effectiveness of Homelessness Services by Provider
1
1.5
2
2.5
3
3.5
4
Need Accessibility Effectiveness
Homelessness (N=233) Basic Needs (N=221)Health (N=182) Mental Health/Substance Abuse (N=143)Other Services (N=151)
Lower
Higher
Human Service Domain
1
1.5
2
2.5
3
3.5
4
Need Accessibility Effectiveness
Homelessness (N=65) Basic Needs (N=114)Health (N=59) Mental Health/Substance Abuse (N=54)Other Services (N=114)
Lower
Higher
Respondent

10 • Louis de la Parte Florida Mental Health Institute • December 2004
Figure 3. Need, Accessibility, & Effectiveness of Health Services by Provider
1
1.5
2
2.5
3
3.5
4
Need Accessibility Effectiveness
Homelessness (N=36) Basic Needs (N=84)Health (N=56) Mental Health/Substance Abuse (N=40)Other Services (N=79)
Lower
Higher
Respondent
1
1.5
2
2.5
3
3.5
4
Need Accessibility Effectiveness
Homelessness (N=38) Basic Needs (N=68)Health (N=40) Mental Health/Substance Abuse (N=41)Other Services (N=62)
Lower
Higher
Respondent
Figure 4. Need, Accessibility, & Effectiveness of Mental Health/Substance Abuse Services by Provider
Human Services Needs Assessment • Provider and Citizen Survey Results • 11
Figure 5. Need, Accessibility, & Effectiveness of Basic Need Services by Provider
1
1.5
2
2.5
3
3.5
4
Need Accessibility Effectiveness
Homelessness (N=62) Basic Needs (N=111)Health (N=59) Mental Health/Substance Abuse (N=50)Other Services (N=62)
Lower
Higher
Respondent
1
1.5
2
2.5
3
3.5
4
Need Accessibility Effectiveness
Homelessness (N=36) Basic Needs (N=69)Health (N=40) Mental Health/Substance Abuse (N=34)Other Services (N=74)
Lower
Higher
Respondent
Figure 6. Need, Accessibility, & Effectiveness of Other Services by Provider

12 • Louis de la Parte Florida Mental Health Institute • December 2004
Providers’ assessments regarding the needs, accessibility, and effectiveness of services within each human service domain were also analyzed by the location of their agency/organization. These analyses were conducted to determine if providers located within certain geographic areas of the county rated the needs for these services significantly higher relative to providers located in different areas of the county. The results of these analyses are presented graphically by each domain in Figures 7-11.
Some slight but non-significant variations were observed across the three regions of the county with respect to providers’ assessment of the needs for, accessibility to, and effectiveness of services within these human services domains. In general, needs were assessed by providers throughout the county as high in each domain examined. In terms of service accessibility and effectiveness, overall provider assessments were in the “somewhat” range. Providers from the northern region of the county reported mental health/substance abuse and “other” services as somewhat less accessible and somewhat less effective compared to providers in other section of the county although these differences were not statistically significant.
1
1.5
2
2.5
3
3.5
4
Need Accessibility Effectiveness
South County (N=115) Mid County (N=99) North County (N=17)
Lower
Higher
Region
Figure 7. Need, Accessibility, & Effectiveness of Homelessness Services by Region (Provider)

Human Services Needs Assessment • Provider and Citizen Survey Results • 13
1
1.5
2
2.5
3
3.5
4
Need Accessibility Effectiveness
South County (N=88) Mid County (N=81) North County (N=12)
Lower
Higher
Region
Figure 8. Need, Accessibility, & Effectiveness of Health Services by Region (Provider)
1
1.5
2
2.5
3
3.5
4
Need Accessibility Effectiveness
South County (N=76) Mid County (N=61) North County (N=9)
Lower
Higher
Region
Figure 9. Need, Accessibility, Effectiveness ofMental Health Substance Abuse Services by Region (Provider)

14 • Louis de la Parte Florida Mental Health Institute • December 2004
Providers’ Top Five Service Needs.
Providers’ top five services needs were identified based on the average need rating. These are summarized in Table 4 along with the percentage of respondents who reported that service was a “Great” or “Moderate” need. As previously noted, providers responses to each question can be found in Appendix A.
Analysis of the providers’ responses indicated that several needs emerged across the human services domains examined. The need for enhanced coordination among service providers was found among the top five needs in three of the domains assessed (i.e., health care, mental health/substance abuse, basic needs). The top five providers’ needs also included transportation within three of the domains
1
1.5
2
2.5
3
3.5
4
Need Accessibility Effectiveness
South County (N=115) Mid County (N=90) North County (N=16)
Lower
Higher
Region
Figure 10. Need, Accessibility, Effectiveness of Basic Needs Services by Region (Provider)
1
1.5
2
2.5
3
3.5
4
Need Accessibility Effectiveness
South County (N=82) Mid County (N=60) North County (N=9)
Lower
Higher
Region
Figure 11. Need, Accessibility, Effectiveness of Other Services by Region (Provider)

Human Services Needs Assessment • Provider and Citizen Survey Results • 15
Domain/Need
Mean % Great or Moderate Need
Homelessness
Health care needs 3.67 95.4% Prevention service 3.59 94.0% Mental health/Substance abuse service * 3.56 95.7% Safe havens * 3.54 91.3% Transportation * 3.46 89.1% Health Care
Prescriptions * 3.72 95.4% Primary care * 3.60 94.9% Dental * 3.55 92.9% Transportation 3.51 90.7% Coordinated referral process 3.48 90.7% Mental Health/Substance Abuse
Coordinated care 3.61 94.4% Housing 3.59 90.4% Prescriptions * 3.58 91.5% Out -patient counseling * 3.57 93.9% Job/Vocational training * 3.50 91.9% Basic Needs
Help with housing * 3.62 93.1% Coordination among providers 3.58 93.8% Help with utilities * 3.55 93.2% Help with transportation 3.52 90.3% Help with rent/mortgage * 3.50 92.3% Other Services
Elder care * 3.69 98.0% Child care * 3.63 95.1% Respite care 3.59 94.2% Delinquency prevention * 3.58 94.1% Chore services 3.57 94.1%
*Also one of the citizens top five needs
(i.e., homelessness, health care, basic needs). Housing issues also emerged as a consistently reported need among providers emerging as one of the top five priorities within the homelessness, mental health/substance abuse, and basic needs domains. As is also noted in this table, many of the needs identified by providers were consistent with the need that emerged from citizen respondents. It is important to emphasize that while this table provides a summary of the top five needs, this should not be interpreted that there was not a need for the other services assessed. To the contrary, the differences in the average reported need among services that made the providers top five list and those services that did not were quite small.
Table 4. Providers’ Top Five Needs by Domain

16 • Louis de la Parte Florida Mental Health Institute • December 2004
Citizen Questionnaire
Respondent Characteristics.
A total of 390 community members responded to the citizen’s version of the needs assessment questionnaire. As previously noted, citizen respondents were categorized into three groups: 1) solicited community members, 2) solicited service users, and 3) unsolicited community members. Solicited community members were respondents from the group of 300 individuals selected at random from county telephone directories. A total of 84 questionnaires were received from this subgroup representing an unadjusted response rate of 28.0% for this subgroup. When adjusted for incorrect addresses (n=38 or 12.7%), the response rate was 32.1%. Solicited service users were respondents from the group of 200 consumers obtained from selected service providers in the county. A total of 162 questionnaires were received from service users representing a response rate of 81.0%. In addition to respondents from the 500 citizens specifically targeted to participate in the needs assessment, other county residents had an opportunity to participate in the needs assessment process. Questionnaires were distributed at the each of the four community forums, by service providers, and by the county. Additionally, citizens could participate by completing the on-line web-based version of the survey. Questionnaires were received from a 149 “unsolicited community members.”
Table 5 presents a summary of the demographic characteristics of the citizen respondents. As is shown in this table, nearly 59% of the respondents were female and 41% male. Approximately a quarter of the respondents were under 35 years old, 51% were between 36 and 55 years old, while the remaining respondents were over 56 years old. With respect to race, the majority of the respondents were White (69%), 12% were Black/African American, while the remaining respondents were from other racial groups or indicated no primary racial affiliation. In terms of ethnicity, about 8% of the respondents reported they were Hispanic.

Human Services Needs Assessment • Provider and Citizen Survey Results • 17
Table 5. Citizen Survey Respondent Characteristics
Characteristics N % Respondent type: Solicited community member Solicited consumer Unsolicited (forums & online)
84 162 149
21.8% 41.6 % 38.3%
Gender: Male Female
224 156
58.9% 41.1%
Age: Under 25 25 to 35 36 to 45 46 to 55 56 to 65 Over 65
18 69 97 97 51 49
4.7% 18.1% 25.5% 25.5% 13.4% 12.9%
Race: Asian/Pacific Islander Black/A frican American Caucasian Native American Another race No primary affiliation
5 48 272 15 21 7
1.3% 12.2% 68.9% 3.8% 5.3% 1.8%
Ethnicity: Hispanic (% Yes)
30
7.6% Adults in household (including self): 1 2 3 4 or more
171 160 22 8
43.3% 40.5% 5.6% 2.1%
Children in household: 0 1 2 3 4 or more
68 59 8 47 7
36.0% 31.2% 24.9% 4.2% 3.7%
Has insurance (% Yes)
135
34.1%
Type of insurance: Through work Through spouse Medicaid Medicare Veterans Administration Other
103 37 31 36 10 29
41.9% 15.0% 12.6% 14.6% 4.1% 11.8%

18 • Louis de la Parte Florida Mental Health Institute • December 2004
With respect to household composition, over 43% of the respondents were the only adult in the household, 40% lived with one other adult, while 8% lived with two or more adults. There were no children living in a third of the responding households, approximately a third of the respondents had one child at home, while the remaining third of the respondents lived with two or more children.
Over a third of the respondents reported having no health care insurance. Among those with insurance, 41.9% indicated having health insurance through work, 15.0% had their insurance through their spouse, 12.6% were enrolled in Medicaid, and 14.6% in Medicare, and 4.1% had insurance through the Veterans Administration. The remaining respondents reported insurance through “other” sources.
Citizens’ Service Use.
Citizen respondents were asked to report if they had used any of a variety of human services during the past year. These results are summarized in Table 6 in the aggregate and by the citizen respondent subgroup. Overall citizen’s reported service use ranged from none for respite care services to nearly 75% for prescription drug services.
Not surprisingly, in many of the service categories (e.g., transportation, employment, shelter emergency), a higher proportion of citizens who were surveyed from among service users reported using various services. This was not true for all service categories, however, as this subgroup of respondents was less likely to have used private physicians, dental, and vision services compared to respondents from the general population of community members whose responses were not specifically solicited.
Service Need, Accessibility, and Effectiveness. Citizens were asked to assess the need, accessibility, and effectiveness of various services within each domain using a four-point Likert-type scale. A summary of their responses to each question can be found in Appendix E. Aggregate responses by domain are presented graphically in Figure 12.

Human Services Needs Assessment • Provider and Citizen Survey Results • 19
Service Solicited Citizen (N=82)
Solicited Consumer
(N=161)
Unsolicited Citizen (N=134)
Total
(N=377)
Prescription drug 82.5 73.1 72.6 74.9%
Private physician 86.6% 50.6% 79.4% 68.9
Emergency room 45.0 68.4 61.8 61.0
Dental 76.5 51.6 59.3 59.8
Vision 74.1 44.6 52.6 53.9
Food or clothing assistance 3.9 63.4 23.2 38.5
Walk -in clinic 34.6 47.2 36.6 38.2
Transportation 16.9 47.8 26.5 33.7
Mental health 10.5 47.8 30.4 33.3
Housing or shelter assistance 3.9 50.9 19.8 30.0
Employment -related 15.6 34.2 23.5 26.4
Rent or utility assistance 4.0 37.1 20.5 24.3
Substance abuse 3.9 33.5 14.3 20.4
Respite care 0 0 0 0
Table 6. Service Use by Type of Citizen Respondent
1
1.5
2
2.5
3
3.5
4
Need Accessibility Effectiveness
Homelessness Basic NeedsHealth Mental Health/Substance AbuseOther Services
Lower
Higher
Human Service Domain
Figure 12. Need, Accessibility, Effectiveness Across Human Service Domains (Citizens)

20 • Louis de la Parte Florida Mental Health Institute • December 2004
The responses from the citizen questionnaire were similar to those of providers. As Figure 12 shows, citizens reported consistently high levels of need within each human service domain. Ratings of accessibility were in the “somewhat accessible” range with the exception of the health domain which was rated as slightly more accessible compared to the other domains. Citizens also rated the overall effectiveness of available services in the “somewhat effectiveness” range with the exception of the homelessness and health domains which were rated as slightly, albeit not significantly, more effective compared to the other domains.
Citizens’ assessment of service need, accessibility, and effectiveness were also analyzed by geographic location to determine if differences existed in their assessments by region of the county. Overall, few differences were found among the responses of citizens residing in different areas of the county with respect to their assessments of need, accessibility, and effectiveness of services within the various human services domains. Some slight but non-significant differences were noted in the homelessness domain, with respondents from north county reporting slightly higher needs and poorer accessibility and effectiveness of these services.
Citizens’ Top Five Service Needs.
Citizens’ top five services needs were identified within each domain based on the ranking of the average rating of each service. These results are summarized in Table 7 along with the percentage of respondents who reported that service was a “Great” or “Moderate” need. Citizen’s responses to each question can be found in Appendix B.
Analysis of the citizens’ responses identified several needs emerged across the various domains. Citizens’ assessed the need for job/vocational training as among the top five needs in three of the domains (i.e., homelessness, mental health/substance abuse, basic needs). Citizens’ top five needs also included transportation within three of the domains (i.e., homelessness, basic needs, other services). The need for housing also was a consistent need among the citizens surveyed, emerging as one of the top five priorities within the homelessness, mental health/substance abuse, and basic needs domains. As is also noted in this table, many of the needs identified by citizens were consistent with the needs that emerged from providers. As was previously noted, it is important to emphasize that while this table provides a summary of the top five needs, this should not be interpreted that there was not a need for the other services assessed. To the contrary, the differences in the average reported need among services making the citizens top five list and those that did not were quite small.

Human Services Needs Assessment • Provider and Citizen Survey Results • 21
Domain/Need
Mean % Great or Moderate
Need Homelessness
Affordable housing 3.65 93.5% Job/vocati onal training 3.56 92.4% Emergency housing * 3.54 92.9% Mental health/Substance abuse * 3.52 90.9% Transportation * 3.46 87.8% Health Care
Prescriptions * 3.65 95.4% Primary care * 3.63 94.8% Dental * 3.56 90.8% Specialty care 3.47 88.8% Vision 3.46 88.7% Mental Health/Substance Abuse
Job/vocational training * 3.59 94.8% Housing 3.55 90.3% Prescriptions * 3.52 90.9% Out -patient counseling * 3.51 91.3% Substance abuse detoxification 3.51 90.0% Basic Needs
Help with housing * 3.68 93.5% Job/vocational training 3.53 92.9% Help with rent/mortgage * 3.51 89.8% Help with utilities * 3.50 88.7% Help with transportation 3.47 87.8% Other Services
Elder care * 3.62 93.2% Child care * 3.53 89.8% School drop -out prevention 3.53 90.6% Transportation 3.52 92.4% Delinquency prevention * 3.49 90.0%
*Also one of the providers top five needs
Table 7. Citizens’ Top Five Needs by Domain

22 • Louis de la Parte Florida Mental Health Institute • December 2004
Citizens’ and provider’s perceptions regarding the need, accessibility, and effectiveness of services across the four human service domains examined through this needs assessment suggest a rather high rate of need across each domain with relatively low levels of both accessibility and effectiveness. Within each human service domain, citizens and providers identified the need for many of the same services within their top five needs which included housing and transportation. Additionally, providers consistently reported a need for improved service coordination across domains while citizens perceived a need for job/vocational training. Providers also reported current funding levels within the four service domains were less than “somewhat adequate” and that current functioning and the level of provider cooperation were in the “somewhat adequate” range.
Dillman, D. A. (1978). Mail and telephone surveys: The total design method. New York, John Wiley & Sons, Inc.
Pinellas County Coalition for the Homeless (2004). Final Report - 2004 Homeless Conditions in Pinellas County. St. Petersburg, FL: Author. Access on-line December 3, 2004 at http://www.pccoho.org/2004/Final%20report%202004%20Homelessness%20Statistics.pdf
Salant, P. A., & Dillman, D. A. (1994). How to conduct your own survey. New York, John Wiley & Sons, Inc.
SUMMARY
REFERENCES

Human Services Needs Assessment • Provider and Citizen Survey Results • A-23
Appendix A
Response to Provider Survey

A-24 • Louis de la Parte Florida Mental Health Institute • December 2004
Pinellas County Needs Assessment: Provider Survey
Th e University of South Florida needs your help. We are conducting a needs assessment on behalf of the Pinellas County Human Services Project. Th is assessment is designed to obtain needs information in four human service areas: homelessness, health services, mental health/substance abuse services, and basic services (e.g., food and shelter). Th is project can only succeed with your help and cooperation. We would like your opinions regarding the availability of certain services in Pinellas County and the extent to which you think there is a need for these services.
Participation in completing this survey is completely voluntary and all of your answers are strictly confi dential. No one other than the project staff at the University of South Florida will have access to individual responses and they will not be shared with anyone. Your answers will be added to those of other providers so your agency cannot be identifi ed.
Since you are a provider in Pinellas County, you are part of a select group of providers chosen to receive this survey. It is important for us to know what you think. Th e survey is about service needs, availability, and eff ectiveness in Pinellas County. It should take about 20-25 minutes to complete.
If you have any questions about this survey or would like to complete it by telephone, you can call us toll-free at 1-888-263-6899. Someone will be there to talk with you Monday through Friday from 8:30 am to 8:30 pm. Please return the completed survey in the stamped pre-addressed return envelope that has been provided.
I would like to thank you for your help with this important project. Th is is your opportunity to comment on service availability in Pinellas County and will help identify gaps in existing service capacity.
Survey Number: ___ ___ ___ ___

Human Services Needs Assessment • Provider and Citizen Survey Results • A-25
Th e
follo
win
g qu
estio
ns re
late
to se
rvic
es fo
r hom
eles
s ind
ivid
uals
in P
inel
las C
ount
y. Fo
r eac
h se
rvic
e pl
ease
pro
vide
you
r hon
est o
pini
on re
gard
ing:
1) t
he n
eed
for t
hese
serv
ices
by
circ
ling
a re
spon
se in
col
umn
A; 2
) the
acc
essib
ility
of t
hese
serv
ices
by
circ
ling
a re
spon
se in
col
umn
B; 3
) how
eff e
ctiv
e yo
u th
ink
thes
e se
rvic
es
are
in m
eetin
g th
e ne
eds o
f the
Cou
nty’s
hom
eles
s ind
ivid
uals
by c
irclin
g a
resp
onse
in c
olum
n C
. If y
ou d
o no
t fee
l you
hav
e en
ough
info
rmat
ion
to p
rovi
de a
n op
inio
n pl
ease
circ
le D
K in
the
last
colu
mn
to in
dica
te “
Don
’t K
now.
”
A
B
C
Wha
t is
the
need
for
this
ser
vice
in
Pin
ella
s C
ount
y?
How
acc
essi
ble
is th
is s
ervi
ce in
P
inel
las
Cou
nty?
H
ow e
ffec
tive
is th
is s
ervi
ce in
P
inel
las
Cou
nty?
Prov
ider
Que
stio
ns r
elat
ed to
H
omel
essn
ess
Lim
ited
Nee
dSl
ight
Nee
dM
oder
ate
Nee
dG
reat
Nee
dN
otV
ery
Som
ewha
t M
oder
atel
y V
ery
Not
Ver
ySo
mew
hat
Mod
erat
ely
Ver
y D
on’t
K
now
1. T
empo
rary
/em
erge
ncy
shel
ters
for
:
a)
Sing
le m
en
27
4246
2048
293
2244
286
28
b)
Sing
le w
omen
2
9 41
47
22
51
24
3
22
46
28
5 26
c
) Fa
mili
es
25
3458
2846
242
2839
284
26 2
. Tra
nsiti
onal
hou
sing
3
7 35
55
34
46
19
1
24
46
26
5 27
3. P
erm
anen
t aff
orda
ble
hous
ing
04
2471
4438
163
3840
165
27 4
. Per
man
ent s
uppo
rtiv
e ho
usin
g 1
8 37
54
37
44
17
2
29
48
18
6 32
5. D
omes
tic v
iole
nce
shel
ters
4
1142
4411
3339
178
2644
2226
6. R
unaw
ay s
helte
rs f
or te
ens
3 12
45
39
24
44
26
6
24
36
31
9 37
7. P
reve
ntio
n of
hom
eles
snes
s 2
427
6750
3216
346
3515
430
8. O
utre
ach/
inta
ke
3 8
38
51
28
42
27
3 23
44
26
7
36 9
. Dro
p-in
cen
ters
(e.
g., s
how
ers,
mai
l,
cl
othi
ng e
tc.)
4
939
4938
3623
232
3825
535
10. E
mer
genc
y fo
od s
ervi
ces/
soup
kitc
hens
5
10
42
42
7 37
44
12
6
33
46
16
2111
. Sup
port
ive
serv
ices
(e.
g., c
ase
man
agem
ent,
advo
cacy
) 3
837
5224
3931
623
4030
627
12. J
ob/v
ocat
iona
l tra
inin
g 2
7 36
56
25
39
32
4
22
40
31
8 27
13. T
rans
port
atio
n 3
830
5934
4019
733
4218
723
14. M
enta
l hea
lth/s
ubst
ance
abu
se s
ervi
ces
1 3
34
62
23
45
28
4 22
43
28
7
2315
. Hea
lth c
are
14
2273
2939
284
2542
267
2216
. Saf
e ha
ven
for
pers
ons
with
men
tal
illne
ss
1 8
27
64
48
37
12
2 40
40
16
4
28
17. O
ther
(pl
ease
spe
cify
)__
____
____
____
____
____
____
____
____
_ 18
. Oth
er (
plea
se s
peci
fy)
____
____
____
____
____
____
____
____
___

A-26 • Louis de la Parte Florida Mental Health Institute • December 2004
Th e
follo
win
g qu
estio
ns re
late
to h
ealth
serv
ices
in P
inel
las C
ount
y. Fo
r eac
h se
rvic
e pl
ease
pro
vide
you
r hon
est o
pini
on re
gard
ing:
1) t
he n
eed
for t
hese
serv
ices
by
circ
ling
a re
spon
se in
col
umn
A; 2
) the
acc
essib
ility
of t
hese
serv
ices
by
circ
ling
a re
spon
se in
col
umn
B; 3
) how
eff e
ctiv
e yo
u th
ink
thes
e se
rvic
es a
re in
mee
ting
the
heal
th n
eeds
of t
he P
inel
las C
ount
y re
siden
ts by
circ
ling
a re
spon
se in
col
umn
C. I
f you
do
not f
eel y
ou h
ave
enou
gh in
form
atio
n to
pro
vide
an
opin
ion
plea
se c
ircle
D
K in
the
last
colu
mn
to in
dica
te “
Don
’t K
now.
”
A
B
C
Wha
t is
the
need
for
this
ser
vice
in
Pin
ella
s C
ount
y?
How
acc
essi
ble
is th
is s
ervi
ce in
P
inel
las
Cou
nty?
H
ow e
ffec
tive
is th
is s
ervi
ce in
P
inel
las
Cou
nty?
Pro
vide
r Q
uest
ions
re
late
d to
Hea
lth S
ervi
ces
Lim
ited
Nee
dSl
ight
Nee
dM
oder
ate
Nee
d
Gre
atN
eed
Not
Ver
ySo
mew
hat
Mod
erat
ely
Ver
y N
otV
ery
Som
ewha
t M
oder
atel
y V
ery
Don
’t
Kno
w
19. P
rim
ary/
prev
entiv
e m
edic
al
care
2
328
6726
4029
521
3933
720
20. S
peci
alty
car
e 2
7 37
54
32
38
26
3
26
40
29
4 30
21. P
resc
ript
ions
2
318
7837
3816
934
3719
1023
22. H
ome
heal
th c
are
3 7
37
53
21
36
37
7 14
38
38
10
28
23. O
ut-p
atie
nt h
ospi
tal c
are
(e.g
.,
m
edic
al/s
urgi
cal,
emer
genc
y
ca
re)
610
4242
1233
3719
1232
3818
29
24. I
n-pa
tient
hos
pita
l car
e 10
11
42
37
8
24
44
24
8 22
44
26
30
25. P
hysi
cal o
ccup
atio
nal t
hera
py
719
4430
1133
4214
1228
4416
4026
. Hos
pice
9
12
30
49
3 13
35
49
3
12
28
57
2427
. Den
tal
25
2865
3935
197
3435
247
2528
. Vis
ion
(e.g
., ey
e ex
ams/
co
rrec
tive
lens
es)
1 8
36
55
30
34
27
9 30
29
32
9
27
29. T
rans
port
atio
n fo
r m
edic
al
car
e 1
829
6127
4028
525
4227
522
30. H
ealth
ser
vice
s fo
r no
n-
Eng
lish
spea
king
per
sons
3
10
36
51
28
47
21
4 26
50
18
6
37
31. C
oord
inat
ed r
efer
ral p
roce
ss
36
3060
3139
272
3042
253
3532
. Cas
e m
anag
emen
t ser
vice
s 3
11
40
46
22
46
27
4 26
46
26
2
3533
. Inf
ectio
us d
isea
se c
are
(e.g
., H
IV/A
IDS,
Hep
atiti
s)
212
4442
1441
377
1339
3910
40
34. O
ther
(pl
ease
spe
cify
)__
____
____
____
____
____
____
__
35. O
ther
(pl
ease
spe
cify
)__
____
____
____
____
____
____
__

Human Services Needs Assessment • Provider and Citizen Survey Results • A-27
Th e
follo
win
g qu
estio
ns c
once
rn se
rvic
es to
mee
t the
beh
avio
ral h
ealth
nee
ds o
f Pin
ella
s Cou
nty
resid
ents.
For
eac
h se
rvic
e pl
ease
pro
vide
you
r hon
est o
pini
on
rega
rdin
g: 1
) the
nee
d fo
r the
se se
rvic
es b
y ci
rclin
g a
resp
onse
in c
olum
n A;
2) t
he a
cces
sibili
ty o
f the
se se
rvic
es b
y ci
rclin
g a
resp
onse
in c
olum
n B;
3) h
ow e
ff ect
ive
you
thin
k th
ese
serv
ices
are
in m
eetin
g th
e ba
sic n
eeds
of P
inel
las C
ount
y re
siden
ts by
circ
ling
a re
spon
se in
col
umn
C. I
f you
do
not f
eel y
ou h
ave
enou
gh in
form
atio
n to
pr
ovid
e an
opi
nion
ple
ase
circ
le D
K in
the
last
colu
mn
to in
dica
te “
Don
’t K
now.
”
A
B
C
Wha
t is
the
need
for
this
ser
vice
in
Pin
ella
s C
ount
y?
How
acc
essi
ble
is th
is s
ervi
ce in
P
inel
las
Cou
nty?
H
ow e
ffec
tive
is th
is s
ervi
ce in
P
inel
las
Cou
nty?
Prov
ider
Que
stio
ns r
elat
ed
to M
enta
l Hea
lth/S
ubst
ance
A
buse
Ser
vice
s L
imit
edN
eed
Slig
htN
eed
Mod
erat
eN
eed
Gre
atN
eed
Not
Ver
ySo
mew
hat
Mod
erat
ely
Ver
y N
otV
ery
Som
ewha
t M
oder
atel
y V
ery
Don
’t
Kno
w
36. O
ut-p
atie
nt m
enta
l hea
lth
coun
selin
g2
4 29
64
22
47
30
2
18
45
34
3 26
37. I
n-pa
tient
men
tal h
ealth
tr
eatm
ent
29
3851
2149
301
2242
333
33
38. M
enta
l hea
lth c
risi
s ce
nter
s 3
8 26
63
26
42
30
1
32
37
27
4 31
39. P
resc
ript
ions
for
men
tal h
ealth
3
622
7032
4620
234
3922
535
40. S
ubst
ance
abu
se d
etox
ific
atio
n
ce
nter
s 3
5 33
59
32
39
26
3
29
38
29
4 32
41. S
ubst
ance
abu
se d
ay tr
eatm
ent
cent
ers
36
3556
3635
272
3335
293
37
42. S
obri
ety
mai
nten
ance
pro
gram
s 3
8 32
58
23
32
33
11
23
31
35
10
35
43. S
ubst
ance
abu
se r
esid
entia
l
tr
eatm
ent c
ente
rs
38
3258
3540
241
2940
247
33
44. H
ousi
ng f
or p
erso
ns w
ith m
enta
l
ill
ness
and
sub
stan
ce a
buse
cl
ient
s 2
7 20
71
51
39
10
1
40
41
15
5 32
45. C
ase
man
agem
ent s
ervi
ces
27
3456
3043
243
3142
243
3746
. Job
/voc
atio
nal t
rain
ing
2 6
32
60
23
47
25
4 25
46
24
5
34
47. C
oord
inat
ion
betw
een
prov
ider
s
of
men
tal h
ealth
and
sub
stan
ce
abus
e se
rvic
es
24
2668
3933
262
3933
235
40
48. O
ther
(pl
ease
spe
cify
)__
____
____
____
____
____
____
____
_
49. O
ther
(pl
ease
spe
cify
)__
____
____
____
____
____
____
____
_

A-28 • Louis de la Parte Florida Mental Health Institute • December 2004
Th e
follo
win
g qu
estio
ns c
once
rn se
rvic
es to
mee
t the
bas
ic n
eeds
of P
inel
las C
ount
y re
siden
ts. F
or e
ach
serv
ice,
ple
ase
prov
ide
your
hon
est o
pini
on re
gard
ing:
1)
the
need
for t
hese
serv
ices
by
circ
ling
a re
spon
se in
col
umn
A; 2
) the
acc
essib
ility
of t
hese
serv
ices
by
circ
ling
a re
spon
se in
col
umn
B; 3
) how
eff e
ctiv
e yo
u th
ink
thes
e se
rvic
es a
re in
mee
ting
the
basic
nee
ds o
f Pin
ella
s Cou
nty
resid
ents
by c
irclin
g a
resp
onse
in c
olum
n C
. If y
ou d
o no
t fee
l you
hav
e en
ough
info
rmat
ion
to p
rovi
de a
n op
inio
n pl
ease
circ
le D
K in
the
last
colu
mn
to in
dica
te “
Don
’t K
now.
”
A
B
C
Wha
t is
the
need
for
this
ser
vice
in
Pin
ella
s C
ount
y?
How
acc
essi
ble
is th
is s
ervi
ce in
P
inel
las
Cou
nty?
H
ow e
ffec
tive
is th
is s
ervi
ce in
P
inel
las
Cou
nty?
Prov
ider
Que
stio
ns r
elat
ed
to B
asic
Nee
d S
ervi
ces
Lim
ited
Nee
dSl
ight
Nee
dM
oder
ate
Nee
dG
reat
Nee
dN
otV
ery
Som
ewha
t M
oder
atel
y V
ery
Not
Ver
ySo
mew
hat
Mod
erat
ely
Ver
y D
on’t
K
now
50. H
elp
with
ren
t/mor
tgag
e
1 7
33
59
40
47
13
0 39
42
14
4
1951
. Hel
p w
ith u
tiliti
es
16
3162
3254
122
3347
145
1952
. Hel
p w
ith f
ood
4 7
37
52
11
36
43
10
12
35
39
14
1553
. Hel
p w
ith c
loth
ing
517
4434
1234
4014
1132
4512
1854
. Hel
p w
ith tr
ansp
orta
tion
0 9
28
62
29
53
15
3 31
44
21
4
1855
. Hel
p w
ith a
ffor
dabl
e ho
usin
g 1
623
7038
4714
238
4513
420
56. J
ob/v
ocat
iona
l tra
inin
g 2
7 36
55
24
43
28
6
23
43
27
7 26
57. T
rave
lers
Aid
to r
etur
n to
hom
e
co
mm
unity
10
2137
3345
3814
341
4214
444
58. C
oord
inat
ion
amon
g pr
ovid
ers
of b
asic
nee
ds s
ervi
ces
1 5
28
65
30
46
21
2 33
42
21
4
26
59. O
ther
(pl
ease
spe
cify
)__
____
____
____
____
____
____
____
_60
. Oth
er (
plea
se s
peci
fy)
____
____
____
____
____
____
____
___

Human Services Needs Assessment • Provider and Citizen Survey Results • A-29
Th e
follo
win
g qu
estio
ns c
once
rn o
ther
serv
ices
to m
eet t
he n
eeds
of P
inel
las C
ount
y re
siden
ts. F
or e
ach
serv
ice,
ple
ase
prov
ide
your
hon
est o
pini
on re
gard
ing:
1)
the
need
for t
hese
serv
ices
by
circ
ling
a re
spon
se in
col
umn
A; 2
) the
acc
essib
ility
of t
hese
serv
ices
by
circ
ling
a re
spon
se in
col
umn
B; 3
) how
eff e
ctiv
e yo
u th
ink
thes
e se
rvic
es a
re in
mee
ting
the
basic
nee
ds o
f Pin
ella
s Cou
nty
resid
ents
by c
irclin
g a
resp
onse
in c
olum
n C
. If y
ou d
o no
t fee
l you
hav
e en
ough
info
rmat
ion
to p
rovi
de a
n op
inio
n pl
ease
circ
le D
K in
the
last
colu
mn
to in
dica
te “
Don
’t K
now.
”
A
B
C
Wha
t is
the
need
for
this
ser
vice
in
Pin
ella
s C
ount
y?
How
acc
essi
ble
is th
is s
ervi
ce in
P
inel
las
Cou
nty?
H
ow e
ffec
tive
is th
is s
ervi
ce in
P
inel
las
Cou
nty?
Prov
ider
Que
stio
ns r
elat
ed to
O
ther
Ser
vice
s L
imit
edN
eed
Slig
htN
eed
Mod
erat
eN
eed
Gre
atN
eed
Not
Ver
ySo
mew
hat
Mod
erat
ely
Ver
y N
otV
ery
Som
ewha
t M
oder
atel
y V
ery
Don
’t
Kno
w
61. H
ousi
ng f
or d
isab
led
pers
ons
1
10
39
49
23
48
28
2 22
44
28
6
3362
. Tra
nspo
rtat
ion
16
2964
2741
302
2539
305
2263
. Chi
ld c
are
1 4
26
69
24
37
33
5 20
39
32
8
2564
. Eld
er c
are
02
2771
2238
364
1643
357
2365
. Ser
vice
s fo
r no
n-ci
tizen
s/ill
egal
a
liens
6
12
32
50
34
47
14
5 37
44
14
6
45
66. S
choo
l dro
p-ou
t pre
vent
ion
prog
ram
s
26
2962
2438
326
2740
294
35
67. D
elin
quen
cy p
reve
ntio
n pr
ogra
ms
2 4
29
65
23
40
34
4 28
42
26
4
3768
. Hom
e-ba
sed
serv
ices
/res
pite
car
e/
pers
onal
car
e 1
528
6626
4227
522
4028
1030
69. C
hore
ser
vice
s fo
r se
nior
s 1
5 31
63
27
44
26
4
19
47
26
8 35
70. O
ther
(pl
ease
spe
cify
)__
____
____
____
____
____
____
____
__71
. Oth
er (
plea
se s
peci
fy)
____
____
____
____
____
____
____
____

A-30 • Louis de la Parte Florida Mental Health Institute • December 2004
Th e following questions relate to the adequacy of funding, system functioning, and interagency cooperation associated with the provision of homelessness, health, mental health/substance abuse, and basic needs services in Pinellas County.
84. How many individuals per month in Pinellas County would you estimate are in need of: (If you do not have suffi cient information to estimate please indicate “unknown”)
Mean
a. Homelessness services _2,210____ people
b. Health-related services _5,274____ people
c. Mental health/substance abuse services _4,652____ people
d. Services related to basic needs _6,116____ people
85. Which of the following services does your agency provide? (Check all that apply)
a. _____ Homelessness services
b. _____ Health-related services
c. _____ Mental health/substance abuse services
d. _____ Services related to basic needs
e. _____ Other (please specify) ____________________________________________________________
86. Please indicate how many unduplicated units of service does your agency provides each month?
a. ____________________ Homelessness services
b. ____________________ Health-related services
c. ____________________ Mental health/substance abuse services
d. ____________________ Services related to basic needs
e. ____________________ Other services (please specify) _______________________________________
Adequacy of current funding Not at all Adequate
SomewhatAdequate
Moderately Adequate
VeryAdequate
72. Homeless services 41 47 11 173. Health services 38 41 20 1 74. Mental health/substance abuse services 44 39 15 275. Basic needs services 38 44 17 1 Adequacy of system functioning 76. Homeless services 29 50 19 277. Health services 26 46 26 2 78. Mental health/substance abuse services 31 46 21 279. Basic needs services 26 51 19 4 Adequacy of interagency cooperation 80. Homeless services 29 41 26 481. Health services 24 46 26 4 82. Mental health/substance abuse services 28 46 23 383. Basic needs services 29 44 24 3

Human Services Needs Assessment • Provider and Citizen Survey Results • A-31
87. What is the zip code where your agency is located? ___ ___ ___ ___ ___
88. What do you perceive are the primary barriers associated with the provision of human services in Pinellas County?
89. What recommendations that do not require additional funding would you off er to improve the provision of human services in Pinellas County?
90. Other comments:
Th ank you for taking the time to respond to this survey.

B-32 • Louis de la Parte Florida Mental Health Institute • December 2004
Appendix B
Response to Citizen Survey

Human Services Needs Assessment • Provider and Citizen Survey Results • B-33
Pinellas County Needs Assessment: Citizen Survey
Th e University of South Florida needs your help. We are conducting a needs assessment on behalf of the Pinellas County Human Services Project. Th is assessment is designed to obtain needs information in four human service areas: homelessness, health services, mental health/substance abuse services, and basic services (e.g., food and shelter). Th is project can only succeed with your help and cooperation. We would like your opinions regarding the availability of certain services in Pinellas County and the extent to which you think there is a need for these services.
Participation in completing this survey is completely voluntary and all of your answers are strictly confi dential. No one other than the project staff at the University of South Florida will have access to individual responses and they will not be shared with anyone. Your answers will be added to those of other County residents so you cannot be identifi ed.
Since you are a resident of Pinellas County, you are part of a select group of individuals chosen to receive this survey. It is important for us to know what you think. Th e survey is about service needs, availability, and eff ectiveness in Pinellas County. It should take about 15-20 minutes to complete and you will be paid $8.00 for returning a completed survey.
If you have any questions about this survey or would like to complete it by telephone, you can call us toll-free at 1-888-263-6899. Someone will be there to talk with you Monday through Friday from 8:30 am to 8:30 pm. A web-based version of the survey is also available at www.pinellascounty.org/HumanServicesSurvey/ Please return the completed survey in the stamped pre-addressed return envelope that has been provided.
I would like to thank you for your help with this important project. Th is is your opportunity to comment on service availability in Pinellas County and will help identify gaps in existing service capacity.
Survey Number: ___ ___ ___ ___

B-34 • Louis de la Parte Florida Mental Health Institute • December 2004
Th e
follo
win
g qu
estio
ns re
late
to se
rvic
es fo
r hom
eles
s ind
ivid
uals
in P
inel
las C
ount
y. Fo
r eac
h se
rvic
e pl
ease
pro
vide
you
r hon
est o
pini
on re
gard
ing:
1) t
he n
eed
for t
hese
serv
ices
by
circ
ling
a re
spon
se in
col
umn
A; 2
) the
acc
essib
ility
of t
hese
serv
ices
by
circ
ling
a re
spon
se in
col
umn
B; 3
) how
eff e
ctiv
e yo
u th
ink
thes
e se
rvic
es
are
in m
eetin
g th
e ne
eds o
f the
Cou
nty’s
hom
eles
s ind
ivid
uals
by c
irclin
g a
resp
onse
in c
olum
n C
. If y
ou d
o no
t fee
l hav
e en
ough
info
rmat
ion
to p
rovi
de a
n op
inio
n pl
ease
circ
le D
K in
the
last
colu
mn
to in
dica
te “
Don
’t K
now.
”
A
B
C
Wha
t is
the
need
for
this
ser
vice
in
Pin
ella
s C
ount
y?
How
acc
essi
ble
is th
is s
ervi
ce in
P
inel
las
Cou
nty?
H
ow e
ffec
tive
is th
is s
ervi
ce in
P
inel
las
Cou
nty?
Citi
zen
Que
stio
ns r
elat
ed to
H
omel
essn
ess
Lim
ited
Nee
d
Slig
htN
eed
Mod
erat
eN
eed
Gre
atN
eed
Not
Ver
ySo
mew
hat
Mod
erat
ely
Ver
y N
otV
ery
Som
ewha
t M
oder
atel
y V
ery
Don
’t
Kno
w
1. E
mer
genc
y/tr
ansi
tiona
l she
lters
3
4 29
64
18
43
29
10
17
35
33
15
10
2
. Aff
orda
ble
hous
ing
24
2074
3337
228
2837
2412
10 3
.Dom
estic
vio
lenc
e se
rvic
es
4 10
34
52
11
38
35
16
11
34
37
18
18
4
. Run
away
she
lters
for
teen
s 4
1236
4924
3134
1118
3334
1524
5. E
mer
genc
y fo
od s
ervi
ces/
soup
kitc
hens
3
9 34
54
8
35
36
21
9 30
38
24
12
6
. Job
trai
ning
3
526
6621
3928
1128
3027
1514
7. T
rans
port
atio
n
4 8
25
63
28
30
27
15
18
36
29
17
11
8. M
enta
l hea
lth/s
ubst
ance
abu
se s
ervi
ces
46
2664
1635
3316
4634
020
13 9
. Oth
er (
plea
se s
peci
fy)
____
____
____
____
____
____
____
____
___
10. O
ther
(pl
ease
spe
cify
)__
____
____
____
____
____
____
____
____
_

Human Services Needs Assessment • Provider and Citizen Survey Results • B-35
Th e
follo
win
g qu
estio
ns re
late
to h
ealth
serv
ices
in P
inel
las C
ount
y. Fo
r eac
h se
rvic
e pl
ease
pro
vide
you
r hon
est o
pini
on re
gard
ing:
1) t
he n
eed
for t
hese
serv
ices
by
circ
ling
a re
spon
se in
col
umn
A; 2
) the
acc
essib
ility
of t
hese
serv
ices
by
circ
ling
a re
spon
se in
col
umn
B; 3
) how
eff e
ctiv
e yo
u th
ink
thes
e se
rvic
es a
re in
mee
ting
the
heal
th n
eeds
of t
he P
inel
las C
ount
y re
siden
ts by
circ
ling
a re
spon
se in
col
umn
C. I
f you
do
not f
eel y
ou h
ave
enou
gh in
form
atio
n to
pro
vide
an
opin
ion
plea
se
circ
le D
K in
the
last
colu
mn
to in
dica
te “
Don
’t K
now.
”
A
B
C
Wha
t is
the
need
for
this
ser
vice
in
Pin
ella
s C
ount
y?
How
acc
essi
ble
is th
is s
ervi
ce in
P
inel
las
Cou
nty?
H
ow e
ffec
tive
is th
is s
ervi
ce in
P
inel
las
Cou
nty?
Citi
zen
Que
stio
ns r
elat
ed
to H
ealth
Ser
vice
sL
imit
edN
eed
Slig
htN
eed
Mod
erat
eN
eed
Gre
atN
eed
Not
Ver
ySo
mew
hat
Mod
erat
ely
Ver
y N
otV
ery
Som
ew
hat
Mod
erat
ely
Ver
y
Don
’t
Kno
w
11. P
rim
ary/
prev
entiv
e m
edic
al
care
33
2272
1830
3517
1827
3619
9
12. S
peci
alty
car
e
5 7
26
63
25
34
24
17
22
31
30
17
16
13. P
resc
ript
ions
4
317
7622
2926
2322
2728
239
14. E
mer
genc
y ca
re
4 8
31
57
11
21
38
30
12
23
36
29
11
15. I
n-pa
tient
hos
pita
l car
e
411
3153
1325
3825
1623
3724
1316
. Den
tal
5 4
20
71
38
25
21
16
35
24
25
16
10
17. V
isio
n (e
.g.,
eye
exam
s/
corr
ectiv
e le
nses
) 5
626
6231
2626
1727
2728
1712
18. I
nfec
tious
dis
ease
car
e (e
.g.,
HIV
/AID
S, H
epat
itis)
6
8 26
60
15
33
34
18
18
31
33
18
21
19. O
ther
(pl
ease
spe
cify
)__
____
____
____
____
____
____
__20
. Oth
er (
plea
se s
peci
fy)
____
____
____
____
____
____
____

B-36 • Louis de la Parte Florida Mental Health Institute • December 2004
Th e
follo
win
g qu
estio
ns c
once
rn se
rvic
es to
mee
t the
beh
avio
ral h
ealth
nee
ds P
inel
las C
ount
y re
siden
ts. F
or e
ach
serv
ice
plea
se p
rovi
de y
our h
ones
t opi
nion
re
gard
ing:
1) t
he n
eed
for t
hese
serv
ices
by
circ
ling
a re
spon
se in
col
umn
A; 2
) the
acc
essib
ility
of t
hese
serv
ices
by
circ
ling
a re
spon
se in
col
umn
B; 3
) how
eff e
ctiv
e yo
u th
ink
thes
e se
rvic
es a
re in
mee
ting
the
basic
nee
ds o
f Pin
ella
s Cou
nty
resid
ents
by c
irclin
g a
resp
onse
in c
olum
n C
. If y
ou d
o no
t fee
l you
hav
e en
ough
in
form
atio
n to
pro
vide
an
opin
ion
plea
se c
ircle
DK
in th
e la
st co
lum
n to
indi
cate
“D
on’t
Kno
w.”
A
B
C
Wha
t is
the
need
for
this
ser
vice
in
Pin
ella
s C
ount
y?
How
acc
essi
ble
is th
is s
ervi
ce in
P
inel
las
Cou
nty?
H
ow e
ffec
tive
is th
is s
ervi
ce in
P
inel
las
Cou
nty?
Citi
zen
Que
stio
ns r
elat
ed to
M
enta
l Hea
lth/S
ubst
ance
A
buse
Ser
vice
s L
imit
edN
eed
Slig
htN
eed
Mod
erat
eN
eed
Gre
atN
eed
Not
Ver
ySo
mew
hat
Mod
erat
ely
Ver
y N
otV
ery
Som
ewha
t M
oder
atel
y V
ery
Don
’t
Kno
w
21. O
ut-p
atie
nt m
enta
l hea
lth
Cou
nsel
ing
3 6
29
63
17
40
29
13
22
42
24
12
15
22. I
n-pa
tient
men
tal h
ealth
T
reat
men
t 4
931
5621
4226
1124
3827
1120
23. M
enta
l hea
lth c
risi
s ce
nter
s 5
5 28
62
23
38
27
12
26
35
26
13
19
24
. Pre
scri
ptio
ns f
or m
enta
l hea
lth
45
2665
2634
2912
2829
2914
1825
. Sub
stan
ce a
buse
det
oxif
icat
ion
Cen
ters
5
5 23
67
22
37
29
12
24
36
24
15
19
26. S
ubst
ance
abu
se d
ay tr
eatm
ent
Cen
ters
5
724
6427
3824
1126
3526
1322
27. S
obri
ety
mai
nten
ance
pro
gram
s 4
6 28
61
19
37
29
15
22
32
28
18
20
28
. Hou
sing
for
per
sons
with
men
tal
illne
ss a
nd s
ubst
ance
abu
se
clie
nts
45
2169
3534
1912
3528
2513
19
29. S
ubst
ance
abu
se r
esid
entia
l
tr
eatm
ent c
ente
rs
6 4
28
62
29
38
22
11
30
31
26
13
21
30. C
ase
man
agem
ent s
ervi
ces
39
2761
2238
2911
2238
2614
1931
. Job
/voc
atio
nal t
rain
ing
3 2
27
68
21
37
30
12
22
34
29
15
15
32. O
ther
(pl
ease
spe
cify
)__
____
____
____
____
____
____
____
33. O
ther
(pl
ease
spe
cify
)__
____
____
____
____
____
____
____
_

Human Services Needs Assessment • Provider and Citizen Survey Results • B-37
Th e
follo
win
g qu
estio
ns c
once
rn se
rvic
es to
mee
t the
bas
ic n
eeds
of P
inel
las C
ount
y re
siden
ts. F
or e
ach
serv
ice,
ple
ase
prov
ide
your
hon
est o
pini
on re
gard
ing:
1)
the
need
for t
hese
serv
ices
by
circ
ling
a re
spon
se in
col
umn
A; 2
) the
acc
essib
ility
of t
hese
serv
ices
by
circ
ling
a re
spon
se in
col
umn
B, 3
) how
eff e
ctiv
e yo
u th
ink
thes
e se
rvic
es a
re in
mee
ting
the
basic
nee
ds o
f Pin
ella
s Cou
nty
resid
ents
by c
irclin
g a
resp
onse
in c
olum
n C
. If y
ou d
o no
t fee
l you
hav
e en
ough
info
rmat
ion
to p
rovi
de a
n op
inio
n pl
ease
circ
le D
K in
the
last
colu
mn
to in
dica
te “
Don
’t K
now.
”
A
B
C
Wha
t is
the
need
for
this
ser
vice
in
Pin
ella
s C
ount
y?
How
acc
essi
ble
is th
is s
ervi
ce in
P
inel
las
Cou
nty?
H
ow e
ffec
tive
is th
is s
ervi
ce in
P
inel
las
Cou
nty?
Citi
zen
Que
stio
ns r
elat
ed to
B
asic
Nee
d S
ervi
ces
Lim
ited
Nee
dSl
ight
Nee
dM
oder
ate
Nee
dG
reat
Nee
dN
otV
ery
Som
ewha
t M
oder
atel
y V
ery
Not
Ver
ySo
mew
hat
Mod
erat
ely
Ver
y D
on’t
K
now
34. H
elp
with
ren
t/mor
tgag
e
4 6
25
65
38
36
18
9 32
39
18
11
10
35
. Hel
p w
ith u
tiliti
es
38
2464
3141
1711
2837
2114
1136
. Hel
p w
ith f
ood
3 7
33
58
15
30
36
18
18
27
33
21
9 37
. Hel
p w
ith c
loth
ing
410
4046
2032
3414
2033
3116
1138
. Hel
p w
ith tr
ansp
orta
tion
4 9
25
63
31
39
19
11
32
36
20
12
10
39. H
elp
with
aff
orda
ble
hous
ing
25
1876
3637
1710
2636
2414
1140
. Job
/voc
atio
nal t
rain
ing
2 5
31
62
26
45
20
9 37
36
16
11
13
41
. Tra
vele
rs A
id to
ret
urn
to
hom
e co
mm
unity
8
1731
4541
3616
862
240
1527
42. O
ther
(pl
ease
spe
cify
)__
____
____
____
____
____
____
____
_
43. O
ther
(pl
ease
spe
cify
)__
____
____
____
____
____
____
____
_

B-38 • Louis de la Parte Florida Mental Health Institute • December 2004
Th e
follo
win
g qu
estio
ns c
once
rn o
ther
serv
ices
to m
eet t
he n
eeds
of P
inel
las C
ount
y re
siden
ts. F
or e
ach
serv
ice,
ple
ase
prov
ide
your
hon
est o
pini
on re
gard
ing:
1)
the
need
for t
hese
serv
ices
by
circ
ling
a re
spon
se in
col
umn
A; 2
) the
acc
essib
ility
of t
hese
serv
ices
by
circ
ling
a re
spon
se in
col
umn
B; 3
) how
eff e
ctiv
e yo
u th
ink
thes
e se
rvic
es a
re in
mee
ting
the
basic
nee
ds o
f Pin
ella
s Cou
nty
resid
ents
by c
irclin
g a
resp
onse
in c
olum
n C
. If y
ou d
o no
t fee
l you
hav
e en
ough
info
rmat
ion
to p
rovi
de a
n op
inio
n pl
ease
circ
le D
K in
the
last
colu
mn
to in
dica
te “
Don
’t K
now.
”
A
B
C
Wha
t is
the
need
for
this
ser
vice
in
Pin
ella
s C
ount
y?
How
acc
essi
ble
is th
is s
ervi
ce in
P
inel
las
Cou
nty?
H
ow e
ffec
tive
is th
is s
ervi
ce in
P
inel
las
Cou
nty?
Citi
zen
Que
stio
ns r
elat
ed to
O
ther
Ser
vice
s L
imit
edN
eed
Slig
htN
eed
Mod
erat
eN
eed
Gre
atN
eed
Not
Ver
ySo
mew
hat
Mod
erat
ely
Ver
y N
otV
ery
Som
ewha
t M
oder
atel
y V
ery
Don
’t
Kno
w
44. H
ousi
ng f
or d
isab
led
pers
ons
3
9 31
57
23
39
27
11
25
25
28
12
20
45
. Tra
nspo
rtat
ion
25
3162
2435
2912
2733
2713
1446
. Chi
ld c
are
4 6
23
67
22
39
30
9 27
33
27
13
20
47
. Eld
er c
are
34
2272
3040
219
2336
2812
2248
. Ser
vice
s fo
r no
n-ci
tizen
s/ill
egal
al
iens
17
18
24
41
19
39
29
13
26
44
19
10
30
49. S
choo
l dro
p-ou
t pre
vent
ion
prog
ram
s
46
2466
2042
289
2637
2413
26
50. D
elin
quen
cy p
reve
ntio
n pr
ogra
ms
3 7
28
62
17
42
32
9 26
39
25
9
26
51. H
ome-
base
d se
rvic
es/r
espi
te
care
/per
sona
l car
e 4
732
5720
4226
1221
3732
1025
52. C
hore
ser
vice
s fo
r se
nior
s 4
5 34
56
28
21
34
17
23
37
28
12
25
53
. Oth
er (
plea
se s
peci
fy)
____
____
____
____
____
____
____
____
54. O
ther
(pl
ease
spe
cify
)__
____
____
____
____
____
____
____
__

Human Services Needs Assessment • Provider and Citizen Survey Results • B-39
Th e following questions involve services that you or your family might have used in the past year. Please circle the number to the right of each service to indicate whether you or your family used this service.
56. In the past year, were there any services you or your family needed but were not able to obtain?
33% No
67% Yes
56a. If yes, please indicate what these services were and why you could not obtain them.
57. If you or your family needed assistance with health, mental health or substance abuse, housing, or basic needs, do you know where to go for
help?
____ No
____ Yes
55. Have you or your family used any of the following services in the past year?
No Yes
a. Private physician services 31 69 b. Walk-in clinic services 59 41c. Emergency room services 39 61 d. Mental health services 66 34e. Substance abuse services 80 20 f. Dental services 40 60g. Vision services 46 54 h. Prescription drug services 25 75i. Transportation services 66 34 j. Employment-related services 74 26k. Housing or shelter assistance services 70 30 l. Food or clothing assistance services 62 38m. Rent or utility assistance services 76 24 n. Respite care services 100 0
58. How would you rate your familiarity with the services available in Pinellas County related to
Not at all familiar
SomewhatFamiliar
Moderatelyfamiliar
Veryfamiliar
a. Homelessness services 25 34 19 21 b. Health-related services 17 28 27 27c. Mental health/substance abuse services 28 27 22 23 d. Basic need services (e.g., shelter, food, clothing assistance) 22 29 22 26

B-40 • Louis de la Parte Florida Mental Health Institute • December 2004
Now we want to ask you a few questions about yourself.
59. Is your family covered by your health insurance?
35% No
59% Yes
6% Not applicable
60. Which of the following best describe your health insurance coverage:
35% No health insurance
27% Health insurance through work
10% Health insurance through spouse or family member
8% Medicaid
9% Medicare
3% Veterans Administration
7% Other source (please specify) _________________________________________
61. Gender: 59% Male
41% Female
62. Age: 5% under 25
18% 25 to 35
26% 36 to 45
26% 46 to 55
13% 56 to 65
13% Over 65
63. Race: 1% Asian Pacifi c Islander
12% Black/African American
69% Caucasian
4% Native American
5% No primary affi liation/mixed race
2% Another race (please specify) ________________________________
64. Are you of Spanish or Hispanic decent? 92% No
8% Yes
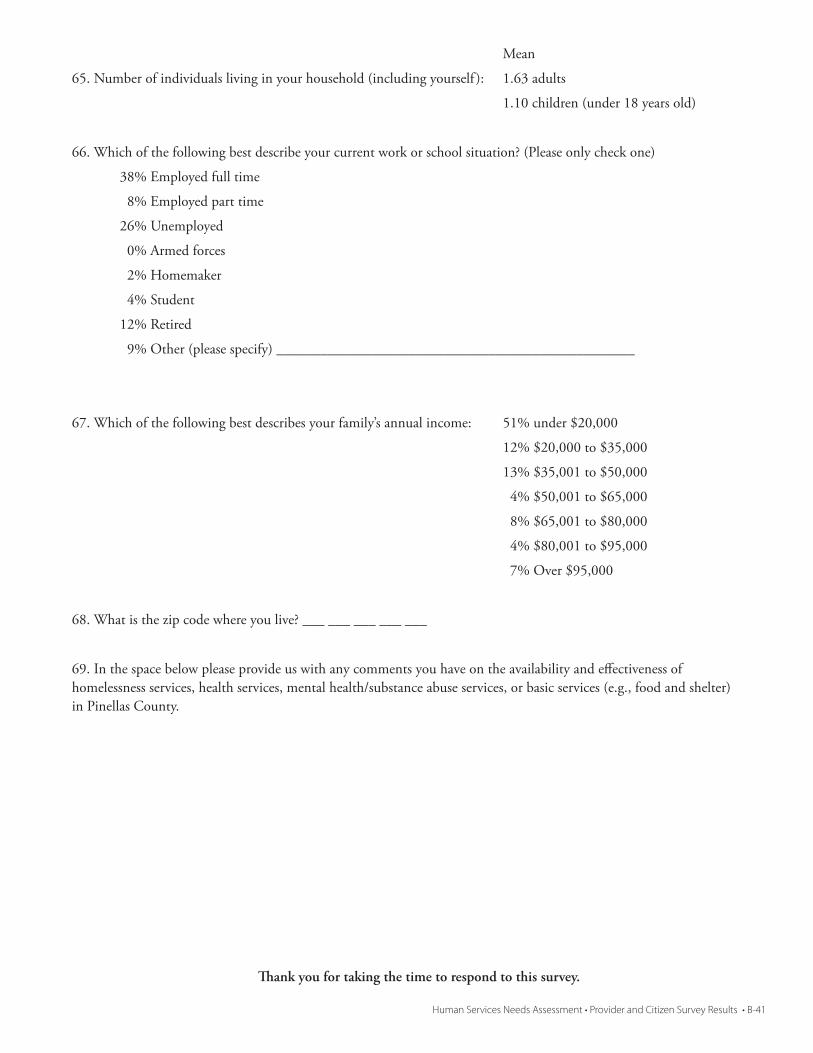
Human Services Needs Assessment • Provider and Citizen Survey Results • B-41
Mean
65. Number of individuals living in your household (including yourself ): 1.63 adults
1.10 children (under 18 years old)
66. Which of the following best describe your current work or school situation? (Please only check one)
38% Employed full time
8% Employed part time
26% Unemployed
0% Armed forces
2% Homemaker
4% Student
12% Retired
9% Other (please specify) _________________________________________________
67. Which of the following best describes your family’s annual income: 51% under $20,000
12% $20,000 to $35,000
13% $35,001 to $50,000
4% $50,001 to $65,000
8% $65,001 to $80,000
4% $80,001 to $95,000
7% Over $95,000
68. What is the zip code where you live? ___ ___ ___ ___ ___
69. In the space below please provide us with any comments you have on the availability and eff ectiveness of homelessness services, health services, mental health/substance abuse services, or basic services (e.g., food and shelter) in Pinellas County.
Th ank you for taking the time to respond to this survey.

C-42 • Louis de la Parte Florida Mental Health Institute • December 2004
Appendix C
Provider and Citizen Survey Letters and Postcard Text

Human Services Needs Assessment • Provider and Citizen Survey Results • C-43
Initial Postcard text (Citizen)
Pinellas County Government is engaged in a study to determine how to improve human services in the county. As a part of this project, the University of South Florida is conducting a needs assessment of for the County. Th e assessment is designed to obtain information from Pinellas County residents in four service domains: homelessness, health services, mental health/substance abuse services, and basic services (e.g. food, shelter).
Within a few days you will receive a survey seeking your input regarding the availability of certain human services in the County and the extent to which you think there is a need for these services.
We would greatly appreciate it if you would take a few minutes to complete and return this important survey. If you do, we will pay you $8.00. If you have any questions about this survey or would like to complete it by telephone, you can call us toll-free at 1-888-263-6899. Th ank you in advance for your help.
Follow-up Postcard text (Citizen)
We are writing to see if you received and completed the Pinellas County Needs Assessment survey that was sent to you approximately one week ago. If you have already completed and returned the survey, we thank you. If you have not yet had an opportunity to complete it we hope that you will take a few minutes to complete and return the survey. If you do, we will pay you $8.00.
Th is project can only succeed with your help and cooperation. Th e survey is designed to obtain your input regarding the availability of certain services in the County and the extent to which you think there is a need for these services. If you have any questions about this survey or would like to complete it by telephone, you can call us toll-free at 1-888-263-6899. Again, thank you in advance for your help.

C-44 • Louis de la Parte Florida Mental Health Institute • December 2004
August 12, 2004
Dear County Resident:
Pinellas County Government is engaged in a study to determine if a human services planning council would be of benefi t to the county as a whole. A number of communities in the nation use some form of human services planning councils to promote community wide need assessment and priority setting for human services as well as fostering coordinated service delivery approaches.
As a part of this project, the University of South Florida (USF) is conducting a needs assessment on behalf of Pinellas County. Th e assessment is designed to obtain information in four service domains (homelessness, health services, mental health/substance abuse services, and basic services (e.g. food, shelter, etc.) across the primary geographic areas -north, south, and mid county.
You have been chosen from a select group of county residents to participate in this survey. As a community member, we value your opinions regarding service needs, the availability and extent of need for these services in Pinellas County.
Participation is completely voluntary and your responses are strictly confi dential. If you decide to participate you will be paid $8.00 for your time. Th is is your opportunity to comment on the service delivery system in Pinellas County and help identify gaps in existing service capacity. We hope that you will agree to join us in planning for the future. If you have any questions about this survey or would like to complete it by telephone, you can call USF toll-free at 1-888-263-6899. Someone will be available to talk with you Monday through Friday.
We appreciate your participation in this phase of the project. Th ank you in advance for your help.
Cordially,

Human Services Needs Assessment • Provider and Citizen Survey Results • C-45
August 12, 2004
Dear Executive Director/Chief Administrator:
Pinellas County Government is engaged in a study to determine if a human services planning council would be of benefi t to the county as a whole. A number of communities in the nation use some form of human services planning councils to promote community wide need assessment and priority setting for human services as well as fostering coordinated service delivery approaches.
As a part of this project, the University of South Florida (USF) is conducting a needs assessment on behalf of Pinellas County. Th e assessment is designed to obtain information in four service domains (homelessness, health services, mental health/substance abuse services, and basic services (e.g. food, shelter, etc.) across the primary geographic areas -north, south, and mid county.
You have been chosen from a select group of providers to participate in this survey. As a community leader, we value your opinions regarding service needs, the availability and extent of need for these services in Pinellas County, and the eff ectiveness and funding of the service delivery system.
Participation is completely voluntary and your responses are strictly confi dential. Th is is your opportunity to comment on the service delivery system in Pinellas County and help identify gaps in existing service capacity. We hope that you will agree to join us in planning for the future. If you have any questions about this survey or would like to complete it by telephone, you can call USF toll-free at 1-888-263-6899. Someone will be available to talk with you Monday through Friday.
We appreciate your participation in this phase of the project and we will keep you informed as the status of the project in the future. Th ank you for your help.
Cordially,

Louis de la Parte Florida Mental Health InstituteUniversity of South Florida
13301 Bruce B. Downs Blvd.Tampa, Florida 33612