humans infected with ebola virus. genome biology , [4 ...in the ebola treatment centre (etc). for...
TRANSCRIPT
Liu, X., Matthews, D., Connor, J. H., Carroll, M. W., & Hiscox, J. A. (2017).Transcriptomic signatures differentiate survival from fatal outcomes inhumans infected with Ebola virus. Genome Biology, 18, [4].https://doi.org/10.1186/s13059-016-1137-3
Publisher's PDF, also known as Version of record
License (if available):CC BY
Link to published version (if available):10.1186/s13059-016-1137-3
Link to publication record in Explore Bristol ResearchPDF-document
This is the final published version of the article (version of record). It first appeared online via BioMed Central athttp://doi.org/10.1186/s13059-016-1137-3. Please refer to any applicable terms of use of the publisher.
University of Bristol - Explore Bristol ResearchGeneral rights
This document is made available in accordance with publisher policies. Please cite only the publishedversion using the reference above. Full terms of use are available:http://www.bristol.ac.uk/pure/about/ebr-terms

RESEARCH Open Access
Transcriptomic signatures differentiatesurvival from fatal outcomes in humansinfected with Ebola virusXuan Liu1,2†, Emily Speranza3†, César Muñoz-Fontela4,5,6, Sam Haldenby2, Natasha Y. Rickett1,7,Isabel Garcia-Dorival7, Yongxiang Fang2, Yper Hall8, Elsa-Gayle Zekeng1,7, Anja Lüdtke4,5, Dong Xia7, Romy Kerber5,Ralf Krumkamp5, Sophie Duraffour5, Daouda Sissoko9, John Kenny2, Nichola Rockliffe2, E. Diane Williamson10,Thomas R. Laws10, Magassouba N’Faly11, David A. Matthews12, Stephan Günther5,6, Andrew R. Cossins2,Armand Sprecher14, John H. Connor3*, Miles W. Carroll8,13* and Julian A. Hiscox1,7*
Abstract
Background: In 2014, Western Africa experienced an unanticipated explosion of Ebola virus infections. Whatdistinguishes fatal from non-fatal outcomes remains largely unknown, yet is key to optimising personalisedtreatment strategies. We used transcriptome data for peripheral blood taken from infected and convalescentrecovering patients to identify early stage host factors that are associated with acute illness and those thatdifferentiate patient survival from fatality.
Results: The data demonstrate that individuals who succumbed to the disease show stronger upregulation ofinterferon signalling and acute phase responses compared to survivors during the acute phase of infection.Particularly notable is the strong upregulation of albumin and fibrinogen genes, which suggest significant liverpathology. Cell subtype prediction using messenger RNA expression patterns indicated that NK-cell populationsincrease in patients who survive infection. By selecting genes whose expression properties discriminated between fatalcases and survivors, we identify a small panel of responding genes that act as strong predictors of patient outcome,independent of viral load.
Conclusions: Transcriptomic analysis of the host response to pathogen infection using blood samples takenduring an outbreak situation can provide multiple levels of information on both disease state and mechanisms ofpathogenesis. Host biomarkers were identified that provide high predictive value under conditions where otherpredictors, such as viral load, are poor prognostic indicators. The data suggested that rapid analysis of the hostresponse to infection in an outbreak situation can provide valuable information to guide an understanding ofdisease outcome and mechanisms of disease.
* Correspondence: [email protected]; [email protected];[email protected]†Equal contributors3Department of Microbiology, School of Medicine, National Emerging andInfectious Diseases Laboratories, Bioinformatics Program, Boston University,Boston, MA 02118, USA8Public Health England, Porton Down, Wiltshire SP4 0JG, UK7Institute of Infection and Global Health, University of Liverpool, LiverpoolL69 7BE, UKFull list of author information is available at the end of the article
© The Author(s). 2017 Open Access This article is distributed under the terms of the Creative Commons Attribution 4.0International License (http://creativecommons.org/licenses/by/4.0/), which permits unrestricted use, distribution, andreproduction in any medium, provided you give appropriate credit to the original author(s) and the source, provide a link tothe Creative Commons license, and indicate if changes were made. The Creative Commons Public Domain Dedication waiver(http://creativecommons.org/publicdomain/zero/1.0/) applies to the data made available in this article, unless otherwise stated.
Liu et al. Genome Biology (2017) 18:4 DOI 10.1186/s13059-016-1137-3

BackgroundEbola virus (EBOV) causes a devastating infectionknown as Ebola virus disease (EVD) that in many pa-tients leads to a fatal outcome. The virus responsible forthe 2013-2016 West African outbreak was caused by anew strain of EBOV called Makona. In the Republic ofGuinea, which was at the epicentre of the 2013-2016EBOV outbreak, the fatality rate was around 60% andhigher than in Sierra Leone and Liberia. The processesthat lead either to survival or a fatal infection are un-known although viral load (the amount of virus) can bea key determinant [1, 2]. This is especially relevant at ex-tremes where patients with very high viral loads have apoor prognosis. Factors influencing outcome in patientswith EVD include hospitalisation (i.e. access to palliativecare) [3], anti-viral treatment [4] and age [5].The interplay between EVD and outcome is complex
and involves a balance between the host response andviral load. Analysis of four patients from the 2013-2016EBOV outbreak who underwent intensive treatment andcare at Emory University Hospital in the USA indicatedthese patients had a robust immune response during theacute phase of EBOV infection [6], which challengedprevious assumptions about the ability of EBOV to sup-press the immune system [6]. Certainly in non-humanprimate models of fatal EBOV infection, an extremeaberrant immunological status and anti-inflammatoryresponse was shown to contribute to the development offatal haemorrhagic fever [7] and this has also beenobserved together with lymphocyte apoptosis in fatalhuman infections with EBOV [8]. Analysis of samplesfrom patients with EVD treated in Guinea from the2013-2016 outbreak also revealed an immune compo-nent influenced survival [6, 9].The study of patient samples taken from previous out-
breaks suggests that host responses may delineate sur-vival and fatal outcomes and potential biomarkersindicative of these outcomes can be identified. In the2000–2001 Sudan-associated EVD outbreak in Uganda,the case fatality rate for paediatric patients was lowerthan for adults [10]. Data indicated that paediatric pa-tients who survived had differential abundance of certainserum proteins from paediatric patients who died andthat, in contrast, adults had similar levels of these samemolecules [11]. Whereas fatality rates in the 2013-2016West African outbreak suggested that children aged lessthan five years had a poorer prognosis [5].Apart from providing data on the underlying causes of
EVD, being able to predict the outcome of infectionbased on analyte concentrations would provide guidanceas to potential treatment and would also uncover newtherapeutic strategies [11, 12]. Several such immuno-logical/biochemical biomarkers have been identified in aprevious outbreak of EBOV-Sudan [11, 12]. However,
currently, viral load measurements by real-time quanti-tative polymerase chain reaction (qRT-PCR) (given as aCt value) are considered the gold standard for predictingEVD outcome. Viral load measured as Ct can give someindication for outcome [1, 13], and has been particularlyuseful in the triage of patients for experimental anti-viraltrials for EBOV [14]. Viral load for predicting outcomeworks well, particularly at extremes of Ct, where for ex-ample a Ct of 12 would be suggestive of a fatal infectionand a Ct value of 30 would be indicative of survival.However, it works less well where Ct values are not ableto distinguish outcome, mainly between Ct 20 and Ct22. Here the outcome is approximately equal betweensurvival and a fatal infection.The 2013-2016 EVD outbreak was unprecedented in
scale and has revealed previously unappreciated aspectsof EBOV biology, such as persistence in semen [15]. Thestrain responsible for this outbreak, EBOV Makona, alsoappears to have different growth kinetics when com-pared to previous strains, having a delayed onset to dis-ease progression in a non-human primate model of EVD[16] and reduced lethality in an immune-deficient mousemodel [17]. Given the potential new strain variation ofEBOV responsible for this outbreak and EVD is a diseaseof the host response, we wanted to investigate this usinga genomics approach to identify transcriptome changesin peripheral blood from acute patients who either wenton to survive or die from EVD. This would allow us toinvestigate whether those patients that succumbed toEBOV showed a hyperactive response to infection andalso potentially to identify host-based response markersthat can help predict survival in situations where viralload gives little predictive value.Therefore, to characterise the infection of EBOV
Makona in the human population, we first used deepsequencing to define the transcriptomic profile of bloodtaken from acute patients who either went on to sur-vive or die from EVD. These samples were obtainedfrom patients located in Guinea. During the 2013-2016 out-break, Guinea recorded the highest death rate for EBOV.Thus, EVD patients in Guinea were optimal for correlatingchanges in the host response to outcome—either a fatal ornon-fatal infection. Their responses to EVD would nothave been influenced by intensive palliative and/or ex-perimental care that was utilised in high-income coun-tries to treat repatriated healthcare workers, where81.5% of patients who received supportive care survived[3]. In contrast, the survival rate in Guinea was ap-proximately 40% throughout the outbreak. These tran-scriptional signatures from acutely ill patients werecompared to profiles obtained from former patientswho had recovered from EVD and were EBOV-negativeby qRT-PCR and also to data obtained from healthyvolunteers mined from historical datasets.
Liu et al. Genome Biology (2017) 18:4 Page 2 of 17
Using transcriptome data from acutely infected pa-tients and from the control patients, profiles were identi-fied that highlighted differences in the host response toEBOV at the time of acute infection. These data wereobtained for patients who were either going to surviveor die from EVD. The profiles of acutely infected indi-viduals differed from the survivor EBOV-negative groupand the healthy controls. The profiles provide significantinsight into the global circulating immune response toEBOV in acutely infected patients on a scale that haspreviously not been possible. Significantly, differences inimmune cell populations predicted through analysis ofgene expression patterns were validated on an independ-ent group of EVD patients using flow cytometry to dir-ectly measure the same cell types in patient blood.Machine learning was used to identify a panel of geneswhose abundance could be used to predict the outcomeof infection at the acute phase. This panel was validatedon a separate independent group of patients with eithera fatal or non-fatal outcome and whose viral loads weresimilar and was found to accurately predict outcome. Thiswould be particularly useful in a clinical setting in caseswhere the viral load provides little to no predictive power.
ResultsAnalysing patient groups with EVDTo identify changes in the host response following ex-posure to EBOV, the transcriptome of blood samplesfrom infected patients was analysed. These samples werecollected by the European Mobile Laboratory in Guineaduring 2014 and 2015. The samples were taken with theforemost aim of diagnosing the presence of EBOV usingqRT-PCR, which was then used in patient managementin the Ebola Treatment Centre (ETC). For this purpose,RNA was extracted in the setting of the European
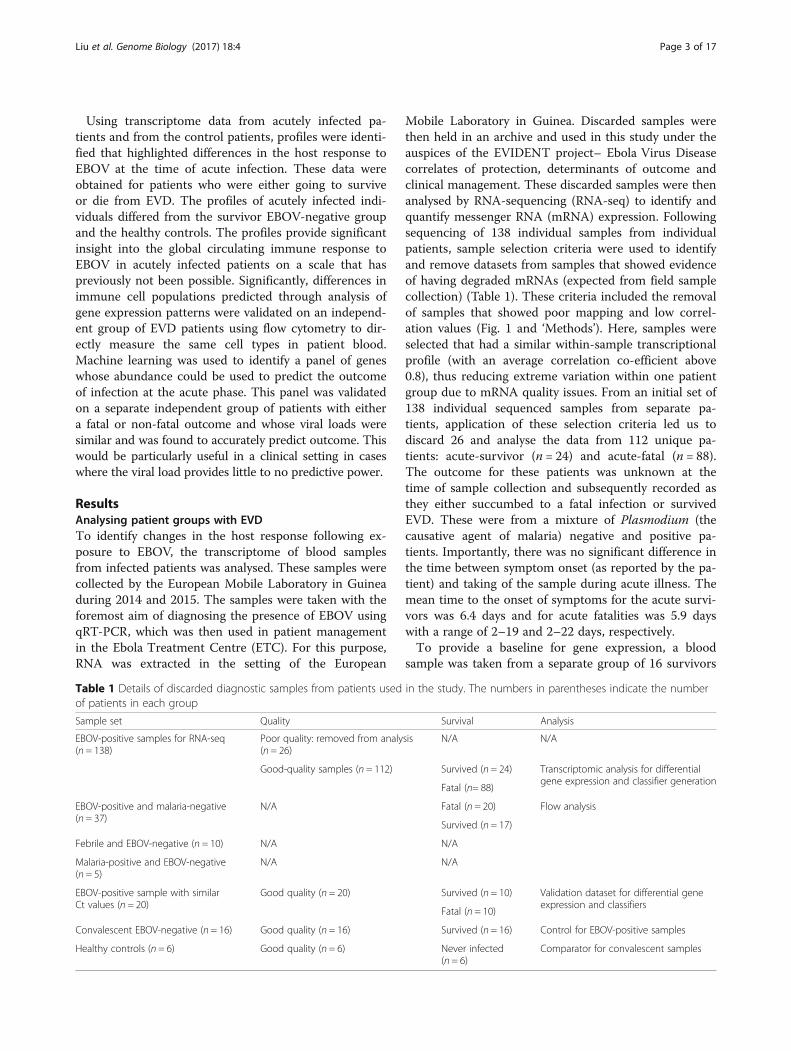
Mobile Laboratory in Guinea. Discarded samples werethen held in an archive and used in this study under theauspices of the EVIDENT project– Ebola Virus Diseasecorrelates of protection, determinants of outcome andclinical management. These discarded samples were thenanalysed by RNA-sequencing (RNA-seq) to identify andquantify messenger RNA (mRNA) expression. Followingsequencing of 138 individual samples from individualpatients, sample selection criteria were used to identifyand remove datasets from samples that showed evidenceof having degraded mRNAs (expected from field samplecollection) (Table 1). These criteria included the removalof samples that showed poor mapping and low correl-ation values (Fig. 1 and ‘Methods’). Here, samples wereselected that had a similar within-sample transcriptionalprofile (with an average correlation co-efficient above0.8), thus reducing extreme variation within one patientgroup due to mRNA quality issues. From an initial set of138 individual sequenced samples from separate pa-tients, application of these selection criteria led us todiscard 26 and analyse the data from 112 unique pa-tients: acute-survivor (n = 24) and acute-fatal (n = 88).The outcome for these patients was unknown at thetime of sample collection and subsequently recorded asthey either succumbed to a fatal infection or survivedEVD. These were from a mixture of Plasmodium (thecausative agent of malaria) negative and positive pa-tients. Importantly, there was no significant difference inthe time between symptom onset (as reported by the pa-tient) and taking of the sample during acute illness. Themean time to the onset of symptoms for the acute survi-vors was 6.4 days and for acute fatalities was 5.9 dayswith a range of 2–19 and 2–22 days, respectively.To provide a baseline for gene expression, a blood
sample was taken from a separate group of 16 survivors
Table 1 Details of discarded diagnostic samples from patients used in the study. The numbers in parentheses indicate the numberof patients in each group
Sample set Quality Survival Analysis
EBOV-positive samples for RNA-seq(n = 138)
Poor quality: removed from analysis(n = 26)
N/A N/A
Good-quality samples (n = 112) Survived (n = 24) Transcriptomic analysis for differentialgene expression and classifier generation
Fatal (n= 88)
EBOV-positive and malaria-negative(n = 37)
N/A Fatal (n = 20) Flow analysis
Survived (n = 17)
Febrile and EBOV-negative (n = 10) N/A N/A
Malaria-positive and EBOV-negative(n = 5)
N/A N/A
EBOV-positive sample with similarCt values (n = 20)
Good quality (n = 20) Survived (n = 10) Validation dataset for differential geneexpression and classifiers
Fatal (n = 10)
Convalescent EBOV-negative (n = 16) Good quality (n = 16) Survived (n = 16) Control for EBOV-positive samples
Healthy controls (n = 6) Good quality (n = 6) Never infected(n = 6)
Comparator for convalescent samples
Liu et al. Genome Biology (2017) 18:4 Page 3 of 17

that were EBOV-negative by PCR and convalescent forthe disease and recovered from infection (recovered con-trol group) (Table 1). This control group represented acritical comparison population. During the 2013-2016outbreak, amid the breakdown of the in-country health-care system and the stigma of being seen associated withETCs, acquiring samples from non-infected patients wasnot possible. The EBOV survivors represented a knownEBOV-negative population that were also tested andconfirmed to be Plasmodium-negative with no otherovert signs of a febrile illness (which could have im-pacted the results in a control group). We also made useof historical datasets obtained from the RNA-seq ana-lysis of peripheral blood taken from healthy volunteersbased in British Columbia (Canada) (n = 6) and thuswould not have been exposed to EBOV or a range ofother pathogens present in West Africa [18] (GEONumber GSE53655) (Table 1).
Analysis of gene responses of patients that differentiatefate after EBOV infectionWe compared the transcriptomes from these differentgroups to identify mRNAs in survivors and in fatal casesthat showed greater than twofold changes (false discov-ery rate (FDR) 5%) in abundance compared to the recov-ered control group. In the acute-survivor group, almost1300 genes were increased in transcript abundance com-pared to the survivor control group. The correspondingvalue for the acute-fatal group was 2200 of which halfwere redundant with those in the acute-survivor group
and approximately 1200 were unique to the fatal cases(Fig. 2a and Additional file 1). Additional file 1 showsany gene transcript with an absolute log2 fold changegreater than 2 with a FDR of 5%. Most of the gene tran-scripts were common to both the acute-fatal versusacute-survivor group. Additionally, some gene tran-scripts that had abundance differences were restrictedto the acute-survivor group. Thus, in the blood fromindividuals with acute EBOV infection, mRNAs of vari-ous pro-inflammatory factors such as CXCL10, CCL2/MCP-1, CCL8/MCP2 and CXCL11 showed increasedabundance when acute-fatal cases were compared toacute-survivors (Additional file 2). Similar changes inmRNA abundance were observed in a publicly availabledataset from non-human primates (NHPs) that sur-vived the challenge with EBOV (Additional file 2).
Analysis of gene pathways differentiating fate afterEBOV infectionGene set enrichment analysis (GSEA) showed that inacute patients both surviving and having a fatal infectionwere associated with a significant enrichment of genesfrom within the same signalling pathways (Fig. 2b). Themost significantly represented included gene sets associ-ated with interferon signalling, complement, coagulation,hormone receptor and acute phase signalling. Manyinterferon-stimulated genes (ISGs) were strongly in-creased in abundance in all acute infection cases com-pared to the recovered control group. There was greater
A B
Fig. 1 The sample selection criteria based on correlation value to within group expression. A mean correlation within the acute fatal (a) andacute survivors (b) was used to determine samples with evidence of unreliable sequencing. A cut-off value of 0.8 was used (dashed line) andsamples that fell below this within-group mean correlation were removed from analysis. This led to selection of 88 acute fatal samples and 24acute survivors
Liu et al. Genome Biology (2017) 18:4 Page 4 of 17
increased in abundance of these gene transcripts inacute-fatal compared to acute-survivors.In addition to GSEA, we also analysed the patterns of
differentially expressed genes using Ingenuity PathwayAnalysis (IPA) (Qiagen Bioinformatics) to identify signal-ling pathways associated with infection. Pathways show-ing significant upregulation in acute infection are shownin Fig. 2c. This analysis identified many of the samepathways identified in GSEA such as complement, acutephase signalling and coagulation factors, but also identi-fied signalling pathways not identified by GSEA, such asIL-6 and IL-8, indicating strong activation of these cyto-kines in EVD. IL-6 signalling has previously been shownto be associated with fatal EBOV infections in somestudies [8, 19] but not others [11]. Our data support theconclusion that IL-6 signalling was upregulated in boththe acute-survivor and acute-fatal cases. Spider plot
analysis (Fig. 2d) showed that in almost all gene expres-sion categories, acute patients that succumbed to infec-tion showed a more robust immune response.There were also distinctive differences in gene
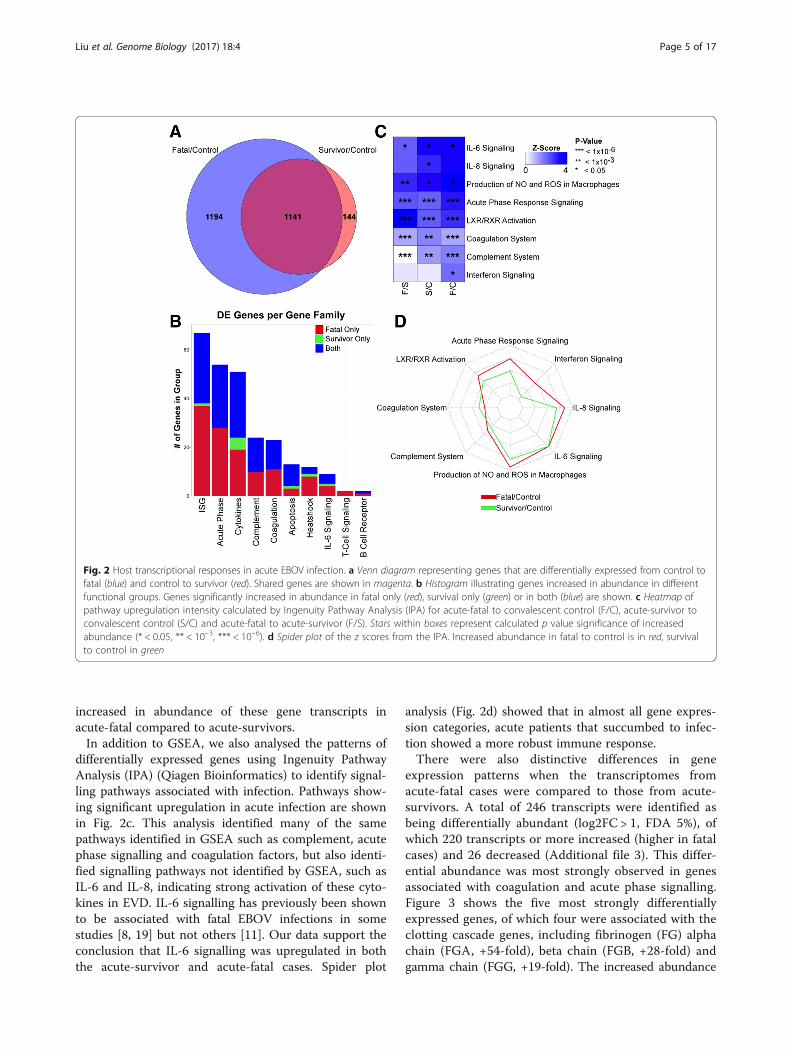
expression patterns when the transcriptomes fromacute-fatal cases were compared to those from acute-survivors. A total of 246 transcripts were identified asbeing differentially abundant (log2FC > 1, FDA 5%), ofwhich 220 transcripts or more increased (higher in fatalcases) and 26 decreased (Additional file 3). This differ-ential abundance was most strongly observed in genesassociated with coagulation and acute phase signalling.Figure 3 shows the five most strongly differentiallyexpressed genes, of which four were associated with theclotting cascade genes, including fibrinogen (FG) alphachain (FGA, +54-fold), beta chain (FGB, +28-fold) andgamma chain (FGG, +19-fold). The increased abundance
Fig. 2 Host transcriptional responses in acute EBOV infection. a Venn diagram representing genes that are differentially expressed from control tofatal (blue) and control to survivor (red). Shared genes are shown in magenta. b Histogram illustrating genes increased in abundance in differentfunctional groups. Genes significantly increased in abundance in fatal only (red), survival only (green) or in both (blue) are shown. c Heatmap ofpathway upregulation intensity calculated by Ingenuity Pathway Analysis (IPA) for acute-fatal to convalescent control (F/C), acute-survivor toconvalescent control (S/C) and acute-fatal to acute-survivor (F/S). Stars within boxes represent calculated p value significance of increasedabundance (* < 0.05, ** < 10–3, *** < 10–6). d Spider plot of the z scores from the IPA. Increased abundance in fatal to control is in red, survivalto control in green
Liu et al. Genome Biology (2017) 18:4 Page 5 of 17
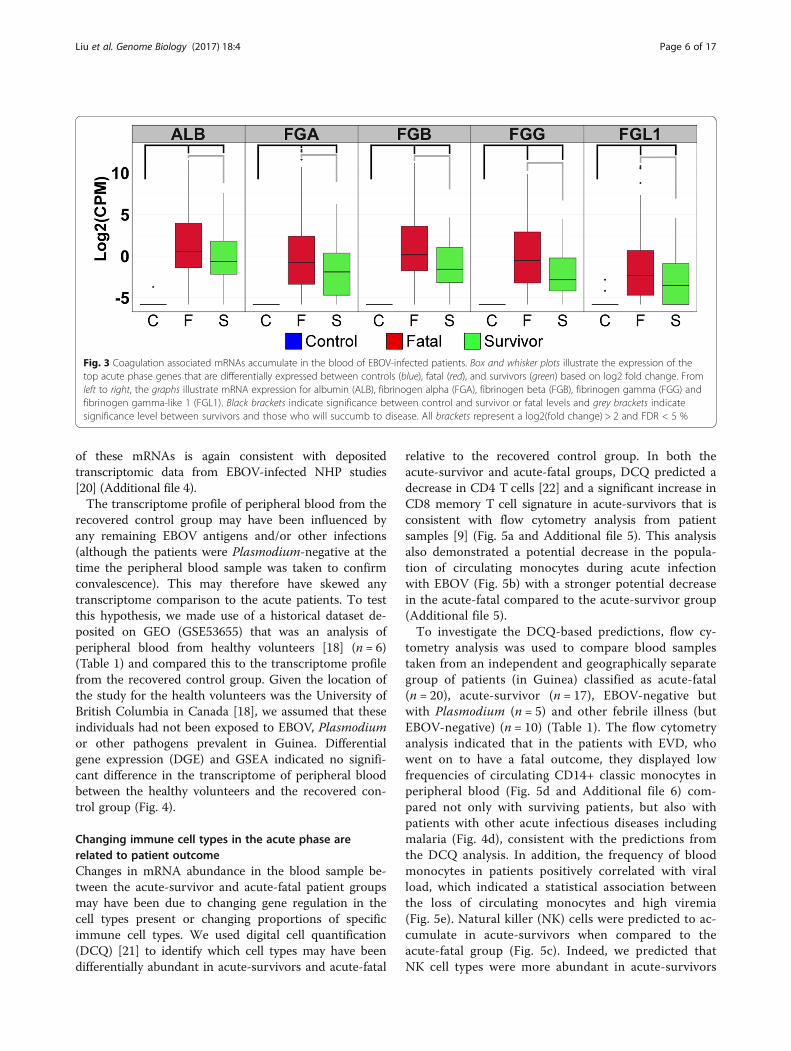
of these mRNAs is again consistent with depositedtranscriptomic data from EBOV-infected NHP studies[20] (Additional file 4).The transcriptome profile of peripheral blood from the
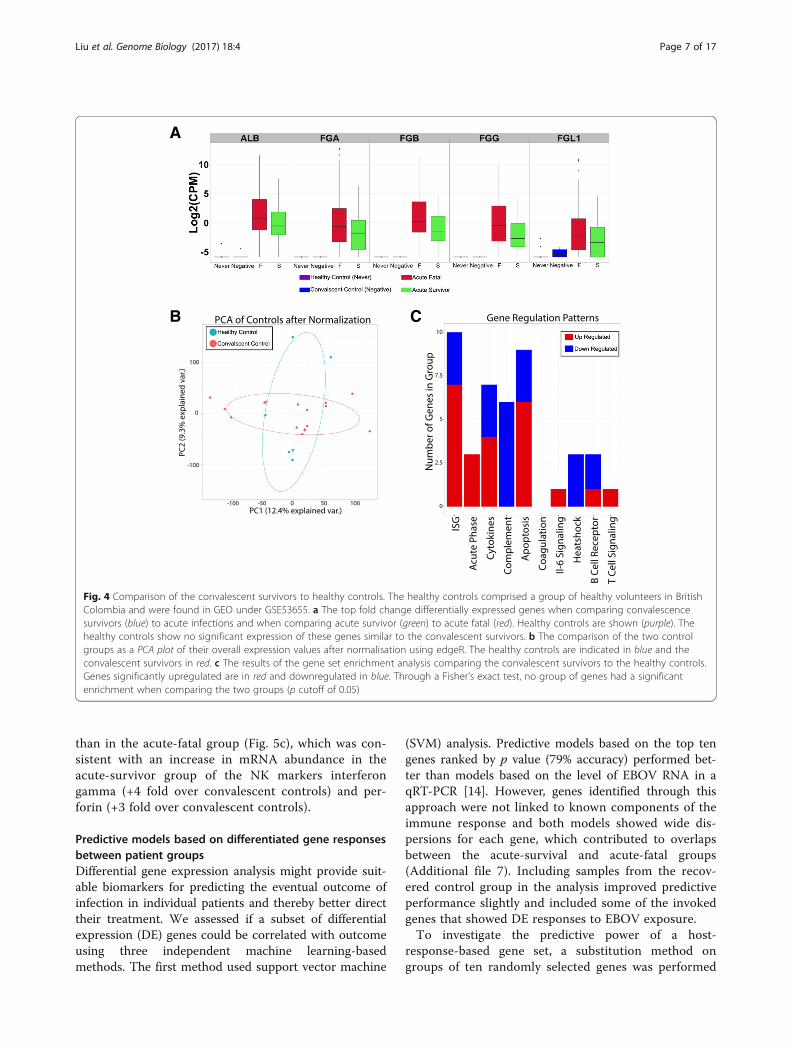
recovered control group may have been influenced byany remaining EBOV antigens and/or other infections(although the patients were Plasmodium-negative at thetime the peripheral blood sample was taken to confirmconvalescence). This may therefore have skewed anytranscriptome comparison to the acute patients. To testthis hypothesis, we made use of a historical dataset de-posited on GEO (GSE53655) that was an analysis ofperipheral blood from healthy volunteers [18] (n = 6)(Table 1) and compared this to the transcriptome profilefrom the recovered control group. Given the location ofthe study for the health volunteers was the University ofBritish Columbia in Canada [18], we assumed that theseindividuals had not been exposed to EBOV, Plasmodiumor other pathogens prevalent in Guinea. Differentialgene expression (DGE) and GSEA indicated no signifi-cant difference in the transcriptome of peripheral bloodbetween the healthy volunteers and the recovered con-trol group (Fig. 4).
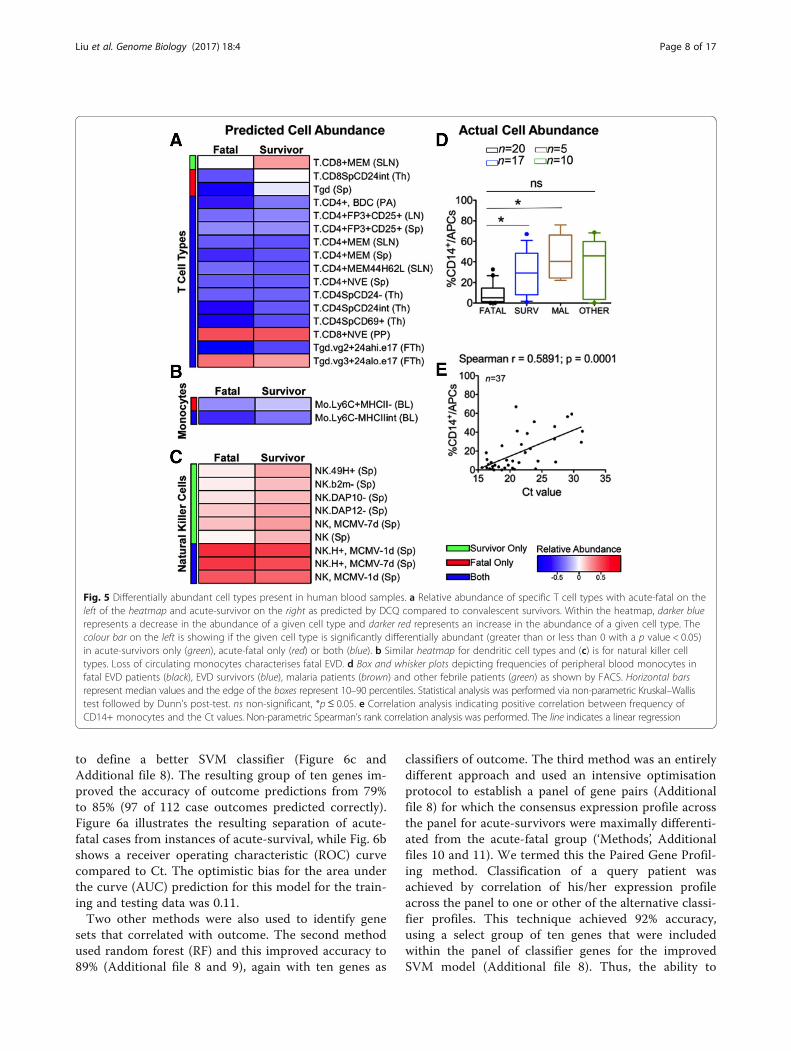
Changing immune cell types in the acute phase arerelated to patient outcomeChanges in mRNA abundance in the blood sample be-tween the acute-survivor and acute-fatal patient groupsmay have been due to changing gene regulation in thecell types present or changing proportions of specificimmune cell types. We used digital cell quantification(DCQ) [21] to identify which cell types may have beendifferentially abundant in acute-survivors and acute-fatal
relative to the recovered control group. In both theacute-survivor and acute-fatal groups, DCQ predicted adecrease in CD4 T cells [22] and a significant increase inCD8 memory T cell signature in acute-survivors that isconsistent with flow cytometry analysis from patientsamples [9] (Fig. 5a and Additional file 5). This analysisalso demonstrated a potential decrease in the popula-tion of circulating monocytes during acute infectionwith EBOV (Fig. 5b) with a stronger potential decreasein the acute-fatal compared to the acute-survivor group(Additional file 5).To investigate the DCQ-based predictions, flow cy-
tometry analysis was used to compare blood samplestaken from an independent and geographically separategroup of patients (in Guinea) classified as acute-fatal(n = 20), acute-survivor (n = 17), EBOV-negative butwith Plasmodium (n = 5) and other febrile illness (butEBOV-negative) (n = 10) (Table 1). The flow cytometryanalysis indicated that in the patients with EVD, whowent on to have a fatal outcome, they displayed lowfrequencies of circulating CD14+ classic monocytes inperipheral blood (Fig. 5d and Additional file 6) com-pared not only with surviving patients, but also withpatients with other acute infectious diseases includingmalaria (Fig. 4d), consistent with the predictions fromthe DCQ analysis. In addition, the frequency of bloodmonocytes in patients positively correlated with viralload, which indicated a statistical association betweenthe loss of circulating monocytes and high viremia(Fig. 5e). Natural killer (NK) cells were predicted to ac-cumulate in acute-survivors when compared to theacute-fatal group (Fig. 5c). Indeed, we predicted thatNK cell types were more abundant in acute-survivors
Fig. 3 Coagulation associated mRNAs accumulate in the blood of EBOV-infected patients. Box and whisker plots illustrate the expression of thetop acute phase genes that are differentially expressed between controls (blue), fatal (red), and survivors (green) based on log2 fold change. Fromleft to right, the graphs illustrate mRNA expression for albumin (ALB), fibrinogen alpha (FGA), fibrinogen beta (FGB), fibrinogen gamma (FGG) andfibrinogen gamma-like 1 (FGL1). Black brackets indicate significance between control and survivor or fatal levels and grey brackets indicatesignificance level between survivors and those who will succumb to disease. All brackets represent a log2(fold change) > 2 and FDR < 5 %
Liu et al. Genome Biology (2017) 18:4 Page 6 of 17
than in the acute-fatal group (Fig. 5c), which was con-sistent with an increase in mRNA abundance in theacute-survivor group of the NK markers interferongamma (+4 fold over convalescent controls) and per-forin (+3 fold over convalescent controls).
Predictive models based on differentiated gene responsesbetween patient groupsDifferential gene expression analysis might provide suit-able biomarkers for predicting the eventual outcome ofinfection in individual patients and thereby better directtheir treatment. We assessed if a subset of differentialexpression (DE) genes could be correlated with outcomeusing three independent machine learning-basedmethods. The first method used support vector machine
(SVM) analysis. Predictive models based on the top tengenes ranked by p value (79% accuracy) performed bet-ter than models based on the level of EBOV RNA in aqRT-PCR [14]. However, genes identified through thisapproach were not linked to known components of theimmune response and both models showed wide dis-persions for each gene, which contributed to overlapsbetween the acute-survival and acute-fatal groups(Additional file 7). Including samples from the recov-ered control group in the analysis improved predictiveperformance slightly and included some of the invokedgenes that showed DE responses to EBOV exposure.To investigate the predictive power of a host-
response-based gene set, a substitution method ongroups of ten randomly selected genes was performed
A
B C
Fig. 4 Comparison of the convalescent survivors to healthy controls. The healthy controls comprised a group of healthy volunteers in BritishColombia and were found in GEO under GSE53655. a The top fold change differentially expressed genes when comparing convalescencesurvivors (blue) to acute infections and when comparing acute survivor (green) to acute fatal (red). Healthy controls are shown (purple). Thehealthy controls show no significant expression of these genes similar to the convalescent survivors. b The comparison of the two controlgroups as a PCA plot of their overall expression values after normalisation using edgeR. The healthy controls are indicated in blue and theconvalescent survivors in red. c The results of the gene set enrichment analysis comparing the convalescent survivors to the healthy controls.Genes significantly upregulated are in red and downregulated in blue. Through a Fisher’s exact test, no group of genes had a significantenrichment when comparing the two groups (p cutoff of 0.05)
Liu et al. Genome Biology (2017) 18:4 Page 7 of 17
to define a better SVM classifier (Figure 6c andAdditional file 8). The resulting group of ten genes im-proved the accuracy of outcome predictions from 79%to 85% (97 of 112 case outcomes predicted correctly).Figure 6a illustrates the resulting separation of acute-fatal cases from instances of acute-survival, while Fig. 6bshows a receiver operating characteristic (ROC) curvecompared to Ct. The optimistic bias for the area underthe curve (AUC) prediction for this model for the train-ing and testing data was 0.11.Two other methods were also used to identify gene
sets that correlated with outcome. The second methodused random forest (RF) and this improved accuracy to89% (Additional file 8 and 9), again with ten genes as
classifiers of outcome. The third method was an entirelydifferent approach and used an intensive optimisationprotocol to establish a panel of gene pairs (Additionalfile 8) for which the consensus expression profile acrossthe panel for acute-survivors were maximally differenti-ated from the acute-fatal group (‘Methods’, Additionalfiles 10 and 11). We termed this the Paired Gene Profil-ing method. Classification of a query patient wasachieved by correlation of his/her expression profileacross the panel to one or other of the alternative classi-fier profiles. This technique achieved 92% accuracy,using a select group of ten genes that were includedwithin the panel of classifier genes for the improvedSVM model (Additional file 8). Thus, the ability to
Fig. 5 Differentially abundant cell types present in human blood samples. a Relative abundance of specific T cell types with acute-fatal on theleft of the heatmap and acute-survivor on the right as predicted by DCQ compared to convalescent survivors. Within the heatmap, darker bluerepresents a decrease in the abundance of a given cell type and darker red represents an increase in the abundance of a given cell type. Thecolour bar on the left is showing if the given cell type is significantly differentially abundant (greater than or less than 0 with a p value < 0.05)in acute-survivors only (green), acute-fatal only (red) or both (blue). b Similar heatmap for dendritic cell types and (c) is for natural killer celltypes. Loss of circulating monocytes characterises fatal EVD. d Box and whisker plots depicting frequencies of peripheral blood monocytes infatal EVD patients (black), EVD survivors (blue), malaria patients (brown) and other febrile patients (green) as shown by FACS. Horizontal barsrepresent median values and the edge of the boxes represent 10–90 percentiles. Statistical analysis was performed via non-parametric Kruskal–Wallistest followed by Dunn’s post-test. ns non-significant, *p ≤ 0.05. e Correlation analysis indicating positive correlation between frequency ofCD14+ monocytes and the Ct values. Non-parametric Spearman’s rank correlation analysis was performed. The line indicates a linear regression
Liu et al. Genome Biology (2017) 18:4 Page 8 of 17

predict outcome was independent of the method usedto achieve it.To test whether these predictions of patient fate were
not overly optimistic, we adopted a ‘bootstrapping’technique. The random resampling of subsets of theoverall patient data provides a large number (i.e. 1000)of independent estimates of the predicted status of eachpatient. The consistency of the outcomes can then beexplored from the resulting histogram (Additional file 9),which if normally distributed, as indicated by the linearityof the corresponding QQplot (Additional file 9), is de-scribed by a mean ± 95% confidence interval (CI). Weshow for each of the different predictive methodsemployed that the distributions were well described by anormal distribution, and that the 95% CIs for predictiveaccuracy for the RF test were 0.758–0.876, while those forthe paired gene profiling (PGP) test were 0.793–0.953.These all lay within ± 8% of the corresponding meanvalues. Given the absence of data for independent
validation, this outcome offers good support to a highlyconsistent predictive accuracy across the different models.
Effects of viral load on predictive outcome and testing ona separate group of patients with EVDThe DGE analysis and gene classifiers were generatedfrom patients that had a diverse range of viral load. Wewanted to examine whether both were independent ofviral load and instead just reflected the host response toEBOV infection. To investigate this, we determined thetranscriptome of blood samples taken from an inde-pendent group of patients from that used in the initialDGE analysis and for gene classifiers. We focused specif-ically on samples from new patients whose viral loadswere not significantly different (Ct = 20–22) between afatal (n = 10) or non-fatal outcome (n = 10) (Additionalfile 12). This is a crucial range for viral load as betweenthese Ct values the outcome of EVD cannot be predictedas the case fatality rate in this group of patients was
Fig. 6 Identification and testing of a small set of host mRNAs whose expression predicts survival during acute EBOV infection. a Mean correlationplots where each sample is represented. Survivors in green, fatal in red. Line indicates prediction inflection point. Individuals above the line wouldbe predicted to be survivors using these mRNAs, while individuals below would be predicted to succumb to the disease. b ROC comparingprediction of survival using EBOV PCR Ct value (green) and host mRNA expression classifier (blue). The error bars represent SD of the average truepositive rate. c Box and whisker plots illustrating expression changes in log2(CPM) for the ten genes in the Host Classifier in control (blue), fatal(red) and survivors (green)
Liu et al. Genome Biology (2017) 18:4 Page 9 of 17

approximately 50% from the outbreak in Guinea. Froma disease biological perspective, this allowed us to in-vestigate whether the observed differentially expressedgenes between a fatal and survivor outcome were po-tentially related to viral load. For example, a lower viralload promoted survival or whether DGE was poten-tially host-moderated. All of these selected patientswere antigenically negative for Plasmodium and thusthe outcome and the host response were not compli-cated by malaria. DGE analysis between these twogroups of patients identified the enrichment of verysimilar transcript abundance to that described in theoriginal DGE analysis on the acute-fatal and acute-survivor patients groups (Additional file 13), suggestingthat the host response (at least at the transcript level inthe blood) was mainly independent of viral load. Therewas also good correlation between the top five differen-tially abundant gene transcripts expressed in the n = 20study and the n = 112 patient study (Additional file 14).When the ten gene SVM classifier was compared tothe Ct value in this group, it greatly outperformed theCt value in predicting survival as seen in the ROC andpartial (pROC) in Fig. 7. The ten gene RF classifier wasalso able to predict survival in this group of patientswhere the Ct value failed. This shows that the ability ofthe biomarker to predict outcome was independent ofCt value and is useful predicting outcome in patientswhere the Ct value is uninformative.
DiscussionUnderstanding the pathogenesis of rare outbreak dis-eases such as EBOV is both difficult and important. Todate, the overwhelming majority of cases of this disease
have occurred in situations where high-quality health-care and monitoring are challenging. This has made itdifficult to understand in detail many of the basic as-pects of disease development and pathogenesis; informa-tion on the disease has been gathered through animalmodels [16, 17].Here we show that transcriptomic sequencing of blood
samples taken from humans during the 2013-2016 WestAfrican outbreak and leftover from diagnostic sequen-cing can be an important means of acquiring multiplelevels of information about the host response to virus in-fection, ranging from understanding how immune cellpopulations in the blood change over time during infec-tion to helping define potential host biomarkers of infec-tion. This strongly argues that integrating transcriptomicanalysis of host responses during outbreaks can provideimportant insights into disease pathogenesis that affectclinical management. The strong ISG response observedin the large cohort of EVD patients is notable. IFN-likeresponses have been reported to be associated withmoderate disease in a diverse set of US EBOV patients[23] and have been suggested to be protective for EBOVinfection [24]. The existence of a strong innate immuneresponse in acute cases in Guinean patients, given theirdiffering clinical outcome and treatment, suggests thatthis response may not be offering significant protectionto promote survival.A particularly interesting finding from this study was
the effectiveness of using a recovered control group as acomparison population to investigate differential geneexpression. Ideally, a control group from Guinea thatwas never infected with EBOV would have been optimal;however, at the time (and still persisting), stigma
Fig. 7 Validation of classifier in an independent dataset. The ability of the host-based classifier to predict outcome was tested in an independentdataset where the Ct values all lay between 20 and 22. a ROC showing the host-based classifier (blue) in the independent dataset compared tothe Ct value (green). The line represents the line y = x which shows where the ROC falls if the predictions are equal to random selection. b pROCshowing the comparison for the host classifier (blue) and Ct value (green) with a false positive rate up to 0.2. In the validation dataset, the hostclassifier was able to predict better than the Ct value
Liu et al. Genome Biology (2017) 18:4 Page 10 of 17

associated with EBOV and ETCs rendered such a groupchallenging to identify and ethically problematic to takeblood samples. Using recovered control group tran-scriptomes had the potential to identify some responsesthat began during acute Ebola infection and had notbeen resolved when samples were taken from the con-trol group. However, comparison of the peripheralblood transcriptomes from this group to historical data-sets from a completely unrelated healthy control groupseparated both geographically and temporally from theWest African outbreak [18] indicated no significant dif-ferences in the transcriptome (Fig. 4). This suggestedthat at least when the peripheral blood samples weretaken the control group had recovered from infection.We find that immune-cell populations predicted by ourcomparison analysis (Fig. 5) and biomarkers identifiedthrough comparison were both verified in independentdatasets (e.g. Fig. 6 and Additional file 13). It is unlikelythat the Ebola outbreak will be the only one in whichthe ‘ideal’ control population is difficult to sampleand our results suggest that convalescent patientsmay serve as an important alternate control. By ne-cessity, datasets from samples that had poor-qualityreads were excluded from the analysis presented inthis work. This may have biased the identification andmeasurement of differentially expressed genes as wellas the downstream analysis of gene classifiers thatcorrelated outcome. However, the underlying biologyof EVD identified in this study through the transcrip-tomic approach correlated with both data from non-human primate studies and clinical information frompatients.The increased accumulation of mRNAs for genes in-
volved in the clotting cascade found during acute infec-tion with EBOV is consistent with earlier findings thatfibrin deposition was closely associated with EBOV in-fection [25, 26]. The increased abundance of multipleFG gene isoforms as well as the increased abundance ofalbumin mRNA is initially perplexing, as these genes areconsidered liver-specific mRNAs and not mRNAs thatare found in blood. We favour the hypothesis that theaccumulation of these genes is an indication of signifi-cant liver damage leading to leakage of hepatic mRNAsinto the blood [27]. It is important to note that duringthis outbreak, overt haemorrhaging was rarely observed[28], but strong increases in the abundance of thesegenes was seen in both the acute-survivor and acute-fatal patient groups, suggesting that significant liverdamage was present. As a measure of aberrant liverfunction, in patients with EVD, aspartate transaminase(AST) values were found to be higher than alaninetransaminase (ALT) [29]. This finding is consistent withobservations of liver damage in repatriated patients fromLiberia treated in the United States [30].
An important finding of this study is the similarity ofthe transcriptomic data to protein expression data ana-lysing cytokine expression observed in this [9] and earl-ier outbreaks [8]. These data emphasise the similarityof cytokine abundance information collected throughthis approach to that seen in previous EBOV outbreaksand also to NHP models of EVD in humans (Additionalfile 2). The robust IFN response seen in human infec-tion was somewhat surprising based on earlier reports.However, this was consistent with data from NHPmodels of lethal infection with this virus [31] that alsoshow very strong increases in IFN-responsive genes incirculating immune cells and suggests that more robustIFN signalling may decrease an individual’s ability tosurvive EBOV infection. Certainly, our study on pa-tients treated in a low-income setting and results frompatients treated in a high-income setting [6] challengesthe assumption that humans do not mount a robustimmune response.The changes in the immune response identified in this
study in the acute phase of EVD between acute-survivors and acute-fatal patients were potentiallycaused by the differential activation of gene transcriptionand also potential infiltration/exfiltration of differentcell types in the blood. Our prediction that monocytecell populations were higher in the acute-survivors thanthe acute-fatal patients was validated on an independ-ent group of patients using a cell-based approach(Fig. 5d)—completely different to that of RNA-seq(Fig. 5a and Additional file 6). We also predicted thatNK cell populations were higher in acute-survivorscompared to acute-fatal patients during the acutephase. NK cells have been previously suggested to beimportant innate immune cells in fighting EBOV infec-tion [32], so the increased abundance of these cells per-haps providing the crucial survival advantage to theacute-survivors group.Independent machine learning approaches identified
different panels of genes whose abundance could accur-ately predict outcome over a range of Ct values. Usinghost gene profiles to predict outcome also worked forthose Ct values (between 20 and 22) where the outcomewas not clear in the data from the European Mobile La-boratory, i.e. where the case fatality rate was approxi-mately 50%. Other studies have also shown that Ctvalues can be used to predict outcome. For example, astudy of EVD patients in Sierra Leone showed that pa-tients with a Ct ≥ 24 had an 87% chance of survival,whereas patients with a Ct value < 24 had a 22% chanceof survival [2]. Interestingly, the average patient Ct valuein samples processed by the European Mobile Labora-tory was 21.4, implying that for the average patient theiroutcome could not have been predicted based on Ctvalue alone. We show that the identified gene classifiers
Liu et al. Genome Biology (2017) 18:4 Page 11 of 17

were valid over a wide range of viral loads which clearlyindicated that the host response was unrelated to theamount of viremia. The classifiers were tested on an in-dependent group of 20 patients. This provided strongpreliminary information that the model was not highlyover-fitted, though additional samples would increaseconfidence.Assessing viral load together with an evaluation of the
host response at the time of diagnostic sampling maygive an accurate indication of the survival chance for thepatient, across a broad range of viral loads. Managementof patients in the developed world resulted in far bettersurvival rates than the management of patients in WestAfrica, due to extensive palliative intervention; therefore,the acute and fatal outcomes in this study may be morereflective of the situation in untreated patients. The tri-age of large numbers of patients under very resource-poor situations may promote survival rates by focusingefforts on those most in need. Predictive models basedon clinical data have also been proposed to determinethe outcome for patients with EVD [33].The ability to triage patients by disease severity and
likely outcome can be of practical benefit for patientcare. In any outbreak setting, it is inefficient to have theresources for the most intensive care scattered about theEbola Treatment Unit (ETU). Developing tests that allowthe stratification of risk would allow an ETU to central-ise intensive care resources for maximum efficiency andefficacy.Our findings also have implications for the design of
clinical trials. Recent studies used Ct value as a proxyfor the probability of survival (e.g. the Favipiravir trial),but as we demonstrate here, Ct-based prediction is notperfect. As our results provide improved prediction ofoutcome, the potential to show an effect of a therapeuticthrough a clinical trial is improved. During the last out-break, there was much public disagreement over the eth-ics of randomising patients with EVD to control groupsin clinical trials [34–36]. In our opinion (and that ofothers), a reasonable compromise position would be toexclude from randomisation those patients with the low-est probability of survival and provide them with thestudy drug. The results of our work would allow for amore accurate identification of those EVD patients witha low probability of survival rather than simply rely onCt values at admission.The mRNAs associated with the correct prediction of
outcome include the transcription factor eomesodermin(eomes), an important characteristic of CD8 T cell mem-ory transition [37], and is consistent with our predictionof increased CD8+ memory cells in survivors (Fig. 5).Consistent across the three gene sets identified by SVM,RF and the PGP profile-based classifier were TGFB1,VACM1 and HOPX. TGFBI is an extracellular matrix
protein that inhibits cell adhesion and is seen to bedownregulated in both fatal patients and survivors.VCAM1 is a gene important for lymphocyte extravasa-tion to sites of infection. This gene has previously beenshown to be upregulated in response to EBOV infection[38], consistent with our prediction of increased CD8+memory cells in survivors (Fig. 5). The decreased abun-dance of TGFB1 and the increased abundance ofVCAM1 is suggestive of an increase in cell adhesionwith an increased instance of leukocyte cell adhesion tothe endothelial layer and movement out of the bloodinto tissues.
ConclusionsThese data demonstrate that a blood sample from a pa-tient with EVD is a powerful source of disease informa-tion, which is relevant to clinical treatment. Analysingthe population of mRNAs present in the blood providedinformation on the extent of the immune response to in-fection, the immune cells engaged (and depleted) duringinfection, and also the accumulation of mRNAs likelyderived from damaged internal organs such as the liver.The changes in mRNA abundance also proved to be areliable means of predicting whether an individual pa-tient would survive or succumb to EVD.In large-scale outbreaks, blood represents one of the
most available and informative of diagnostic samples.Our studies suggest that using collected blood to analysehow a patient is responding to infection will allow betterdiagnosis and prediction of disease outcome for thishighly fatal infection. Though the analysis of a patient’sresponse to infection has not always been thought of asan important component of a diagnostic approach, thisreport and others [39–41] show that it has significantvalue and likely should be adopted into future diagnosticand treatment approaches.It is important to note that the differences between
patient groups are likely to have been due to a mixtureof gene regulation and changes in the cell types repre-sented in the blood samples. This complexity offers op-portunities to identify cell populations recruited tosuccessfully combat infection. Our analysis supportsthe hypothesis that in acute patients who survive infec-tion, gene transcripts associated with the presence ofNK cells may play a major role in outcome, suggestingthat approaches to enhance this population of cellscould be an effective EVD treatment strategy.Integration of this type of analysis in future outbreak
responses could help direct therapy and maximise abeneficial outcome of infection, particularly in the devel-opment of diagnostic approaches that can accuratelystratify patients for treatment based on the likely out-come of infection.
Liu et al. Genome Biology (2017) 18:4 Page 12 of 17

MethodsRNA extractions, library preparation and sequencingSamples from patients were sequenced on a HiSeq2500and several criteria were applied to the selection of datapost sequencing. A total of 38,554 genes were mappedto the 64,253 genes in the annotated human genomedatabase. The RNA was DNase treated using AmbionTurbo DNase. RNA–seq libraries were prepared fromthe DNAse-treated RNA using the Epicentre ScriptSeqv2 RNA-Seq Library Preparation Kit and following10–15 cycles of amplification; libraries were purifiedusing AMPure XP beads. Each library was quantifiedusing Qubit and the size distribution assessed usingthe Agilent 2100 Bioanalyser and the final librarieswere pooled in equimolar ratios. The quantity andquality of each pool was assessed by Bioanalyzer andsubsequently by qPCR using the Illumina LibraryQuantification Kit from Kapa on a Roche Light CyclerLC480II according to the manufacturer’s instructions.The template DNA was denatured according to theprotocol described in the Illumina User Guide andloaded at 12 pM concentration. To improve sequen-cing quality control, 1% PhiX was spiked-in. The se-quencing was undertaken on the Illumina HiSeq 2500with version 4 chemistry generating 2 × 125 bp paired-end reads. Base calling and de-multiplexing of indexedreads was performed by CASAVA version 1.8.2 (Illu-mina) to produce all the sequence data in fastq format.The raw fastq files were trimmed to remove Illuminaadapter sequences using Cutadapt version 1.2.1 [42]. Theoption ‘-O 3’ was set, so the 3′ end of any reads whichmatched the adapter sequence over at least 3 bp wastrimmed off. The reads were further trimmed to re-move low-quality bases, using Sickle version 1.200 witha minimum window quality score of 20. After trim-ming, reads shorter than 10 bp were removed.Trimmed R1/R2 read pairs were mapped to the humanreference genome assembly GRCh38 (ftp://ftp.ensem-bl.org/pub/release-77/fasta/homo_sapiens/dna/Homo_-sapiens.GRCh38.dna_sm.primary_assembly.fa.gz) usingTopHat2 version 2.1.0 [43, 44], which calls the mapperBowtie2 version 2.0.10 [44]. Paired-end mapping was car-ried out using option ‘-g 1’, ‘–library-type fr-secondstrand’,‘–mate-inner-dist 160’ and ‘–mate-std-dev 60’, which in-structs TopHat2 to allow a maximum of one alignment tothe reference for a given read, choosing the alignmentwith the best alignment scores if there is more than oneor discarding the read if there is more than one equallygood alignment.The alignments were used for calculating read counts
per gene using HTSeq-count (http://www-huber.embl.de/users/anders/HTSeq/doc/count.html). The raw countsgenerated from HTSeq-count were imported into the Renvironment to carry out differential expression analysis
using edgeR [45] for contrasting acute when tested andsurvived (acute survivor), acute when tested and died(acute fatal) and acute (either fatal or survived) comparedto convalescent controls. Differentially expressed geneswith a FDR < 5% and an absolute log2 fold change > 1 werefinally reported. Details on the sample numbers are pro-vided in the text and in Table 1.
Informatic analysisThree criteria were used to identify sample quality: (1)removal of low-quality samples from the dataset suchthat all samples eventually selected had over ~10% ofreads mapping to the human genome; (2) calculation ofthe correlation coefficient of each remaining sampleagainst any other samples within each groups and thescatter plot of all correlation coefficient values was plot-ted for the fatal and survivor groups; and (3) a cutoff ofa mean correlation coefficient of 0.8 was selected basedon the distribution and any samples with a mean correl-ation coefficient of less than 0.8 were eliminated.To identify gene expression signatures for predicting
outcomes of Ebola patients, a machine learning ap-proach was used (SVM) function in R package ‘e1071’[46]. These were based on the ten genes either with thehighest fold change or most significant identification.The performance of predictions was assessed following aleave-one-out cross-validation approach. The predictionperformances were assessed by using R package ‘ROCR’[47] through ROC curves and Accuracy-FPR (False Posi-tive Rate) plots (see Additional file 7).To perform the expansion substitution method to
identify an optimal classifier, first, the total gene setwas reduced to a search space containing only genesthat were differentially expressed from convalescentcontrols to acute-fatal or convalescent controls toacute-survivors. Then, for each iteration, ten geneswere selected at random to be the starting profile set.Each gene in the search space was substituted for a profilegene and the correlation within groups (acute-fatal toacute-fatal and acute-survivor to acute-survivor) andbetween groups (acute-fatal to acute-survivor) was calcu-lated. If the new gene substitution improved the within-group correlation and decreased the between-groupcorrelation, the new profile set was selected. This was rununtil convergence was reached and a last profile gene setwas generated. The whole process was run 50 times. Thefinal profile set included the genes that showed up themost in a last gene set. Finally, the accuracy of the classi-fier was determined by leave-one-out cross-validationwhere a sample was classified as acute-survivor or acute-fatal based on the correlation to the acute-fatal group orthe acute-survivor group. The bias estimations were per-formed using the boot function in R for 100 iterations. Acutoff value for the correlation was determined at each cv
Liu et al. Genome Biology (2017) 18:4 Page 13 of 17

step and if the sample fell below the cutoff line, it was clas-sified as acute-fatal and above acute-survivor. Trainingand testing of the model was performed in the originaldataset of 112 samples. The trained model was then usedin a validation dataset of 20 independent samples.
Ingenuity Pathway AnalysisThe p value was calculated by Fisher’s exact test right-tailed, which indicated the probability of association ofmolecules from the dataset with the canonical pathwayby random chance alone. The Z-score was used tomathematically compare the dataset with the canonicalpathway patterns, taking into account the activationstate of one of more key molecules when the pathwaywas activated and also the molecules’ causal relation-ships with each other. This is a Quant-based test thatdetermined if canonical pathways, including functionalendpoints, were increased or decreased based on differ-entially expressed genes or proteins in the dataset.
Digital cell quantificationTo determine relative cell type quantities from countdata, we used DCQ through the R-package ComICS[21]. The default parameters were used with 500 repeatsand a split ratio of 50% on an input dataset of foldchanges compared to controls (acute-fatal to controlsand acute-survivors to controls). All 207 cell types wereanalysed. The resulting data provided a predicted meanrelative abundance as well as the standard deviation ofthe mean. To determine cell types that were significantlydifferent from zero, a standard t-test was performed witha p value cutoff of 0.05. Definition of immune subsets isbased on ImmGen database information and thus repre-sents previously validated mouse equivalents to humanimmune cells [48–50].
Study samples for flow cytometry analysisRT-PCR was performed on EDTA-blood of patients withsuspected EVD using the RealStar Zaire Ebolavirus RT-PCR Kit 1.0 (Altona Diagnostics). EVD-positive patients(n = 37) included in the study were diagnosed by theEuropean Mobile Laboratory unit at the ETC Coyah andwere medically attended by medical teams deployed bythe Cuban government. Patients with Plasmodium co-infection were excluded from the study. Additionally,ten febrile EVD-negative controls and five patients diag-nosed with malaria were included in the study. Malariawas diagnosed using a rapid test. Leftover samples fromdiagnostics were shipped within 24 h after collection toour immunology laboratory at Donka Hospital inConakry and processed immediately. Peripheral bloodmononuclear cells (PBMCs) were isolated after redblood cell lysis (BD Biosciences). Immune phenotypingwas done by flow cytometry using the following antibodies:
CD16-PE (3G8), CD3-PerCP/Cy5.5 (SK7), CD19-PerCP/Cy5.5 (HIB19), CD56-PerCP/Cy5.5 (HCD56), HLA-DR-PE/Cy7 (L243), CD14-APC (HCD14), CD11c-PB (Bu15),CD14-BV510 (M5E2), CD141-PE (M80), CD1c-APC(L161), CD16-APC/Cy7 (3G8). All antibodies were fromBiolegend. Live/Dead cell discrimination was done withZombie NIR staining (Biolegend). After Live/Dead cellstaining, PBMCs were treated with FACS block (HumanTruStain Fc receptor blocking antibodies from Biolegend)for 20 min followed by extracellular antibody staining.Samples were afterwards inactivated in Cytofix/Cytoperm(BD) buffer in the presence of 4% formaldehyde. Sam-ple acquisition was done in a Guava easyCyte 8 FlowCytometer from Millipore. Flow cytometry analysis wasdone with FlowJo software (Treestar). Non-parametricstatistics was performed in Graphpad Prism software asdescribed in the legend to Fig. 3.
Human DCQThe human cell compendium for DCQ used a micro-array dataset of FACS-separated human immune cells(GSE24759). The data were read into R and normalisedusing the ‘affy’ package and RMA normalisation. Then,the log normalised values for each cell type were aver-aged for each gene and each gene was then normalisedby the median and standard deviation. A list of surfacemarkers was selected based on the FACS separatingmarkers used and other known surface markers for thegiven cell type. This list of surface markers and the newnormalised dataset was read into DCQ along with thefold change data. To determine significance, a standardt-test was performed on the mean and standard devi-ation of the output.
Non-human primate dataThe NHP data were taken from GEO GSE64538. Thisdataset contained RNA-seq in PBMCs from vaccinatedand unvaccinated animals at various time points duringviral challenge. Data were read into R and using edgeRand normalised for library size. DE data were calculatedusing the negative binomial. Fold changes were calculatedby first normalising to the pre-infection control for vacci-nated and unvaccinated animals and then taking the un-vaccinated 7 dpi animals over the vaccinated 7 dpi.
RF method for phenotypic prediction applied to theEbola datasetThe list of all genes was split into six strata and the Rpackage ‘randomForest’ was used on expression data foreach strata, with patients’ status marked as either Sur-vivor or Fatal. Classification was undertaken separatelyfor the six strata and the data were pooled and geneswere ranked to identify the top ten genes which wereused as biomarker genes. Finally, the patients’ outcome
Liu et al. Genome Biology (2017) 18:4 Page 14 of 17
prediction based on the top ten genes was performedusing the ‘randomForest’ method.
A novel PGP method for phenotypic prediction basedon the optimised selection of representative multi-geneexpression profilesSee Additional file 11 for a full description of this method.
BootstrappingBootstrapping for both RF and PGP predictive modelswas deployed using the R function ‘boot’ with 1000 re-samplings set to generate 1000 estimates of predictionaccuracy. Bootstrapping was set in ‘non-parameter’mode and patient outcome was presented in the func-tion argument ‘strata’.The bootstrapping results are depicted in Additional
file 9, with the left panel providing a histogram of pre-diction accuracy over the 1000 replications. The rightpanel shows the QQplot of prediction accuracy againstthe standard normal distribution, the linearity indicat-ing the extent to which the accuracy distribution is rep-resented by a normal distribution.
Additional files
Additional file 1: Gene expression profiles of fatal and survivors withEVD compared to a control group. (XLSX 335 kb)
Additional file 2: Fold change of the abundance of selected cytokinesshowing comparison between fatal or survivor groups between humans(using our datasets) and non-human primate models of infection (usinghistorical published data). (DOCX 184 kb)
Additional file 3: Expression profile differences in acute patients whoeither went on to have a fatal outcome or survive infection. (XLSX 74 kb)
Additional file 4: Acute phase response genes activated in a non-human primate model of EBOV infection. (DOCX 159 kb)
Additional file 5: DCQ analysis of predicted immune cell type profilesin acute patients who either went on to have a fatal outcome or surviveinfection. (DOCX 314 kb)
Additional file 6: Flow cytometry gating strategy for discrimination ofclassic CD14+ peripheral blood monocytes. (DOCX 412 kb)
Additional file 7: Receiver operating characteristic (ROC) curves for p- valuehost classifier genes versus Ct value. (DOCX 49 kb)
Additional file 8: Genes in the final profile sets for the machinelearning approaches. (DOCX 103 kb)
Additional file 9: Outcome of predictive models for the Random Forestmethod. (PDF 201 kb)
Additional file 10: The paired gene profiling method for outcomeprediction. (PDF 386 kb)
Additional file 11: A novel ‘gene paired profiling’ method for improvedphenotypic prediction based on the optimised selection of representativemulti-gene expression profiles. (DOCX 160 kb)
Additional file 12: Comparison of Ct values between the training andvalidation datasets. (DOCX 189 kb)
Additional file 13: Gene set enrichment analysis on validation dataset.(DOCX 333 kb)
Additional file 14: Box and whisker plot for the top differentiallyexpressed genes in validation dataset. (DOCX 134 kb)
FundingThe research was funded by the National Institute for Health Research HealthProtection Research Unit (NIHR HPRU) in Emerging and Zoonotic Infectionsat the University of Liverpool in partnership with Public Health England (PHE)and Liverpool School of Tropical Medicine (LSTM) to JAH and MWC anddirectly supported XL and NYR. The views expressed are those of the author(s)and not necessarily those of the NHS, the NIHR, the Department of Health orPHE. Bioinformatics pipelines were also developed as part of a Centre ofDefence Enterprise award to JAH and DAM. This work was also funded byproject EVIDENT (led by SG) (Ebola virus disease: correlates of protection,determinants of outcome and clinical management) that received fundingfrom the European Union’s Horizon 2020 research and innovation programunder grant agreement no. 666100 and in the context of service contractIFS/2011/272-372 funded by Directorate-General for International Cooperationand Development. The EMLab is a technical partner in the WHO Emerging andDangerous Pathogens Laboratory Network (EDPLN), and the Global OutbreakAlert and Response Network (GOARN) and the deployments in West Africa havebeen coordinated and supported by the GOARN Operational Support Team atWHO/HQ. The work was also funded by the Food and Drug Administration(USA) awarded to MWC and JAH, Ebola Virus Disease: correlates of protection,determinants of outcome and clinical management, numberHHSF223201510104C. We acknowledge the support of RO1AI1096159 and BPS/STP-15-051 to JHC. ES is supported by a National Science Foundation GraduateResearch Fellowship under grant no. DGE-1247312. We gratefully acknowledgehelpful conversations with Jay Mizgerd (BU, Pulmonary) regarding the acutephase response and Yael Steuerman (Tel Aviv University) regarding DCQ.
Availability of data and materialsFor the PGP method, the corresponding function is in the R statisticalpackage and an instruction for using the R function can be accessed at:https://github.com/fangy01/epbasedpredict.git. The DOI for the source codeis DOI 10.5181/zenodo.202727. The NHP data were taken from GEOGSE64538. Raw sequence read data for all the samples used in this analysiswere deposited with NCBI BioProject ID PRJNA352396. Note the data containno patient identifiable information, only the outcome of infection.
Authors’ contributionsXL and ES made an equal contribution. MWC, SG, CM-F, JHC and JAH designedthe study. MWC, CM-F, ARC, JHC and JAH wrote the manuscript. XL, ES, SH,NYR, IG-D, TRL, YF, ARC, AL, DX, DAM, JHC and JAH performed the experimentsand/or analysed the data. All other authors were involved either in samplecollection, processing and analysis, and/or logistical support. All authorsread and approved the final manuscript.
Competing interestsThe authors declare that they have no competing interests.
Ethics approval and consent to participateThe National Committee of Ethics in Medical Research of Guinea approvedthe use of diagnostic leftover samples and corresponding patient data forthis study (permit nos. 11/CNERS/14 and 33/CNERS/15). Approved researchprotocols included the use of samples that had been collected as part of thepublic health response to contain the outbreak in Guinea (informed consentwas not obtained from patients) and the use of samples from survivors(informed consent obtained). Ethical permission for the sequencing workconducted at the University of Liverpool of RNA from patient samples wasreviewed and approved by the institution under reference numberRETH000784. Permission to sequence biological samples (made safe)containing genetic material from Human Pathogen Hazard Group 4 viruseswas granted by the UK Home Office and the UK National Counter TerrorismSecurity Office. Ethical permission was also obtained from the Ethik-KommissionDer Arztekammer Hamburg (PV4910). Experimental methods comply with theHelsinki Declaration.
Author details1National Institute of Health Research, Health Protection Research Unit InEmerging and Zoonotic Infections, Liverpool, UK. 2Centre for GenomicResearch, Institute of Integrative Biology, University of Liverpool, LiverpoolL69 7ZB, UK. 3Department of Microbiology, School of Medicine, NationalEmerging and Infectious Diseases Laboratories, Bioinformatics Program,Boston University, Boston, MA 02118, USA. 4Heinrich Pette Institute – Leibniz
Liu et al. Genome Biology (2017) 18:4 Page 15 of 17

Institute for Experimental Virology, 20251 Hamburg, Germany. 5BernhardNocht Institute for Tropical Medicine, D-20359 Hamburg, Germany. 6GermanCenter for Infection Research (DZIF), partner site Hamburg, Germany.7Institute of Infection and Global Health, University of Liverpool, LiverpoolL69 7BE, UK. 8Public Health England, Porton Down, Wiltshire SP4 0JG, UK.9Bordeaux Hospital University Center (CHU) -INSERM U1219- BordeauxUniversity, Bordeaux, France. 10Defence Science Technology Laboratories(Porton Down), Porton Down, Salisbury, UK. 11Hôpital National Donka servicedes Maladies infectieuses et Tropicales, Conakry, Guinea. 12School of Cellularand Molecular Medicine, University of Bristol, Bristol BS8 1TD, UK. 13NationalInstitute of Health Research in Emerging and Zoonotic Infections, PortonDown, SP4 0JQ Salisbury, UK. 14Médecins Sans Frontières (MSF), Brussels,Belgium.
Received: 2 August 2016 Accepted: 15 December 2016
References1. Carroll MW, Matthews DA, Hiscox JA, Elmore MJ, Pollakis G, Rambaut A,
et al. Temporal and spatial analysis of the 2014-2015 Ebola virus outbreak inWest Africa. Nature. 2015;524:97–101.
2. Crowe SJ, Maenner MJ, Kuah S, Erickson BR, Coffee M, Knust B, et al. Prognosticindicators for Ebola patient survival. Emerg Infect Dis. 2016;22:217–23.
3. Uyeki TM, Mehta AK, Davey Jr RT, Liddell AM, Wolf T, Vetter P, et al. Clinicalmanagement of Ebola virus disease in the United States and Europe. N EnglJ Med. 2016;374:636–46.
4. Trad MA, Naughton W, Yeung A, Mazlin L, O'sullivan M, Gilroy N, Fisher DA,Stuart RL. Ebola virus disease: an update on current prevention andmanagement strategies. J Clin Virol. 2017;86:5-13. doi:10.1016/j.jcv.2016.11.005.Epub 2016 Nov 11.
5. Shah T, Greig J, van der Plas LM, Achar J, Caleo G, Squire JS, et al. Inpatientsigns and symptoms and factors associated with death in children aged 5 yearsand younger admitted to two Ebola management centres in Sierra Leone,2014: a retrospective cohort study. Lancet Glob Health. 2016;4:e495–501.
6. McElroy AK, Akondy RS, Davis CW, Ellebedy AH, Mehta AK, Kraft CS, et al.Human Ebola virus infection results in substantial immune activation. ProcNatl Acad Sci U S A. 2015;112:4719–24.
7. Ebihara H, Rockx B, Marzi A, Feldmann F, Haddock E, Brining D, et al. Hostresponse dynamics following lethal infection of rhesus macaques with Zaireebolavirus. J Infect Dis. 2011;204 Suppl 3:S991–9.
8. Wauquier N, Becquart P, Padilla C, Baize S, Leroy EM. Human fatal ZaireEbola virus infection is associated with an aberrant innate immunity andwith massive lymphocyte apoptosis. PLoS Negl Trop Dis. 2010;4, e837.
9. Ruibal P, Oestereich L, Ludtke A, Becker-Ziaja B, Wozniak DM, Kerber R, et al.Unique human immune signature of Ebola virus disease in Guinea. Nature.2016;533:100–4.
10. Mupere E, Kaducu OF, Yoti Z. Ebola haemorrhagic fever among hospitalisedchildren and adolescents in northern Uganda: epidemiologic and clinicalobservations. Afr Health Sci. 2001;1:60–5.
11. McElroy AK, Erickson BR, Flietstra TD, Rollin PE, Nichol ST, Towner JS, et al.Biomarker correlates of survival in pediatric patients with Ebola virusdisease. Emerg Infect Dis. 2014;20:1683–90.
12. McElroy AK, Erickson BR, Flietstra TD, Rollin PE, Nichol ST, Towner JS, et al.Ebola hemorrhagic Fever: novel biomarker correlates of clinical outcome.J Infect Dis. 2014;210:558–66.
13. Fitzpatrick G, Vogt F, Moi Gbabai OB, Decroo T, Keane M, De Clerck H, et al.The contribution of Ebola viral load at admission and other patientcharacteristics to mortality in a Medecins Sans Frontieres Ebola CaseManagement Centre, Kailahun, Sierra Leone, June-October 2014. J Infect Dis.2015;212:1752–8.
14. Sissoko D, Laouenan C, Folkesson E, M’Lebing AB, Beavogui AH, Baize S,et al. Experimental treatment with Favipiravir for Ebola Virus Disease (theJIKI Trial): A historically controlled, single-arm proof-of-concept trial inGuinea. PLoS Med. 2016;13, e1001967.
15. Deen GF, Knust B, Broutet N, Sesay FR, Formenty P, Ross C, et al. Ebola RNApersistence in semen of Ebola Virus Disease survivors - preliminary report. NEngl J Med. 2015. doi:10.1056/NEJMoa1511410.
16. Marzi A, Feldmann F, Hanley PW, Scott DP, Gunther S, Feldmann H. Delayeddisease progression in cynomolgus macaques infected with Ebola virusMakona strain. Emerg Infect Dis. 2015;21:1777–83.
17. Smither SJ, Eastaugh L, Ngugi S, O’Brien L, Phelps A, Steward J, et al. Ebolavirus Makona shows reduced lethality in an immune-deficient mousemodel. J Infect Dis. 2016;214 Suppl 3:S268–74.
18. Shin H, Shannon CP, Fishbane N, Ruan J, Zhou M, Balshaw R, et al. Variationin RNA-Seq transcriptome profiles of peripheral whole blood from healthyindividuals with and without globin depletion. PLoS One. 2014;9, e91041.
19. Hutchinson KL, Rollin PE. Cytokine and chemokine expression in humansinfected with Sudan Ebola virus. J Infect Dis. 2007;196 Suppl 2:S357–63.
20. Barrenas F, Green RR, Thomas MJ, Law GL, Proll SC, Engelmann F, et al. Nextgeneration sequencing reveals a controlled immune response to ZaireEbola virus challenge in cynomolgus macaques immunized with VSVΔG/EBOVgp. Clin Vaccine Immunol. 2015;22:354–6.
21. Altboum Z, Steuerman Y, David E, Barnett-Itzhaki Z, Valadarsky L, Keren-Shaul H, et al. Digital cell quantification identifies global immune celldynamics during influenza infection. Mol Syst Biol. 2014;10:720.
22. Reed DS, Hensley LE, Geisbert JB, Jahrling PB, Geisbert TW. Depletion ofperipheral blood T lymphocytes and NK cells during the course of ebolahemorrhagic Fever in cynomolgus macaques. Viral Immunol. 2004;17:390–400.
23. McElroy AK, Harmon JR, Flietstra TD, Campbell S, Mehta AK, Kraft CS, et al.Kinetic analysis of biomarkers in a cohort of US patients with Ebola virusdisease. Clin Infect Dis. 2016;63:460–7.
24. Smith LM, Hensley LE, Geisbert TW, Johnson J, Stossel A, Honko A, et al.Interferon-beta therapy prolongs survival in rhesus macaque models ofEbola and Marburg hemorrhagic fever. J Infect Dis. 2013;208:310–8.
25. Feldmann H, Geisbert TW. Ebola haemorrhagic fever. Lancet. 2011;377:849–62.
26. Geisbert TW, Young HA, Jahrling PB, Davis KJ, Kagan E, Hensley LE.Mechanisms underlying coagulation abnormalities in ebola hemorrhagicfever: overexpression of tissue factor in primate monocytes/macrophages isa key event. J Infect Dis. 2003;188:1618–29.
27. Okubo S, Miyamoto M, Takami K, Kanki M, Ono A, Nakatsu N, et al.Identification of novel liver-specific mRNAs in plasma for biomarkers ofdrug-induced liver injury and quantitative evaluation in rats treated withvarious hepatotoxic compounds. Toxicol Sci. 2013;132:21–31.
28. Chertow DS, Kleine C, Edwards JK, Scaini R, Giuliani R, Sprecher A. Ebolavirus disease in West Africa–clinical manifestations and management. NEngl J Med. 2014;371:2054–7.
29. Schieffelin JS, Shaffer JG, Goba A, Gbakie M, Gire SK, Colubri A, et al. Clinicalillness and outcomes in patients with Ebola in Sierra Leone. N Engl J Med.2014;371:2092–100.
30. Lyon GM, Mehta AK, Varkey JB, Brantly K, Plyler L, McElroy AK, et al. Clinicalcare of two patients with Ebola virus disease in the United States. N Engl JMed. 2014;371:2402–9.
31. Rubins KH, Hensley LE, Wahl-Jensen V, Daddario DiCaprio KM, Young HA,Reed DS, et al. The temporal program of peripheral blood gene expressionin the response of nonhuman primates to Ebola hemorrhagic fever.Genome Biol. 2007;8:R174.
32. Williams KJ, Qiu X, Fernando L, Jones SM, Alimonti JB. VSVDeltaG/EBOV GP-induced innate protection enhances natural killer cell activity to increasesurvival in a lethal mouse adapted Ebola virus infection. Viral Immunol.2015;28:51–61.
33. Colubri A, Silver T, Fradet T, Retzepi K, Fry B, Sabeti P. Transforming clinicaldata into actionable prognosis models: machine-learning framework andfield-deployable app to predict outcome of Ebola patients. PLoS Negl TropDis. 2016;10, e0004549.
34. Cox E, Borio L, Temple R. Evaluating Ebola therapies–the case for RCTs. NEngl J Med. 2014;371:2350–1.
35. Adebamowo C, Bah-Sow O, Binka F, Bruzzone R, Caplan A, Delfraissy JF,et al. Randomised controlled trials for Ebola: practical and ethical issues.Lancet. 2014;384:1423–4.
36. Joffe S. Evaluating novel therapies during the Ebola epidemic. JAMA. 2014;312:1299–300.
37. Buggert M, Tauriainen J, Yamamoto T, Frederiksen J, Ivarsson MA, MichaelssonJ, et al. T-bet and Eomes are differentially linked to the exhausted phenotypeof CD8+ T cells in HIV infection. PLoS Pathog. 2014;10, e1004251.
38. Wahl-Jensen VM, Afanasieva TA, Seebach J, Ströher U, Feldmann H,Schnittler H-J. Effects of Ebola virus glycoproteins on endothelial cellactivation and barrier function. J Virol. 2005;79:10442–50.
39. Zaas AK, Chen M, Varkey J, Veldman T, Hero 3rd AO, Lucas J, et al. Geneexpression signatures diagnose influenza and other symptomatic respiratoryviral infections in humans. Cell Host Microbe. 2009;6:207–17.
Liu et al. Genome Biology (2017) 18:4 Page 16 of 17
40. Garamszegi S, Yen JY, Honko AN, Geisbert JB, Rubins KH, Geisbert TW,et al. Transcriptional correlates of disease outcome in anticoagulant-treated non-human primates infected with ebolavirus. PLoS Negl Trop Dis.2014;8, e3061.
41. Tsalik EL, Henao R, Nichols M, Burke T, Ko ER, McClain MT, et al. Host geneexpression classifiers diagnose acute respiratory illness etiology. Sci TranslMed. 2016;8:322ra311.
42. Martin M. Cutadapt removes adapter sequences from high-throughputsequencing reads. EMBnet journal. 2011;17:10–2.
43. Kim D, Pertea G, Trapnell C, Pimentel H, Kelley R, Salzberg SL. TopHat2:accurate alignment of transcriptomes in the presence of insertions,deletions and gene fusions. Genome Biol. 2013;14:R36.
44. Langmead B, Salzberg SL. Fast gapped-read alignment with Bowtie 2. NatMethods. 2012;9:357–9.
45. Robinson MD, McCarthy DJ, Smyth GK. edgeR: a Bioconductor package fordifferential expression analysis of digital gene expression data.Bioinformatics. 2010;26:139–40.
46. Meyer D, Dimitriadou E, Hornik K, Weingessel A, Leisch F, Chang CC, et al.Support Vector Machines: The Interface to libsvm in package e1071. Rpackage version 16-7. 2015. http://CRAN.R-project.org/package=e1071.
47. Sing T, Sander O, Beerenwinkel N, Lengauer T. ROCR: visualizing classifierperformance in R. Bioinformatics. 2005;21:3940–1.
48. Villadangos JA, Shortman K. Found in translation: the human equivalent ofmouse CD8+ dendritic cells. J Exp Med. 2010;207:1131–4.
49. Haniffa M, Shin A, Bigley V, McGovern N, Teo P, See P, et al. Human tissuescontain CD141hi cross-presenting dendritic cells with functional homologyto mouse CD103+ nonlymphoid dendritic cells. Immunity. 2012;37:60–73.
50. Auffray C, Sieweke MH, Geissmann F. Blood monocytes: development,heterogeneity, and relationship with dendritic cells. Annu Rev Immunol.2009;27:669–92.
• We accept pre-submission inquiries
• Our selector tool helps you to find the most relevant journal
• We provide round the clock customer support
• Convenient online submission
• Thorough peer review
• Inclusion in PubMed and all major indexing services
• Maximum visibility for your research
Submit your manuscript atwww.biomedcentral.com/submit
Submit your next manuscript to BioMed Central and we will help you at every step:
Liu et al. Genome Biology (2017) 18:4 Page 17 of 17