humber river basin district
TRANSCRIPT

River Basin Management Plan Humber River Basin District
Contact us You can contact us in any of these ways: • email at [email protected] • phone on 08708 506 506 • post to Environment Agency Yorkshire & North East Region, WFD Team, Rivers House,
21 Park Square South, Leeds, LS1 2QG The Environment Agency website holds the river basin management plans for England and Wales, and a range of other information about the environment, river basin management planning and the Water Framework Directive. www.environment-agency.gov.uk/wfd You can search maps for information related to this plan by using ‘What’s In Your Backyard’. http://www.environment-agency.gov.uk/maps.
Published by:
Environment Agency, Rio House, Waterside Drive, Aztec West, Almondsbury, Bristol BS32 4UD tel: 08708 506506 email: [email protected] www.environment-agency.gov.uk
© Environment Agency Some of the information used on the maps was created using information supplied by the Geological Survey and/or the Centre for Ecology and Hydrology and/or the UK Hydrographic Office All rights reserved. This document may be reproduced with prior permission of the Environment Agency.
Cover image: Environment Agency Other images: Environment Agency
The Esk Pearl Mussel and Salmon Recovery Project The Lincolnshire Chalk Stream Project The On Trent Initiative British Waterways M Lucas – Durham University
Environment Agency River Basin Management Plan, Humber River Basin District 2 Main document December 2009

Contents This plan at a glance 5 1 About this plan 6 2 About the Humber River Basin District 8 3 Water bodies and how they are classified 13 4 The state of the water environment now 16 5 Actions to improve the water environment by 2015 21 6 The state of the water environment in 2015 34 7 Targets for subsequent cycles 41 8 Humber River Basin District catchments 42 9 Next steps – implementing this plan 79 10 Summary statistics for the Humber River Basin District 83 11 Further information – the annexes 84 Tables Table 1 Water body numbers in the Humber River Basin District ........................................13 Table 2 Other Directives and their Water Framework Directive protected areas .................15 Table 3 Main reasons (where known) for not achieving good ecological status or potential17 Table 4 Qualitative assessment of increased risk from climate change...............................30 Table 5 Key statistics at a glance – Esk & Coast catchment ...............................................44 Table 6 Key statistics at a glance – Swale, Ure, Nidd and Upper Ouse catchment.............46 U U
Table 7 Key statistics at a glance – Yorkshire Derwent catchment.....................................48 Table 8 Key statistics at a glance – Wharfe and Ouse catchment .......................................51 Table 9 Key statistics at a glance – Hull & East Ridging catchment ....................................53 Table 10 Key statistics at a glance – Aire and Calder catchment ..........................................55 Table 11 Key statistics at a glance – Idle and Tornecatchment .............................................57 Table 12 Key statistics at a glance – Don & Rother catchment .............................................59 Table 13 Key statistics at a glance – Louth, Grimsby and Ancholme catchment...................61 Table 14 Key statistics at a glance – Derbyshire Derwent catchment ...................................63 Table 15 Key statistics at a glance – Dove catchment..........................................................65 Table 16 Key statistics at a glance – Lower Trent & Erewash catchment..............................68 Table 17 Key statistics at a glance – Staffordshire Trent Valley catchment...........................70 Table 18 Key statistics at a glance – Tame, Anker and Mease catchment...........................72 Table 19 Key statistics at a glance – Soar catchment...........................................................74 Table 20 Key statistics at a glance – Estuaries and coastal waters.......................................77 Table 21 Key statistics at a glance – Groundwater ................................................................78 Table 22 Summary statistics ..................................................................................................83 Case Studies The Esk Pearl Mussel and Salmon Recovery Project............................................................10 Improving fish passage ..........................................................................................................19 The Yorkshire Derwent...........................................................................................................50 The Lincolnshire Chalk Stream Project ..................................................................................62 The OnTrent Initiative.............................................................................................................69
Environment Agency River Basin Management Plan, Humber River Basin District 3 Main document December 2009
Figures Figure 1 Map of the Humber River Basin District ...................................................................9 Figure 2 The components of overall status for surface water bodies...................................14 Figure 3 Ecological status/potential and biological status of surface water bodies now ......16 Figure 4 Proportion of assessed river water bodies in each status class, by element
(numbers above bars indicate total number of water bodies assessed) ................18 Figure 5 Surface water bodies showing an improvement for one or more elements by 2015
...............................................................................................................................34 Figure 6 Ecological status/potential of surface water bodies now and in 2015 ....................35 Figure 7 Biological status of surface water bodies now and in 2015....................................35 Figure 8 Predicted proportion of river water bodies in each status class, by element, for
2015 .......................................................................................................................36 Figure 9 Predicted status and potential for surface water bodies in 2015............................38 Figure 10 Predicted quantitative status for groundwater in 2015 ...........................................39 Figure 11 Predicted chemical status for groundwater in 2015 ...............................................40 Figure 12 Map of the catchments in the Humber River Basin District ....................................43 Figure 13 Map showing the current ecological status/potential for rivers in Esk & Coast
catchment...............................................................................................................45 Figure 14 Map showing the current ecological status/potential for rivers in Swale, Ure, Nidd
and Upper Ouse catchment ...................................................................................47 U
U
Figure 15 Map showing the current ecological status/potential for rivers in Yorkshire Derwent catchment...............................................................................................................49
Figure 16 Map showing the current ecological status/potential for rivers in Wharfe and Ouse catchment...............................................................................................................52
Figure 17 Map showing the current ecological status/potential for rivers in Hull & East Riding catchment...............................................................................................................54
Figure 18 Map showing the current ecological status/potential for rivers in Aire and Calder catchment...............................................................................................................56
Figure 19 Map showing the current ecological status/potential for rivers in Idle and Torne catchment...............................................................................................................58
Figure 20 Map showing the current ecological status/potential for rivers in Don & Rother catchment...............................................................................................................60
Figure 21 Map showing the current ecological status/potential for rivers in Louth, Grimsby and Ancholme catchment.......................................................................................62
Figure 22 Map showing the current ecological status/potential for rivers in Derbyshire Derwent catchment ................................................................................................64
Figure 23 Map showing the current ecological status/potential for rivers in Dove catchment 66 Figure 24 Map showing the current ecological status/potential for rivers in Lower Trent &
Erewash catchment................................................................................................68 Figure 25 Map showing the current ecological status/potential for rivers in Staffordshire Trent
Valley catchment....................................................................................................71 Figure 26 Map showing the current ecological status/potential for rivers in Tame, Anker and
Mease catchment...................................................................................................73 Figure 27 Map showing the current ecological status/potential for rivers in Soar catchment.75 Figure 28 River basin district management planning milestones to date and to 2015 ...........82
Environment Agency River Basin Management Plan, Humber River Basin District 4 Main document December 2009
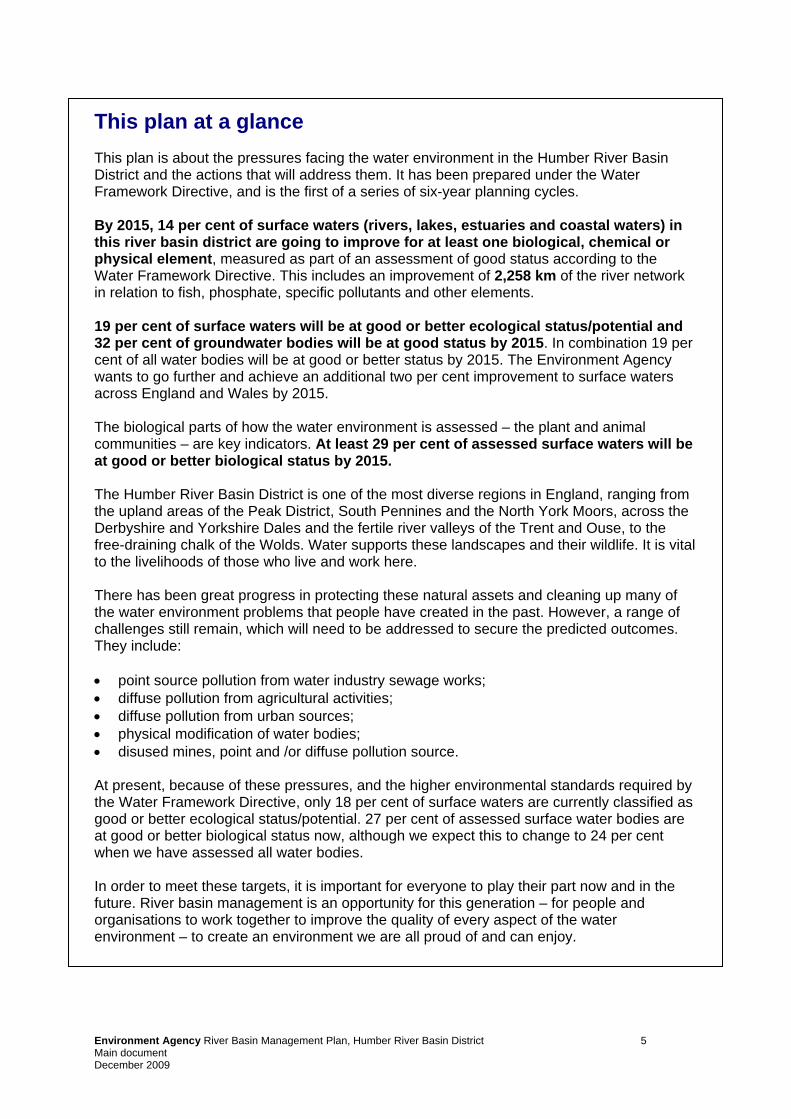
This plan at a glance This plan is about the pressures facing the water environment in the Humber River Basin District and the actions that will address them. It has been prepared under the Water Framework Directive, and is the first of a series of six-year planning cycles. By 2015, 14 per cent of surface waters (rivers, lakes, estuaries and coastal waters) in this river basin district are going to improve for at least one biological, chemical or physical element, measured as part of an assessment of good status according to the Water Framework Directive. This includes an improvement of 2,258 km of the river network in relation to fish, phosphate, specific pollutants and other elements. 19 per cent of surface waters will be at good or better ecological status/potential and 32 per cent of groundwater bodies will be at good status by 2015. In combination 19 per cent of all water bodies will be at good or better status by 2015. The Environment Agency wants to go further and achieve an additional two per cent improvement to surface waters across England and Wales by 2015. The biological parts of how the water environment is assessed – the plant and animal communities – are key indicators. At least 29 per cent of assessed surface waters will be at good or better biological status by 2015. The Humber River Basin District is one of the most diverse regions in England, ranging from the upland areas of the Peak District, South Pennines and the North York Moors, across the Derbyshire and Yorkshire Dales and the fertile river valleys of the Trent and Ouse, to the free-draining chalk of the Wolds. Water supports these landscapes and their wildlife. It is vital to the livelihoods of those who live and work here. There has been great progress in protecting these natural assets and cleaning up many of the water environment problems that people have created in the past. However, a range of challenges still remain, which will need to be addressed to secure the predicted outcomes. They include: • point source pollution from water industry sewage works; • diffuse pollution from agricultural activities; • diffuse pollution from urban sources; • physical modification of water bodies; • disused mines, point and /or diffuse pollution source.
At present, because of these pressures, and the higher environmental standards required by the Water Framework Directive, only 18 per cent of surface waters are currently classified as good or better ecological status/potential. 27 per cent of assessed surface water bodies are at good or better biological status now, although we expect this to change to 24 per cent when we have assessed all water bodies. In order to meet these targets, it is important for everyone to play their part now and in the future. River basin management is an opportunity for this generation – for people and organisations to work together to improve the quality of every aspect of the water environment – to create an environment we are all proud of and can enjoy.
Environment Agency River Basin Management Plan, Humber River Basin District 5 Main document December 2009

1 About this plan This plan focuses on the protection, improvement and sustainable use of the water environment. Many organisations and individuals help to protect and improve the water environment for the benefit of people and wildlife. River basin management is the approach the Environment Agency is using to ensure our combined efforts achieve the improvement needed in the Humber River Basin District (RBD). River basin management is a continuous process of planning and delivery. The Water Framework Directive introduces a formal series of 6 year cycles. The first cycle will end in 2015 when, following further planning and consultation, this plan will be updated and reissued. The Humber River Basin District Liaison Panel has been central to helping us manage this process. The panel includes representatives of businesses, planning authorities, environmental organisations, consumers, navigation, fishing and recreation bodies and central, regional and local government, all with key roles to play in implementing this plan. The Environment Agency has also worked extensively with local stakeholders to identify the actions needed to address the main pressures on the water environment. This plan has been prepared under the Water Framework Directive (WFD), which requires all countries throughout the European Union to manage the water environment to consistent standards. Each country has to: • prevent deterioration in the status of aquatic ecosystems, protect them and improve the
ecological condition of waters; • aim to achieve at least good status for all water bodies by 2015. Where this is not
possible and subject to the criteria set out in the Directive, aim to achieve good status by 2021 or 2027;
• meet the requirements of Water Framework Directive Protected Areas; • promote sustainable use of water as a natural resource; • conserve habitats and species that depend directly on water; • progressively reduce or phase out the release of individual pollutants or groups of
pollutants that present a significant threat to the aquatic environment; • progressively reduce the pollution of groundwater and prevent or limit the entry of
pollutants; • contribute to mitigating the effects of floods and droughts. The plan describes the river basin district, and the pressures that the water environment faces. It shows what this means for the current state of the water environment, and what actions will be taken to address the pressures. It sets out what improvements are possible by 2015 and how the actions will make a difference to the local environment – the catchments, the estuaries and coasts, and the groundwater. Looking towards implementation, the plan highlights the programme of investigations to be undertaken. This will identify more actions, particularly those associated with diffuse pollution, for delivery during the first cycle. New national measures, made available by government, will also lead to additional improvements. At local level, the Environment Agency will be working closely with a wide variety of organisations and individuals, not only to deliver the commitments contained in the plan, but wherever possible to expand upon them for the benefit of the water environment.
Environment Agency River Basin Management Plan, Humber River Basin District 6 Main document December 2009

Strategic Environmental Assessment A Strategic Environmental Assessment of the draft plan was completed to review the effects of the proposals on the wider environment. The assessment enabled us to make sure that this plan represents the most sustainable way of managing the water environment. The Post Adoption Statement and accompanying Statement of Environmental Particulars is available at www.environment-agency.gov.uk/wfd Habitats Regulations Assessment A Habitats Regulations Assessment of this plan has been carried out to consider whether it is likely to have a significant effect on any Natura 2000 sites. The assessment was undertaken by the Environment Agency, in consultation with Natural England. The assessment concluded that the River Basin Management Plan is unlikely to have any significant negative effects on any Natura 2000 sites. The Plan itself does not require further assessment under the Habitats Regulations. This conclusion is reliant on the fact that before any measures in the plan are implemented they must be subject to the requirements of the Habitats Regulations. Any plans, project or permissions required to implement the measures must undergo an appropriate assessment if they are likely to a have a significant effect. A copy of the Habitats Regulations Assessment of this plan is available at www.environment-agency.gov.uk/wfd Impact Assessment An impact assessment of this plan has been completed. It looks at the costs of a reference case, which includes existing actions and new actions required by existing obligations, and the incremental costs and benefits of implementing the additional new actions required by this plan. The impact assessment also provides a forward look to the costs and benefits of potential action in future cycles (2015 to 2021 and 2021 to 2027). A copy of the impact assessment is available at www.environment-agency.gov.uk/wfd
Environment Agency River Basin Management Plan, Humber River Basin District 7 Main document December 2009

2 About the Humber River Basin District The Humber River Basin District covers an area of 26,109 km2, ranging from the North York Moors to Birmingham, the Pennines to the North Sea and Stoke-on-Trent to Rutland. The river basin district has several major urban centres including Birmingham, Leeds and Sheffield. There are several areas of high deprivation and a proportion of the river basin district is the focus of urban renewal programmes. In total, more than 10.8 million people live and work in towns and cities within the district. Many Local Authorities within the district have Growth Point status. The relevant spatial plans propose over 700,000 additional homes along with the jobs and services for the people who will live in them. The Environment Agency will work with the planners, developers and communities affected by growth to maintain and improve the environment. Key economic sectors in the region include business services, health, wholesale and distribution. Manufacturing (particularly metals) is an important contributor to the economy of the Humber River Basin District, but has been declining in recent years. Historically, mining and quarrying for coal and other minerals was a huge industry across the region. Today, mineral extraction is less widespread, although there are important exceptions including a few surviving deep coal mines. The Humber RBD is one of the most diverse regions in England. It ranges from the upland areas of the Peak District, South Pennines and the North York Moors with their internationally important peatlands, across the Derbyshire and Yorkshire Dales and the fertile river valleys of the Trent and Ouse, to the free-draining chalk of the Yorkshire and Lincolnshire Wolds. The predominant land use is agriculture, with a diversity of farming types to match the landscape, ranging from livestock and dairy farming to cereals and vegetable production. Forestry accounts for around 13% of land use in the RBD. Tourism is an important component of the economy of the river basin district with three National Parks (North Yorkshire Moors, the Yorkshire Dales and the Peak District) and two Areas of Outstanding Natural Beauty (Nidderdale, and Hambleton and Howardian Hills). Seaside towns such as Bridlington, Scarborough and Whitby all attract large numbers of visitors. Historically all rivers within the district contained salmon and sea trout. Following decades of pollution, water quality has improved greatly and all river systems within the Humber River basin district now contain stocks of migratory salmonids to a greater or lesser extent. Man-made physical barriers to fish movement prevent these fish, along with freshwater fish, eels and lampreys, from reaching their true natural potential in rivers such as the Ouse and Trent and their tributaries. • We will seek to remove all artificial barriers to fish migration for all species, starting with
the highest priority obstructions. • We will work with communities and partners to provide opportunities and funding for the
removal of prioritised barriers. All rivers within the Region will hold naturally self-sustaining spawning populations of migratory fish by 2021.
Environment Agency River Basin Management Plan, Humber River Basin District 8 Main document December 2009
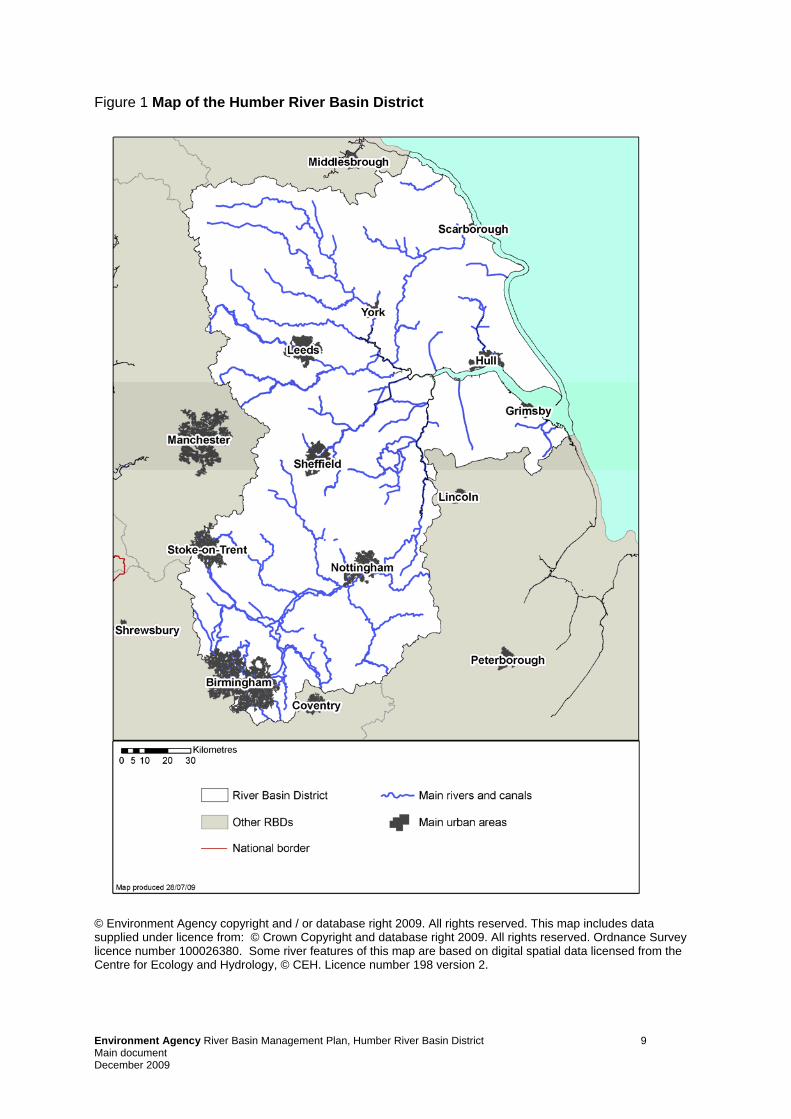
Figure 1 Map of the Humber River Basin District
© Environment Agency copyright and / or database right 2009. All rights reserved. This map includes data supplied under licence from: © Crown Copyright and database right 2009. All rights reserved. Ordnance Survey licence number 100026380. Some river features of this map are based on digital spatial data licensed from the Centre for Ecology and Hydrology, © CEH. Licence number 198 version 2.
Environment Agency River Basin Management Plan, Humber River Basin District 9 Main document December 2009

Pressures on the water environment A great deal is already being done to protect and improve the water environment. However, it will take more time, effort and resources to deal with the pressures that have significantly altered and damaged the environment over the last few hundred years. There are a number of major challenges. The way that urban land is used should also protect and restore habitats, species and natural processes. Drinking water supplies and bathing areas also need to be protected. We want to see reduced runoff from urban development and roads as this reduces diversity in aquatic plants and animals. Measures such as sustainable drainage systems and, clearly understood and effectively enforced planning policies at the regional and local level are essential to the success of this objective. The regional planning bodies and Leader Boards have important roles to play in ensuring that the Regional Spatial Strategies and emerging Integrated Regional Strategies actively seek to endorse the requirements of the WFD and promote sustainable development across the river basin district. Controlling diffuse pollution and making wise use of water are priorities if the water environment is going to improve. Farmers can increase profits and minimise risk to the environment by integrating the best traditional methods with advanced technologies. For example, through soil sampling and nutrient planning farmers can establish exactly what each crop needs, reducing the risk of nutrients leaching from farmland. Unrestricted stock access to watercourses can injure livestock as well as damage river banks and increase soil erosion. Upland management is also important in the Humber RBD. Through protecting peatlands, sediment input into the river system and water colour in drinking water can be reduced. The peatlands provide continued carbon storage, which could help to address some of the impacts of climate change. To deliver the Regional Forestry Strategy, woodland groups are looking at tree planting within gills and cloughs to stabilise the soil and reduce the movement of gravels downstream.
Case Study 1 The Esk Pearl Mussel and Salmon Recovery Project The freshwater pearl mussel is one of the longest lived invertebrates known. Formerly widespread, its numbers have severely declined. The decline is due to a number of factors including:
• habitat degradation caused by sedimentation of river gravels
• decline in populations of host fish (salmon and trout) • historic pearl fishing • pollution and water quality deterioration.
This Project aims to restore pearl mussel populations and increase numbers of salmon and trout through improving the river habitat and promoting good land management. A demonstration farm has been set up to demonstrate good environmental practice.
There is concern about future trends in water availability in the Humber RBD. Water is valuable. To ensure there is sufficient for future needs and for wildlife to flourish, supplies need to be provided in a sustainable way. Some areas are closed to new abstractions, while some have no water available during times of low surface flows. We must ensure the efficient use of available water resources and restore sustainable abstraction in order to accommodate growth in the district. The main demands on our water resources are: public
Environment Agency River Basin Management Plan, Humber River Basin District 10 Main document December 2009

water supply, irrigation for agriculture, horticulture and recreational use, and industrial abstractions. Climate change is also seen as a pressure on water resources. Following publication of the Environment Agency’s water resources strategy for England and Wales, we have developed Regional Action Plans for the Midlands and Yorkshire. These plans translate actions from the main strategy into local initiatives based on local needs and priorities. For example, we will promote water efficiency and will contribute to enhancement of the water environment by implementing our Restoring Sustainable Abstraction programme. River flows will be protected in five Habitats Directive sites through the modification of relevant abstraction licences with the aim of achieving objectives by 2015. The impacts of modifications and invasive non-native species on wildlife can be reduced through measures introduced by river basin management planning. The benefits to the environment, wildlife and society in general of improved, well connected habitats need to be clearly explained, understood and maximised. For example, a planned approach to flood risk management and shoreline management, which incorporates opportunities for habitat creation and river enhancement, will result in environmental improvements. Optimisation of washland regulation, such as that upstream of Rotherham, will also contribute to greater ecological enhancement, while continuing to deliver flood risk management for downstream urban areas. There are a number of initiatives within the river basin district which can be drawn upon to develop good practice for the control of invasive non-native species e.g. the River Soar partnership who work together to remove floating pennywort on the river; and Mid Aire Rivers Project and Calder Rivers Project delivering mink control to benefit water vole populations. The legacy left behind from mining, both coal and non-coal, has led to contamination and rising mine waters, both of which need to be carefully managed to minimise the impact on water quality. The Coal Authority will continue to manage mine-water arising from abandoned coal mines and will aim to prevent and mitigate significant new pollution. They are also developing a strategy to address environmental risk from non-coal mines and piloting possible remediation works. Ongoing regulatory work, water company investment and working with partnership organisations, will minimise the impact of pollution from regulated sites. There are a number of initiatives to investigate the source and behaviour of polluting substances; and seek to control their use and discharge by means of: pollution prevention partnerships, advice and campaigns awareness campaigns, codes of good practice and improved management of assets. The most significant of these pressures are: • Non-native species – invasive non-native species are plants and animals that have
deliberately or accidentally been introduced outside their natural range, and by spreading quickly threaten native wildlife and can cause economic damage.
• Urban and transport pollution – a range of pollutants related to urban areas and the transport network.
• Nitrate – an essential plant nutrient found in fertiliser and sewage effluent. It can cause environmental problems in excessive quantities.
• Organic pollution – an excess of organic matter such as manure or sewage which depletes the oxygen available for wildlife.
• Pesticides – chemical and biological products used to kill or control pests. • Abstraction and other artificial flow regulation – problems related to taking water
from rivers, lakes and groundwater.
Environment Agency River Basin Management Plan, Humber River Basin District 11 Main document December 2009

• Mines and minewaters – minewaters are usually acidic and contain metal contaminants such as copper, iron, manganese and zinc which can have significant ecological impacts.
• Metals – metals, in large quantities, can be toxic to freshwater fish, invertebrates and marine organisms.
• Physical modification – changes to the structure of water bodies, such as for flood defence.
• Phosphate – a plant nutrient found in sewage and fertiliser that can cause too much algae in rivers when in excess quantities.
• Sediment –.undissolved particles of floating on top of or suspended within water, for example those caused by increased rates of soil erosion from land based activities. Sedimentation can smother river life and spread pollutants from the land into the water environment.
• Faecal indicator organisms – pathogenic (infection-causing) organisms, such as bacteria or viruses from sewage or animal excrement.
The plan also looks at other important issues, such as climate change and the significant growth in housing and other development.
Environment Agency River Basin Management Plan, Humber River Basin District 12 Main document December 2009
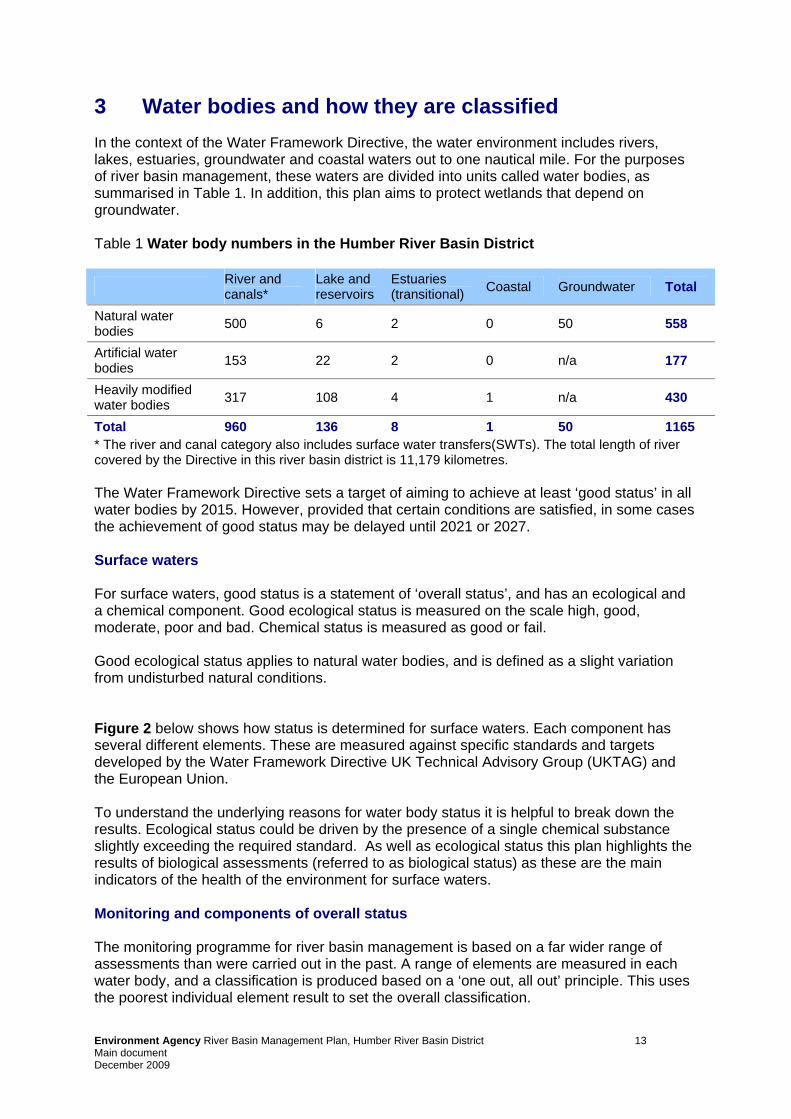
3 Water bodies and how they are classified In the context of the Water Framework Directive, the water environment includes rivers, lakes, estuaries, groundwater and coastal waters out to one nautical mile. For the purposes of river basin management, these waters are divided into units called water bodies, as summarised in Table 1. In addition, this plan aims to protect wetlands that depend on groundwater. Table 1 Water body numbers in the Humber River Basin District
River and canals*
Lake and reservoirs
Estuaries (transitional) Coastal Groundwater Total
Natural water bodies 500 6 2 0 50 558
Artificial water bodies 153 22 2 0 n/a 177
Heavily modified water bodies 317 108 4 1 n/a 430
Total 960 136 8 1 50 1165 * The river and canal category also includes surface water transfers(SWTs). The total length of river covered by the Directive in this river basin district is 11,179 kilometres. The Water Framework Directive sets a target of aiming to achieve at least ‘good status’ in all water bodies by 2015. However, provided that certain conditions are satisfied, in some cases the achievement of good status may be delayed until 2021 or 2027. Surface waters For surface waters, good status is a statement of ‘overall status’, and has an ecological and a chemical component. Good ecological status is measured on the scale high, good, moderate, poor and bad. Chemical status is measured as good or fail. Good ecological status applies to natural water bodies, and is defined as a slight variation from undisturbed natural conditions. Figure 2 below shows how status is determined for surface waters. Each component has several different elements. These are measured against specific standards and targets developed by the Water Framework Directive UK Technical Advisory Group (UKTAG) and the European Union. To understand the underlying reasons for water body status it is helpful to break down the results. Ecological status could be driven by the presence of a single chemical substance slightly exceeding the required standard. As well as ecological status this plan highlights the results of biological assessments (referred to as biological status) as these are the main indicators of the health of the environment for surface waters. Monitoring and components of overall status The monitoring programme for river basin management is based on a far wider range of assessments than were carried out in the past. A range of elements are measured in each water body, and a classification is produced based on a ‘one out, all out’ principle. This uses the poorest individual element result to set the overall classification.
Environment Agency River Basin Management Plan, Humber River Basin District 13 Main document December 2009

Figure 2 The components of overall status for surface water bodies
Physico-Chem e.g. nutrients, pH, dissolved oxygen,
ammonia
Biological Elements e.g. phytoplankton, macroalgae, fish,
invertebrates Specific Pollutants e.g. metals and their compounds, organic
compounds
Hydromorphology e.g. depth, width,
flow, structure
Priority substances which present a
significant risk to the water environment
Chemical status
Overall Status
Ecological status
The classification of water bodies will improve as new monitoring data are collected and better methods of assessment are developed. Future monitoring will help show where environmental objectives are already being met and where more needs to be done to improve the water environment. Monitoring will also give us some information on the spread of invasive non-native species.
The Water Framework Directive recognises the key role that water resources and habitats play in supporting healthy aquatic ecosystems. It requires that water bodies are managed to protect or improve hydromorphological conditions. Hydromorphology is a term that covers the flow of water in a water body and its physical form. The term encompasses both hydrological and geomorphological characteristics that help support a healthy ecology in rivers, lakes, estuaries and coastal waters. Artificial and heavily modified waters Some water bodies are designated as ‘artificial’ or ‘heavily modified’. This is because they may have been created or modified for a particular use such as water supply, flood protection, navigation or urban infrastructure. By definition, artificial and heavily modified water bodies are not able to achieve natural conditions. Instead the classification and objectives for these water bodies, and the biology they represent, are measured against ‘ecological potential’ rather than status. For an artificial or heavily modified water body to achieve good ecological potential, its chemistry must be good. In addition, any modifications to the structural or physical nature of the water body that harm biology must only be those essential for its valid use. All other such modifications must have been altered or managed to reduce or remove their adverse impact, so that there is the potential for biology to be as close as possible to that of a similar natural
Environment Agency River Basin Management Plan, Humber River Basin District 14 Main document December 2009
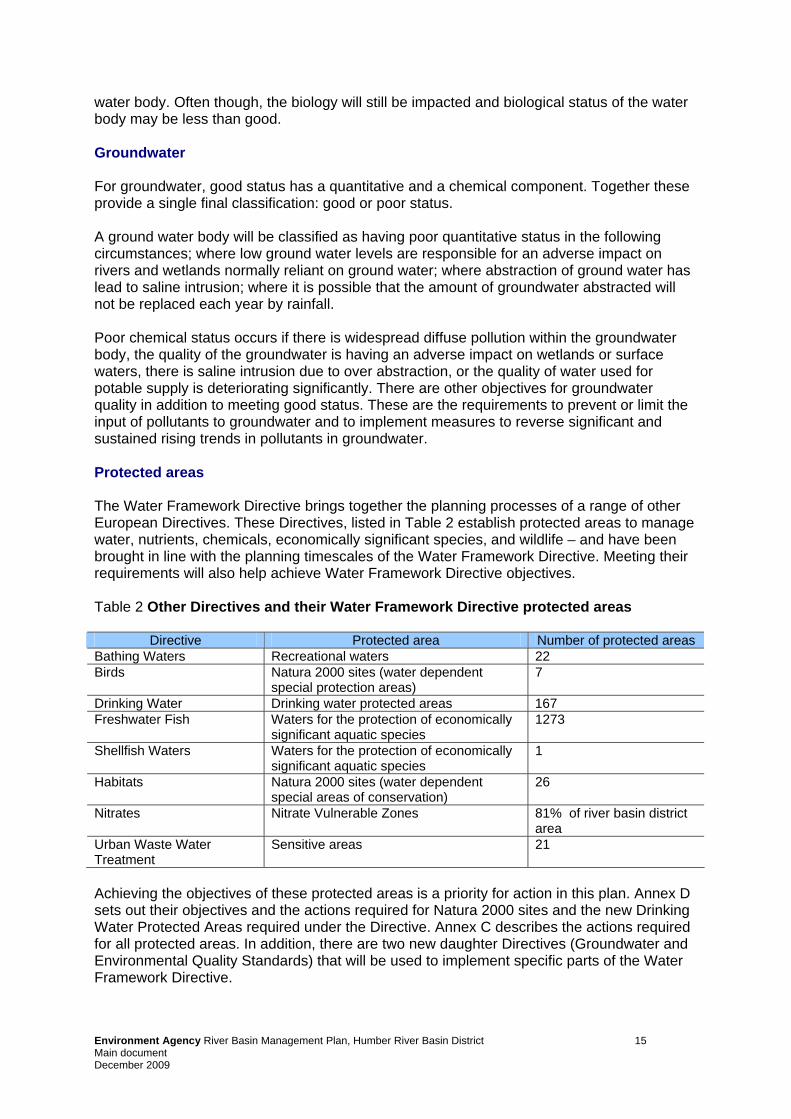
water body. Often though, the biology will still be impacted and biological status of the water body may be less than good. Groundwater For groundwater, good status has a quantitative and a chemical component. Together these provide a single final classification: good or poor status. A ground water body will be classified as having poor quantitative status in the following circumstances; where low ground water levels are responsible for an adverse impact on rivers and wetlands normally reliant on ground water; where abstraction of ground water has lead to saline intrusion; where it is possible that the amount of groundwater abstracted will not be replaced each year by rainfall. Poor chemical status occurs if there is widespread diffuse pollution within the groundwater body, the quality of the groundwater is having an adverse impact on wetlands or surface waters, there is saline intrusion due to over abstraction, or the quality of water used for potable supply is deteriorating significantly. There are other objectives for groundwater quality in addition to meeting good status. These are the requirements to prevent or limit the input of pollutants to groundwater and to implement measures to reverse significant and sustained rising trends in pollutants in groundwater. Protected areas The Water Framework Directive brings together the planning processes of a range of other European Directives. These Directives, listed in Table 2 establish protected areas to manage water, nutrients, chemicals, economically significant species, and wildlife – and have been brought in line with the planning timescales of the Water Framework Directive. Meeting their requirements will also help achieve Water Framework Directive objectives. Table 2 Other Directives and their Water Framework Directive protected areas
Directive Protected area Number of protected areas Bathing Waters Recreational waters 22 Birds Natura 2000 sites (water dependent
special protection areas) 7
Drinking Water Drinking water protected areas 167 Freshwater Fish Waters for the protection of economically
significant aquatic species 1273
Shellfish Waters Waters for the protection of economically significant aquatic species
1
Habitats Natura 2000 sites (water dependent special areas of conservation)
26
Nitrates Nitrate Vulnerable Zones 81% of river basin district area
Urban Waste Water Treatment
Sensitive areas 21
Achieving the objectives of these protected areas is a priority for action in this plan. Annex D sets out their objectives and the actions required for Natura 2000 sites and the new Drinking Water Protected Areas required under the Directive. Annex C describes the actions required for all protected areas. In addition, there are two new daughter Directives (Groundwater and Environmental Quality Standards) that will be used to implement specific parts of the Water Framework Directive.
Environment Agency River Basin Management Plan, Humber River Basin District 15 Main document December 2009
4 The state of the water environment now The current status classification is the baseline from which improvements and the ‘no deterioration in status' objective of the Water Framework Directive is measured. The current status classification has been updated since the draft plan. It is different to that presented in the draft plan because: • the quality of assessments has been improved by refining classification methods; • the accuracy of individual assessment tools has improved, especially for fish; • a number of water bodies that were identified as potentially being heavily modified have
not been designated as such in this plan because monitoring shows that they currently achieve good status;
• improvements from the water companies’ Periodic Review 2004 have now been factored in;
• an additional two rivers, 40 lakes and one estuary have been classified that were previously unassessed.
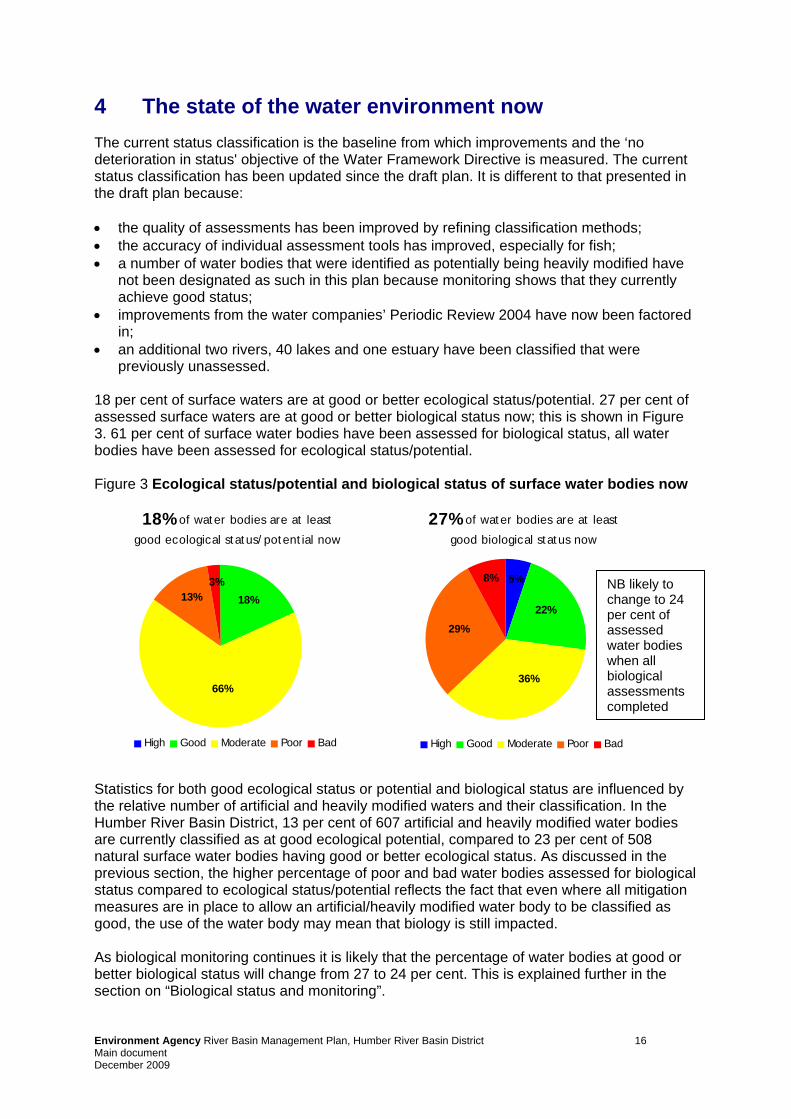
18 per cent of surface waters are at good or better ecological status/potential. 27 per cent of assessed surface waters are at good or better biological status now; this is shown in Figure 3. 61 per cent of surface water bodies have been assessed for biological status, all water bodies have been assessed for ecological status/potential. Figure 3 Ecological status/potential and biological status of surface water bodies now
18% of water bodies are at least
good ecological status/potential now
3%13% 18%
66%
High Good Moderate Poor Bad
27% of water bodies are at least
good biological status now
36%
22%
29%
5%8%
High Good Moderate Poor Bad
NB likely to change to 24 per cent of assessed water bodies when all biological assessments completed
Statistics for both good ecological status or potential and biological status are influenced by the relative number of artificial and heavily modified waters and their classification. In the Humber River Basin District, 13 per cent of 607 artificial and heavily modified water bodies are currently classified as at good ecological potential, compared to 23 per cent of 508 natural surface water bodies having good or better ecological status. As discussed in the previous section, the higher percentage of poor and bad water bodies assessed for biological status compared to ecological status/potential reflects the fact that even where all mitigation measures are in place to allow an artificial/heavily modified water body to be classified as good, the use of the water body may mean that biology is still impacted. As biological monitoring continues it is likely that the percentage of water bodies at good or better biological status will change from 27 to 24 per cent. This is explained further in the section on “Biological status and monitoring”.
Environment Agency River Basin Management Plan, Humber River Basin District 16 Main document December 2009

For groundwater bodies, currently 60 per cent are at good or better quantitative status. 54 per cent are at good chemical status. Reasons for not achieving good status or potential This section takes a closer look at rivers. The majority of management actions in the first river basin management cycle will be applied to rivers. Reasons for not achieving good status or potential in other surface waters are being investigated. The first course of action for lakes, coasts and estuaries is to develop a better understanding of the issues. To identify what needs to be done to improve the environment, the reasons for not achieving good status need to be understood. The main reasons most frequently identified by Environment Agency staff using monitoring data and their knowledge and experience of individual water bodies are shown in Table 3. Each relates to one or more pressures, which in turn impact on elements of the classification. The reasons for failure include point source discharges from water industry sewage works, diffuse source pollution from agriculture, abstraction, mine waters and a range of reasons due to physical modifications. The actions in this plan will increase the number of waters achieving good status or potential, for example through significant investment in improving discharges from sewage works and changes to land management practices. Even if good status is not completely achieved, they will also lead to improvements to the key elements impacted. Table 3 Main reasons (where known) for not achieving good ecological status or potential Reason for Failure Key elements impacted
Point source water industry sewage works ammonia, diatoms, fish, invertebrates, phosphate Diffuse source agricultural diatoms, fish, invertebrates, phosphate Point source water industry storm discharge
ammonia, diatoms, fish, invertebrates, phosphate
Physical modification urbanisation fish, invertebrates, mitigation measures for morphology Physical modification flood protection fish, invertebrates, mitigation measures for morphology Physical modification water storage and supply (including for power generation)
mitigation measures for morphology
Physical modification land drainage fish, invertebrates, mitigation measures for morphology Diffuse source mixed urban run-off diatoms, fish, invertebrates, phosphate Physical modification barriers to fish migration
fish
Point source industry - non water industry fish, invertebrates It is important to note that because classification involves a wider range of elements than previous monitoring schemes, and many of the key pressures are complex and occur in combination, we often do not know the reason for a failure. For many water bodies either the reasons for failure are unknown, or it is uncertain whether there is a failure or whether pressures really are causing an impact. In these cases we will need to investigate, as discussed in the “Investigations – improving outcomes for 2015” in Section6. For groundwater quality, the main reasons for poor status are high or rising nitrate concentrations with failures for pesticides and chemicals associated with mine working. The main reason for poor quantitative status is that abstraction levels – mainly for drinking water – exceed the rate at which aquifers recharge. The plan identifies a range of actions to prevent deterioration and improve groundwater elements, as well as investigations to improve the confidence in groundwater classification.
Environment Agency River Basin Management Plan, Humber River Basin District 17 Main document December 2009

Classification of individual elements For rivers, which comprise the majority of water bodies in the river basin district, the main elements indicating that the standards for good ecological status/potential are not being achieved are fish, invertebrates and phosphate. This is shown in Figure 4. The results for macrophytes (aquatic plants) and diatoms (microscopic algae) are from relatively fewer water body assessments based on a new (2007) risk based monitoring programme. However, as would be expected, the results for these elements, particularly diatoms, confirm the presence of pressures on biology in many of the assessed water bodies. Figure 4 Proportion of assessed river water bodies in each status class, by element (numbers above bars indicate total number of water bodies assessed)
0%10%20%30%40%50%60%70%80%90%
100%
Diat
oms
Mac
roph
ytes
Inve
rteb
rate
s
Fish
Diss
olve
d Ox
ygen
Amm
onia pH
Phos
phat
eTe
mpe
ratu
reSp
ecifi
c Po
lluta
nts
Prio
rity
Sub
stan
ces
High Good Moderate Poor Bad
121 502 390 753 753 744 752 753 755 14031 Excessive sediment is a possible cause for biology not being good in a number of water bodies. At present however, standards are not available to identify clearly where sedimentation is excessive. The Environment Agency will be developing techniques to assess the impact of sedimentation as one of the actions in this plan.
Environment Agency River Basin Management Plan, Humber River Basin District 18 Main document December 2009
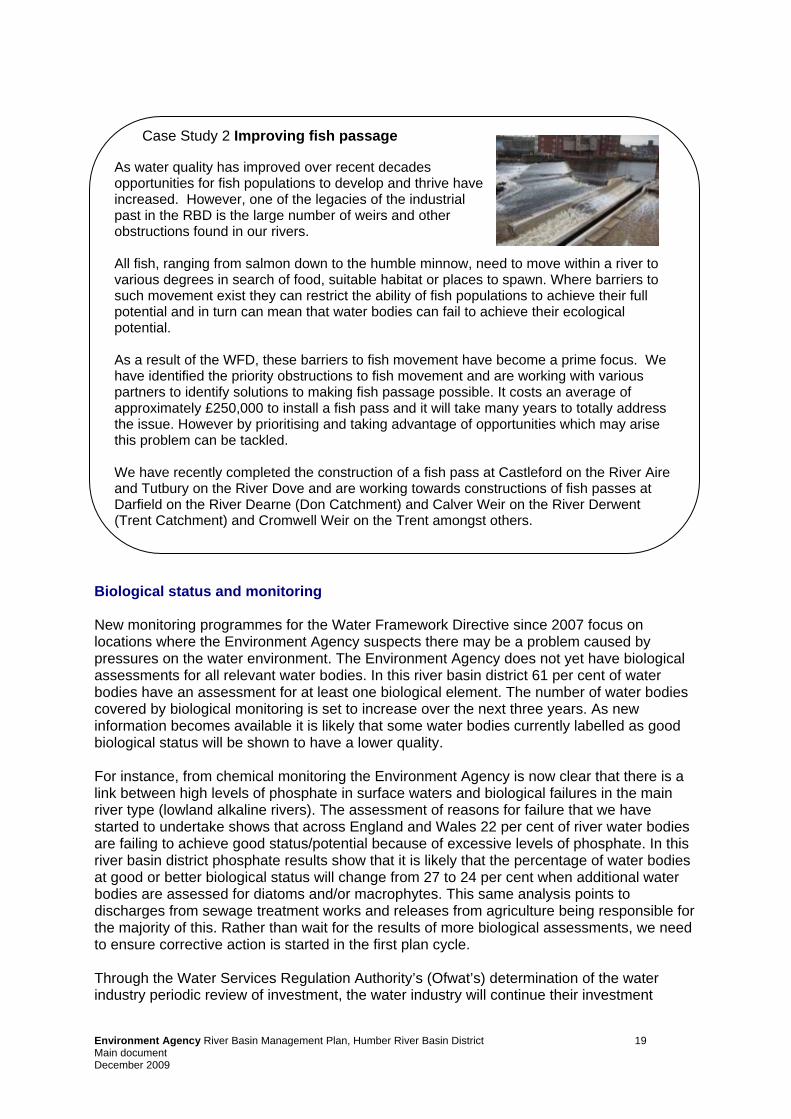
Case Study 2 Improving fish passage As water quality has improved over recent decades opportunities for fish populations to develop and thrive have increased. However, one of the legacies of the industrial past in the RBD is the large number of weirs and other obstructions found in our rivers. All fish, ranging from salmon down to the humble minnow, need to move within a river to various degrees in search of food, suitable habitat or places to spawn. Where barriers to such movement exist they can restrict the ability of fish populations to achieve their full potential and in turn can mean that water bodies can fail to achieve their ecological potential. As a result of the WFD, these barriers to fish movement have become a prime focus. We have identified the priority obstructions to fish movement and are working with various partners to identify solutions to making fish passage possible. It costs an average of approximately £250,000 to install a fish pass and it will take many years to totally address the issue. However by prioritising and taking advantage of opportunities which may arise this problem can be tackled. We have recently completed the construction of a fish pass at Castleford on the River Aire and Tutbury on the River Dove and are working towards constructions of fish passes at Darfield on the River Dearne (Don Catchment) and Calver Weir on the River Derwent (Trent Catchment) and Cromwell Weir on the Trent amongst others.
Biological status and monitoring New monitoring programmes for the Water Framework Directive since 2007 focus on locations where the Environment Agency suspects there may be a problem caused by pressures on the water environment. The Environment Agency does not yet have biological assessments for all relevant water bodies. In this river basin district 61 per cent of water bodies have an assessment for at least one biological element. The number of water bodies covered by biological monitoring is set to increase over the next three years. As new information becomes available it is likely that some water bodies currently labelled as good biological status will be shown to have a lower quality. For instance, from chemical monitoring the Environment Agency is now clear that there is a link between high levels of phosphate in surface waters and biological failures in the main river type (lowland alkaline rivers). The assessment of reasons for failure that we have started to undertake shows that across England and Wales 22 per cent of river water bodies are failing to achieve good status/potential because of excessive levels of phosphate. In this river basin district phosphate results show that it is likely that the percentage of water bodies at good or better biological status will change from 27 to 24 per cent when additional water bodies are assessed for diatoms and/or macrophytes. This same analysis points to discharges from sewage treatment works and releases from agriculture being responsible for the majority of this. Rather than wait for the results of more biological assessments, we need to ensure corrective action is started in the first plan cycle. Through the Water Services Regulation Authority’s (Ofwat’s) determination of the water industry periodic review of investment, the water industry will continue their investment
Environment Agency River Basin Management Plan, Humber River Basin District 19 Main document December 2009
programme targeted at addressing their contribution to phosphate pollution. It is important that agriculture also makes a contribution in the first cycle improvements. The Environment Agency is now working with the main farming groups to understand better the main ways in which phosphate from land enters and is transported in water bodies. Farming groups have agreed to use this information to encourage individual farmers to take action to reduce their contribution to water pollution. We will trial this new approach in the Anglian River Basin District and through the Campaign for Farmed Environment. We will also look at what the advice and incentives available through agri-environment schemes and the England Catchment Sensitive Farming Delivery Initiative can do to reduce phosphate pollution of water and wetlands. In parallel with this approach, the Environment Agency will continue to develop work on regulatory measures, such as piloting Water Protection Zones (WPZs) so that if voluntary approaches are shown not to work in a particular area, or where higher environmental standards are needed in for example protected areas, we are ready and able to ensure progress is made before 2015. The work to identify the ways in which phosphate enters water bodies and the means of reducing this will inform the measures that might be applied in WPZs. WPZs will only be effective if the means of control have been clearly identified.
Environment Agency River Basin Management Plan, Humber River Basin District 20 Main document December 2009
5 Actions to improve the water environment by 2015 The following gives an overview of the key contributions from sectors and organisations that the Environment Agency will work with to implement this plan. All sectors Agriculture and rural land management Angling, fisheries and conservation Central government Environment Agency Industry, manufacturing and other business Local and regional government Mining and quarrying Navigation Urban and transport Water industry Individuals and communities. These actions are summarised versions of the full programme of actions that can be found in Annex C. The lead organisation for each action is given in brackets. Note that many actions will involve more than one sector and need to be implemented in partnership. Actions in Annex C are therefore duplicated across the relevant sectors. Sectors are encouraged to put further actions forward during the implementation of this plan. After the action tables there are sections on: Actions to protect drinking water The costs of action in this plan Taking action in a changing climate Working with other plans and programmes All sectors All sectors must comply with the range of existing regulations, codes of practice and controls on the use of certain substances. Investigations will be carried out by the Environment Agency and partner organisations where appropriate, to establish the extent and source of pressures and to identify any further actions that are technically feasible and not disproportionately costly. These actions will be carried out during this or future management cycles. Investigations and actions will also be carried out in drinking water protected areas (where necessary focused in safeguard zones) to reduce the risk of deterioration in raw water quality and therefore reduce the need for additional treatment to meet drinking water standards. A small number of candidate Water Protection Zones (WPZ) will be promoted nationally early in the first plan cycle, where there is clear evidence that voluntary mechanisms such as the England Catchment Sensitive Farming Delivery Initiative and pollution prevention campaigns are not sufficient by themselves to achieve the required environmental objectives. The candidate WPZs will be used to establish the usefulness of the concept, but as said earlier in describing the results of the biological monitoring, this in turn relies on a clear understanding of the practices causing problems and the techniques to avoid them.
Environment Agency River Basin Management Plan, Humber River Basin District 21 Main document December 2009
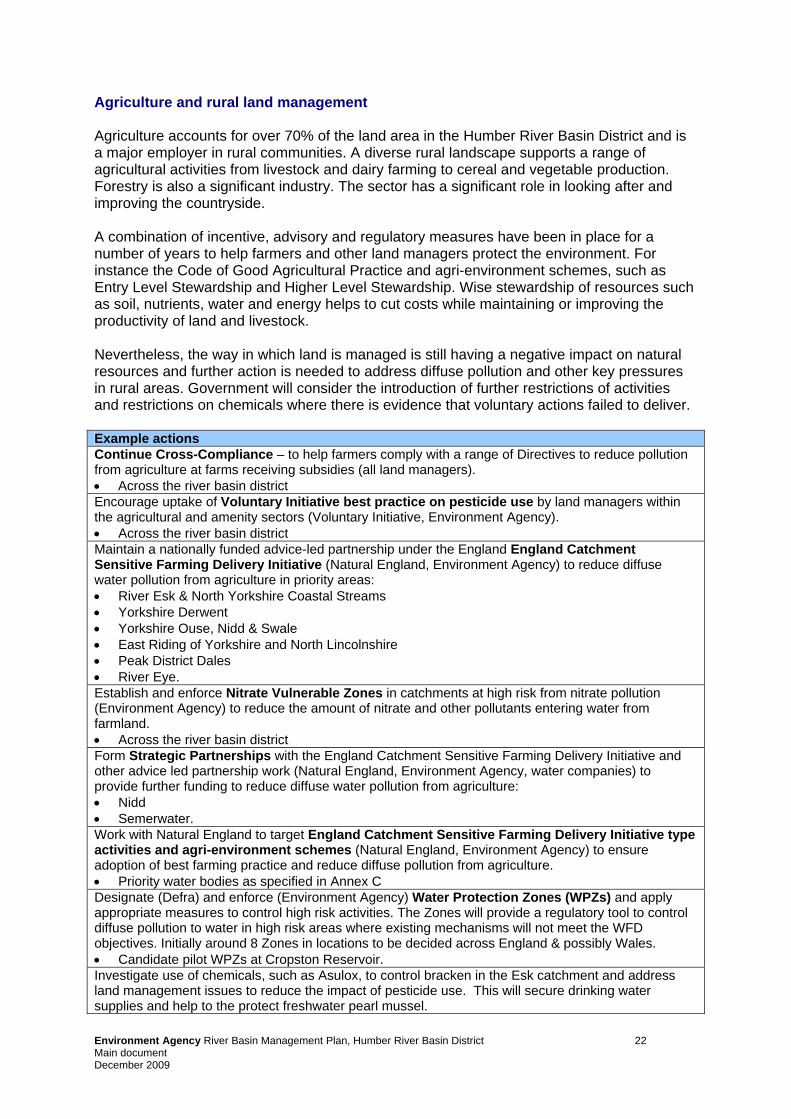
Agriculture and rural land management Agriculture accounts for over 70% of the land area in the Humber River Basin District and is a major employer in rural communities. A diverse rural landscape supports a range of agricultural activities from livestock and dairy farming to cereal and vegetable production. Forestry is also a significant industry. The sector has a significant role in looking after and improving the countryside. A combination of incentive, advisory and regulatory measures have been in place for a number of years to help farmers and other land managers protect the environment. For instance the Code of Good Agricultural Practice and agri-environment schemes, such as Entry Level Stewardship and Higher Level Stewardship. Wise stewardship of resources such as soil, nutrients, water and energy helps to cut costs while maintaining or improving the productivity of land and livestock. Nevertheless, the way in which land is managed is still having a negative impact on natural resources and further action is needed to address diffuse pollution and other key pressures in rural areas. Government will consider the introduction of further restrictions of activities and restrictions on chemicals where there is evidence that voluntary actions failed to deliver. Example actions Continue Cross-Compliance – to help farmers comply with a range of Directives to reduce pollution from agriculture at farms receiving subsidies (all land managers). • Across the river basin district Encourage uptake of Voluntary Initiative best practice on pesticide use by land managers within the agricultural and amenity sectors (Voluntary Initiative, Environment Agency). • Across the river basin district Maintain a nationally funded advice-led partnership under the England England Catchment Sensitive Farming Delivery Initiative (Natural England, Environment Agency) to reduce diffuse water pollution from agriculture in priority areas: • River Esk & North Yorkshire Coastal Streams • Yorkshire Derwent • Yorkshire Ouse, Nidd & Swale • East Riding of Yorkshire and North Lincolnshire • Peak District Dales • River Eye. Establish and enforce Nitrate Vulnerable Zones in catchments at high risk from nitrate pollution (Environment Agency) to reduce the amount of nitrate and other pollutants entering water from farmland. • Across the river basin district Form Strategic Partnerships with the England Catchment Sensitive Farming Delivery Initiative and other advice led partnership work (Natural England, Environment Agency, water companies) to provide further funding to reduce diffuse water pollution from agriculture: • Nidd • Semerwater. Work with Natural England to target England Catchment Sensitive Farming Delivery Initiative type activities and agri-environment schemes (Natural England, Environment Agency) to ensure adoption of best farming practice and reduce diffuse pollution from agriculture. • Priority water bodies as specified in Annex C Designate (Defra) and enforce (Environment Agency) Water Protection Zones (WPZs) and apply appropriate measures to control high risk activities. The Zones will provide a regulatory tool to control diffuse pollution to water in high risk areas where existing mechanisms will not meet the WFD objectives. Initially around 8 Zones in locations to be decided across England & possibly Wales. • Candidate pilot WPZs at Cropston Reservoir. Investigate use of chemicals, such as Asulox, to control bracken in the Esk catchment and address land management issues to reduce the impact of pesticide use. This will secure drinking water supplies and help to the protect freshwater pearl mussel.
Environment Agency River Basin Management Plan, Humber River Basin District 22 Main document December 2009

Example actions Encourage farmers to build winter storage reservoirs where appropriate. The Environment Agency has recently produced a guide to building water storage reservoirs. This will be used to promote the uptake of grants within priority catchments. Forest Research has undertaken a mapping exercise in Yorkshire to identify suitable areas of flood plain for woodland planting to deliver benefits for flood risk and water quality. Woodland can help to increase surface water infiltration and also reduce flooding. Angling, fisheries and conservation The angling and conservation sector has a large role to play in delivering local ‘on the ground’ improvements to the water environment as well as working to establish new mechanisms. It engages communities and individuals, building on their skills and experience and actively involves them in making these improvements. Angling is a popular pastime that can provide local intelligence on environmental quality – over 231,000 rod licences are sold each year in Humber River Basin District. Many environmental organisations can influence environmental quality through the land they own or manage. Riparian owners have specific responsibility for the management of their watercourses so their support, involvement and investment in implementing the actions are crucial. Example actions Promote existing codes of practice and guidance to the public and / or industry and trade to minimise the spread of invasive non-native species. For example, "All Choked Up" information postcard for garden centres and the Environment Agency information "Guidance for the control of non-native invasive weeds in or near fresh water". Installation of eel passes at sites identified within the Humber eel management plan. Trent Rivers Trust is using the Passport Fishing Scheme on the Upper Dove, with plans for expansion. The scheme works with farmers to develop new sites for fishing. Anglers purchase tokens to access sites and farmers exchange tokens for cash payment. Lincolnshire Chalk Streams project in Lincolnshire Wolds where a project officer works with landowners to re-naturalise streams, reintroducing meanders, riffles and buffers East Midlands Strategic River Corridors Project. Taking a holistic approach to management and enhancement of river corridors to benefit people, wildlife and management of flood risk. Central government Government will continue to influence the development of European legislation to help bring forward initiatives that protect and improve the water environment, and that are technically feasible and not disproportionately costly. Defra are considering further policy options to help improve ambition in achieving objectives in this first plan cycle. These include controls on phosphate in detergents, tackling misconnections, general binding rules, a code of practice on septic tanks and options to increase the use of sustainable drainage systems to reduce risks of flooding and pollution of surface waters during periods of high rainfall. The Environment Agency, Forestry Commission, Natural England and the Marine and Fisheries Agency (to become the Marine Management Organisation) are the key government agencies for this plan. The agencies will work together on relevant actions. Example actions Offer tax incentives for the purchase of efficient plant and fittings by commercial organisations to reduce water demand (Defra). • Nationally Disseminate and develop species identification guides and train key groups, to improve early detection of invasive non-native species (Natural England). • Nationally
Environment Agency River Basin Management Plan, Humber River Basin District 23 Main document December 2009

Example actions Work to increase awareness of the implications of WFD and promote sustainable drainage systems in new and existing developments, re-use of grey and storm water and the value of green infrastructure in urban developments. • Across the river basin district Implement the water related actions of the Invasive Non-native Species Framework Action Plan for Great Britain (Defra, Environment Agency). • Nationally Environment Agency The Environment Agency is the Government’s lead agency for implementing the Water Framework Directive. We will continue to monitor, provide advice on and manage improvements to the water environment. We regulate discharges to and abstraction from the water environment by issuing and enforcing environmental permits and licences. Where necessary we take enforcement action against those who act illegally and damage or put at risk the water environment. We also have responsibility to make sure there is enough water to meet the needs of industry, agriculture and wider society in the future. We will work closely with all sectors to learn from them, build on existing knowledge and to develop a shared commitment to implementing environmental improvements. Example actions Continue and develop a monitoring programme, to maintain our understanding of the state of the water environment (Environment Agency). • Across the river basin district Run local pollution prevention campaigns (Environment Agency) to raise awareness of the need for responsible handling and disposal of chemicals, oil and other pollutants. • Specified water bodies identified at risk, such as safeguard zones Action to reduce the physical impacts of flood risk management activities in artificial or heavily modified water bodies (Environment Agency). • Waters specified in Annex C The Environment Agency has identified priority artificial obstructions on the Rivers Wharfe, Aire, Trent, Calder, Don, Derwent, Ure, Esk, Idle, Torne, Dove and Soar. The Environment Agency will seek funding and opportunity to improve passage either through provision of fish passes or removal of obstructions (starting with Boston Spa (River Wharfe) and Darfield (River Don) by 2010). The Environment Agency will take an opportunistic approach to removing other artificial obstructions to fish migration as funds and opportunities permit. Other organisations may also take action on obstructions. Consider removing or amending the operation of barrages where appropriate to improve ecology and amenity value. For example consider operation of Barmby Barrage as part of the Yorkshire River Derwent Restoration Project. Improve the impact from diffuse organic pollution through a better understanding of source apportionment. Industry, manufacturing and other business Key economic sectors in the region include business services, health, wholesale and distribution. Manufacturing (particularly metals) is an important contributor to the economy of the Humber River Basin District, but has been declining in recent years. Historically mining and quarrying for coal and other minerals was a huge industry across the region. Today, mineral extraction is less widespread, although there are important exceptions including a few surviving deep coal mines. Although agriculture only makes up a small part of the regional economy, it is a critical element of the rural economy. The activities of these businesses can directly or indirectly affect the water environment.
Environment Agency River Basin Management Plan, Humber River Basin District 24 Main document December 2009
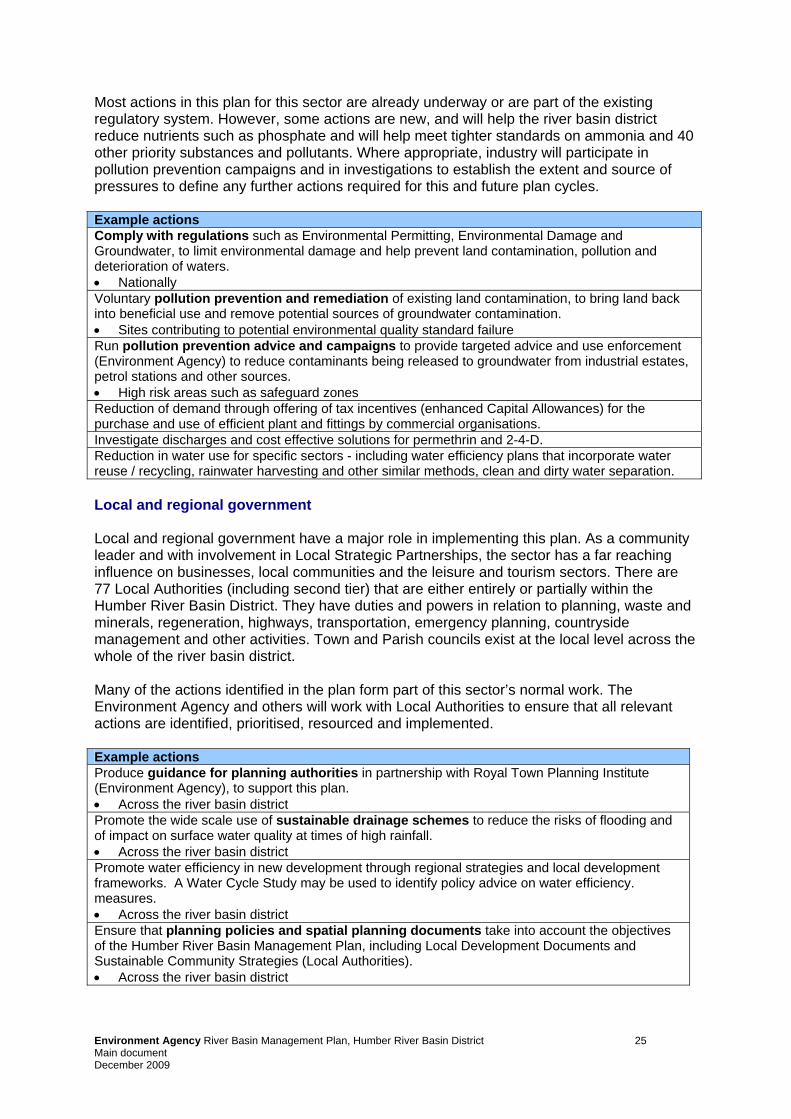
Most actions in this plan for this sector are already underway or are part of the existing regulatory system. However, some actions are new, and will help the river basin district reduce nutrients such as phosphate and will help meet tighter standards on ammonia and 40 other priority substances and pollutants. Where appropriate, industry will participate in pollution prevention campaigns and in investigations to establish the extent and source of pressures to define any further actions required for this and future plan cycles. Example actions Comply with regulations such as Environmental Permitting, Environmental Damage and Groundwater, to limit environmental damage and help prevent land contamination, pollution and deterioration of waters. • Nationally Voluntary pollution prevention and remediation of existing land contamination, to bring land back into beneficial use and remove potential sources of groundwater contamination. • Sites contributing to potential environmental quality standard failure Run pollution prevention advice and campaigns to provide targeted advice and use enforcement (Environment Agency) to reduce contaminants being released to groundwater from industrial estates, petrol stations and other sources. • High risk areas such as safeguard zones Reduction of demand through offering of tax incentives (enhanced Capital Allowances) for the purchase and use of efficient plant and fittings by commercial organisations. Investigate discharges and cost effective solutions for permethrin and 2-4-D. Reduction in water use for specific sectors - including water efficiency plans that incorporate water reuse / recycling, rainwater harvesting and other similar methods, clean and dirty water separation. Local and regional government Local and regional government have a major role in implementing this plan. As a community leader and with involvement in Local Strategic Partnerships, the sector has a far reaching influence on businesses, local communities and the leisure and tourism sectors. There are 77 Local Authorities (including second tier) that are either entirely or partially within the Humber River Basin District. They have duties and powers in relation to planning, waste and minerals, regeneration, highways, transportation, emergency planning, countryside management and other activities. Town and Parish councils exist at the local level across the whole of the river basin district. Many of the actions identified in the plan form part of this sector’s normal work. The Environment Agency and others will work with Local Authorities to ensure that all relevant actions are identified, prioritised, resourced and implemented. Example actions Produce guidance for planning authorities in partnership with Royal Town Planning Institute (Environment Agency), to support this plan. • Across the river basin district Promote the wide scale use of sustainable drainage schemes to reduce the risks of flooding and of impact on surface water quality at times of high rainfall. • Across the river basin district Promote water efficiency in new development through regional strategies and local development frameworks. A Water Cycle Study may be used to identify policy advice on water efficiency. measures. • Across the river basin district Ensure that planning policies and spatial planning documents take into account the objectives of the Humber River Basin Management Plan, including Local Development Documents and Sustainable Community Strategies (Local Authorities). • Across the river basin district
Environment Agency River Basin Management Plan, Humber River Basin District 25 Main document December 2009
Example actions Develop and provide sustainable water management planning guidance (Environment Agency), to ensure that the impacts of development on the water environment are fully understood. • Across the river basin district Action to reduce the physical impacts of urban development in artificial or heavily modified waters, to help waters reach good ecological potential (Local Authorities). • Waters specified in Annex C Implement surface water management plans, increasing resilience to surface water flooding and ensuring water quality is considered on a catchment basis (Environment Agency, Local Authorities). • Across the river basin district Promote the use of sustainable drainage systems in new urban and rural development where appropriate, and retrofit in priority areas including highways where possible (Environment Agency, Local Authorities). • Across the river basin district Mining and quarrying This sector has some current operations in this river basin district, and a legacy from historic mining throughout the river basin district. Water quality can be undermined by the silting of watercourses from mining and quarrying operations, by discharges of minewater and by workings below the water table. Examples of work needed to reduce pollution includes identifying sustainable treatment methods for minewaters from metal mines, cleaning up pollution from abandoned mines and introducing new technologies to recover energy and other resources from mine water and treatment residues. Example actions Investigate emissions from working sites and appraise options of best practice controls at mines and quarries to ensure environmental quality standards are met (Operators). • Sites contributing to potential environmental quality standard failure Establish a non coal mine strategy for the RBD to address environmental risk. Pilot remediation works for example Welsh Metal Mine Strategy. Highlight benefits and promote development into a national programme over future cycles. Riverside gravel pit operation to be modified wherever possible in collaboration with gravel companies and in agreement with Local Authorities to include river restoration as part of works. For example, the On Trent and Central Rivers Initiatives links wetlands through strategic restoration of sand and gravel quarries to establish a north -south corridor for species. Navigation Ports, harbours and marinas are essential for economic prosperity. Many navigation and port authorities have already done a great deal to help improve ecology and water quality and some harbours are home to internationally important wildlife. Careful planning will be needed to ensure that waters remain navigable whilst at the same time water quality is protected and improved. Proposals to build new ports or expand existing ones need to take sustainable water management goals into account. Physical changes are permitted to waters for navigation but only if certain conditions are met. Example actions Ban on TBT use on ship hulls unless there is a coating to prevent leaching of underlying TBT anti-foulants, to prevent or limit pollution in marine waters (Marine and Fisheries Agency, others). • Nationally
Environment Agency River Basin Management Plan, Humber River Basin District 26 Main document December 2009

Example actions Develop a dredging and disposal framework (Ports sector), which will provide guidance to all those undertaking or permitting navigation dredging and dredged material disposal activities to assist in achieving the statutory objectives of the Water Framework Directive and related Environmental Quality Standards Directive (2008/105/EEC). • Nationally (England) Ports, harbours and navigation authorities to prepare a dredging and disposal strategy, such as the baseline document recommended under the Maintenance Dredging Protocol. Urban & transport Development and regeneration is a major opportunity to improve the water environment. However, when poorly planned or designed, urban and transport infrastructure can adversely impact on water quality or water resources. The Environment Agency and others want to work with the urban and transport sector to achieve an urban water environment rich in wildlife that local communities can benefit from and enjoy. A good quality water environment has the potential to help economic regeneration and to enhance the economic and social amenity value of developments, and improve the quality of life in cities, towns and villages. Spatial planning and design for urban development and infrastructure should aim to reduce surface water run off; protect and restore habitats; improve the quality of rivers, coastal waters, and groundwater, and thus protect drinking water supplies and bathing areas. The release of toxic pollutants that harm the water environment also needs to be reduced. Example actions Encourage uptake of Voluntary Initiative best practice on pesticide use by land managers within the agricultural and amenity sectors (Voluntary Initiative, Environment Agency). • Across the river basin district Action to reduce the physical impacts of urban development in artificial or heavily modified water bodies, to help waters reach good ecological potential (Local Authorities). • Waters specified in Annex C Support to investigate emissions from sites and pollution from contaminated land to reduce uncertainty and provide additional information (Industry). • Sites contributing to potential environmental quality standard failure Designate (Defra) and enforce (Environment Agency) Water Protection Zones and apply appropriate measures to control high risk activities The Zones will provide a regulatory tool to control diffuse pollution to water in high risk areas where existing mechanisms will not met the WFD objectives. • Candidate pilot at Cropston Reservoir Improved or more targeted street and drain cleaning and maintenance of storm water systems. For example, the Environment Agency and Highways Agency review of de-icing chemicals/materials to identify products with minimal environmental impact. Water industry Water companies are major partners in the management and protection of the water environment. The Environment Agency works with companies, consumers and government to ensure that the sector’s environmental work is planned and implemented in a way that is affordable for the public. Improvement of continuous and intermittent sewage effluent discharges and of water resources management will be carried out as part of the ongoing water industry asset management programme.
Environment Agency River Basin Management Plan, Humber River Basin District 27 Main document December 2009

The companies’ programme of work under the periodic review of water industry investment in 2009 will make a large contribution to meeting the objectives in this plan. This includes carrying out investigations, and specific improvement schemes to address water quality or water resources. In addition, specific actions will be carried out in drinking water protected areas to help safeguard drinking water supplies. Example actions Reduce leakage through active leakage control and customer supply pipe repair policies to help ensure sufficient water for people and wildlife (Water Companies). • Across the river basin district Complete the current round of water company asset investment to deliver water quality improvements and reduce the impact of abstraction (Water companies). • Rivers, coasts, estuaries and groundwaters across the river basin district Improvements to water company assets under the next round of company investment (Asset Management Programme – AMP5), to deliver water quality improvements and continue to reduce the impact of abstraction under a range of environmental Directives (Water Companies). • Rivers, coasts, estuaries and groundwater bodies across the river basin district Schools based education and awareness campaigns for sustainable water use, for example as done by Severn Trent in the Midlands. Reduction of demand through promotion of free household meters Raise awareness with householders, SME's and traders on the problems caused by what people put down their drains. Specifically on chemicals in products used; vehicle washing and disposal of fats, oils and greases. Individuals and communities Everyone can help protect and improve the water environment. Actions people can take include the following. To save water
in houses or offices • Turn off the tap when brushing teeth, and take short showers rather than baths. • Wash fruit and vegetables in a bowl rather than under the running tap - and use the
remainder on plants. • Install a 'hippo' or 'save-a-flush' in toilet cisterns. • Run dishwashers or washing machines with a full load on an economy setting, and boil
the minimum amount of water needed in kettles or saucepans. • Purchase low energy and low water use appliances. • Hand wash cars. • Ask water companies to fit a meter. This can reduce household water consumption. • Install a low-flush toilet, put flow regulators on taps and showers, and install waterless
urinals at work. • Consider installing grey-water recycling systems in homes or workplaces. This can save
one third of domestic mains water usage. in gardens • Choose plants that tolerate dry conditions. To help lawns through dry periods, don't cut
them too short. • To save water in gardens, collect rain in a water-butt, water at the beginning or end of the
day, mulch plants, and use watering cans where possible instead of sprinklers or hosepipes.
• Fix dripping taps, and lag pipes to avoid them bursting in freezing weather.
Environment Agency River Basin Management Plan, Humber River Basin District 28 Main document December 2009

To prevent pollution • Use kitchen, bathroom and car cleaning products that don't harm the environment, such
as phosphate-free laundry detergents, and use as little as possible. This helps prevent pollution.
• Take waste oil and chemicals such as white spirit to a municipal recycling facility: don't pour them down the sink or outside drains.
• Check that household appliances are connected to the foul sewer, not the surface water drain.
• Ensure septic tanks or private sewage treatment plants are well maintained and working effectively.
• Ensure household oil storage is in good condition, with an up-to-date inspection record. • Report pollution or fly-tipping to the Environment Agency on 0800 807060. To protect water dependent wildlife • Put cotton buds and other litter in the bin, not down the toilet. It may end up in the sea
where it can harm wildlife. • Eat fish from sustainable sources, caught using fishing methods that don't cause damage
to marine wildlife and habitats. • Eliminate invasive non-native species from gardens, disposing of them responsibly. • Adopt-a-beach to help keep beaches clean of litter than can harm wildlife and cause
pollution. • Join a river group to spot pollution, invasive non-native species, and take part in practical
tasks. Actions to protect drinking water Drinking water supplied to households by water companies is of high quality and complies with strict standards enforced by the Drinking Water Inspectorate. Where water is abstracted from a water body for human consumption, the water body is designated as a Drinking Water Protected Area (DrWPA) – additional objectives apply and where necessary, additional action is put in place to protect the quality of the raw water abstracted. Where the Environment Agency are reasonably confident that the DrWPA objective is at high risk of not being complied with, a Safeguard Zone has been identified. In the Safeguard Zone additional actions will take place. These may include voluntary agreements, pollution prevention campaigns and targeted enforcement action of existing legislation. Additional monitoring is taking place to assess whether those DrWPAs currently not assessed at high risk, need a Safeguard Zone and additional action taken. In parallel with this approach, the Environment Agency will continue to develop work on regulatory measures, such as piloting Water Protection Zones in England. If voluntary approaches are shown not to work in a Safeguard Zone, we are ready and able to ensure progress is made before 2015. The costs of action in this plan Overall the Environment Agency estimate that the cost for implementing the actions in the Humber River Basin Management Plan will be £186 million annually. A significant proportion of this cost relates to existing measures. The existing measures are mainly required to fulfil the requirements of earlier EC Directives and are defined as the Reference Case in the Impact Assessment.
Environment Agency River Basin Management Plan, Humber River Basin District 29 Main document December 2009

There are new measures in the plan which we estimate to cost £27 million with a benefit of £16 million. In addition, investigations will be carried out that will help to identify the additional measures necessary in future planning cycles. The new measures are defined as the Policy Option in the Impact Assessment. Further information on the approach used to assess the costs and benefits is contained in the Impact Assessment. Taking action in a changing climate The UK’s Climate Projections (UKCP09) show that this region is likely to experience hotter drier summers, warmer wetter winters and rising sea levels. This is likely to have a significant effect on environmental conditions and will increase the impact of human activity on the water environment. Table 4 shows the likely effects of climate change on known pressures and the risk they pose on the water environment in the river basin district. It is essential that the actions in this plan take account of the likely effects of climate change. What is done now must not make it harder to deal with problems in the future. Most actions in this plan will remain valid as the climate changes. Others can be adapted to accommodate climate change. Table 4 Qualitative assessment of increased risk from climate change by 2050 and beyond Pressure Increased risk Abstraction and other artificial flows Very high Nutrients (nitrogen and phosphate) High Sediment High Physical modification Medium Biological (invasive non-native species) Medium Microbiology (including organisms indicating presence of faeces) Medium Organic pollution (sanitary determinands) Medium Salinity Medium Biological (fisheries management) Low/Medium Acidification Low: freshwater
Medium/High: marine waters
Priority substances, priority substances and specific pollutants (including pesticides)
Low
Temperature of point source discharges Low It is important to assess the carbon implications of the plans to avoid adding unnecessary carbon dioxide burdens that could increase the problem of climate change. The carbon costs associated with actions in the water industry Periodic Review 2009 (PR09) have been quantified. This is where the most significant carbon impacts will occur as the actions will require additional water treatment, construction of new works or upgrades to existing sites. The approximate operational carbon implications of PR09 measures in England and Wales is approximately 4,722,000 tonnes per year at the start of the PR09 cycle (2009-10) and 4,564,200 tonnes per year at the end of the PR09 cycle (2014-2015). This does not include the carbon implications of constructing the schemes. These figures are from the water
Environment Agency River Basin Management Plan, Humber River Basin District 30 Main document December 2009

company plans and result from schemes to satisfy a number of existing drivers such as Urban Waste Water Directive and Bathing Waters Directive as well as the Water Framework Directive. In this river basin district, the operational carbon component driven by the additional requirement to meet good status under the Water Framework Directive is estimated , at this time, to be 387 tonnes per year. In the majority of cases this will be balanced by reductions elsewhere as part of the CRC Energy Efficiency Scheme (formally known as the Carbon Reduction Commitment). The CRC Energy Efficiency Scheme is a legally binding scheme, which covers large business and public sector organisations, and is intended to promote energy efficiency and help reduce carbon emissions. See www.decc.gov.uk for further information. The majority of other actions are likely to have a low impact as they are investigations, partnerships or encouraging best practice management. The potential impact of these can be assessed as the work is progressed. No organisation has sole responsibility for ensuring that society adapts successfully to the effects of climate change on the water environment. Most will be achieved by working together and in partnership. This river basin management process provides an excellent framework to help focus and co-ordinate activities. In particular it will allow action to be taken on existing pressures at sites that are at risk and where appropriate restore the natural characteristics of catchments to protect water quality, maintain water resources and reduce the risks of floods and droughts thus building resilience to the further impacts of climate change. Working with other plans and programmes A wide range of planning processes help ensure more sustainable management of the water environment. They are briefly described here. Development planning Development planning plays a key role in sustainable development and the Environment Agency will continue to work closely with planning authorities. We aim to ensure that planners understand the objectives of the Water Framework Directive and are able to translate them into planning policy. There are many planning processes and provisions involved. They include: • national guidance • Regional Spatial Strategies • Integrated Regional Strategies • Local Development Documents • local guidance (e.g. Supplementary Planning Documents). In the Humber River Basin District, there are already spatial plans which set out proposed levels of growth and development up to 2026. The Environment Agency aims to work with water companies and local government to assess the implications of housing growth on sewage treatment works discharges and consequently on receiving river water quality. Good development planning needs to consider a number of issues relevant to this plan, including housing locations, sewage treatment options, initiatives to reduce flow to sewage works, water efficiency measures and the reduction of nutrients from diffuse pollution. The Environment Agency and others will continue to work to help clarify the way forward. Environment Agency River Basin Management Plan, Humber River Basin District 31 Main document December 2009

Flood risk, coastal erosion planning There is a separate planning process for flood and coastal erosion risk management introduced by the new European Floods Directive (Directive 2007/60/EC) on the assessment and management of flood risks). This requires that the environmental objectives of the Water Framework Directive are taken into account in flood and coastal erosion plans. Implementation of the Floods Directive in England and Wales will be co-ordinated with the Water Framework Directive. The delivery plans and timescales for the two Directives will be closely aligned. Catchment Flood Management Plans (prepared by the Environment Agency) and Shoreline Management Plans (prepared by coastal Local Authorities and the Environment Agency) set out long term policies for flood risk management. The delivery of the policies from these long term plans will help to achieve the objectives of this and subsequent River Basin Management Plans. The Environment Agency plans its flood and coastal risk management capital investment through the ‘Medium Term Plan’, which is a rolling five-year investment plan. Using this, we have identified flood and coastal risk management activities that will deliver one or more restoration or mitigation measures included in this plan. Although these activities will be carried out for flood risk management purposes, they will be carried out in such a way to ensure any impacts are minimised and that ecology is protected. Activities will not lower water body status unless fully justified under Article 4.7 of the Water Framework Directive. Marine planning The Marine Strategy Framework Directive is closely linked with the Water Framework Directive and their application overlaps in estuaries and coasts. The Environment Agency is working with Defra, Welsh Assembly Government and others to ensure that the implementation of both Directives is fully integrated. Managing new physical modifications In specific circumstances the Water Framework Directive provides a defence for when, as a result of a new physical modification, good ecological status or potential cannot be achieved or where deterioration in status occurs. This is covered under Article 4.7 of the Directive. Although protecting the water environment is a priority, some new modifications may provide important benefits to human health, human safety and/or sustainable development. Such benefits can include: • public water supply • flood defence/alleviation • hydropower generation • navigation. It is often impossible to undertake such activities without causing deterioration of status to the water body. The benefits that such developments can bring need to be balanced against the social and economic benefits gained by maintaining the status of the water environment in England and Wales.
Environment Agency River Basin Management Plan, Humber River Basin District 32 Main document December 2009
The Environment Agency has developed a process for applying the tests and justifications required for such new modifications (Article 4.7) and will work with stakeholders to ensure these provisions are met during the first cycle of river basin management. Other planning processes The Environment Agency is also working to align planning processes in other areas. These include water resources and water quality, agriculture and rural development and natural heritage. Annex J provides further information about other planning processes.
Environment Agency River Basin Management Plan, Humber River Basin District 33 Main document December 2009
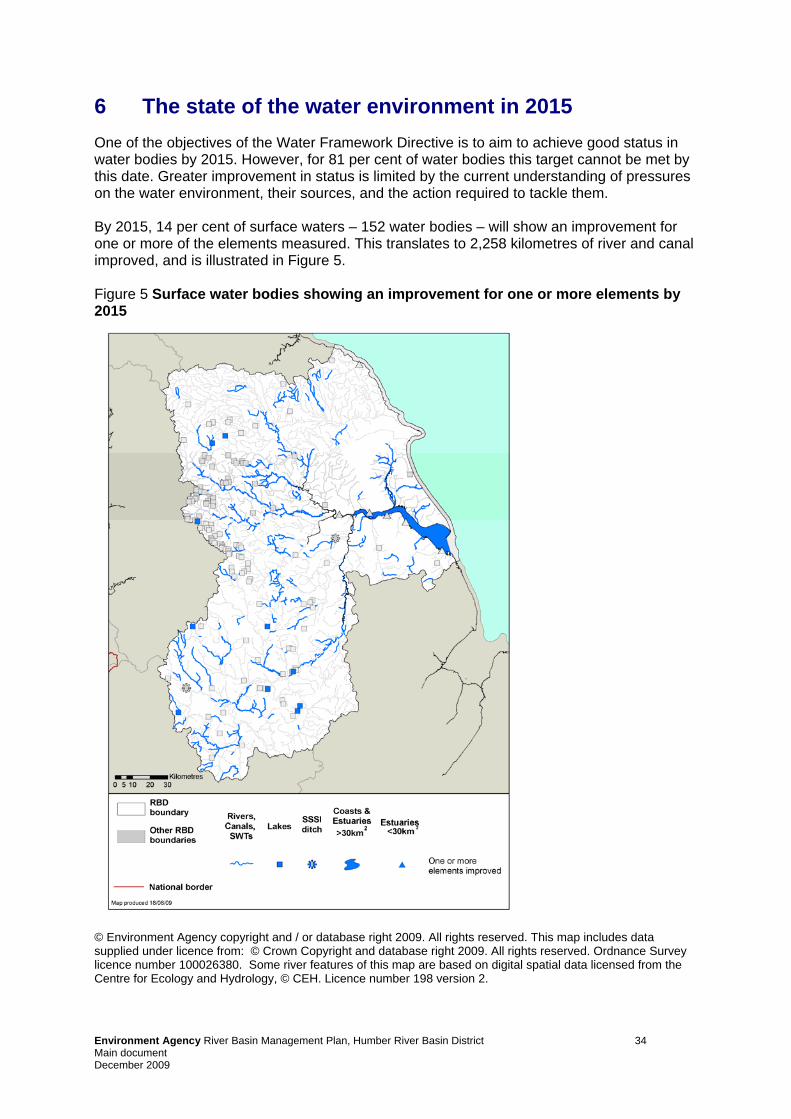
6 The state of the water environment in 2015 One of the objectives of the Water Framework Directive is to aim to achieve good status in water bodies by 2015. However, for 81 per cent of water bodies this target cannot be met by this date. Greater improvement in status is limited by the current understanding of pressures on the water environment, their sources, and the action required to tackle them. By 2015, 14 per cent of surface waters – 152 water bodies – will show an improvement for one or more of the elements measured. This translates to 2,258 kilometres of river and canal improved, and is illustrated in Figure 5. Figure 5 Surface water bodies showing an improvement for one or more elements by 2015
© Environment Agency copyright and / or database right 2009. All rights reserved. This map includes data supplied under licence from: © Crown Copyright and database right 2009. All rights reserved. Ordnance Survey licence number 100026380. Some river features of this map are based on digital spatial data licensed from the Centre for Ecology and Hydrology, © CEH. Licence number 198 version 2.
Environment Agency River Basin Management Plan, Humber River Basin District 34 Main document December 2009

There will be tangible benefits from meeting these objectives. For example, major investment in the water industry will continue to address problems such as the high levels of nutrients in sewage effluent. By 2015, these actions will have reduced phosphate in some surface water bodies, and improved the levels of dissolved oxygen vital for fish and other wildlife. As a result of action in this plan, ammonia – a chemical that can kill fish and other river life – will have been largely eliminated as a problem for rivers. Figure 6 and Figure 7 show what ecological and biological status will be for surface water bodies in 2015 compared to now. By 2015, 19 per cent will be in at least good ecological status/potential and 32 per cent of assessed surface waters will be in at least good biological status. A map showing predicted status for surface water bodies in 2015 is provided in Figure 9. Figures 10 and 11 show the predicted quantitative status and chemical status for groundwater in 2015. Figure 6 Ecological status/potential of surface water bodies now and in 2015
Figure 7 Biological status of surface water bodies now and in 2015
For the 607 artificial and heavily modified water bodies, 13 per cent will be in at least good ecological potential in 2015, compared to 25 per cent of 508 natural surface water bodies being at good or better ecological status.
18% of water bodies are at least
good ecological status/potential now
High Good Moderate Poor Bad
2015
1%12% 20
%
67%
High Moderate
19% of water bodies will be at least
good ecological status/potential in
High Good Moderate Poor Bad
19%
67%
12%
2%
3% 18%
66%
13%
27% of water bodies are at least 32% of water bodies will be at least
good biological status now
8% 5%
29%
22%
36%
good biological status in 2015
36%
27%27%
5%5%
High Good Moderate Poor Bad High Good Moderate Poor Bad
NB likely to change to 29 per cent of assessed water bodies when all biological assessments completed
NB likely to change to 24 per cent of assessed water bodies when all biological assessments completed
Environment Agency River Basin Management Plan, Humber River Basin District 35 Main document December 2009
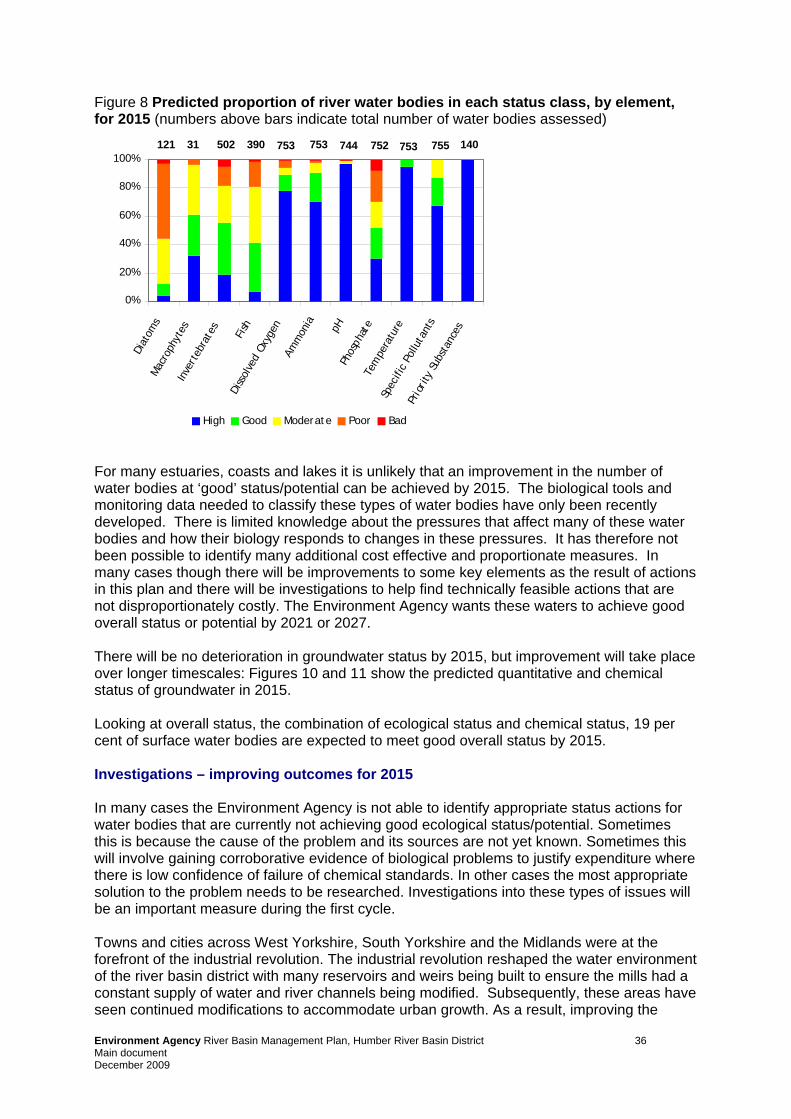
Figure 8 Predicted proportion of river water bodies in each status class, by element, for 2015 (numbers above bars indicate total number of water bodies assessed)
0%
20%
40%
60%
80%
100%
Diat
oms
Mac
roph
ytes
Inve
rteb
rate
s
Fish
Diss
olve
d Ox
ygen
Amm
onia pH
Phos
phat
eTe
mpe
ratu
reSp
ecifi
c Po
lluta
nts
Prio
rity
Sub
stan
ces
High Good Moderate Poor Bad
74475375339050231121 753752 755 140
For many estuaries, coasts and lakes it is unlikely that an improvement in the number of water bodies at ‘good’ status/potential can be achieved by 2015. The biological tools and monitoring data needed to classify these types of water bodies have only been recently developed. There is limited knowledge about the pressures that affect many of these water bodies and how their biology responds to changes in these pressures. It has therefore not been possible to identify many additional cost effective and proportionate measures. In many cases though there will be improvements to some key elements as the result of actions in this plan and there will be investigations to help find technically feasible actions that are not disproportionately costly. The Environment Agency wants these waters to achieve good overall status or potential by 2021 or 2027. There will be no deterioration in groundwater status by 2015, but improvement will take place over longer timescales: Figures 10 and 11 show the predicted quantitative and chemical status of groundwater in 2015. Looking at overall status, the combination of ecological status and chemical status, 19 per cent of surface water bodies are expected to meet good overall status by 2015. Investigations – improving outcomes for 2015 In many cases the Environment Agency is not able to identify appropriate status actions for water bodies that are currently not achieving good ecological status/potential. Sometimes this is because the cause of the problem and its sources are not yet known. Sometimes this will involve gaining corroborative evidence of biological problems to justify expenditure where there is low confidence of failure of chemical standards. In other cases the most appropriate solution to the problem needs to be researched. Investigations into these types of issues will be an important measure during the first cycle. Towns and cities across West Yorkshire, South Yorkshire and the Midlands were at the forefront of the industrial revolution. The industrial revolution reshaped the water environment of the river basin district with many reservoirs and weirs being built to ensure the mills had a constant supply of water and river channels being modified. Subsequently, these areas have seen continued modifications to accommodate urban growth. As a result, improving the
Environment Agency River Basin Management Plan, Humber River Basin District 36 Main document December 2009
status of almost two thirds of our water bodies will involve addressing a number of pressures, with just under one third of failing water bodies in the Humber River Basin District failing for three or more elements. The one out all out principle means that until all the pressures have been tackled the improvements that are made will not be reflected in a move to good status, but they are important steps towards achieving good status in the future. Where possible, investigations will take place before 2013 so that the results are known in time for the formal review of this plan by 2015. The Environment Agency has identified a significant number of surface water bodies that require investigations in this plan. A proportion of these will lead to actions that should be straightforward to put in place before 2015. The outcome of our detailed planning work is that we have confidence that 19 per cent of surface waters will be in good ecological status or potential by 2015. This is our formal target for this plan. Across England and Wales the Environment Agency have a formal target of achieving 31 per cent of surface waters in good ecological status or potential by 2015. Improvement to the water environment has to be managed as a continuum, not in isolated six year cycles. We are already confident in this river basin district that 14 per cent of surface waters will be improved by at least one element by 2015. We are also confident that a proportion of investigations will lead to action that we can put in place before 2015. To ensure we capture these additional opportunities, we will be ensuring that the Humber River Basin District makes its contribution to a goal of achieving up to 33 per cent of surface waters across England and Wales at good status or potential by 2015.
Environment Agency River Basin Management Plan, Humber River Basin District 37 Main document December 2009

Figure 9 Predicted status and potential for surface water bodies in 2015
© Environment Agency copyright and / or database right 2009. All rights reserved. This map includes data supplied under licence from: © Crown Copyright and database right 2009. All rights reserved. Ordnance Survey licence number 100026380. Some river features of this map are based on digital spatial data licensed from the Centre for Ecology and Hydrology, © CEH. Licence number 198 version 2.
Environment Agency River Basin Management Plan, Humber River Basin District 38 Main document December 2009

Figure 10 Predicted quantitative status for groundwater in 2015
© Environment Agency copyright and / or database right 2009. All rights reserved. This map includes data supplied under licence from: © Crown Copyright and database right 2009. All rights reserved. Ordnance Survey licence number 100026380 and BGS © NERC 2009.
Environment Agency River Basin Management Plan, Humber River Basin District 39 Main document December 2009

Figure 11 Predicted chemical status for groundwater in 2015
© Environment Agency copyright and / or database right 2009. All rights reserved. This map includes data supplied under licence from: © Crown Copyright and database right 2009. All rights reserved. Ordnance Survey licence number 100026380 and BGS © NERC 2009.
Environment Agency River Basin Management Plan, Humber River Basin District 40 Main document December 2009

7 Targets for subsequent cycles There are three river basin management cycles: 2009-2015, 2015-2021 and 2021-2027. Achieving good status in all water bodies by 2027 is a significant challenge. The information gained from investigations during the first cycle will help to accelerate improvement to known issues using both traditional and novel techniques in both second and third cycles. New issues will arise though. This plan sets out where good status cannot be achieved by 2015. This relates to 80 per cent of rivers, 85 per cent of lakes, 88 per cent of estuaries, 100 per cent of coastal waters and 68 per cent of groundwater. In these cases an alternative objective of good status or potential by 2021 or 2027 is set (see Annex E). Over the period to 2027, the pressures on the water environment will change, particularly because of climate change. It is not known in detail how the water environment will respond to this. The population in the river basin district will continue to increase, with further urbanisation. Agriculture will respond to the changing climate both here and abroad, market conditions, financial incentives and regulatory pressures. Technology and other solutions to address the pressures will improve, but the rate at which some new solutions can be introduced will depend on the economic climate. The Environment Agency believes that achieving good status in all water bodies by 2027 will not be possible using only current technologies. Even achieving 75 per cent good status will require marked changes in land use and water infrastructure, such as a major programme to separate foul and surface water sewers across most of the river basin district. By current standards, such changes are extremely unlikely to be economically or socially acceptable. For some waters therefore, achieving good status by 2027 could be not technically feasible or disproportionately costly. The Environment Agency wants to work with others to find and implement additional actions to improve the environment, with the aspiration of achieving good status in at least 60 per cent of waters by 2021 and in as many waters as possible by 2027. The water environment now and objectives for 2015 are described further in the section 8 Humber River Basin District catchments. A summary of the key statistics for the Humber River Basin District is provided in Table 22.
Environment Agency River Basin Management Plan, Humber River Basin District 41 Main document December 2009

8 Humber River Basin District catchments This section summarises information about the status of waters in the different parts of the Humber River Basin District, their objectives and some of the actions for them. Rivers and lakes are grouped by catchment. There are 15 catchments, presented here from north to south. These are shown in Figure 12. Esk and Coast Swale, Ure, Nidd and Upper Ouse Yorkshire Derwent Wharfe and Ouse Hull and East Riding Aire and Calder Idle and Torne Don and Rother Louth, Grimsby and Ancholme Derbyshire Derwent Dove Lower Trent and Erewash Staffordshire Trent Valley Tame, Anker and Mease Soar
There are separate sections for Canals and surface water transfers, Estuaries and coastal water bodies and Groundwater
Environment Agency River Basin Management Plan, Humber River Basin District 42 Main document December 2009

Figure 12 Map of the catchments in the Humber River Basin District
© Environment Agency copyright and / or database right 2009. All rights reserved. This map includes data supplied under licence from: © Crown Copyright and database right 2009. All rights reserved. Ordnance Survey licence number 100026380. Some river features of this map are based on digital spatial data licensed from the Centre for Ecology and Hydrology, © CEH. Licence number 198 version 2.
Environment Agency River Basin Management Plan, Humber River Basin District 43 Main document December 2009

Esk and Coast
The River Esk rises on the North York Moors and is the only major river in North Yorkshire that drains directly into the North Sea. It has a rural catchment entirely within the North York Moors National Park where every year millions of visitors come for walking, boating and angling. The coastal town of Whitby is the most densely populated area, although there are a number of small towns scattered throughout the catchment. Many of the more isolated hamlets do not have mains water supply, instead relying upon springs from the more permeable rocks. The catchment houses many SSSIs and other areas of conservation interest, as it supports nationally important species such as water vole, kingfisher, dipper, brook lamprey, salmon and freshwater pearl mussel. The fish populations of the River Esk and its tributaries are also of a high quality, with the dominant species being sea trout and salmon. Table 5 Key statistics at a glance – Esk & Coast catchment River and lake water bodies Now 2015 % at good ecological status or potential 10 10 % assessed at good or high biological status (18 water bodies assessed) 6 6 % assessed at good chemical status (1 water bodies assessed) 0 0 % at good status overall (chemical and ecological) 10 10 % improving for one or more element in rivers 7
There are 30 river water bodies and one lake in the catchment. Four are artificial or heavily modified. 10 per cent of rivers (32 km) currently achieve good or better ecological status/potential. Six per cent of rivers assessed for biology are at good or better biological status now, 39 per cent at poor biological status and none at bad status. Diffuse pollution from agriculture and natural mineralisation are key reasons for failures in the catchment. Physical modifications for flood protection, urbanisation and water storage and supply also play a key role in determining the status of rivers and lakes in this catchment.
Environment Agency River Basin Management Plan, Humber River Basin District 44 Main document December 2009

Figure 13 Map showing the current ecological status/potential for rivers in Esk & Coast catchment
© Environment Agency copyright and / or database right 2009. All rights reserved. This map includes data supplied under licence from: © Crown Copyright and database right 2009. All rights reserved. Ordnance Survey licence number 100026380. Some river features of this map are based on digital spatial data licensed from the Centre for Ecology and Hydrology, © CEH. Licence number 198 version 2. Some key actions for this catchment • The Esk Pearl Mussel and Salmon Recovery Project will improve habitat with the aim of
restoring the freshwater pearl mussel population and increasing the population of salmon and trout in the Esk catchment. This will be achieved through the promotion of good land management, and the use of a demonstration farm.
• There will be an investigation into the use of chemicals to control bracken. Action in reducing these chemicals will secure drinking water supply and protect the freshwater pearl mussel.
• The England Catchment Sensitive Farming Delivery Initiative is focused on the coastal streams of the catchment to deliver mandatory conditions at the bathing beaches of Staithes, Sandsend and Runswick Bay. The England Catchment Sensitive Farming Delivery Initiative officers provide advice to farmers on a range of subjects including how to reduce soil erosion and making the most of their slurries and manure in order to tackle diffuse pollution.
Environment Agency River Basin Management Plan, Humber River Basin District 45 Main document December 2009

Swale, Ure, Nidd and Upper Ouse
The Swale, Ure, Nidd and Upper Ouse catchment attracts many tourists because of its National Parks, natural features such as Aysgarth Falls and historic sites such as York Minster and Fountains Abbey. It extends from the heights of the North Pennine Moors, Yorkshire Dales, North York Moors and Howardian Hills down to the low-lying Vale of York in the south. It has large rural areas of grassland and livestock farming with several historic towns and cities including Northallerton, Ripon, Harrogate and York. There is a vast network of footpaths and bridleways within the catchment, such as the nationally important Pennine Way. The catchment also contains nationally important Ash woodlands. The two major aquifers in the catchment are the Sherwood Sandstone and Magnesian Limestone. There are groundwater quality risks for the Magnesian Limestone which relate to urban and rural inputs from localised use of nitrates and pesticides in agriculture and horticulture. In some areas there is a strong relationship between surface water and groundwater. Groundwater in the Sherwood Sandstone is heavily used for drinking water supplies. We are working to ensure there is enough water for both the environment and abstractors by preventing any further abstractions where the environment is at risk of deterioration. Table 6 Key statistics at a glance – Swale, Ure, Nidd and Upper Ouse catchment River and lake water bodies Now 2015 % at good ecological status or potential 28 28 % assessed at good or high biological status (75 water bodies assessed) 48 48 % assessed at good chemical status (3 water bodies assessed) 67 100 % at good status overall (chemical and ecological) 28 28 % improving for one or more element in rivers 9
There are 114 river water bodies and 14 lakes in the catchment. 41 are artificial or heavily modified. 30 per cent of rivers (452 km) currently achieve good or better ecological status/potential. 48 per cent of rivers assessed for biology are at good or better biological status now, 12 per cent at poor biological status, and three per cent at bad status. Point source discharges from industry sewage works, water industry storm discharges and diffuse pollution from agriculture are key reasons for failures in the catchment. Physical modifications due to water storage and supply, urbanisation and land drainage also play a key role in determining the status of rivers and lakes in this catchment.
Environment Agency River Basin Management Plan, Humber River Basin District 46 Main document December 2009

Figure 14 Map showing the current ecological status/potential for rivers in Swale, Ure, Nidd and Upper Ouse catchment
© Environment Agency copyright and / or database right 2009. All rights reserved. This map includes data supplied under licence from: © Crown Copyright and database right 2009. All rights reserved. Ordnance Survey licence number 100026380. Some river features of this map are based on digital spatial data licensed from the Centre for Ecology and Hydrology, © CEH. Licence number 198 version 2. Some key actions for this catchment • The “Wetting The Wiske” Project is working towards creating two areas of wetland habitat
and erecting stock fencing to prevent overgrazing and bank collapse leading to erosion and sedimentation.
• A Nitrate Vulnerable Zone advice campaign is being carried out to assist farmers with their nutrient management plans, enabling them to reduce use of nitrates and other nutrients, ultimately reducing nutrient loss to surface and groundwaters.
• The ‘Peat Partnership’ is a restoration project working to restore the peat environment; to reduce erosion and sediment movement into rivers whilst improving water management to make catchments less flashy.
• The ‘Ripon Multi Objective Project’ is a partnership that promotes land management techniques to reduce flood risk and deliver wider environmental benefits such as sediment control and improved water quality. The project uses farm advisors and capital monies to carry out intervention on land such as pond creation, woodland creation, buffer strips and fencing off watercourses.
Environment Agency River Basin Management Plan, Humber River Basin District 47 Main document December 2009
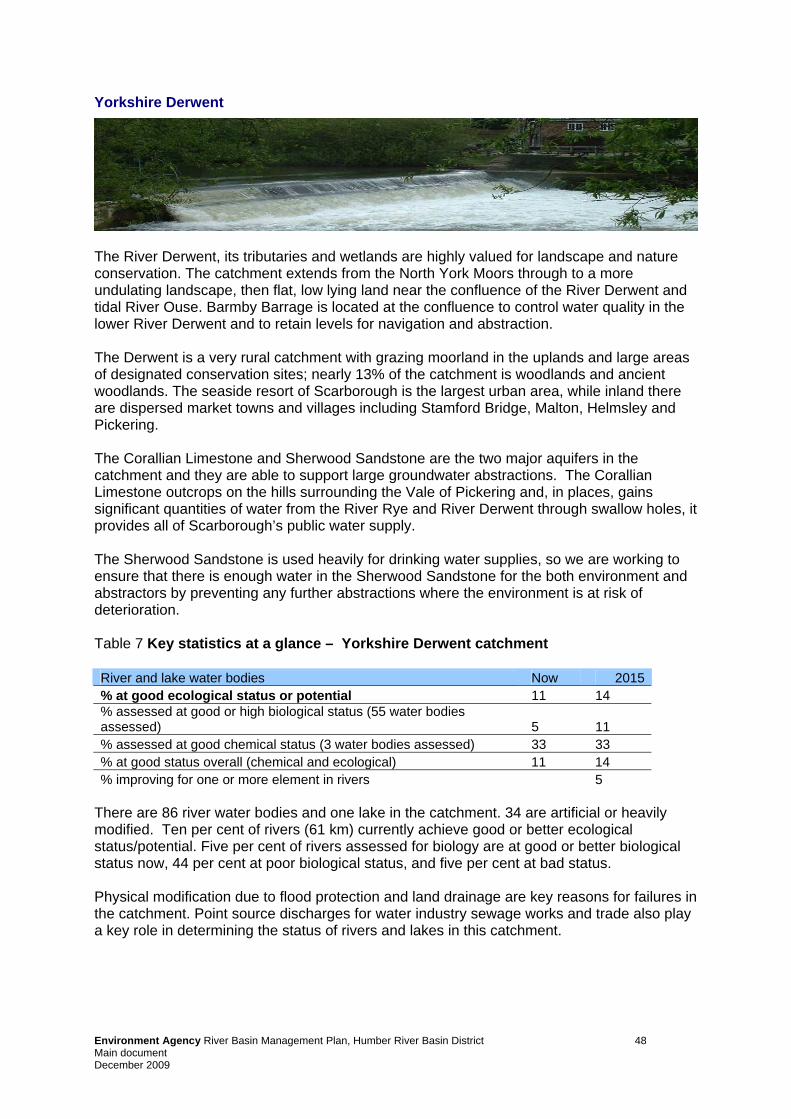
Yorkshire Derwent
The River Derwent, its tributaries and wetlands are highly valued for landscape and nature conservation. The catchment extends from the North York Moors through to a more undulating landscape, then flat, low lying land near the confluence of the River Derwent and tidal River Ouse. Barmby Barrage is located at the confluence to control water quality in the lower River Derwent and to retain levels for navigation and abstraction. The Derwent is a very rural catchment with grazing moorland in the uplands and large areas of designated conservation sites; nearly 13% of the catchment is woodlands and ancient woodlands. The seaside resort of Scarborough is the largest urban area, while inland there are dispersed market towns and villages including Stamford Bridge, Malton, Helmsley and Pickering. The Corallian Limestone and Sherwood Sandstone are the two major aquifers in the catchment and they are able to support large groundwater abstractions. The Corallian Limestone outcrops on the hills surrounding the Vale of Pickering and, in places, gains significant quantities of water from the River Rye and River Derwent through swallow holes, it provides all of Scarborough’s public water supply. The Sherwood Sandstone is used heavily for drinking water supplies, so we are working to ensure that there is enough water in the Sherwood Sandstone for the both environment and abstractors by preventing any further abstractions where the environment is at risk of deterioration. Table 7 Key statistics at a glance – Yorkshire Derwent catchment River and lake water bodies Now 2015 % at good ecological status or potential 11 14 % assessed at good or high biological status (55 water bodies assessed) 5 11 % assessed at good chemical status (3 water bodies assessed) 33 33 % at good status overall (chemical and ecological) 11 14 % improving for one or more element in rivers 5
There are 86 river water bodies and one lake in the catchment. 34 are artificial or heavily modified. Ten per cent of rivers (61 km) currently achieve good or better ecological status/potential. Five per cent of rivers assessed for biology are at good or better biological status now, 44 per cent at poor biological status, and five per cent at bad status. Physical modification due to flood protection and land drainage are key reasons for failures in the catchment. Point source discharges for water industry sewage works and trade also play a key role in determining the status of rivers and lakes in this catchment.
Environment Agency River Basin Management Plan, Humber River Basin District 48 Main document December 2009

Figure 15 Map showing the current ecological status/potential for rivers in Yorkshire Derwent catchment
© Environment Agency copyright and / or database right 2009. All rights reserved. This map includes data supplied under licence from: © Crown Copyright and database right 2009. All rights reserved. Ordnance Survey licence number 100026380. Some river features of this map are based on digital spatial data licensed from the Centre for Ecology and Hydrology, © CEH. Licence number 198 version 2. Some key actions for this catchment • In this catchment the England Catchment Sensitive Farming Delivery Initiative is being
directed primarily at achieving favourable condition at the River Derwent SSSI. Strategic Partnerships are being developed around Seamer Water to further develop this project. The England Catchment Sensitive Farming Delivery Initiative officers are giving advice to farmers on a range of subjects including soil management and making the most of their slurries and manure in order to tackle diffuse pollution.
• A Nitrate Vulnerable Zone advice campaign is being carried out to assist farmers with their nutrient management plans, enabling them to reduce use of nitrates and other nutrients, ultimately reducing nutrient loss to surface and groundwaters.
• Buttercrambe on the River Derwent is being investigated as a possible site for the construction of a fish and elver pass to enable fish and elvers to migrate upstream.
• The completion of a biocide trial to control signal crayfish at Barmbyfield Reservoir in the Lower Derwent Valley will determine the success of the programme to control the non-native species.
• Pickering Beck Land Management Partnership Project is using land management interventions to reduce flood risk and deliver environmental improvements such as sediment control and improved water quality. Interventions include woodland creation, woody debris dams, flood storage bunds and farm management measures to reduce rates of run off.
Environment Agency River Basin Management Plan, Humber River Basin District 49 Main document December 2009

Case Study 3 The Yorkshire Derwent
The Yorkshire River Derwent has been designated as a Site of Special Scientific Interest (SSSI), and as a European Special Area of Conservation (SAC) due to the importance of the range of plants and animals it supports. However, over time, changes to the surrounding land and river use have resulted in a decline in the quality of habitat. Main issues have been identified as excess fine sedimentation, physical modification, lack of shading and shelter in the river and its bankside and barriers to migratory fish passage. In response to these issues, the Environment Agency and Natural England are developing a restoration plan to help the River Derwent SSSI move towards favourable condition. This includes a range of actions including fencing off sections trampled by stock to allow vegetation growth, investigation into the potential for fish passes and improving riparian and marginal habitats by increasing tree cover. A ramp is being installed at Barmby Barrage to help lamprey movement into the river. Trials, in progress on East Cottingwith flood meadow, will help to inform any management changes required to protect the integrity of the lowland hay meadows.
Environment Agency River Basin Management Plan, Humber River Basin District 50 Main document December 2009
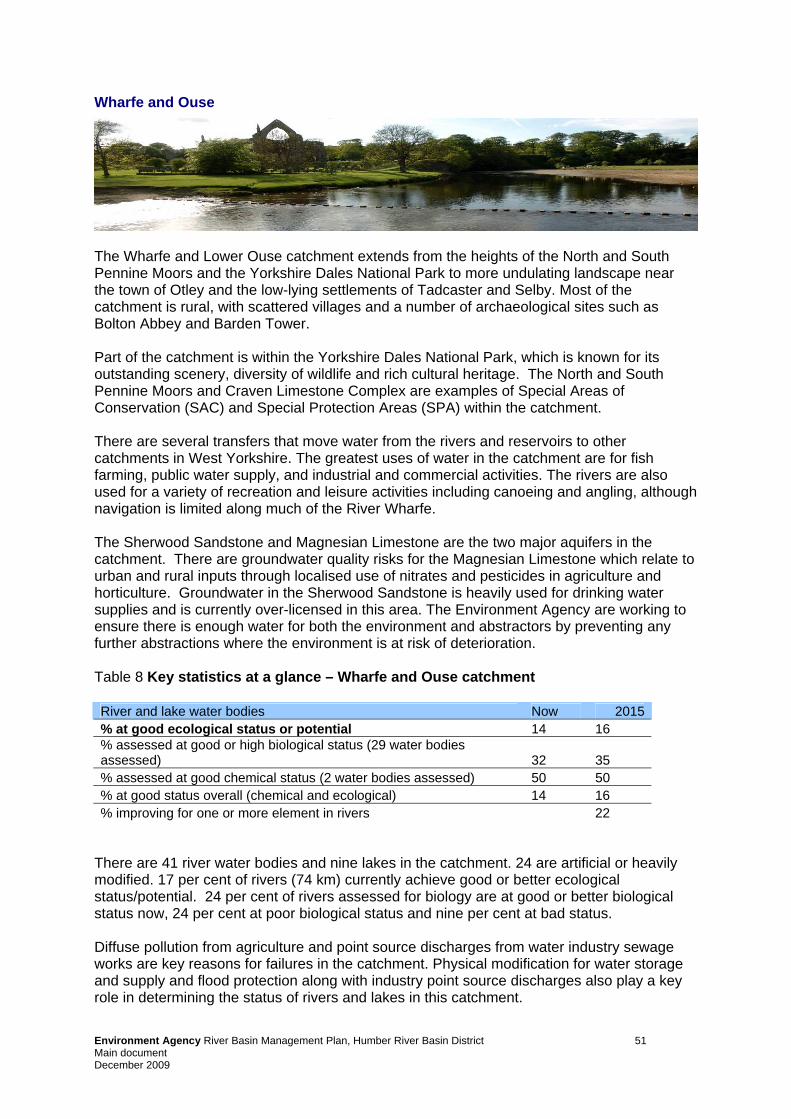
Wharfe and Ouse
The Wharfe and Lower Ouse catchment extends from the heights of the North and South Pennine Moors and the Yorkshire Dales National Park to more undulating landscape near the town of Otley and the low-lying settlements of Tadcaster and Selby. Most of the catchment is rural, with scattered villages and a number of archaeological sites such as Bolton Abbey and Barden Tower. Part of the catchment is within the Yorkshire Dales National Park, which is known for its outstanding scenery, diversity of wildlife and rich cultural heritage. The North and South Pennine Moors and Craven Limestone Complex are examples of Special Areas of Conservation (SAC) and Special Protection Areas (SPA) within the catchment. There are several transfers that move water from the rivers and reservoirs to other catchments in West Yorkshire. The greatest uses of water in the catchment are for fish farming, public water supply, and industrial and commercial activities. The rivers are also used for a variety of recreation and leisure activities including canoeing and angling, although navigation is limited along much of the River Wharfe. The Sherwood Sandstone and Magnesian Limestone are the two major aquifers in the catchment. There are groundwater quality risks for the Magnesian Limestone which relate to urban and rural inputs through localised use of nitrates and pesticides in agriculture and horticulture. Groundwater in the Sherwood Sandstone is heavily used for drinking water supplies and is currently over-licensed in this area. The Environment Agency are working to ensure there is enough water for both the environment and abstractors by preventing any further abstractions where the environment is at risk of deterioration. Table 8 Key statistics at a glance – Wharfe and Ouse catchment River and lake water bodies Now 2015 % at good ecological status or potential 14 16 % assessed at good or high biological status (29 water bodies assessed) 32 35 % assessed at good chemical status (2 water bodies assessed) 50 50 % at good status overall (chemical and ecological) 14 16 % improving for one or more element in rivers 22
There are 41 river water bodies and nine lakes in the catchment. 24 are artificial or heavily modified. 17 per cent of rivers (74 km) currently achieve good or better ecological status/potential. 24 per cent of rivers assessed for biology are at good or better biological status now, 24 per cent at poor biological status and nine per cent at bad status. Diffuse pollution from agriculture and point source discharges from water industry sewage works are key reasons for failures in the catchment. Physical modification for water storage and supply and flood protection along with industry point source discharges also play a key role in determining the status of rivers and lakes in this catchment.
Environment Agency River Basin Management Plan, Humber River Basin District 51 Main document December 2009

Figure 16 Map showing the current ecological status/potential for rivers in Wharfe and Ouse catchment
© Environment Agency copyright and / or database right 2009. All rights reserved. This map includes data supplied under licence from: © Crown Copyright and database right 2009. All rights reserved. Ordnance Survey licence number 100026380. Some river features of this map are based on digital spatial data licensed from the Centre for Ecology and Hydrology, © CEH. Licence number 198 version 2. Some key actions for this catchment • In this catchment a Nitrate Vulnerable Zone advice campaign is being carried out to
assist farmers with their nutrient management plans, enabling them to reduce use of nitrates and other nutrients, ultimately reducing excess nutrient load being lost to surface and groundwaters.
• At Bishop Wood, near Selby, partnership work led by Forestry Commission will lead to restored wet woodland, creation of ponds and realising flood risk benefits.
• The construction of a fish and elver pass at Boston Spa will enable fish and elvers to migrate upstream.
Environment Agency River Basin Management Plan, Humber River Basin District 52 Main document December 2009

Hull and East Riding
The Hull and East Riding catchment has had a fascinating and intriguing history. It has been witness to Roman invasions, Viking settlements, the War of the Roses and the industrial revolution. This sparsely populated area stretches from the seaside resort of Bridlington in the north to Holderness in the south and from Market Weighton in the west to Withernsea in the east. The Yorkshire Wolds curve in a crescent shape from the chalk cliffs at Flamborough to the Humber Estuary at Hessle. The largest urban area is the city of Hull where there is a major port with strong trade links to Europe, Scandinavia and the Baltic. Complex networks of man made drains and pumped ditches dominate the catchment and the Hull Tidal Surge Barrier protects the city of Hull. The headwaters of the River Hull and the Gypsey Race form the most northerly chalk streams in Britain and the chalk aquifer is important for the whole area, supplying a large proportion of water for public supply and farming needs. Groundwater quality in a small part of the East Yorkshire Chalk around Hull is at risk from saline intrusion. There are several streams on the Yorkshire Wolds that only flow when groundwater levels are high, including Gypsey Race which flows into the sea at Bridlington. Table 9 Key statistics at a glance – Hull & East Ridging catchment River and lake water bodies Now 2015 % at good ecological status or potential 16 19 % assessed at good or high biological status (32 water bodies assessed) 21 45 % assessed at good chemical status (2 water bodies assessed) 100 100 % at good status overall (chemical and ecological) 16 19 % improving for one or more element in rivers 22
There are 68 river water bodies and one lake in the catchment. 49 are artificial or heavily modified. 16 per cent of rivers (60 km) currently achieve good or better ecological status/potential. 22 per cent of rivers assessed for biology are at good or better biological status now, 36 per cent at poor biological status and 12 per cent at bad status. Diffuse pollution from agriculture is the key reason for failures in the catchment. Point source discharges from the water industry sewage works and storm discharges, along with physical modifications for land drainage also play a key role in determining the status of rivers and lakes in this catchment.
Environment Agency River Basin Management Plan, Humber River Basin District 53 Main document December 2009
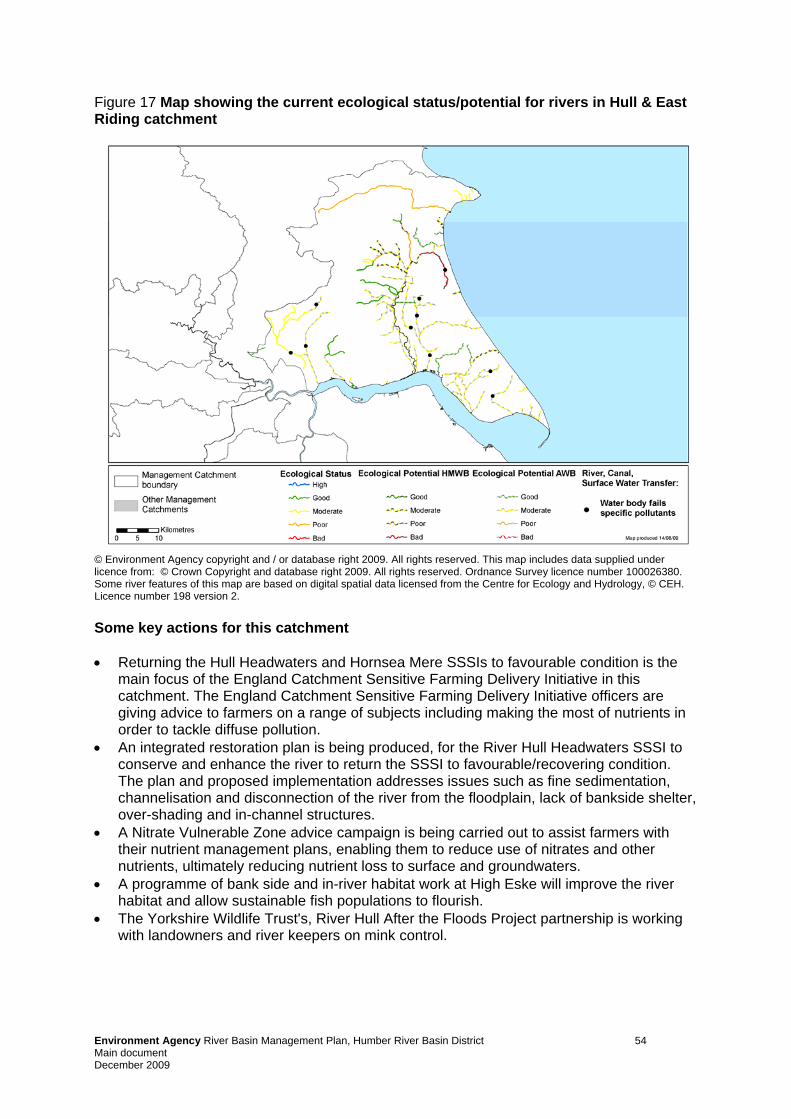
Figure 17 Map showing the current ecological status/potential for rivers in Hull & East Riding catchment
© Environment Agency copyright and / or database right 2009. All rights reserved. This map includes data supplied under licence from: © Crown Copyright and database right 2009. All rights reserved. Ordnance Survey licence number 100026380. Some river features of this map are based on digital spatial data licensed from the Centre for Ecology and Hydrology, © CEH. Licence number 198 version 2. Some key actions for this catchment • Returning the Hull Headwaters and Hornsea Mere SSSIs to favourable condition is the
main focus of the England Catchment Sensitive Farming Delivery Initiative in this catchment. The England Catchment Sensitive Farming Delivery Initiative officers are giving advice to farmers on a range of subjects including making the most of nutrients in order to tackle diffuse pollution.
• An integrated restoration plan is being produced, for the River Hull Headwaters SSSI to conserve and enhance the river to return the SSSI to favourable/recovering condition. The plan and proposed implementation addresses issues such as fine sedimentation, channelisation and disconnection of the river from the floodplain, lack of bankside shelter, over-shading and in-channel structures.
• A Nitrate Vulnerable Zone advice campaign is being carried out to assist farmers with their nutrient management plans, enabling them to reduce use of nitrates and other nutrients, ultimately reducing nutrient loss to surface and groundwaters.
• A programme of bank side and in-river habitat work at High Eske will improve the river habitat and allow sustainable fish populations to flourish.
• The Yorkshire Wildlife Trust's, River Hull After the Floods Project partnership is working with landowners and river keepers on mink control.
Environment Agency River Basin Management Plan, Humber River Basin District 54 Main document December 2009
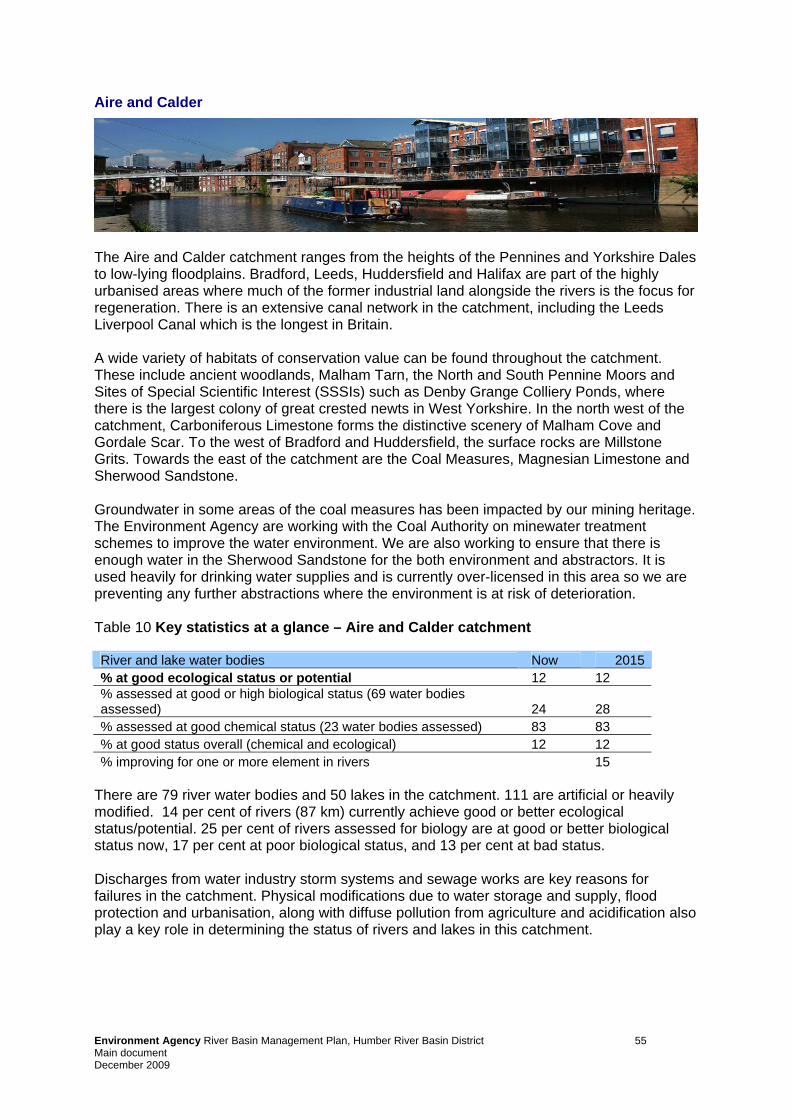
Aire and Calder
The Aire and Calder catchment ranges from the heights of the Pennines and Yorkshire Dales to low-lying floodplains. Bradford, Leeds, Huddersfield and Halifax are part of the highly urbanised areas where much of the former industrial land alongside the rivers is the focus for regeneration. There is an extensive canal network in the catchment, including the Leeds Liverpool Canal which is the longest in Britain. A wide variety of habitats of conservation value can be found throughout the catchment. These include ancient woodlands, Malham Tarn, the North and South Pennine Moors and Sites of Special Scientific Interest (SSSIs) such as Denby Grange Colliery Ponds, where there is the largest colony of great crested newts in West Yorkshire. In the north west of the catchment, Carboniferous Limestone forms the distinctive scenery of Malham Cove and Gordale Scar. To the west of Bradford and Huddersfield, the surface rocks are Millstone Grits. Towards the east of the catchment are the Coal Measures, Magnesian Limestone and Sherwood Sandstone. Groundwater in some areas of the coal measures has been impacted by our mining heritage. The Environment Agency are working with the Coal Authority on minewater treatment schemes to improve the water environment. We are also working to ensure that there is enough water in the Sherwood Sandstone for the both environment and abstractors. It is used heavily for drinking water supplies and is currently over-licensed in this area so we are preventing any further abstractions where the environment is at risk of deterioration. Table 10 Key statistics at a glance – Aire and Calder catchment River and lake water bodies Now 2015 % at good ecological status or potential 12 12 % assessed at good or high biological status (69 water bodies assessed) 24 28 % assessed at good chemical status (23 water bodies assessed) 83 83 % at good status overall (chemical and ecological) 12 12 % improving for one or more element in rivers 15
There are 79 river water bodies and 50 lakes in the catchment. 111 are artificial or heavily modified. 14 per cent of rivers (87 km) currently achieve good or better ecological status/potential. 25 per cent of rivers assessed for biology are at good or better biological status now, 17 per cent at poor biological status, and 13 per cent at bad status. Discharges from water industry storm systems and sewage works are key reasons for failures in the catchment. Physical modifications due to water storage and supply, flood protection and urbanisation, along with diffuse pollution from agriculture and acidification also play a key role in determining the status of rivers and lakes in this catchment.
Environment Agency River Basin Management Plan, Humber River Basin District 55 Main document December 2009
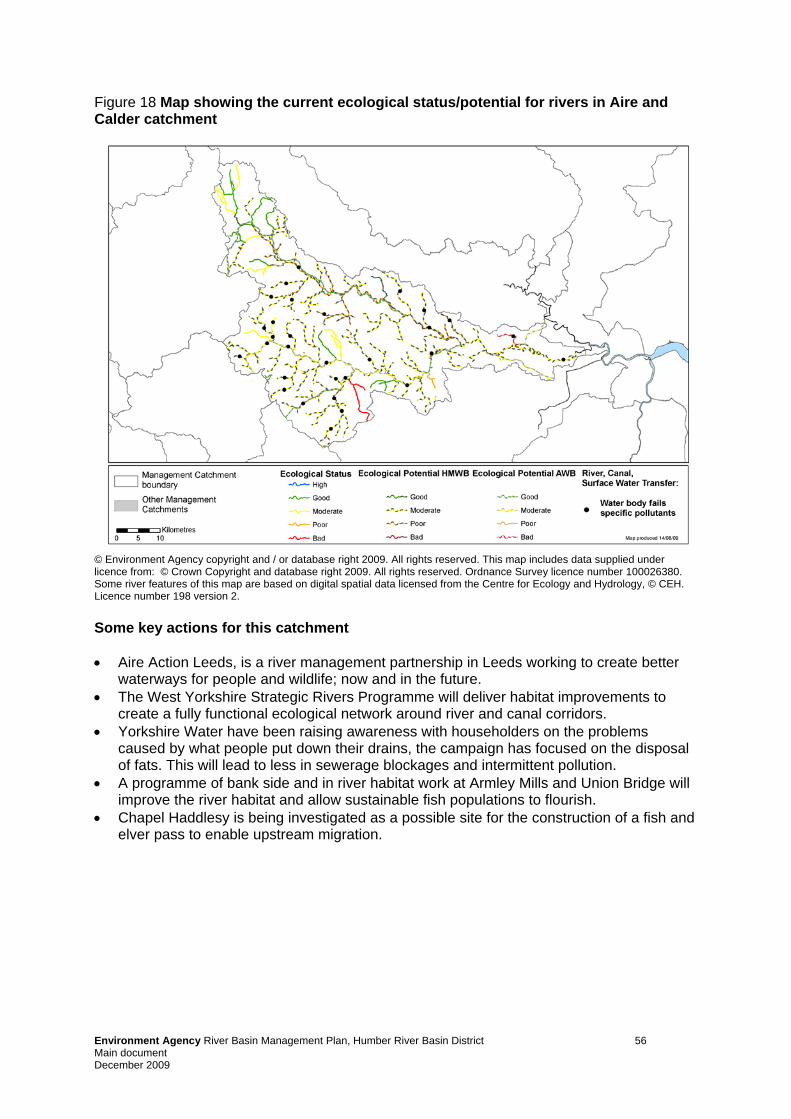
Figure 18 Map showing the current ecological status/potential for rivers in Aire and Calder catchment
© Environment Agency copyright and / or database right 2009. All rights reserved. This map includes data supplied under licence from: © Crown Copyright and database right 2009. All rights reserved. Ordnance Survey licence number 100026380. Some river features of this map are based on digital spatial data licensed from the Centre for Ecology and Hydrology, © CEH. Licence number 198 version 2. Some key actions for this catchment • Aire Action Leeds, is a river management partnership in Leeds working to create better
waterways for people and wildlife; now and in the future. • The West Yorkshire Strategic Rivers Programme will deliver habitat improvements to
create a fully functional ecological network around river and canal corridors. • Yorkshire Water have been raising awareness with householders on the problems
caused by what people put down their drains, the campaign has focused on the disposal of fats. This will lead to less in sewerage blockages and intermittent pollution.
• A programme of bank side and in river habitat work at Armley Mills and Union Bridge will improve the river habitat and allow sustainable fish populations to flourish.
• Chapel Haddlesy is being investigated as a possible site for the construction of a fish and elver pass to enable upstream migration.
Environment Agency River Basin Management Plan, Humber River Basin District 56 Main document December 2009

Idle and Torne
The Idle and Torne catchment stretches from central Nottinghamshire to southern Yorkshire. It covers an area of approximately 1300km2, the landscape varying from Sherwood Forest in the south to the exposed Hatfield and Thorne Moors and valuable agricultural land of the Isle of Axholme in the north. The Rivers Idle and Torne both flow in a general north easterly direction. The Idle is formed by the Rivers Meden, Maun and Poulter which meet near Gamston. The Idle joins the River Trent at West Stockwith and lower downstream the Torne joins the Trent at Keadby where it is tidal. The confluences with the Idle and Torne are artificially managed with water either pumped out of the tributaries at high tides or released by gravity at low tide. Both rivers rise and flow through heavily urbanised areas including Mansfield, Sutton in Ashfield, Worksop, East Retford and the south-eastern outskirts of Doncaster. Heavy industry is present in the catchment but many collieries have closed in recent years owing to the decline in coal mining which means that mine waters need to be carefully managed. Peat has historically been extracted in the north, at Hatfield Moors. The dominant land use is arable agriculture. Large areas of land in the north of the catchment have a comprehensive system of land drainage to maintain their agricultural quality. Because of their low-lying situation these areas are also protected from the River Trent by extensive flood defences. Table 11 Key statistics at a glance – Idle and Tornecatchment River and lake water bodies Now 2015 % at good ecological status or potential 7 7 % assessed at good or high biological status (33 water bodies assessed) 18 18 % assessed at good chemical status (10 water bodies assessed) 80 80 % at good status overall (chemical and ecological) 7 7 % improving for one or more element in rivers 16
There are 38 river water bodies and six lakes in the catchment. 19 are artificial or heavily modified. Three per cent of rivers (6km) currently achieve good or better ecological status/potential. 18 per cent of rivers assessed for biology are at good or better biological status now, 32 per cent at poor biological status and twelve per cent at bad status. Point source discharges from water industry sewage work are key reasons for failures in the catchment. Physical modification due to land drainage, flood protection and recreation, along with abstraction also play a key role in determining the status of rivers and lakes in this catchment.
Environment Agency River Basin Management Plan, Humber River Basin District 57 Main document December 2009
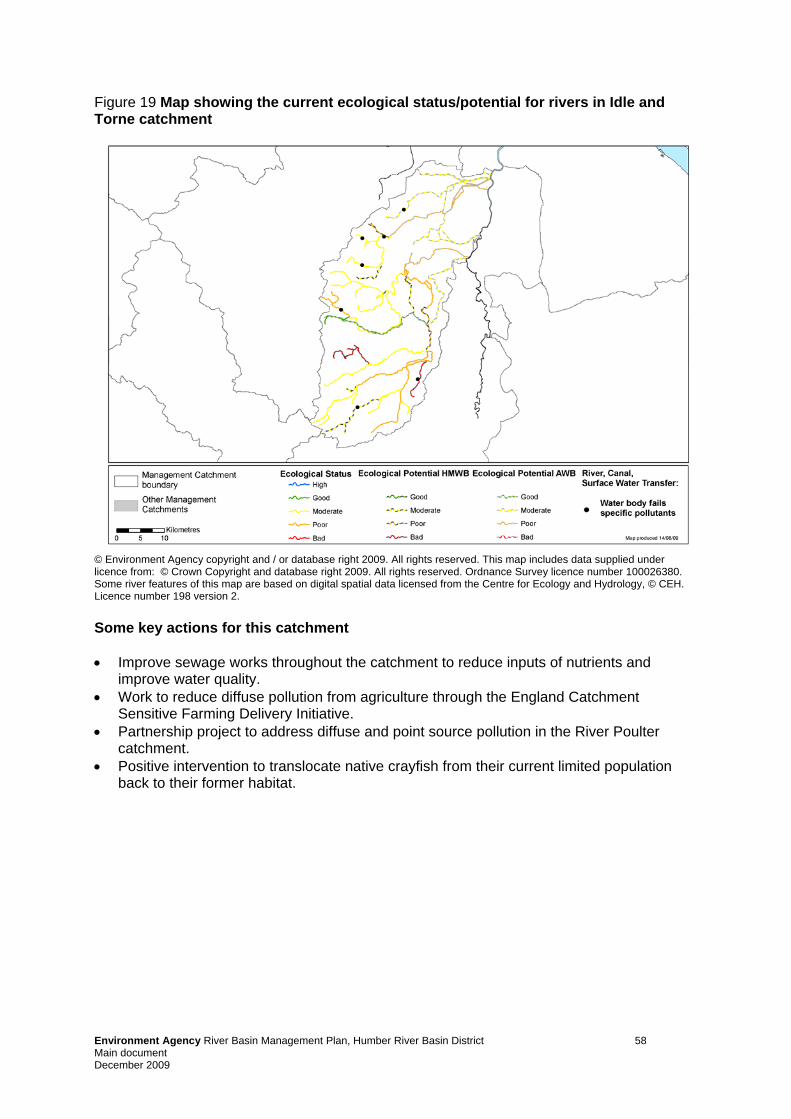
Figure 19 Map showing the current ecological status/potential for rivers in Idle and Torne catchment
© Environment Agency copyright and / or database right 2009. All rights reserved. This map includes data supplied under licence from: © Crown Copyright and database right 2009. All rights reserved. Ordnance Survey licence number 100026380. Some river features of this map are based on digital spatial data licensed from the Centre for Ecology and Hydrology, © CEH. Licence number 198 version 2. Some key actions for this catchment • Improve sewage works throughout the catchment to reduce inputs of nutrients and
improve water quality. • Work to reduce diffuse pollution from agriculture through the England Catchment
Sensitive Farming Delivery Initiative. • Partnership project to address diffuse and point source pollution in the River Poulter
catchment. • Positive intervention to translocate native crayfish from their current limited population
back to their former habitat.
Environment Agency River Basin Management Plan, Humber River Basin District 58 Main document December 2009

Don and Rother
The Don and Rother catchment is highly urbanised and includes Doncaster, Barnsley, Sheffield and Chesterfield where there is a long history of metal manufacture and engineering. This, along with agriculture, mining and quarrying, has led to a varied landscape which extends from the South Pennine Moors and Peak District National Park to the low-lying flood plain of the Sherwood Sandstone. Water powered industry was extensive in the Upper Don and the physical infrastructure remains surprisingly intact. Working water wheels can be found at Abbeydale Industrial Hamlet and at the Shepherd Wheel on the River Sheaf. The Pennines are dominated by moorland and heath whilst the majority of the Peak District is grassland. They are popular tourist destinations due to the spectacular scenery and pleasant villages and hamlets. There are significant areas of ancient woodland. The South Yorkshire Forest can also be found in the centre of the catchment. Millstone Grit and shallow Coal Measures lie towards the west of the catchment with the Magnesian Limestone and Sherwood Sandstone to the east. Some areas of the Coal Measures groundwater have been impacted by the mining heritage in the catchment and we are working with The Coal Authority on minewater treatment schemes to improve the water environment. We are working to ensure that there is enough water in the Sherwood Sandstone for the both environment and abstractors, it is heavily used for drinking water supplies and is currently over-licensed in this area so we are preventing any further abstractions where the environment is at risk of deterioration. Table 12 Key statistics at a glance – Don & Rother catchment River and lake water bodies Now 2015 % at good ecological status or potential 8 9 % assessed at good or high biological status (71 water bodies assessed) 26 31 % assessed at good chemical status (19 water bodies assessed) 74 79 % at good status overall (chemical and ecological) 8 9 % improving for one or more element in rivers 18
There are 78 river water bodies and 18 lakes in the catchment. 78 are artificial or heavily modified. Nine per cent of rivers (48 km) currently achieve good or better ecological status/potential. 25 per cent of rivers assessed for biology are at good or better biological status now, with 38 per cent at poor biological status, and 13 per cent at bad status. Point source discharges from water industry sewage works and storm discharges are key reasons for failures in the catchment. Diffuse pollution from agriculture and physical modification due to urbanisation and water storage and supply also play a key role in determining the status of rivers and lakes in this catchment.
Environment Agency River Basin Management Plan, Humber River Basin District 59 Main document December 2009

Figure 20 Map showing the current ecological status/potential for rivers in Don & Rother catchment
© Environment Agency copyright and / or database right 2009. All rights reserved. This map includes data supplied under licence from: © Crown Copyright and database right 2009. All rights reserved. Ordnance Survey licence number 100026380. Some river features of this map are based on digital spatial data licensed from the Centre for Ecology and Hydrology, © CEH. Licence number 198 version 2. Some key actions for this catchment • Creation of wetland habitats and installation of elver passes by the Dearne Valley Green
Heart Project delivering benefits to biodiversity, improving water quality and managing peak flows.
• Work to implement initiatives to tackle significant local issues particularly on pesticides and sheep-dip, e.g. the voluntary initiative at Ingbirchworth Reservoir.
• Replacement of the Darfield weir on the River Dearne with a series of rock ramps to facilitate fish and eel passage will begin in 2010.
• The restoration of Rotherham wetlands will result in a more natural inundation regime in the wetlands creating ecological enhancement and reduced flood risk for Rotherham and Doncaster.
• As part of the Living Don project, Sheffield Wildlife Trust will work with local communities in Sheffield and Rotherham to promote community involvement in environmental initiatives.
Environment Agency River Basin Management Plan, Humber River Basin District 60 Main document December 2009
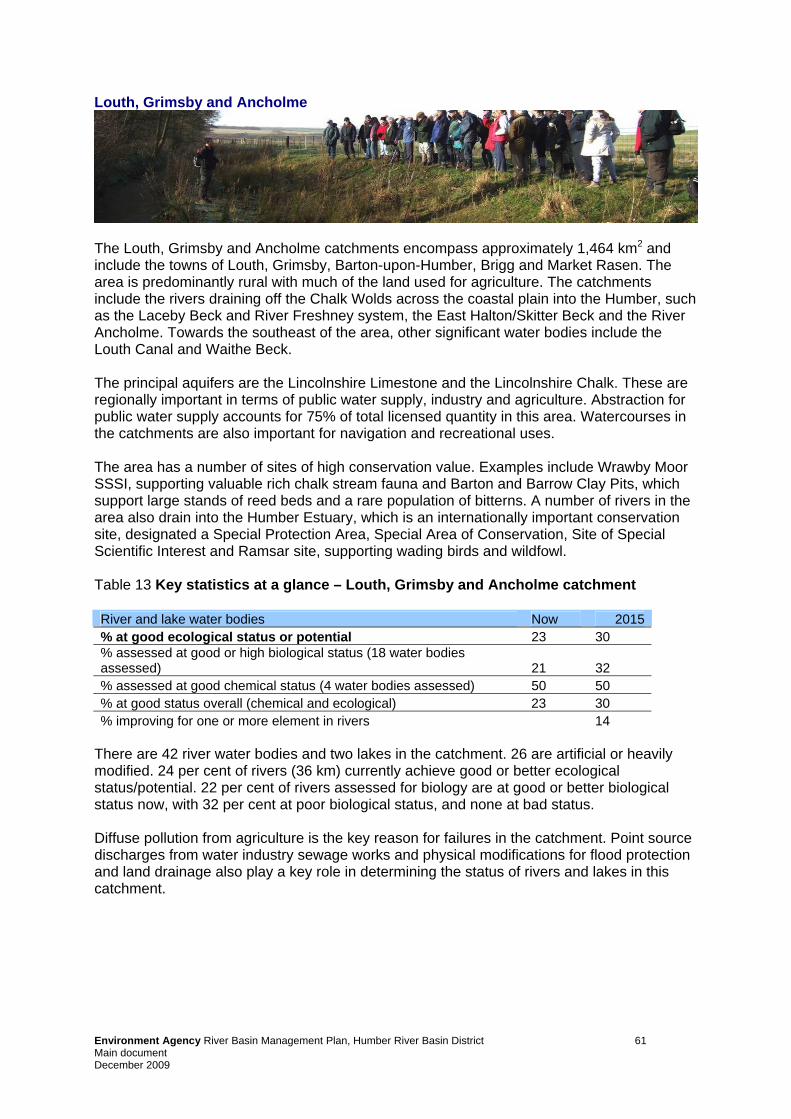
Louth, Grimsby and Ancholme
The Louth, Grimsby and Ancholme catchments encompass approximately 1,464 km2 and include the towns of Louth, Grimsby, Barton-upon-Humber, Brigg and Market Rasen. The area is predominantly rural with much of the land used for agriculture. The catchments include the rivers draining off the Chalk Wolds across the coastal plain into the Humber, such as the Laceby Beck and River Freshney system, the East Halton/Skitter Beck and the River Ancholme. Towards the southeast of the area, other significant water bodies include the Louth Canal and Waithe Beck. The principal aquifers are the Lincolnshire Limestone and the Lincolnshire Chalk. These are regionally important in terms of public water supply, industry and agriculture. Abstraction for public water supply accounts for 75% of total licensed quantity in this area. Watercourses in the catchments are also important for navigation and recreational uses. The area has a number of sites of high conservation value. Examples include Wrawby Moor SSSI, supporting valuable rich chalk stream fauna and Barton and Barrow Clay Pits, which support large stands of reed beds and a rare population of bitterns. A number of rivers in the area also drain into the Humber Estuary, which is an internationally important conservation site, designated a Special Protection Area, Special Area of Conservation, Site of Special Scientific Interest and Ramsar site, supporting wading birds and wildfowl. Table 13 Key statistics at a glance – Louth, Grimsby and Ancholme catchment River and lake water bodies Now 2015 % at good ecological status or potential 23 30 % assessed at good or high biological status (18 water bodies assessed) 21 32 % assessed at good chemical status (4 water bodies assessed) 50 50 % at good status overall (chemical and ecological) 23 30 % improving for one or more element in rivers 14
There are 42 river water bodies and two lakes in the catchment. 26 are artificial or heavily modified. 24 per cent of rivers (36 km) currently achieve good or better ecological status/potential. 22 per cent of rivers assessed for biology are at good or better biological status now, with 32 per cent at poor biological status, and none at bad status. Diffuse pollution from agriculture is the key reason for failures in the catchment. Point source discharges from water industry sewage works and physical modifications for flood protection and land drainage also play a key role in determining the status of rivers and lakes in this catchment.
Environment Agency River Basin Management Plan, Humber River Basin District 61 Main document December 2009

Figure 21 Map showing the current ecological status/potential for rivers in Louth, Grimsby and Ancholme catchment
© Environment Agency copyright and / or database right 2009. All rights reserved. This map includes data supplied under licence from: © Crown Copyright and database right 2009. All rights reserved. Ordnance Survey licence number 100026380. Some river features of this map are based on digital spatial data licensed from the Centre for Ecology and Hydrology, © CEH. Licence number 198 version 2.
The Lincolnshire Chalk Steam Project is a partnership project hosted by the Lincolnshire Wolds Countryside Service. The project works with the farming community to tackle a number of issues including:
Case Study 4 The Lincolnshire Chalk Stream Project
• Abstraction and low flows • Land use changes • Pollution from sewage works and agricultural run-off • Structural changes including the damming of streams and land drainage impacts • Spread of non-native species
To date, the project has worked with landowners to restore over four km of habitat. This has involved the removal of shading scrub, reversion to more natural bank profiles, increasing connectivity with the flood plain and introducing more flow diversity and bed variation. The project also works closely with Natural England’s Higher Level Stewardship and has made specific recommendations that have improved land management for over 1100 hectares. This directly benefits over 32km of chalk stream.
Environment Agency River Basin Management Plan, Humber River Basin District 62 Main document December 2009
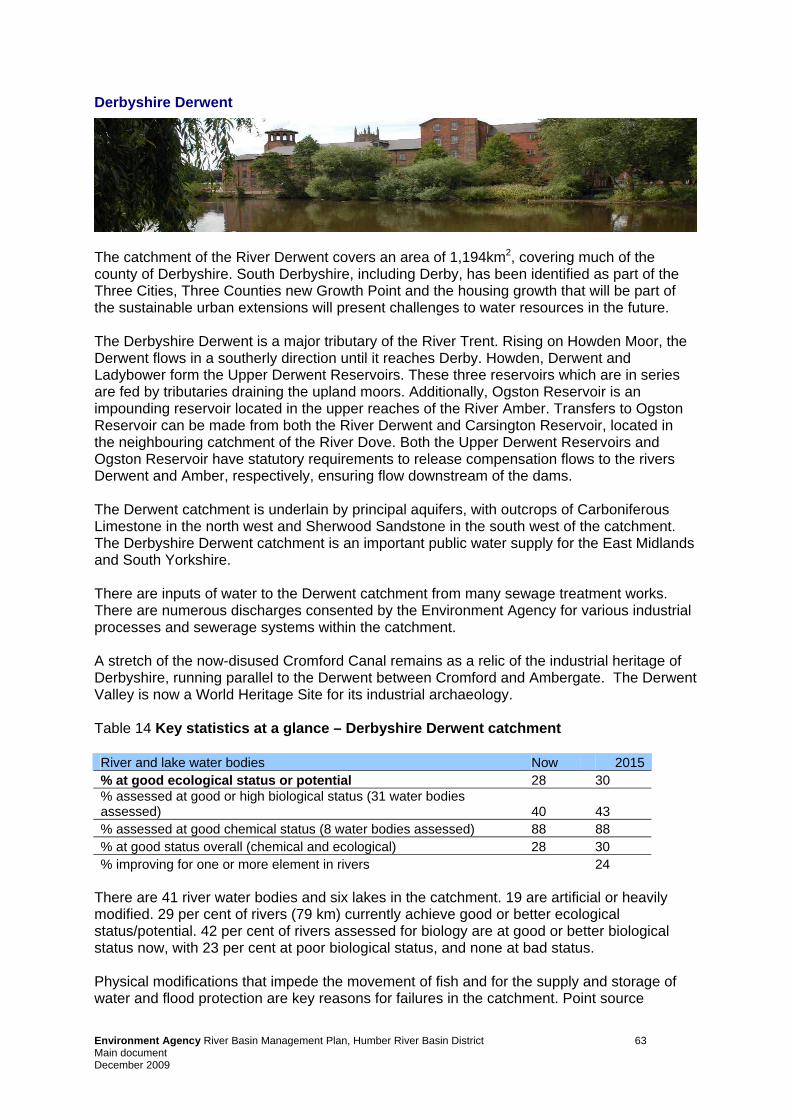
Derbyshire Derwent
The catchment of the River Derwent covers an area of 1,194km2, covering much of the county of Derbyshire. South Derbyshire, including Derby, has been identified as part of the Three Cities, Three Counties new Growth Point and the housing growth that will be part of the sustainable urban extensions will present challenges to water resources in the future. The Derbyshire Derwent is a major tributary of the River Trent. Rising on Howden Moor, the Derwent flows in a southerly direction until it reaches Derby. Howden, Derwent and Ladybower form the Upper Derwent Reservoirs. These three reservoirs which are in series are fed by tributaries draining the upland moors. Additionally, Ogston Reservoir is an impounding reservoir located in the upper reaches of the River Amber. Transfers to Ogston Reservoir can be made from both the River Derwent and Carsington Reservoir, located in the neighbouring catchment of the River Dove. Both the Upper Derwent Reservoirs and Ogston Reservoir have statutory requirements to release compensation flows to the rivers Derwent and Amber, respectively, ensuring flow downstream of the dams. The Derwent catchment is underlain by principal aquifers, with outcrops of Carboniferous Limestone in the north west and Sherwood Sandstone in the south west of the catchment. The Derbyshire Derwent catchment is an important public water supply for the East Midlands and South Yorkshire. There are inputs of water to the Derwent catchment from many sewage treatment works. There are numerous discharges consented by the Environment Agency for various industrial processes and sewerage systems within the catchment. A stretch of the now-disused Cromford Canal remains as a relic of the industrial heritage of Derbyshire, running parallel to the Derwent between Cromford and Ambergate. The Derwent Valley is now a World Heritage Site for its industrial archaeology. Table 14 Key statistics at a glance – Derbyshire Derwent catchment River and lake water bodies Now 2015 % at good ecological status or potential 28 30 % assessed at good or high biological status (31 water bodies assessed) 40 43 % assessed at good chemical status (8 water bodies assessed) 88 88 % at good status overall (chemical and ecological) 28 30 % improving for one or more element in rivers 24
There are 41 river water bodies and six lakes in the catchment. 19 are artificial or heavily modified. 29 per cent of rivers (79 km) currently achieve good or better ecological status/potential. 42 per cent of rivers assessed for biology are at good or better biological status now, with 23 per cent at poor biological status, and none at bad status. Physical modifications that impede the movement of fish and for the supply and storage of water and flood protection are key reasons for failures in the catchment. Point source
Environment Agency River Basin Management Plan, Humber River Basin District 63 Main document December 2009
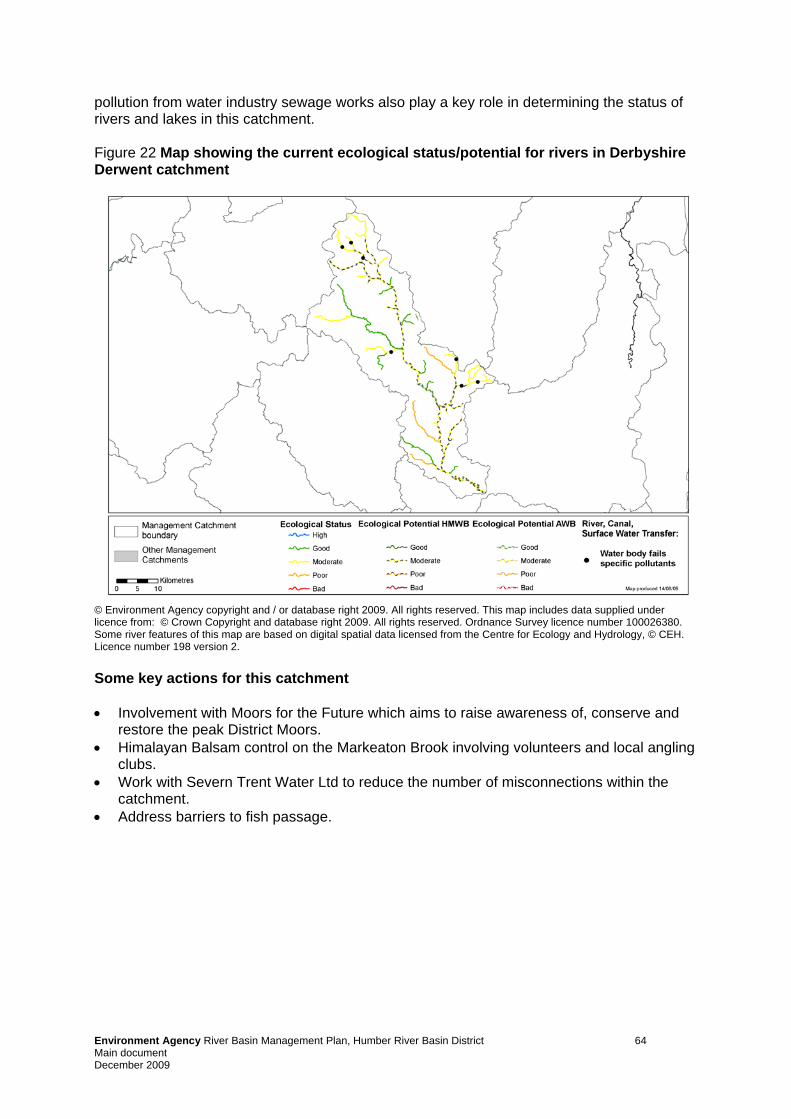
pollution from water industry sewage works also play a key role in determining the status of rivers and lakes in this catchment. Figure 22 Map showing the current ecological status/potential for rivers in Derbyshire Derwent catchment
© Environment Agency copyright and / or database right 2009. All rights reserved. This map includes data supplied under licence from: © Crown Copyright and database right 2009. All rights reserved. Ordnance Survey licence number 100026380. Some river features of this map are based on digital spatial data licensed from the Centre for Ecology and Hydrology, © CEH. Licence number 198 version 2. Some key actions for this catchment • Involvement with Moors for the Future which aims to raise awareness of, conserve and
restore the peak District Moors. • Himalayan Balsam control on the Markeaton Brook involving volunteers and local angling
clubs. • Work with Severn Trent Water Ltd to reduce the number of misconnections within the
catchment. • Address barriers to fish passage.
Environment Agency River Basin Management Plan, Humber River Basin District 64 Main document December 2009

Dove
The Dove Catchment includes the Rivers Dove, Churnet, Tean, Manifold and Hamps. Parts of the catchment lie in the Peak District National Park with well-known beauty spots such as Dovedale, Ilam and the Manifold Valley. This area of the Peak District National Park is known as the ‘White Peak’ due to the underlying carboniferous limestone which forms the majority of the geology of the lower parts of the Peak District. The River Dove through Dovedale and sections of the Rivers Hamps and Manifold, along with the Hoo Brook in Butterton form part of the Peak District Dales and Woodlands Special Area of Conservation (SAC) and are designated for populations of white-clawed crayfish, bullhead and lamprey. The Peak District Dales is also an existing Priority Catchment under the England Catchment Sensitive Farming Delivery Initiative Initiative which has recently (2008) been extended to include the River Churnet. The catchment supports abstraction for public water supply from reservoirs, surface and groundwater sources. Water is also abstracted for spray irrigation, industrial use and hydropower. In the upper reaches of the ‘White Peak’, carboniferous limestone is quarried for use in the aggregates and cement industry. There are numerous coarse trout and grayling fisheries. Juvenile salmon were introduced to the Dove and Churnet and as a result, adult salmon have started to return to the River Dove from the North Sea, via the River Trent. Naturally spawned salmon have also recently been recorded on surveys in the River Dove. Table 15 Key statistics at a glance – Dove catchment River and lake water bodies Now 2015 % at good ecological status or potential 39 41 % assessed at good or high biological status (28 water bodies assessed) 65 74 % assessed at good chemical status (5 water bodies assessed) 100 100 % at good status overall (chemical and ecological) 39 41 % improving for one or more element in rivers 11
There are 37 river water bodies and four lakes in the catchment. 12 are artificial or heavily modified. 38 per cent of rivers (146 km) currently achieve good or better ecological status/potential. 68 per cent of rivers assessed for biology are at good or better biological status now, with thirteen per cent at poor biological status, and three per cent at bad status. Physical modifications for urbanisation flood protection and water storage and supply are key reasons for failures in the catchment. Diffuse pollution from urban areas also plays a key role in determining the status of rivers and lakes in this catchment.
Environment Agency River Basin Management Plan, Humber River Basin District 65 Main document December 2009

Figure 23 Map showing the current ecological status/potential for rivers in Dove catchment
© Environment Agency copyright and / or database right 2009. All rights reserved. This map includes data supplied under licence from: © Crown Copyright and database right 2009. All rights reserved. Ordnance Survey licence number 100026380. Some river features of this map are based on digital spatial data licensed from the Centre for Ecology and Hydrology, © CEH. Licence number 198 version 2. Some key actions for this catchment • Improve sewage treatment works to reduce the levels of nutrients including phosphate to
ensure no adverse impact on the Special Area of Conservation. • Target pollution prevention campaigns around industrial areas in the lower reaches of the
Dove catchment. • Investigate sources of poor water quality in waterbodies due to physical chemistry
determinands; the impact of abstractions and into the source and control of nitrates within the catchment.
• Continue to tackle diffuse pollution across the Dove and Churnet catchment with continued use of the England Catchment Sensitive Farming Delivery Initiative.
Environment Agency River Basin Management Plan, Humber River Basin District 66 Main document December 2009
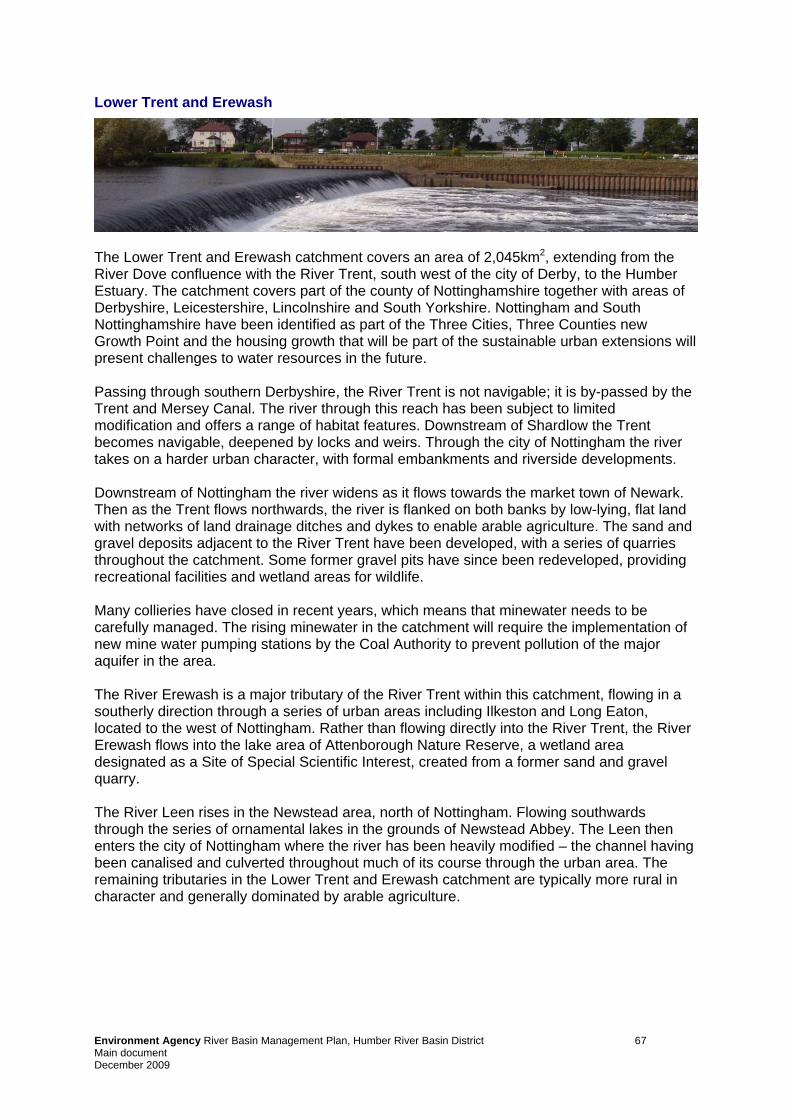
Lower Trent and Erewash
The Lower Trent and Erewash catchment covers an area of 2,045km2, extending from the River Dove confluence with the River Trent, south west of the city of Derby, to the Humber Estuary. The catchment covers part of the county of Nottinghamshire together with areas of Derbyshire, Leicestershire, Lincolnshire and South Yorkshire. Nottingham and South Nottinghamshire have been identified as part of the Three Cities, Three Counties new Growth Point and the housing growth that will be part of the sustainable urban extensions will present challenges to water resources in the future. Passing through southern Derbyshire, the River Trent is not navigable; it is by-passed by the Trent and Mersey Canal. The river through this reach has been subject to limited modification and offers a range of habitat features. Downstream of Shardlow the Trent becomes navigable, deepened by locks and weirs. Through the city of Nottingham the river takes on a harder urban character, with formal embankments and riverside developments. Downstream of Nottingham the river widens as it flows towards the market town of Newark. Then as the Trent flows northwards, the river is flanked on both banks by low-lying, flat land with networks of land drainage ditches and dykes to enable arable agriculture. The sand and gravel deposits adjacent to the River Trent have been developed, with a series of quarries throughout the catchment. Some former gravel pits have since been redeveloped, providing recreational facilities and wetland areas for wildlife. Many collieries have closed in recent years, which means that minewater needs to be carefully managed. The rising minewater in the catchment will require the implementation of new mine water pumping stations by the Coal Authority to prevent pollution of the major aquifer in the area. The River Erewash is a major tributary of the River Trent within this catchment, flowing in a southerly direction through a series of urban areas including Ilkeston and Long Eaton, located to the west of Nottingham. Rather than flowing directly into the River Trent, the River Erewash flows into the lake area of Attenborough Nature Reserve, a wetland area designated as a Site of Special Scientific Interest, created from a former sand and gravel quarry. The River Leen rises in the Newstead area, north of Nottingham. Flowing southwards through the series of ornamental lakes in the grounds of Newstead Abbey. The Leen then enters the city of Nottingham where the river has been heavily modified – the channel having been canalised and culverted throughout much of its course through the urban area. The remaining tributaries in the Lower Trent and Erewash catchment are typically more rural in character and generally dominated by arable agriculture.
Environment Agency River Basin Management Plan, Humber River Basin District 67 Main document December 2009

Table 16 Key statistics at a glance – Lower Trent & Erewash catchment River and lake water bodies Now 2015 % at good ecological status or potential 5 5 % assessed at good or high biological status (60 water bodies assessed) 17 17 % assessed at good chemical status (14 water bodies assessed) 86 86 % at good status overall (chemical and ecological) 5 5 % improving for one or more element in rivers 12
There are 76 river water bodies and nine lakes in the catchment. 30 are artificial or heavily modified. Three per cent of rivers (27 km) currently achieve good or better ecological status/potential. 17 per cent of rivers assessed for biology are at good or better biological status now, with 39 per cent at poor biological status, and six per cent at bad status. Diffuse pollution from agriculture and point source discharges from water industry sewage works are key reasons for failures in the catchment. Physical modifications for flood protection and abstractions also play a key role in determining the status of rivers and lakes in this catchment. Figure 24 Map showing the current ecological status/potential for rivers in Lower Trent & Erewash catchment
© Environment Agency copyright and / or database right 2009. All rights reserved. This map includes data supplied under licence from: © Crown Copyright and database right 2009. All rights reserved. Ordnance Survey licence number 100026380. Some river features of this map are based on digital spatial data licensed from the Centre for Ecology and Hydrology, © CEH. Licence number 198 version 2.
Environment Agency River Basin Management Plan, Humber River Basin District 68 Main document December 2009

Some key actions for this catchment • Phosphate removal to be applied to qualifying sewage treatment works in the catchment
under the Urban Waste Water Treatment Directive Sensitive Areas (eutrophic). • Works with Severn Trent Water Ltd to reduce the number of misconnections within the
catchment. • Address barriers to fish passage.
Case Study 5 The OnTrent Initiative The OnTrent Initiative is a major partnership project working to enhance the
heritage value of the River Trent and its floodplain. The initiative has been in place since the mid 1990’s and its key role is to deliver its agreed vision of ‘A Trent floodplain rich in wildlife habitats, landscape and historic features, for the benefit of all, both now and in the future’.
OnTrent aims to provide opportunities to improve the quality of life for local people and support the local economy by:
• Creating a rich diversity of linked wetland habitats along the Trent from
Stoke to the Humber Estuary. • Respecting and enhancing local distinctiveness, character and diversity of
the landscape. • Encouraging the adoption of sustainable practices in agriculture, forestry,
mineral extraction and building development. • Conserving and enhancing the cultural identity and historic environment of
the river valley. • Encouraging sustainable recreation and tourism. • Working with organisations and land managers to promote the value of
wetlands and where appropriate the re-establishment of natural processes in floodplains.
• Encouraging others to adapt to, and mitigate the effects of, climate change
Environment Agency River Basin Management Plan, Humber River Basin District 69 Main document December 2009
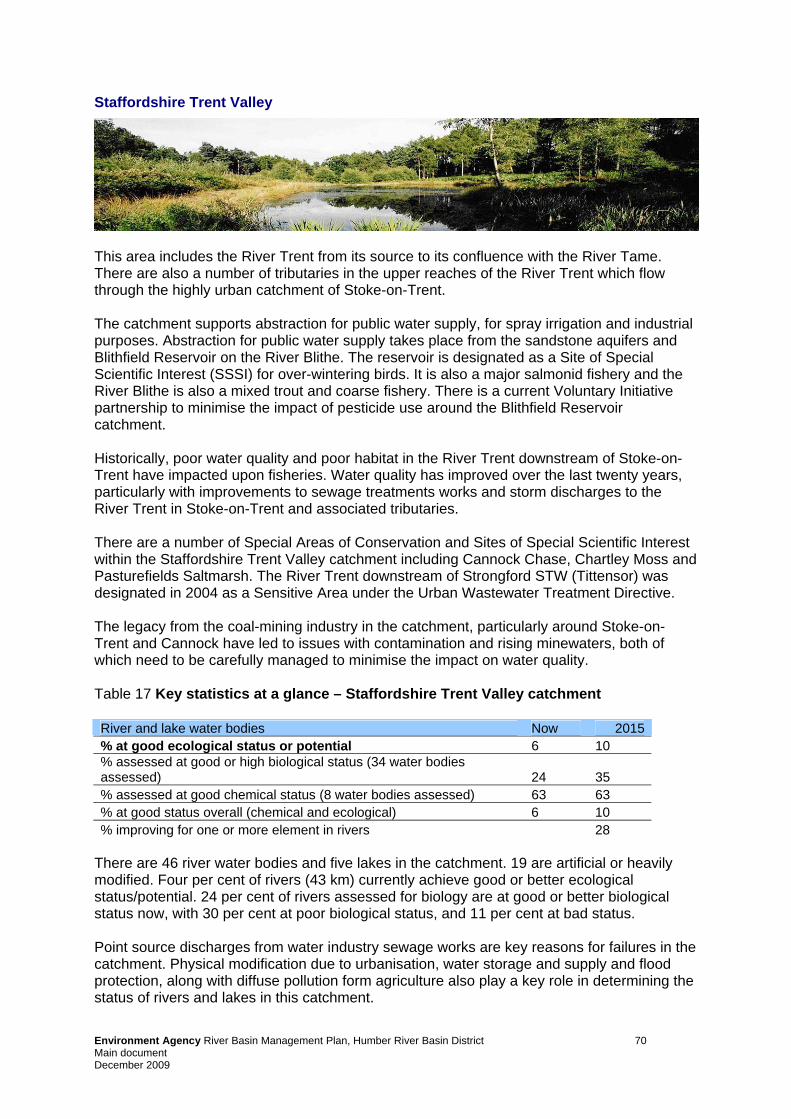
Staffordshire Trent Valley
This area includes the River Trent from its source to its confluence with the River Tame. There are also a number of tributaries in the upper reaches of the River Trent which flow through the highly urban catchment of Stoke-on-Trent. The catchment supports abstraction for public water supply, for spray irrigation and industrial purposes. Abstraction for public water supply takes place from the sandstone aquifers and Blithfield Reservoir on the River Blithe. The reservoir is designated as a Site of Special Scientific Interest (SSSI) for over-wintering birds. It is also a major salmonid fishery and the River Blithe is also a mixed trout and coarse fishery. There is a current Voluntary Initiative partnership to minimise the impact of pesticide use around the Blithfield Reservoir catchment. Historically, poor water quality and poor habitat in the River Trent downstream of Stoke-on-Trent have impacted upon fisheries. Water quality has improved over the last twenty years, particularly with improvements to sewage treatments works and storm discharges to the River Trent in Stoke-on-Trent and associated tributaries. There are a number of Special Areas of Conservation and Sites of Special Scientific Interest within the Staffordshire Trent Valley catchment including Cannock Chase, Chartley Moss and Pasturefields Saltmarsh. The River Trent downstream of Strongford STW (Tittensor) was designated in 2004 as a Sensitive Area under the Urban Wastewater Treatment Directive. The legacy from the coal-mining industry in the catchment, particularly around Stoke-on-Trent and Cannock have led to issues with contamination and rising minewaters, both of which need to be carefully managed to minimise the impact on water quality. Table 17 Key statistics at a glance – Staffordshire Trent Valley catchment River and lake water bodies Now 2015 % at good ecological status or potential 6 10 % assessed at good or high biological status (34 water bodies assessed) 24 35 % assessed at good chemical status (8 water bodies assessed) 63 63 % at good status overall (chemical and ecological) 6 10 % improving for one or more element in rivers 28
There are 46 river water bodies and five lakes in the catchment. 19 are artificial or heavily modified. Four per cent of rivers (43 km) currently achieve good or better ecological status/potential. 24 per cent of rivers assessed for biology are at good or better biological status now, with 30 per cent at poor biological status, and 11 per cent at bad status. Point source discharges from water industry sewage works are key reasons for failures in the catchment. Physical modification due to urbanisation, water storage and supply and flood protection, along with diffuse pollution form agriculture also play a key role in determining the status of rivers and lakes in this catchment.
Environment Agency River Basin Management Plan, Humber River Basin District 70 Main document December 2009

Figure 25 Map showing the current ecological status/potential for rivers in Staffordshire Trent Valley catchment
© Environment Agency copyright and / or database right 2009. All rights reserved. This map includes data supplied under licence from: © Crown Copyright and database right 2009. All rights reserved. Ordnance Survey licence number 100026380. Some river features of this map are based on digital spatial data licensed from the Centre for Ecology and Hydrology, © CEH. Licence number 198 version 2. Some key actions for this catchment • Improve sewage treatment works at a number of locations to reduce the levels of
phosphate under the requirements of the Urban Wastewater Treatment Directive. • Carry out investigations to determine the impact of abstractions in limiting the
achievement of good ecological potential. • Improve sewage treatment works at a number of locations where the measured dry
weather flow has exceeded the Consented flow. • Target pollution prevention campaigns around industrial areas in the upper Staffordshire
Trent Valley catchment, particularly around Stoke-on-Trent.
Environment Agency River Basin Management Plan, Humber River Basin District 71 Main document December 2009
Tame, Anker and Mease
This catchment includes the Rivers Tame, Rea, Cole, Bourne, Blythe, Anker, Sence, Mease and the River Trent from its confluence with the River Tame to the River Dove. The rivers within this catchment pass through mainly urban areas including Birmingham, Solihull, Nuneaton, Tamworth and Burton-upon-Trent. Heavy industry in the area has declined over recent years but pockets remain in urban areas. To the east and the north, much of the land outside the Birmingham conurbation is used for agriculture, particularly arable farming. Due to the highly urbanised nature of a large part of the catchment, the largest inputs to the system come from sewage treatment works. During low flow periods, a large proportion of the river flows is made up of these discharges. By far the largest input comes from Minworth sewage treatment works (STW) which discharges treated effluent from Birmingham into the River Tame at Water Orton. As the water supply for Birmingham comes from the Severn catchment, the Tame catchment is also a net importer of water. A major use of water in the Burton-upon-Trent area is for brewing, mineral washing, dust suppression and cooling water. This reflects the number of quarries in the lower part of the River Trent and the occurrence of power stations in the valley. Historically, water quality has also been the main cause for poor fisheries in the River Tame. A series of lakes at Lea Marston were created from old gravel workings in 1980 and the River Tame diverted through these lakes to provide settlement lagoons to protect downstream reaches from dry weather and storm impacts. This helps in mitigating large pollution events from affecting the lower reaches of the River Tame and downstream on the River Trent. The whole catchment is a very important angling resource for the highly populated area it serves and comprises of 80 or more clubs. The River Mease is a small lowland river designated as a Special Area of Conservation under the Habitats Directive. The River Blythe is a Site of Special Scientific Interest, designated as a fine example of a lowland river on clay. Table 18 Key statistics at a glance – Tame, Anker and Mease catchment River and lake water bodies Now 2015 % at good ecological status or potential 3 3 % assessed at good or high biological status (53 water bodies assessed) 19 26 % assessed at good chemical status (16 water bodies assessed) 75 75 % at good status overall (chemical and ecological) 3 3 % improving for one or more element in rivers 38
There are 61 river water bodies and three lakes in the catchment. 31 are artificial or heavily modified. Two per cent of rivers (3 km) currently achieve good or better ecological status/potential. 19 per cent of rivers assessed for biology are at good or better biological status now, with 40 per cent at poor biological status, and 17 per cent at bad status.
Environment Agency River Basin Management Plan, Humber River Basin District 72 Main document December 2009

Physical modifications due to urbanisation, water storage and supply and flood protection are key reasons for failures in the catchment. Point source discharges from water industry sewage works and diffuse run-off from urban areas also play a key role in determining the status of rivers and lakes in this catchment. Figure 26 Map showing the current ecological status/potential for rivers in Tame, Anker and Mease catchment
© Environment Agency copyright and / or database right 2009. All rights reserved. This map includes data supplied under licence from: © Crown Copyright and database right 2009. All rights reserved. Ordnance Survey licence number 100026380. Some river features of this map are based on digital spatial data licensed from the Centre for Ecology and Hydrology, © CEH. Licence number 198 version 2. Some key actions for this catchment • Improve sewage treatment works at a number of locations to reduce the levels of
phosphate, for the River Trent designation. • Target pollution prevention campaigns around industrial areas in the urban areas,
particularly around Birmingham and the Black Country. • Improve sewage treatment works at a number of locations in the River Mease catchment
to reduce the levels of phosphate in the SAC site.
Environment Agency River Basin Management Plan, Humber River Basin District 73 Main document December 2009

Soar
The catchment of the River Soar covers an area of approximately 1,380km2, covering much of the county of Leicestershire, together with small areas of south Nottinghamshire and north east Warwickshire. The whole of Leicestershire has been identified as part of the Three Cities, Three Counties new Growth Point and the housing growth that will be part of the sustainable urban extensions will present challenges to water resources in the future. The River Soar is a significant tributary of the River Trent. From its source, south east of Hinckley, the river follows a northerly course towards its confluence with the River Trent near Ratcliffe on Soar, south west of Nottingham. There are a number of important tributaries, including the Rivers Sence, Biam and Wreake and the Rothley, Black and Kingston Brooks. The Charnwood Reservoir Group, located in the north west of the catchment, includes Cropston, Swithland, Thornton, Blackbrook and Nanpantan Reservoirs. With the exception of Nanpantan, these waterbodies are impounding reservoirs, with civil agreements requiring compensation discharges to be made from Thornton Reservoir to the Rothley Brook and from Blackbrook Reservoir to the Black Brook, maintaining flow downstream of the dams. The geology of the Soar catchment is dominated by impermeable clays and marls with limited areas of permeable rocks that provide exploitable groundwater resources. In the north west of the catchment there are some limited outcrops of Sherwood Sandstone. More widespread through the river corridors of the catchment are alluvial sand and gravel deposits. Indicative of the industrial heritage of the area and the historic importance of trade, the Grand Union Canal is a prominent feature of the catchment. Joining the River Soar at Kings Lock in south Leicester, the canal and river are interwoven until downstream of Loughborough where the two merge to form a single, navigable watercourse until the confluence with the River Trent. Table 19 Key statistics at a glance – Soar catchment River and lake water bodies Now 2015 % at good ecological status or potential 9 9 % assessed at good or high biological status (41 water bodies assessed) 33 33 % assessed at good chemical status (9 water bodies assessed) 100 100 % at good status overall (chemical and ecological) 9 9 % improving for one or more element in rivers 2
There are 50 river water bodies and five lakes in the catchment. 18 are artificial or heavily modified. Ten per cent of rivers (62 km) currently achieve good or better ecological status/potential. 34 per cent of rivers assessed for biology are at good or better biological status now, with 36 per cent at poor biological status, and two per cent at bad status. Diffuse pollution from agriculture is the key reason for failures in the catchment. Physical modifications due to urbanisation and for water storage and supply and barriers to fish movement also play a key role in determining the status of rivers and lakes in this catchment.
Environment Agency River Basin Management Plan, Humber River Basin District 74 Main document December 2009

Figure 27 Map showing the current ecological status/potential for rivers in Soar catchment
© Environment Agency copyright and / or database right 2009. All rights reserved. This map includes data supplied under licence from: © Crown Copyright and database right 2009. All rights reserved. Ordnance Survey licence number 100026380. Some river features of this map are based on digital spatial data licensed from the Centre for Ecology and Hydrology, © CEH. Licence number 198 version 2. Some key actions for this catchment • Working with British Waterways, Leicester County Council, Angling clubs and Inlands
Waterways Association to remove floating Pennywort from the River Soar. • Investigate and assess water quality issues within Cropston Reservoir catchment,
including the Bradgate Brook which has been nominated as a Candidate Water Protection Zone.
• Improve sewage works at locations throughout the catchment to reduce the input of nutrients and improve water quality.
• Work with Severn Trent Water Ltd to reduce the number of misconnections within the catchment.
Environment Agency River Basin Management Plan, Humber River Basin District 75 Main document December 2009

Canals and surface water transfers
Canals and surface water transfers are one of the main ways society has modified the water environment to meet its needs. Surface water transfers move water from where it occurs naturally to where it is needed, whilst canals are a major part of the network of inland waterways. Most of the canals were built around 200 years ago, before railways and motorways, to serve the coalfields and industrial revolution. They were the focus of the industrial revolution, providing links between towns and cities. For example, the Grand Union Canal linking Birmingham to London, and the Leeds Liverpool Canal. Despite a period of decline following the development of the railways, the canal system is again in good shape with an important role for recreational boating, angling, cycling and walking. Canals and rivers are also still used to transport goods. Birmingham is said to have more canals than Venice. In the middle of the eighteenth century there were 280 kilometres of canal in the area; now only 184 kilometres remain as navigable water. Some canals have become important habitats for wildlife, for example Pocklington Canal has been designated a SSSI and is one of the most important waterways for wildlife in Britain owing to its wide range of plants, animals and birds. Supplying canals with water and surface water transfers can place pressure on the environment that the water is abstracted from. There are 73 canals and ten surface water transfers in the Humber River Basin District. 53 per cent of canals currently achieve good or better ecological potential. And this is expected to increase to 56 per cent by 2015. 85 per cent of canals are at least good chemical status and three per cent of canals are expected to improve for at least one element by 2015.
Environment Agency River Basin Management Plan, Humber River Basin District 76 Main document December 2009
Estuaries and coastal water bodies
The Humber Basin has over 165 kilometres of coastline, 330 hundred square kilometres of estuaries and 22 designated bathing waters as well as many important marine species and habitats. The Humber Estuary is the largest in the United Kingdom, with a catchment draining one fifth of the area of England. The Humber Estuary is vital to the region's economy, particularly their contribution to the tourism and leisure industry and the ports, harbours, shipping and associated industries they support. The main pressures on Humber Estuary are pollution from industrial discharges, nutrient and microbiological contamination from run-off and sewage. Classification shows that the Humber Estuary is falling short of good potential because of the morphological conditions which will need further investigation. In contrast the Esk Estuary and the coastal water body meet good status. Tourism is a vital industry along the Yorkshire and Lincolnshire coasts with main centres at the resorts of Scarborough, Bridlington and Cleethorpes. Bathing water quality dropped slightly in the Humber RBD in 2008 after a very wet summer. The high summer rainfall caused an increase in storm overflows from sewers, a rise in diffuse pollution and run-off from farmland, which impacted on bathing waters. Delivering compliance with the revised bathing waters directive is a high priority for this plan. By 2015, significant progress will be made in resolving these issues as a result of the measures laid out in this plan. The Environment Agency is also working with partners to develop and deliver a habitat creation programme to safeguard the diverse estuarine and coastal habitats. Table 20 Key statistics at a glance – Estuaries and coastal waters Estuaries Coastal Now 2015 Now 2015% at good ecological status or potential 14 14 86 86 % assessed at good or high biological status (11 water bodies assessed) 0 0 83 83 % assessed at good chemical status (5 water bodies assessed) 0 33 100 100 % at good status overall (chemical and ecological) 14 14 86 86 % improving for one or more element 14 0
Environment Agency River Basin Management Plan, Humber River Basin District 77 Main document December 2009

Groundwater
Groundwaters are an important resource in the Humber River Basin District. A significant proportion of drinking water comes from the groundwaters of the chalk and sandstone in this District. The main pressures on groundwaters are abstraction for drinking water supply and contamination with nitrates and pesticides. Historic mining in the west on the coal measures has had a significant impact on the groundwater quality. Unsustainable abstraction from groundwater can lower groundwater levels and affect dependent river flows or wetlands, or can induce the intrusion of poorer quality water from the sea or from deeper aquifers. Investigations are ongoing to understand better the potential impact that major groundwater abstractions may have on the quantity and quality of groundwater in this district. Coupled with this, investigation is ongoing into the impacts of diffuse pollutants such as nitrate and pesticides and what actions may be practical to take to reverse upward trends in these contaminants. Table 21 Key statistics at a glance – Groundwater Groundwater Now 2015% at good quantitative status 89 89% assessed at good chemical status (9 water bodies assessed) 33 33% at good status overall 33 33
Environment Agency River Basin Management Plan, Humber River Basin District 78 Main document December 2009
9 Next steps – implementing this plan Diffuse pollution investigation and action
In developing the River Basin Management Plans approximately 8,500 investigations have been identified for England and Wales, including further monitoring. The vast majority of these will be undertaken by the Environment Agency and all of these will be completed by the end of 2012. The investigations will focus on resolving what is causing the problem and what the best method to tackle it is. As a result of the evidence they will provide, we will be able to take further action in the first cycle where practicable. The remainder of the investigations – including over 100 water company catchment management investigations – will be carried out by co-deliverers across England and Wales during the course of the first delivery cycle. Working with the river basin district liaison panels, the Environment Agency will welcome the input of local data and knowledge from other parties to help drive action at catchment level. We are confident the investigation programme will lead to actions enabling a further reduction in diffuse pollution and more environmental improvement before 2015. As we have said earlier, the Environment Agency is already committed to delivering, through its own work or through working with others, an additional two per cent improvement towards good status or potential by 2015 across England and Wales
Additional national measures
In addition to commitments already provided, the UK Government and Welsh Assembly Government will continue to demonstrate their commitment and bring forward significant work starting with; • banning phosphates in household laundry detergents; • a new requirement contained within the Flood and Water Management Bill making the
right to connect to surface water sewers contingent on Sustainable Drainage Systems (SuDS) being included in new developments. Local authorities will be responsible for adopting and maintaining SuDS that serve multiple properties and the highways authorities will maintain them in all adopted roads;
• general binding rules to tackle diffuse water pollution by targeting abuse of drainage systems, potentially including industrial estates, car washes and construction by 2012;
• transferring the responsibility for misconnections to water companies by 2012; • the Water Protection Zones Statutory Instrument which will enter into force on 22
December 2009 and will be used to tackle diffuse pollution where voluntary measures are not sufficient;
• more funding for the Catchment Sensitive Farming Delivery Initiative in England from 2010 – a 50% increase in capital grant spend, and evaluation of the initiative to ensure it is achieving maximum effectiveness;
• better targeting of agri-environment schemes for water protection. In Wales, this includes aligning the forthcoming “Glastir” agri-environment scheme to contribute towards meeting Water Framework Directive requirements;
• supporting the farming industry in the Campaign for the Farmed Environment, which has reducing impacts on water quality as one of its priorities;
• encouraging farmers to use buffer strips to reduce diffuse pollution through guidance and advice provided under cross compliance;
• better understanding of the impact of sediment and measures to tackle it as a result of the additional funding announced in June 2009;
• further consideration of the impact of cross compliance and good agricultural and environmental conditions (GAEC) on water quality;
Environment Agency River Basin Management Plan, Humber River Basin District 79 Main document December 2009
• implementation of the Sustainable Use of Pesticides Directive; • Environmental Permitting Regulations guidance setting essential standards of location,
operation and maintenance for septic tanks.
These and the other actions in the plans will lead towards a greater achievement of good status and improvement within class, with more than a quarter of the length of all rivers improving. Implementing the plans at catchment level
The Environment Agency has found river basin liaison panels extremely valuable, and will continue to work with them throughout the plan delivery period. The panels will help to encourage river basin district-wide action through their sectors, monitor overall progress and prepare for the second cycle of River Basin Management Planning.
Given that implementation requires activity ‘on the ground’, it is essential that there is the maximum involvement and action from locally based organisations and people. Innovative ways of working together need to be identified that will deliver more for the environment than has been captured in this plan.
The Environment Agency will adopt a catchment-based approach to implementation that is efficient and cost-effective. This will support the liaison panels, complement existing networks and relationships, and enable better dialogue and more joined up approaches to action.
In some places there will be added value from adopting more detailed catchment plans to help deliver the River Basin Management Plan objectives during the planning cycles. The River Kennet is a case in point where we have set up a pilot group with a range of stakeholders. We will share the knowledge gained with the liaison panels, to help identify other catchments that could benefit from a similar approach. Working with co-deliverers This plan sets out in detail the actions required to improve the water environment. All organisations involved must play their part, record their progress and make the information available.
Where the work of a public body affects a river basin district, that body has a general duty to have regard to the River Basin Management Plan. Ministerial guidance states that the Environment Agency should:
• work with other public bodies to develop good links between river basin management planning and other relevant plans and strategies, especially those plans that have a statutory basis such as the Local Development Plans and Wales Spatial Plan;
• encourage public bodies to include Water Framework Directive considerations in their plans, policies, guidance, appraisal systems and casework decisions.
For some, the actions in this plan may be voluntary and for others they will be required under existing legislation. We want to work with you to make these actions happen, and identify new action to create a better place. Reporting on progress The Environment Agency will use its environmental monitoring programme and, where appropriate, information from other monitoring programmes, to review whether work on the ground is achieving the environmental objectives. We will update the classification status of
Environment Agency River Basin Management Plan, Humber River Basin District 80 Main document December 2009
Environment Agency River Basin Management Plan, Humber River Basin District 81 Main document December 2009
water bodies accordingly and review progress annually. At the end of 2012 a formal interim report will be published. This will: • describe progress in implementing the actions set out in this plan; • set out any additional actions established since the publication of this plan; • assess the progress made towards the achievement of the environmental objectives. Preparations have already begun for the next cycle period 2015 to 2021 and for the subsequent cycle to 2027. If you have proposals for actions that can be included in these future cycles please contact us. River basin management milestones The plan builds on a number of other documents and milestones required by the Water Framework Directive. The work to date has ensured a strong evidence base, and a framework for dialogue with interested organisations and individuals. In terms of taking this plan forwards, it helps to understand the major milestones remaining. These future milestones are summarised in the figure below.

Figure 28 River basin district management planning milestones to date and to 2015
Environment Agency River Basin Management Plan, Humber River Basin District Main Document December 2009 82
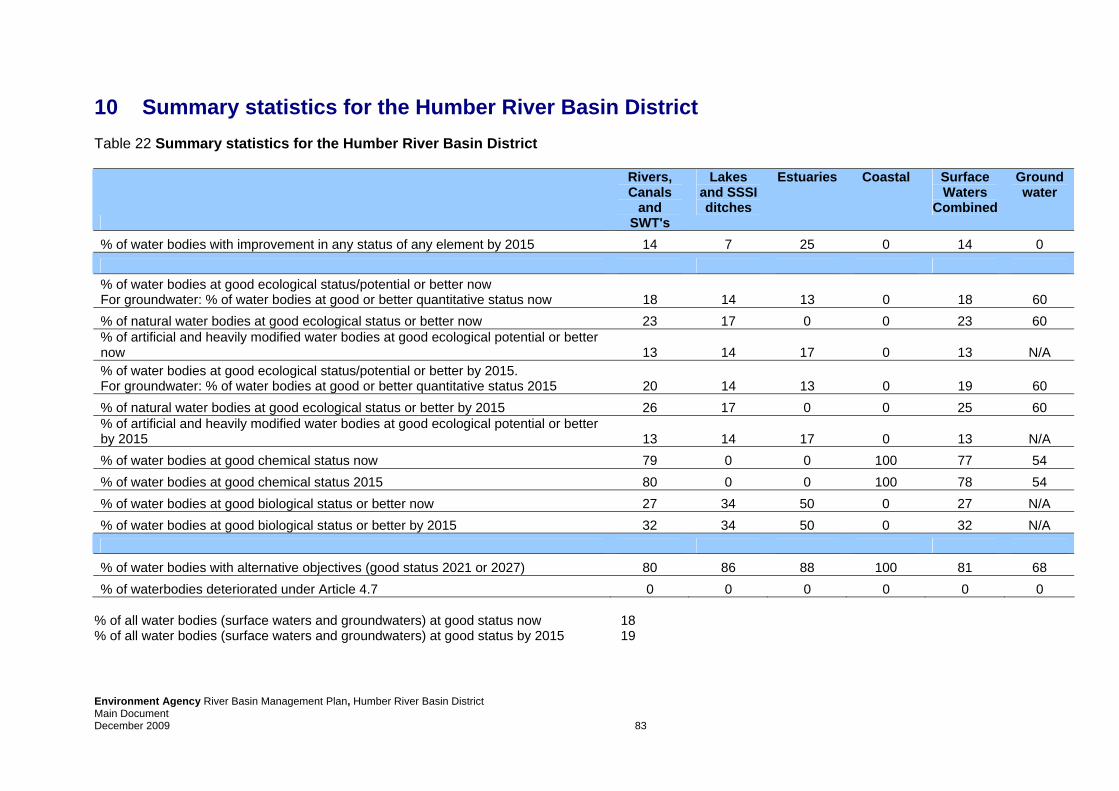
Environment Agency River Basin Management Plan, Humber River Basin District Main Document December 2009 83
10 Summary statistics for the Humber River Basin District Table 22 Summary statistics for the Humber River Basin District
Rivers, Canals
and SWT's
Lakes and SSSI ditches
Estuaries Coastal Surface Waters
Combined
Groundwater
% of water bodies with improvement in any status of any element by 2015 14 7 25 0 14 0 % of water bodies at good ecological status/potential or better now For groundwater: % of water bodies at good or better quantitative status now 18 14 13 0 18 60 % of natural water bodies at good ecological status or better now 23 17 0 0 23 60 % of artificial and heavily modified water bodies at good ecological potential or better now 13 14 17 0 13 N/A % of water bodies at good ecological status/potential or better by 2015. For groundwater: % of water bodies at good or better quantitative status 2015 20 14 13 0 19 60 % of natural water bodies at good ecological status or better by 2015 26 17 0 0 25 60 % of artificial and heavily modified water bodies at good ecological potential or better by 2015 13 14 17 0 13 N/A % of water bodies at good chemical status now 79 0 0 100 77 54 % of water bodies at good chemical status 2015 80 0 0 100 78 54 % of water bodies at good biological status or better now 27 34 50 0 27 N/A % of water bodies at good biological status or better by 2015 32 34 50 0 32 N/A % of water bodies with alternative objectives (good status 2021 or 2027) 80 86 88 100 81 68 % of waterbodies deteriorated under Article 4.7 0 0 0 0 0 0
% of all water bodies (surface waters and groundwaters) at good status now 18 % of all water bodies (surface waters and groundwaters) at good status by 2015 19

Environment Agency River Basin Management Plan, Humber River Basin District Main Document December 2009 84
11 Further information – the annexes Annex A Current state of waters in the Humber River Basin District
What the waters are like now. Information on our network of monitoring stations, the classification status of water bodies and the reference conditions for each of the water body types in the river basin district.
Annex B Water body status objectives for the Humber River Basin District Information on water body status and objectives
Annex C Actions to deliver objectives Details of the actions planned (programmes of measures) for each sector to manage the pressures on the water environment and achieve the objectives of this plan.
Annex D Protected area objectives Details of the location of protected areas, the monitoring network, environmental objectives and the actions required to meet Natura 2000 sites and Drinking Water Protected Area objectives.
Annex E Actions appraisal and justifying objectives Information about how we have set the water body objectives for this plan and how we selected the actions. It also includes justifications for alternative objectives that have been set.
Annex F Mechanisms for action More detail about the mechanisms (i.e. policy, legal, financial tools) that are use to drive actions.
Annex G Pressures and risks Information about the significant pressures and risks resulting from human activities on the status of surface water and groundwater.
Annex H Adapting to climate change Information on how climate change may affect the pressures on the water environment and the ability to meet the objectives.
Annex I Designating artificial and heavily modified water bodies Information about the criteria used to designate waters as artificial or heavily modified water bodies.
Annex J Aligning other key processes to river basin management Aligning planning processes to deliver multiple benefits and sustainable outcomes
Annex K Economic analysis of water use Information about the costs of water services within the river basin district
Annex L Record of consultation and engagement Details of how we have worked with interested parties to develop this plan
Annex M Competent authorities List of the competent authorities responsible for river basin management planning.
Annex N Glossary Explanation of technical terms and abbreviations.

Would you like to find out more about us, or about your environment? Then call us on 08708 506 506 (charged at local rates) email [email protected] or visit our website www.environment-agency.gov.uk incident hotline 0800 80 70 60 (Freephone 24 hour) Calls from mobile phones are not free and will be charged at normal network operator's call rates floodline 0845 988 1188 (24 hour)
Environment Agency River Basin Management Plan, Humber River Basin District 85 Main document December 2009