hungary energy efficiency report - energy information service
TRANSCRIPT
1 Hungary | Country reports
HungaryEnergy efficiency report
Objectives:
– 9% of end-user energy savings by 2016 (1.4 Mtoe) –14.6%shareofrenewablesinfinalenergyconsumptionin2020– 10.9% share of renewables in electricity production in 2020
Overview 2009 2000-2009 (% / year)
Primaryintensity(EU=100)1 121 - -2.2% +CO2intensity(EU=100) 111 - -3.2% +CO2emissionspercapita(intCO2 / cap) 4.9 + -0.8% -Power generation 2009 2000-2009 (% / year)Efficiencyofthermalpowerplants(in%) 33 - 0.9% +Rate of electricity T&D losses (in %) 9 -- -4.0% ++CO2emissionsperkWhgenerated(ingCO2 /kWh) 307 + -3.2% ++Industry 2009* 2000-2009* (% / year)Energyintensity(EU=100) 82 ++ -2.9% +ShareofindustrialCHPinindustryconsumption(in%) 3 -- -5.8% --Unitconsumptionofsteel(intoe/t) 0.43 + -3.4% +*2008 and 2000-2008 for steel
1 TheEuropeanUnion,asthebest-performingregion,isusedasthebenchmark.
Latest update: January 2011
++ Amongbestcountries + BetterthantheEUaverage - BelowtheEUaverage -- Amongcountrieswithlowestperformances
Country reports | Hungary 2
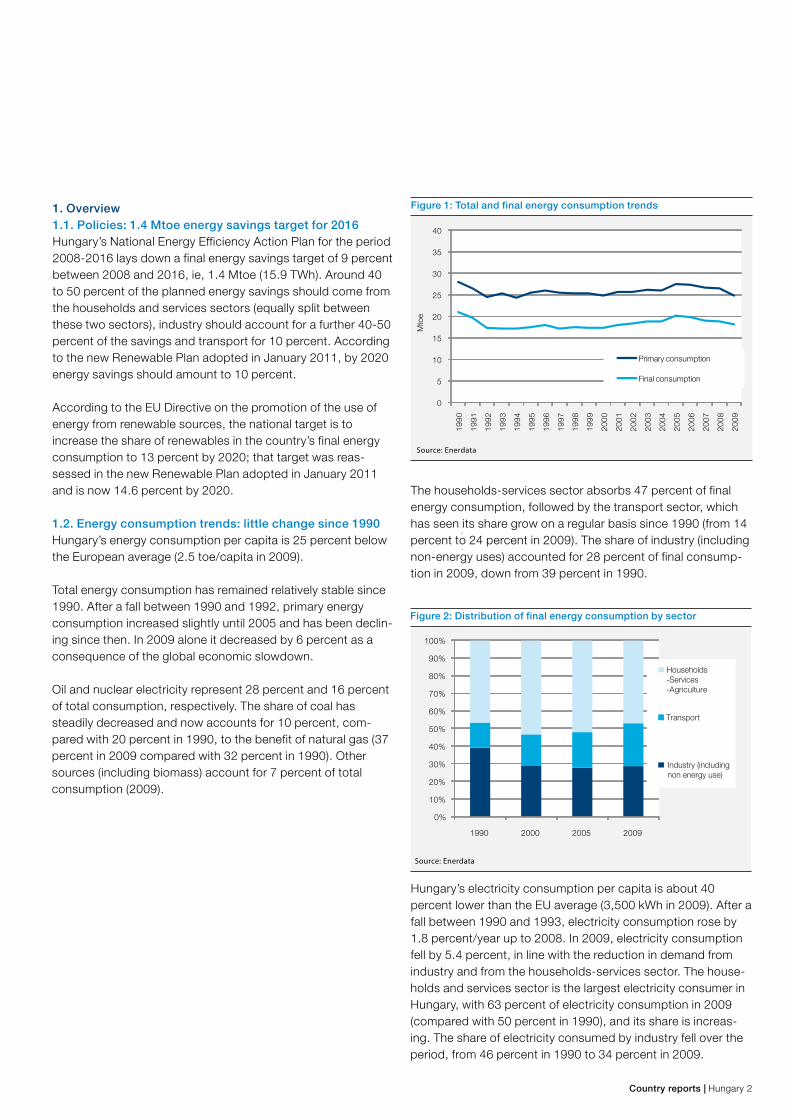
1. Overview1.1. Policies: 1.4 Mtoe energy savings target for 2016Hungary’s National Energy Efficiency Action Plan for the period 2008-2016 lays down a final energy savings target of 9 percent between2008and2016,ie,1.4Mtoe(15.9TWh).Around40to50percentoftheplannedenergysavingsshouldcomefromthe households and services sectors (equally split between thesetwosectors),industryshouldaccountforafurther40-50percent of the savings and transport for 10 percent. According tothenewRenewablePlanadoptedinJanuary2011,by2020energysavingsshouldamountto10percent.
AccordingtotheEUDirectiveonthepromotionoftheuseofenergyfromrenewablesources,thenationaltargetistoincrease the share of renewables in the country’s final energy consumptionto13percentby2020;thattargetwasreas-sessed in the new Renewable Plan adopted in January 2011 and is now 14.6 percent by 2020.
1.2. Energy consumption trends: little change since 1990Hungary’senergyconsumptionpercapitais25percentbelowthe European average (2.5 toe/capita in 2009).
Totalenergyconsumptionhasremainedrelativelystablesince1990.Afterafallbetween1990and1992,primaryenergyconsumptionincreasedslightlyuntil2005andhasbeendeclin-ing since then. In 2009 alone it decreased by 6 percent as a consequenceoftheglobaleconomicslowdown.
Oil and nuclear electricity represent 28 percent and 16 percent oftotalconsumption,respectively.Theshareofcoalhassteadilydecreasedandnowaccountsfor10percent,com-paredwith20percentin1990,tothebenefitofnaturalgas(37percentin2009comparedwith32percentin1990).Othersources(includingbiomass)accountfor7percentoftotalconsumption(2009).
Source: Enerdata
0
5
10
15
20
25
30
35
40
1990
1991
1992
1993
1994
1995
1996
1997
1998
1999
2000
2001
2002
2003
2004
2005
2006
2007
2008
2009
Mto
e
Primary consumption
Final consumption
Figure 1: Total and final energy consumption trends
The households-services sector absorbs 47 percent of final energyconsumption,followedbythetransportsector,whichhasseenitssharegrowonaregularbasissince1990(from14percent to 24 percent in 2009). The share of industry (including non-energyuses)accountedfor28percentoffinalconsump-tionin2009,downfrom39percentin1990.
Source: Enerdata
0%
10%
20%
30%
40%
50%
60%
70%
80%
90%
100%
1990 2000 2005 2009
Households-Services-Agriculture
Transport
Industry (including non energy use)
Hungary’selectricityconsumptionpercapitaisabout40percentlowerthantheEUaverage(3,500kWhin2009).Afterafallbetween1990and1993,electricityconsumptionroseby1.8percent/yearupto2008.In2009,electricityconsumptionfellby5.4percent,inlinewiththereductionindemandfromindustryandfromthehouseholds-servicessector.Thehouse-holdsandservicessectoristhelargestelectricityconsumerinHungary,with63percentofelectricityconsumptionin2009(comparedwith50percentin1990),anditsshareisincreas-ing.Theshareofelectricityconsumedbyindustryfellovertheperiod,from46percentin1990to34percentin2009.
Figure 2: Distribution of final energy consumption by sector

3 Hungary | Country reports
HungaryEnergy efficiency report
Source: Enerdata
0
5
10
15
20
25
30
35
1990
1991
1992
1993
1994
1995
1996
1997
1998
1999
2000
2001
2002
2003
2004
2005
2006
2007
2008
2009
TWh
Industry Others
Figure 3: Electricity consumption trends by sector
1.3. Energy efficiency and CO2 trends: significant energy intensity reduction TotalenergyconsumptionperunitofGDP(primaryenergyintensity) has decreased by 2.1 percent/year since 1990. This gaininoverallenergyefficiencywasfasterthantheimprove-mentintheEU(1.7percent/yearbetween1990and2009),butHungary’sprimaryenergyintensity,measuredatpurchasingpowerparity,remains20percenthigherthantheEUaverage. Hungary’sfinalenergyconsumptionperunitofGDP(finalintensity) decreased by 2.3 percent/year between 1990 and 2009,thankstoefficiencygainsintheindustrialsector.Owingto the high share of low-efficiency power plants in electricity production(over80percentbetween1990and2000),theseefficiencygainswereonlypartiallytransferredtotheprimaryenergy intensity. Efficiency gains in the power sector since 2000(replacementofoilandcoal-firedfacilitiesbygas-firedunits)contributedtothereductioninprimaryintensitybetween2000 and 2009.
CO2 intensity (CO2emissionsperunitofGDP)droppedby2.9percent/yearbetween1990and2009,ie,slightlyfasterthanprimaryenergyintensity,duetotheuseofalternativelow-car-bon fuels. Fuel substitutions account for about 20 percent of thatreduction,whilethereductioninenergyintensityexplainstheremaining80percent.
Source: Enerdata
-3.5%
-3.0%
-2.5%
-2.0%
-1.5%
-1.0%
-0.5%
0.0%
%/y
ear
1990-2009 2000-2009
Final energy intensityCO2 intensity
Primary energy intensity
Figure 4: Energy and CO2 intensity trends
2. Power generation2.1. Policies: 9.5 TWh of renewable electricity by 2020Hungary’s strategy on renewable energy sources 2007-2020 aimstoincreasethepowerproductionfromrenewableener-giesto9.5TWhby2020.InthenewplanonrenewablesadoptedinJanuary2011,atargetof10.9percentoftotalelectricity production was set for renewables by 2020. To improveCO2emissions,newdevelopmentsinthecountry’snuclear capacity are under consideration.
In 2003 Hungary introduced feed-in tariffs for electricity pro-ducedfromPV,wind,biomassandbiogas,andsmallhydro.Feed-in tariffs can be applied to CHP installations. The govern-mentisintroducinggreencertificates,whichwillbemandatoryforpowerproducers(fromCHP)andsellersfromJan.1,2012.Thissystemcouldlaterreplacethefeed-intariffforRenewableEnergy Resources (RES)-electricity.
InvestmentsinrenewableenergyaresupportedthroughgrantsbytheEnvironmentProtectionandInfrastructureOperativeProgram(EIOP).AsplannedintheNationalEnergyConserva-tionProgram2008(NEP2008),investmentsinfacilitiespro-ducingelectricityfromrenewablesareeligibleforsubsidiescovering25percentoftheinvestment.
2.2. Power generation trends by source: nuclear and thermal Hungary’selectricitymixisdividedbetweennuclearpower(43percentin2009,comparedwith48percentin1990)andthermalgeneration(49percentin2009,comparedwith51percentin1990).Withinfossilfuels,theshareofnaturalgasinpowerproductionhasrisensteadily,from16percentin1990to38percentin2008,whilethesharesofcoalandoilhavedecreasedsteadily,from30percentand5percent,respec-tively,to18percentand2percent.In2009,thelowerelectric-

Country reports | Hungary 4
itydemandalteredthefuelmixtothebenefitofnuclearenergy.Biomass-firedgenerationnowaccountsfor7percent(com-paredwith1percentin2003)andwindremainsmarginal(1percent).
Figure 5: Power generation by source
2.3. Efficiency of the power sector: low, but improving TheefficiencyofthepowersectorinHungaryispoor,sincelow-efficiency technologies (nuclear and coal-fired power plants)dominatethepowermix.However,theelectricitysectorhasimproveditsefficiencyovertheyears,from29percentin1990to33percentin2009,thankstoefficiencyimprovementsinthermalpowerplants,anincreasingshareofCCGTfacilitiesinthethermalmix(from8percentin1990to18percentin2009) and a shift to gas.
Source: Enerdata
20
22
24
26
28
30
32
34
36
Total power generation
%
1990
1991
1992
1993
1994
1995
1996
1997
1998
1999
2000
2001
2002
2003
2004
2005
2006
2007
2008
2009
Thermal power plants
Figure 6: Efficiency of power generation and thermal power plants
Source: Enerdata
0
1
2
3
4
5
6
7
8
1990
1991
1992
1993
1994
1995
1996
1997
1998
1999
2000
2001
2002
2003
2004
2005
2006
2007
2008
2009
GW
Gas turbines Combined cyclesSteam
Figure 7: Thermal electricity capacity, by technology
TherateofT&Dlosseswasslightlyabove9percentin2009,ie,43percenthigherthantheEUaverage,despiteasignificantdecrease since 1993 (– 40 percent). Those losses were over 13 percentbetween1993and2001,andweremainlyduetoelectricitytheftratherthantechnicalproblems.
Source: Enerdata
3
5
7
9
11
13
15
1990
1991
1992
1993
1994
1995
1996
1997
1998
1999
2000
2001
2002
2003
2004
2005
2006
2007
2008
2009
%
Figure 8: Electric T&D losses
The average CO2emissionfactorforelectricitygenerationfelldramaticallybetween1993and2009,fromaround440gCO2/kWhto310gCO2/kWh,andisnow9percentlowerthantheEUaverage(340gCO2/kWh).Thisimprovementisduetothedecliningshareofcoal-firedandoil-firedgeneration,tothebenefit of gas-fired generation. The high share of nuclear also helpslimitCO2emissions(theincreaseinthecarbonfactorin2003islinkedtoadropinnucleargeneration).
Source: Enerdata
0
5
10
15
20
25
30
35
40
1990 2000 2009
TWh
TWh
*Including biomass, geothermal and solar
Other*
Wind
Hydro
Nuclear
Gas
Oil
Coal-Lignite
5 Hungary | Country reports
HungaryEnergy efficiency report
Source: Enerdata
200
250
300
350
400
450
500
550
600
1990
1991
1992
1993
1994
1995
1996
1997
1998
1999
2000
2001
2002
2003
2004
2005
2006
2007
2008
2009
gCO
₂/kW
h
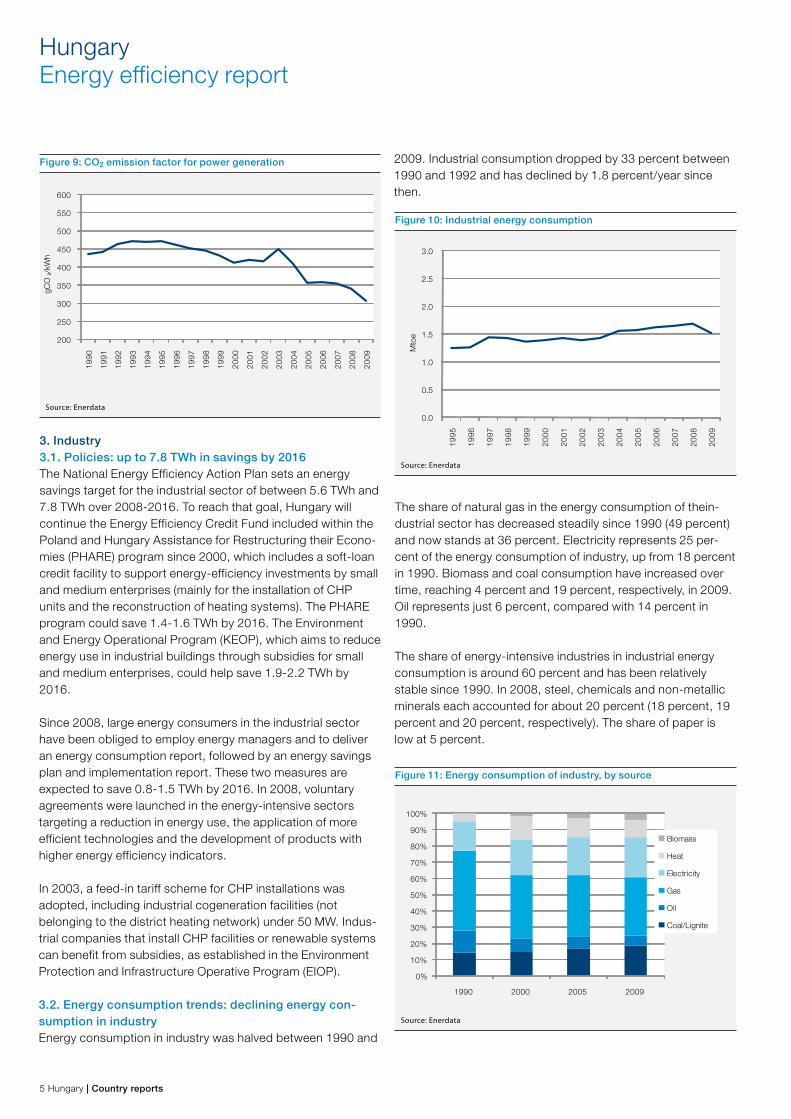
Figure 9: CO2 emission factor for power generation
3. Industry3.1. Policies: up to 7.8 TWh in savings by 2016The National Energy Efficiency Action Plan sets an energy savingstargetfortheindustrialsectorofbetween5.6TWhand7.8TWhover2008-2016.Toreachthatgoal,Hungarywillcontinue the Energy Efficiency Credit Fund included within the Poland and Hungary Assistance for Restructuring their Econo-mies(PHARE)programsince2000,whichincludesasoft-loancreditfacilitytosupportenergy-efficiencyinvestmentsbysmallandmediumenterprises(mainlyfortheinstallationofCHPunitsandthereconstructionofheatingsystems).ThePHAREprogramcouldsave1.4-1.6TWhby2016.TheEnvironmentandEnergyOperationalProgram(KEOP),whichaimstoreduceenergyuseinindustrialbuildingsthroughsubsidiesforsmallandmediumenterprises,couldhelpsave1.9-2.2TWhby2016.
Since2008,largeenergyconsumersintheindustrialsectorhavebeenobligedtoemployenergymanagersandtodeliveranenergyconsumptionreport,followedbyanenergysavingsplanandimplementationreport.Thesetwomeasuresareexpectedtosave0.8-1.5TWhby2016.In2008,voluntaryagreementswerelaunchedintheenergy-intensivesectorstargetingareductioninenergyuse,theapplicationofmoreefficienttechnologiesandthedevelopmentofproductswithhigher energy efficiency indicators.
In2003,afeed-intariffschemeforCHPinstallationswasadopted,includingindustrialcogenerationfacilities(notbelongingtothedistrictheatingnetwork)under50MW.Indus-trialcompaniesthatinstallCHPfacilitiesorrenewablesystemscanbenefitfromsubsidies,asestablishedintheEnvironmentProtectionandInfrastructureOperativeProgram(EIOP).
3.2. Energy consumption trends: declining energy con-sumption in industry Energyconsumptioninindustrywashalvedbetween1990and
2009.Industrialconsumptiondroppedby33percentbetween1990 and 1992 and has declined by 1.8 percent/year since then.
Source: Enerdata
0.0
0.5
1.0
1.5
2.0
2.5
3.0
1995
1996
1997
1998
1999
2000
2001
2002
2003
2004
2005
2006
2007
2008
2009
Mto
e
Figure 10: Industrial energy consumption
Theshareofnaturalgasintheenergyconsumptionofthein-dustrial sector has decreased steadily since 1990 (49 percent) and now stands at 36 percent. Electricity represents 25 per-centoftheenergyconsumptionofindustry,upfrom18percentin1990.Biomassandcoalconsumptionhaveincreasedovertime,reaching4percentand19percent,respectively,in2009.Oilrepresentsjust6percent,comparedwith14percentin1990.
The share of energy-intensive industries in industrial energy consumptionisaround60percentandhasbeenrelativelystablesince1990.In2008,steel,chemicalsandnon-metallicmineralseachaccountedforabout20percent(18percent,19percentand20percent,respectively).Theshareofpaperislow at 5 percent.
Source: Enerdata
0%
10%
20%
30%
40%
50%
60%
70%
80%
90%
100%
1990 2000 2005 2009
Biomass
Heat
Electricity
Gas
Oil
Coal/Lignite
Figure 11: Energy consumption of industry, by source

Country reports | Hungary 6
3.3. Energy intensity trends: noticeable energy efficiency improvementBetween 1992 and 2008 industrial energy intensity decreased by6percent/year.Thatimprovementwasduetoefficiencygainsinthesteelsector(-5.4percent/year),butalsotochang-es in the structure of industry (rising share of industrial branch-es with lower energy intensity). The increases in the specific energyconsumptionofotherenergy-intensiveindustrieshavelimitedtheeffectoftheseenergyefficiencyimprovements.
TheshareofindustrialCHPintheelectricityconsumptionofHungarianindustryisfarbelowtheEUaverage(around3percentin2009comparedwith17percentintheEU)andhasbeen decreasing since 1996.
Between1992and2008theenergyintensityofthemanufac-turingindustry(ie,excludingconstructionandmining)fellsubstantially,by7.7percent/year.Thisimprovementwasduetoefficiencygainsintheindustrialbranches,butalsotochang-es in the structure of the industrial value added: the share of theequipmentsector-thebranchwiththelowestenergyintensity-inthetotalvalueaddedofmanufacturingincreasedby nearly 17 percentage points between 2000 and 2008. Structuralchangesexplainabout40percentoftheoverallreduction since 1992 and 30 percent since 2000.
Source: Enerdata
-9%
-8%
-7%
-6%
-5%
-4%
-3%
-2%
-1%
1992 -2008 2000 -2008
Real variationChange at constant structureStructural effect
%/y
ear
Figure 15: Trend in energy intensity of manufacturing
and structural effect
AllinformationordataprovidedbyEnerdata,inanyform,isthepropertyofEnerdataandisprotectedineach country by national laws governing intellectual property.AllinformationordataprovidedbyEn-erdataiscopyrightprotected,inclusiveofmaterialappearinginahardcopyformatorelectronically.DataprovidedbyEnerdataarebasedoncompilati-on and analysis of the best sources in the industry. Enerdatahasagreementswiththoseproviderstouse and publish this data.
All pictures Copyright ABB
Source: Enerdata
*Including construction and mining
Total* Steel Cement PaperChemical
-7%
-6%
-5%
-4%
-3%
-2%
-1%
0%
1%
2%
3%
1992 - 2008 2000 - 2008
%/y
ear
Figure 13: Trends in the energy intensity of industrial branches
Source: Enerdata
0%
2%
4%
6%
8%
10%
12%
1990
1991
1992
1993
1994
1995
1996
1997
1998
1999
2000
2001
2002
2003
2004
2005
2006
2007
2008
2009
Figure 14: Share of industrial CHP in industrial consumption
Source: Enerdata
Other
Paper
Non metallic minerals
Chemical
Steel
0%
10%
20%
30%
40%
50%
60%
70%
80%
90%
100%
1995 2000 2005 2008
Figure 12: Energy consumption of industry, by branch