hungary: mother’s employment and children poverty report.pdf · in the first quarter of 2001, in...
TRANSCRIPT

UNICEF Innocenti Research Centre Piazza SS. Annunziata, 12, 50122 Florence, Italy websi te: www.unicef .org/ i rc www.unicef- i rc .org Tel: +39 05520330 Fax: +39 055 2033 220
HUNGARY: MOTHER’S EMPLOYMENT AND CHILDREN POVERTY
Co-ordinator: Judit Lakatos Hungarian Central Statistical Office, Budapest
MONEE Country Analytical Report 2003
The opinions expressed are those of the authors
and do not necessarily reflect the policies or views of UNICEF

2
MOTHER’S EMPLOYMENT AND CHILDREN’S POVERTY
Hungary, 2003

3
1. Demography and the Family
The study of the employment situation of women and mothers requires reviewing
the changes in reproductive behaviour and demography. In the past one or one
and a half decade matrimonial and reproduction patterns of the Hungarian
population have significantly changed, which is generally explained by the
adoption of western patterns. Certainly, radical economic changes have impacted
the demographic characteristics of the population too.
• One of the most apparent phenomena is the spreading of cohabitation without
marriage. The larger share of persons choosing cohabitation are young people.
With respect to activity and education, however, there are no differences
between married couples and cohabiting partners. The spread of cohabitation
is the primary explanation why nearly one third of children today are born
outside marriage. (In 1989 their share was approximately 12%).
• Not only people marry at a later age on average but also they tend to have
their first children later. Younger generations become adults at an increasingly
later age. These findings are well proven by the results of the Household Panel
Survey in 1992 as well as the survey “Turning points in Our Lives”: in 1992
about half of the age group of 29 lead an adult way of life while in 2002 only
about 25%. (i.e. does not live with parents any more, is in full time employment,
does not participate in education, is married or lives in a solid cohabitation
relationship)

4
Child: lives with parents and is in education, does not hold a full time job, is unmarried
Adult : does not live with parents, holds a full time job, is not in education, married or lives in cohabitation. Source of data: Hungarian Household Panel 1992 „Turning Points in Our Lives” 2002
• This change has an impact on fertility. While the share of women without
children in those having children born in the 1970s and 80s is 7 to 9 %, which,
taken into account that not all of them were married, is close to biological
infertility. In 2002 60 % of women under 25 years, and 27% of women under
30 do not have children. These data suggest that generations currently in
propagative age will almost certainly produce fewer children than earlier
generations.
Life situation of young people aged 18 to 29, 1992
0%
20%
40%
60%
80%
100%
18 19 20 21 22 23 24 25 26 27 28 29age
"adult"
"child"
Life situation of young people aged 18 to 29, 2002
0%
20%
40%
60%
80%
100%
18 19 20 21 22 23 24 25 26 27 28 29
age
"adult"
"child"

5
• The young today consciously plan smaller families. (According to the answers
to the questionnaire of the survey Turning Points in Our Lives*/, the planned
number of children currently is fewer than two.) A new and unfavourable
phenomenon is the first signs of voluntary childlessness, typical mostly for
unmarried young under 25 living in Budapest, the capital city. Should current
family planning tendencies realise, extended reproduction seems ensured in
women with lower education, who live in bad financial situation in villages in the
countryside. According Zsolt Spéder’s research related to the survey referred
to above, the drastic drop in the number of births is primarily the result of lower
reproduction by higher education mothers.
Estimated TRF by highest educational level of mothe rs, 1990-2000
Mother’s highest completed education level
Year Not completed primary
Primary Vocational Secondary Higher Total (N)
1990 2.245 1.815 1.915 1.731 1.858 1.846 1991 2.322 1.845 1.899 1.738 1.903 1.862 1992 2.357 1.776 1.816 1.607 1.825 1.772 1993 2.455 1.686 1.794 1.519 1.694 1.692 1994 2.719 1.759 1.755 1.417 1.560 1.652 1995 2.706 1.684 1.654 1.334 1.548 1.578 1996 2.662 1.561 1.524 1.209 1.486 1.464 1997 2.668 1.510 1.439 1.108 1.385 1.386 1998 2.447 1.435 1.382 1.088 1.347 1.341 1999 2.344 1.354 1.352 1.071 1.308 1.300 2000 2.335 1.400 1.350 1.120 1.364 1.337
Source: Calculation of Zsolt Spéder
• Over the past decades, the need to reverse, or at least curb, unfavourable
demographic processes (first of all declining number of births) was included in
the programs of each of the governments. There is, however, no exact
evidence on what is the effect, if there is an effect at all, of various family
support measures on reproduction and on motivating parents to have the
desired number of children.
*/ Head of research: Zsolt Spéder, HCSO, Demography Research Institute

6
2. Mothers on the labour market
After the mass scale loss of jobs in the late 1980s, by the mid 1990s the number of
employees stabilised, then slowly started to grow. This growth, however, has to be
understood in the light of a gradually increasing official retirement age, altogether
by 7 years for women and 2 years for men, and of the large generations born in
the 1970s actually entering the labour market as late as the end of the millennium
as a result of the trend of recent years to spend more years in education.
Currently, the employment rate of women entering the labour market at a later age
than earlier generations due to longer education is significantly higher up to their
age of 29 to 30 than 10 years earlier. Nevertheless, this seems to be in
conjunction with women’s having children at a later age rather than with improving
labour market positions of the young. The employment rate of women reaches that
of men after their age of 40 only primarily because of raising children (in 2002 it
did not reach that level as opposed to 1993.); the employment rate is the highest
in women aged 40 to 50, not having young children any more.
Female employment rate by age, 1993, 2002
0,0
10,0
20,0
30,0
40,0
50,0
60,0
70,0
80,0
90,0
20 30 40 50 60 70
Years old
Employment rate (%)
1993 2002

7
The maternity provisions system, to be detailed later in the paper, ensures a long
paid absence from the labour market (with a guarantee of employment by earlier
employer). Returning to work after raising children, however, is far from being
smooth, which is certainly a reason why young women on the whole have their
children at a much later age than even only 10 years ago. Connected to the
Labour Force Survey, possibilities of women to return to the labour market after
staying home on child care provisions has been surveyed four times. Since the
first survey in 1993, the share of mothers in employment before going on a
maternity provision has decreased. According to the 2002 survey, over one fifth of
mothers were not employed before having children. As for those who had been
employed, for some the employer ceased to exist while they were on one of the
maternity provisions. In 2002, over 12% of mothers in employment before having
children and currently on a maternity provision the employer did not exist as
opposed to 8.6% in 1993. While in the period between 1993 and 2002 businesses
became fairly stabilised, with the introduction of the child care support (received by
one fifth of some 300 thousand women on a maternity provision) the average
absence period has grown, increasing the risk of the employer going out of
business by the time the maternity provision period is over. Despite the legal
guarantee, many mothers are let known that their employers do not really want
them back, while a smaller share of women want to work elsewhere. (The reason
for this, however, is very often related to the employer: long travelling or work in
two or three shifts is impossible for mothers with young children.)
In 2002, only 45% of earlier employed women on a maternity provision thought
that after this period they would work with their former employer.

8
Share of mothers according to the possibility of re turn to earlier employer after the maternity provision period
(%)
The possibility of return 1993 1995 1999 2002
Employer ceased to exist 8.6 9.2 10.0 12.3 Employer exists but does not want the mother back
34.3 29.8 32.4 32.5
Employer wants the mother back but she does not want to return
6.7 8.7 11.2 9.9
Employer wants the mother back and she wants to return
50.4 52.3 46.4 45.3
Total 100.0 100.0 100.0 100.0 Source: LFS ad-hoc modul
In the first quarter of 2001, in relation with the Labour Force Survey the module
„Family in Transition” was taken to survey how family and labour market roles can
be harmonised. To one of the open questions, the majority of respondents said
that there was a conflict between raising children and labour market demands.
Employers tend to assume that mothers with small children will be substantially
more time absent than the average because of the illnesses of the children, which
is disadvantageous not only from the point of view of work organisation (with a
lack of surplus labour, all activities have to be carried out by the core team doing
“peak output” anyway) but also from the point of view of finances (the first ten days
of sick leave are paid by employers, and sick leave to stay at home with ill children
is typically taken out several times a year by mothers with small children).
Therefore employers avoid employing mothers with small children. Not only
mothers of small children but also those over this period of life almost univocally
said that today it was much harder to coordinate work and motherhood than
earlier, sometimes simply impossible without the help of the family and
grandparents.
According to the findings of the research based on the Labour Force Survey, the
presence of women with children on the labour market is primarily influenced by
three factors:
• Number of children
• Age of children

9
• Qualifications of the mother, defined in a simplified way by her education level
Apart from these three there are of course other factors such as the education,
profession and income of the husband, housing, potential help from the family in
raising children; with the exception of the type of settlement, these factors are
outside the scope of this paper.
On the whole, in 2002 the employment rate of women with one child was higher
than the rate of the whole female population aged 15 to 64 (60.2% and 55.3%
respectively), with a slightly above average unemployment rate. The employment
rate of women with two children is somewhat lower than the average (52.2%), and
is significantly lower of women with large families (3 or more children), of whom
only 18.6% were employed.
With the definition of child applied here (persons under 15), a significant number of
mothers with 3 or more children are entitled to, and the overwhelming majority of
them actually are on a maternity provision, yet their absence from the labour
market does not seem voluntary, as suggested by their 11.2% unemployment rate,
which is 2.5 times as high as the average of women aged 15 – 64.

10
Labour market participation of women aged 15-64 by number of children and educational level, 2002
Inactive
Employed Un-employed total
of which: in maternity
provision period
Total Employ-ment rate
Unemploy- ment rate
Denomination
number of women %
Primary school or less Women aged 15-64 total
322079
33293
885082
87699
1240454
26.0
9.4
Of which: Mother with children younger than 15 years, total
94748
14049
172705
80440
281502
33.7
12.9 mother with 1 child 62186 7692 71608 19696 141486 44.0 11.0 mother with 2 children 26153 4984 51935 21568 83072 31.5 16.0 mother with 3 or more children
6409
1373
49162
39176
56944
11.3
17.6
Married/cohabiting women without children younger than 15 years
157754
10337
293928
72
462019
34.1
6.1
Vocational school Women aged 15-64 total
378055
26286
221187
78134
625528
60.4
6.5
Of which: Mother with children younger than 15 years, total
134339
12110
112381
71278
258830
51.9
8.3 mother with 1 child 82694 7783 51486 28611 141963 58.3 8.6 mother with 2 children 47335 3646 39867 24790 90848 52.1 7.2 mother with 3 or more children
4310
681
21028
17877
26019
16.6
13.6
Married/cohabiting women without children younger than 15 years
142578
5649
64113
417
212340
67.1
3.8
Secondary school with G.C.E. Women aged 15-64 total
704846
32363
465905
84893
1203114
58.6
4.4
Of which: Mother with children younger than 15 years, total
199997
9956
113543
77065
323496
61.8
4.7 mother with 1 child 128299 5482 55203 34092 188984 67.9 4.1 mother with 2 children 66018 4024 41324 28391 111366 59.3 5.7 mother with 3 or more children
5680
450
17016
14582
23146
24.5
7.3
Married/cohabiting women without children younger than 15 years
290730
9181
133353
221
433264
67.1
3.1 Source: LFS

11
Labour market participation of women aged 15-64 by number of children and educational level, 2002 (continued)
Inactive Employed Un-
employed total
of which: in maternity
provision period
Total Employ-ment rate
Unemploy- ment rate
Denomination
number of women %
University and college Women aged 15-64 total
345017
8576
89296
31164
442889
77.9
2.4
Of which: Mother with children younger than 15 years, total
96157
1635
33015
28097
130807
73.5
1.7 mother with 1 child 56945 719 17873 14165 75537 75.4 1.2 mother with 2 children 34127 716 10725 9679 45568 74.9 2.1 mother with 3 or more children
5085
200
4417
4253
9702
52.4
3.8
Married/cohabiting women without children younger than 15 years
141987
2593
29200
22
173780
81.7
1.8
Women aged 15-64, total Women aged 15-64 total
1749997
100518
1661470
281890
3511985
49.8
5.4
Of which: Mother with children younger than 15 years, total
525241
37750
431644
256880
994635
52.8
6.7 mother with 1 child 330124 21676 196170 96564 547970 60.2 6.2 mother with 2 children 173633 13370 143851 84428 330854 52.5 7.1 mother with 3 or more children
21484
2704
91623
75888
115811
18.6
11.2
Married/cohabiting women without children younger than 15 years
733049
27760
520594
732
1281403
52.7
3.6 Source: LFS
The influence of education is just the opposite of that of the number of children:
the higher educated the mother is, the more probably she is present in the labour
market even with a large family. In 2002 44% of women with not more than
primary education with one child, 31.5% of such women with two children and
11.3% with 3 or more children were employed as opposed to women with
university or collage degree with shares 72,4%, 66,5%, and 37,6%. The
unemployment of low women – given the age of their children, probably young – is
outstandingly high and does not seem to be connected to the number of children,
which leads to the conclusion that for them labour market disadvantages add up
(lack of qualification, small children).

12
Using data of the survey „Family in Transition” including relatively detailed
information on the children in the family, the relationship between the age of
children and the presence of the mother on the labour market can be examined. A
much smaller share of mothers with under school age children are employed than
mothers with as many but older children. Being absent from the labour market was
primarily made possible by using one of the maternity provisions. Typically, after
the maternity period only mothers with at least three children tend to remain
housewives out of the labour market.
The breakdown of households with children* by the m other’s labour market status and the
type of the family, 2001 4 th quarter
(%)
Type of the family
Employed Un- employed
Pensioner or unable to work
On child care
allowance, fee or child
rearing support
Housewife Studies or out of work
for an unlisted reason
Total
One child under school-age 36.0 5.1
3.0
45.2
7.8
2.9
100.0
One child in primary school 72.9 7.5 8.2 1.2 8.5 1.8 100.0 One child in secondary school 76.4 4.4 12.3 0.1 5.2 1.7 100.0 Total of families with one child 61.6 5.7 7.8 15.6 7.2 2.1 100.0 Two children under school-age 18.0 4.6 1.3 68.1 5.9 2.1 100.0 Two children in primary school 77.3 5.9 4.4 1.0 10.3 1.0 100.0 Two children in secondary school 81.2 3.2 7.0 0.0 6.9 1.8 100.0 One child under school-age, one in primary school
52.7
8.7
1.4
25.9
10.0
1.3
100.0
One child in primary school, one in secondary school
77.9 6.9 5.1 1.6 7.9 0.5 100.0
One child under school-age, one in secondary school
37.9
10.4
3.8
35.0
12.9
0.0
100.0
Total of families with two children 62.3 6.4 3.6 17.6 8.8 1.1 100.0 Three children under school-age or in primary school
19.1
3.5
0.7
61.0
14.4
1.3
100.0
Other families with three children 45.1 9.7 2.6 25.0 16.2 1.3 100.0 Total of families with three children 27.2 5.4 1.3 49.8 14.9 1.3 100.0 Families with four or more children of whom none is in secondary education
13.3
4.1
2.8
70.7
5.2
3.9
100.0
Families with four or more children of whom some are in secondary education
21.1
3.1
6.7
48.3
19.6
1.2
100.0
Total of families with four or more children
16.0 3.7 4.2 63.0 10.1 3.0 100.0
Total of families with children 57.0 5.9 5.5 21.3 8 .7 1.7 100.0 * Child concept is following: younger than 19 and not in employment Source: LFS – Family in Transition ad hoc module

13
As for the type of settlement, there is a definite dividing line between cities and
villages, which differentiates women in their labour market chances regardless of
the number of children.
To achieve at least the average Hungarian living standard, families usually need a
second earner, who most often is the mother. According to the latest data
available by the breakdown by education, in May 2002 women’s earnings on the
whole were by 15% lower than men’s; this difference, however, requires several
explanations and comments:
• After the change of the regime, the restructuring of economy has reduced the
global earnings difference between men and women. Mining, metallurgy and
some areas of machine manufacture involving hard physical work and
dominated by men today employ only a fragment of the earlier workforce. Men
having lost their jobs have either left the labour market (typically in early
retirement schemes) or have gone into less well paying sectors of the
economy.
With the improved prestige of earlier, partly artificially, undervaluated
intellectual jobs in which a relatively high rate of women work, women now are
less disadvantaged in terms of earning.
• The distribution of employed women by education is better than that of men,
because a larger share of them have secondary and even higher education.
(Though in this category more women have college than university education,
while in men the proportions are just the opposite). This, on the whole,
increases the overall average earning of women; at the same time, however,
women earn by more than the average 15% less at almost all education levels
as a result of shorter working years because of child raising and more
importantly because they are significantly under-representation in managerial
and leadership positions.
• In 2001 and 2002 two measures were taken to further reduce women’s
disadvantage in earnings. One was raising the minimum wage from HUF

14
25,500 to HUF 40,000 in 2001 and then to HUF 50,000 in 2002. As a much
larger share of women than men work in areas where the wage level is close to
the current minimum wage (commerce, catering, clothing industry, social
services), the higher minimum wage improved average earnings for women
more than for men. The second measure facilitating convergence was the pay
raise for health care and education workers by 50% in September 2002 as in
these two budget areas women are the majority (data presented here are
based on the May 2002 survey, therefore not show the effect of the latter
measure).
Average monthly gross wage of full time employees b y educational qualification and gender, 2002*
HUF
Highest educational qualification Male Female Together
Enterprises
Primary school 80666 70846 76114 Vocational school 90480 72270 85898 Vocational secondary school 119451 107419 113502 Grammar school 122631 109280 113957 College 242599 192888 221609 University 343791 273701 320828 Total 122927 105723 116248
Government
Primary school 76001 64415 66716 Vocational school 78405 74834 76358 Vocational secondary school 101752 97183 97973 Grammar school 109960 99507 101228 College 174581 133211 141478 University 220580 190911 205385 Total 144319 111258 119831
National economy total
Primary school 80186 68603 73892 Vocatioal school 89761 72788 84945 Vocational secondary school 117473 103519 109325 Grammar school 120195 105427 109678 College 218300 147964 172216 University 290846 222468 262016 Total 125900 108051 117236 * May wage and 1/12th of non regular annual payment Source: Wage Structure Survey, 2002

15
Data of classical earnings statistics are collected from enterprises and institutions.
Such surveys, thus, do not (and cannot) include any information on families. As in
Hungary couples pay taxes separately, the only source of data that allows for
inferences as to the connections between the situation of families and income is
the household statistics. According to HBS 2002 data, in two earner and childless
households the gross annual earning of women was by 10% less than that of men.
In households with one or two children the difference is 23 to 25 % while the
earning of women in households raising three or more children is by 24% lower
that that of women in childless households, and 70% of the earning of men in their
households. (As household statistics – in contrast to data from the survey of
institutions – covers part timers too, the lower earning average may partially be the
result of the higher rate of part timers in this category of women. However, the
negative correlation between the number of children and education is surely a
more significant factor.) In households with only one earner, and that one is a
woman, her earning average tends to be higher that the earning of women in two
earner households with the same number of children. A very distinct exception is
the group of households in which income earning women raise three or more
children: in 2002 their average gross earning was only by 16% higher than the
minimum wage.
Average earnings by gender in different type of hou sehold, 2002
Childless household with
Household with 1 child and with
Household with 2 children and with
Household with 3 or more children and
with 1 2 1 2 1 2 1 2
active earners active earners active earners active earners
Number of household
603 422 509 286 220 502 290 453 176 331 156 500 61 265 15 659
Number of household members
1 292 941 1 492 672 740 945 1 064 916 748 221 661 983 333 810 84 404
Number of active earners
603 422 1 018 572 220 502 580 906 176 331 313 000 61 265 31 318
of which male 321 829 524 356 134 641 288 976 144 611 158 947 58 094 15 913 of which female 281 593 494 216 85 861 291 930 31 720 154 053 3 171 15 405 Averege gross annual earning per active earners (HUF/year)
999219 1053855 914630 964931 1011473 984131 980816 918365
of which male earners
1010975 1109721 950272 1089916 1042900 1124786 996042 1071756
of which female earners
985783 994581 858739 841210 868198 839007 701878 759915
Source: HBS (Household Budget Survey), 2002

16
3. Child related benefits In Hungary, cash and other supports to raise children constitute a system made up
of several elements. These elements as well as their relative weight and
importance are the result of a complex social bargaining process, and depend on
the system of preferences of the political line currently in power. In this chapter the
most important changes over the pas 6 to 8 years in this field are reviewed,
categorising supports by their being directly addressed for children or the mother
(parents). Apart from the social security system, the social system too includes
several elements that influence the situation of families, yet to overview them is
out of the scope of this presentation.
Of family supports, the family allowance is the most significant one in terms of
the number of recipients. In 2002 1223 thousands families received the family
allowance for 2011 thousands children. Until 1996 this regular cash benefit was an
entitlement for all children under 16, and for those under 19 in full time education.
As a part of the economic and financial stabilisation program (the Bokros
package), however, as of April 1996 the family allowance for families with one or
two children became means tested while with three or more children the amount
was independent of the per head income of the family. In May 1998 – before the
elections that year – the amount of the family allowance was raised and the
number of income categories differentiating the amount was reduced from three to
two. In May 1998 the left wing coalition was replaced by a right wing coalition
government. One of its first acts was to restore family allowance as an entitlement
(besides restoring the child care fee, to be discussed later) but the amount of the
allowance remained the same throughout the four years of office. (The only
exception was the family allowance for seriously disabled children, raised by 40%
in January 2001.)
After the elections in 2002 the nominal value of the family allowance was raised. In
addition, as of 2002, in September a schooling aid, the equivalent of the amount of
the one-month family allowance, „tops” the family allowance.

17
The family allowance and the subsistence level in s elected years
Type of household As of January 1995
As of April 1996*
As of May 1998*
As of January 1999
2001
As of September
2002
Family allowance HUF/month/child
Family with one child Two parents 2750 1100-2750 1900, 3800 3800 3800 4600 Single parent 3250 1300-3250 2500, 4500 4500 4500 5400 Family with two children
Two parents 3250 1300-3250 2300,4700 4700 4700 5600 Single parent 3750 1500-3750 2700,5400 5400 5400 6500 Family with three or more children
Two parents 3750 3750 5900 5900 5900 7100 Single parent 3950 3950 6300 6300 6300 7600 Family with long term seriously disabled child
5100 5100 7500 7500 10500 12600
Subsistence level HUF/month/household
1 adult with 1 child 27 118 31 794 43 895 48 444 64 781 71 128 1 adult with 2 children
35 335 41 428 57 196 63 124 84 411 92 682
2 adults with 1 child 39 444 46 246 63 847 70 464 94 226 103 459 2 adults with 2 children
47 662 55 880 77 149 85 144 113 857 125 013
2 adults with 3 children
54 236 63 588 87 790 96 888 129 561 142 256
2 adults with 4 children
60 810 71 295 98 431 108 632 145 266 159 500
*/ As of April 1996 the amount of family allowance for families with one and two children was differentiated by three income categories while as of May 1998 by two. Between April 1996 and December 1998 high income families with one or two children were not eligible for the family allowance.
The amount of the family allowance remained the same between 1999 and 2002
which means that with the moderate though not negligible inflation rate (10% in
1990; 9.8% in 2000; and 9.1% in 2001) its real value gradually declined. This was
in conjunction with the system of preferences of the government to emphasise the
importance of self-sustenance instead of mitigating social inequality. This
philosophy was expressed in the tax allowance for children , introduced in 1999.
If parents (child supporting adults) had any taxable income (and were eligible for
the family allowance) the following amounts of tax allowance was available in each
fiscal year:

18
HUF/Year
1999 2000 2001-2002 For one child 20400 26400 36000 For two children per child 20400 26400 48000 For three or more children per child
27600 36000 120000
The allowance, however, is available only for households whose tax payments are
large enough to make them eligible. For instance, the increased allowance in 2001
for households with three or more children has provided a financial benefit only for
a very little share of large families. According to statistics of the tax authority, in
2000 only 79% of the allowance was actually claimed. According to a HCSO study
conducted in late 2001, 66.4% of families could claim the full amount of the
allowance, 15.6% part of it while about 18% none of it at all, even though parents
could split the allowance. In contrast to the family allowance, the amount of the tax
allowance was raised more than the inflation rate in 2000 and 2001.
The third pillar of supports for children was the supplementary family allowance ,
a means tested provision. For instance, in 2000 some 800 thousand children were
eligible (one third of those receiving the family allowance) for this support of HUF
3.4 thousand per month.
The elections in April 2002 brought about shifts of emphasis in the provisions
system. Although the main pillars (including the tax allowance) have remained in
place, the principle of means testing has received once again a greater emphasis.
In this spirit, the family allowance has been raised, a 13th month family allowance
(schooling aid) has been introduced, and school books have been made free for
households receiving the supplementary family allowance, single parent families
and large families.
On the whole, according to expert estimates* the real value of various cash
provisions for children in 1996 amounted to 40% of what it was in 1990; 43% in
1998; and 53% in 2000. Even though the child-care provisions system did not
* Dr. István Baranyai: The family and social costs of raising children (Statisztikai Szemle /Statistics Bulletin/ 2003/7. p:542-559)

19
become fairer between 1998 and 2000 from the point of view of children, this kind
of expenditure of society have started to grow again after a continuous decline.
The system of maternity provisions in Hungary again is composed of several
elements with some of them being entitlements and some are tied to meeting
eligibility criteria. Apart from the transitory period of the Bokros package, the last
major change in the system was implemented in 1993 with the Social Act
introducing, inter alia, the child care support. The current system includes the
following elements:
Type of the provision
Eligibility criteria Period Amount Employment
Pregnancy and childbirth aid (maternity leave)
Those women are eligible who have been insured for at least 180 days up to the child’s birth
168 days 70% of the average daily earning
Not permitted
Child care fee*/ The same as the pregnancy and child birth aid but can be taken by the father if he is insured.
After the period of the pregnancy and child birth aid up to the child’s age of 2.
70% of the average daily earning with a ceiling tied to the minimum wage. (In 2002 HUF 83 thousand)
Not permitted
Child care allowance **/
An entitlement, can be claimed by the father too
Up to the child’s age of 3
The current minimum old age pension (In 2002 HUF 20100)
Not more than four hours a day or unlimited hours at home
Child care benefit Parent with three or more children
Up to the youngest child’s age of 8 (Except if the eldest meanwhile turns 18)
The current minimum old age pension (In 2002 HUF 20100)
Not more than four hours a day or unlimited hours at home
*/ Cancelled between April 1996 and 31st December 1998.
**/ This provision existed between April 1996 and 31st December 1998 as means tested.
Note: As of 2002, the child care allowance can be taken by grandparents, too. For sick child it is available up to the age of
14.
Experts cited in relation with the family allowance calculations estimate that
maternity provisions in 1996 amounted to 47% of the 1990 level, the percentage
remaining the same in 1998, while in 2000, with the reintroduction of the child care
fee, the level of maternity provisions went up to 57% of the 1990 level.
In addition to cash provisions, child raising is helped by a broad social provisions
system, of which two thirds are educational, 10% health care, and about one
quarter is so called other social provisions (nursery, kindergarten, school meals,
students’ hostel, subsidised transportation). Experts estimate that in 2000 46% of

20
the total costs of raising a child was born by parents while 14% was covered by
cash social provisions and 40% by in kind provisions. In 1998 the respective
shares in the same order were 48.1%, 10.6%, and 41.3%.
In relation with the employment of women – and in conjunction with this the well-
being of families – the existence or lack of institutions for the day care of children
is of primary importance. In Hungary the system of child care institutions had been
developed according to the needs of the (nearly) full employment of women, and is
still more developed than in the majority of (maybe all) EU countries. The various
types of institutions, of course, are not used to the same degree.
Nurseries, taking care of children aged 0 to 3, are primarily used by higher income
women, and most typically after the period of the child care fee. Since the
introduction of the child care allowance, mothers tend to spend the whole period
up to the child’s age of 3 at home (also, recipients of the child care allowance or
fee cannot use the nursery; children whose mother receives any of the maternity
provisions can be placed in kindergarten only part time, except for the last year
which is a preparatory year for school.) Currently out of 100 10 children aged 0 to
3 go to nurseries. Over the past decade about half of nurseries have been closed.
Although the potential need for nurseries has declined due to the radical drop in
births, the exploitation of nurseries is greater that in the early 1990s. Generally,
nurseries exist only in bigger towns or cities, therefore women in villages cannot
put their children in a nursery even if they wanted to.
Nearly 90% of kindergarten age children attend kindergarten (only the so called
preparatory year right before compulsory primary school is compulsory). Although
the demand for and supply of kindergartens not always meet in terms of location,
and municipal kindergartens cannot meet the special needs of women working in
irregular schedules (as opposed to kindergartens run earlier by employers and
mostly closed as a result of cuts in operation costs in the 1990s), there is not a
significant discrepancy between demand and supply. Parents pay only for the
meals in the kindergarten, and as of 2003 families in bad financial situation
(recipients of the supplementary family allowance) are exempted from paying the

21
fee. (Families with three or more children had paid only half of the fee before too,
or at some places the costs were paid by the municipality.)
Over half of primary school children have meals at the school and spend the
afternoons in the school, and their share is higher in the lower four grades. On the
whole, as opposed to several more developed European countries, the lack of day
care institutions for children is not a real hindrance to women’s employment.
According to a reasearch*/ conducted in late 2001, in nearly half of the households
raising children under 10 all of the children under 10 were in a child-care
institution, and in 12.4% of the households some of the children under 10 attended
kindergarten or afternoon school. A very small share of families not or only
partially using a child-care institution, and typically households living in villages,
reported that the reason for it was the lack of available institutions.
The breakdown of households with children under 10 not or only partially using child-care institutions by the reason of not using them, 2001 4th quarter
Reason Villages Towns and cities Budapest Total
No possibility 9.0 2.5 - 5.1 Too expensive 14.4 12.1 10.3 12.9 Found another solution 76.6 85.4 89.7 82.0 Total 100.0 100.0 100.0 100.0
Source: LFS ad hoc module Family in Transition
A good part of households not using a child-care institution, however, provide
children a low stimulating environment and bad financial situation – exactly the
circumstances that would require the compensatory influence of child-care
institutions.
*/ Family in Transition, KSH-UNDP 2002.

22
4. The relative income position of households with children
The international literature offers two approaches to identify households’
unfavourable financial situation:
• If there is a national threshold level (subsistence level), those living under this
threshold can be regarded poor;
• As the above approach cannot be made uniform, for the purpose of
international comparison usually those are regarded poor who have less
income than a certain percentage (50 or 60 percent) of some kind of mean.
Besides these two approaches to measurement, which involve the inaccuracy of
reported incomes and limited availability of data sources, there is a method which
specifies poverty by a complex system of variables. The most important source of
information for examining poverty based on income distribution is the Household
Budget Survey, the largest and oldest regular survey of HCSO as well as of the
country. HBS was started in 1949 but comparability is limited even within smaller
time spans due to changes in methodology. In this annual survey some ten
thousand families (0.25% of all Hungarian households) report on their incomes
and consumption and on some characteristics related to their assets and housing
conditions. One of the specialities of the survey is that it underestimates incomes.
In some items concealment is significant, and most probably a larger share of
lower income households participate than their actual share in all households.
Thus, in HBS the share of lower income households may seem greater than
reality. An even bigger obstacle to use HBS for examining poverty is the size of
the sample. For instance, to examine the poverty risk of households with many
children in villages on the basis of HBS is not possible because there are only
some 100 to 150 households in this category. Despite these concerns, poverty
researches in the near past have used HBS data, or even smaller surveys
conducted by market organisations (for instance a TÁRKI panel survey of about
2000 households).
In Hungary, poverty has been researched for a quarter of a century though
findings earlier were not widely published. Since the early 1980s, threshold values
have been more or less regularly published (The methodology of subsistence level
23
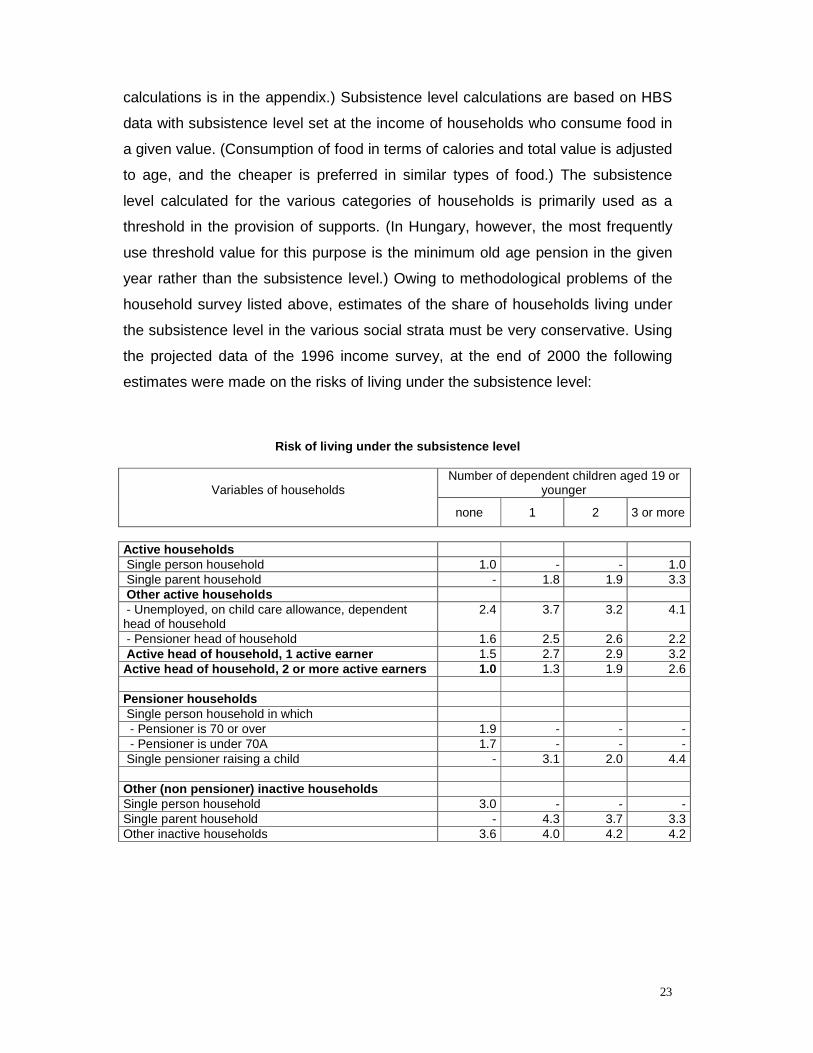
calculations is in the appendix.) Subsistence level calculations are based on HBS
data with subsistence level set at the income of households who consume food in
a given value. (Consumption of food in terms of calories and total value is adjusted
to age, and the cheaper is preferred in similar types of food.) The subsistence
level calculated for the various categories of households is primarily used as a
threshold in the provision of supports. (In Hungary, however, the most frequently
use threshold value for this purpose is the minimum old age pension in the given
year rather than the subsistence level.) Owing to methodological problems of the
household survey listed above, estimates of the share of households living under
the subsistence level in the various social strata must be very conservative. Using
the projected data of the 1996 income survey, at the end of 2000 the following
estimates were made on the risks of living under the subsistence level:
Risk of living under the subsistence level
Number of dependent children aged 19 or
younger
Variables of households
none 1 2 3 or more
Active households Single person household 1.0 - - 1.0 Single parent household - 1.8 1.9 3.3 Other active households - Unemployed, on child care allowance, dependent head of household
2.4 3.7 3.2 4.1
- Pensioner head of household 1.6 2.5 2.6 2.2 Active head of household, 1 active earner 1.5 2.7 2.9 3.2 Active head of household, 2 or more active earners 1.0 1.3 1.9 2.6 Pensioner households Single person household in which - Pensioner is 70 or over 1.9 - - - - Pensioner is under 70A 1.7 - - - Single pensioner raising a child - 3.1 2.0 4.4 Other (non pensioner) inactive households Single person household 3.0 - - - Single parent household - 4.3 3.7 3.3 Other inactive households 3.6 4.0 4.2 4.2

24
As shown, if the risk of two earner childless households to come under the
subsistence level is 1, that risk of a similar household with three or more children
is 2.6 times as great. With the greater number of children and having no active
earner in the household, there is a higher risk of poverty.
According to the inflated data of the 2002 HBS, 87.9% of children aged 0 – 14
lived in households with an active earner, but 17.1% of them in households with 3
or more children which poses a greater risks. Almost half of the 204 thousand
children under 15 living in inactive households lived in large families.
Not unrelated to this data, 28% of children under 15 live in households with a net
income amounting to 60% of the median income*/. Taking the number of children
living under the threshold value 100%, 14.4% of them lived in large households
with an active earner, and 42.1% in households without an active earner. These
percentages support what has been found about the risks of poverty in the section
on the subsistence level.
The poverty risk of children aged 0 – 14 by the typ e of households, 2002
1 2 3 or more Type of household
children All
house-holds with
children
Number of children under 15 in the household (1000) Active household 523.9 697.7 251.6 1473.2 Inactive household 45.7 63.1 94.7 203.5 Total of households 569.6 760.8 346.3 1676.7
Of them, the number of children in households with an income amounting to 60% of the median income (1000 )
Active household 42.9 88.0 43.6 174.5 Inactive household 19.6 35.4 71.7 126.7 Total of households 62.5 123.4 115.3 301.2 The share of children living under the income thres hold in all children in the same types of
household (%)
Active household 8.2 12.6 17.3 11.8 Inactive household 43.0 56.1 75.7 62.3 Total of households 11.0 16.2 33.3 18.0 **/ Children turning 14 in that year Source: HBS 2002
*/ To calculate the percentage of those living under the threshold of the median income, the so called domestic equivalent consumption scale was used. (see: The method of calculating the subsistence level)

25
In the larger part of poor households raising children under 15 there are no
employed members, and even in active earner households with the growing
number of children the probability that the wife works decreases. (The third child
seems to be a sharp line as the employment rate of women with one or two
children does not differ significantly from that of childless women.) The high
poverty risk of large families, thus, is connected to the lack of a second earner. An
vice versa, only a very small share of households in which the mother is an active
earner (or receives a benefit based on earlier earnings) qualify as poor. The lack
of an (second) earner is not counterbalanced by social and family support
provisions. (It is sufficient to cite that in 2002 the total of the child care allowance
or the child care support and the family allowance for 3 children was less than
HUF 50,000, the minimum wage.)

26
The poverty risk of children aged 0 – 14 in single parent and in two parent households, 2002
1 2 3 and more Type of household
children
Total of house-holds with
children
The number of children under 15 in the household (1 000)
Active, single parent family 39.2 29.2 4.3 72.6 Active, two parent family 484.8 668.5 247.3 1400.6 Inactive, single parent family 9.7 13.8 9.6 33.1 Inactive, two parent family 36.1 49.3 85.1 170.5 Total of households 569.8 760.8 346.3 1676.8
Of them, the number of children in households with an income amounting to 60% of the median income (1000)
Active, single parent family 4.8 4.4 1.4 10.6 Active, two parent family 38.1 83.6 42.2 163.9 Inactive, single parent family 3.8 6.3 6.1 16.2 Inactive, two parent family 15.9 29.1 65.6 110.6 Total of households 62.6 123.4 115.3 301.0
The share of children living under the income thres hold in all children in the same types of
household (%)
Active, single parent family 1.2 15.0 32.5 14.6 Active, two parent family 7.9 12.5 17.1 11.7 Inactive, single parent family 39.2 45.7 63.5 48.9 Inactive, two parent family 44.0 59.0 77.1 64.9 Total of households 11.0 16.2 33.3 18.0 Source: HBS, 2002
25% of children under 15 living in single parent households are hit by children
poverty, which is an only slightly greater percentage than the average. This is due
to the fact that in most cases single parents work.

27
5. Mothers’ employability and wage in the future
Earlier chapters have already addressed the relationship between women’s labour
market status and reproduction. The increasing employment rate of young, school
leaving generations of women is in conjunction with their having children at an
ever later age. To stop the decrease in the number of births and curbing the
unfavourable demographic trend is a crucial issue. The current left wing
government has established a so called „Demographical Government Committee”
in charge of researching the problem and developing complex solutions. One of
the most important questions for the future is whether the large generations of the
baby boom in the 1970s have only postponed having children or have altogether
renounced of having part of the theoretically possible children. Apart from cash
support from the state, their decision to have children can be facilitated through a
number of other measures and circumstances.
.
• A child-friendly attitude adopted by employers, too. Currently the opposite is
true: employers are counter-interested in employing mothers with young
children. Having children is often postponed exactly because of the fear of
loosing one’s job. Most young women can see negative examples in their
environment and try to postpone coming in a similar situation as late as
possible. A special feature of women’s employment in Hungary is that very few
of them can work in schedules that help harmonize work place and family
duties. Telework, and other activities that can be done at home, have not
spread yet. In 2003 a government program was launched to popularise working
at home, designed to make employers interested in creating telework jobs.
(Plans, however, are modest: in 2004 about one thousand telework jobs are
expected to be created as a result of the program.) Part time employment,
again, is relatively rare. According to a labour force survey in 2002, only about
8% of all employed women worked part time. While employers’ incentives
could be increased through taxation, the government has only refrained from
increasing the health care fund contribution, the most discriminative type of
wage tax, rather than to cancel it altogether. As in the current economic
situation it is hard to loose the tiniest amount of tax payments, it is uncertain
whether tax rules will favourably change in the future. According to results of

28
various surveys, a lot more women would prefer (or think more advantageous)
part time jobs than currently work in such schedules. A critical issue is,
however, earnings. The Hungarian family model is fundamentally a two-earner
one, which means that the earnings of both parents from full time jobs are
needed to maintain an average living standard. It is then a questions whether
as many women would really choose part time if possible as many said so in a
statistical survey.
• Availability of day care for children is fundamental for mothers to be able to
work. Undeniably, the system of child-care institutions developed in the era of
women’s full employment is still able to largely meet needs. Over the past
decade or decade and a half, however, this system has been cut and reduced.
Because of the close down of kindergartens, current less numerous
generations are in large groups (occasionally as large as groups of thirty)
which was typical for earlier, large generations and which does not offer the
possibility of person-tailored development. In terms of location the mostly
several decade old institutions often do not match the age distribution of the
population. (For instance, high-rise housing estates once inhabited typically by
young families, have aged and the majority of institutions for children are not
needed by the people there any more. In contrast, mushrooming suburban
family-house neighbourhoods are constructed without child-care facilities and
parents can use kindergartens only by spending a significant amount of time
for travelling.) While with the general availability of the child care allowance
nurseries are not used on a mass scale, one can find it difficult to find a nursery
for a child under 3 (or older but not yet fit for kindergarten). Again, it does not
help harmonise family and work place duties that many kindergartens and day
care institutions offer professional care only from 8 a.m. to 4 p.m.
Child-care institutions, of course, accept only healthy children. Yet it is exactly
the sickness of children and mothers’ staying home with them, which is the
main cause of discrimination in their employment. In getting and keeping a job,
thus, it is highly important what kind of help from the family, primarily from
grandparents, a mother with young children can have. While theoretically there
is the possibility of paid help, it is affordable only for a narrow group of high
income women.

29
• Employment of women with young children, however, is basically determined
by the economy and the state of the labour market rather than the above
described factors. If there is a shortage in labour, employers will be forced to
consider their employee’s duties outside the workplace. If there is an
oversupply, labour valued low for some reason (inexperienced, unskilled,
Gypsy, elderly, mothers with young children) will be disadvantaged.
Hungarian employment prospects – in contradiction with official opinion of
dutiful optimism - in my view are not too good. The clothing industry, a major
employer of women in the past lost a considerable number of jobs in 2002 and
the first half of 2003 as foreign owners facing difficulties in sales have closed
down plants or relocated production to lower labour cost countries (the
Ukraine, Rumania and mainly the Far East). A similar process has been going
on in the electronics assembly business, again employing a great number of
women. Commerce, too, is over the spectacular boom: there seems to be no
more place for chains of shop and shopping malls in the country, and due to
increased motorisation small retail turnover has been continuously declining. In
the area of the state dominated health care and education, the government has
made its plans of cuts in staff public in recent days, causing the potential loss
of at least 20 to 30 thousand (women’s) jobs. New jobs for women can be
created in the area of social care, which, however, is a limited possibility given
solvent demand. In the medium run, it appears, there are only chances to
preserve, or to slightly increase the current level of employment of women. As
women with small children are typically young, two trends in the labour market
need to be noted. The retirement age for women will be increased to 62 years
by the end of the decade (Remember: until the mid 1990s it was 55 years and
then gradually increased). That is why the number of retirement from the labour
market is smaller than what would be expected from the age distribution. With
the current demand for labour, this „crowding” makes it harder for the younger
generations to find jobs (or to go back to the labour market after staying at
home with young children). Since the 1990s, participation in higher education
has soared. Nevertheless, the educational structure and the labour market
demand are not fully in harmony. An increasing number of young people
(among them young women too) are not able to find jobs matching their
education and must compromise with much lower qualification work.

30
• Among employment policy guidelines, the removal (reduction) of gender
inequality in earnings is a priority. Central government measures in the past
years have managed to reduce women’s disadvantage in earnings – even if it
was not their specific purpose. To our knowledge, no similar or comparable
measures concerning earnings are expected. Forecasts, however, are hard to
make as new governments every four years tend to make ad hoc actions in
order to increase their popularity. Assuming a normal economic development,
current male-female earning ratios are expected to be preserved in the long
run.