hunger free summer hubs initiative: a needs assessment
TRANSCRIPT

The Joseph P. Riley Jr. Center for Livable Communities66 George StreetCharleston, SC 29424www.cofc.edu
Lowcountry Food Bank2864 Azalea DriveNorth Charleston, SC 29405www.lowcountryfoodbank.org
ConAgra Foods Inc.222 W. Merchandise Mart PlazaSuite 1300 Chicago, IL 60654www.conagrafoods.com
Hunger Free Summer Hubs Initiative: A Needs Assessment
MAY 2016

2HuNger Free SuMMer HubS INIt IAtIve : A NeedS ASSeSSMeNt
College of Charlestonthe Joseph P. riley Jr. Center for Livable Communities
MISSION DEPARTMENTThe Joseph P. Riley Jr. Center for Livable Communities established in 1978 is an interdisciplinary initiative of the College of Charleston whose mission is to leverage the intellectual resources of the College to support the economic and cultural vibrancy of the City of Charleston and other communities throughout South Carolina, the United States, and around the world.
With access to the resources of the College of Charleston’s School of Humanities and Social Sciences, the Riley Center seeks to be a leader in livable community research, education and practice.
The Riley Center defines “livable communities” as those which are economically and culturally vibrant, with equitable access for all residents to education, jobs, healthcare, and housing as well as diverse opportunities in arts, culture, and recreation.
The Riley Center achieves its mission by connecting community needs with faculty, staff and student expertise. The Center has five core competencies under which it offers a variety of services. These five areas are:
1) Nonprofit and Local Government support2) Health and Sustainability3) Public Safety4) Education, Arts and Culture5) Urban Design, Planning and Housing
The Riley Center offers a variety of professional services tailored to fit the needs of the client. Services include:
Strategic planning, program evaluation and policy analysis• Leadership training and coaching• Meeting and focus group facilitation• Board training and team development• Grant writing and research support• Surveys, data collection and data analysis• Faculty research support•

3HuNger Free SuMMer HubS INIt IAtIve : A NeedS ASSeSSMeNt
Lowcountry Food bank
MISSION DEPARTMENTAt the Lowcountry Food Bank (LCFB), our mission is to lead the fight against hunger in our community. Our vision is to end hunger in coastal South Carolina. Our guiding principles are: Feed. Advocate. Empower.
The LCFB was founded in 1983 as a clearinghouse for donated food items through the generosity of both the Coastal Community Foundation of South Carolina and Trident United Way.
Our service model is simple and cost-effective. We collect, inspect, maintain and distribute otherwise wasted food products from manufacturers, food distributors, the government, supermarkets, wholesalers and farmers and redistribute these food products to a grassroots network of nearly 300 member agencies providing hunger-relief services throughout the 10 coastal counties of South Carolina.
The LCFB will distribute more than 25 million pounds of food, including 6 million pounds of fresh produce to 200,000 families, children and seniors in 2016. We are a member of Feeding America, the nation’s official network of food banks.
One in four children in our community are at risk of hunger. At the LCFB, it’s our mission to end childhood hunger in coastal South Carolina through a range of innovative programs, one of which is summer feeding service programs (SFSP).

4HuNger Free SuMMer HubS INIt IAtIve : A NeedS ASSeSSMeNt
AcknowledgmentsWRITTEN AND DEVELOPED BY:Elizabeth B. Symon, MS, MPA, CSMProgram Manager, Public Health InitiativesJoseph P. Riley Jr. Center for Livable CommunitiesCollege of Charleston
Olivia M. Thompson, PhD, MPHAssistant Professor and Director, Division of Public Health Sciences Joseph P. Riley Jr. Center for Livable CommunitiesCollege of Charleston
Madison Kaelin, BSResearch AssistantCollege of Charleston
Jacob Stoudenmire, MPADirector of ResearchJoseph P. Riley Jr. Center for Livable CommunitiesCollege of Charleston
Kendra Stewart, PhD, MPAAssociate Professor and DirectorJoseph P. Riley Jr. Center for Livable CommunitiesCollege of Charleston
GIS MAPPING BY:Corey Callihan, MESCollege of Charleston
GRAPHIC DESIGN BY:Meg McConnell, MAwww.MDMcConnell.com

5HuNger Free SuMMer HubS INIt IAtIve : A NeedS ASSeSSMeNt
table of Contents
Executive Summary. . . . . . . . . . . . . . . . . . . . . . . . . . . . . . . . . . . . . . . . . . . . . . . . . . . . . . . . . . . . . . . . . . . . . . . . . . . . . . . . . . . . . . . . . . . . . . . . . . . . . . . . . . . . . .6
Project Background and Significance. . . . . . . . . . . . . . . . . . . . . . . . . . . . . . . . . . . . . . . . . . . . . . . . . . . . . . . . . . . . . . . . . . . . . . . . . . . . . . . . .6
Project Purpose. . . . . . . . . . . . . . . . . . . . . . . . . . . . . . . . . . . . . . . . . . . . . . . . . . . . . . . . . . . . . . . . . . . . . . . . . . . . . . . . . . . . . . . . . . . . . . . . . . . . . . . . . . . . . . . . . .7
Methodology. . . . . . . . . . . . . . . . . . . . . . . . . . . . . . . . . . . . . . . . . . . . . . . . . . . . . . . . . . . . . . . . . . . . . . . . . . . . . . . . . . . . . . . . . . . . . . . . . . . . . . . . . . . . . . . . . . . . . .7
Key Findings. . . . . . . . . . . . . . . . . . . . . . . . . . . . . . . . . . . . . . . . . . . . . . . . . . . . . . . . . . . . . . . . . . . . . . . . . . . . . . . . . . . . . . . . . . . . . . . . . . . . . . . . . . . . . . . . . . . . . . .8
Recommendations. . . . . . . . . . . . . . . . . . . . . . . . . . . . . . . . . . . . . . . . . . . . . . . . . . . . . . . . . . . . . . . . . . . . . . . . . . . . . . . . . . . . . . . . . . . . . . . . . . . . . . . . . . .12
Introduction. . . . . . . . . . . . . . . . . . . . . . . . . . . . . . . . . . . . . . . . . . . . . . . . . . . . . . . . . . . . . . . . . . . . . . . . . . . . . . . . . . . . . . . . . . . . . . . . . . . . . . . . . . . . .13
Framework of the Summer Feeding Service Program. . . . . . . . . . . . . . . . . . . . . . . . . . . . . . . . . . . . . . . . . . . . . . . . . . . . . .13
The Lowcountry Food Bank’s Summer Feeding Program. . . . . . . . . . . . . . . . . . . . . . . . . . . . . . . . . . . . . . . . . . . . . . . . .15
Procedures Used. . . . . . . . . . . . . . . . . . . . . . . . . . . . . . . . . . . . . . . . . . . . . . . . . . . . . . . . . . . . . . . . . . . . . . . . . . . . . . . . . . . . . . . . . . . . . . . . . . . . . . . . . . . . . . . . .19
Key Informant Interviews. . . . . . . . . . . . . . . . . . . . . . . . . . . . . . . . . . . . . . . . . . . . . . . . . . . . . . . . . . . . . . . . . . . . . . . . . . . . . . . . . . . . . . . . . . . . . . . . .19
Parent/Guardian Surveys and Focus Group Discussions. . . . . . . . . . . . . . . . . . . . . . . . . . . . . . . . . . . . . . . . . . . . . . . .19
Results. . . . . . . . . . . . . . . . . . . . . . . . . . . . . . . . . . . . . . . . . . . . . . . . . . . . . . . . . . . . . . . . . . . . . . . . . . . . . . . . . . . . . . . . . . . . . . . . . . . . . . . . . . . . . . . . . . . . . . . . . . . . . . .24
Key Informant Interview Findings. . . . . . . . . . . . . . . . . . . . . . . . . . . . . . . . . . . . . . . . . . . . . . . . . . . . . . . . . . . . . . . . . . . . . . . . . . . . . . . . . . . . .24
Focus Group Discussions Findings. . . . . . . . . . . . . . . . . . . . . . . . . . . . . . . . . . . . . . . . . . . . . . . . . . . . . . . . . . . . . . . . . . . . . . . . . . . . . . . . . .33
Parent/Guardian Survey Result Findings. . . . . . . . . . . . . . . . . . . . . . . . . . . . . . . . . . . . . . . . . . . . . . . . . . . . . . . . . . . . . . . . . . . . . . . . . .40
Discussion. . . . . . . . . . . . . . . . . . . . . . . . . . . . . . . . . . . . . . . . . . . . . . . . . . . . . . . . . . . . . . . . . . . . . . . . . . . . . . . . . . . . . . . . . . . . . . . . . . . . . . . . . . . . . . . . . . . . . . . . . .49
Main Barriers to Child Participation. . . . . . . . . . . . . . . . . . . . . . . . . . . . . . . . . . . . . . . . . . . . . . . . . . . . . . . . . . . . . . . . . . . . . . . . . . . . . . . . .49
Main Program Needs. . . . . . . . . . . . . . . . . . . . . . . . . . . . . . . . . . . . . . . . . . . . . . . . . . . . . . . . . . . . . . . . . . . . . . . . . . . . . . . . . . . . . . . . . . . . . . . . . . . . . . .51
Conclusions and Recommendations. . . . . . . . . . . . . . . . . . . . . . . . . . . . . . . . . . . . . . . . . . . . . . . . . . . . . . . . . . . . . . . . . . . . . . . . . . . . . . . . . . .52
Main Barriers to Service. . . . . . . . . . . . . . . . . . . . . . . . . . . . . . . . . . . . . . . . . . . . . . . . . . . . . . . . . . . . . . . . . . . . . . . . . . . . . . . . . . . . . . . . . . . . . . . . . .52
General Conclusions and Recommendations. . . . . . . . . . . . . . . . . . . . . . . . . . . . . . . . . . . . . . . . . . . . . . . . . . . . . . . . . . . . . . . . . .52
Rural Areas. . . . . . . . . . . . . . . . . . . . . . . . . . . . . . . . . . . . . . . . . . . . . . . . . . . . . . . . . . . . . . . . . . . . . . . . . . . . . . . . . . . . . . . . . . . . . . . . . . . . . . . . . . . . . . . . . . . . . .53
Limitations to the Feasibility Study. . . . . . . . . . . . . . . . . . . . . . . . . . . . . . . . . . . . . . . . . . . . . . . . . . . . . . . . . . . . . . . . . . . . . . . . . . . . . . . . . .53
References. . . . . . . . . . . . . . . . . . . . . . . . . . . . . . . . . . . . . . . . . . . . . . . . . . . . . . . . . . . . . . . . . . . . . . . . . . . . . . . . . . . . . . . . . . . . . . . . . . . . . . . . . . . . . . . . . . . . . . . . .54
Appendices. . . . . . . . . . . . . . . . . . . . . . . . . . . . . . . . . . . . . . . . . . . . . . . . . . . . . . . . . . . . . . . . . . . . . . . . . . . . . . . . . . . . . . . . . . . . . . . . . . . . . . . . . . . . . . . . . . . . . . . . .56

6HuNger Free SuMMer HubS INIt IAtIve : A NeedS ASSeSSMeNt
executive Summary
PROjECT BACkGROuND AND SIGNIfICANCEThe household food insecurity rate in South Carolina is 18%, which is a rate that is approximately 2% higher than the national average. Moreover, according to “Map the Meal Gap Statistics”, more than a quarter of South Carolina’s children risk hunger on a daily basis. In the ten coastal areas of South Carolina in which the Lowcountry Food Bank (LCFB) serves, the need for hunger relief programming is particularly acute. Feeding America estimates that approximately 68,090 children in this region do not consistently receive the food that they need to live healthy, active lives.
During the school year, the National School Lunch Program (NSLP) plays a pivotal role in fighting childhood hunger. However, in coastal South Carolina, while 104,471 children qualify for the NSLP program, Food Research and Action Center (FRAC) estimates that only 19% of these children (19,850) received meals at Summer Feeding Service Program (SFSP) sites. In addition, the LCFB provides 6,000 children during the school year with food assistance through programs such as BackPack Buddies, School Pantry, and Kids Café. However, during the summer the LCFB is only able to provide 1,920 children with meals/snacks at SFSP sites (only 2% of the children eligible for NSLP).
The Hunger-Free Summer Hubs Initiative is a multi-agency collaboration that includes personnel from the Lowcountry Food Bank, the Mayor Joseph P. Riley Center for Livable Communities at the College of Charleston, Feeding America, the Family Resiliency Center at the University of Illinois, and AmeriCorps VISTA. This team was established to conduct a feasibility study to better determine recommendations for increased summer feeding service program participation in the Lowcountry Food Bank’s service area, which includes the following ten coastal counties: Beaufort, Berkeley, Charleston, Colleton, Dorchester, Georgetown, Hampton, Horry, Jasper, and Williamsburg. A mixed-methods approach was used to obtain both qualitative and quantitative data for the feasibility study.

7HuNger Free SuMMer HubS INIt IAtIve : A NeedS ASSeSSMeNt
PROjECT PuRPOSEThe project purpose is to assess childhood hunger summer programming in the Lowcountry Food Bank’s service area. The Hunger-Free Summer Hubs Initiative aims to address the following questions:
How can Food Banks strategically partner, over a three-year period and beyond, with organizations within their community to:
a) Increase access to meals for children and their families during the summer months?
b) Increase participation by eligible children in SFSP programming?
METHODOLOGYThe purpose of this feasibility study was to identify possible reasons behind the low utilization of SFSP sites within the Lowcountry Food Bank’s service area in order to better determine best practices to increase program participation. In order to identify low utilization factors related to SFSP participation, key informant interviews were conducted with state agency area-wide parties, school district representatives, and non-school district representatives. These parties were previously selected by the Lowcountry Food Bank based on their county location, familiarity and experience with the SFSP, and, importantly, the Lowcountry Food Bank’s interest in increased partnership potential in regards to SFSP. In addition, focus group discussions were conducted with parents/guardians within each county in order to assess the level of interest and awareness in SFSP as well as summertime feeding struggles and behaviors when children are not in school. A parent/guardian survey was developed from existing tools with questions encompassing summertime feeding struggles and behaviors, level of interest and awareness in SFSP, services and/or incentives needed for child participation, barriers to participation, information sources, and demographics. The survey was made available both electronically and in paper format.
“We can’t assume that people know what benefits are out there,
and we can’t assume that people know that they’re
eligible for them.”

8HuNger Free SuMMer HubS INIt IAtIve : A NeedS ASSeSSMeNt
“Some people are skipping meals because
they can’t afford it. I know some people that
don’t work, and the food stamps are just not
enough. they have to. They can’t afford it.”
kEY fINDINGS
Key Informant InterviewsKey informant interviews revealed perspectives on barriers to child participation, barriers to service in the SFSP, and recommendations for program improvement and needs within the SFSP.
1. Barriers to child participation in the SFSP
Six main themes were identified as barriers to child participation by key informants, and included:
Transportation• Lack of awareness and outreach• Quality of food• Negative association/stigma• Time of day• Lack of activities•
2. Barriers to service - biggest challenges for sites, sponsors, and vendors in the SFSP
Six main themes were identified as the biggest challenges for sites, sponsors, and vendors servicing the SFSP, and included:
Transportation• Lack of knowledge or training• Administrative burdens• Financial stability• Proper facilities and equipment• Food costs and menu planning•

9HuNger Free SuMMer HubS INIt IAtIve : A NeedS ASSeSSMeNt
3. Recommendations on program improvement and needs for the SFSP
Five main themes were identified as SFSP needs or suggestions for program improvement, and included:
Innovation• Advocacy and community involvement• Increase outreach and education• Additional sites• Food trucks and mobile farmer’s markets•
Focus Group DiscussionsFocus group discussions provided insights from parents and guardians on summer feeding behavior, summer feeding struggles, awareness of and interest in SFSP, needs of SFSP offerings, services and incentives, child participation barriers, and best locations to receive SFSP information.
1. Perspectives on summer feeding behavior
Home is where children most often spend their time and eat lunch.• A handful of children most often spend their time and eat lunch either with a family member, • at a summer school or camp program, or at work with their parents.
2. Perspectives on summer feeding struggles
Food insecurity is particularly high in the summertime months when children are not in • school, with participants indicating either worrying about running out of food or actually running out of food during the summer.Food insecurity patterns mainly revolve around the need to provide more meals during the • summer when children are not in school to take advantage of school services such as the NSLP. In addition, many families face food insecurity towards the end of the month before the following month’s food assistance is available.The main way participants indicated making meals or food stretch is by cutting meal sizes, • serving less nutritious foods, and skipping meals.

10HuNger Free SuMMer HubS INIt IAtIve : A NeedS ASSeSSMeNt
3. Perspectives on awareness of and interest in SFSP
More than half of the focus group participants were unaware of locations where kids can • receive free meals. Of those participants who were aware of locations where kids could receive free meals, • 100% of these participants recommended these free meals to others. 100% of the focus group participants expressed interest in the SFSP.•
4. Perspectives on summer feeding service program offerings, services, and incentives
Four main themes were identified by focus group participants as needed services or incentives for the SFSP, and included:
Transportation• Safe and secure location• Educational and enrichment activities• Recreational and physical activities•
5. Perspectives on SFSP child participation barriers
Three main themes were identified by focus group participants that would prevent their child/children from participating in the SFSP, and included:
Lack of transportation• Inconvenient timeframe• Negative connotation or social stigma•
6. Perspectives on SFSP information sources
Focus group participants identified the following four sources as the best way to receive information about the SFSP:
Schools of their children• Local church or place of worship• Local government offices (DSS/WIC/SNAP)• Local newspaper•
“I think they are just as bored as they are hungry some days.”

11HuNger Free SuMMer HubS INIt IAtIve : A NeedS ASSeSSMeNt
Parent/Guardian SurveysThe parent/guardian survey asked questions about summer food security and included questions regarding summer feeding behavior, summer feeding struggles, awareness of and interest in SFSP, needs to SFSP offerings, services and incentives, SFSP child participation barriers, and best formats and locations to receive SFSP information.
1. Summer food security among children
Food insecurity is particularly high in the summertime months when kids are not in school. Of those surveyed, approximately 70% • identified as having “very low food security” while approximately 28% identified as having “low food security.”
2. Awareness and interest in SFSP
More than half of the survey respondents in both food security categories reported being unaware of locations in the community where • children could go to receive free meals, with respondents also indicating that their children did not receive any free summer meals.Interest level in SFSP is highest in those respondents who identified as having “very low food security.”•
3. Desired SFSP services, offerings, and incentives
The number one need for the SFSP among both “low security” and “very low security” is the necessity for an SFSP site location to be safe • and secure.Other top SFSP necessities identified include: Provide healthy, balanced meals, provide meals their child/children are willing to eat, provide • meals at no cost to all children 18 and under, and provide educational activities.
4. Barriers to child participation in SFSP
“Very low security” respondents indicated meals not being served at a convenient location as the number one barrier to child participation • whereas respondents within the “low security” category indicated that their child/children do not need free summer meals as the number one barrier.
5. Desired SFSP operations
The preferred hours of operation for SFSP sites were identified as weekdays in the afternoon with over half of “very low security” • respondents indicating the need for an SFSP site to be within 1 mile of either their home or place of employment.

12HuNger Free SuMMer HubS INIt IAtIve : A NeedS ASSeSSMeNt
6. SFSP information sources – Where and How
Respondents indicated a preference for learning about the SFSP at their child’s school • and a church or place of worship via flyers and/or in the mail.
RECOMMENDATIONS
Target very low food secure households with children. • Deliver food to children (i.e., healthy, prepared frozen meals that just need to be reheated • along with breakfast items and fresh fruits and veggies). This could be done via mail delivery partnership (i.e., Blue Apron, Hello Fresh) or via a refrigerated or dry ice packed truck. The money that is allocated for “extra services” at pick-up sites could be reallocated to cover the costs associated with shipping food to households with children. Change the name of the summer feeding program to eliminate the stigma associated • with getting free food and advertise through the local newspaper, schools, and churches.Create a hard-copy form that parents can complete to register in addition to a website • with online registration.

13HuNger Free SuMMer HubS INIt IAtIve : A NeedS ASSeSSMeNt
IntroductionAcross the United States, over 48 million Americans live in food insecure households, including over 15 million children1,2. The United States Department of Agriculture (USDA) defines food insecurity as “a household-level economic and social condition of limited or uncertain access to adequate food3.” Food insecurity is linked with poor health outcomes and low academic performance for affected children, and it is considered to be one of the most important public health issues of today. Addressing this issue has become a main goal for policy makers, health administrators, and community members alike. Free and reduced school lunch programs alleviate some of the burden bared by impoverished families by providing free or low-cost breakfast and lunch to children of families who fall at or below a certain income. The National School Lunch Program (NSLP) has done much to combat childhood food insecurity, but when the program halts due to summer vacation, food insecurity rates rise4. The Summer Feeding Service Program (SFSP) was introduced to combat this increase in food insecurity rates by providing free meals to children (0-18 years of age) of low-income families over the summer months at approved SFSP sites5.
Despite efforts of the program to lower food insecurity rates, the SFSP is seeing troubling nationwide underutilization. In 2015, the USDA reported that the SFSP served 2.565 million meals per day during the peak month of July. The number of free and reduced priced meals served for 2015 is reported at 23 million6. This means that the number of meals served over the summer is about 11.15% that of meals served to eligible children over the school year. The reason for this discrepancy in utilization is a great cause of concern for public health officials, resulting in a call for studies of barriers to summer feeding program participation and recommendations to improve the SFSP and for prioritization of SFSP expansion initiatives by the USDA.
fRAMEWORk Of THE SuMMER fEEDING SERVICE PROGRAMThe SFSP is a federally funded, state administered program constructed of a hierarchical framework led by the USDA7. The SFSP is made up of the USDA, state agencies, sponsors, sites, and program participants.
USDAThe USDA provides funding for the program, analyzes program data, and provides marketing tools for the SFSP.
State AgenciesState agencies communicate directly with the USDA and oversee the program for their respective state. They are responsible for recruiting sponsors and publicizing sites, training sponsors and providing

14HuNger Free SuMMer HubS INIt IAtIve : A NeedS ASSeSSMeNt
assistance, monitoring sites and sponsors, and distributing reimbursements to sponsors. The South Carolina Department of Education manages the SFSP in South Carolina.
SponsorsSponsors recruit sites and train volunteers by providing technical assistance, monitor sites, report meal counts and submit claims based on reimbursement rates, and conduct community SFSP promotion and outreach in the community.
SitesSites are the physical location of meal distribution in the community. Sites may be located in schools, parks, community centers, churches, sports facilities, and migrant centers. Children are fed, supervised, and often provided activities. Outreach is done to draw more children to the sites.
There are many forms that a site can take.
Open sites• operate in areas where over 50% of the children in the area meet income eligibility. Meals here are given out on a first-come,
first-serve basis to any child 0-18.
Restricted open sites • operate similarly to an open enrollment site, but often there is limited attendance due to space, safety, or control.
Closed enrolled sites • operate in areas with smaller localized regions of poverty. Here, children are required to enroll in the program to
receive free meals.
Additional types include: •
- for-profit sites
- NSLP operated sites
- camps
- tribal government sites
- rural sites, which receive a higher reimbursement rate
- migrant sites
- National Youth Sports Program sites
- Upward Bound closed enrolled sites
- farmers market sites and mobile sites9.

15HuNger Free SuMMer HubS INIt IAtIve : A NeedS ASSeSSMeNt
Participants Participants in the SFSP range from 0-18 years of age and usually meet income eligibility for meal assistance, although some children who do not meet income eligibility may collect meals from open enrollment and certain other sites.
THE LOWCOuNTRY fOOD BANk’S SuMMER fEEDING PROGRAM The Hunger Free Summer Hubs Needs Assessment, a cross-sectional needs assessment made possible by a grant from ConAgra, Inc. via Feeding America and the Lowcountry Food Bank, is a SFSP feasibility study examining 10 South Carolina counties: Beaufort, Berkeley, Charleston, Colleton, Dorchester, Georgetown, Hampton, Horry, Jasper, and Williamsburg (Figure 1).
FIGURE 1. Hunger Free Summer Hubs Geographic Area

16HuNger Free SuMMer HubS INIt IAtIve : A NeedS ASSeSSMeNt
In South Carolina, SFSP utilization rates have seen growth — up 20.1% from 2013 to 201411; but utilization remains below optimal levels at just 12.18% in 2014. Thankfully, SFSP is not the only option for summer nutrition. The National School Lunch Program offers services such as the Seamless Summer Option, which brought the utilization percentage to 20.18% in 201412. Although these increases in utilization seem promising, they are still far below the optimal levels, and the rate of food insecurity during the summer months continues to outpace food insecurity rates during the school years.
In 2013, the USDA prioritized the SFSP in an attempt to serve millions more meals to food insecure children across the US. While some of these initiatives were successful, they were focused on six specific states and South Carolina was not included. Successful initiatives were effective in part because they were specific to their target community, with solutions tailored to fit their population13. The Hunger Free Summer Hubs Initiative aims to assess the needs of coastal South Carolina so that SFSP solutions may be custom fit to this location. One such notable distinction in the 10 counties is the prevalence of rural community types, which can be seen in Figure 2. Rural community settings impose unique challenges for the SFSP largely due to the spreading of homes in the area14. Sites in these areas may find it difficult to meet open enrollment qualifications and may be required to fill out more paperwork. Additionally, children often lack the resources to travel long distances from their homes to the fixed site locations. Of the 10 counties in the current study, 4 have a rural population of 50% or more, and 3 have a rural population of over 70%15.
FIGURE 2. Percentage of People Living in Rural Areas in 10 South Carolina Counties16

17HuNger Free SuMMer HubS INIt IAtIve : A NeedS ASSeSSMeNt
Rates of food insecurity for the 10 counties can be seen in Figure 3. The average rate was reported at 15.2% 2013, which is slightly lower than the 17.1% reported prevalence of low food security and very low food security rates in South Carolina, but is in line with overall food insecurity rates for the US, which was reported as 15.8% in 201417.
FIGURE 3. Household Food Insecurity Percentage in 10 South Carolina Counties18

18HuNger Free SuMMer HubS INIt IAtIve : A NeedS ASSeSSMeNt
Median household income levels in the 10 Counties for those with a child/children ranged from about $37,000 to $59,000 per year as compared to the median household income level with a child/children for South Carolina of $50,967 (Figure 4). The counties with the highest population of rural inhabitants have lower median incomes and higher rates of food insecurity, which may indicate a strong need for Summer Feeding Programs in rural areas in particular.
FIGURE 4. Median Household Income with Child/Children by County19

19HuNger Free SuMMer HubS INIt IAtIve : A NeedS ASSeSSMeNt
PrOCedureS uSed
kEY INfORMANT INTERVIEWSIn October 2015, a letter (Appendix A) was distributed to 18 selected key informant interviewees and/or potential partners selected by the LCFB in order to coordinate in-person or phone interviews addressing what SFSPs exist, familiarity with SFSP, barriers from participating in SFSP, and benefits of SFSP within their counties. Interviewees consisted of state agencies serving as area-wide parties, school district representatives, and non-school district representatives. Interviews were conducted during January, February, and March of 2016. Three separate key informant interview guides (Appendix B) were developed and used accordingly. Key informant interviews were audio-recorded and sent off for transcription servicing so a summary of key informant input could be compiled of SFSP issues. Audio-recordings and transcriptions will be kept in a secure location for a period of 3 years after the project completion date of May 15th, 2016.
PARENT/GuARDIAN SuRVEYS AND fOCuS GROuP DISCuSSIONSIn January 2016, a newsletter (Appendix C) was electronically distributed to participating LCFB BackPack Buddies (43 schools in 10 counties; 3,164 children) (Table 1) and School Pantry (31 schools in 10 counties; 2,466 children) (Table 2) site coordinators for distribution for children to give to their parents/guardians in order to recruit parent/guardian participants for an anonymous online parent/guardian survey, with the College of Charleston’s Qualtrics account. The survey was launched and made available in January 2016 through April 2016. Prior to the newsletter distribution, 6 people who were identified with food insecurity were selected to take the parent/guardian survey created in order to cognitively test the survey content for level of understanding and clarity of questions being asked. Additionally, prior to newsletter distribution a letter of research participation approval was sent to school principals (Appendix D).
Table 1. LCFB’s Participating BackPack Buddies Schools, Counties, and Number of Children Served
County School Number of Participating ChildrenBeaufort Beaufort Elementary 80Beaufort Broad River Elementary 81Beaufort Joseph S. Shanklin Elementary 77Beaufort Lady’s Island Elementary 48Beaufort St. Helena Elementary 102Beaufort Whale Branch Elementary 120Berkeley Boulder Bluff Elementary 40Berkeley Cross Elementary 87Berkeley Goose Creek Primary 50Berkeley J.K. Gourdin Elementary 35

20HuNger Free SuMMer HubS INIt IAtIve : A NeedS ASSeSSMeNt
County School Number of Participating ChildrenBerkeley Sedgefield Intermediate 126Berkeley St. Stephen Elementary 92
Charleston Chicora Elementary 105Charleston Edith L. Frierson Elementary 40Charleston James B. Edwards Elementary 26Charleston James Simons Elementary 24Charleston Jennie Moore Elementary 28Charleston Mary Ford Elementary 145Charleston Matilda Dunston Elementary 60Charleston McKinney-Vento 178Charleston Meeting Street Elementary at Brentwood 15Charleston Memminger Elementary 85Charleston Mitchell Elementary 60Charleston North Charleston Elementary 148Charleston Sanders-Clyde Elementary 125Charleston St. James-Santee Elementary 65Charleston W.B. Goodwin Elementary 127
Colleton Bells Elementary 70Colleton Hendersonville Elementary 75Colleton Northside Elementary 80
Dorchester Flowertown Elem 50Dorchester Knightsville Elementary 65Dorchester Harleyville Elementary 75Dorchester Williams Memorial Elementary 110Georgetown McDonald Elementary 50
Hampton Fennell Elementary 48Hampton Varnville Elementary 45Hampton Estill Elementary 97
Horry Kingston Elementary 55Jasper Hardeeville Elementary 75Jasper Ridgeland Elementary 100
Williamsburg W.M. Anderson Primary 40Williamsburg Kenneth Gardner Elementary 85
Table 1 continued

21HuNger Free SuMMer HubS INIt IAtIve : A NeedS ASSeSSMeNt
Table 2. LCFB’s Participating School Pantry Schools, Counties, and Number of Children Served
County School Number of Participating ChildrenBeaufort Battery Creek High 80Beaufort Hilton Head Island High 40Beaufort Hilton Head Island Middle 40Beaufort Lady’s Island Middle 80Beaufort Robert Smalls International Academy 80Beaufort Whale Branch Middle 80Berkeley Cainhoy Elementary/Middle 80Berkeley Sedgefield Middle 40Berkeley St. Stephen Middle 35
Charleston Baptist Hill High 56Charleston Burke High 56Charleston Haut Gap Middle 56Charleston Jerry Zucker Middle 72Charleston Lincoln High 40Charleston Midland Park Primary 56Charleston Northwoods Middle 80Charleston Pinehurst Elementary 64Charleston W.B. Goodwin Elementary 255
Colleton Colleton County Middle 160Dorchester Charles B. DuBose Middle 64Georgetown Carvers Bay Middle 112Georgetown Georgetown Middle 96Georgetown Rosemary Middle 40
Hampton North District Middle 48Hampton Estill Middle 80
Horry Loris Middle 80Jasper Hardeeville-Ridgeland Middle 80
Williamsburg C.E. Murray Middle 48Williamsburg D.P. Cooper Charter School 112Williamsburg Greeleyville Elementary 200Williamsburg Kingstree Middle 48

22HuNger Free SuMMer HubS INIt IAtIve : A NeedS ASSeSSMeNt
The 35-question survey (Appendix E), adapted from Share Our Strength’s 2015 Summer Meals Survey and the USDA Food Security Assessment Toolkit, asked questions about food insecurity, use of the SFSP, interest in the SFSP, barriers to SFSP use, and recommendations for the SFSP, and demographic questions such as race, ethnicity, employment status, community type, and income. Participants in the survey were parents/guardians of children aged under the age of 18 who could be served by the SFSP. Of 372 people who opened the survey, 25 people did not complete the survey and were excluded. Of the 347 responses, 27 people indicated that they did not have children and were excluded. Of those 320 responses, 3 did not answer questions 1-7, which indicated that they did not have children and thus were excluded, leaving the final response count to be 317. The survey collected quantitative data, which were analyzed using descriptive statistics to determine the frequency and percentage of responses. Variables for hunger were determined by coding the responses for survey questions 1-7, which were based on the USDA Food Insecurity Determinant Survey21. These questions were adjusted to account specifically for summer food security. The hunger variable was separated into 3 categories, “high food security,” “low food security” (low security), and “very low food security” (very low security). If responses for questions 1-3 included “often true” or “sometimes true,” they were counted as an affirmative response to food insecurity and were given a point. Responses of “yes” were counted as an affirmative response to food insecurity for questions 4-6 and given a point. Scores of 0-1 point were considered high food security, scores of 2-4 were considered as “low food security,” and scores of 5-7 were considered as “very low food security.”
To allow for meaningful statistical analysis, data responses for several questions were collapsed into categories. Data for income were collapsed into three categories based on monthly income before tax deductions. Categories included “less than $1,600 per month,” “between $1,600 and $3,500” and “$3,500 or more.” Race was collapsed into the categories “Black,” “White,” and “Other” with “Other” including those who indicated their race as Asian, Pacific Islander or Native Hawaiian, or American Indian or Alaskan Native. Employment status was collapsed into the categories “full-time” “part-time” and “other” with “other” including those who indicated their employment status as student, retired, seeking employment, homemaker, disabled, or some other employment status. Household designation was collapsed into categories “urban,” “rural,” and “other,”

23HuNger Free SuMMer HubS INIt IAtIve : A NeedS ASSeSSMeNt
with “other” including those who indicated their designation as suburban or some other household designation. Household location by County was collapsed into “Charleston” or “other” with “other” including those who indicated their household location to be Beaufort, Berkeley, Dorchester, Georgetown, Hampton, Jasper, Horry, Colleton, or Williamsburg County. Data were analyzed using a Fisher’s Exact Test to determine statistical significance. Answer proportions were compared for the variables Low Food Security and Very Low Food Security to determine independence. A two-sided p-value of <.05 was considered to be statistically significant. Qualitative data were also collected to gain knowledge on why respondents indicated certain answer choices. Qualitative responses gave participants the opportunity to explain their designated interest levels in the SFSP, as well as indicate barriers and recommendations to the SFSP that were not covered by possible survey answer choices. Qualitative data were entered into online software tool TagCrowd, which generated a word cloud with word frequencies so major themes of the answers could be deciphered. The software omitted common filler words and presented the 50 most common words found in responses.
The online survey contained an additional separate link in which participants could enter in their county and email to be entered into a raffle to receive a $25 Amazon gift card (one per county). The separate link allowed the email (identifying information) to be separated from the survey data in order to keep the results anonymous. The online survey also contained a separate, voluntary 5-minute screener survey in order to recruit 8-12 parents for a focus group discussion at a location within each county so as to represent each county in the LCFB service area.
In addition to the online survey and due to lack of online participation, the parent/guardian survey was also printed and distributed in paper form at several of the LCFB’s Fresh for All produce distributions as well as other LCFB events. At these events, participants were asked if they were parents/guardians of children between 0-18 years. Parents/guardians completed the surveys and survey data was entered into the Qualtrics database. Paper surveys are stored and secured with a College of Charleston researcher.
Due to a lack of online survey participation, recruiting for focus group discussions was aided and coordinated by many key informant interviewees as well as partners with the LCFB. These interviewees and partners attempted to recruit 6-12 parents/guardians from potential food insecure households. Each focus group participant received a $25 Amazon gift card. A focus group screener survey (Appendix F) was administered prior to the focus group discussion in order to identify their level of food security/insecurity. In addition, a focus group consent form (Appendix G) was distributed and signed by each participant prior to the focus group discussion. A focus group moderator guide (Appendix H) was developed in order to familiarize participants with the research study. A focus group discussion guide (Appendix I) was developed from the parent/guardian survey in order to probe for a deeper understanding of summertime feeding struggles, levels of interest and awareness in SFSP, barriers to participation, etc. Focus group discussions were audio-recorded. Recordings were sent off for transcription servicing so as a summary of commonalities of various SFSP issues could be compiled. Audio-recordings and transcriptions will be kept in a secure location for a period of 3 years after the project completion date of May 15th, 2016.

24HuNger Free SuMMer HubS INIt IAtIve : A NeedS ASSeSSMeNt
results
kEY INfORMANT INTERVIEW fINDINGSThe key informant interview phase entered into a dialog with key area wide parties (N=3), school district representatives (N=8), and non-school district representatives (N=5) totaling 15 key informant interviews with 16 participants (Table 3) within Beaufort, Berkeley, Dorchester, Georgetown, Horry, and Jasper counties, totaling 6 counties. Interviewees were able to comment and discuss topics concerning SFSP, such as level of familiarity, barriers to participation from both child participation level standpoints as well as SFSP provider (site/sponsor/vendor levels) standpoints, and SFSP program improvement recommendations.
Table 3. Key Informant Interview List by County, Key Informant, and Representative Category
6 Counties, 16 Key Informants
County key Informant CategoryBeaufort Joanne Edwards School District
Beaufort Theresa Roberts Non-School District
Beaufort Shannon Loper Non-School District
Berkeley Linda Fairchild School District
Berkeley Creighton Eddings Non-School District
Dorchester Debi Filomarino School District
Dorchester Patricia Truett School District
Dorchester Taffany Bolger Non-School District
Georgetown Jan Knox School District
Georgetown Terri Lottchea Non-School District
Horry Laura Farmer School District
Horry Sara Tenny Non-School District
Jasper Lydia Breland School District
All Counties Sue Berkowitz Area-Wide Party
All Counties Dyeretta Fashion Area-Wide Party
All Counties Rebecca Scott Area-Wide Party

25HuNger Free SuMMer HubS INIt IAtIve : A NeedS ASSeSSMeNt
Barriers to Child ParticipationFigure 5. Key Informant Perspectives on Barriers to Child Participation
Figure 5 shows key informant interviewee’s perspectives on barriers to child participation in the SFSP. All 16 key informant interviewees identified transportation as the number one barrier, many commenting on the lack of a central location for an SFSP site. For example, one key informant stated that:
“There’s a big need, you know, how do you get meals to those kids because they may not be near a school or near a park.”
Other key informants discussed the lack of public transportation for SFSP and the fact that many families have parents or guardians who work during the day that are unable to shuffle their kids back and forth from SFSP sites. One key informant specified that:
“Children can get to school because there’s a public transportation for them to and from school, but then during the summer their parents are working. They’re at home, sitting there all day long, and who’s going to get them to and from these lunch programs?”
The second-rank barrier to child participation was identified by 9 key informants as a lack of awareness and outreach for SFSP. One key informant stated that:
“We can’t assume that people know what benefits are out there, and we can’t assume that people know that they’re eligible for them.”
Another key informant noted that:
“There’s not enough advertisement when it comes to knowing about these services.”
The quality of food at SFSP sites was identified as the third barrier to child participation by 7 key informants. Many discussed the importance of a kid friendly menu in order for child participation rates to go up. One key informant stated that:
“We’ve been learning that sponsors who have taken the initiative to have a more inviting menu, their numbers are going up.”

26HuNger Free SuMMer HubS INIt IAtIve : A NeedS ASSeSSMeNt
With another stating that:
“We may have sponsors in the areas that are feeding kids, but if the quality of the meal is not meeting certain standards that the kids like, they’re not going to come out in the hot sun to utilize the meal service.”
In addition to creating a kid friendly meal, key informants also stressed the importance of cold versus hot foods and menu planning cycles. Many discussed the fact that kids learn menu cycles and tend to see increased SFSP utilization when hot meals are served. One key informant commented that:
“The hot foods are far more expensive than the cold foods, but the hot foods are a better drawing card. Kids get tired of cold sandwiches after a while. So, after a couple of years we started mixing it up, so now we do a combination. We do cold foods a couple of days week and the other days we do hot foods.”
5 key informants commented that a negative association or stigma attached to SFSP sites is a barrier to child participation. Many suggested advertising SFSP sites in such a way that all families and kids associate a site as a positive experience. One key informant explained that:
“We don’t want there to be a stigma attached that all these kids that go here, they’re poor, and they just need the food. I think that just trying to eliminate any type of stigma that might be attached to it and then making it just a summer experience for the children that they can come participate in and have fun.”
Time of day in which SFSP sites are open and available to kids was identified by 5 key informants as a barrier preventing children from participating. Key informants discussed the need for sites to learn their kids and their timeframes. One key informant stated that:
“If you know that your sites are not having big numbers at 8:00 in the morning, you probably don’t need to do it at 8:00 in the morning. You have to look at when your children are going to come out and actually participate.”
Several key informants also discussed the need for SFSP sites to have extended timeframes in which kids could be able to stay at sites all day while their parents or guardians are at work. One key informant explained that:
“I would think that the timeframe needs to be a little longer because that way parents really wouldn’t have to worry about what’s going on with their children the whole day while they’re at work.”

27HuNger Free SuMMer HubS INIt IAtIve : A NeedS ASSeSSMeNt
Another key informant even questioned the need for evening hours at SFSP sites, stating that:
“My thing, too, is this is all during the day hours. What happens in the evening, you know? They have all maybe morning and afternoon programs, but there’s nothing in the evening at all.”
5 key informants identified a lack of activities provided at SFSP sites as a child participation barrier. Several key informants stressed the need for engaging activities to excite kids and entice them to utilize SFSP sites not just for meals but also for recreational, educational, and social experiences, with one key informant stating that:
“They’re not going to get out in the heat and walk because ‘I have my PlayStation. I can sit here all day.’ So, you have to entice them, engage them.”
Another key informant commented that:
“Kids like to have fun, but you want to provide some kind of enrichment if you can, and make it fun, because kids come out when there’s something to do. It can be recreational, but it can be enrichment as well. Kids like to stay busy.”
Barriers to ServiceFigure 6. Key Informant Perspectives on Barriers to Service
Figure 6 shows key informant interviewee’s perspectives on barriers to service sites, sponsors, and vendors face in the SFSP. All 16 key informants identified transportation as the biggest barrier to service not only in getting kids to and from sites but also in transporting food to and from sites within regulation standards due to travel time and distance. Thinking about a new SFSP site in certain areas, one key informant commented that:
“Coming into this area and trying to start a feeding program of any sort, the first thing you would have to think about is how are you going to get your people to and from you site. You know, there aren’t any city buses here like they have in Charleston where you can just get on a bus and go. We don’t have those services. So, if you don’t have a van service connected with your program you’re basically doomed.”
While discussing the issues in meeting regulation standards when transporting food to SFSP sites, one key informant shared that:

28HuNger Free SuMMer HubS INIt IAtIve : A NeedS ASSeSSMeNt
“One of the greatest challenges we face is because Horry County is spread out so far it’s difficult to be able to cover some areas of the county that I would really like to cover. I do have some sites that are further out that I’m a little uncomfortable in serving hot foods just because I’m afraid that they won’t meet the temperature requirements.”
Key informants identified the second major challenge to sites, sponsors, and vendors as lack of knowledge and training, specifically with newer SFSP programs. Many commented that there is a severe lack of understanding in what running an SFSP entails, leaving many newcomers unprepared and overwhelmed. One key informant stated that:
“With sponsors, what we’re learning is that they don’t prepare themselves well enough. When summer hits, it goes so fast, it’s almost like they’re losing the rest of the whole summer. When they finally get up for air, they don’t want to participate the next year because it was so overwhelming.”
Another key informant explained that there is a need for more training for interested parties, explaining that:
“I think earlier training and more in-depth training is the key. This would be overwhelming for a new sponsorship coming in. But, I would say additional training, more in-depth training, a lot more examples of what are the costs, and letting them know some of the challenges they’re going to face. I think somebody who’s never done this before, they’re kind of overwhelmed and blown out of the water.”
The third major challenge identified by key informants for sites, sponsors, and vendors participating in SFSP is the administrative burdens associated with running an SFSP. Such burdens include but are not limited to: financial accountability, meal accountability, keeping up with regulations and requirements, trained and reliable manpower, paperwork, and time commitment. On discussing paperwork and accountability, one key informant stated that:
“Paperwork is burdensome, I’m not going to lie to you. It took me a lot of my summer just working with Summer Feeding. You have to have the right people in these spots that are going to keep up with all of the paperwork because it’s important to know ‘This is how many I sent out, this is what you got, and now this is what I can claim.’ So, it’s just a check and balance every day.”
On discussing all of the administrative burdens as a whole in regards to the level of time commitment the SFSP requires, another key informant went on to explain that:
“It really takes time. I make it happen, and that’s the only way I can say it. I can’t do any more than I’m doing. I actually counted my time on timesheets a semester ago, and I worked two months more than what I am paid to work. So, you know, we’re talking about 40 days, and that used to be 20 days – didn’t mind that. 20 was not bad, but with the changes in the meal program, and the things I took on to make it work, I can’t get rid of those extra hours.”

29HuNger Free SuMMer HubS INIt IAtIve : A NeedS ASSeSSMeNt
Financial stability tallied up as the fourth challenge by 10 key informants for sites, sponsors, and vendors, specifically for newer programs with startup funding costs and programs who become stretched thin financially due to changing meal regulations. One key informant commented that:
“The biggest thing is understanding, honestly, you don’t get paid before, you get paid after, so you’re actually putting the money up front in the beginning.”
Another key informant explained the financial burdens felt due to new meal regulations, explaining that:
“They have changed the regulations. It’s requiring more fruits and vegetables to be served to the kids, so that’s a big difference in the patterns and it certainly affects the costs and the ability of getting everything in their program within the budget. I don’t know if it is something they can sustain with those changes.”
9 key informants identified having proper facilities and equipment as a challenge to sites, sponsors, and vendors participating in SFSP, indicating that having adequate facility size, up to code kitchens, storage space, refrigeration, and proper food transportation such as van sizes, coolers, and heat retaining containers known as Cambros are all needed to run a successful program but can be difficult to obtain. On discussing proper facilities, a key informant said:
“You know, if you want to serve more than something pre-packaged then you’re going to have the right kind of facility that DHEC would say, ‘Okay, it’s safe to serve meals here.’”
One key informant further stated that:
“Storage space can be hard. We’ll get a whole case of something when we only need a quarter of a case of something. So the storage, that’s been difficult for us. Freezer and refrigerator space and that sort of thing.”
On discussing food transportation and delivery, another key informant explained that:
“If I’m carrying a hot meal, I have to have the equipment and the van to hold and withstand it hot and keep it hot during that time because you never know what time the kids are actually going to show up.”

30HuNger Free SuMMer HubS INIt IAtIve : A NeedS ASSeSSMeNt
The last challenge facing sites, sponsors, and vendors was identified by 8 key informants as food costs in relation to menu planning and meal requirements. For example, one key informant explained that:
“Keeping food costs down is a big challenge for me. Milk is an expensive commodity, but we are required to serve milk with every meal. The child does not have to drink it, but we have to serve it. We throw away more milk than anything. We spend a lot on milk, and a lot of it has gone to waste because kids just don’t drink the milk.”
Another key informant further went on to state that:
“A major barrier is the cost of food and meal planning. We really can’t serve some of the types of food that we would like to send out, like more fresh fruits and vegetables, because of the cost.”
Recommendations for Program ImprovementFigure 7. Key Informant Recommendations for Summer Feeding Program Improvement
Figure 7 shows key informant interviewee’s perspectives and recommendations on program improvement for the SFSP. The first major recommendation for program improvement was identified by 13 key informants for the need for innovation within the SFSP in regards to maximizing resources and finding creative outlets to reach more families and feed more children, with one key informant explaining that:
“It’s about how do we maximize getting the resources out to the kids, and that’s why I think that we have to be much more creative and innovative about how we do it and more mindful and thoughtful about families so that when we’re thinking about how to do it we really are thinking about the realities of what families are going through.”
Tied with innovation also came the recommendation for increased advocacy and local community involvement, stressed by 13 key informants. One key informant explained the need for a grassroots campaign and getting local elected officials involved, stating that:
“When you get more elected officials involved in your area, that drums up a whole other level because when they have that education and knowledge as to what the summer food program is about, then they will be more inclined to assist with getting the kids out there. So getting the elected officials on the same board and giving them the same knowledge that we’re giving these sites and these sponsors is key.”

31HuNger Free SuMMer HubS INIt IAtIve : A NeedS ASSeSSMeNt
Many key informants mentioned much of their programs’ successes came from the result of partnering with organizations and businesses within their communities. For example, one key informant discussed that:
“In some areas, where our numbers are high at, we have the sheriff’s department participating. We have the fire departments participating. We have hospitals participating in the summer feeding program. In those areas where you cannot find central locations, getting those kind of people involved with the summer program is key to getting those kids to really safe places.”
9 key informants recommended increasing outreach and education for SFSP improvement by not just advertising through the school systems but by also getting community establishments to advertise and reach out as well. One key informant stated that:
“I think something that would help is our schools helping us to promote summer feeding not just at the schools but in the community and putting out positive messages letting parents know that this is something that can help the entire family.”
Adding additional sites was also suggested by 9 key informants as a recommendation for program improvement. Several key informants commented that many kids on the outskirts of South Carolina counties may not have access to SFSP. For example, one key informant stated that:
“Of course, just because many sites are being served in South Carolina, it still does not represent the full number of children who access free or reduced price meals during the school year, so we’re probably only reaching maybe a third of those children, and we need to continue to increase the number of sites that make meals available to children to partake in those meals.”
Several key informants also discussed the fact that not only would additional sites benefit more children, but they would also benefit sites and sponsors, with one key informant explaining that:

32HuNger Free SuMMer HubS INIt IAtIve : A NeedS ASSeSSMeNt
“It would benefit us if we could have more sites. Participation is what drives our sites that we have because we are solely based on our funding that comes from participation. If we don’t have the participation this year, then we can’t operate our program next year.”
The final recommendation for program improvement made by 7 key informants calls for food trucks and mobile famer’s markets. Several key informants discussed that much of South Carolina is scattered with very rural areas and communities where kids often cannot get out of very often. For example, one key informant commented that:
“What we are learning is that there are real rural, rural areas, meaning that there may be a house here, and probably a mile up the street there’s another house. They don’t have a central location for the kids to eat, a common feeding area. I think the best thing to do in those areas is to have mobile feeding in that area for door-to-door delivery.”
Another key informant stated that:
“We kind of bridged that gap this year by going to some of the sites. We rented vans. We rented U-Hauls and actually went into the places kids couldn’t get out of, trailer parks and maybe Section 8 housing. We saw pockets where kids couldn’t get to us, so we went to them and set up tables and fed them there.”

33HuNger Free SuMMer HubS INIt IAtIve : A NeedS ASSeSSMeNt
fOCuS GROuP SCREENER SuRVEYTable 4 contains focus group participant characteristics. The vast majority of participants were women (94%) with 1.5% male, and 4.5% not indicating gender. Black (82.0%) and non-Hispanic (94.0%) were the dominant racial and ethnic classifications indicated, with 3 participants (4.5%) not indicating their race or ethnicity. Furthermore, 1.5% indicated their ethnicity as Hispanic, 12.0% reported their race as White, and 1.5% reported their race as either American Indian or Alaskan Native, or Native Hawaiian or Pacific Islander, which was collapsed into the “other” category. Nearly half of the participants (45.5%) reported worrying about running out of food in the past 12 months while 50.0% reported not having this worry, and 4.5% did not indicate whether or not the faced this worry. 42.4% of the participants reported that in the past 12 months the food they bought did not last and they did not have enough money to buy more while 53.0% reported not having this experience, and 4.5% did not indicate whether or not they faced this experience.
fOCuS GROuP DISCuSSIONS fINDINGS
Summer Feeding BehaviorFigure 8. Focus Group Responses to Where Children Most Often Spend Time and Eat Lunch
Table 4. Focus Group Screener Survey Participant Characteristics
N = 66
Characteristic n (%)Gender
Male
Female
Missing
1 (1.5)
62 (94.0)
3 (4.5)Ethnicity
Hispanic or Latino
Not Hispanic or Latino
Missing
1 (1.5)
62 (94.0)
3 (4.5)Race
Black
White
Other
Missing
54 (82.0)
8 (12.0)
1 (1.5)
3 (4.5)Household/Family Food Insecurity
Worried about running out of food in the past 12
months
Yes
No
Missing
Food bought did not last and did not have money to
buy more in the past 12 months
Yes
No
Missing
30 (45.5)
33 (50.0)
3 (4.5)
28 (42.4)
35 (53.0)
3 (4.5)

34HuNger Free SuMMer HubS INIt IAtIve : A NeedS ASSeSSMeNt
Figure 8 shows focus group participants’ responses to questions regarding summer feeding behavior during the summer months when their children are not in school (N=10 focus groups; ~66 participants). When participants were asked to discuss when the children are not in school during the summer months where they most often spend most of their time, and who most often looks after them, 45 people indicated at home, 9 indicated with a family member, 7 indicated at summer camps/programs and 7 indicated with them at work. When asked where their children most often eat lunch during the summer months while not in school, 45 indicated at home, 9 indicated with a family member, 7 indicated at summer camps/programs, and 5 indicated with them at work.
Summer Feeding Struggles Figure 9 shows focus group participants’ perspectives and responses to questions regarding summer feeding struggles during the summertime months when their children are not in school (N=10 focus groups; ~66 participants). When participants were asked whether or not they ran out of food or were worried about running out of food this past summer when kids were not in school, 41 indicated doing so. One participant stated that:
“Potentially snacks because kids love snacks in a majority of the time during the summertime. Not particularly home cooked meals, but as far as snacks and like breakfast kind of stuff because they eat more of that because they’re home burning their energy.”
When asked if they were worried about running out of food or did run out of food for every month this past summer while kids were not in school, 32 indicated doing so as well. A participant explained that:
“I’m used to buying a certain amount of food because they’re at school or aftercare or whatnot, but during the summer it is more of an expense to provide those meals to them.”
Another participant commented that:
“Usually you have extra children in your household in the summer, so you always worry about extra food.”

35HuNger Free SuMMer HubS INIt IAtIve : A NeedS ASSeSSMeNt
Figure 10. Focus Group Summer Feeding Struggle Patterns59 participants noted that this worry followed a regular pattern each month, specifically at the end of a month when supplemental food assistance program money runs out (Figure 10). 45 participants also stressed the fact that there are more mouths to feed and more meals to provide that adds to their worry on having enough food. For example, one participant stated that:
“Between the first and tenth of the month is when most of us get our food assistance from the government. If kids are at home, they aren’t just eating 3 times a day, they are eating 6 times a day. They’re not eating every four hours, they’re eating every two hours. That’s not going to last long. So by the 20th of the month to the end of the month there’s no food.”
Figure 11. Focus Group Methods to Make Summertime Food StretchMany participants discussed several ways in which they make food last longer when they worry there may not be enough food during the summer months (Figure 11). 47 participants responded to cutting meal sizes and/or serving nutritious foods but lessening the amount. One participant provided an example by explaining that:
“If you’re used to eating maybe two pieces of sausage, you can only give them one because you didn’t have enough money to by the extra pack.”
9 participants responded to skipping meals with one participant commenting that:
“If we’ve just had breakfast, if you did get breakfast, then in the middle there’s no lunch. Then you have to wait until dinner.”
“We have meatless nights where we
don’t do the meat because the meat is the most expensive
thing in the world.”

36HuNger Free SuMMer HubS INIt IAtIve : A NeedS ASSeSSMeNt
63 participants responded to serving less nutritious foods, mainly starches, because they are less expensive and can provide more meals for a longer period of time (i.e., spaghetti). For example, one participant stated that:
“I mean, they are going to have to eat two starches just because the starchier food is the less expensive of the bunch. When the meat’s gone, I have to double up on something or whatnot. So we’ll have spaghetti or whatever or something that’s not their norm. Sometimes you have to double up on the starches, and that, you know, is really not healthy.”
Another participant further explained:
“Buying things that may be cheaper. Things that you get more quantity over quality rather than things that are more expensive and nutritious, like probably stuff that the kids can prepare themselves, which is mostly non-nutritious stuff, microwavable, processed, easy things.”
Figure 12. Focus Group Summertime Food Assistance MethodsWhen people are short on money and there isn’t enough food to go around, many participants offered up different types of places they have gone for food during the summer months (Figure 12). 59 participants responded to participating in food assistance programs while 20 participants responded to getting food from local food pantries. A participant discussed that:
“There’d be a week we’d be without food. We’d have to go find food banks, and we’d have to find all of the churches that were giving out food, but they limit you. If you’re getting help from one location, they’ll deny you help at another, but you’ve got a whole week you’re trying to feed your kids, and it makes that kind of hard.”
Figure 13. Focus Group Summer Feeding Program AwarenessFigure 13 shows focus group participants’ responses to their level of awareness of summer feeding programming available for their children within their communities during the summertime months when children are not in school (N=10 focus groups; ~66 participants). When participants were asked if they knew of locations within their community where their children could go to receive free meals during the summer, 26 participants responded to knowing of such locations. However, 40 participants responded to not knowing of any such locations, with one participant stating that:
“Until you came here today, I had no idea there was a summer feeding program available.”

37HuNger Free SuMMer HubS INIt IAtIve : A NeedS ASSeSSMeNt
Another participant explained that:
“There needs to be more information because a lot of people don’t know about it. I spend a lot of time trying to find places, but I don’t want to keep looking for something that I’m not seeing and wasting gas money at the same time.”
With this, 25 participants responded that their children within their household received free meals from locations in their community, and 41 participants responded that they would recommend these free meals for children to others within their community.
Participants were asked to think about their family and their interest level in a summer feeding program that would provide free meals for their children during the summer when their children are not in school. All 66 participants responded as being interested. Responses included that summer feeding would aid in summer costs, help provide their children with healthier meals (specifically, at the end of the month), and provide activities for children to keep them engaged and socialized. For example, a participant discussed that:
“That would be a place for them to go and be able to socialize amongst their peers and with other kids, and also they will get that meal, that nourishment. That gives them something to do during the summer as well as get that meal.”
Another participant explained that:
“In the summer it would be very beneficial. That’s five meals a week for the parent or that grandparent that they don’t have to worry about. I believe it would make a tremendous difference.”
Figure 14. Focus Group Desired Summer Feeding Service Program Services and IncentivesFigure 14 shows focus groups perspectives on what they would like to see as offerings, services, and/or incentives in order for their children to participate in summer feeding programming (N=10 focus groups; ~66 participants). Participants discussed what would be important for a program to have. 62 participants stressed the need for free transportation as many of these communities are rural in nature, with one participant explaining that:
“They go to the parks, but it’s just getting the kids to the park because I live out in the middle of nowhere. I don’t have time to take them into town and come back because it’s such a rural area. There’s no real central location.”

38HuNger Free SuMMer HubS INIt IAtIve : A NeedS ASSeSSMeNt
Another participant commented that:
“If you give transportation, they will come, and they will go.”
59 participants also stressed the need for a site location offering a summer feeding program to be a safe and secure location, specifically in regards to having enough staff on hand to watch all of the kids coming and going from a site. One participant expressed that:
“If you don’t have enough staff then how are you going to watch all of the kids? I mean, you can’t be there 24/7, but at least know exactly what’s going on, on your grounds. You know what I mean? Because even though it’s an open area, you’ve got to know who’s there and who’s coming in. That’s my biggest worry.”
57 participants would like to see education programs/activities to keep kids mindful of education during the summer months while not in school. A participant stated that:
“You don’t want them to just sit there and always be socializing and not still be getting what they need for school. A lot of the kids get out of the habit of school during the summer. Then, when they get back in school then they say, ‘This is new.’ So if you keep them motivated towards school, not fully but just a little bit, then they say, ‘Okay, this is what I did in school. I remember this.’”
49 participants mentioned sports/physical activities in order to keep their children engaged and stimulated throughout the summer while not in school to provide a source of exercise, with one participant commenting that:
“Because of obesity, if you could incorporate exercise that might help.”
Additionally, another participant said:
“I think they are just as bored as they are hungry some days. I think having some kind of sports would excite them and give them something teamwise to do during the summer.”

39HuNger Free SuMMer HubS INIt IAtIve : A NeedS ASSeSSMeNt
Figure 15. Focus Group Responses to Summer Feeding Service Program BarriersFigure 15 shows focus groups responses of summer feeding program barriers (real or potential) that may prevent children from participating (N=10 focus groups; ~66 participants). When participants were asked what would prevent them from allowing their children to participate in a SFSP the top barrier was identified as a lack of transportation by 62 participants. One participant explained that:
“It’s a wide area up here, and that’s why a lot of kids are at home during the summer because it’s too hard to get them to a place and back from a feeding program, especially if you’ve got parents that work.”
Another participant commented that:
“There has to be transportation. For them to walk in that heat through the street, no sidewalks most of the time, and the traffic lights that aren’t there, it’s dangerous, and it’s not safe for them to do so.”
An inconvenient timeframe during the day in which a summer feeding site may be open was noted by 59 participants as a barrier to participation mainly due to work schedules of parents, expressing the need for extended program hours throughout the day, with one participant explaining that:
“If it wasn’t somewhere that I could leave my son for the day, then he wouldn’t be able to participate. I can’t drop him off and have to turn around and pick him up in the afternoon during work hours.”
57 participants identified the barrier of a negative connotation and stigma associated with SFSP sites and a need for positive advertising for all kids so as not to identify kids in need. A participant expressed that:
“There’s a social stigma attached to it. Advertise in a way that doesn’t make it feel like a certain group is helped. You know, that it’s maybe something available to all, or something.”
With this, another participant commented that:
“When you’re telling your kid we’re going to the feeding the needy function, and he says that by accident, or says it in conversation with someone, you know, it’s a possibility that it’s going to have a negative comeback, and it’s not right, but it’s the way it is.”

40HuNger Free SuMMer HubS INIt IAtIve : A NeedS ASSeSSMeNt
Figure 16. Focus Group Perspectives on Summer Feeding Program Information SourcesFigure 16 shows focus group perspectives on where summer feeding program informational sources should be available for the public (N=10 focus groups; ~66 participants). When asked where they would like best to learn more about summer feeding programs in their area, the majority of focus group participants (63 participants) responded to some sort of communication from the schools of their children (i.e., flyer, email, phone call/text through school phone blasting system), with one participant stating that:
“I think the quickest way would be to have some sort of communication from my child’s school.”
61 participants suggested a local church or place of worship. A participant commented that:
“I think the local churches because that’s where most people around here go is church. Everybody is at church.”
40 participants also noted that having information at local DSS and WIC/SNAP offices would be highly beneficial, especially to new community members receiving assistance. One participant said that:
“Everyone round here needs some sort of assistance. New people coming in the community who need government assistance should be given the summer feeding information when in the local office. That would get the word out.”
31 participants recommended the local newspaper, specifically for those areas that are more rural where the local newspaper often serves as the main form of information sharing. For example, a participant said that:
“In our area of the county and since we are rural, our most central information source would be the newspapers. I think that would be the most effective way of advertisement in this area.”
Parent/Guardian SurveyParticipant characteristics are presented in Table 5. Included in this study were 317 participants, with 313 of these participants beingclassified as having “low food security” (n=89) or “very low food security” (n=224) for the summer months. The vast majority of respondents were women (85.2%) with 9.1% male, and 5.7% not indicating gender. This may be due to women being the primary family members attending LCFB collection events, or being in charge of family email accounts. Black (70.3%) and non-Hispanic (83.3%) were the dominant racial and

41HuNger Free SuMMer HubS INIt IAtIve : A NeedS ASSeSSMeNt
ethnic classifications indicated, with 25 participants not indicating their race or ethnicity. Furthermore, 8.8% indicated their ethnicity as not Hispanic, 18.6% reported their race as White, and 2.8% reported their race as either American Indian or Alaskan Native, or Native Hawaiian or Pacific Islander, which was collapsed into the “other” category. Nearly half of the participants (47.6%) reported working full-time, however 56.5% reported earning less than $1,600 per month before tax deductions. Part-time employment accounted for 12.9% of respondents, and “other” accounted for 36.3% which included those who indicated their employment status as disabled, homemaker, student, seeking employment, or some other employment status. Over half of participants (52.7%) resided in Charleston County, with 45.1% reporting residing in one of the other 9 Counties included. Urban was the primary housing designation, with 40.1% reporting an urban housing setting, 33.8% reporting a rural designation, and 23.7% indicating some other designation.
Frequencies, percentages, and Fisher’s Exact Test data for reported awareness of the Summer Feeding Program by summer food security category (low vs. very low) is presented in Figure 17. A Fisher’s Exact Test found no significant difference in awareness of places in the community that serve free meals between those in the “low security” category (41.9% indicating “yes”) compared to those in the “very low security” category (46.0% indicating “yes”), with the majority of respondents indicating that they were not aware of free meal locations. There was a significant difference in reported participation levels (p=.003) between those in the two categories, with those in the “very low security” category more likely to have received a free meal from a community location the past summer (27.2% vs. 45.2% indicating yes). Interest levels in a Summer Feeding Program also showed a significant difference (p=<.001). Those in the “very low security” indicated higher levels of interest (62.9% and 23.1%) than those in the “low security” category (33.3% and 23.0%).
Table 5. Parent/Guardian Survey Participant Characteristics (N = 317)Characteristic n (%)
Gender Male Female Missing
29 (9.1)
270 (85.2)18 (5.7)
Ethnicity Hispanic or Latino Not Hispanic or Latino Missing
28 (8.8)264 (83.3)
25 (7.9)Race Black White Other Missing
223 (70.3)60 (18.6)
9 (2.8)25 (7.9)
Employment Status Full-time Part-time Other Missing
151 (47.6)41 (12.9)
115 (36.3)10 (3.2)
Monthly Household Income Less than $1,600 Between $1,600 and $3,500 $3,500 or More Missing
179 (56.5)79 (24.9)43 (13.5)16 (5.0)
Household County Location Charleston Other Missing
167 (52.7)143 (45.1)
7 (2.2)Designation Urban Rural Other Missing
127 (40.1)107 (33.8)
75 (23.7)8 (2.5)
Summer Food Security Among Children High Food Security Low Food Security Very Low Food Security Missing
4 (1.3)89 (28.1)
224 (70.7)--

42HuNger Free SuMMer HubS INIt IAtIve : A NeedS ASSeSSMeNt
Figure 17. Summer Feeding Program Awareness and Interest by Summer Food Security Category (Low vs. Very Low)
*p-values were calculated with a Fisher Exact Test to determine if proportions for Low Food Security were different among Very Low Food Security proportions. A p-value of <.05 indicated statistical significance.
** The sample size was 310.
† The sample size was 291.
‡ The sample size was 308.
NO58.1%
YES41.9%
LOW SECURITY VERY LOW SECURITY
NO54%
YES46%
NO72.8%
YES27.2%
LOW SECURITY VERY LOW SECURITY
NO54.8%
YES45.2%
23%
33.3%
LOW SECURITY VERY LOW SECURITY
23.1% 62.9%
43.7% 14%
Very Interested
Interested
Neutral, Uninterested, or Very Uninterested
Participant or Child Received Free Meals from Community this Past Summer† (*p-value = .003)
Aware of Places in Community Where Free Meals are Served During the Summer**
Interest Level in a Summer Feeding Program‡ (*p-value = <.001)

43HuNger Free SuMMer HubS INIt IAtIve : A NeedS ASSeSSMeNt
Frequencies, percentages, and Fisher’s Exact Test data for desired Summer Feeing Program services, offerings, and incentives by summer food security category (low vs. very low) are presented in Figure 18. A significant difference (p=.02) was found between low vs. very low summer food security categories when asked if free transportation was a necessity for program involvement. For example, 76.7% of those in the “low security” category indicated that this was not a necessity; while also 63.9% of those in the “very low security” category indicated that this was also not a necessity. No significant difference was found between summer food security categories (low vs. very low) for other services or incentives, including recreational activities (51.2% vs. 44.4% indicating yes), educational activities (55.7% vs. 50.0% indicating yes), sports/physical activities (48.3% vs. 44.2% indicating yes), serving meals that the children are willing to eat (58.1% vs. 52.8% indicating yes), providing healthy, balanced meals (52.9% vs. 60.1% indicating yes), providing free meals (48.3% vs. 58.8% indicating yes), having a safe location (67.4% vs. 66.4% indicating yes), providing opportunities for children to socialize (49.4% vs. 50.5% indicating yes), or providing meals to adults. Of note, 67.4% of those in the “low security” category and 66.4% of those in the “very low security” category indicated that providing meals in a safe and secure location was a necessity. Providing meals to adults was indicated as not necessary by 69.4% and 68.7% of those in the “low security” and “very low security” categories, respectively.
Figure 18. Desired Summer Feeding Program Services, Offerings, and Incentives by Summer Food Category (Low vs. Very Low)
Free Transportation
Recreation Activities
Educational Activities
Sports/Physical Activities
Meals Child Willing To
Eat
Provide Healthy,
�Balanced Meals
Provide Meals At No Cost To All Children 18 and Under
Provide Meals At A Safe and Secure Location
Provide A Place For �Children To
Socialize
Provide Meals For Adults
YES23.3%
NO76.7%
YES36.1%
NO63.9%
YES51.2%
NO48.8%
YES44.4%
NO55.6%
YES55.7%
NO44.3%
YES50%
NO50%
YES48.3%
NO51.7%
YES44.2%
NO55.8%
YES58.1%
NO41.9%
YES52.8%
NO47.2%
YES52.9%
NO47.1%
YES60.1%
NO39.9%
YES48.3%
NO51.7%
YES58.8%
NO41.2%
YES67.4%
NO32.6%
YES66.4%
NO33.6%
YES49.4%
NO50.6%
YES50.5%
NO49.5%
YES30.6%
NO69.4%
YES31.3%
NO68.7%
* p-values were calculated with a Fisher Exact Test to determine if proportions for Low Food Security were different among Very Low Food Security proportions. A p-value of <.05 indicated statistical significance.** The sample size ranged from 300-305
(*p-value = .02)

44HuNger Free SuMMer HubS INIt IAtIve : A NeedS ASSeSSMeNt
Frequencies, percentages, and Fisher’s Exact Test results for Summer Feeding Program barriers by summer food security category (low vs. very low) are presented in Figure 19. A significant difference (p=.006) was found between low and very low summer food security categories reporting parental interest as a barrier for participation in Summer Feeing Programs. Parental interest in the SFSP can be seen as the desire of a parent of an eligible child to receive summer meals. Of note, 15.7% of those in the “low security” category reported parental interest as being a barrier for participation, while 5.8% of those in the “very low security” category reported parental interest as being a barrier for participation. A significant difference between categories was reported for the barrier of meals not being served in a convenient location (p=<.001). Moreover, 22.5% of “low security” respondents reported this to be a barrier, while 45.1% of “very low security” respondents considered non-convenient locations to be a barrier. A child not needing free meals was found to be a barrier with a significant difference in response proportions by those in low vs. very low food security categories (p=<.001). Additionally, 24.7% of those in the “low security” category indicated this as a barrier; while 8.5% of those in the “very low security” category indicated that their child not needing free summer meals was a barrier. Traveling to a Summer Feeding Program site was also found to be a barrier with a significant difference in response proportions
Figure 19. Summer Feeding Program Barriers by Summer Food Security Category (Low vs. Very Low)
* p-values were calculated with a Fisher Exact Test to determine if proportions for Low Food Security were different among Very Low Food Security proportions. A p-value of <.05 indicated statistical significance.** The parent of the child/children that is potentially eligible for Summer Feeding Program meals
I am not interested** Meals Are Not Served At A
Convenient Location†
I Do Not Feel The Location Is Saf e And Secure
I Am Not Familiar With The Staff Or Organization
My Child/Children Do Not Need Free Summer Meal s
My Children Are Not Interested
Travel To Summer Food P rogram Too Much Of A Hassle
We Do Not Get To Eat As A F amily
My Children Previously Participated And Were Unsatisfied
My Children Previously Participated And I was Unsatisfied
YES15.7%
NO84.3%
YES5.8%
NO92.4%
YES22.5%
NO77.5%
YES45%
NO54.9%
YES15.7%
NO84.3%
YES21%
NO79%
YES20.2%
NO79.8%
YES17%
NO83%
YES24.7%
NO75.3%
YES8.5%
NO91.5%
YES5.6%
NO94.4%
YES6.7%
NO93.3%
YES7.9%
NO92.1%
YES21.9%
NO78.1%
YES4.5%
NO95.5%
YES2.7%
NO97.3%
YES4.5%
NO95.5%
YES3.1%
NO96.5%
YES6.7%
NO93.3%
YES5.4%
NO94.6%
(*p-value = .006)
(*p-value = <.001)
(*p-value = <.001)
(*p-value = .002)

45HuNger Free SuMMer HubS INIt IAtIve : A NeedS ASSeSSMeNt
by those in low vs. very low food security categories (p=<.002). Almost 8% of those in the “low security” category indicated this as a barrier; while 21.9% of those in the “very low security” category indicated that traveling to a site was a barrier. No significant difference between low and very low summer food security categories was found for the barriers of not feeling safe and secure at site locations (15.7% vs. 21.0% indicating yes), not being familiar with the summer feeding staff or organization (20.2% vs. 17.0% indicating yes), children not being interested in free summer meals (5.6% vs. 6.7% indicating yes), not getting to eat as a family (4.5% vs. 2.7% indicating yes), children being unsatisfied with Summer Feeding Programs from a previous experience (4.5% vs. 3.1% indicating yes), or parents being unsatisfied with Summer Feeding Programs from a previous experience (6.7% vs. 5.4% indicating yes).
Frequencies, percentages, and Fisher’s Exact Test results for participants preferred Summer Feeding Program operations by summer food security category (low vs. very low) are presented in Figure 20. No significant difference was found for preferred days of operation, preferred hours of operation on weekdays, preferred hours of operation on weekend days, or necessary proximity of feeding site to participant between those in “low security” and “very low security” categories. Of note, 42.9% of “low security” respondents and 40.0% of “very low” respondents indicated that afternoon operational hours would be preferred on weekdays, as well as 46.5% and 41.8% indicating that the afternoon would be preferable on weekend days. An almost even split was seen in “very low security” respondents when indicating preferred days operation, with 45.9% preferring only weekdays, and 44.0% preferring weekdays and weekend days. 58.4% of “low security” respondents preferred weekday operational days, with 35.1% preferring weekday and weekend day operational days. 54.8% of “very low security” respondents would prefer to have a SFSP site within one mile, with 42.0% preferring to have a site between 1 and 10 miles away. Those in the “low security” category were more willing to have a site at a further distance, with 44.2% indicating a distance of 1 mile and 50.6% indicating a distance of 1-10 miles as a necessary distance for participation.
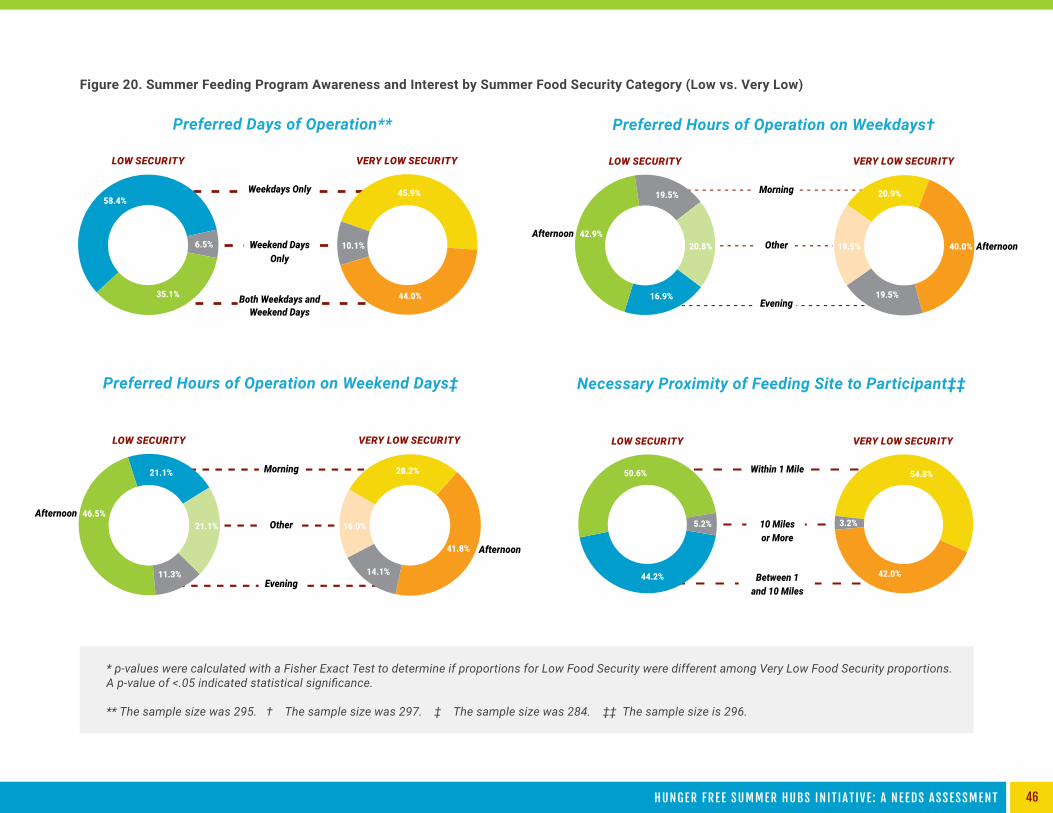
46HuNger Free SuMMer HubS INIt IAtIve : A NeedS ASSeSSMeNt
* p-values were calculated with a Fisher Exact Test to determine if proportions for Low Food Security were different among Very Low Food Security proportions. A p-value of <.05 indicated statistical significance.
** The sample size was 295. † The sample size was 297. ‡ The sample size was 284. ‡‡ The sample size is 296.
Figure 20. Summer Feeding Program Awareness and Interest by Summer Food Security Category (Low vs. Very Low)
Preferred Hours of Operation on Weekdays†Preferred Days of Operation**
Necessary Proximity of Feeding Site to Participant‡‡Preferred Hours of Operation on Weekend Days‡
6.5%
35.1%
LOW SECURITY VERY LOW SECURITY
10.1%
44.0%
58.4%45.9%Weekdays Only
Weekend Days Only
Both Weekdays and Weekend Days
5.2%
44.2%
LOW SECURITY VERY LOW SECURITY
3.2%
42.0%
50.6% 54.8%Within 1 Mile
10 Miles or More
Between 1 and 10 Miles
21.1%
11.3%
LOW SECURITY VERY LOW SECURITY
14.1%
16.0%
21.1%
41.8%
Morning
Other
Evening
46.5%
28.2%
Afternoon
Afternoon
20.8%
16.9%
LOW SECURITY VERY LOW SECURITY
19.5%
19.5%
19.5%
40.0%
Morning
Other
Evening
42.9%
20.9%
AfternoonAfternoon

47HuNger Free SuMMer HubS INIt IAtIve : A NeedS ASSeSSMeNt
Frequencies, percentages, and Fisher’s Exact Test results for participants preferred Summer Feeding Program information source locations by summer food security category (low vs. very low) are presented in Figure 21. A significant difference in response proportions between “low security” and “very low security” categories was found for a church or place of worship being a preferred location for Summer Feeding Program information distribution (p=.022). Of note, 41.6% of “low security” respondents indicated yes vs. 54.9% of “very low security” respondents indicating yes. A significant difference in response proportions between “low security” and “very low security” categories was found for a local recreation center/pool being a preferred location for Summer Feeding Program information distribution (p=.05). Moreover, 10.1% of “low security” respondents indicated yes vs. 18.3% of “very low security” respondents indicating yes. A significant difference in response proportions between “low security” and “very low security” categories was found for a community meeting being a preferred location for Summer Feeding Program information distribution (p=.017). 28.1% of “low security” respondents indicated yes vs. 16.5% of “very low security” respondents indicating yes. There was no significant difference between low vs. very low summer food security categories for preferred locations of Summer Feeding Program information distribution for the child’s school (64.0% vs. 71.4% indicating yes), online/website
Figure 21. Summer Feeding Program Information Sources (Where) by Summer Food Security Category (Low vs. Very Low)
* p-values were calculated with a Fisher Exact Test to determine if proportions for Low Food Security were different among Very Low Food Security proportions. A p-value of <.05 indicated statistical significance.
My Child’s School
Online/Website
A Church or Place of Worship
A Local Library
WIC/SNAP Offices
Local Community Center
Local Recreation Center/Pool
Social Services Offices
Food Pantries/Food Banks/Soup Kitchens
Community Meetings
On Public Transportation
Local Business
Other
YES64.0%
NO36.0%
YES36.1%
NO28.6%
YES41.6%
NO58.4%
YES33.5%
NO66.5%
YES41.6%
NO58.4%
YES54.9%
NO45.1%
YES24.7%
NO75.3%
YES44.2%
NO69.6%
YES22.5%
NO77.5%
YES28.1%
NO71.9%
YES21.3%
NO78.7%
YES30.4%
NO69.6%
YES10.1%
NO89.9%
YES18.3%
NO81.7%
YES19.1%
NO80.9%
YES16.5%
NO83.5%
YES21.3%
NO78.7%
YES26.8%
NO73.2%
YES28.1%
NO71.9%
YES16.5%
NO83.5%
YES7.9%
NO92.1%
YES9.4%
NO90.6%
YES11.2%
NO88.8%
YES9.4%
NO90.6%
YES4.5%
NO95.5%
YES4.9%
NO95.1%
(*p-value = .022)
(*p-value = .05)
(*p-value = .017)

48HuNger Free SuMMer HubS INIt IAtIve : A NeedS ASSeSSMeNt
(41.6% vs. 33.5% indicating yes), a local library (24.7% vs. 30.4% indicating yes), WIC/SNAP offices (22.5% vs. 28.1% indicating yes), local community centers (21.3% vs. 30.4% indicating yes), social services offices (19.1% vs. 16.5% indicating yes), food pantries/food banks/soup kitchens (21.3% vs. 26.8% indicating yes), public transportation (7.9% vs. 9.4% indicating yes), local businesses (11.2% vs. 9.4% indicating yes), or some other location (4.5% vs. 4.9% indicating yes).
Frequencies, percentages, and Fisher’s Exact Test results for participants preferred Summer Feeding Program information source forms by summer food security category (low vs. very low) are presented in Figure 22. No significant difference was found between preferred forms of Summer Feeding Program information by summer food security category (low vs. very low) for the following forms: mail (50.6% vs. 58.0% indicating yes), flyers (48.3% vs. 57.6% indicating yes), online/websites (37.1% vs. 33.0% indicating yes), email (31.5% vs. 36.6% indicating yes), community newspapers (32.6% vs. 35.7% indicating yes), local news (27.0% vs. 33.0% indicating yes), television (28.1% 32.1% indicating yes), radio (28.1% vs. 29.9% indicating yes), billboards (16.9% vs. 12.5% indicating yes), phone call (10.1% vs. 26.8% indicating yes), advertising on public transportation (11.2% vs. 9.8% indicating yes), text message (20.2% vs. 26.3% indicating yes), home visit (6.7% vs. 7.6% indicating yes), or some other form (6.7% vs. 3.1%).
Figure 22. Summer Feeding Program Information Sources (How) by Summer Food Security Category (Low vs. Very Low)
* p-values were calculated with a Fisher Exact Test to determine if proportions for Low Food Security were different among Very Low Food Security proportions. A p-value of <.05 indicated statistical significance.
In the Mai l
Flyers
Online/Website
Community Newspaper
Local News
Television
Radio
Billboards
Phone Call
Ads on Public Transportation
Text Message
Home Visit
Other
YES50.6%
NO49.4%
YES58.0%
NO42.0%
YES48.3%
NO51.6%
YES57.6%
NO42.4%
YES37.1%
NO62.9%
YES33.0%
NO67.0%
YES31.5%
NO68.5%
YES36.6%
NO63.4%
YES32.6%
NO67.4%
YES35.7%
NO64.3%
YES27.0%
NO73.0%
YES33.0%
NO67.0%
YES10.1%
NO89.9%
YES32.1%
NO67.9%
YES28.1%
NO71.9%
YES29.9%
NO70.1%
YES28.1%
NO71.9%
YES12.5%
NO87.5%
YES10.1%
NO89.9%
YES26.8%
NO73.2%
YES11.2.%
NO88.8%
YES9.8%
NO90.2%
YES20.2%
NO79.8%
YES26.3%
NO73.7%
YES6.7%
NO93.3%
YES7.6%
NO92.4%
YES6.7%
NO93.3%
YES3.1%
NO96.9%

49HuNger Free SuMMer HubS INIt IAtIve : A NeedS ASSeSSMeNt
discussionThe primary purpose of this project was to conduct a feasibility study to better determine recommendations for increased summer feeding service program participation in the Lowcountry Food Bank’s service area, which includes the following ten coastal counties: Beaufort, Berkeley, Charleston, Colleton, Dorchester, Georgetown, Hampton, Horry, Jasper, and Williamsburg. Key findings and their implications are discussed below.
MAIN BARRIERS TO CHILD PARTICIPATION
TransportationTransportation was overwhelmingly identified by both key informants and focus group participants as the number one barrier to child participation in summer feeding programming. Although the parent/guardian survey did not reveal transportation as the number one barrier among respondents, despite a similar study in the South Carolina Midlands entitled the Midlands Family Study reporting transportation as a primary barrier to participation in SFSP, it is important to note that “low security” survey respondents indicated SFSP sites not being at a convenient location as a number two barrier. Furthermore, “very low security” respondents indicated a lack of a convenient location and travel to a SFSP site as too much of a hassle as number one and number two barriers, respectively. Although, more “very low security” survey respondents reported transportation to a SFSP site to be a necessary service for program participation. This clearly indicates a relationship with transportation being a barrier to survey respondents as well. Transportation may not have been cited as a high priority or barrier to survey respondents because of the high level of participants who lived in urban areas, specifically Charleston County where public transportation is available. However, key informants and focus group participants identified transportation as a main barrier and more accurately represented a majority of the counties in the LCFB’s service area, including four rural counties where public transportation is not available.
Lack of AwarenessLack of awareness was also identified as a common main barrier among key informants, focus group participants, and survey respondents. Interestingly, less than one-third of focus group participants were aware of the SFSP, and more than half of the survey respondents from both “low security” and “very low security” categories were unaware of SFSP sites. This mirrors results of the Midlands Family Study where 56% of caregivers who were not participating in the SFSP had not heard of the program, and 25% were not aware of a site near them. With this, almost all focus group participants and survey respondents from the “very low security” category who responded with awareness indicated that their children received these free meals. However, less than half of those survey respondents from the “low security” category who indicated awareness noted that their children received these free meals. In addition, although less than half of the focus group participants indicated any level of food insecurity, it is important to note that 100% of the participants expressed interest in the SFSP. Furthermore, of those survey respondents in the “very low security” category almost two-thirds expressed an interest level of “very interested” while only approximately one-

50HuNger Free SuMMer HubS INIt IAtIve : A NeedS ASSeSSMeNt
third of those in the “low security” category indicated a “very interested” level. This may be due to the fact that those respondents in the “low security” category also identified the number one barrier to child participation as their child not needing SFSP meals. These results indicate that those experiencing high levels of summer food insecurity were more interested in the SFSP and more likely to have participated.
Inconvenient Site OperationsSFSP site hours of operation and locations are interconnected and were revealed as barriers to child participation by both key informants (time of day rated as fifth) and focus group participants (inconvenient time frame rated as second) and indirectly by survey respondents as “low security” respondents indicated that a SFSP site not being at a convenient location serves as a number two barrier while “very low security” survey respondents indicated lack of a convenient location and travel to a SFSP site is too much of a hassle as number one and two barriers, respectively. Interestingly, this ties in with survey respondent results from both security categories of which both clearly preferred SFSP hours of operation to be in the afternoon on both weekdays and weekends. The “very low security” respondents strongly indicated a need for weekdays and weekend operations. With this, both key informants and focus group participants stressed the fact that during the summertime kids do not want to get up and get out early in the morning. Furthermore, over half of survey respondents in the “very low security” category indicated a SFSP site must be within 1 mile of their household or place of employment while just over half of those in the “low security” category indicated that a site must be between 1 and 10 miles with a site being within 1 mile coming in at a strong second. These findings clearly support transportation being a main barrier to child participation in summer feeding programming.
Negative Association/Stigma Both key informants and focus group participants identified the issue of a negative association/stigma attached to SFSP, ranked at number five and number three, respectively. Although “stigma” was not clearly measurable in the survey, it is important to note that survey respondents within the “low security” category indicated their number one barrier to be their child not needing free summer meals while this barrier ranked as the fifth barrier for those in the “very low security” category, indicating that reducing or eliminating stigma associated with SFSP should be a top priority. Findings also indicate those in the “low security” category may not participate as much as those in the “very low security” category.

51HuNger Free SuMMer HubS INIt IAtIve : A NeedS ASSeSSMeNt
MAIN PROGRAM NEEDS
Safe and Secure LocationsSurvey respondents in both low and very low food security categories overwhelmingly indicated the need for an SFSP site to be provided at a safe and secure location for their children to participate. With this, the majority of focus group participants indicated this as the second most important program provision. Interestingly, survey respondents in both low and very low food security categories indicated not being familiar with the staff or feeling like the SFSP site is safe and secure as top barriers to allowing their children to participate. These findings again mirror the Midlands Family Study where 42% of SFSP participants found out about the program through friends or family. With the closeness of the Midlands to the 10 counties in the LCFB’s service area, it is very likely that parents and guardians strongly need an overall sense of safety and security at SFSP sites in order for their children to participate.
Quality of FoodQuality of food was also identified as common program need among key informants and survey respondents. Key informants stressed the need for more kid friendly, healthy menus along with alternating hot and cold meal cycles, noting that sponsors who do have more inviting meals for kids are those who seem to be more successful in participation rates. These findings align with survey respondents rating strongly the need for SFSP sites to provide healthy, balanced meals that their children are willing to eat.
ActivitiesProviding educational/enrichment activities in addition to recreational activities was also identified as a SFSP program need by key informants, focus group participants, and survey respondents. Key informants stressed the need to provide activities to get kids excited and actively engaged to leave their homes, especially in the summer months when temperatures are high. Of note, survey respondents in the “low security” category indicated a higher need for activities than those in the “very low security” category; indicating that having a meal for the children is more important than having entertainment.
Increased Outreach and EducationIncreased outreach and education about summer feeding programming is critical to the SFSP’s success. The most preferred methods for learning

52HuNger Free SuMMer HubS INIt IAtIve : A NeedS ASSeSSMeNt
about the SFSP were overwhelmingly indicated as some form of communication from schools and churches or places of worship. Additionally, parents and guardians would most like to receive this information in a tangible manner, specifically in the mail or flyers. However, it is important to note that electronic communication, such as a website or an email, was also rated as being a preferred method. Furthermore, of interest is that almost half of focus group participants noted the local newspaper as a central information location, particularly in rural areas. Key informants also stressed the need for partnering with community groups and local officials. The most beneficial ways in which to promote SFSP is not only to get local partners educated on what SFSP does for their communities, but also to get them involved by potentially sponsoring activities and seminars.
MAIN BARRIERS TO SERVICEKey informants indicated several barriers to operating and managing a SFSP, which included: transportation of children to and from sites as well as meal deliveries to sites, lack of knowledge and training for sponsors and staff, administrative burdens mainly due to the load of paperwork, financial stability in light of start-up fund costs in addition to food costs, proper facilities and equipment, such as vans/trucks/buses, storage space, and cambros, and food costs and menu planning in regards to SFSP food/menu regulations. These barriers echo a National Food Service Management Institute (NFSMI) study conducted in 2005 on sponsor participation barriers in the southeastern United States where several similar barriers were identified.
Conclusions and recommendations
GENERAL CONCLuSIONS AND RECOMMENDATIONSIn line with similar studies, transportation remains a main barrier to child participation, program utilization, and sponsorship participation. To increase participation, deliver food to children (i.e., healthy, prepared frozen meals that just need to be reheated along with breakfast items and fresh fruits and veggies). This could be done via mail delivery partnership (i.e., Blue Apron, Hello Fresh) or via a refrigerated or dry ice packed truck. The money that is allocated for “extra services” at pick-up sites could be reallocated to cover the costs associated with shipping food to households with children.
Furthermore, a severe lack of awareness of the SFSP also remains a barrier. The USDA provides a number of promotional newsletters, flyers, and other media sources25 that could be used in combination with local site promotion to increase SFSP utilization. To maximize the effectiveness of this information, it is recommended that distribution occur in preferred formats and locations (i.e., hard-copy newsletters/flyers distributed through schools and churches).
Moreover, because survey respondents in the “very low security” category indicated the highest level of interest and participation in SFSP, it would be advisable to focus efforts on the very low food secure population. This can be done by distributing more information through

53HuNger Free SuMMer HubS INIt IAtIve : A NeedS ASSeSSMeNt
schools and churches, and setting up feeding sites in areas with high food insecurity rates in particular. All survey respondents indicated the importance of summer meals being healthy, balanced, and served in safe locations. To increase participation, it is important that parents know that the meals served by the SFSP are healthy and served in a secure location. In areas where security is an issue, sites may adopt a restricted site policy, or relocate the site to a more protected location. With this, change the name of the summer feeding program to eliminate the stigma associated with getting free food and advertise through the local newspaper, schools, and churches. Create a hard-copy form that parents can complete to register in addition to a website with online registration
Additionally, more resources need to be offered and made available to SFSP sponsors and site staff, specifically in regards to transportation and training. Grants are available to programs to transport children to sites, however, many key informants mentioned the burden of liability involved. Because start-up costs can often be a deterrent, helping sponsors identify funding opportunities may aid in continued participation. Furthermore, more in-depth training on the time commitment, costs, and issues in which previous sponsors have experienced to new sponsors expressing interest in participating may prevent sponsorship fall out. Lastly, to alleviate the headaches and time consumption of burdensome paperwork, the Simplified Summer Food Program and Seamless Summer Waiver should be presented as an option for sponsors.
RuRAL AREASRural sites face unique challenges for utilization of the SFSP. The spread of children throughout rural areas causes many barriers to rural sites in particular. With 33% of participants residing in rural areas, recommendations for rural areas must be considered. Mobile sites were seen as cost inefficient and ineffective, but with much research pointing to the necessity of mobile sites, especially in rural areas, new models have been implemented. Urban areas may benefit from a mobile SFSP site if safety and violence inhibit a more permanent site location. Mobile sites such as outfitted school busses have been proven successful SFSP sites, with examples and step-by-step guides on implementation given by the USDA. One such example is the Alabama mobile site Superfood Express, which served over 98,000 meals to children in 201426. Mobile sites may be a viable option for rural areas or areas lacking proper feeding site locations. LIMITATIONS TO THE fEASIBILITY STuDYThis study contained a few limitations. Key informants from Charleston, Colleton, Hampton, and Williamsburg were not interviewed and therefore only 6 of the 10 counties were represented. Focus group screener surveys were not used in the form originally intended to screen and choose participants based on food insecurity due to the lack of online survey participation, leaving a reliance of focus group participant recruitment upon several key informant interviewees and other willing partners. Therefore, there were more food secure focus group participants than ideal. Additionally, original methods of administering the parent/guardian survey online failed, and because the survey was sent to people who were on the Lowcountry Food Bank email lists and paper surveys were completed at Lowcountry Food Bank collection events, survey respondents were not a random sample of the population and reflected views from Charleston, Beaufort, and Dorchester Counties in particular.

54HuNger Free SuMMer HubS INIt IAtIve : A NeedS ASSeSSMeNt
references 1. The Economics of Food Insecurity in the United States Appl. Econ. Perspect. Pol. (Autumn 2011) 33 (3): 281-303 first published online August 11, 2011 doi:10.1093
2. Coleman-Jensen, A., Rabbitt, M. P., Gregory, C., & Singh, A. (2015). Economic Research Service. Household food security in the United States in 2014. Washington, D.C.: U.S. Dept. of Agriculture.
3. Food Security in the U.S.: Definitions of Food Security. (n.d.). Retrieved May 01, 2016, from http://www.ers.usda.gov/topics/food-nutrition-assistance/food-security-in-the-us/definitions-of-food-security.aspx
4. The Economics of Food Insecurity in the United States Appl. Econ. Perspect. Pol. (Autumn 2011) 33 (3): 281-303 first published online August 11, 2011 doi:10.1093
5. USA, Food and Nutrition Service. (2016). The Summer Food Service Program (SFSP) 2016 Administrative Guidance for Sponsors. Washington, D.C.: U.S. Dept. of Agriculture.
6. Food and Nutrition Service. (2016). Fiscal Numbers of Peak (July) Meals. Washington, D.C.: U.S. Dept. of Agriculture.
7. USA, Food and Nutrition Service. (2016). The Summer Food Service Program (SFSP) 2016 Administrative Guidance for Sponsors. Washington, D.C.: U.S. Dept. of Agriculture.
8. USA, Food and Nutrition Service, U.S. Department of Agriculture. (2016). Federal Register (8th ed., Vol. 81). Washington, D.C.: Office of the Federal Register, National Archives and Records Administration.
9. USA, Food and Nutrition Service. (2016). The Summer Food Service Program (SFSP) 2016 Administrative Guidance for Sponsors. Washington, D.C.: U.S. Dept. of Agriculture.
10. USA, Food and Nutrition Service. (2015). 2015-2016 Income Eligibility Guidelines. Washington, D.C.: U.S. Dept. of Agriculture.
11. Hunger Doesn’t Take A Vacation: Summer Nutrition Status Report (Rep.). (2015). Retrieved from http://frac.org/pdf/2015_summer_nutrition_report.pdf
12. Hunger Doesn’t Take A Vacation: Summer Nutrition Status Report (Rep.). (2015). Retrieved from http://frac.org/pdf/2015_summer_nutrition_report.pdf
13. U.S. Department of Agriculture (2016). Summer Food Service Program (SFSP) Summer Meal Expansion. Retrieved from http://www.fns.usda.gov/sfsp/summer-meal-expansion

55HuNger Free SuMMer HubS INIt IAtIve : A NeedS ASSeSSMeNt
14. Wauchope, B., & Stracuzzi, N. (2010). Challenges in serving rural american Children through the summer Food service Program (Issue brief No. 13). Durham, NH: Carsey Institute.
15. U.S. Census Bureau. (2010). 2010 Census Urban and Rural Classification. Retrieved from https://www.census.gov/geo/reference/ua/urban-rural-2010.html
16. Coleman-Jensen, A., Rabbitt, M. P., Gregory, C., & Singh, A. (2015). Economic Research Service. Household food security in the United States in 2014. Washington, D.C.: U.S. Dept. of Agriculture.
17. U.S. Census Bureau. (2010). 2010 Census Urban and Rural Classification. Retrieved from https://www.census.gov/geo/reference/ua/urban-rural-2010.html
18. Gundersen, A. Dewey, A. Crumbaugh, M. Kato, E. Englehard. (2016). Mind the Meal Gap 2016: Food Insecurity and Child Food Insecurity Estimates at the County Level. Feeding America.
19. U.S. Census Bureau. (2014). Population Income by County. Retrieved from http://www.census.gov/quickfacts/table/PST045215/00,45,45019
20. Hunger Free Summer Hubs Initiative Geographic Area [GIS]. (2016).
21. Economic Research Service. (2012). U.S. Household Food Security Survey Module: Three-Stage Design, With Screeners. Washington, D.C.: U.S. Dept. of Agriculture.
22. Cost of Living Index (Rep.). (2015). Retrieved May 1, 2016, from Council for Community and Economic Research website: https://www.coli.org/
23. Draper, C., & Jones, S. (2014). Summer Feeding Program Utilization in the Midlands of South Carolina (Report brief). Columbia, SC: University of South Carolina.
24. Draper, C., & Jones, S. (2014). Summer Feeding Program Utilization in the Midlands of South Carolina (Report brief). Columbia, SC: University of South Carolina.
25. USDA Summer Food Service Program Summer Meals Toolkit. (2016, March 24). Retrieved May 1, 2016, from http://www.fns.usda.gov/sfsp/summer-meals-toolkit
26. USA, Food and Nutrition Service. (n.d.). Mobile Feeding Model. Washington, D.C.: U.S. Dept. of Agriculture
27. Molaison, E. F., & Carr, D.H. (2005). Overcoming Barriers to Participation in the Summer Food Service Program – An Identification of Best Practice Solutions. National Food Service Management Institute, The University of Mississippi.

Appendices

57HuNger Free SuMMer HubS INIt IAtIve : A NeedS ASSeSSMeNt
Appendix A – Key Informant Letter[DATE]
[PROJECT MANAGER NAME][TITLE]The Lowcountry Food Bank2864 Azalea DriveNorth Charleston, SC 29405
Dear Mr. /Ms. [NAME]:
Although 21 million children receive free and reduced price school meals during the academic year, only 3 million actually participate in the USDA’s Summer Food Service Program (SFSP) – which means that only one in seven eligible children access these available meals during the summer. We believe there is an unmet need, but it is complex and not fully understood.
The Lowcountry Food Bank believes that ongoing, focused and coordinated community-wide efforts can support increased access to meals for children and their families over the summer months. In order to attempt to understand this complex issue, the Lowcountry Food Bank has been awarded a grant opportunity, the Hunger-Free Summer Hubs initiative through Feeding America, to evaluate the summer feeding landscape in our service area, strengthen community-based partnerships and ultimately work to increase access to meals for households with children over the summer months.
More specifically, the Hunger-Free Summer Hubs initiative aims to answer the following question: • How can food banks strategically partner, over a 3-year period and beyond, with organizations within their community to:
Increase access to meals for children and their families during the summer months? • Increase participation by eligible children in SFSP programming?
Three key objectives of this grant opportunity are to: 1) conduct a formal community needs assessment, 2) collaborate with our local community partners and 3) strategically develop innovative approaches to summer programming or modify existing programs, based on evidence collected from ongoing research and program evaluation during this initiative.

58HuNger Free SuMMer HubS INIt IAtIve : A NeedS ASSeSSMeNt
The Lowcountry Food Bank considers you a key stakeholder and valuable partner in [INSERT NAME OF COUNTY OR SERVICE AREA]. Members of the Lowcountry Food Bank will be in touch throughout the year to discuss the issue of summer hunger, as well as talk through existing and potential interventions in our community. This project will entail a cross-site evaluation component, which will be conducted by Dr. Barbara Fiese and Brenda Koester, researchers from the Family Resiliency Center (FRC) at the University of Illinois Urbana Champaign as well as a community needs assessment conducted by Elizabeth Symon.
We look forward to connecting and collaborating with you over the coming year, and beyond, as we embark on this Hunger Free Summer Hub initiative. Thank you for your consideration in partnering for the Hunger Free Summer Hubs project to expand access and increase participation in summer meals.
Sincerely,
[PROJECT MANAGER NAME]Lowcountry Food Bank

59HuNger Free SuMMer HubS INIt IAtIve : A NeedS ASSeSSMeNt
Appendix b – Key Informant Interview guides
College of Charlestonkey Informant Interview
CONSENT TO PARTICIPATE IN RESEARCH (ADuLT fORM)
You are invited to participate in a research study. This research, to be conducted by Elizabeth Symon, Program Manager, Public Health Initiatives with the College of Charleston, is designed to increase the awareness, interest, and participation in child summer food service programming within the Lowcountry Food Bank’s 10 coastal county service area.
Participation in this study will require between 30-45 minutes of your time. As a participant in this research, you will be asked questions during a structured interview regarding summer feeding service program participation, program needs, program barriers, etc.
This discussion will be audio-recorded. Data collected from you will remain anonymous, Audio-recordings will be kept in a secure location for a period of 3 years after the project completion date of May 15th, 2015.
Although you will not benefit directly from this study, this research is expected to benefit Lowcountry Food Bank service area residents by increasing participation in child summer feeding service programs. I know of no risk or discomfort associated with this research. Your participation is completely voluntary and you may discontinue participation at any time.
If you have any questions concerning this research study please contact Elizabeth Symon, at [email protected]. You may also contact Research Protections & Compliance on the Office of Research and Grants Administration, at 843-953-7421 or e-mail [email protected] if you have questions or concerns about research review at the College of Charleston or your rights as a research participant. You will be given a copy of this form to keep.
This research has been reviewed by the Human Research Protections Program at the College of Charleston.
I have read this consent form, and I agree to participate in this research study. ________________________________________________________________________Printed Name of Participant ________________________________________________________________________Signature of Participant Date ________________________________________ ________________Signature of Person Obtaining Consent Date

60HuNger Free SuMMer HubS INIt IAtIve : A NeedS ASSeSSMeNt
Hunger free Summer Hubs InitiativePotential Partner Interview Survey
School District Representative
Interviewer: _____________________________________________________________
Interviewee(s): ___________________________________________________________
Location: ________________________________________________________________
County: _________________________________________________________________
Date: ___________________________________________________________________
1. How familiar are you with child summer feeding service programs?
Probe: Level of familiarity What information is known of SFSP
2. Currently, what child summer feeding service programs exist in your district?1
Probe: Locations Number of sites Days/times available
3. In your opinion, would child summer feeding service programs benefit students in your district?12
Probe: How it would benefit Why it would benefit
1 USDA, “Evaluation of the Summer Food Service Program Enhancement Demonstrations: 2012 Demonstration Evaluation Report,” 20122 FRAC, “State Agency Summer Nutrition Sponsor Retention Strategies”

61HuNger Free SuMMer HubS INIt IAtIve : A NeedS ASSeSSMeNt
4. What have been past efforts in your district in participating in child summer feeding service program/s? Have you partnered (or are you partnering) with any organizations or agencies? Is this a change since last summer?3
Probe: Organizations/agencies Role – developing proposal, outreach for sponsors and sites, funding
5. What do you see as potential barriers or challenges for your district in participating and partnering with agencies in summer feeding service programs?123
Probe: Communication with partners Partner issues Funding
6. Based on your experience, what do you think is the biggest challenge for a school district sponsor in starting a summer food service program?3
Probe: Logistics – who, what, where, when, how Funding – Start up costs
7. Ideally, what resources would a sponsor need to start a program in a district where summer feeding has never been offered?3
Probe: Volunteers Funding – Start up and continued Administrative and Technical Assistance
3NFSMI, “Overcoming Barriers to Participation in the Summer Food Service Program – An Identification of Best Practice Solutions,” 2005

62HuNger Free SuMMer HubS INIt IAtIve : A NeedS ASSeSSMeNt
Hunger free Summer Hubs InitiativePotential Partner Interview Survey
District County Representative
Interviewer: _____________________________________________________________
Interviewee(s): ___________________________________________________________
Location: ________________________________________________________________
County: _________________________________________________________________
Date: ___________________________________________________________________
1. How familiar are you with child summer feeding service programs?1
Probe: Level of familiarity What information is known of SFSP
2. Currently, what child summer feeding service programs exist in your county?12
Probe: Locations Number of sites Days/times available
3. In your opinion, would child summer feeding service programs benefit students in your county?3
Probe: How it would benefit Why it would benefit

63HuNger Free SuMMer HubS INIt IAtIve : A NeedS ASSeSSMeNt
4. What have been past efforts in your county in participating in child summer feeding service program/s? Have you partnered (or are you partnering) with any organizations or agencies? Is this a change since last summer?123
Probe: Organizations/agencies Role – developing proposal, outreach for sponsors and sites, funding
5. What do you see as potential barriers or challenges for your county in participating and partnering with agencies in summer feeding service programs?123
Probe: Communication with partners Partner issues Funding
6. Based on your experience, what do you think is the biggest challenge for a school district sponsor in starting a summer food service program?3
Probe: Logistics – who, what, where, when, how Funding – Start up costs
7. Ideally, what resources would a sponsor need to start a program in a district where summer feeding has never been offered?3
Probe: Volunteers Funding – Start up and continued Administrative and Technical Assistance

64HuNger Free SuMMer HubS INIt IAtIve : A NeedS ASSeSSMeNt
Hunger free Summer Hubs InitiativePartner/Sponsor Interview Survey
Currently Participating
Interviewer: _____________________________________________________________
Interviewee(s): ___________________________________________________________
Location: ________________________________________________________________
County: _________________________________________________________________
Date: ___________________________________________________________________
1. Currently, what child summer feeding service programs exist in your district?1
Probe: Locations Number of sites Days/times available
2. In your opinion, would additional child summer feeding service programs benefit students in your district?12
Probe: How it would benefit Why it would benefit
3. What have been past efforts in your district in participating in child summer feeding service program/s? Have you partnered (or are you partnering) with any organizations or agencies? Is this a change since last summer?3
Probe: Organizations/agencies Role – developing proposal, outreach for sponsors and sites, funding

65HuNger Free SuMMer HubS INIt IAtIve : A NeedS ASSeSSMeNt
4. What do you see as potential barriers or challenges for your district in participating and partnering with agencies in summer feeding service programs?123
Probe: Communication with partners Partner issues Funding
5. Based on your experience, what do you think is the biggest challenge for a school district sponsor in starting a summer food service program?123
Probe: Logistics – who, what, where, when, how Funding – Start up costs
6. Ideally, what resources would a sponsor need to start a program in a district where summer feeding has never been offered?3
Probe: Volunteers Funding – Start up and continued Administrative and Technical Assistance
7. Do you plan on sponsoring/partnering again next summer?2
8. Will you add more sites?2
9. Would you like help identifying additional sites?2
10. From your experience, where could you use additional support to increase the number of children who attend SFSP?2

66HuNger Free SuMMer HubS INIt IAtIve : A NeedS ASSeSSMeNt
Appendix C – Newsletter

67HuNger Free SuMMer HubS INIt IAtIve : A NeedS ASSeSSMeNt
Appendix d – School Principal Letter[School Letterhead]
College of CharlestonSchool Principle Letter of Cooperation
APPROVAL TO PARTICIPATE IN RESEARCH
[DATE]
Elizabeth B. SymonProgram Manager, Public Health InitiativesThe College of CharlestonThe Mayor Joseph P. Riley Center for Livable Communities66 George StreetCharleston, SC 29424P: 843-324-1043E: [email protected]
Dear Ms. Symon,
I am writing to support the College of Charleston’s participation in the Lowcountry Food Bank’s Hunger Free Summer Hubs Initiative. As the head of [SCHOOL NAME], I fully support your efforts in collaboration with the Lowcountry Food Bank in aiming to fight against summertime child hunger in our area. This Hunger Free Summer Hubs Initiative presents opportunities to utilize already existing food assistance programs within our schools, such as BackPack Buddies and School Pantry programs, in order to identify ways in which more children can be served during summer months when kids are not in school and unable to take advantage of school year food assistance services.
I look forward to our working partnership, as I believe that is through this partnership that we will be able to create and sustain a positive aim at ending childhood summertime hunger.
Sincerely,_____________________________________[School Principal Signature][TYPE SCHOOL PRINCIPAL NAME], Principal

68HuNger Free SuMMer HubS INIt IAtIve : A NeedS ASSeSSMeNt
Appendix e – Parent/guardian SurveyQ1 Agreement to Participate in Research You are invited to participate in this research survey because you are a part of the Lowcountry Food Bank’s 10 coastal county service area. (You must be of 18 years or older to participate). The purpose of this research is to collect data on the level of awareness, interest, and need of summer feeding program opportunities in your area. We expect that this survey will take about 20 minutes to complete. Your responses will not affect your benefits or your child’s benefits at school. In order to be entered into a $25 online Amazon gift card raffle, you must complete each question. One winner will be chosen randomly for each participating county. Participation is entirely voluntary, and you may withdraw at any time. Completion of the survey constitutes your consent to participate in this research. All data obtained will be anonymous. We ask that you do not provide any information that could identify you personally. However, an email submission will be required in order to enter you into the raffle, but your email will remain confidential and separate from all data collected. One winner will be chosen randomly for each participating county. Your participation in this survey does not guarantee you will win the $25 online Amazon gift card raffle. If you have any questions before completing this survey, please contact the researcher, Elizabeth Symon by email at [email protected].
Q2 This research study has been reviewed by the Human Research Protection Program at the College of Charleston. For information about the review process, please contact the Office of Research and Grants Administration, [email protected] or 843-953-7421. IRB approval code: GQKK-10-20-2015. If you wish to participate, please proceed to the questionnaire by clicking “Next.” If not, please close this browser tab/window. If you would like to leave the survey at any time, just close this browser tab/window. We will also be conducting focus group discussions in your area. Refreshments will be provided as well as a $25 Amazon gift card for your participation in the 1-1.5 hour discussion. If you would be interested in participating, please click the link at the end of this survey to be taken to a new web link to answer a quick 5-minute survey after you have entered in your email submission. All identifiable information will remain confidential and separate from all data collected. If not interested, please close this browser window/tab. Please note: Participation in the 5-minute survey does not guarantee selection for focus group discussion participation. Selection is subject to participant availability as well as survey results. All identifiable information collected will remain confidential.
Q3 Summer Feeding Struggles
Q4 This past summer, I relied on only a few kinds of low-cost food to feed my child/children because I was running out of money to buy food. ___ Often true (1) ___ Sometimes true (2) ___ Never true (3) ___ Don’t know (4)

69HuNger Free SuMMer HubS INIt IAtIve : A NeedS ASSeSSMeNt
Q5 This past summer, I couldn’t feed my child/children a balanced meal, because I couldn’t afford that. ___ Often true (1) ___ Sometimes true (2) ___ Never true (3) ___ Don’t know (4)
Q6 This past summer, my child/children did not eat enough because I just couldn’t afford enough food. ___ Often true (1) ___ Sometimes true (2) ___ Never true (3) ___ Don’t know (4)
Q7 This past summer, did you ever cut the size of your child’s/childrens’ meals because there wasn’t enough money for food? ___ Yes (1) ___ No (2) ___ Don’t know (3)
Q8 This past summer, did your child/children ever skip meals because there wasn’t enough money for food? ___ Yes (1) ___ No (2) ___ Don’t know (3)
Q9 This past summer, was your child/children ever hungry but you just couldn’t afford more food? ___ Yes (1) ___ No (2) ___ Don’t know (3)
Q10 This past summer, did your child/children ever NOT eat for a whole day because there wasn’t enough money for food? ___ Yes (1) ___ No (2) ___ Don’t know (3)

70HuNger Free SuMMer HubS INIt IAtIve : A NeedS ASSeSSMeNt
Q11 Summer Feeding Program Awareness
Q12 Are you aware of places in your community where you or your child/children can go to receive free meals during the summer? ___ Yes (1) ___ No (2)If Yes Is Selected, Then Skip To This past summer, did any children in...
Q13 This past summer, did you or your child/children receive free meals from places (e.g., your church, an area business, etc.) in your community? ___ Yes (1) ___ No (2)If Yes Is Selected, Then Skip To Would you recommend these free meals ...
Q13a Would you recommend eating the meals served/picked up from these places? ___ Yes (Please explain why) (1) ____________________ ___ No (Please explain why) (2) ____________________
Q14 Summer Feeding Program Interest
Q15 Thinking about your family, how interested would you be in a summer feeding program that provides free meals for your child/children during the summer when your child/children are not in school? ___ Very Interested (1) ___ Interested (2) ___ Neutral (3) ___ Uninterested (4) ___ Very Uninterested (5)
Q15a Please explain why you answered with your interest level.
Q16 Summer Feeding Program Services, Offerings, and Incentives
Q17 Of the following services listed below, please select if a service is a must, would like to have, or is not important to you for your child/children to participate in a summer feeding service program.

71HuNger Free SuMMer HubS INIt IAtIve : A NeedS ASSeSSMeNt
Must Have (1) Would Like to Have (2) Not Important (3)Provide free transportation: (1)Provide recreational activities that your children like: (2)Provide educational programs and activities: (3)Provide sports and physical activities: (4)Provide meals that your children are willing to eat: (5)Provide healthy, balanced meals: (6)Provide meals at no cost to all children age 18 and under: (7)Provide meals at a safe, secure, and local place: (8)Provide a place where your children can socialize with their friends: (9)Provide adults with free meals: (10)
Q18 Please explain what else, if anything, would be important for a summer feeding program to have in order for your child/children to participate.
Q19 Summer Feeding Program Barriers
Q20 What would prevent you from allowing your child/children to participate in a summer feeding program? Please check all reasons that apply, listed below: ___ I am not interested (1) ___ The summer meals are not served a convenient location (2) ___ I do not feel the location serving the summer meals is safe and secure (3)

72HuNger Free SuMMer HubS INIt IAtIve : A NeedS ASSeSSMeNt
___ I am not familiar with the staff or organization (4) ___ My child/children do not need free summer meals (5) ___ My children are not interested (6) ___ Trying to get to a summer food program site is too much of a hassle (7) ___ We do not get to eat as a family (8) ___ My children have participated in the past and have been unsatisfied (9) ___ I have allowed my children to participate in the past and have been unsatisfied (10)
Q21 When would a summer feeding program site need to be open in order for your child/children to participate? ___ Weekdays Only (Monday - Friday) (1) ___ Weekend Days Only (Saturday and Sunday) (2) ___ Both Weekdays and Weekend Days (Monday - Sunday) (3)
Q22a On Weekdays, what time frame would a summer feeding program site need to be open in order for your child/children to participate? ___ Morning (8am-11am) (1) ___ Afternoon (12pm-3pm) (2) ___ Evening (4pm-7pm) (3) ___ Other (please type in times if selected) (4) ____________________
Q22b On Weekend days, what time frame would a summer feeding program site need to be open in order for your child/children to participate? ___ Morning (8am-11am) (5) ___ Afternoon (12pm-3pm) (6) ___ Evening (4pm-7pm) (7) ___ Other (8) ____________________
Q23 In order for your child/children to participate in a summer feeding program, how close would a site need to be from your house or place of employment? ___ Within a quarter-mile (1) ___ Within a half-mile (2) ___ Within 1 mile (3) ___ Within 5 miles (4) ___ Within 10 miles (5) ___ Within 20 miles (6) ___ Within more than 20 miles (7)

73HuNger Free SuMMer HubS INIt IAtIve : A NeedS ASSeSSMeNt
Q24 Summer Feeding Information Sources
Q25 Where would you want to learn about summer feeding programs? Please check all of the places that apply, listed below: ___ My child’s school (1) ___ Online/website (2) ___ A church or place of worship (3) ___ A local library (4) ___ WIC/SNAP offices (5) ___ A local community center (6) ___ A local recreation center/pool (7) ___ Social Services offices (8) ___ Food pantries/food banks/soup kitchens (9) ___ Community meetings (10) ___ On public transportation (11) ___ A local business (12) ___ Somewhere else (13) ____________________
Q26 How would you want to learn about summer feeding programs? Please check all of the media that apply, listed below: ___ In the mail (1) ___ Flyers (2) ___ Online/website (3) ___ Email (4) ___ Community newspaper (5) ___ Local news (6) ___ TV (7) ___ Radio (8) ___ Billboards (9) ___ A phone call (10) ___ Ads on public transportation (11) ___ Text message (12) ___ Home visit (13) ___ Some other way (14) ____________________

74HuNger Free SuMMer HubS INIt IAtIve : A NeedS ASSeSSMeNt
Q27 Demographics
Q28 Gender ___ Male (1) ___ Female (2)
Q29 Are you Hispanic or Latino? ___ No, not Hispanic or Latino (1) ___ Yes, Hispanic or Latino (2)
Q30 How would you describe yourself? ___ Black or African American (3) ___ White (5) ___ American Indian or Alaskan Native (1) ___ Asian (2) ___ Native Hawaiian or Pacific Islander (4)
Q31 Current employment status: ___ Employed Full-time (1) ___ Employed Part-time (2) ___ Seeking employment (3) ___ Homemaker (4) ___ Retired (5) ___ Student (6) ___ Disabled (7) ___ Other (8) ____________________
Q32 Household county location: ___ Charleston (1) ___ Beaufort (2) ___ Berkeley (3) ___ Dorchester (4) ___ Georgetown (5)

75HuNger Free SuMMer HubS INIt IAtIve : A NeedS ASSeSSMeNt
___ Hampton (6) ___ Jasper (7) ___ Horry (8) ___ Colleton (9) ___ Willamsburg (10) ___ Other (11) ____________________
Q33 Community type: ___ Urban (city) (1) ___ Suburban (outside of a city) (2) ___ Rural (country) (3) ___ Other (4) ____________________Q34 What is your total monthly household income, before taxes and deductions? ___ Less than $400 (1) ___ $400-$800 (2) ___ $800-$1200 (3) ___ $1200-$1600 (4) ___ $1600-$2000 (5) ___ $2000-$2500 (6) ___ $2500-$3000 (7) ___ $3000-$3500 (8) ___ $3500-$4000 (9) ___ $4000-$5000 (10) ___ $5000-$6000 (11) ___ More than $6000 (12)
Q35 Do you have children in your household between the ages of 0-18 years old? ___ Yes (3) ___ No (2)If No Is Selected, Then Skip To To enter your name into the raffle dr...If Yes Is Selected, Then Skip To Do you have children in your househol...

76HuNger Free SuMMer HubS INIt IAtIve : A NeedS ASSeSSMeNt
Q35a Do you have children in your household between the ages of 0-5 years old? If yes, please enter in the number of children within this age range. ___ Yes (1) ____________________ ___ No (2)
Q35b Do you have children in your household between the ages of 6-12 years old? If yes, please enter in the number of children within this age range. ___ Yes (1) ____________________ ___ No (2)
Q35c Do you have children in your household between the ages of 13-18 years old? If yes, please enter in the number of children within this age range. ___ Yes (1) ____________________ ___ No (2)
Q36 To enter your name into the raffle drawing for a chance to win a $25 online Amazon gift card, please click on or type in the following link in your web-browser: http://go.cofc.edu/HFSraffle
Q37 If you wish to participate in the focus group described at the start of this survey, please click on or type in the following link in your web-browser: http://go.cofc.edu/HFSfgsurvey Please note that participation and completion of the focus group survey does not guarantee your selection. Also please be sure you finalize and complete this survey by clicking on the button below. Thank you for your time and participation in this survey.
Please note that participation and completion of the focus group survey does not guarantee your selection. Also please be sure you finalize and complete this survey by clicking on the button below. Thank you for your time and participation in this survey.

77HuNger Free SuMMer HubS INIt IAtIve : A NeedS ASSeSSMeNt
Appendix F – Focus group Screener Survey
Hunger free Summer Hubs Initiativefocus Group Recruitment Screening Survey
Thank you for you interest. We are conducting some group discussions to learn about summer feeding struggles and level of awareness of summer feeding service programs in your area. Part of that process includes speaking to people about the food security in their household during summer months when kids are not in school.
Please note: Participation in the following survey does not guarantee selection for focus group discussion participation. Selection is subject to participant availability as well as survey results. All identifiable information collected will remain confidential. IRB approval code: GQKK-10-20-2015 1. Gender: Male _________ Female _________
2. Are you Hispanic or Latino? a. No, not Hispanic or Latino b. Yes, Hispanic or Latino
3. How would you describe yourself? ___American Indian or Alaskan Native ___Asian ___Black or African American ___Native Hawaiian or Pacific Islander ___White
3. Please answer “Yes” or “No” to the following questions in regards to your family/household:
a. Within the past 12 months, we worried whether our food would run out before we got money to buy more. ___Yes ___No

78HuNger Free SuMMer HubS INIt IAtIve : A NeedS ASSeSSMeNt
b. Within the past 12 months, the food we bought just didn’t last and we didn’t have money to get more. ___Yes ___No
4. Please enter in your contact information: Respondent’s Name:_____________________________________ Address:______________________________________________ Phone Number:_________________________________________ Email Address:_________________________________________

79HuNger Free SuMMer HubS INIt IAtIve : A NeedS ASSeSSMeNt
Appendix g – Focus group Consent Form
College of Charlestonfocus Group Discussion
CONSENT TO PARTICIPATE IN RESEARCH (ADuLT fORM)
You are invited to participate in a research study. This research, to be conducted by Elizabeth Symon, Program Manager, Public Health Initiatives with the College of Charleston, is designed to increase the awareness, interest, and participation in child summer food service programming within the Lowcountry Food Bank’s 10 coastal county service area.
Participation in this study will require between 1 to 1.5 hours of your time. As a participant in this research, you will be asked questions during a structured interview regarding food security in your household as well as summer feeding service program awareness and interest.
This discussion will be audio-recorded. I will keep your information strictly anonymous. However, if you are willing to permit me to quote you in the report of my research, please check the item just above the signature line. You will be given an opportunity to review the section of my report in which your quote appears before completion of my research.
Although you will not benefit directly from this study, this research is expected to benefit Lowcountry Food Bank service area residents by increasing participation in child summer feeding service programs.
I know of no risk or discomfort associated with this research. Your participation is completely voluntary and you may discontinue participation at any time.
If you have any questions concerning this research study please contact Elizabeth Symon, at [email protected]. You may also contact Research Protections & Compliance on the Office of Research and Grants Administration, at 843-953-7421 or e-mail [email protected] if you have questions or concerns about research review at the College of Charleston or your rights as a research participant. You will be given a copy of this form to keep.
This research has been reviewed by the Human Research Protections Program at the College of Charleston.

80HuNger Free SuMMer HubS INIt IAtIve : A NeedS ASSeSSMeNt
I have read this consent form, and I agree to participate in this research study. In any reports/publications which result from this research, I permit you to quote me
___no ___yes
________________________________________________________________________Printed Name of Participant
________________________________________________________________________Signature of Participant Date
________________________________________________________________________Signature of Person Obtaining Consent Date

81HuNger Free SuMMer HubS INIt IAtIve : A NeedS ASSeSSMeNt
Appendix H – Focus group Moderator guide
Hunger-free Summer Hubs InitiativeParent/Guardian focus Group Discussion
Moderator’s Guide
IntroductionHi, my name is _____________________and I am with _____________________. Thank you for being a part of a focus group on summer feeding programs and household food security.
Why am I doing this project?We are collecting information on household food security during the summer months and the level of interest and awareness in summer feeding service programs for children in your household in order to assess ways in which we can better serve more children during the summer months.
Anonymity & ConfidentialityPlease be assured that all your responses are anonymous and will be used for statistical purposes only. Our summary report will make no references to names.
The information you learn about each other must remain confidential and cannot leave this room once our discussion is over.
Purpose of DiscussionThe purpose of this discussion is to help us understand your level of food security or insecurity during the summer months when your children are not in school and how to raise the level of awareness and interest in the participation of children in your area in the summer feeding service program opportunities.
Difficult TopicWe understand that discussing issues like this can be difficult to discuss publicly. However, almost everyone in this group, if not everyone, is familiar with the challenges and struggles of providing enough food for everyone in your household during the summer months when kids are not in school.
Participant IntroductionBefore we begin, let’s go around the room and introduce ourselves. Why not tell us your name, how long you have lived in the area, and what you like to do in your spare time.

82HuNger Free SuMMer HubS INIt IAtIve : A NeedS ASSeSSMeNt
Appendix I – Focus group discussion guide
Hunger-free Summer Hubs InitiativeParent/Guardian focus Group Discussion Questions
Summer Feeding Behavior1) During the summer, when your children are not in school, where do your children spend most of their time? And, who most often looks after them?
Probe for: at home, with a family member, with a family friend, at a summer program, at a babysitter’s, etc.
2) During the summer, when your children are not in school, where do your children most often eat lunch?
Probe for: at home, with a family member, with a family friend, at a summer program, at a babysitter’s, etc.
Summer Feeding Struggles3) How many people would say that they either ran out or worried about running out of food this past summer when kids were not in school?
4) How many people would say that they either ran out or worried about running out of food every month this past summer while kids were not in school? Did these things happen at certain times of the month?
Probe for: beginning of the month when rent is due, end of the month after bills have been paid, etc.
5) Does running out of food or worrying about it follow any pattern during summer months? That is, does anything else happen regularly during summer months that cause you to run out of food or worry about it?
Probe for: kids are not in school so more mouths to feed, more meals to provide, medical emergencies, large bills, etc.
6) If there isn’t enough food, what are some of the things you do to make food last longer during the summer months when kids are not in school?
Probe for: cut meal sizes, skip meals, serve less nutritious foods because they are less expensive, serve nutritious foods but lessen the amount, etc.

83HuNger Free SuMMer HubS INIt IAtIve : A NeedS ASSeSSMeNt
7) When people are short on money and there isn’t enough food to go around, people sometimes go to different places to get enough food. What types of places have you gone to for food during the summer months? How often do you go? Which of these places works best for you and why?
Probe for: food assistance programs, food pantry, soup kitchen, etc.Probe for: more than once a week, weekly, bi-weekly, monthly, etc.Probe for: location, distance, time availability, etc.
Summer Feeding Program Awareness8) How many people are aware of locations in your community where children can go to receive free meals during the summer? Can you explain what you know, if anything, about free meals for children during the summer?
Probe for: program names, program locations, program times, etc.
9) This past summer, did any children in your household receive any free meals from locations in your community? Would you recommend these free meals for children to others? Can you explain why you answered “Yes” or “No?”
Probe for: where children received the meals, locationsProbe for: why or why not, satisfied, unsatisfied, availability, location, etc.
Summer Feeding Program Interest10) Thinking about your family, how interested would you be in a summer feeding program that provides free meals for your children during the summer when your children are not in school? Can you explain why you answered with your interest level?
Probe for: very interested, interested, neutral, uninterested, very uninterested Probe for: aiding in summer costs, kids would receive healthier meals, availability, location, timing, activities for kids, etc.
Summer Feeding Program Offerings, Services, and Incentives 11) For you to consider having your child/children in your household participate in a summer feeding program, what services, offerings, and incentives would be needed or nice to have? In other words, please explain what would be important for a summer feeding program to have in order for your child/children to participate.
Probe for: free transportation, recreation activities your kids like, educational programs/activities, sports/physical activities, meals that your kids want to eat, healthy/balanced meals, safe secure location, location where your kids could hang out with their friends, provide adults free meals, etc.

84HuNger Free SuMMer HubS INIt IAtIve : A NeedS ASSeSSMeNt
Summer Feeding Program Barriers12) Are there any reasons in particular that would prevent your child/children from participating in summer feeding programs?
Probe for: not interested, location convenience, safety/security of location, unfamiliar with the staff/organization, not needed, have participated in the past and either you/your children were not satisfied, etc.
13) In order for your child/children to participate in a summer feeding program site, how long would the site need to stay open, and how close would a site need to be for you?
Probe for: 0-1 hour, 2 hours, 3 hours, 4 hours, etc.Probe for: within half mile, within a mile, within 5 miles, etc.
Summer Feeding Program Information14) How and where would you like best to learn more about summer feeding programs in your area?
Probe for: schools of your children, library, phone call, email, etc.

85HuNger Free SuMMer HubS INIt IAtIve : A NeedS ASSeSSMeNt