hurricane center lab tasks cartographer (plots storm position and track) computer (categorizes...
Post on 21-Dec-2015
225 views
TRANSCRIPT
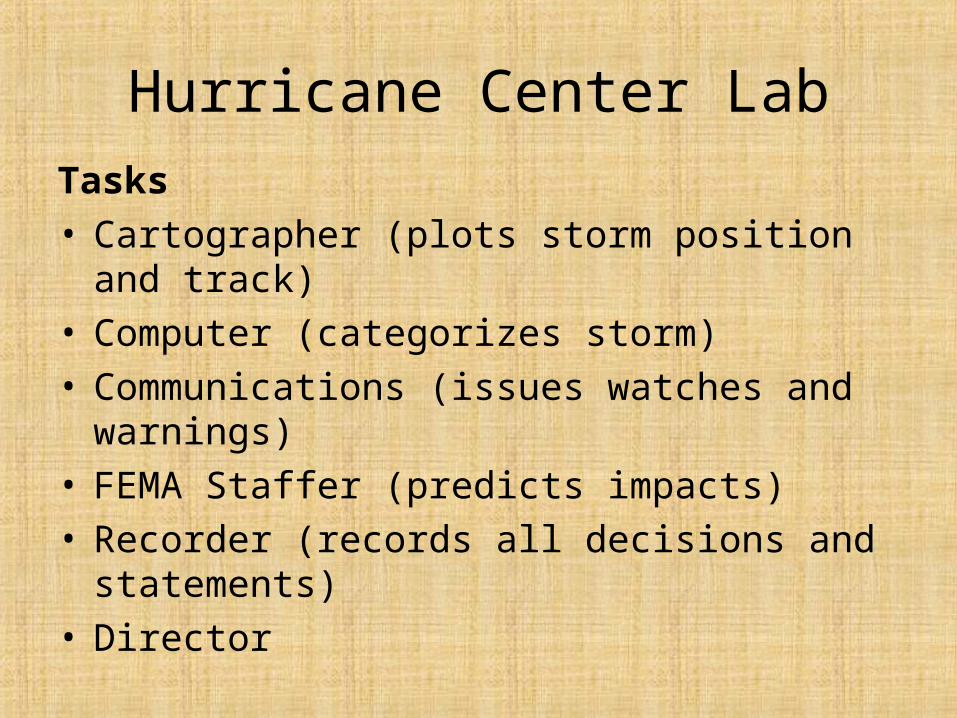
Hurricane Center Lab
Tasks• Cartographer (plots storm position and track)• Computer (categorizes storm)• Communications (issues watches and warnings)• FEMA Staffer (predicts impacts)• Recorder (records all decisions and statements)• Director

Hurricane X Data
Date Time Latitude Longitude Pressure Wind Speed Wind Speed
(UTC) (N) (W) (mb) (kt) (mph)
15-Oct 1800 17.6 78.5 1004 25 29


Hurricane X Data
Date Time Latitude Longitude Pressure Wind Speed Wind Speed
(UTC) (N) (W) (mb) (kt) (mph)
15-Oct 1800 17.6 78.5 1004 25 29
18-Oct 600 15.7 79.9 982 60 69

Hurricane X Data
Date Time Latitude Longitude Pressure Wind Speed Wind Speed
(UTC) (N) (W) (mb) (kt) (mph)
15-Oct 1800 17.6 78.5 1004 25 29
18-Oct 600 15.7 79.9 982 60 69
19-Oct 1200 17.3 82.8 882 160 184
X

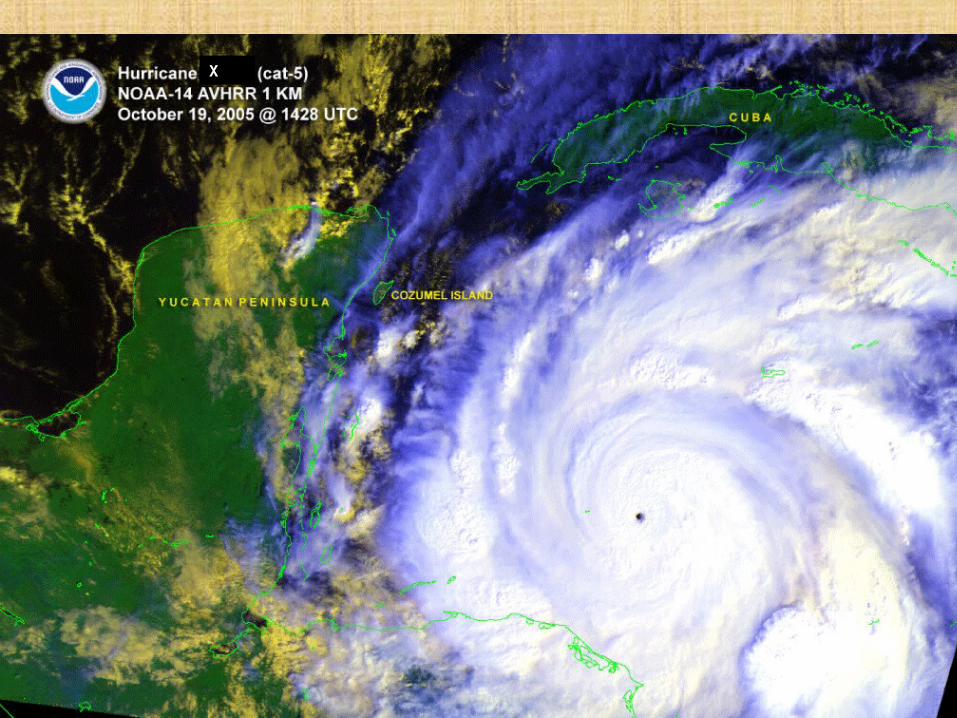
Hurricane X Data
Date Time Latitude Longitude Pressure Wind Speed Wind Speed
(UTC) (N) (W) (mb) (kt) (mph)
15-Oct 1800 17.6 78.5 1004 25 29
18-Oct 600 15.7 79.9 982 60 69
19-Oct 1200 17.3 82.8 882 160 184
21-Oct 2145 20.6 86.8 927 130 150

X

Hurricane Wilma Data
Date Time Latitude Longitude Pressure Wind Speed Wind Speed
(UTC) (N) (W) (mb) (kt) (mph)
15-Oct 1800 17.6 78.5 1004 25 29
18-Oct 600 15.7 79.9 982 60 69
19-Oct 1200 17.3 82.8 882 160 184
21-Oct 2145 20.6 86.8 927 130 150
24-Oct 600 25 83.1 953 110 127


Hurricane Wilma - 2005

Wilma Impacts• 23 deaths have been directly attributed to
Wilma: 12 in Haiti, 1 in Jamaica, 4 in Mexico, 5 in Florida, and 1 in the Bahamas
• Maximum Precipitation Mexico – 62 in• Maximum Precipitation Florida – 10 in• Maximum Storm Surge Florida – 7 ft• Estimate of Wilma’s U.S. damage of $20.6
billion, making Wilma the third costliest hurricane in U.S. history. Worse damage on Yucatan Peninsula.
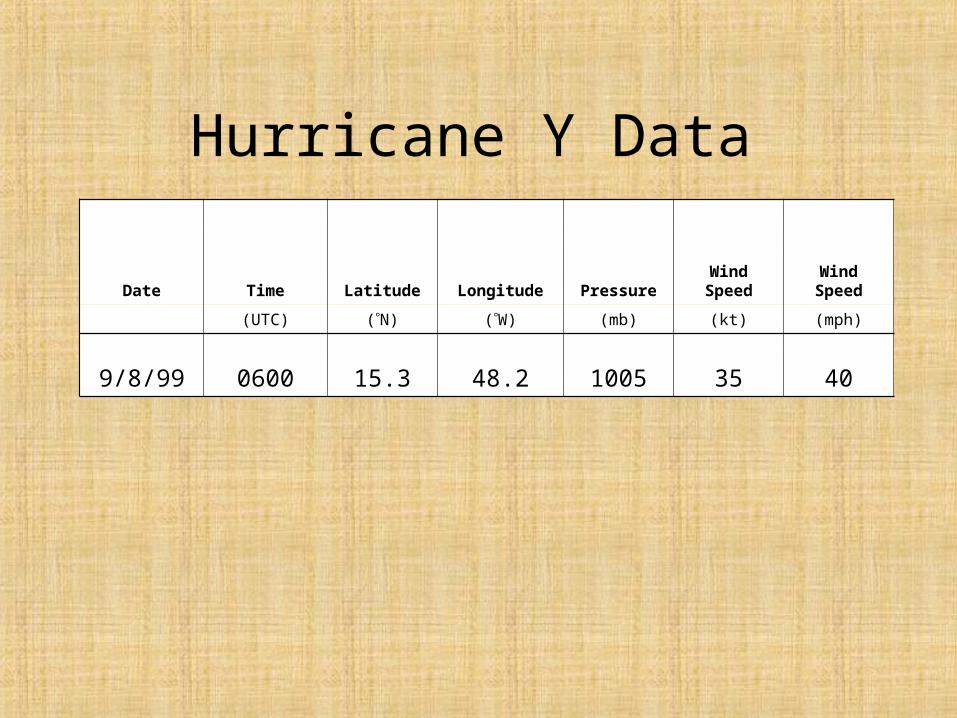
Hurricane Y Data
Date Time Latitude Longitude Pressure Wind Speed Wind Speed
(UTC) (N) (W) (mb) (kt) (mph)
9/8/99 0600 15.3 48.2 1005 35 40

Hurricane Y Data
Date Time Latitude Longitude Pressure Wind Speed Wind Speed
(UTC) (N) (W) (mb) (kt) (mph)
9/8/99 0600 15.3 48.2 1005 35 40
9/10/99 0000 18.3 57.2 995 60 69
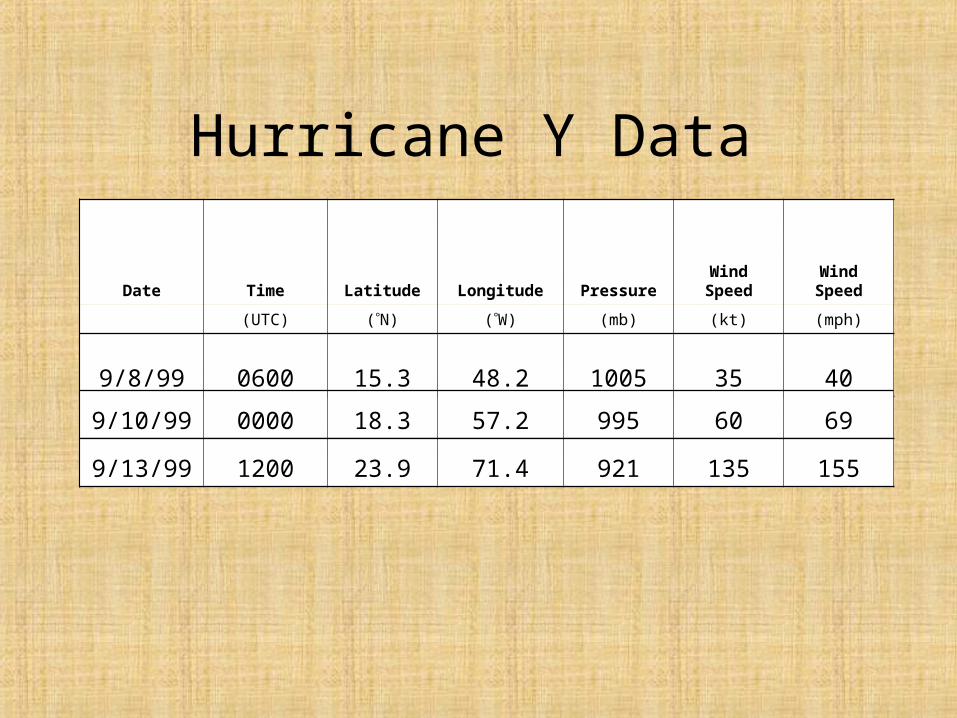
Hurricane Y Data
Date Time Latitude Longitude Pressure Wind Speed Wind Speed
(UTC) (N) (W) (mb) (kt) (mph)
9/8/99 0600 15.3 48.2 1005 35 40
9/10/99 0000 18.3 57.2 995 60 69
9/13/99 1200 23.9 71.4 921 135 155

Hurricane Y Data
Date Time Latitude Longitude Pressure Wind Speed Wind Speed
(UTC) (N) (W) (mb) (kt) (mph)
9/8/99 0600 15.3 48.2 1005 35 40
9/10/99 0000 18.3 57.2 995 60 69
9/13/99 1200 23.9 71.4 921 135 155
9/15/99 0000 27.1 77.7 933 115 132
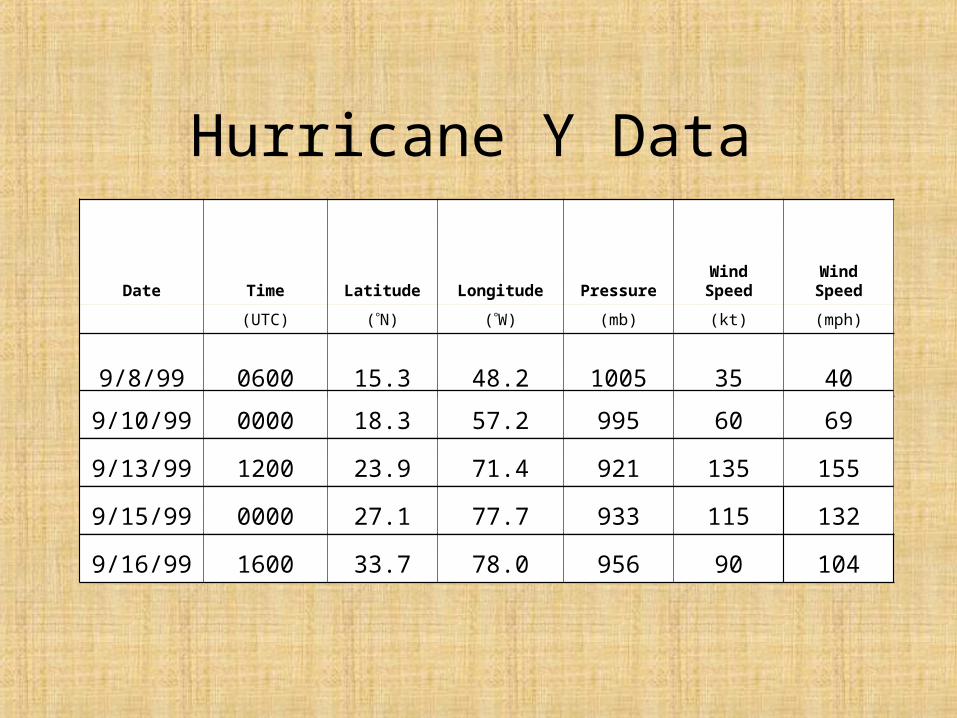
Hurricane Y Data
Date Time Latitude Longitude Pressure Wind Speed Wind Speed
(UTC) (N) (W) (mb) (kt) (mph)
9/8/99 0600 15.3 48.2 1005 35 40
9/10/99 0000 18.3 57.2 995 60 69
9/13/99 1200 23.9 71.4 921 135 155
9/15/99 0000 27.1 77.7 933 115 132
9/16/99 1600 33.7 78.0 956 90 104

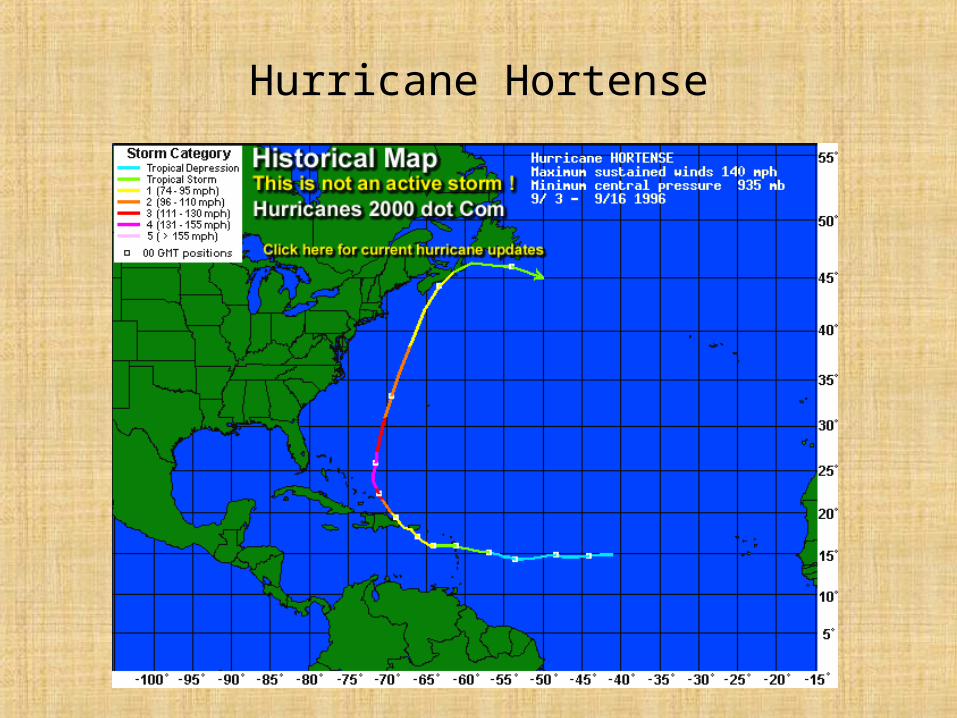
Hurricane Floyd

Hurricane Floyd

Floyd Impacts• Floyd was the deadliest hurricane in the United
States since Agnes of 1972. (pre-Katrina)• 57 deaths: North Carolina 35, Pennsylvania 6,
New Jersey 6, Virginia 3, Delaware 2, New York 2, Connecticut 1, and Vermont 1
• Damage estimates from 3 to > 6 billion dollars. • Storm surge values as high as 10 feet in North
Carolina• Rainfall totals as high as 20 inches were
recorded in eastern North Carolina and Virginia. Up to 11 inches in parts of New England.

Floyd Flooding

Hurricane Hortense Data
Date Time Latitude Longitude Pressure Wind Speed Wind Speed
(UTC) (N) (W) (mb) (kt) (mph)
9/7/96 0000 15.2 57.0 1006 40 46

Hurricane Hortense Data
Date Time Latitude Longitude Pressure Wind Speed Wind Speed
(UTC) (N) (W) (mb) (kt) (mph)
9/7/96 0000 15.2 57.0 1006 40 46
9/9/96 1200 16.3 65 985 70 81

Hurricane Hortense Data
Date Time Latitude Longitude Pressure Wind Speed Wind Speed
(UTC) (N) (W) (mb) (kt) (mph)
9/7/96 0000 15.2 57.0 1006 40 46
9/9/96 1200 16.3 65 985 70 81
9/10/96 1200 18.3 67.8 989 65 75

Hurricane Hortense

Hurricane Hortense Data
Date Time Latitude Longitude Pressure Wind Speed Wind Speed
(UTC) (N) (W) (mb) (kt) (mph)
9/7/96 0000 15.2 57.0 1006 40 46
9/9/96 1200 16.3 65 985 70 81
9/10/96 1200 18.3 67.8 989 65 75
9/11/96 1200 20.9 70.1 971 90 104

Hurricane Hortense Data
Date Time Latitude Longitude Pressure Wind Speed Wind Speed
(UTC) (N) (W) (mb) (kt) (mph)
9/7/96 0000 15.2 57.0 1006 40 46
9/9/96 1200 16.3 65 985 70 81
9/10/96 1200 18.3 67.8 989 65 75
9/11/96 1200 20.9 70.1 971 90 104
9/13/96 0000 25.9 71.5 935 120 138
Hurricane Hortense
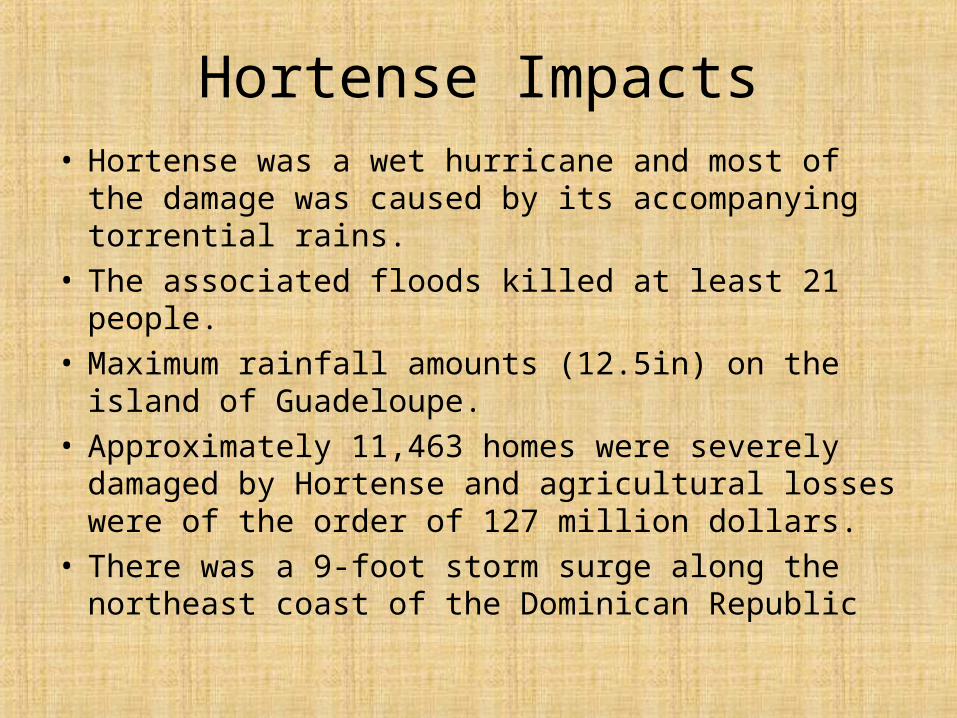
Hortense Impacts• Hortense was a wet hurricane and most of the
damage was caused by its accompanying torrential rains.
• The associated floods killed at least 21 people.• Maximum rainfall amounts (12.5in) on the island
of Guadeloupe.• Approximately 11,463 homes were severely
damaged by Hortense and agricultural losses were of the order of 127 million dollars.
• There was a 9-foot storm surge along the northeast coast of the Dominican Republic