hurunui -waiau zone waiau zone committee …€¦ · · 2014-11-11waiau zone committee hurunui...
TRANSCRIPT

HURU
NU
I-WAI
AU Z
ON
E CO
MM
ITTE
E
Hurunui-Waiau Zone Committee
A G E N DA FOR THE MEETING TO BE HELD ON: MONDAY 17 NOVEMBER 2014 AT 4.30PM WAIKARI HALL PRINCES STREET WAIKARI Community partnership in growth and wellbeing.

----------------------------------------------------------------------- For the meeting timetable and order of
business please refer to the back page fold-out.
------------------------------------------------------------ Committee Membership:
David Eder (Chairperson) David Bedford (Canterbury Regional Council) Mayor Winton Dalley (Hurunui District Council) Vince Daly (Hurunui District Council) John Faulkner (Deputy Chairperson) Michele Hawke James McCone Mike Hodgen Ken Hughey Makarini Rupene (Te Ngāi Tūāhuriri Rūnanga) Raewyn Solomon (Te Rūnanga o Kaikōura)
Quorum: A majority of members of the committee shall be present to form a quorum.
Purpose of local government
(1) The purpose of local government is –
(a) To enable democratic local decision-making and action by, and on behalf of, communities and
(b) To meet the current and future needs of communities for good quality local infrastructure, local public services, and performance of regulatory functions in a way that is most cost-effective for households and businesses.
(2) In this Act good-quality, in relation to local infrastructure, local public services, and performance of regulatory functions, means infrastructure, services and performance that are –
(a) Efficient: and
(b) Effective: and
(c) Appropriate to present and anticipated future circumstances
(Local Government Act 2002 – Amendment Act 2012)

HURUNUI – WAIAU ZONE COMMITTEE
MONDAY 17 NOVEMBER 2014, WAIKARI HALL, WAIKARI
TIMETABLE & ORDER OF BUSINESS
4.30pm Meeting commences with Karakia and formal order of business
• Apologies
• Announced urgent business
• Confirmation of minutes
• Correspondence –
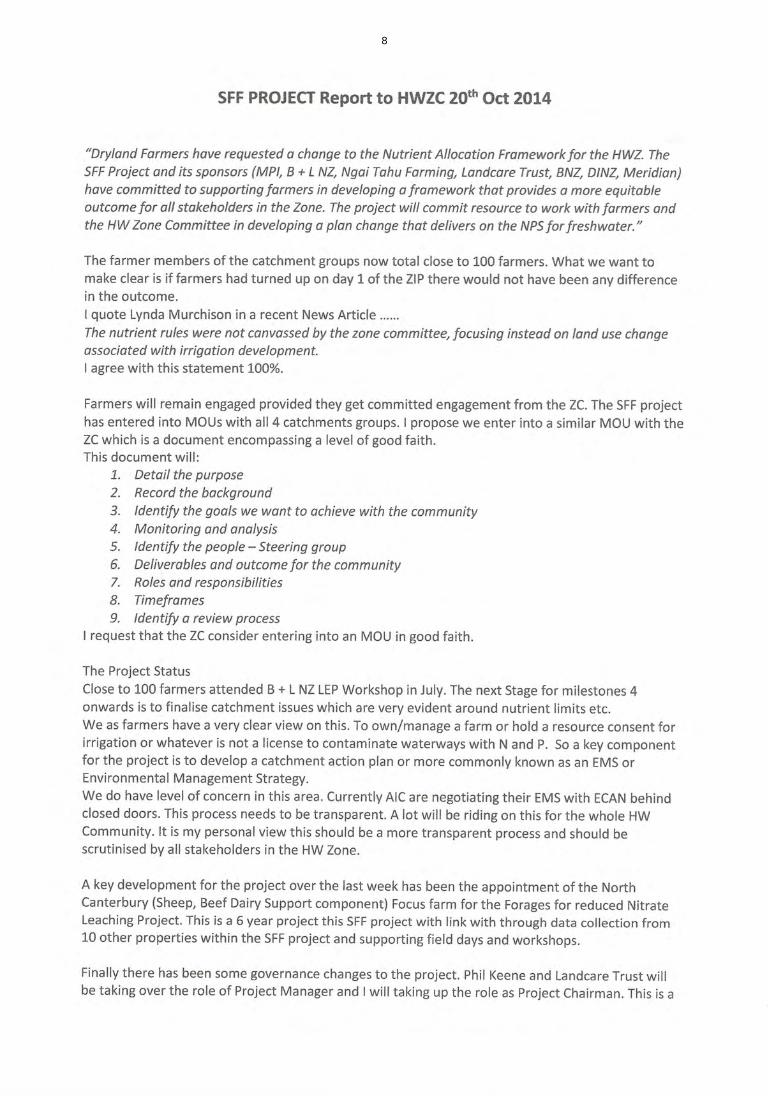
• SFF Report - Andrew Harris
• Letter from the SNA Group -
1 - 7
6 – 7
8 – 11
12
1 4.50pm
Update on Regional Committee
• David Eder, Winton Dalley
Update on other activities and meetings attended
2 5.00pm Update on Hurunui, Waiau and Jed Nutrient Working Group-
Ben Ensor (Chair of Working Group)
13 - 22
3 5.00pm Project proposed for Immediate Steps Biodiversity Fund
Jean Tompkins (Environment Canterbury)
23 - 29
5.30pm Review of water use in Hurunui Waiau Zone – Ross Glubb and
Andy Barbati 30 - 64
6.30pm Meeting concludes
Meeting Hurunui-Waiau Zone Committee
Time and Date 20 October 2014, 3.00pm
Venue Waiau Hall, 3 Cheviot St, Waiau
Members Present David Eder (Chair), John Faulkner, Mayor Winton Dalley, Cr Vince Daly, Commissioner David Bedford, Mike Hodgen, Ken Hughey, James McCone, Makarini Rupene, Michele Hawke and Raewyn Solomon (from 3.22pm).
In Attendance Ian Whitehouse (ECan Facilitator), Kim Drummond (ECan), Alex Adams (HWP), Karen Renouf (HWP), Ben Ensor (FA), Scott Pearson (F&G), Norm Williamson (AIC), James Hoban, Jean Tompkins (ECan), Elaine Moriarty (ESR), Dick Davison (HDC), Fran Perriam (Hurunui SNA), John Benn (DOC), Jamie McFadden (Hurunui Natives), Leone Evans (ENC), Stephen Bragg (ECan), Jane Demeter, Judith Batchelor(HDC), Cr Marie Black, and Linzi Turner (Committee Secretary).
Apologies David Bedford for lateness.
Absent Nil.
Conflict of Interest Declarations
Ken Hughey and Raewyn Solomon regarding the Hanmer Wetland restoration project. They both abstained from voting for funding.
Recording Device A recording device was used for the purpose of the accuracy of the minutes.
Urgent Business Nil.
Minutes THAT THE MINUTES OF THE MEETING HELD ON 18 AUGUST 2014 BE CONFIRMED SUBJECT TO THE FOLLOWING AMENDMENTS.
Eder/Daly CARRIED
1. SFF completed four workshops in Culverden, Cheviot, Waiau and Hawarden.
2. Spelling error - Kaikoura not Kaikora.
3. Item 5 - James Hoban "is" involved in low nutrient farming…
4. The regulations of the "ZIP", not ZIP plan.
5. Item 6 - HWP - a resolution process is taking place as AICL and NTFE appeal "over" consents.
6. NTFE – The HWRRP has been "constrained" not strained.
1
7. AICL – 2nd paragraph - parties work in collaboration with the Zone Committee "rather" than through the existing consenting process. (The word ‘rather’ was missing in the sentence.)
8. Paragraph 7 - There was concern from members of the public attending the meeting about the interpretation of the ZIP.
THAT THE MINUTES OF THE MEETING HELD ON 22 SEPTEMBER 2014 BE CONFIRMED SUBJECT TO THE FOLLOWING AMENDMENTS.
Eder/Hawke CARRIED
1. Item 1 - Not North Canterbury Rural Women's Group, it is the “Amuri Rural Women's Group” meeting.
2. Item 4 - Andrew “Parish” not just Andrew.
3. Item 5, bullet point 3 –The Hurunui River "low" flows of phosphorus concentration is above average.
4. New paragraph – the current N load is …
5. Item 6, bullet point 6 - typing error "block".
6. Item 6, bullet point 7 - N losses above the B block "allocation" limits.
7. Change Edwin Jansen equation for N load limits from (t/ha/yr) to (Kg/ha/yr) and attach the presentation review to the minutes as an addendum.
8. The resolution on page 8 should read:
THAT THE COMMITTEE ACKNOWLEDGE THAT THE CURRENT NUTRIENT ALLOCATION FRAMEWORK IN THE HURUNUI – WAIAU IS NOT EQUITABLE AND WILL NOT ACHIEVE DESIRED COMMUNITY OUTCOMES, THEREFORE THE COMMITTEE COMMITS TO FURTHER INVESTIGATE LYNDA MURCHISON'S ALTERNATIVE SOLUTIONS FOR DRYLAND FARMERS TO ALLOW A CHANGE OF LAND USE AND MAY ALSO CONSIDER ANY OTHER OPTIONS THAT PRESENT THEMSELVES.
Hodgen/Dalley CARRIED
THAT THE COMMITTEE AGREES TO ACCEPT THE CHANGES MR JANSEN HAS MADE TO REFLECT HIS REVIEW OF HIS PRESENTATION THAT HE GAVE AT THE SEPTEMBER MEETING AND THAT THE CHANGES ARE ATTACHED TO THE MINUTES AS AN ADDENDUM.
Eder/Hughey CARRIED
Matters Arising
Commissioner David Bedford apologised for his comments at the September meeting and asked that his expressed apologies be accepted.
2

Correspondence
Inwards Mail
An email from Doug and Rose Rankin regarding biodiversity work on the Clarence River was sent to Ian Whitehouse, addressed to the Zone Committee.
A letter received from the SNA Group.
Clarification was sought on what correspondence is to be tabled as there is confusion surrounding correspondence addressed to and between individual committee members and what is addressed to the committee as an entity.
Winton Dalley clarified the situation by explaining that correspondence addressed to the committee and chair is a public document and will be tabled. Private correspondence to an individual is to remain a private conversation.
The email was addressed to Ian Whitehouse to request an opportunity to speak at a Zone Committee meeting. Mr Rankin is to be invited to speak at a meeting.
Outwards Mail
A letter of thanks and a verbal thank you to Andrew Harris, as he was in attendance at the meeting. Andrew gave a verbal report of progress with SFF. (Please see attached)
It was pointed out that the letter that Dan Hodgen wrote refers more to P not N.
THAT THE COMMITTEE ACCEPT DAN HODGEN'S LETTER AND ACCEPTS THIS IS A WAY FORWARD.
Dalley/Faulkner CARRIED
1.Regional Committee Update
Regional CWMS
• David Bedford attended the regional meeting last week. It was a combined meeting of the three zones at the Temuka Marae attended by 60 or 70 people. The main discussion was regarding the South Canterbury infrastructure and water management.
• There has been a lot of work in the area and project "Raindrop" in Lees Valley catchment (Ashley and Waimakariri area) may still be an option for water storage.
• There will be a LWQ meeting next month to discuss recreational water activities and biodiversity as they are the new work stream for ECan.
Other meeting and activity updates
• John Faulkner reported that he was on the ECan assessment panel to consider the Amuri Irrigation Company (AIC) Management Plan. This plan was accepted today and marks a significant milestone for the Zone Committee, which should be very proud that AIC have reached this position. John Faulkner was very impressed with the AIC Management Plan and the depth of knowledge of the HWRRP.
• Norm Williamson reiterated the significance of the achievements for AIC over the last three years and thanked the Zone Committee and ECan for their support and assistance.
• Independent Waiau Irrigators and AIC have a memorandum of understanding (MoU) as a means to move forward. John Faulkner will forward a copy of the MoU to the Zone Committee.
• The challenge for the Zone Committee now is to have every other land user
3

to commit to their Farm Plan timetable by 2017.
Verbal Report from Andrew Harris
Andrew Harris gave a verbal report on the SFF project. Mayor Winton Dalley commented on the report and expressed concerns that the Zone Committee has not done enough to resolve the issues surrounding the dryland farmers in the ZIP.
Norm Williamson commented on the issue of transparency that Andrew Harris had referred to in his report by saying NTFE, HWP, AIC have had discussions on how to work within the plan and that the information will be made public in due course.
It was agreed that Andrew Harris submit an update of the SFF project each month.
2. Project proposed for Immediate Steps Biodiversity Fund
Jean Tompkins (Environment Canterbury) spoke to her report.
Jean Tompkins explained that the purpose of the Immediate Steps Programme is to protect and restore freshwater biodiversity and water-use affected terrestrial biodiversity targeting priority areas in Canterbury. She explained how the funding has been utilised and requested further funding to control Woody Weed and complete restoration work at Conical Hill, Hanmer Springs.
Ken Hughey and Raewyn Solomon declared a conflict of interest.
Discussion following the report:
The Hanmer Wetland restoration project is being proposed by the Conservation Trust. The plan for the area east of Conical Hill will require ongoing maintenance as part of a larger strategy proposed for the reduction of wetlands. There is a set of defined outcomes and a management plan that requires funding of $5,000 initially for the wetlands, then a few thousand dollars for smaller ongoing projects.
Mayor Winton Dalley said while he is supportive of the project in general, he would like to see the funding used for the true purpose of the fund. The true purpose is targeted towards protecting and restoring the region’s biodiversity that has changed over the years due to intensified land and water use. He said there are many opportunities to better utilise the ratepayers’ funding and the Zone Committee welcome ideas for larger projects that will have a larger impact on the issues surrounding water quality.
The Zone Committee need to be more proactive and communicate with those farmers who show interest and want to help with private enhancement schemes.
Jamie McFadden told the committee that work on the wetland areas has increased and that farmers want to retain the funding for their own properties.
The application process for funding should be made easier to encourage further biodiversity projects.
THAT THE COMMITTEE ACCEPTS THE PROPOSAL FOR FUNDING FOR THE CONSERVATION TRUST (TE TIHI O RAUHEA) TO CONTROL WOODY WEED AND RESTORE THE LAND EAST OF CONICAL HILL IN HANMER SPRINGS.
Faulkner/Hodgen CARRIED
4

Ken Hughey and Raewyn Solomon abstained from voting.
3. Letter from Hurunui SNA Group
The SNA group wrote to the Hurunui-Waiau Zone Committee to ask specific questions surround the requirement of farm plans as a tool to improve land and water management.
Fran Perriam asked the committee the purpose of gathering the information about Significant Natural Areas as it is private information about individual farms. She said that in the past, the information gathered from land owners was used by district councils for geological and regulatory purposes without land owners’ knowledge or authority. Land owners want to know where this information is now going to be stored and who can access it.
Fran Perriam asked the committee to clarify the meaning of Farm Environment Plan (FEP) in regard to existing “exotic vegetation” in the SNA plan. As it seems the plan is forcing people into a situation of regulatory control over biodiversity. A positive outcome on biodiversity cannot be achieved by compulsion or by stealth as it encourages people to consider falsifying their private information.
Discussion followed:
Jamie McFadden commented that there is no voluntary option for land owners in this process as the FEP is deemed mandatory by 2017. If there was a voluntary option to join a collective, most land owners would have a more positive outlook on the FEP and feel comfortable sharing information about their land. In the past land owners could not trust the system as their private farm information was shared with government bodies.
Vince Daly asked the committee what happens to the information provided by the FEP. Ian Whitehouse replied that to his understanding, the results of the environment plans are used by the collective, not the plans themselves, unless it is part of resource consent. The options are to join a collective and the information stays within that body, or don’t join and ECan may access and use that information.
Jamie McFadden explained a third option is for the district council to have access to a compulsory SNA assessment provided by the land owner. He stated that the whole plan needs more consideration.
Fran Perriam stated the SNA zones are becoming exponentially larger to incorporate what ECan consider a SNA, as ECan have introduced buffer zones that severely restrict farm activities.
Raewyn Solomon stated that the committee would want notification of any removal of indigenous SNA, to better monitor water quality. She said without the existing regulations water quality would be in a worse state than it is now.
The information that ECan collects on this would only be statistics, not direct private land owner's information.
Mayor Winton Dalley said landowners and ECan are at a stalemate regarding credit for a protected area from a riparian area and through to landscape. Hill country farmers could have a credit to their nutrient budget, which is a credit and not a liability. More unconventional options need further investigation.
5

The Committee adjourned for a break at 5.05pm.
4. Results From Water Quality Monitoring In Jed Catchment
Elaine Moriarty (ESR) spoke to her presentation
This report summarised the microbial analysis that has been carried out on the Jed River over the past nine months in 2014.
The State Highway 1 site tested high concentrations of bacteria two out of three times.
Elaine Moriarty gave a demonstration of the water sample testing kit which is used in disaster zones to test for water contaminants. The kit costs $15.00 per test. She said she is still investigating funding options so that anyone can have a kit to test their local water.
Discussion following presentation:
Ducks seem to be the predominant contaminants of water, due to autumn and winter food sources. Different sources from various birds have different risk, although human to human contamination is a higher risk.
Septic tank over flow can also be responsible for contamination. There has been a recent survey in Darfield where it was found waste water was a major source of contamination.
5. Hurunui Nutrient Working Group
At the 22 September 2014 meeting the Zone Committee agreed to establish a working group to address issues raised by Dryland farmers in relation to the fairness of the nutrient management provisions of the HWRRP.
This working group will provide updates to the Zone Committee following each working group meeting and will make its recommendation(s) to the Zone Committee meeting in March 2015.
Discussion took place after the presentation. The main points made included:
• The main concern for the working group is unravelling regulations that have already been established in the ZIP. Plan changes we will need to be very clear and concise as this has the potential to require community and legal litigation to resolve these issues.
• Some of the identified issues may need a quicker solution and if the scope is too wide the remedies become complex and expensive to resolve.
THAT THE ZONE COMMITTEE FORMALLY ESTABLISH THE HURUNUI-WAIAU AND JED NUTRIENT WORKING GROUP AS A SUBCOMMITTEE OF THE ZONE. COMMITTEE.
Hughey/Hawke CARRIED
The Zone committee appointed Mike Hodgen, John Faulkner, Vince Daly and, James McCone as members to the Hurunui-Waiau and Jed Nutrient Working Group. John Faulkner submitted his apologies for the next meeting.
THAT THE COMMITTEE ACCEPTS MIKE HODGEN, JOHN FAULKNER, VINCE DALY AND JAMES MCCONE AS MEMBERS OF THE WORKING GROUP.
6

Dalley/Hughey CARRIED
The role of the Zone Committee members is to observe the group and to provide guidance to other community members.
6. Hurunui-Waiau Zone 5-year Implementation Outcomes and Milestones
Further discussions on the outcomes and milestones for each Zone catchment.
Discussion of the outcomes and milestones:
Norm Williamson commented that outcome 2 is a large audacious goal but it was inappropriate that the goal is to be 25% better than Good Management Practice (GMP) as this is unchartered ground and there was not yet enough information to understand all the facets. The matrix is what the industry recommends and this has already been taken into account.
Raewyn Solomon stated that if it was not viable to decrease contamination then farmers would not do it. She also asked for clarification on the GMP.
Milestone 2, outcome 2 requires a discussion with DairyNZ regarding what winter grazers can do. What other issues will come up in the future. Ian said he will revise the DairyNZ wording to give clarification on the intentions of the outcome.
Outcome 8 was discussed further, as it is unclear what the Hurunui-Waiau Zone Committee mandate is.
Some dairy farmers are planting massive amounts of trees that has not been recorded anywhere. Jamie McFadden has been planting streams with poplar trees to negate erosion as a large part of hill country waterways FEPs.
Jamie McFadden is already assisting farmers with biodiversity solutions, which will now be fully supported by the committee and submit regular updates to the committee on further progress and any other project initiatives he becomes aware of.
Winton commented that the landowner should be assisted and encouraged to participate in cleaning the waterways. The committee need to know which farmers are working on this privately to ensure they have all the necessary support. Funding for these projects could be accessed from the QEII covenant, Environment Canterbury funds and Department of Conservation funds.
A comment from the public was to look at options to release baby salmon to the streams as this will help clean the waterways.
Outcome 3, milestone 4 - the year 2017 seems the right time for the FEP’s to be completed. Most farmers do not understand the requirements of a FEP and the impact on them to have a completed plan. A simple plan and information sheet needs to be written and sent to all farms within the zone.
Ian Whitehouse will revise the comments and opinions to rewrite the implementation outcomes and milestones.
THAT THE COMMITTEE ACCEPTED THE CHANGES MADE TO THE HURUNUI WAIAU ZONE IMPLEMENTATION OUTCOMES AND MILESTONES DRAFT PLAN, AND THAT THIS WILL BE SUBJECT TO AN ANNUAL REVISION.
Hughey/Hawke CARRIED
Meeting Ended 6.54pm
7
8

9
10

11
To the Hurunui Waiau Zone Committee, Our questions we previously sent to the Hurunui Waiau Zone Committee remain unanswered. In terms of SNAs the written staff response [in the report to the Zone Committee] said the nature of native vegetation remnants on a farm has a relationship to water issues so why is only SNA vegetation that is required in a farm plan? Regarding farm plans audit requirements can you please clearly outline all actions that will be taken by ECan in monitoring the quality [or otherwise] of the audits. Yours sincerely, Fran Perriam Hurunui SNA Group
12

Hurunui Nutrient Working Group Meeting 1 Hawarden Rugby Club Rooms 14th October 2014 MEETING NOTES In attendance (refer register) Apologies David Eder Edwin Jansen Ken Hughey Paul Reese Shaun Burkett Tom Costello James Ryan Doug Rankin Nick Ensor Rebecca Donderman Andy Gardener Hugh Robinson Richard and Mes Power Raewyn Solomon Makarini Rupene Tom Macfarlane Tom Maxwell Hamish McRae Andrew Benton Introduction John Faulkner made the following introductory comments:
• Acknowledged, on behalf of the Zone Committee, the problems with the use of a ‘10% increase’ flexibility criteria above which land use change is determined to occur.
• Acknowledged also that there is now awareness by everyone that management of nutrients is not simply a dairy farming issue.
• Thanked James Hoban, Lynda Murchison, and Dan Hodgen for their efforts to bring the concerns of the community forward in a productive way.
• Expressed faith in the collaboration and consensus approach as a way to deal with community issues, but made it clear that time and a willingness to accommodate the point of view of others is essential to success.
• We can not and should not be tempted to go down any pathway or behavior that results in turning irrigated farmers against dryland farmers.
• We have a load limit on the Hurunui (which is full) and an allocation method (which is not working).
• The recommendation of the working group may result a change of the plan, with all this involves (time, cost, and risk to and effort by the community). Anything that goes through a plan change must be robust (legally and technically).
Dan Hodgen emphasized that it will be important to be careful of emotive commentary derailing the process, and to maintain productive conversation throughout. Dan also emphasized that, despite some signals in the media that the ECan Commissioners support
13

what the community is doing. It will also pay to be mindful that a working group will be expected to work in terms of getting through information and finding solutions. The group must also include representation from all sectors/groups of interested parties. Ian Whitehouse introduced the agenda.
• Outline of the current planning framework. • Update on water quality (N+P) concentrations and loads. • Draft Terms of Reference. • Next steps, further meetings, group structure, appointment of a chair.
How the plan works – Andrew Parrish Andrew Parrish gave a presentation on how the plan works across the Hurunui, Waiau, Jed, Conway, and Waipara catchments. He explained the differences between pLWRP requirements (for the Wapara and Conway) and those for the Hurunui-Waiau. He also outlined how the load limit of 963 t/yr of N for the Hurunui at SH1 was set, and how farmers in the Waiau and the Jed are not in the same boat for the time being because these rivers don’t have a load limit. Andrew acknowledged that the approach of using an in-river load to manage development, with a ‘10% increase’ trigger for land use change and an assumption that loads will come down as farm practice improves, would not be considered an appropriate way to provide for flexibility if the plan were reviewed. Lynda Murchison noted that the Ngai Tahu Property Application to convert Balmoral was a test of the plan in that it demonstrated that there is no ability to further intensify production once the load limit is reached. Andrew went on to note that as we developed the plan we worked on the assumption that a 50% reduction was feasible for some farmers. John Faulkner commented that a modeled 50% reduction was achieved on his farm by going from rotor-rainers on 13 day rotation to a linear with more frequent returns, but took pains to emphasize that not everyone is in a position to achieve a reduction of this magnitude. Hurunui and Waiau nutrient load and concentration limits – Tim Davie Tim Davie outlined how the Hurunui-Waiau Regional Plan sets nutrient loads and concentrations, and how they are both needed to achieve a workable plan:
• A load to allocate to users; • A concentration to set an acceptable limit.
The P load for the Hurunui (expressed as a rolling average) has been breached following a year of unusually high rainfall. The N load is almost breached, and will in fact be exceeded once the N load allocated to HWP takes effect. Notably loads have increased even though low-flow phosphorus concentrations are declining (presumably as a result of improved farm practice). It was expected that phosphorus concentrations at all flows (and loads) would decrease with time. Phil Smith endorsed this comment in that he really would have expected improvements in the load following the significant improvements made on farm over the past few years in terms of converting borderdike-to-spray and stream fencing. It was noted that in other places in Canterbury (i.e. South Canterbury Coastal Streams), the load has been allocated back to farms, based on the river loads. The Hurunui-Waiau was
14

done well ahead of the other sub-regional plans and with some urgency due to the moratorium, and was not supported by the level of understanding of later plans. A number of questions from the audience followed (paraphrased): Why is more frequent monitoring not done to achieve a better understanding of the river (which we appear to need)? Tim responded that ECan are trying to achieve the best balance of cost and effectiveness over all of Canterbury in the long term. Is it justifiable, in terms of the river system to only consider lower flows when calculating loads? Tim responded that this is being looked at by an expert group, but noted that high flow periods play a role in ‘redistributing’ P within the river and bringing sediment out of tributaries/drains, so does not see it as valid to dismiss high flows. How can we be in this situation given how good the river looks, with high abundance of salmon and trout compared to local’s experience of how it has been in the past? Tim responded that there was a noticeable change in the mid 90’s to 2000’s, particularly around periphyton, but things have been OK since then. There has never been an issue with nitrate toxicity. There may also be an issue with lag times – the residence time of N in groundwater in the Culverden Basin is up to ten years. Will a phosphorous load be put in place in the Waiau? The Waiau may not require a river load limit for phosphorous at this time because it has more flushing flows so periphyton is less of an issue. I thought that there was some discussion around this point and ecan staff (whit and I highlighted that this was to occur in 2018. Some form of water quality limit will need to be provided for the Waiau River to comply with the NPSFW2014. I may be that the existing limit in the plan is suitable but the research has not been done yet. Draft Terms of Reference Scope A key question to consider was the scope of the working group or how far the community would want to go with the plan change. Scope of course relates to cost. Even very simple plan changes are expected to cost around $500,000. Costs increase with the level of complexity or controversy. Lynda Murchison commented that there are essentially two issues or key problems with the plan, and that the working group needs to decide which of these it wants to pick up:
1. The lack of a ‘flexibility cap’ which doesn’t allow dryland farmers to undertake even moderate intensification;
2. The inability of those who have access to water to convert to a higher N-loss land use.
Lynda considered that the first issue can probably be resolved without altering the fundamentals of the plan such as nutrient concentrations. The second issue is more complex (and more costly) to deal with because it will require taking another look at concentrations, and adjustments required to create headroom.
15
There appeared to be general agreement with Lynda’s analysis. Substantial scientific and technical input will be required to pursue the second option. Any revisions of catchment limits must give effect to the NPS for Freshwater (2014), which will be tougher to comply with than the 2011 NPS. The status of the working group There was some concern expressed about the status of the working group given some of the signals that have been expressed in the media – in other words are we wasting our time? Winton Dalley responded that David Bedford and the ECan staff would clearly not be present and assisting this process if it was not agreed on by the Commissioners. David Bedford supported this comment, emphasizing that the ECan people would not be present if the Commissioners were paying the process lip service. He also outlined the history of support by the Commissioners for the philosophy of the Canterbury Water Management Strategy and endorsing the recommendations from community-led governance of water resources through the Zone Committees. Rounding off the meeting and further steps Scott Pearson acknowledged the issues faced by dryland farmers, but stated that Fish and Game does not support a plan change. The organisation is however willing to look at how the 10% rule is interpreted, possibly allowing for 3-4 year averaging (this is done with the nitrogen loss calculation in the pLWRP, but in the HWRP it is an absolute). Lynda indicated that she is reasonably confident that getting an A-band (a flexibility cap) in the plan is achievable without compromising N limits in the plan or the high N emitting farmers. There is however an outstanding issue with Ngai Tahu Property and others with capital committed and permission that allow irrigation, but who can’t do it due to N-limits, which will be complex and costly to resolve. It is fine for the working group to work on both, but it is recommended dealing with them as ‘bite sized chunks’ (a 2 stage process) to keep things manageable. The following was suggested as a purpose statement that reflected the key concerns expressed in the meeting and over the past few months:
Recommend a solution to the Zone Committee for the dryland farmers who are constrained by a lack of flexibility to create headroom within the catchment.
Some participants believed this did not go far enough and wanted the Working Group to address the scientific basis of the limits and to look at the whole approach to managing water quality and nutrients in the plan. Sam Zino proposed that the way forward was for the Working Group to start with finding a solution to the concerns raised with regards the “10% rule” while being open to consideration of changes that might be required to the limits and approach to managing nutrients in the plan. This statement appeared to be a good place to leave things, but will need further discussion. It was agreed that the next meeting will take place in Cheviot, on a Tuesday at 7:00 pm, in 3-4 weeks. It is expected that there will be a functioning working group after this meeting.
16
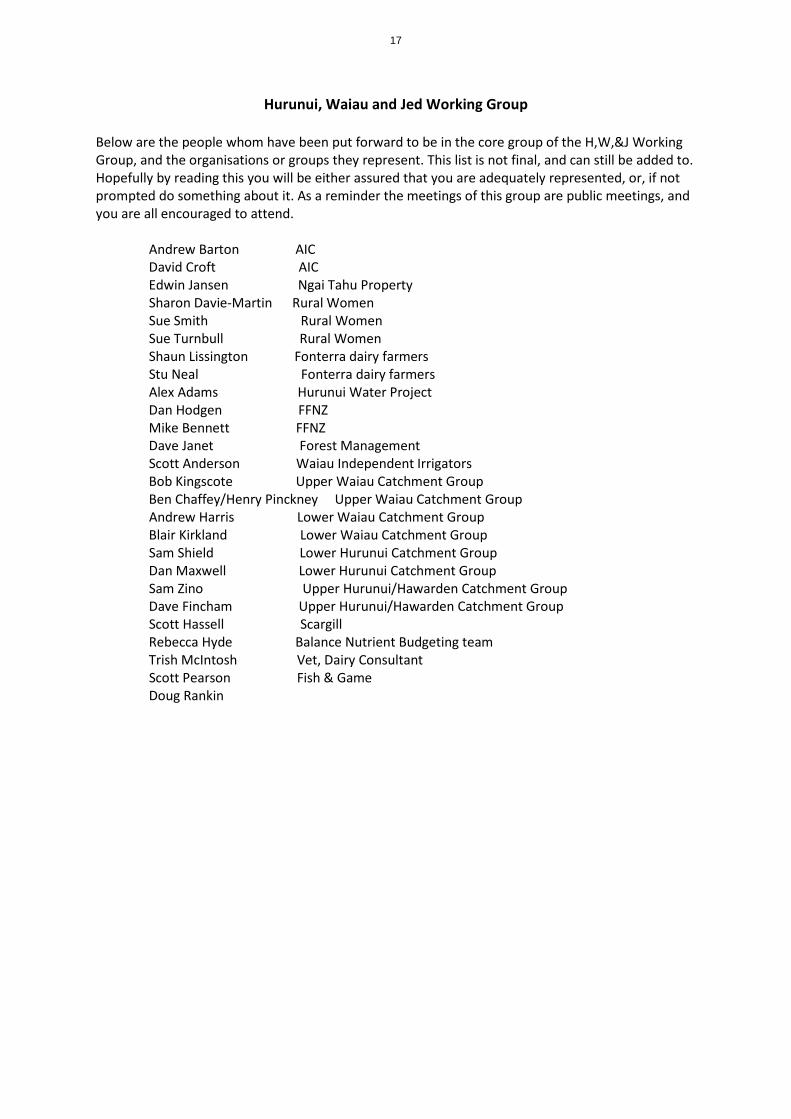
Hurunui, Waiau and Jed Working Group
Below are the people whom have been put forward to be in the core group of the H,W,&J Working Group, and the organisations or groups they represent. This list is not final, and can still be added to. Hopefully by reading this you will be either assured that you are adequately represented, or, if not prompted do something about it. As a reminder the meetings of this group are public meetings, and you are all encouraged to attend. Andrew Barton AIC David Croft AIC Edwin Jansen Ngai Tahu Property Sharon Davie-Martin Rural Women Sue Smith Rural Women Sue Turnbull Rural Women Shaun Lissington Fonterra dairy farmers Stu Neal Fonterra dairy farmers Alex Adams Hurunui Water Project Dan Hodgen FFNZ Mike Bennett FFNZ Dave Janet Forest Management Scott Anderson Waiau Independent Irrigators Bob Kingscote Upper Waiau Catchment Group Ben Chaffey/Henry Pinckney Upper Waiau Catchment Group Andrew Harris Lower Waiau Catchment Group Blair Kirkland Lower Waiau Catchment Group Sam Shield Lower Hurunui Catchment Group Dan Maxwell Lower Hurunui Catchment Group Sam Zino Upper Hurunui/Hawarden Catchment Group Dave Fincham Upper Hurunui/Hawarden Catchment Group Scott Hassell Scargill Rebecca Hyde Balance Nutrient Budgeting team Trish McIntosh Vet, Dairy Consultant Scott Pearson Fish & Game Doug Rankin
17

Hurunui, Waiau & Jed Nutrient Working Group Second Meeting
Tuesday, 28 October 20014 Cheviot Community Centre
1. Apologies: Apologies from John Faulkner, David Eder, Andrew Harris, John & Vicky Stainton, Becs Dontermann, Shaun Burkett, Vince Daly, Dave Mackenzie, Scott Hassle Michael and Solreig Northcote, Stu Neill, Tom MacFarlane, Mike Hodgen, Paul Reese, Mike Bennett.
2. Outline of Meeting
James McCone (Zone Committee) and Dan Hodgen (Federated Farmers) opened the meeting. Dan outlined the nights agenda and emphasised that the group is here tonight to specifically decide on a Chair and Deputy Chair, identify possible solutions to the ‘10% rule’ issue and to discuss the scope of the working party.
3. Nominations for Chair & Deputy Chair
James Hoban spoke on behalf of a group of 25 farmers and put forward Ben Ensor for Chair and Sam Zino for Deputy Chair. James identified that the Chair needs to be well informed, committed and willing.
The comment was made that it is important the chair has an understanding of the Zone Committee process. It was then recommended that Mayor Winton Dalley be nominated for the role of Chair.
Mayor Dalley spoke to this and advised that he doesn’t have the time to undertake the role and wouldn’t be able to give it what it needs. Mayor Dalley would prefer to see a community member in the role of Chair.
Ben Ensor addressed the working party, saying that he is a local farmer, it is his home and he is keen to see a good outcome for the community. Ben has been to a few Zone Committee meetings. Ben said he understands the Chair will need to develop a good knowledge of the Zone Committee and the issues.
Whit noted there will be technical support provided to the working party from Environment Canterbury. In addition Whit will act as a facilitator for the working party and support whoever is elected as Chair.
A participant raised the perception that there is an ‘us & them’ (dryland farmers & dairy farmers) attitude and asked whether it would be better with an ‘outsider’ chair? Mayor Winton advised that the role of the chair can be done impartially. Whit mentioned that it’s a consensus arrangement and is not about a solution favourable to
18

one. All must be able to live with it so there cannot be an ‘us and them’ – everyone must be comfortable with the Working Group’s solution.
The idea of appointing an interim chair was raised and briefly discussed.
It was noted that there will be zone committee members on the working group that can provide support to the chair.
In addition, if the working group gets going and there is dissatisfaction with the Chair, this can be dealt with by the Working Group at that time.
Marie Black asked how wide is the working group going to be? Whit confirmed that everyone in the room can be involved in the working group.
Appointment of Chair
Whit asked the group if anyone is not comfortable with the nomination of Chair & Deputy Chair. No one raised concern at this point.
Ben Ensor appointed as Chair and Sam Zino appointed Deputy Chair.
Ben Ensor spoke to the group. He said a draft proposal of the scope was tabled at Hawarden and tonight the group needs to get a clearer picture on what to do. The group needs to keep moving forward and find solutions to the 10% rule issue.
4. Presentation by Peter Brown (Aqualinc) – ‘Estimating Nitrogen Losses in the Hurunui Catchment’
Peter spoke to his powerpoint presentation & handout. A copy of this has been sent to people on the Working Group email list.
Questions raised:
• Land & Water Regional Plan has no rules regarding slopes until 25 degrees. Can the group have further information/explanation on this?
• If below SH1 are you affected by the plan? Andrew Parrish answered: No, if you are below SH1 you are not affected by the10%-rule in the plan. No load has been set below SH1 so depending on the land use it is a permitted or discretionary activity.
• Is the data within the presentation universally accepted? Peter Brown answered: Yes, accepted by HWP, AIC & Ngai Tahu.
• How accurate is the data? Peter Brown answered: Reasonably accurate. If you are after very accurate data it requires lots of dollars.
5. Identifying possible solutions to the ‘10% rule’ issue – ideas only
19

Participants were given the opportunity to identify ideas to solve the ‘10% rule’ issue. The following ideas were tabled:
Andrew Barton – AIC AIC worked out their scheme load and estimate they are losing 950 tN/yr at the moment, this could be reduced down to 900tN/yr through improved water efficiency and improved management practices this will free up 50tN/yr (though will take a little time to deliver). This could be available for dryland farmers to address the 10% rule issue. Andrew clarified that the losses were estimates of the below-root zone N losses (not the load to the river). Andrew and Norm Williamson also explained that the Irrigation Management System Strategy for the AIC Nutrient Collective that has just been approved by Environment Canterbury (as required under Schedule 2 of the plan) requires all members of the AIC collective to meet the good management practice loss rates (as defined by the Matrix of Good Management (MGM) project). This means that their farmers will not be able to intensify by 10%. Lynda Murchison – Environmental Planner Two key issues identified 1) 10% rule effecting farmers with less leaching losses 2) N and P load limits and how they match long term concentrations The first issue could be addressed by re-distributing the 10% allowance, this would require a plan change and could possibly slip in with the LWRP plan change ECan has scheduled for May 2015 though this is a very tight timeframe. The second issue is much bigger and would require a separate work stream. James Hoban & Andrew Barton Dryland farmers form a collective with their own EMS allowing for a more flexible cap while P is managed. Scott Pearson – Fish & Game Manage within limits for the period 2015 – 2019 using a long term average of 10% Over a four year period, in any given year a farmer can go above the 10% provided that their 4 year average stays below 10%. Edwin Jansen – Ngai Tahu Properties Edwin proposed a short term and long term solution. The following summary was provided by Edwin via email dated 29/10.14. “Short Term (the next 18 months)
• Request ECan review the methodology of determining whether the current load (last 5 years is higher or lower than the 2005-2011 load limit. This requires an assessment of the current load relative to the 2005-2011 load after removal of all river flow differences.
20
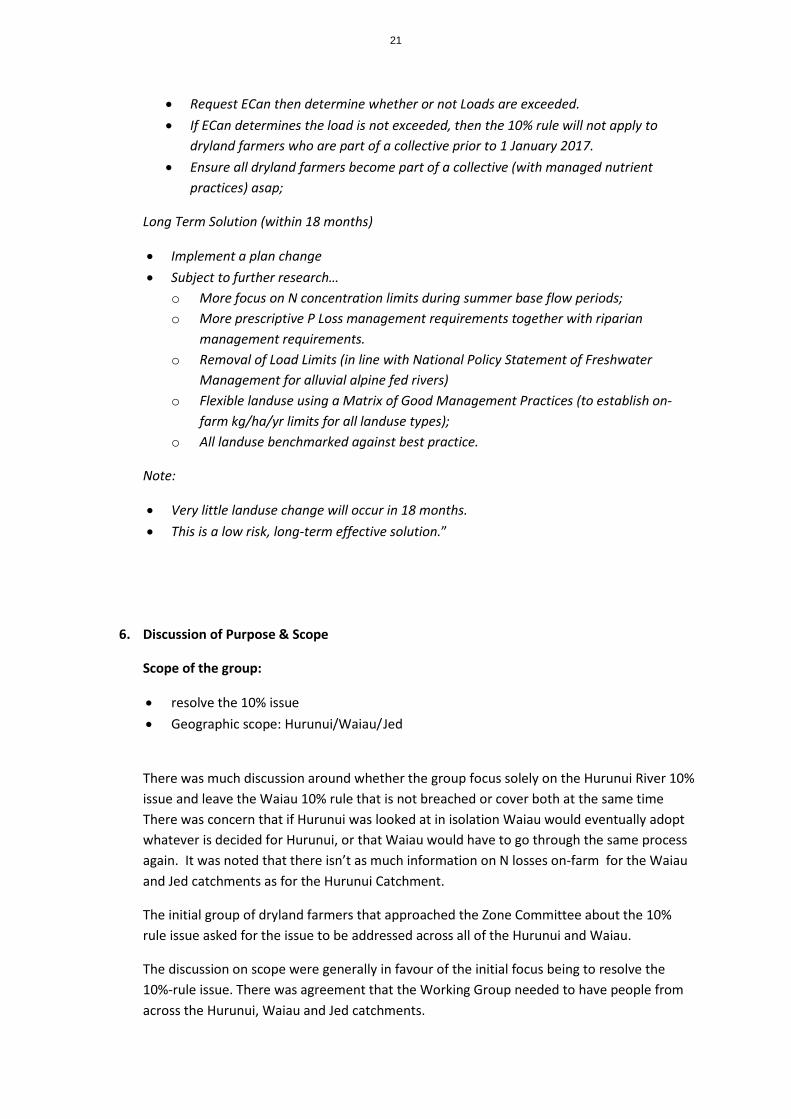
• Request ECan then determine whether or not Loads are exceeded. • If ECan determines the load is not exceeded, then the 10% rule will not apply to
dryland farmers who are part of a collective prior to 1 January 2017. • Ensure all dryland farmers become part of a collective (with managed nutrient
practices) asap;
Long Term Solution (within 18 months)
• Implement a plan change • Subject to further research…
o More focus on N concentration limits during summer base flow periods; o More prescriptive P Loss management requirements together with riparian
management requirements. o Removal of Load Limits (in line with National Policy Statement of Freshwater
Management for alluvial alpine fed rivers) o Flexible landuse using a Matrix of Good Management Practices (to establish on-
farm kg/ha/yr limits for all landuse types); o All landuse benchmarked against best practice.
Note:
• Very little landuse change will occur in 18 months. • This is a low risk, long-term effective solution.”
6. Discussion of Purpose & Scope
Scope of the group:
• resolve the 10% issue • Geographic scope: Hurunui/Waiau/ Jed
There was much discussion around whether the group focus solely on the Hurunui River 10% issue and leave the Waiau 10% rule that is not breached or cover both at the same time There was concern that if Hurunui was looked at in isolation Waiau would eventually adopt whatever is decided for Hurunui, or that Waiau would have to go through the same process again. It was noted that there isn’t as much information on N losses on-farm for the Waiau and Jed catchments as for the Hurunui Catchment.
The initial group of dryland farmers that approached the Zone Committee about the 10% rule issue asked for the issue to be addressed across all of the Hurunui and Waiau.
The discussion on scope were generally in favour of the initial focus being to resolve the 10%-rule issue. There was agreement that the Working Group needed to have people from across the Hurunui, Waiau and Jed catchments.
21
Timeframe:
Lynda Murchison said Environment Canterbury has advised her that there is the ability to put through a plan change in May 2015. This would mean that the working group would need to have a solution to the 10% rule issue by around March 2015 and the Zone Committee would need to make a recommendation to ECan at their March 2015 meeting.
Mayor Dally pointed out by having a narrower scope the group is more likely to meet the deadline.
Working Party Size:
There needs to be a broad representation on the working party. There needs to be continuity of people. Ben Ensor asked that the different “groups” put forward 2-3 people to be on the “core” working party. Names are to be emailed to Whit or Ben before the next meeting.
People not on the “core” working party are encouraged to still come along to the meetings. The working party will operate as similar to the zone committee – everyone in the room has a voice.
Meeting Venues:
It was agreed by the working group that meetings be rotated at various locations around the District.
Meeting closed at 9:30pm
22
Immediate Steps Programme Update Agenda item no: Hurunui-Waiau Zone Committee Meeting 17th November Subject Hurunui- Waiau Zone Committee Immediate Steps Fund – Update
& project consideration
Authors Jean Tompkins, Biodiversity Officer
Action sought Determine funding allocation for an IMS project proposal
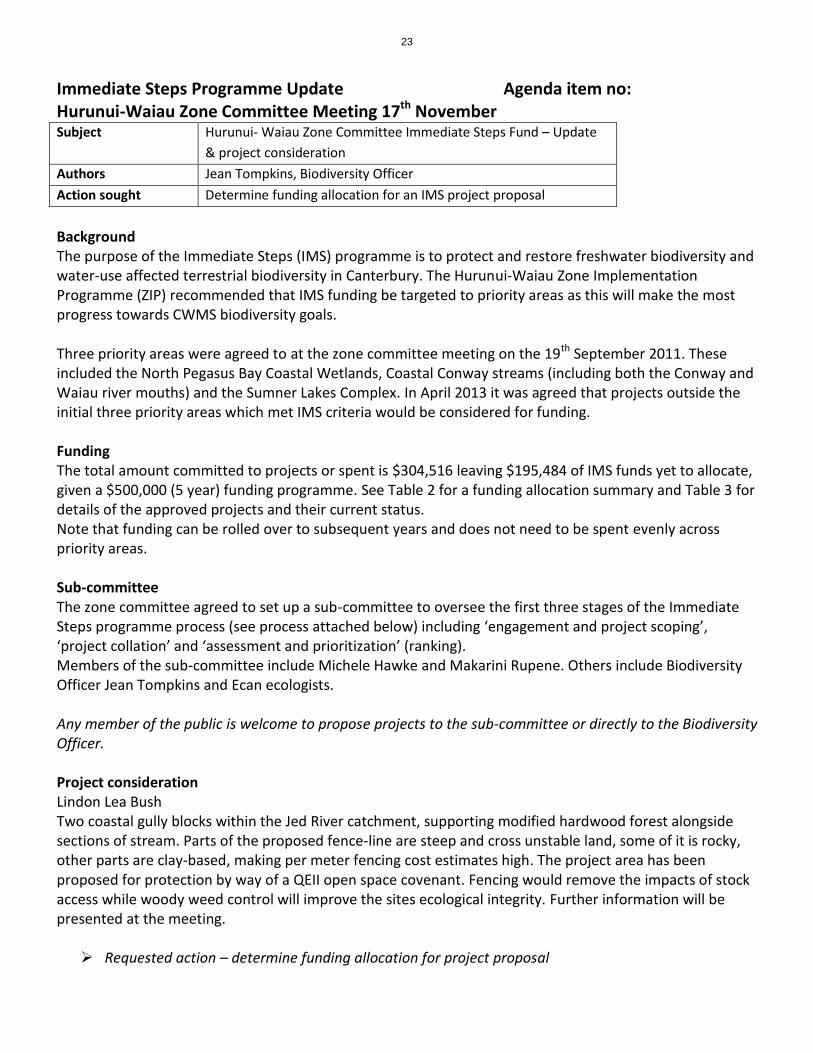
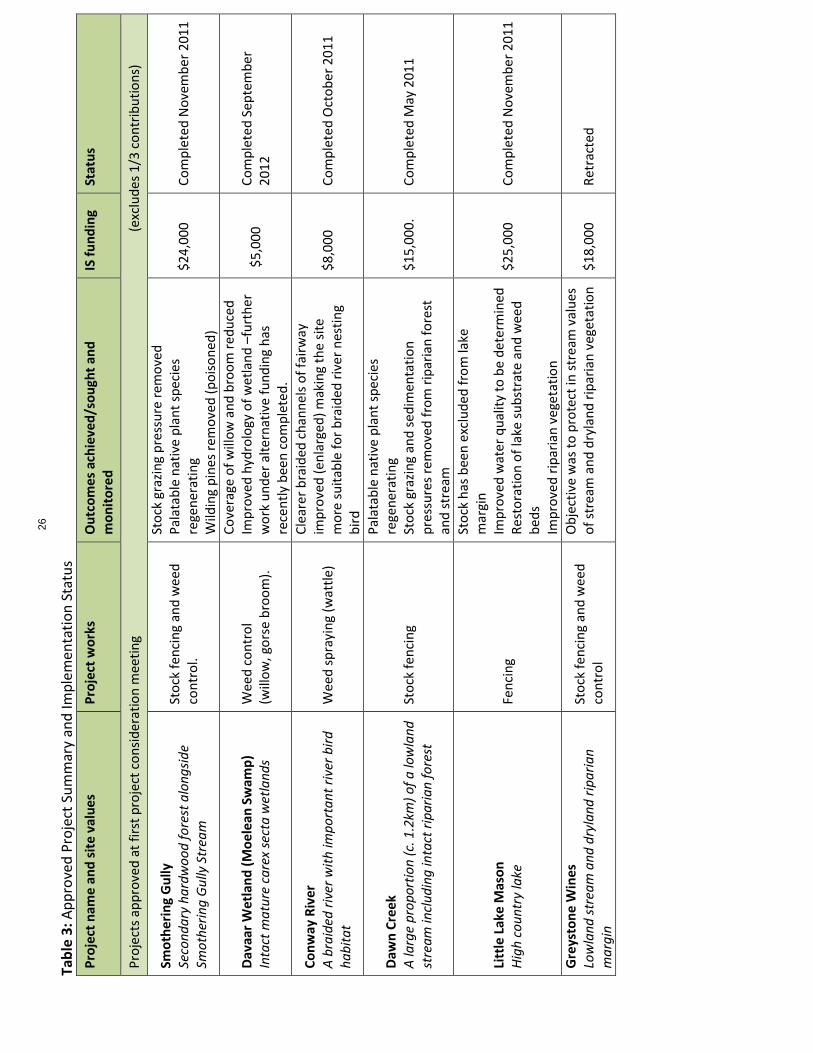
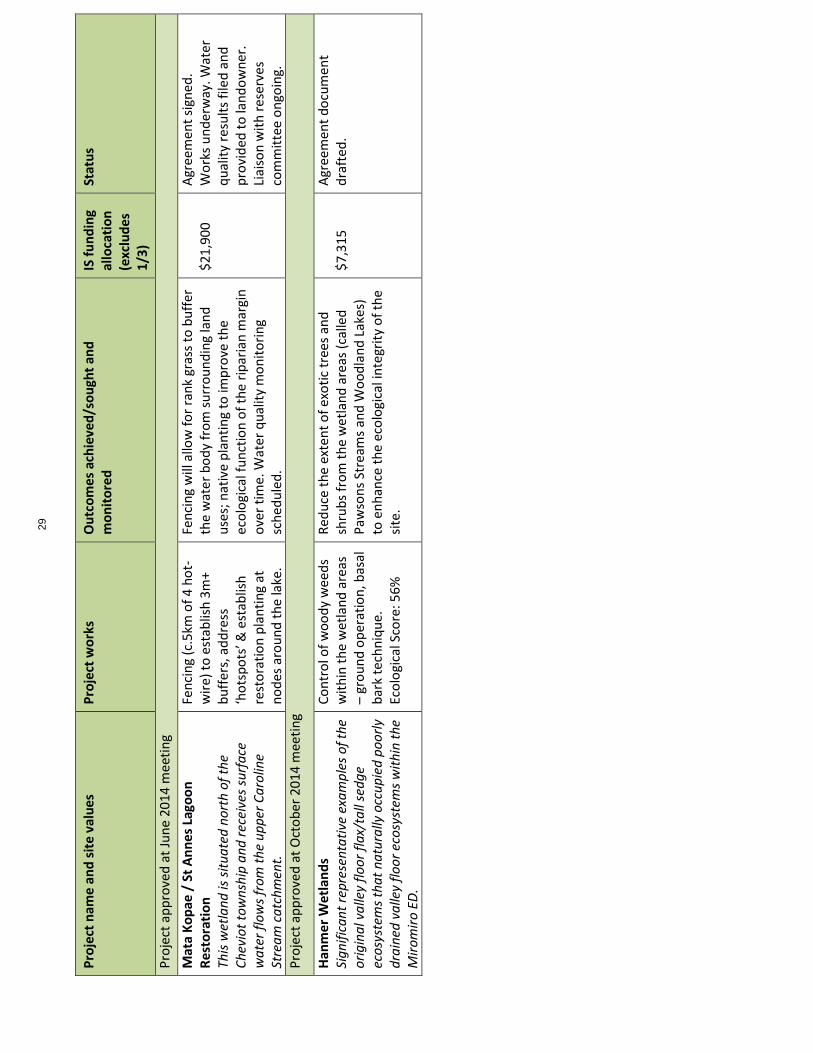
Background The purpose of the Immediate Steps (IMS) programme is to protect and restore freshwater biodiversity and water-use affected terrestrial biodiversity in Canterbury. The Hurunui-Waiau Zone Implementation Programme (ZIP) recommended that IMS funding be targeted to priority areas as this will make the most progress towards CWMS biodiversity goals. Three priority areas were agreed to at the zone committee meeting on the 19th September 2011. These included the North Pegasus Bay Coastal Wetlands, Coastal Conway streams (including both the Conway and Waiau river mouths) and the Sumner Lakes Complex. In April 2013 it was agreed that projects outside the initial three priority areas which met IMS criteria would be considered for funding. Funding The total amount committed to projects or spent is $304,516 leaving $195,484 of IMS funds yet to allocate, given a $500,000 (5 year) funding programme. See Table 2 for a funding allocation summary and Table 3 for details of the approved projects and their current status. Note that funding can be rolled over to subsequent years and does not need to be spent evenly across priority areas. Sub-committee The zone committee agreed to set up a sub-committee to oversee the first three stages of the Immediate Steps programme process (see process attached below) including ‘engagement and project scoping’, ‘project collation’ and ‘assessment and prioritization’ (ranking). Members of the sub-committee include Michele Hawke and Makarini Rupene. Others include Biodiversity Officer Jean Tompkins and Ecan ecologists. Any member of the public is welcome to propose projects to the sub-committee or directly to the Biodiversity Officer. Project consideration Lindon Lea Bush Two coastal gully blocks within the Jed River catchment, supporting modified hardwood forest alongside sections of stream. Parts of the proposed fence-line are steep and cross unstable land, some of it is rocky, other parts are clay-based, making per meter fencing cost estimates high. The project area has been proposed for protection by way of a QEII open space covenant. Fencing would remove the impacts of stock access while woody weed control will improve the sites ecological integrity. Further information will be presented at the meeting.
Requested action – determine funding allocation for project proposal
23

Table 1: Proposed project for funding consideration – Lindon Lea Bush
Project name Project details in brief Land tenure
Cultural Value
Ecological score
Funding requested (Total cost in brackets)
Lindon Lea Bush c.40ha of Modified-secondary hardwood forest, tree-land and scrub with occasional podocarps, surrounding scrub and shrubland in a steeply incised coastal gully of the Jed River.
Threat: Livestock access reducing persistence and regeneration of riparian and terrestrial palatable plant species. Some woody weed incidence reducing the site’s ecological integrity. Proposed activities: 4100m of fencing to remove stock access, isolated control of some woody weeds and establishment of a QEII covenant over the site. Comments from assessments: Despite a history of livestock pressure there are enough inaccessible micro-sites to support a range of representative species, thus there are good opportunities for the eventual recovery of a near-natural composition.
Private
TBA
64%
(Moderate) $72,247 ($36,123)
24

Table 2: Overview of funding allocation and spend to date for Hurunui IMS projects
Project Name Allocated Spent*
Smothering Gully $24,000 $24,000
Davaar Wetland $5,000 $5,000
Conway River $8,000 $5,893
Dawn Creek $15,000 $15,000
Little Lake Mason Stock $25,000 $22,340
Greystone Wines $18,000 $0 -retracted
Mimimoto lagoon –Stage 1 $28,590 $25,850
Mamaku bush –QEII (Silvery stream)
$31,765 $28,701
Raupo Pond $10,000 $10,000
Crichton’s Canyon $9,055 $9,055
Mimimoto Lagoon Stage 2 $42,131 $30,016
Kowai River Mouth Restoration
$29,000 $14,500
Waipara Lagoon $19,643 $0 – on hold
Inverness Stream $4,738.26 $4,738
Conway Stream $21,812 $13,412
Loch Katrine Spring $5,000 $5,000
Waiau River Predator Control $4,567 $4,567
Mata Kopae St Annes Lagoon $21,900 $0
Hanmer Wetlands $7,315 $0
Totals: $304,516 $218,072 (Greystone allocation removed
& adjusted for actual spends)
Total remaining to be allocated ($500,000 programme) $195,484
*Spent means paid to recipients or contractors. On the ground works may yet to be undertaken (i.e. QEII is paid up-front)
25
Tab
le 3
: A
pp
rove
d P
roje
ct S
um
mar
y an
d Im
ple
men
tati
on
Sta
tus
Pro
ject
nam
e a
nd
sit
e v
alu
es
Pro
ject
wo
rks
Ou
tco
me
s ac
hie
ved
/so
ugh
t an
d
mo
nit
ore
d
IS f
un
din
g
Stat
us
Pro
ject
s ap
pro
ved
at
firs
t p
roje
ct c
on
sid
erat
ion
mee
tin
g
(
excl
ud
es 1
/3 c
on
trib
uti
on
s)
Smo
ther
ing
Gu
lly
Seco
nd
ary
ha
rdw
oo
d f
ore
st a
lon
gsi
de
Smo
ther
ing
Gu
lly S
trea
m
Sto
ck f
en
cin
g an
d w
eed
co
ntr
ol.
Sto
ck g
razi
ng
pre
ssu
re r
emo
ved
P
alat
able
nat
ive
pla
nt
spec
ies
rege
ner
atin
g W
ildin
g p
ines
rem
ove
d (
po
iso
ned
)
$2
4,0
00
C
om
ple
ted
No
vem
ber
20
11
Dav
aar
Wet
lan
d (
Mo
elea
n S
wam
p)
In
tact
ma
ture
ca
rex
sect
a w
etla
nd
s W
eed
co
ntr
ol
(will
ow
, go
rse
bro
om
).
Co
vera
ge o
f w
illo
w a
nd
bro
om
re
du
ced
Im
pro
ved
hyd
rolo
gy o
f w
etla
nd
–fu
rth
er
wo
rk u
nd
er a
lter
nat
ive
fun
din
g h
as
rece
ntl
y b
een
co
mp
lete
d.
$5
,00
0
Co
mp
lete
d S
epte
mb
er
20
12
Co
nw
ay R
iver
A
bra
ided
riv
er w
ith
imp
ort
an
t ri
ver
bir
d
ha
bit
at
Wee
d s
pra
yin
g (w
attl
e)
Cle
arer
bra
ided
ch
ann
els
of
fair
way
im
pro
ved
(en
larg
ed)
mak
ing
the
site
m
ore
su
itab
le f
or
bra
ided
riv
er
nes
tin
g b
ird
$8
,00
0
Co
mp
lete
d O
cto
ber
20
11
Daw
n C
reek
A
larg
e p
rop
orti
on
(c.
1.2
km)
of
a lo
wla
nd
st
ream
incl
ud
ing
inta
ct r
ipar
ian
fo
rest
St
ock
fe
nci
ng
Pal
atab
le n
ativ
e p
lan
t sp
ecie
s re
gen
erat
ing
Sto
ck g
razi
ng
and
se
dim
enta
tio
n
pre
ssu
res
rem
ove
d f
rom
rip
aria
n f
ore
st
and
str
eam
$1
5,0
00
. C
om
ple
ted
May
20
11
Litt
le L
ake
Mas
on
H
igh
co
un
try
lake
Fe
nci
ng
Sto
ck h
as b
een
exc
lud
ed f
rom
lake
m
argi
n
Imp
rove
d w
ater
qu
alit
y to
be
det
erm
ined
R
esto
rati
on
of
lake
su
bst
rate
an
d w
eed
b
eds
Imp
rove
d r
ipar
ian
veg
etat
ion
$2
5,0
00
C
om
ple
ted
No
vem
ber
20
11
Gre
ysto
ne
Win
es
Low
lan
d s
trea
m a
nd
dry
land
rip
ari
an
m
arg
in
Sto
ck f
en
cin
g an
d w
eed
co
ntr
ol
Ob
ject
ive
was
to
pro
tect
in s
trea
m v
alu
es
of
stre
am a
nd
dry
lan
d r
ipar
ian
veg
etat
ion
$
18
,00
0
Ret
ract
ed
26

Pro
ject
nam
e a
nd
sit
e v
alu
es
Pro
ject
wo
rks
Ou
tco
me
s ac
hie
ved
/so
ugh
t an
d
mo
nit
ore
d
IS f
un
din
g
Stat
us
Pro
ject
s ap
pro
ved
at
the
Dec
emb
er 2
011
com
mit
tee
mee
tin
g
Mim
imo
to la
goo
n –
Sta
ge O
ne
R
egio
na
lly s
ign
ific
an
t co
ast
al l
ag
oo
n
Fen
cin
g, s
cho
ol p
lan
tin
g an
d w
oo
dy
wee
d c
on
tro
l R
edu
ced
wo
od
y w
eed
co
vera
ge
Ret
urn
of
rep
rese
nta
tive
pla
nt
spec
ies
Incr
ease
d c
om
mu
nit
y aw
aren
ess
$2
8,5
90
C
om
ple
ted
Ap
ril 2
01
3
(Mai
nte
nan
ce c
on
tin
ues
)
McF
arla
ne
Pro
per
ty –
Mam
aku
Bu
sh
A h
ill c
ou
ntr
y st
ream
incl
ud
ing
inta
ct
rip
ari
an
fo
rest
Fen
cin
g st
ream
an
d
exte
nsi
ve c
oas
tal r
ipar
ian
fo
rest
mar
gin
fro
m s
tock
. Q
EII c
ove
nan
t ap
pro
ved
.
Ret
urn
of
rep
rese
nta
tive
pla
nt
spec
ies,
incl
ud
ing
pal
atab
le s
pec
ies
Imp
rove
d r
ipar
ian
mar
gin
an
d
red
uce
d s
ed
imen
tati
on
inp
ut
to
stre
am
$3
0,0
00
U
nd
er
bu
dge
t b
y c.
$3
,00
0.
Co
mp
lete
d A
pri
l 20
13
Rau
po
Po
nd
A
n im
po
rta
nt
bo
dy
of
op
en w
ate
r w
ith
in
the
Sum
ner
La
kes
pri
orit
y a
rea
Will
ow
co
ntr
ol –
gro
un
d
op
erat
ion
(1
ha)
W
oo
dy
wee
d c
ove
rage
red
uce
d,
exte
nsi
ve e
ncr
oac
hin
g w
illo
w
rem
ove
d f
rom
po
nd
ed
ges
$1
0,0
00
C
om
ple
ted
Sp
rin
g 2
01
3
Pro
ject
s ap
pro
ved
at
the
Sep
tem
ber
17
th 2
012
co
mm
itte
e m
eeti
ng
Mim
imo
to la
goo
n -
Sta
ge T
wo
R
egio
na
lly s
ign
ific
an
t co
ast
al l
ag
oo
n
Fen
cin
g, r
est
ora
tio
n
pla
nti
ng
and
wee
d
con
tro
l. Q
EII c
ove
nan
t ap
pro
ved
. Ec
olo
gica
l Sco
re: 8
6%
Co
nti
nu
ed o
utc
om
es f
or:
R
edu
ced
wo
od
y w
eed
co
vera
ge
Ret
urn
of
rep
rese
nta
tive
pla
nt
spec
ies
Incr
ease
d c
om
mu
nit
y aw
aren
ess
$4
2,1
31
M
ajo
rity
of
pla
nti
ng
com
ple
ted
in
May
. Mai
nte
nan
ce o
f p
lan
tin
gs
con
tin
ues
; car
par
k w
ork
s u
nd
erw
ay; f
ollo
w u
p w
eed
co
ntr
ol s
ched
ule
d/c
om
ple
ted
. So
me
rab
bit
issu
es w
ith
pla
nti
ngs
. Sc
ho
ol v
isit
co
mp
lete
d A
ugu
st’1
4
Cri
ghto
n’s
Can
yon
–C
oas
tal C
on
way
Fe
nci
ng
of
4 h
a o
f ri
pa
ria
n b
ush
, in
clu
din
g
c. 0
.4km
of
a b
ran
ch o
f D
awn
Str
eam
kn
ow
n a
s C
rich
ton
’s C
an
yon
Fen
cin
g ri
par
ian
fo
rest
an
d s
trea
m. Q
EII
app
rove
d. E
colo
gica
l Sc
ore
: 72
% (
28
/39
)
Rem
ove
d s
tock
gra
zin
g p
ress
ure
Th
e n
ativ
e ve
geta
tio
n (
esp
ecia
lly t
he
pal
atab
le e
lem
ents
) w
ill r
eco
ver
and
re
cru
it
$9
,05
4.6
7
Lan
do
wn
er a
gree
men
t si
gned
. D
elay
ed; W
ork
s sc
hed
ule
d f
or
com
ple
tio
n b
y la
te 2
01
4 –
acc
ess
is
sues
in w
inte
r.
Ko
wai
Riv
er M
ou
th
Sig
nif
ica
nt
coa
sta
l lo
wla
nd
, in
ter-
du
ne
envi
ron
men
t, c
om
ple
men
tin
g s
om
e o
f th
e m
ost
imp
ort
an
t es
tua
rin
e a
nd
co
ast
al
inte
r-p
ha
se e
cosy
stem
s re
ma
inin
g o
n
Ca
nte
rbu
ry’s
ea
st c
oa
st
Res
tora
tio
n p
lan
tin
g an
d
fen
ce m
ain
ten
ance
(D
oC
ad
min
iste
red
lan
d)
Eco
logi
cal S
core
: 72
%,
28/
39
. Req
ues
ted
$
70,0
00
, ap
pro
ved
yea
r o
ne
acti
on
s.
Ret
urn
of
no
w r
are
vege
tati
on
as
sem
bla
ges
fro
m b
ack-
du
ne
we
tlan
d v
eget
atio
n t
hro
ugh
to
co
asta
l fo
rest
$2
9,0
00
C
on
trac
t si
gned
, wo
rks
pla
nn
ed
incr
emen
tally
th
rou
gho
ut
20
13
-1
4. P
lan
tin
g u
nd
erta
ken
in M
ay
and
Ju
ne
20
14
. Fu
rth
er t
o g
o in
sp
rin
g 2
01
4. I
nte
rim
re
po
rt
reci
eved
.
27

Pro
ject
nam
e a
nd
sit
e v
alu
es
Pro
ject
wo
rks
Ou
tco
me
s ac
hie
ved
/so
ugh
t an
d
mo
nit
ore
d
IS f
un
din
g al
loca
tio
n
(exc
lud
es
1/3
)
Stat
us
Wai
par
a La
goo
n
Co
ast
al l
ag
oo
n a
nd
sa
ltm
ars
h v
eget
ati
on
th
at
is li
kely
to
pro
vid
e su
ita
ble
ina
ng
a
spa
wn
ing
sit
es a
nd
ha
bit
at
Fen
cin
g o
f co
asta
l lag
oo
n
salt
mar
sh.
Eco
logi
cal S
core
: 90
%,
35/
39
Rem
ove
d s
tock
gra
zin
g p
ress
ure
/d
amag
e R
egen
erat
ion
an
d p
rote
ctio
n o
f ri
par
ian
sa
ltm
arsh
veg
etat
ion
$1
9,0
00
O
n h
old
. Aw
aiti
ng
con
sen
tin
g o
utc
om
es.
Fits
in
wit
h H
apu
a ac
tio
n
stra
tegy
rec
om
men
dat
ion
s
Pro
ject
s ap
pro
ved
at
Ap
ril 2
2n
d 2
013
mee
tin
g
Inve
rnes
s St
ream
2
7 h
a o
f h
igh
ly s
ign
ific
an
t ri
pa
ria
n f
ore
st,
incl
ud
ing
c. 1
.5km
of
a b
ran
ch o
f In
vern
ess
stre
am
Fen
cin
g u
pgr
ades
to
p
erim
ete
r o
f se
mi-
coas
tal
po
do
carp
-har
dw
oo
d
rip
aria
n f
ore
st.
Rem
ove
d s
tock
gra
zin
g p
ress
ure
/d
amag
e P
rote
ctio
n o
f re
gen
erat
ing
un
der
sto
ry
$4
,73
8.2
6
W
ork
s sc
hed
ule
d f
or
com
ple
tio
n b
y la
te 2
01
4 –
ac
cess
issu
es in
win
ter.
W
ork
s u
nd
erw
ay.
Pro
ject
s ap
pro
ved
at
July
15
th 2
013
mee
tin
g
Co
nw
ay S
trea
m
Ap
pro
xim
ate
ly 2
km o
f st
rea
m f
rom
hill
co
un
try
to s
ea w
hic
h s
ho
ws
a d
iver
sity
of
ha
bit
at
fro
m w
etla
nd
sp
ring
s a
t it
s h
ead
, th
rou
gh
mea
nd
ers
to e
stu
ari
ne
rive
r m
ou
th.
Fen
cin
g an
d r
est
ora
tio
n
pla
nti
ng
of
stre
am,
pro
tect
ion
of
spri
ngs
an
d
asso
ciat
ed
we
tlan
d.
Eco
logi
cal S
core
: 44
%,
18/
39
Rem
ove
d s
tock
gra
zin
g p
ress
ure
/d
amag
e o
f ri
par
ian
str
eam
mar
gin
an
d w
etla
nd
s.
Reg
ener
atio
n a
nd
pro
tect
ion
of
up
per
w
etl
and
veg
etat
ion
$2
1,8
12
Fen
cin
g o
f lo
wer
sec
tio
n o
f st
ream
co
mp
lete
d. F
enci
ng
of
up
per
we
tlan
d
un
der
way
mid
-lat
e 2
01
4.
Loch
Kat
rin
e Sp
rin
g Su
pp
ort
s a
nd
en
cou
rag
es t
he
loca
l co
mm
un
ity
to lo
ok
aft
er a
nd p
rote
ct t
he
site
s va
lues
Fen
cin
g an
d r
est
ora
tio
n
pla
nti
ng
of
spri
ng
hea
d
Eco
logi
cal S
core
: 33
%,
13/
39
Rem
ove
d s
tock
gra
zin
g p
ress
ure
/d
amag
e o
f sp
rin
ghea
d m
argi
n a
nd
str
eam
sec
tio
n
to la
ke. E
stab
lish
men
t o
f n
ativ
e p
lan
tin
g.
$5
,00
0
Co
mp
lete
d N
ove
mb
er 2
01
3
Wai
au R
iver
care
Gro
up
Pre
dat
or
Co
ntr
ol
Riv
er r
an
ks 7
th f
or
Ca
nte
rbu
ry n
ati
ve b
ird
si
gn
ific
an
ce w
ith
9 li
sted
th
rea
ten
ed b
ird
sp
p
Trap
pin
g o
f b
raid
ed r
iver
b
ird
pre
dat
ors
on
th
e W
aiau
Riv
er.
Imp
rove
d m
on
ito
rin
g o
f b
raid
ed r
ive
r b
ird
p
red
ato
rs
An
act
ive
and
en
gage
d W
aiau
Riv
erca
re
gro
up
$4
,56
7
Un
de
rway
- O
ngo
ing
28
Pro
ject
nam
e a
nd
sit
e v
alu
es
Pro
ject
wo
rks
Ou
tco
me
s ac
hie
ved
/so
ugh
t an
d
mo
nit
ore
d
IS f
un
din
g al
loca
tio
n
(exc
lud
es
1/3
)
Stat
us
Pro
ject
ap
pro
ved
at
Jun
e 20
14 m
eeti
ng
Mat
a K
op
ae /
St
An
nes
Lag
oo
n
Re
sto
rati
on
Th
is w
etla
nd
is s
itu
ate
d n
ort
h o
f th
e C
hev
iot
tow
nsh
ip a
nd
rec
eive
s su
rfa
ce
wa
ter
flo
ws
from
th
e u
pp
er C
aro
line
Stre
am
ca
tch
men
t.
Fen
cin
g (c
.5km
of
4 h
ot-
wir
e) t
o e
stab
lish
3m
+ b
uff
ers,
ad
dre
ss
‘ho
tsp
ots
’ & e
stab
lish
re
sto
rati
on
pla
nti
ng
at
no
des
aro
un
d t
he
lake
.
Fen
cin
g w
ill a
llow
fo
r ra
nk
gras
s to
bu
ffer
th
e w
ate
r b
od
y fr
om
su
rro
un
din
g la
nd
u
ses;
nat
ive
pla
nti
ng
to im
pro
ve t
he
eco
logi
cal f
un
ctio
n o
f th
e ri
par
ian
mar
gin
o
ver
tim
e. W
ater
qu
alit
y m
on
ito
rin
g sc
hed
ule
d.
$2
1,9
00
Agr
eem
ent
sign
ed.
Wo
rks
un
der
way
. Wat
er
qu
alit
y re
sult
s fi
led
an
d
pro
vid
ed t
o la
nd
ow
ner
. Li
aiso
n w
ith
res
erv
es
com
mit
tee
on
goin
g.
Pro
ject
ap
pro
ved
at
Oct
ob
er 2
014
mee
tin
g
Han
me
r W
etla
nd
s Si
gn
ific
an
t re
pres
enta
tive
exa
mp
les
of
the
ori
gin
al v
alle
y fl
oo
r fl
ax/t
all
sed
ge
eco
syst
ems
tha
t n
atu
rally
occ
up
ied
po
orl
y d
rain
ed v
alle
y fl
oo
r ec
osy
stem
s w
ith
in t
he
Mir
omir
o E
D.
Co
ntr
ol o
f w
oo
dy
we
eds
wit
hin
th
e w
etla
nd
are
as
– gr
ou
nd
op
erat
ion
, bas
al
bar
k te
chn
iqu
e.
Eco
logi
cal S
core
: 56
%
Red
uce
th
e ex
ten
t o
f e
xoti
c tr
ees
and
sh
rub
s fr
om
th
e w
etla
nd
are
as (
calle
d
Paw
son
s St
ream
s an
d W
oo
dla
nd
Lak
es)
to e
nh
ance
th
e ec
olo
gica
l in
tegr
ity
of
the
site
.
$7
,31
5
Agr
eem
ent
do
cum
ent
dra
fted
.
29

Canterbury Region Water Use Report for the 2013/14 water year
Report No. R14/ ISBN (print) (web) (CD)
Ross Glubb & Patrick Durney October 2014
30

Report No. R14/ ISBN (print) (web) (CD) PO Box 345 Christchurch 8140 Phone (03) 365 3828 Fax (03) 365 3194 75 Church Street PO Box 550 Timaru 7940 Phone (03) 687 7800 Fax (03) 687 7808 Website: www.ecan.govt.nz Customer Services Phone 0800 324 636
31

Executive summary
This report presents the information that Environment Canterbury has gathered on consented water use – both groundwater and surface water – in Canterbury between 1 July 2013 and 30 June 2014.
It reflects the increasing expectation within Canterbury and New Zealand to better understand the link between the amount of fresh water allocated for use, and the actual amount used. More and better data from water users – largely as a result of the National Regulations for Water Measurement – will provide the information needed to better understand water usage.
3,884 groundwater and surface water takes provided data that were of a sufficient duration and quality to statistically analyse water use within the region. This data represented 50.4% of all consented surface water and groundwater takes that abstracted water at a rate of 5 litres per second or more. While the number of takes fitted with measuring devices is expected to increase in subsequent years, the size of this data group indicates the statistics need to be considered as indicative only.
ArcMap, a geographic information system (GIS) application, was used to spatially map the measured data from these takes to illustrate the percentage of allocation used within the 2013/14 water year. The result of this analysis indicates that there are marked differences throughout the ten specific water management zones of actual water use. The demand for water will vary from take to take due to a number of reasons such as land use, soil type, plant type, irrigation method, water availability and climate.
32

33

Table of contents
Executive summary .................................................................................................... i
1 Introduction ..................................................................................................... 1
2 Water use by water management zone ......................................................... 2
2.1 Kaikoura Zone ................................................................ Error! Bookmark not defined. 2.1.1 2012/13 Water Year .......................................... Error! Bookmark not defined. 2.1.2 2012/13 Irrigation Season ................................. Error! Bookmark not defined.
2.2 Hurunui-Waiau Zone ....................................................................................................... 2 2.2.1 2012/13 Water Year ........................................................................................... 2 2.2.2 2012/13 Irrigation Season .................................................................................. 4
2.3 Waimakariri Zone ........................................................... Error! Bookmark not defined. 2.3.1 2012/13 Water Year .......................................... Error! Bookmark not defined. 2.3.2 2012/13 Irrigation Season ................................. Error! Bookmark not defined.
2.4 Christchurch-West Melton Zone .................................... Error! Bookmark not defined. 2.4.1 2012/13 Water Year .......................................... Error! Bookmark not defined. 2.4.2 2012/13 Irrigation Season ................................. Error! Bookmark not defined.
2.5 Banks Peninsula Zone ................................................... Error! Bookmark not defined. 2.5.1 2012/13 Water Year .......................................... Error! Bookmark not defined.
2.6 Selwyn-Waihora Zone ................................................... Error! Bookmark not defined. 2.6.1 2012/13 Water Year .......................................... Error! Bookmark not defined. 2.6.2 2012/13 Irrigation Season ................................. Error! Bookmark not defined.
2.7 Ashburton Zone ............................................................. Error! Bookmark not defined. 2.7.1 2012/13 Water Year .......................................... Error! Bookmark not defined. 2.7.2 2012/13 Irrigation Season ................................. Error! Bookmark not defined.
2.8 Orari-Opihi-Pareora Zone .............................................. Error! Bookmark not defined. 2.8.1 2012/13 Water Year .......................................... Error! Bookmark not defined. 2.8.2 2012/13 Irrigation Season ................................. Error! Bookmark not defined.
2.9 Upper Waitaki Zone ....................................................... Error! Bookmark not defined. 2.9.1 2012/13 Water Year .......................................... Error! Bookmark not defined. 2.9.2 2012/13 Irrigation Season ................................. Error! Bookmark not defined.
2.10 Lower Waitaki-South Coastal Canterbury Zone ............ Error! Bookmark not defined. 2.10.1 2012/13 Water Year .......................................... Error! Bookmark not defined. 2.10.2 2012/13 Irrigation Season ................................. Error! Bookmark not defined.
3 Acknowledgments .......................................................................................... 7
4 References ....................................................................................................... 8
Appendix 1: List of figures ....................................................................................... 9
Appendix 2: List of tables ....................................................................................... 10
Appendix 3: Water year statistics .......................................................................... 11
34

35
1 Introduction The information that Environment Canterbury has gathered on consented water use in Canterbury between 1 July 2013 and 30 June 2014 is presented within this report. It highlights the current ability for the region to report on water use as well as comments on actual water data that has been provided for both groundwater and surface water takes. This report considers a range of water use activities but has excluded hydropower generation from the data. It is recognised that within the Canterbury region, consented water takes for the generation of hydropower are a predominant use. Although non-consumptive in nature they do represent a proportion of water allocation and in some cases constitute the removal of water from a naturalised resource (i.e. out of catchment use). 3,884 groundwater and surface water takes provided data that were of a sufficient duration and quality to statistically analyse water use within the region. This data represented 50.4% of all consented surface water and groundwater takes that abstracted water at a rate of 5 litres per second or more. While the number of takes fitted with measuring devices is expected to increase in subsequent years, the size of this data group indicates the statistics need to be considered as indicative only. To make a meaningful comparison with total available allocation for the whole year, the consented daily maximum allocations have been considered to give an estimated total for the water year for measured takes that provided water use data. A regional analysis of the allocated volume associated with these takes and their actual use is detailed in Appendix 3. This appendix also includes the proportion of takes equipped with water measurement devices and the progress that has been made over the past three years. More detailed information for each of the ten specific water management zones is shown in Chapter 2. ArcMap, a geographic information system (GIS) application was used to spatially map the measured data from groundwater and surface water takes to illustrate the percentage of allocation used within the 2013/14 water year. An Arc GIS calculate tool was given a set of weighted features (% allocated volume used) to identify spatial clusters of high water use and low water use in individual farm polygons. The resultant scores and values of this analysis show where features with either high or low usage are spatially clustered. This analysis produced density maps to give us a greater understanding of the spatial distribution of water use within the ten specific water management zones. Where agriculture and horticulture are the predominant activity, the volume of water used is influenced by a number of variables such as rainfall, soil temperature, soil moisture status, extreme weather events, or water availability during the irrigation season. The strong winds that occurred in early September 2013 damaged approximately 800 irrigation systems across the region. This delayed the onset of irrigation for many due to the availability of parts and skilled technicians. The reliability of takes subject to a minimum flow condition are dependent on how often each band is on partial or full restriction throughout the water year. Forming a water user group will allow consent holder’s to actively manage or share allocated rates and/or volumes during times of partial restriction. It will allow irrigation to continue although at a reduced scale. A regional summary of restrictions during the 2013/14 water year is detailed in Appendix 3. Typically the irrigation season starts in September and ends in April. For this reason, it is essential to assess water use data in relation to rainfall, daily soil water balance, and groundwater level trends over that same period. This concept is examined further in Chapter 2, where the variations in the volume of water used in the 2013/14 water year are described in more detail for each specific water management zone.
36
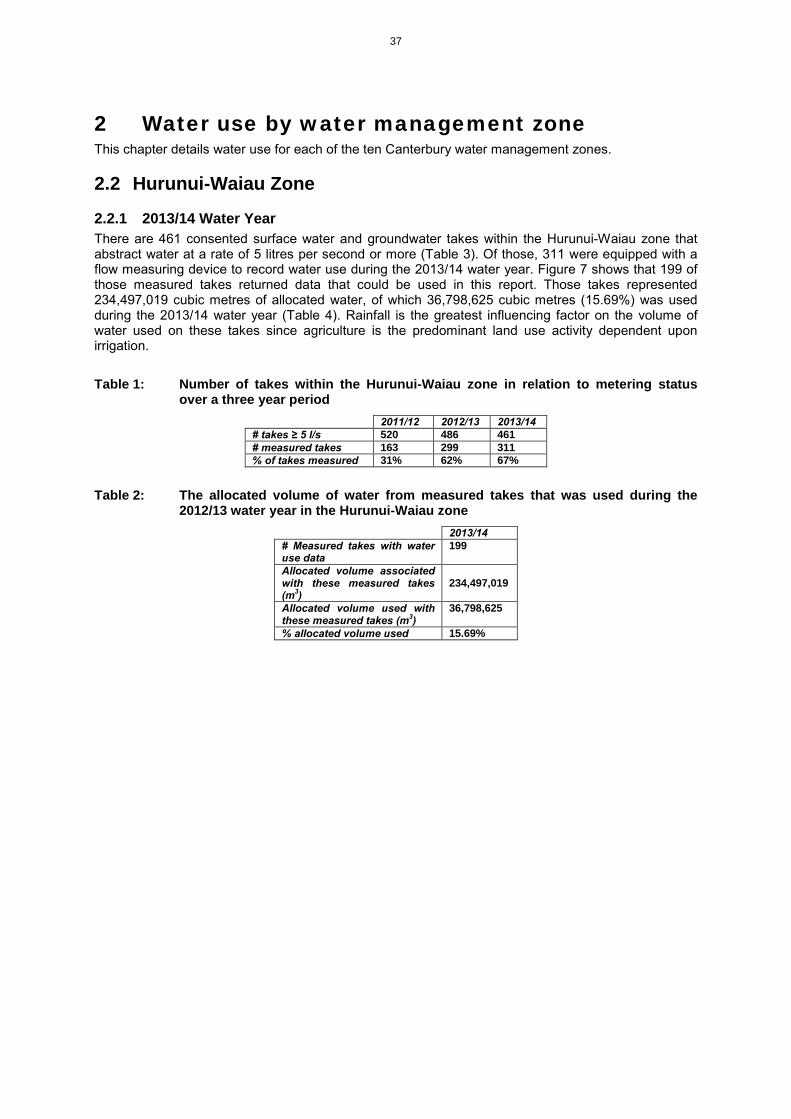
2 Water use by water management zone This chapter details water use for each of the ten Canterbury water management zones.
2.2 Hurunui-Waiau Zone
2.2.1 2013/14 Water Year There are 461 consented surface water and groundwater takes within the Hurunui-Waiau zone that abstract water at a rate of 5 litres per second or more (Table 3). Of those, 311 were equipped with a flow measuring device to record water use during the 2013/14 water year. Figure 7 shows that 199 of those measured takes returned data that could be used in this report. Those takes represented 234,497,019 cubic metres of allocated water, of which 36,798,625 cubic metres (15.69%) was used during the 2013/14 water year (Table 4). Rainfall is the greatest influencing factor on the volume of water used on these takes since agriculture is the predominant land use activity dependent upon irrigation.
Table 1: Number of takes within the Hurunui-Waiau zone in relation to metering status over a three year period
2011/12 2012/13 2013/14 # takes ≥ 5 l/s 520 486 461 # measured takes 163 299 311 % of takes measured 31% 62% 67%
Table 2: The allocated volume of water from measured takes that was used during the 2012/13 water year in the Hurunui-Waiau zone
2013/14 # Measured takes with water use data
199
Allocated volume associated with these measured takes (m3)
234,497,019
Allocated volume used with these measured takes (m3)
36,798,625
% allocated volume used 15.69%
37
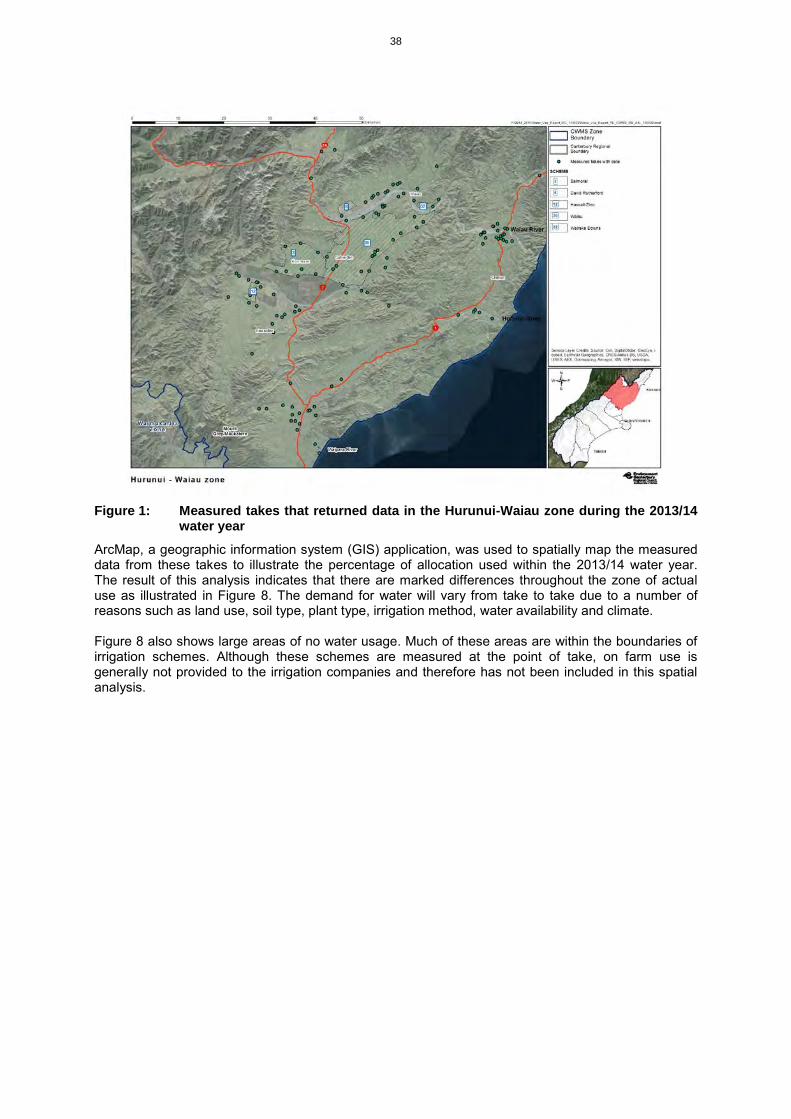
Figure 1: Measured takes that returned data in the Hurunui-Waiau zone during the 2013/14
water year
ArcMap, a geographic information system (GIS) application, was used to spatially map the measured data from these takes to illustrate the percentage of allocation used within the 2013/14 water year. The result of this analysis indicates that there are marked differences throughout the zone of actual use as illustrated in Figure 8. The demand for water will vary from take to take due to a number of reasons such as land use, soil type, plant type, irrigation method, water availability and climate. Figure 8 also shows large areas of no water usage. Much of these areas are within the boundaries of irrigation schemes. Although these schemes are measured at the point of take, on farm use is generally not provided to the irrigation companies and therefore has not been included in this spatial analysis.
38

Figure 2: Proportion of allocated water used in the Hurunui-Waiau zone during the 2013/14
water year
2.2.2 2013/14 Irrigation Season The 2013/14 irrigation season demand for water slowly increased and peaked during the month of February. Rainfall in the first part of the irrigation season was above normal (more than 120 percent of normal) with near average temperaures. There was a warm start to December with near normal rainfall. January was one of our coolest but by February soils became dry because of an increase in average daily temperatures. Autumn was wet especially during the month of April where the rainfall total was more than double that what would normally occur (Figure 9). The daily soil water balance at Hamner started to decline from September onwards reaching a soil moisture deficit of less than 125 mm by the end of February (Figure 10). After this period the soil moisture deficit declined to reach field capacity (maximum amount of water that can be stored in the soil) by mid April. Deciding when to start or stop irrigating is influenced by many variables such as rainfall, soil temperature, soil moisture status, or water availability1. Typically the irrigation season starts in September and ends in April. In spring, soils are generally near field capacity and temperatures are still low. Irrigation only occurs during this period when a soil moisture deficit occurs and temperatures increase. By summer, irrigation generally needs to proceed uninterrupted until autumn when soil moisture deficits and temperatures decline. Irrigation in the Hurunui-Waiau zone began in late September ending in late March, early April. There was a high demand for water from November onwards ending in late February (Figure 11). The observation well at Omihi (N34/0110) clearly demonstrated a steady decline and slight increases in the water level during this period, slowly recovering from March onwards (Figure 12) when the demand for water was less.
1 The reliability of takes subject to a minimum flow condition are dependent on how often each band is on partial or full restriction throughout the water year. A regional summary of restrictions is detailed in Appendix 3.
39

The rate of application on farm also varies greatly throughout the season depending on soil type, plant type (physiological characteristics), evapotranspiration rate (ET)2, and the capability of the irrigation system that is used3. If an irrigator has an understanding of these variables, he/she can apply the right amount of water to ensure that crop/pasture is not stressed, particularly during critical stages of growth.
Figure 3: Monthly rainfall (mm) at G22582 Hanmer Forest EWS. Data supplied by NIWA
2 Evapotranspiration (ET) describes the loss of water to the atmosphere from soil and vegetation. It is, in effect, the actual water lost from the soil each day.
3 The amount of water that can be applied and return period varies depending on the type of irrigation system (border dyke, centre pivot, lateral move, rotary boom etc) that is used and its ability to keep up with ET rates.
40
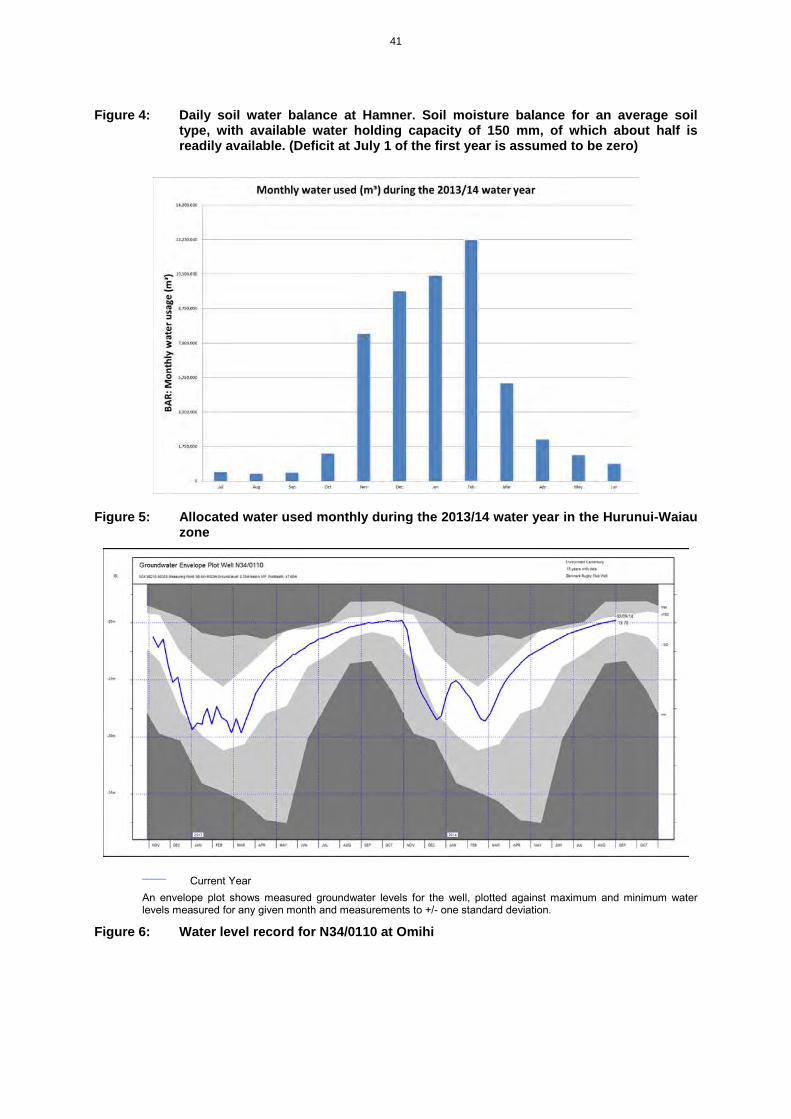
Figure 4: Daily soil water balance at Hamner. Soil moisture balance for an average soil type, with available water holding capacity of 150 mm, of which about half is readily available. (Deficit at July 1 of the first year is assumed to be zero)
Figure 5: Allocated water used monthly during the 2013/14 water year in the Hurunui-Waiau zone
_____ Current Year An envelope plot shows measured groundwater levels for the well, plotted against maximum and minimum water levels measured for any given month and measurements to +/- one standard deviation.
Figure 6: Water level record for N34/0110 at Omihi
41

3 Acknowledgments This Water Use Report for the Canterbury Region depended on contributions from a range of people both within and outside Environment Canterbury. The collection and provision of water use data relating to consented water takes is an essential element. We thank the consent holders who are actively measuring their water use, and the service providers and Resource Management Officers (Compliance Monitoring) for their work in downloading that data to inform this report. The analysis and report development of this report represents contributions from a team of people in addition to the authors. We would like to acknowledge the contributions and roles of Dann Olykan, Marc Ettema, Andy Barbati, Wendy Donald and Colin Bird.
42
4 References Aqualinc Research Limited 2006; Snapshot of Water Allocation in New Zealand. Prepared for the Ministry for the Environment. ISBN: 0-478-30113-8, Wellington. Aqualinc Research Limited 2010: Update of Water Allocation Data and Estimate of Actual Water Use of Consented Takes 2009-10. Prepared for Ministry for the Environment, Report No H10002/3. Canterbury Mayoral Forum 2009: Canterbury Water Management Strategy (CWMS) Strategic Framework. Environment Canterbury, Christchurch, 151 p. Canterbury Water Website http://ecan.govt.nz/GET-INVOLVED/CANTERBURYWATER/Pages/Default.aspx Land and Water Forum 2010. Report of the land and Water Forum: A Fresh Start for Fresh Water. (http://www.landandwater.org.nz). National Policy Statement for Freshwater Management 2011. Ministry for the Environment 2010: Measuring and reporting water takes. Downloaded from http://www.mfe.govt.nz/publications/water/measuring-and-reporting-water-takes/index.html Resource Management (Measurement and Reporting of Water Takes) Regulations 2010 web link http://www.mfe.govt.nz/rma/central/measuring-reporting-water-takes.html
43

Appendix 1: List of figures
44

Appendix 2: List of tables
45

Appendix 3: Water year statistics
Table A 1: Number of takes within the ten water management zones in relation to metering status over a three year period
Lower W
aitaki-South Coastal C
anterbury Zone
Upper W
aitaki Zone
Orari-O
pihi-Pareora Zone
Ashburton Zone
Selwyn-W
aihora Zone
Banks Peninsula Zone
Christchurch-W
est Melton Zone
Waim
akariri Zone
Hurunui-W
aiau Zone
Kaikoura Zone
381
135
1,028
1,963
2,242
35
773
858
520
90
2011/12 # takes ≥ 5 l/s
379
122
1,074
2,132
2,243
20
638
736
486
80
2012/13
367
123
1,046
2,076
2,137
20
652
744
461
82
2013/14
158
18
468
1,093
1,009
2 225
178
163
22
2011/12 # measured takes
204
39
675
1,512
1,306
2 249
356
299
35
2012/13
204
39
675
1,512
1,306
2 249
356
299
42
2013/14
41%
13%
46%
56%
45%
6%
29%
21%
31%
24%
2011/12
% of takes m
easured
54%
32%
63%
71%
58%
10%
39%
48%
62%
44%
2012/13
60%
57%
72%
73%
63%
10%
51%
55%
67%
51%
2013/14
46
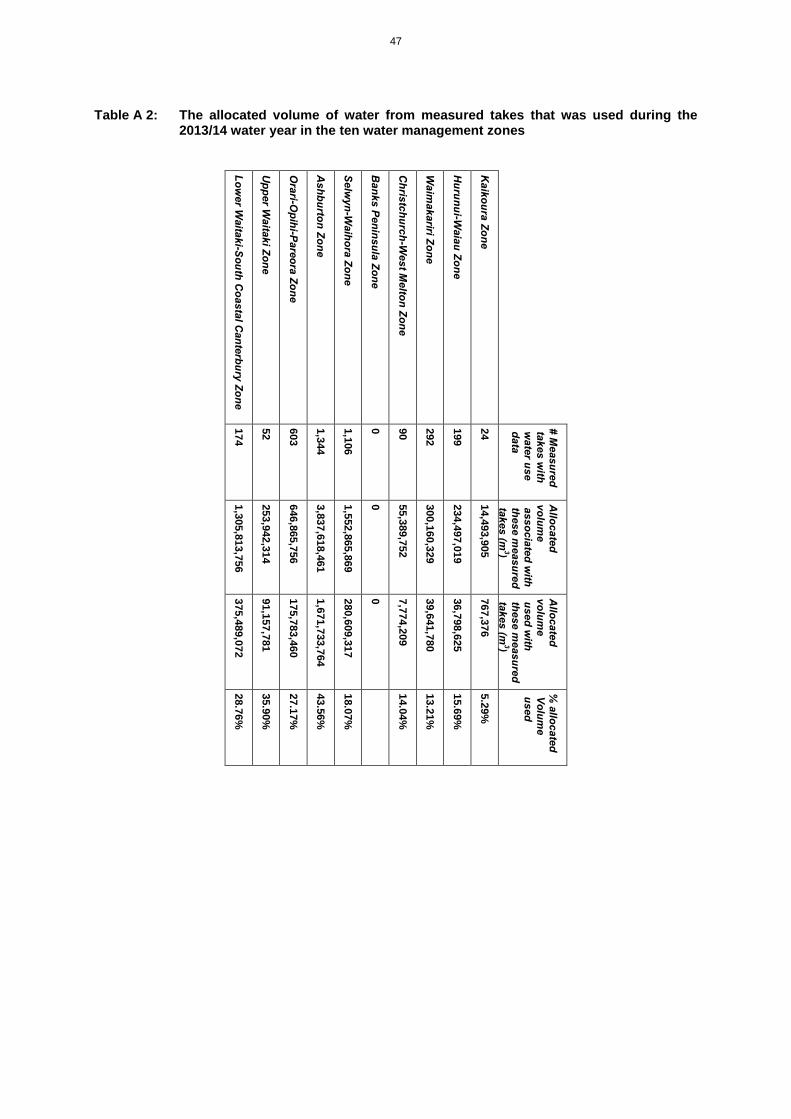
Table A 2: The allocated volume of water from measured takes that was used during the 2013/14 water year in the ten water management zones
Low
er Waitaki-South C
oastal Canterbury Zone
Upper W
aitaki Zone
Orari-O
pihi-Pareora Zone
Ashburton Zone
Selwyn-W
aihora Zone
Banks Peninsula Zone
Christchurch-W
est Melton Zone
Waim
akariri Zone
Hurunui-W
aiau Zone
Kaikoura Zone
174
52
603
1,344
1,106
0 90
292
199
24
# Measured
takes with
water use
data
1,305,813,756
253,942,314
646,865,756
3,837,618,461
1,552,865,869
0 55,389,752
300,160,329
234,497,019
14,493,905
Allocated
volume
associated with
these measured
takes (m3)
375,489,072
91,157,781
175,783,460
1,671,733,764
280,609,317
0 7,774,209
39,641,780
36,798,625
767,376
Allocated
volume
used with
these measured
takes (m3)
28.76%
35.90%
27.17%
43.56%
18.07%
14.04%
13.21%
15.69%
5.29%
% allocated
Volume
used
47

Table A 3: Summary of irrigation restrictions during the 2013/14 water year in the ten water management zones
Site Description Band Description Times On Full Restriction
Times On Partial Restriction
Ahuriri @ Sth. Diadem Band 1 40 0
Band 2 0 64
Ashburton River @ SH1 Bridge (Recorder) Band 1 3 0
Band 1 (Awug Voluntary Roster) 3 3
Band 2 0 0
Band 3 53 0
Band 4 3 128
Band 5 123 0
Ashley @ Ashley Gorge Band 1 4 27
Band 2 (WDC) 0 4
Band 3 33 8
Band 5 31 2
Band 6 (WDC) 0 31
Band 7 42 0
Band 8 0 40
Band 9 40 3
Band 10 0 40
Avon River @ Gloucester Street Bridge Band 1 0 0
Awakino River @ SH83 Band 2 1 2
Band 3 1 1
Baileys Creek @ Lincoln/Leeston Road Band 1 50 0
Barclays Creek @ Glenbrook Run/Benmore Station boundary
Band 1 0 0
Barrys Bay Stream @ Lower Road Bridge - Cheese Factory
Band 1 89 0
Birdlings Brook @ Leggs Road Band 1 0 0
Band 2 0 0
Band 4 0 0
Band 5 0 0
Band 6 0 0
48
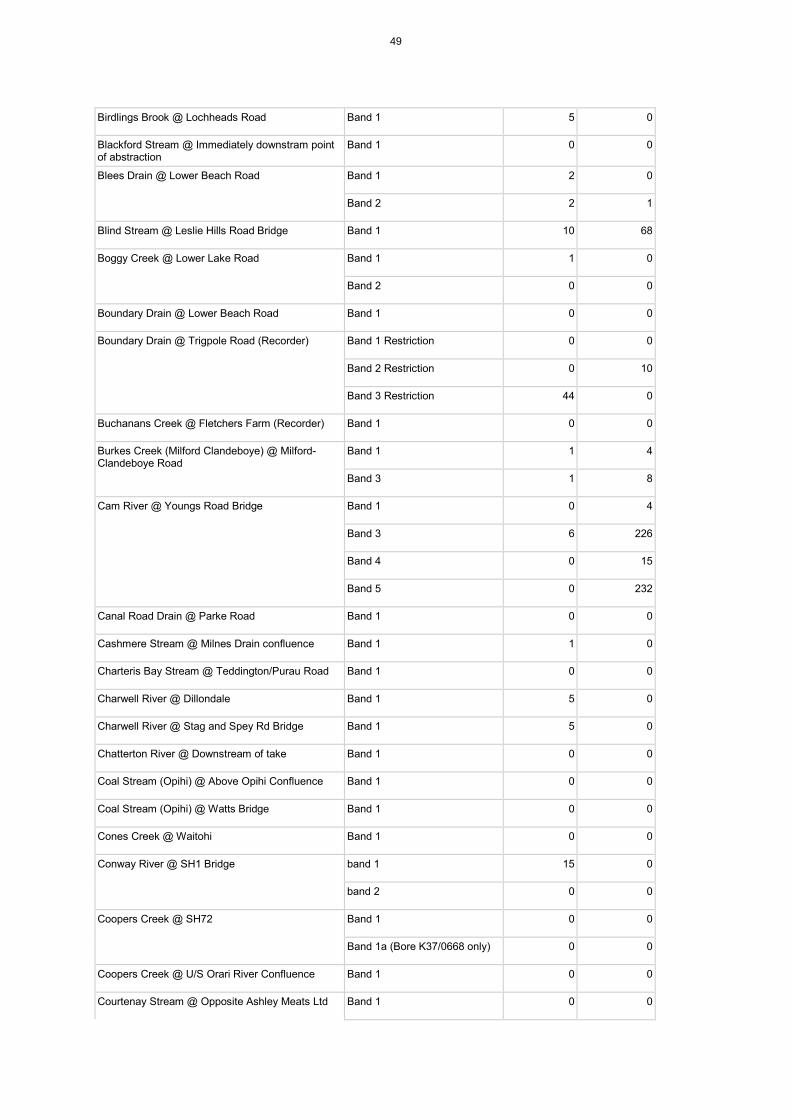
Birdlings Brook @ Lochheads Road Band 1 5 0
Blackford Stream @ Immediately downstram point of abstraction
Band 1 0 0
Blees Drain @ Lower Beach Road Band 1 2 0
Band 2 2 1
Blind Stream @ Leslie Hills Road Bridge Band 1 10 68
Boggy Creek @ Lower Lake Road Band 1 1 0
Band 2 0 0
Boundary Drain @ Lower Beach Road Band 1 0 0
Boundary Drain @ Trigpole Road (Recorder) Band 1 Restriction 0 0
Band 2 Restriction 0 10
Band 3 Restriction 44 0
Buchanans Creek @ Fletchers Farm (Recorder) Band 1 0 0
Burkes Creek (Milford Clandeboye) @ Milford-Clandeboye Road
Band 1 1 4
Band 3 1 8
Cam River @ Youngs Road Bridge Band 1 0 4
Band 3 6 226
Band 4 0 15
Band 5 0 232
Canal Road Drain @ Parke Road Band 1 0 0
Cashmere Stream @ Milnes Drain confluence Band 1 1 0
Charteris Bay Stream @ Teddington/Purau Road Band 1 0 0
Charwell River @ Dillondale Band 1 5 0
Charwell River @ Stag and Spey Rd Bridge Band 1 5 0
Chatterton River @ Downstream of take Band 1 0 0
Coal Stream (Opihi) @ Above Opihi Confluence Band 1 0 0
Coal Stream (Opihi) @ Watts Bridge Band 1 0 0
Cones Creek @ Waitohi Band 1 0 0
Conway River @ SH1 Bridge band 1 15 0
band 2 0 0
Coopers Creek @ SH72 Band 1 0 0
Band 1a (Bore K37/0668 only) 0 0
Coopers Creek @ U/S Orari River Confluence Band 1 0 0
Courtenay Stream @ Opposite Ashley Meats Ltd Band 1 0 0
49
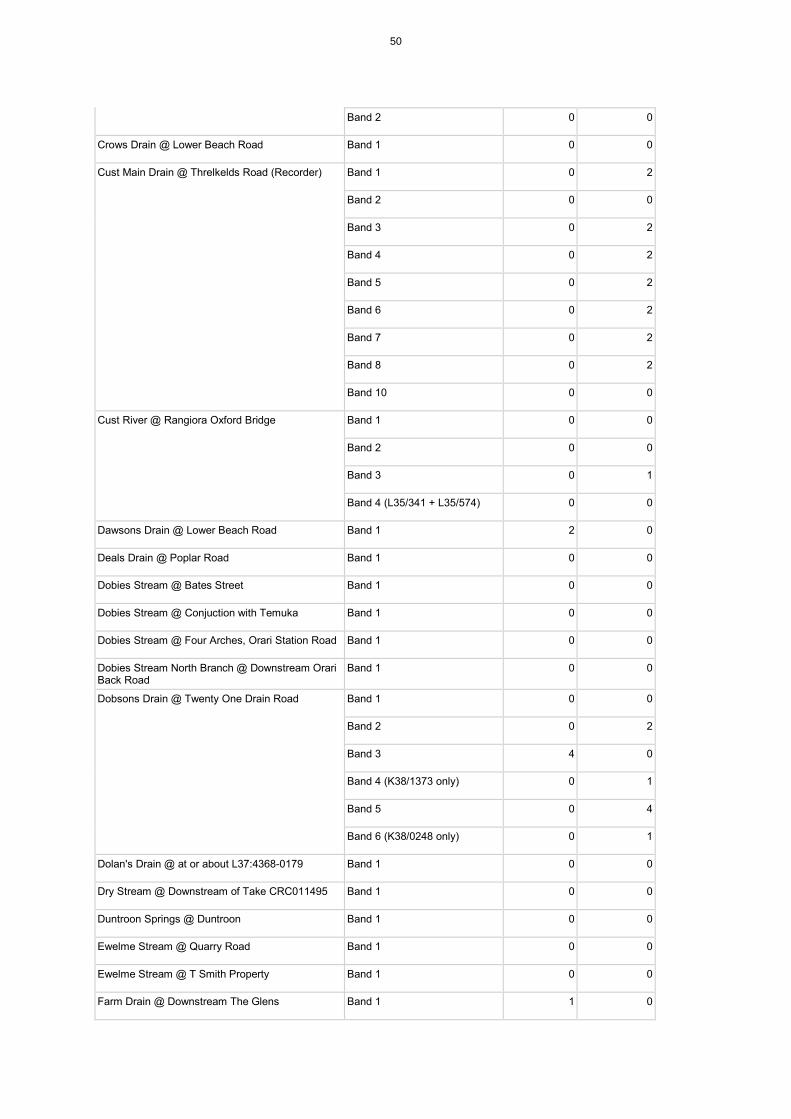
Band 2 0 0
Crows Drain @ Lower Beach Road Band 1 0 0
Cust Main Drain @ Threlkelds Road (Recorder) Band 1 0 2
Band 2 0 0
Band 3 0 2
Band 4 0 2
Band 5 0 2
Band 6 0 2
Band 7 0 2
Band 8 0 2
Band 10 0 0
Cust River @ Rangiora Oxford Bridge Band 1 0 0
Band 2 0 0
Band 3 0 1
Band 4 (L35/341 + L35/574) 0 0
Dawsons Drain @ Lower Beach Road Band 1 2 0
Deals Drain @ Poplar Road Band 1 0 0
Dobies Stream @ Bates Street Band 1 0 0
Dobies Stream @ Conjuction with Temuka Band 1 0 0
Dobies Stream @ Four Arches, Orari Station Road Band 1 0 0
Dobies Stream North Branch @ Downstream Orari Back Road
Band 1 0 0
Dobsons Drain @ Twenty One Drain Road Band 1 0 0
Band 2 0 2
Band 3 4 0
Band 4 (K38/1373 only) 0 1
Band 5 0 4
Band 6 (K38/0248 only) 0 1
Dolan's Drain @ at or about L37:4368-0179 Band 1 0 0
Dry Stream @ Downstream of Take CRC011495 Band 1 0 0
Duntroon Springs @ Duntroon Band 1 0 0
Ewelme Stream @ Quarry Road Band 1 0 0
Ewelme Stream @ T Smith Property Band 1 0 0
Farm Drain @ Downstream The Glens Band 1 1 0
50
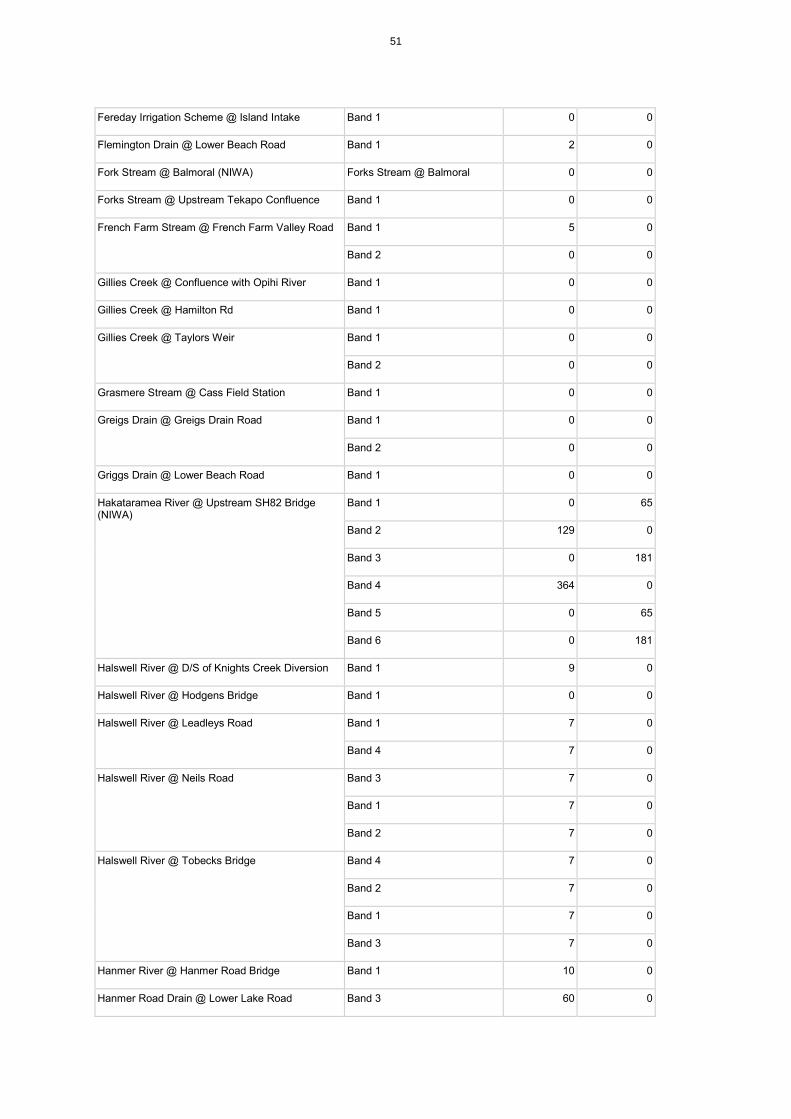
Fereday Irrigation Scheme @ Island Intake Band 1 0 0
Flemington Drain @ Lower Beach Road Band 1 2 0
Fork Stream @ Balmoral (NIWA) Forks Stream @ Balmoral 0 0
Forks Stream @ Upstream Tekapo Confluence Band 1 0 0
French Farm Stream @ French Farm Valley Road Band 1 5 0
Band 2 0 0
Gillies Creek @ Confluence with Opihi River Band 1 0 0
Gillies Creek @ Hamilton Rd Band 1 0 0
Gillies Creek @ Taylors Weir Band 1 0 0
Band 2 0 0
Grasmere Stream @ Cass Field Station Band 1 0 0
Greigs Drain @ Greigs Drain Road Band 1 0 0
Band 2 0 0
Griggs Drain @ Lower Beach Road Band 1 0 0
Hakataramea River @ Upstream SH82 Bridge (NIWA)
Band 1 0 65
Band 2 129 0
Band 3 0 181
Band 4 364 0
Band 5 0 65
Band 6 0 181
Halswell River @ D/S of Knights Creek Diversion Band 1 9 0
Halswell River @ Hodgens Bridge Band 1 0 0
Halswell River @ Leadleys Road Band 1 7 0
Band 4 7 0
Halswell River @ Neils Road Band 3 7 0
Band 1 7 0
Band 2 7 0
Halswell River @ Tobecks Bridge Band 4 7 0
Band 2 7 0
Band 1 7 0
Band 3 7 0
Hanmer River @ Hanmer Road Bridge Band 1 10 0
Hanmer Road Drain @ Lower Lake Road Band 3 60 0
51
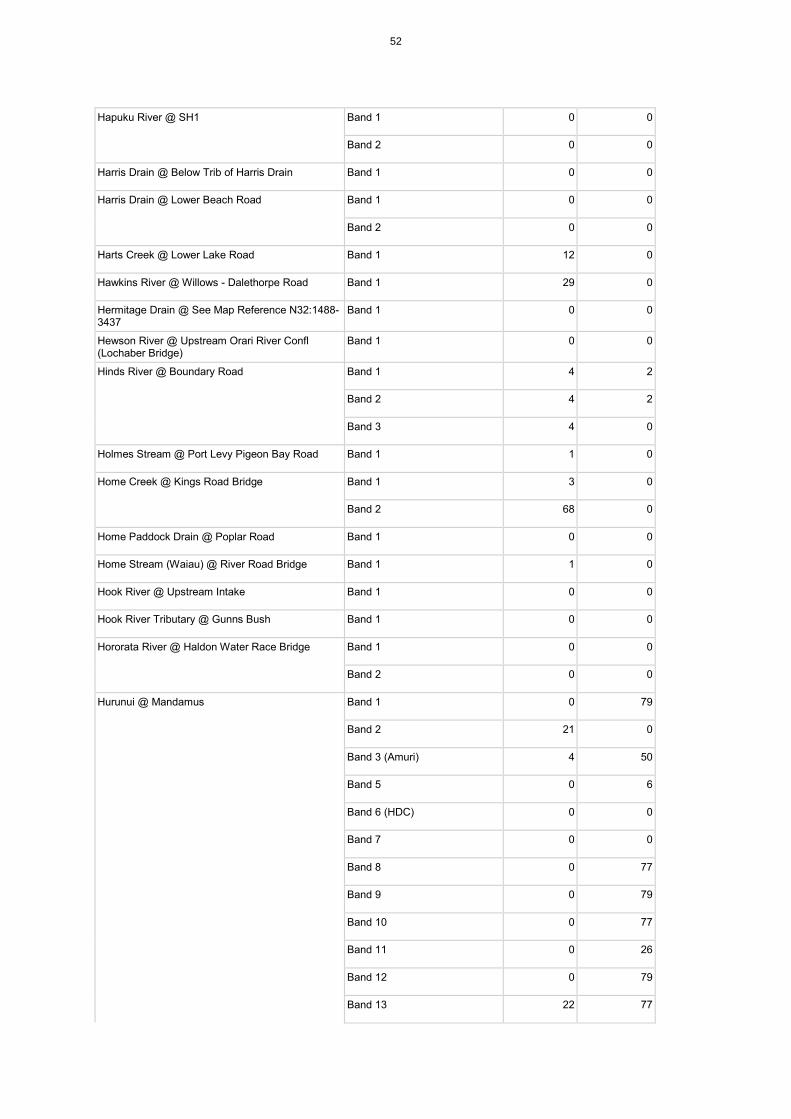
Hapuku River @ SH1 Band 1 0 0
Band 2 0 0
Harris Drain @ Below Trib of Harris Drain Band 1 0 0
Harris Drain @ Lower Beach Road Band 1 0 0
Band 2 0 0
Harts Creek @ Lower Lake Road Band 1 12 0
Hawkins River @ Willows - Dalethorpe Road Band 1 29 0
Hermitage Drain @ See Map Reference N32:1488-3437
Band 1 0 0
Hewson River @ Upstream Orari River Confl (Lochaber Bridge)
Band 1 0 0
Hinds River @ Boundary Road Band 1 4 2
Band 2 4 2
Band 3 4 0
Holmes Stream @ Port Levy Pigeon Bay Road Band 1 1 0
Home Creek @ Kings Road Bridge Band 1 3 0
Band 2 68 0
Home Paddock Drain @ Poplar Road Band 1 0 0
Home Stream (Waiau) @ River Road Bridge Band 1 1 0
Hook River @ Upstream Intake Band 1 0 0
Hook River Tributary @ Gunns Bush Band 1 0 0
Hororata River @ Haldon Water Race Bridge Band 1 0 0
Band 2 0 0
Hurunui @ Mandamus Band 1 0 79
Band 2 21 0
Band 3 (Amuri) 4 50
Band 5 0 6
Band 6 (HDC) 0 0
Band 7 0 0
Band 8 0 77
Band 9 0 79
Band 10 0 77
Band 11 0 26
Band 12 0 79
Band 13 22 77
52

Band 14 9 8
Band 16 0 0
Band 17 80 20
Band 18 0 0
Band 20 16 0
Band 21 0 0
Band 22 16 0
Hurunui River @ SH1 Bridge (Recorder) Band 1 0 0
Band 2 0 22
Band 3 1 4
Band 4 0 38
Band 5 0 0
Irwell River @ Leeston Chch Road Band 1 0 2
Irwell River @ The Lake Road Band 1 0 0
Band 5 0 0
J39/0035 @ PAREORA AVENUE Band 1 1 0
Jollies Brook @ Outlet to Sea Band 1 0 0
Band 2 0 0
Band 3 0 0
Band 4 147 0
Kaiapoi River @ Neeves Road Band 1 0 0
Band 2 0 0
Kaituna River @ Kaituna Valley Road (Recorder) Band 2 211 79
Kaputone Creek @ Styx River Confluence Band 1 0 0
Band 2 0 0
Kekerengu River @ Downstream of Kekerengu Rd Bridge
Kekerengu Rd bridge 0 0
Knights Creek @ Jamiesons Property Band 1 0 0
Band 2 7 0
Kowai River @ Midland Railway Bridge Band 1 63 0
Kowhai River (Kaikoura) @ Gorge Band 1 42 234
Lake Coleridge @ Recorder Site Band 1 0 0
Band 2 0 0
Lake Opuha @ Dam (ECS) Band 1 0 0
53

Band 2 0 0
Latimers Creek @ Yard Culvert Band 1 0 0
Leader River @ Mendip Road Bridge Band 1 10 0
Lee River @ Te Moana Band 1 0 0
LII River @ Wolfes Road Band 3 23 0
Band 2 15 0
Band 1 0 0
Little Akaloa Stream @ Little Akaloa Road Bridge Band 1 0 0
Little Ashley @ State Highway 1 Band 1 0 0
Little Kowai River @ Johnson Property D/S of Intake (CRC020199)
Band 1 64 0
Lll River @ Moirs Property Band 1 0 0
Band 3 0 0
Band 2 0 0
Band 4 0 0
Lottery River @ Waiau Kaikoura Road Bridge Band 1 7 0
Band 2 0 5
Lyell Creek @ State Highway 1 Band 1 0 0
Band 2 0 0
Lyell Creek Left Branch @ Mackle Property Band 1 0 0
Lyell Creek Right Branch @ Mt Fyffe Road Band 1 1 0
M34/0497 @ GREYS RD Band 1 0 0
M35/1000 @ SANDY KNOLLS ROAD Band 1 0 0
M35/1110 @ POUND RD CH CH R D 6 Band 1 0 0
M35/1691 @ 92 CHATTERTONS ROAD CH CH R D 6
Band 1 0 0
M35/5696 @ WEEDONS ROSS RD Band 1 0 0
Band 2 0 0
Band 3 0 12
Band 4 0 0
M36/0217 @ JONES ROAD Band 1 0 0
Band 2 0 0
Band 3 0 0
Maerewhenua River @ Kellys Gully (NIWA) Band 1 6 2
Band 2 6 0
54

Band 3 9 33
Band 4 6 2
Band 5 8 1
Band 6 149 0
CRC070820 76 1
Marshalls Creek @ Milton Road Band 1 0 0
Mary Burn @ SH8 Bridge (Recorder) Band 1 126 0
Mary Burn @ Upstream Tekapo River Confluence Band 1 0 0
Mason River @ Waiau-Lyndon Road Bridge Band 2 5 0
Band 1 0 0
McKays Stream @ Hakataramea Valley Rd Bge Band 1 2 0
McKinnons Creek @ Wallaces Bridge Band 1 3 0
McLeans Swamp Road Drain @ Windermere Cutoff Band 1 0 0
Merrys Stream @ SH1 Bridge Band 1 0 0
Band 3 (B Block) 0 0
band 2 (A Block) 0 0
Middle Brook @ Marsh Road Site Band 1 1 0
Middle Creek @ SH1 Bridge (Recorder) Band 1 0 0
Moffats Drain @ Boundary Road Band 1 0 0
Moffats Drain @ Rylib Dairies Boundary Band 1 0 0
Montgomerys Drain @ Hinds River Confluence Band 1 0 0
Motunau River @ Motunau Mouth Band 2 0 0
Mounseys Stream @ Island Road Bridge - Eyre River Confluence
Band 1 (Washpen Creek) 0 0
Mount Palm Drain @ Grassington Road Band 1 0 0
No 7 Drain @ Main Drain Road Culvert Band 1 0 0
Band 2 0 0
North Ashburton River @ Old Weir (Recorder) Band 1 143 2
Band 2 196 0
Band 3 212 29
Band 4 147 0
North Ashburton River @ Upstream Confluence Band 1 0 0
Band 2 0 0
North Brook Stream @ Marsh Road Band 1 0 2
55

Band 3 0 2
Band 2 (M35/249 & M35/252 only)
0 2
North Opuha River @ Clayton Road Bridge (ECS) Band 1 3 0
Northern Drain @ Confluence with Hinds River Band 1 0 0
Band 1 (Bore K37/2801 only) 0 0
Northern Drain @ Surveyors Road Band 2 0 0
Band 2 (Bore K37/0230 only) 0 0
Oakdale Drain @ Hinds Rangitata Mouth Road Band 1 7 0
Band 2 5 0
Oakdale Drain @ Lower Oakdale (Winchester) Winchester 0 0
Ohapi Creek @ Brown Road Band 1 0 17
Band 2 0 6
Ohoka Stream @ Kaiapoi River Confluence Band 1 0 0
Band 2 0 0
Band 3 0 0
Band 5 0 0
Band 6 0 0
Band 7 0 0
Okuku River @ Fox Creek (Recorder) Band 1 0 2
Okuti River @ Kinloch Road Bridge Band 1 0 0
Omarama Stream @ Above Tara Hills (Recorder) Band 1 0 0
Band 2 6 0
Omarama Stream @ Wardells Bridge (Recorder) Band 1 5 52
Band 2 5 0
Omihi Stream (Waipara) @ Waipara River Confluence
Band 1 9 0
Omihi Stream @ Baxters Bridge Band 1 49 0
Opihi River @ Rockwood (Recorder) Band 1 0 0
Band 2 0 0
Band 3 0 0
Opihi River @ Saleyards Bridge (ECS) Band 1 (AA Permits) 0 0
Band 2 (BA Permits) 0 0
OWL - Flow target (Yesterday) 0 0
Band 4 (AN Permits) 0 55
56
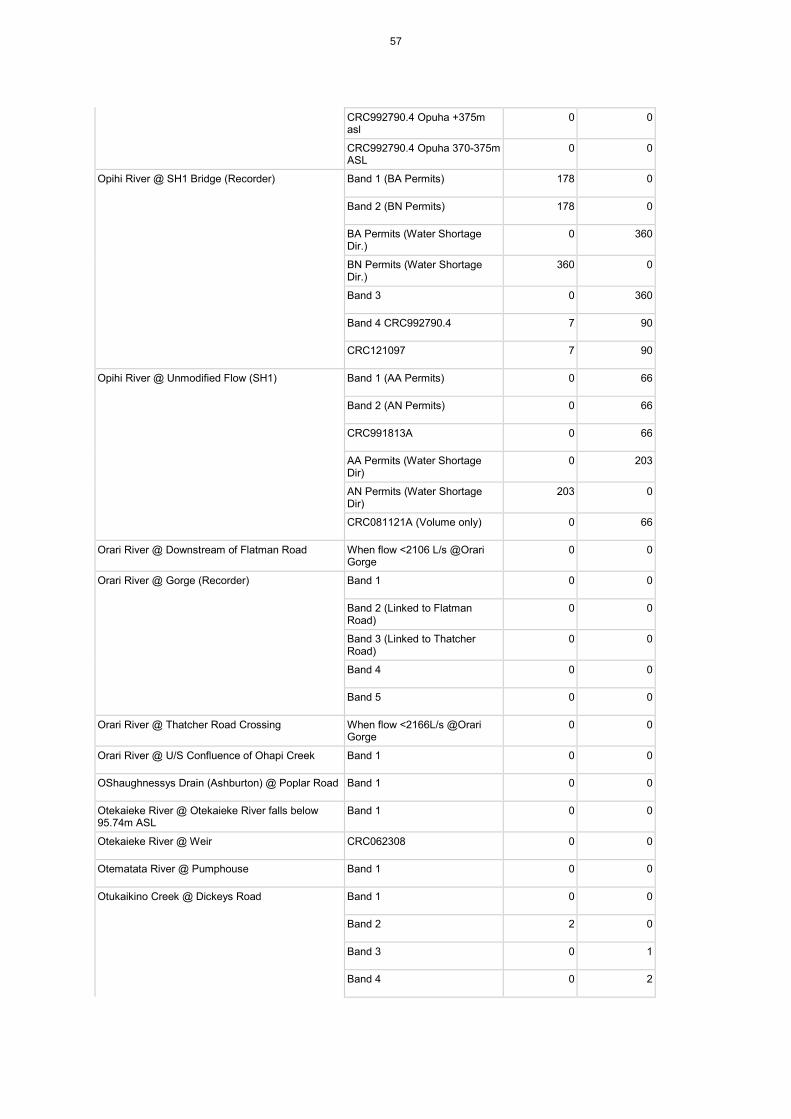
CRC992790.4 Opuha +375m asl
0 0
CRC992790.4 Opuha 370-375m ASL
0 0
Opihi River @ SH1 Bridge (Recorder) Band 1 (BA Permits) 178 0
Band 2 (BN Permits) 178 0
BA Permits (Water Shortage Dir.)
0 360
BN Permits (Water Shortage Dir.)
360 0
Band 3 0 360
Band 4 CRC992790.4 7 90
CRC121097 7 90
Opihi River @ Unmodified Flow (SH1) Band 1 (AA Permits) 0 66
Band 2 (AN Permits) 0 66
CRC991813A 0 66
AA Permits (Water Shortage Dir)
0 203
AN Permits (Water Shortage Dir)
203 0
CRC081121A (Volume only) 0 66
Orari River @ Downstream of Flatman Road When flow <2106 L/s @Orari Gorge
0 0
Orari River @ Gorge (Recorder) Band 1 0 0
Band 2 (Linked to Flatman Road)
0 0
Band 3 (Linked to Thatcher Road)
0 0
Band 4 0 0
Band 5 0 0
Orari River @ Thatcher Road Crossing When flow <2166L/s @Orari Gorge
0 0
Orari River @ U/S Confluence of Ohapi Creek Band 1 0 0
OShaughnessys Drain (Ashburton) @ Poplar Road Band 1 0 0
Otekaieke River @ Otekaieke River falls below 95.74m ASL
Band 1 0 0
Otekaieke River @ Weir CRC062308 0 0
Otematata River @ Pumphouse Band 1 0 0
Otukaikino Creek @ Dickeys Road Band 1 0 0
Band 2 2 0
Band 3 0 1
Band 4 0 2
57

Band 5 0 2
Pahau River @ The Grampians Band 1 1 0
Pahau River @ Top Pahau Road Band 1 0 0
Pahau River @ Upstream Hurunui Drain Confl (Dalzells Bridge)
Band 1 1 0
Band 2 0 0
Band 3 0 0
Band 4 0 0
Pancake Stream @ Down Stream of Inake CRC020522)
Band 1 0 0
Parakanoi Drain @ Lower Beach Road (Recorder) Band 1 62 44
Pareora River @ Huts (Recorder) Band 1 0 0
Band 2 0 0
Band 3 116 0
Band 4 188 0
Band 5 0 0
band 7 (Wai district council) 0 0
Band 8 307 3
Band 9 8 1
Band 10 81 39
Pawson Valley Stream @ State highway 75 Bridge Band 1 0 40
Band 2 0 40
Petries Drain @ Upstream Stopbank/Culvert Band 1 0 0
Pigeon Bay Stream @ Port Levy/Pigeon Bay Road Band 1 0 0
Pipers Creek @ Christchurch Akaroa Road Bridge Band 1 31 0
Pyes Drain @ Lower Beach Road Band 2 0 0
Rakaia River @ Fighting Hill Band 1(a) 25 0
Band 2 34 49
Band 2 (a) 33 0
Band 3 34 49
Band 3 (a) 34 49
Band 4 0 0
Band 4 (a) 34 70
Band 4 (b) 0 34
Band 5 94 17
58

Band 6 87 4
Band 7 91 9
Band 8 100 4
Band 9 (a) 104 0
Band 10 127 0
Band 11 105 85
Band 12 (Band 4 water) 105 72
Band 13 (Band 5 water) 47 0
Band 14 105 85
Band 15 91 9
Band 16 39 324
Band 17 6 4
Band 18 0 363
Band 19 182 127
Rangitata River @ Klondyke (Recorder) Band 1 0 80
Band 2 0 0
Band 3 265 0
Band 4 (RDR) 0 110
Band 5 - Stoddart 124 0
Band 7 (RDL Dairies) 57 1
band 8 (CRC070926.1) 0 0
Band 9 (CRC111020) 31 1
Saltwater Creek @ Factory Road or Morriss Property
Band 1 0 0
Saltwater Creek @ Toppings Road Band 1 0 1
Band 2 0 0
Scour Stream (Hakataramea) @ Hakataramea Downs Road
Band 1 3 0
SDC Water Race (Rakaia) @ Below Early's Intake Band 1 0 0
Seadown Drain @ Aorangi Road Band 1 0 0
Selwyn River @ Coes Ford (Recorder) Band 3 0 43
Band 1 0 0
Band 4 0 0
Selwyn River @ Whitecliffs (NIWA Recorder) Band 1 0 0
Band 2 0 0
59
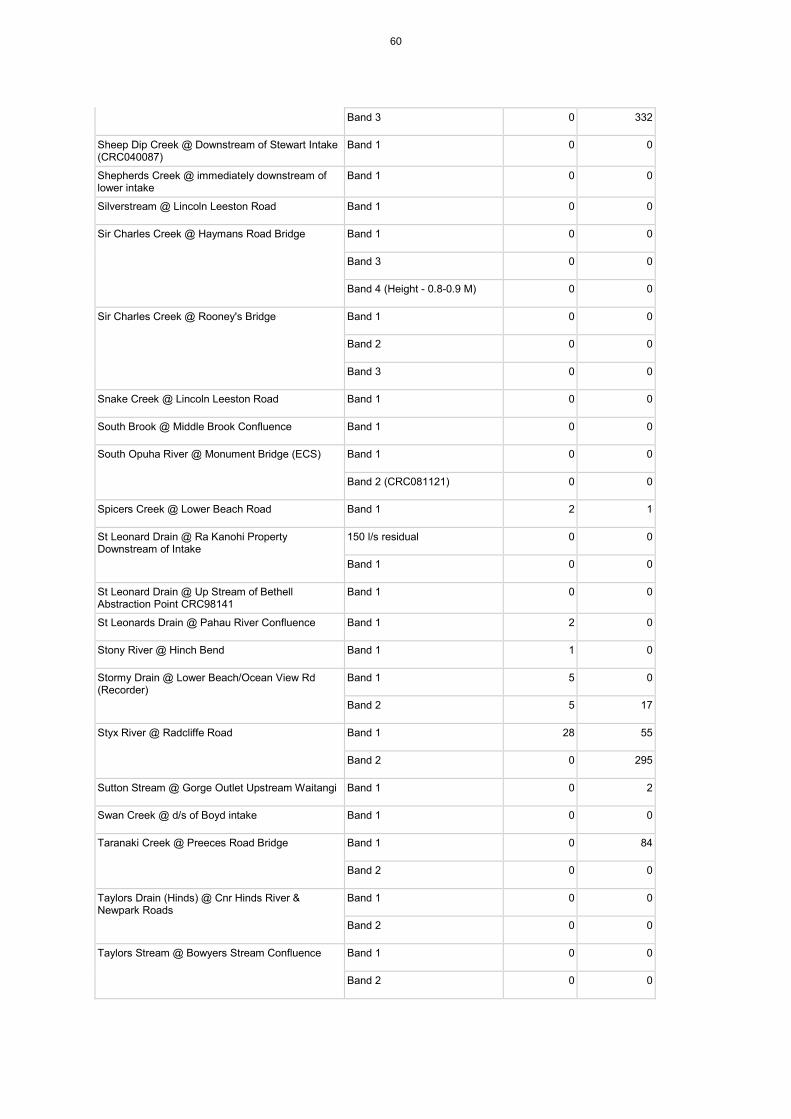
Band 3 0 332
Sheep Dip Creek @ Downstream of Stewart Intake (CRC040087)
Band 1 0 0
Shepherds Creek @ immediately downstream of lower intake
Band 1 0 0
Silverstream @ Lincoln Leeston Road Band 1 0 0
Sir Charles Creek @ Haymans Road Bridge Band 1 0 0
Band 3 0 0
Band 4 (Height - 0.8-0.9 M) 0 0
Sir Charles Creek @ Rooney's Bridge Band 1 0 0
Band 2 0 0
Band 3 0 0
Snake Creek @ Lincoln Leeston Road Band 1 0 0
South Brook @ Middle Brook Confluence Band 1 0 0
South Opuha River @ Monument Bridge (ECS) Band 1 0 0
Band 2 (CRC081121) 0 0
Spicers Creek @ Lower Beach Road Band 1 2 1
St Leonard Drain @ Ra Kanohi Property Downstream of Intake
150 l/s residual 0 0
Band 1 0 0
St Leonard Drain @ Up Stream of Bethell Abstraction Point CRC98141
Band 1 0 0
St Leonards Drain @ Pahau River Confluence Band 1 2 0
Stony River @ Hinch Bend Band 1 1 0
Stormy Drain @ Lower Beach/Ocean View Rd (Recorder)
Band 1 5 0
Band 2 5 17
Styx River @ Radcliffe Road Band 1 28 55
Band 2 0 295
Sutton Stream @ Gorge Outlet Upstream Waitangi Band 1 0 2
Swan Creek @ d/s of Boyd intake Band 1 0 0
Taranaki Creek @ Preeces Road Bridge Band 1 0 84
Band 2 0 0
Taylors Drain (Hinds) @ Cnr Hinds River & Newpark Roads
Band 1 0 0
Band 2 0 0
Taylors Stream @ Bowyers Stream Confluence Band 1 0 0
Band 2 0 0
60

Taylors Stream @ Upstream Sth Ashburton River Confl
Band 1 0 0
Taylors Stream Intake B @ Intake Band 1 0 0
Band 2 0 0
Temuka River @ Manse Bridge (Recorder) Band 1 (A Permits) 0 0
Band 2 (A Permits) 0 0
Band 3 (B Permits) 0 0
Band 4 (A Permits - KIL) 0 0
Band 5 (B Permits - KIL) 0 0
Band 6 (TDC Winchester) 0 0
Band 7 (CRC064043 TDC) 0 0
Band 8 (CRC064042 TDC) 0 0
Tengawai River @ Picnic Grounds (Recorder) Band 1 0 5
CRC091757 66 0
Band 3 84 17
Band 4 0 5
Tommys Stream @ Heathstock Road Band 1 0 0
Twenty One Drain @ Twenty One Drain Road Band 1 0 0
Band 2 0 0
Unnamed Drain @ Down Stream of Delany Pond Band 1 0 0
Unnamed Tributary of Porter River @ Gauging Weir 10 l/s cutoff 0 0
Unnamed Tributary of St Leonard Drain @ Above Confluence with St Leonard Drain
Band 1 0 0
Unnamed Tributary of St Leonard Drain @ Upstream of Davison Intake (CRC000053)
Band 1 0 0
Waiau East Stream @ Downstream of Take Band 1 0 0
Waiau River @ Marble Point (Recorder) Band 1 0 40
Band 2 0 0
Band 3 0 0
Band 4 0 10
Band 5 0 8
Band 6 0 0
Band 7 0 41
Band 8 153 45
Band 10 0 0
61

Waihao River (Waihaorunga) @ Immediately below Intake
Band 1 1 0
Band 2 1 0
Band 3 0 0
Waihao River @ McCulloughs Bridge (Recorder) Band 1 0 22
Band 2 77 0
Band 3 3 38
Band 4 118 5
Band 5 0 22
Band 6 0 22
CRC091998 - MGIS 282 25
Band 8 0 22
Band 9 0 22
Band 10 0 0
Band 11 0 0
Waihao River @ Upstream Bradshaws Bridge (Recorder)
Band 1 0 0
Band 2 0 0
Band 3 0 0
Band 4 0 0
Waihao River South Branch @ Waihaorunga Road Bridge
Band 1 13 0
Band 2 1 0
Waihaorunga Stream @ Waitaki Valley Road Band 1 0 0
Waikakahi Stream @ Glenavy Tawai Road Band 1 0 0
Waikakahi Stream @ Te Maiharoa Road Bridge Band 1 0 0
Waikari River @ D/S of Milmore intake CRC040383 Band 1 0 0
Waikewai Creek @ Taumutu Beach Band 1 0 0
Band 2 0 0
Band 3 0 0
Band 4 0 0
Waikuku Stream @ Waikuku Beach Road Band 1 0 0
Band 2 0 67
Band 3 0 0
Waimakariri River @ Old Highway Bridge (Recorder)
A Permits - Band 2 10 60
Waimak DC 0 70
62
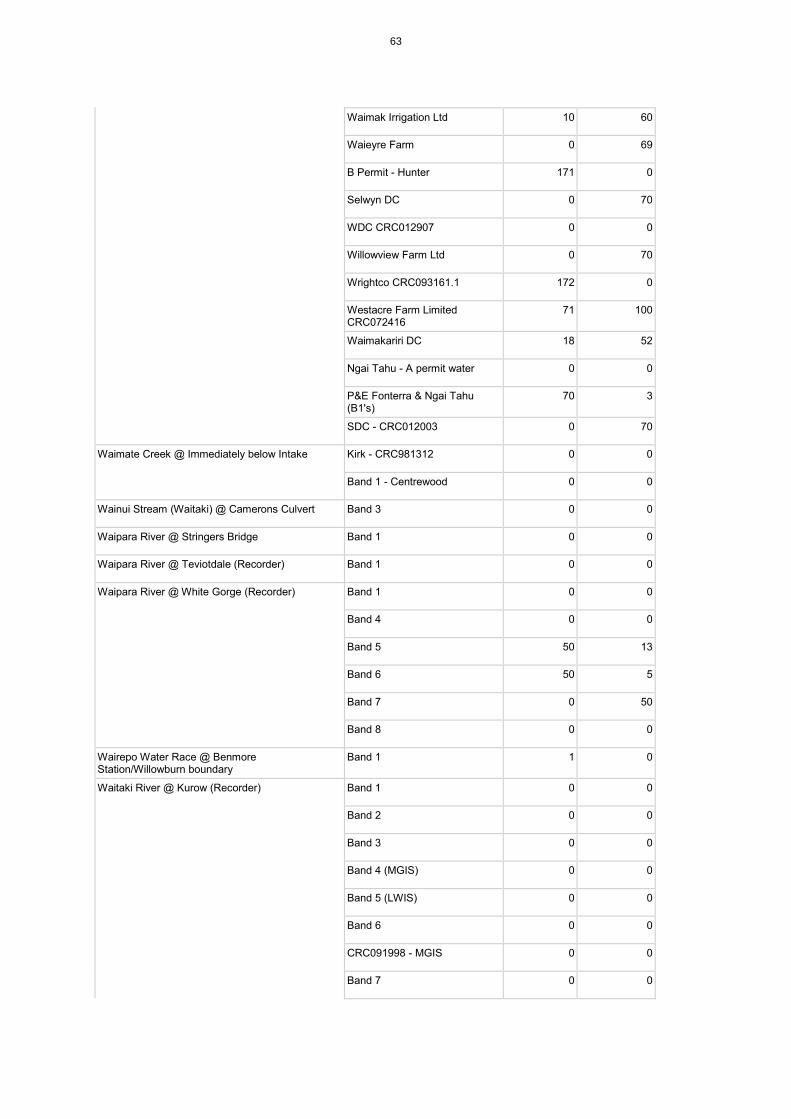
Waimak Irrigation Ltd 10 60
Waieyre Farm 0 69
B Permit - Hunter 171 0
Selwyn DC 0 70
WDC CRC012907 0 0
Willowview Farm Ltd 0 70
Wrightco CRC093161.1 172 0
Westacre Farm Limited CRC072416
71 100
Waimakariri DC 18 52
Ngai Tahu - A permit water 0 0
P&E Fonterra & Ngai Tahu (B1's)
70 3
SDC - CRC012003 0 70
Waimate Creek @ Immediately below Intake Kirk - CRC981312 0 0
Band 1 - Centrewood 0 0
Wainui Stream (Waitaki) @ Camerons Culvert Band 3 0 0
Waipara River @ Stringers Bridge Band 1 0 0
Waipara River @ Teviotdale (Recorder) Band 1 0 0
Waipara River @ White Gorge (Recorder) Band 1 0 0
Band 4 0 0
Band 5 50 13
Band 6 50 5
Band 7 0 50
Band 8 0 0
Wairepo Water Race @ Benmore Station/Willowburn boundary
Band 1 1 0
Waitaki River @ Kurow (Recorder) Band 1 0 0
Band 2 0 0
Band 3 0 0
Band 4 (MGIS) 0 0
Band 5 (LWIS) 0 0
Band 6 0 0
CRC091998 - MGIS 0 0
Band 7 0 0
63

Band 8 0 0
Band 9 0 0
Band 10 0 0
Band 11 0 0
Band 12 0 0
Band 13 0 0
Waitaki River @ Unnamed Drain (Waitaki Dairy) Band 1 0 0
Waitaki River @ Unnamed Drain J40:396-905 band 1 0 0
Waitohi River @ Confluence with Hurunui River Band 1 2 0
Waitohi River @ Lake Sumner Road Bridge Band 1 0 0
Band 2 0 0
Warren Creek @ Rorrisons Road Bridge Band 1 0 0
Band 2 0 0
Band 3 0 0
Washpen Stream @ Bentleys Road Band 1 1 0
Waterfall Creek @ Little Akaloa Chorlton Road Band 1 24 0
Wheatstone Drain @ Croys Road Band 1 0 0
Whitneys Creek @ Immediately d/s of intake CRC120452 0 0
Windermere Drain @ Poplar Road Band 1 0 0
64