hy-wire and fast electric field change measurements … · hy-wire and fast electric field change...
TRANSCRIPT

Appendix C
NASATechnical Memorandum 85072
HY-WIRE AND FAST ELECTRICFIELD CHANGE MEASUREMENTSNEAR AN ISOLATED THUNDERSTORM
Robert H. Holzworth andDavid M. LeVine
August 1983
National Aeronautics andSpace Administration
Goddard Space Flight CenterGreenbelt Maryland 20771
https://ntrs.nasa.gov/search.jsp?R=19840002624 2018-07-05T15:43:52+00:00Z

TM 85072
HY-WIRE AND FAST ELECTRIC FIELD CHANGE MEASUREMENTS NEAR
AN ISOLATED THUNDERSTORM
Robert H. Holzworth
and
David M Le Vine
August 1983
GODDARD SPACE FLIGHT CENTER
Greenbelt, Maryland 20771

C2

C3
HY-WIRE AND FAST ELECTRIC FIELD CHANGE MEASUREMENTS NEAR AN ISOLATEDTHUNDERSTORM
Robert H. HolzworthUniversity of Washington
Seattle. Washington
and
David M. Le VineNASA/Goddard Space Flight Center
Greenbelt, Maryland
ABSTRACT
Electric f i e ld measurements near an isolated thunderstorm at 6 4 km distance are presented
trom both a tethered balloon experiment called Hy-wire and also trom ground based fast and slow
electric field change systems Simultaneous measurements were made ot the electric fields during
several lightning Hashes at the beginning of the storm which the data clearly indicate were cloud-to-
ground flashes In addition to providing a comparison between the Hy-wire technique tor measuring
electric t ields and more traditional methods, these data are interesting because the lightning flashes
occurred prior to changes in the dc electric held, although Hy-wire measured changes in the dc field
of up to 750 V/m in the direction opposite to the ta i r weather f i e ld a short t ime later Also, the dc
electric held was observed to decay back to its pre-flash value af ter each flash The data suggest
tha t H \ -wi re was at the field reversal distance for this storm and suggest tha t charge realignment was
t ak ing place in the cloud with a time constant on the order ot 20 seconds
in

C4

C5
INTRODUCTION
During a July 1982 flight of the Hy-wire experiment (see Holzworth et al , 1981) to measuie
atmospheric potent ials a small air mass thunderstorm developed within a tew kilometers ot Hy-wire
This report will describe the observations trom both Hy-wire and a nearby ground based electnc
held change system of the type conventionally used to study radiation from lightning (Uman. 1969
K n d e r e t al . 1977) The balloon (light was designed to be a tair weather experiment but the thun-
derstorm developed in a location which posed no immediate threat to the tethered balloon. Conse-
quent ly , the balloon and wire remained aloft unt i l ground winds became unsafe, which was 50
minutes a f t e r the first lightning strokes were recorded Four cloud-to-ground strokes were simultan-
eously observed by Hy-wire and by the electric field change system. They occurred prior to any
evidence ot charge build-up in the cloud. This paper will I) describe the Hy-wire measurements and
weather conditions during this flight. 2) present Hy-wire observations of the cloud-to-ground light-
ning strokes which suggest that they transterred trom 0.3 C to 5 2 C to ground. 3) present fast and
slow electric held changes measured on the ground during the early lightning strokes which clearly
show that these were nearby cloud-to-ground discharges and 4) discuss the implications of the
measurements to the charge structure of this storm.

C6
INSTRUMENTATION
Figure 1 shows a plan view of NASA's Wallops Island indicating the experiments and the
thunderstorm at 1740 UT on July 17, 1982 The Hy-wire apparatus and tethered balloon were lo-
cated on the coast near the rocket launching sites and the electnc field change system was located
about 3 km northwest at the Spandar radar facility. The thunderstorm was in the position indi-
cated in Figure 1 when the first lightning strokes occurred.
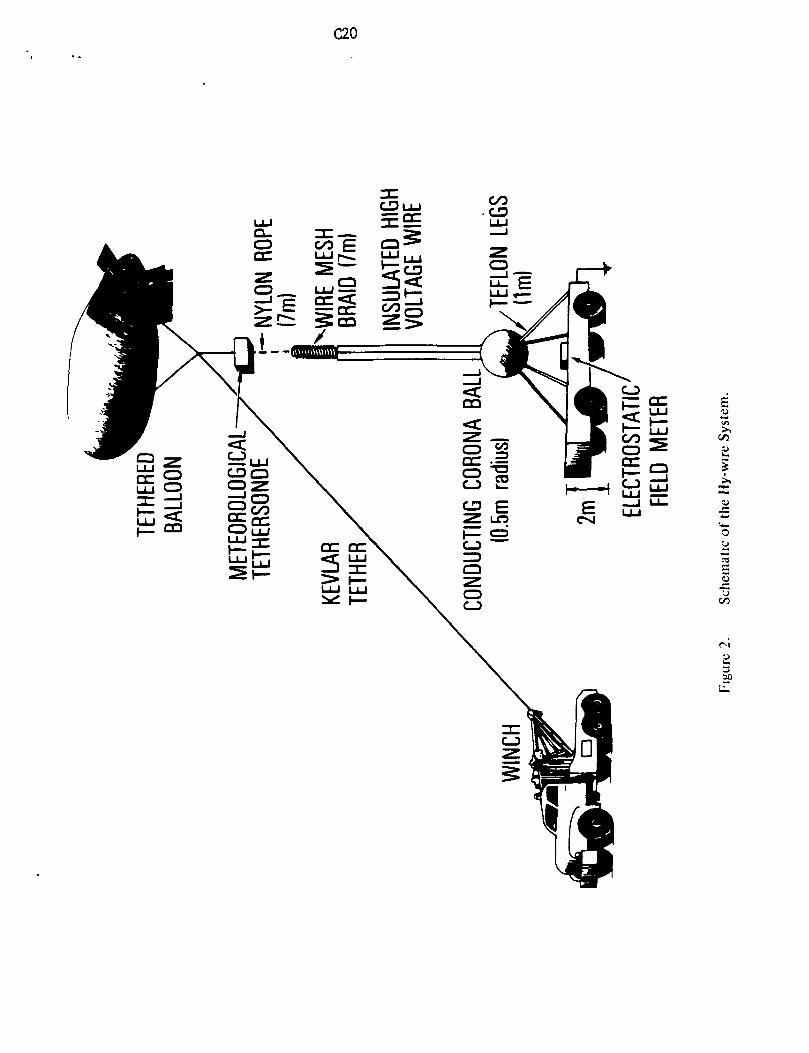
The Hy-wire system (Figure 2) consists of a long insulated conductor connected at the top
to a braided wire mesh and terminated at the bottom inside a large diameter corona ball mounted
on 1 meter Teflon legs. The tethered balloon is used to raise the insulated wire which hangs slack
(vertically) below the balloon and otherwise is electrically isolated from the system. The Hy-wire
instrumentation has been described by Holzworth et al. (1981), and Holzworth (1983) in conjunc-
tion with earlier expenments from the same location on Wallops Island. The actual high voltage
wire used during the July 1982 flight was an improved version of the one used earlier The July
1982 flight was the first flight test of a new system designed to go up to heights of 2 km and poten
tials of 250 kilovolts. However, this flight used the same small tethered balloon which had been
used previously and it was not capable of lifting the new wire above about 350 m altitude. The
data obtained by Hy-wire during the thunderstorm was primarily from an altitude of 275 m.
The new wire itself was specially designed by the Belden wire company It has an inner core
of braided Kevlar for strength and this is surrounded by a conducting wire braid of 34 gauge wire
which is embedded in an extruded layer of conductive polyethylene Another nonconducting layer
of polyethylene is extruded around the outside. The outer diameter is 1 05 cm, and there is no
abrasion jacket (to keep the weight down) The wire has been leakage-tested at lOOkV in grounded
salt water to have a resistance of more than 10^- ohms which is two orders of magnitude larger
than the measured source impedance (Holzworth et al . 1981).
In its raised position, the Hy-wire senses the atmospheric potential at the top ot the wire
(exposed mesh) relative to the ground This potential appears on the corona ball at the base of
the wire and is measured with an electrostatic field meter placed close to the ball (Monroe model
No 1445) At low frequencies the wire responds like any other electrically short antenna and an
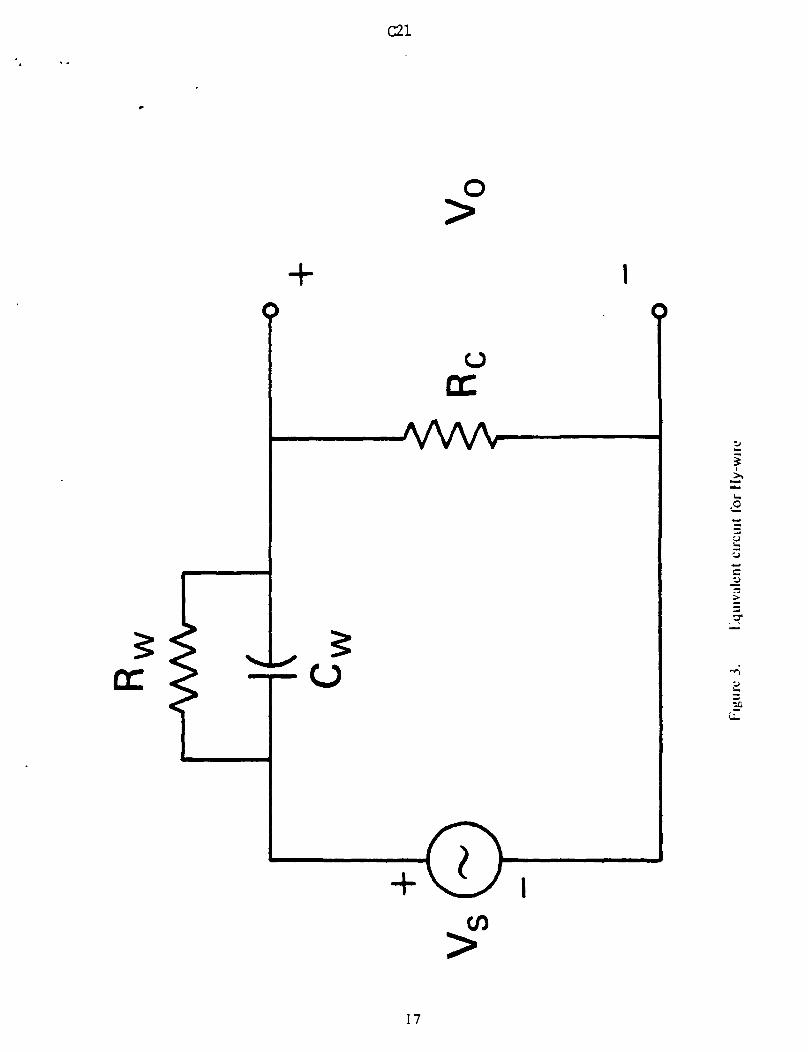
equivalent circuit tor the Hy-wire system is shown in Figure 3 The source voltage Vs represents
the potential induced in the wire due to an external electnc field. It is the potential difference

C7
between the mesh at the top of the wire and the ground, and in a uniform field is just the electric field
times the height to which the wire has been raised. The wire itself has a capacitance Cw which de-
pends on its length and is approximately 5500 pf/km (Holzworth, 1983) The capacitance is not
perfect because the wire can be charged and discharged to the atmosphere through the exposed
mesh at the top and to a less extent through the insulating jacket. Rw represents this leakage resis-
tance. It has been measured to be on the order of 10^ ohms (Holzworth, 1983) Leakage from
the corona ball is much less and is represented in the equivalent circuit by the resistor Rc This re-
sistor is on the order of 10^ ohms (Holzworth, 1983) Under dc conditions, the output voltage V0
measured by the field meter is V0 = VSRC/(RC + Rw) and the step response of the system (i e . the
output voltage Vo(t)due to a sudden change AVS m the source potential due, for example, to a near-
by iightnmg flash) is V0(t) = Vs[ 1 - ^ (1- exp(-t/CwReq))] where Req = RCRW/(RC + Rw)Kw "*" Kc
Defining the relative error between input and output to be (output — input)/(mput), one finds that
when Rc is larger than Rw, the error is on the order of RW/RC f°r both the dc and step response. In
the case of Hy-wire. RC»RW and consequently, both the dc and step response of the system are
very good representations of the input.
The electric field change system used in the experiment was of the Knder et al. design
(Knder. et al., 1977. Le Vine and Knder, 1977). It consists of a flat plate antenna (about 40 cm
diameter) followed by an integrator and recording device. The integrator compensates for the capac-
itive response of the antenna and also provides gam (Uman, 1969, Knder et al, 1977). The equiva-
lent circuit for this system is similar to Figure 3 with the load Rc replaced by a resistor and capaci-
tor m parallel. Two such systems, similar except for the integrator's time constant, were used to
record electric field changes The time constant for the "slow" electric field change system was
about 1 second and for the "fast" electric field change system was about 1 millisecond The slow
electric field changes were recorded on magnetic tape and also on a chart recorder, a combination
having an effective frequency response from a few Hertz to a tew kilohertz The slow electric field
changes are indicative of the quasi-static electric fields at the ground due to changes in the charge in
the cloud (Uman, 1969). The fast electric field change system was designed to record the electric
field waveform during sharp transients in the field. These waveforms tend to have shapes which
are characteristic of the discharge process (return stroke, stepped leader, etc.) which produced them
(Tiller, et al , 1976, Weidman & Knder, 1979, Knder et al., 1977) The signal from this antenna
normally goes directly to a high speed digital sample and hold device (Biomation Model 8100 wave-
form recorder) capable of sampling at (selectable) rates up to 10^ samples/second and storing 2000
samples per record The digital record is transferred to a buffer (in about 1 ms) and the Biomation
3

C8
is then re-armed^The buffer can store up to 10 records and after the lightning flash ends the infor-
mation in the buffer is transferred to magnetic tape for permanent storage. These data are also re-
corded in analogue form on magnetic tape for post processing using a system substantially the same
as described by Le Vine and Knder (1977) The tape recorder permits continuous recording but
incurs a penalty in the form of the increased noise and bandwidth limitations of the tape recorder
(about 100 KHz). The fast field changes to be presented here were obtained after the storm was
over trom the tape recorded data using the digital system.
In addition to the electric field measurements, optical lightning transient measurements
were made with a prototype unit being prepared tor long duration stratospheric flights (see Holz-
worth. 1982) This sy tem consists of a stroke counter and a peak power detector using optical
photodiodes Two photodiodes are used, one of which is preceded by a narrow wavelength inter-
ference f i l t e r between 700 and 710 nm and one which is a bare photodiode In this system, the
transients are detected and counted using the filtered diode output, and the peak power measure-
ment is obtained using the bare photodiode The instrument was calibrated on an optical bench in
a darkroom using a broadband lightning simulator (Edgar, private communication. 1982). The
ins t rument covers the range of 6 x 10 watts to 5 x 10 watts at 10 km range
C9
OBSERVATIONS
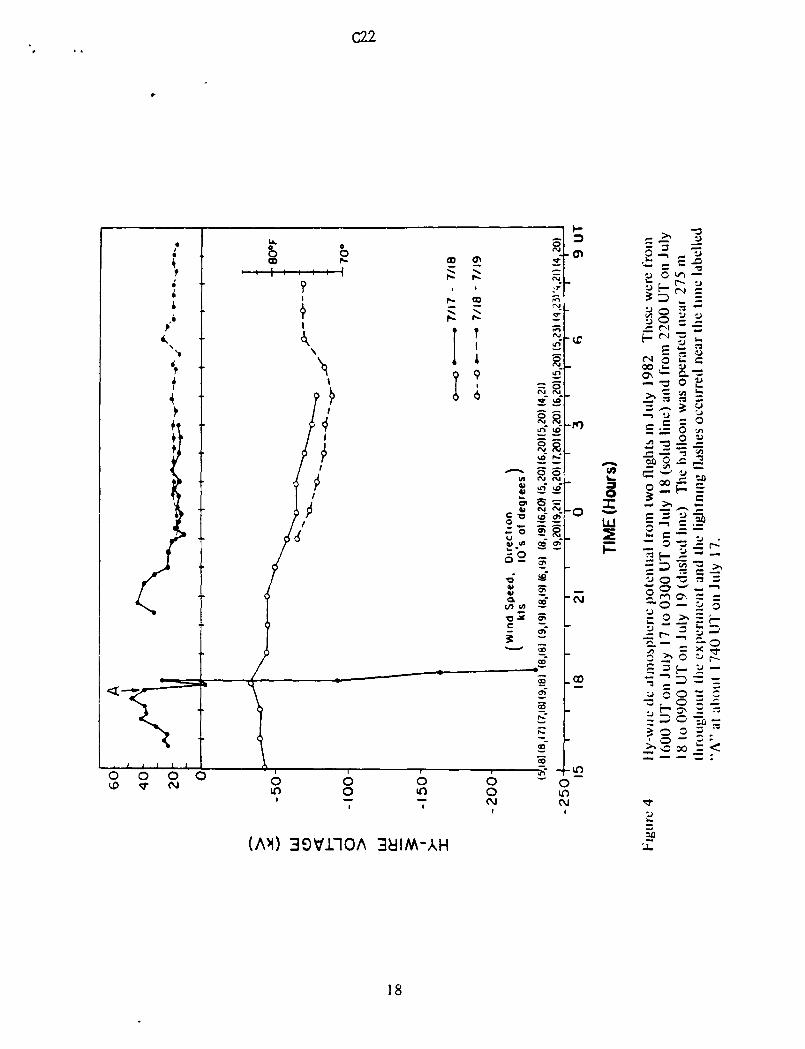
Figure 4 presents the Hy-wire measurements and meteorological parameters (temperature
and winds) during balloon (lights on July 17, 18. and 19 Hy-wire was operated tor two 12 hour
shif ts beginning near 1600 UT on July 17 until near 0300 UT on Ju ly 18 and then beginning near
2200 UT on July 18 unt i l about 0900 UT on July 19 The do variations during this penod com-
pare tavorably to previous fair weather data collected in 1981 but were interrupted by the thunder-
storm The nighttime data were mostly near 30 kilovolts and collected at an antenna (Hy-wire)
height ot 365 m This yields an average electric field of 82 volts/meter, which is about a factor
of two below measurements made in May 1981 (Holzworth. et al , 1981). but except for the pres-
ence of the thunderstorm, the data between 1500 and 2200 UT are very similar to the earlier ob-
servations
The most prominent feature in Figure 4 is the signature of the thunderstorm which first pro-
duced a brief field reversal just before 1800 (July 17). then a very strong reversal up to the point
where ground winds forced the temporary termination of the tethered balloon flight at 1827 UT
The lightning transients to be discussed below occurred near the time labelled A in Figure 4. Aside
from the thunderstorm itself , this was a penod of clear to partly cloudy weather with a visibility
of 7 to over 10 miles most of the time.
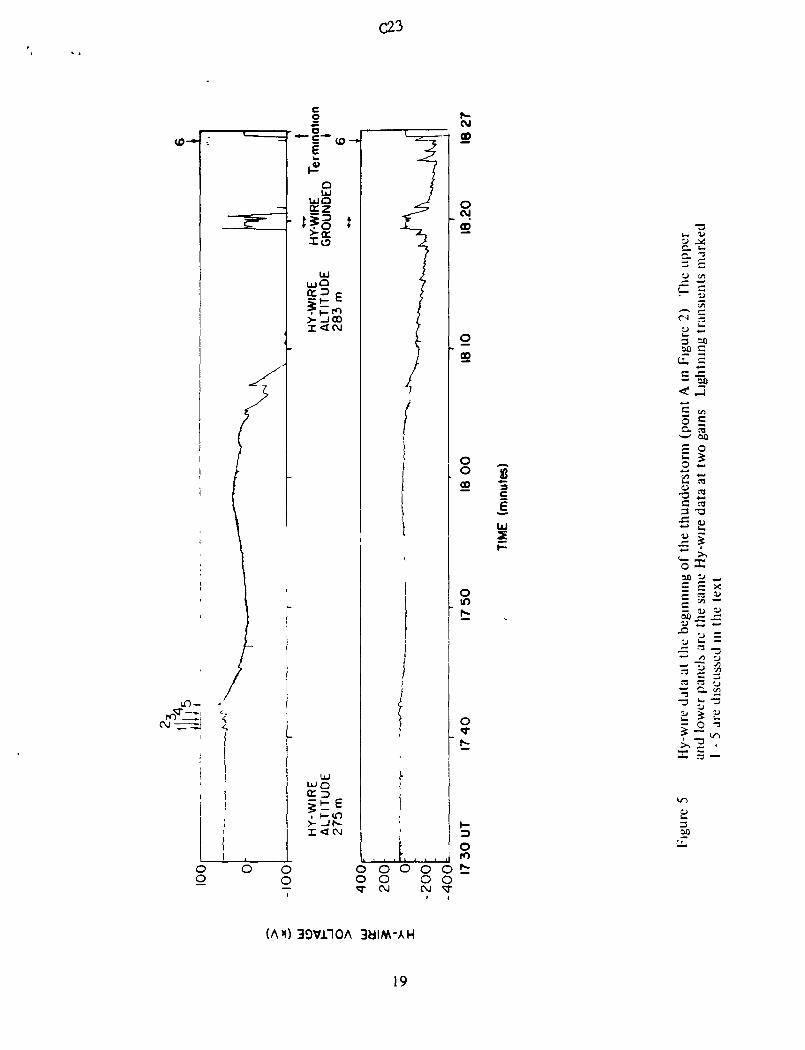
Figure 5 shows an expanded view of the Hy-wire measurements between 1730 and 1825 UT
on Ju ly 1 7. 1982 The two panels are the same data with different gams The l ightning strokes to
be discussed below are numbered 1-6 It is of interest to note that prior to the first stroke, the elec-
tric field was constant and in the fair weather direction (positive voltage) Also, all numbered light-
ning strokes are enhancements in the direction of the fair weather field as would be the case tor
decreasing negative charge overhead as is typical of cloud-to-ground strokes Figure 6 shows a fur-
ther expanded view of lightning strokes 1-5 In this figure it can be seen that the transients vary
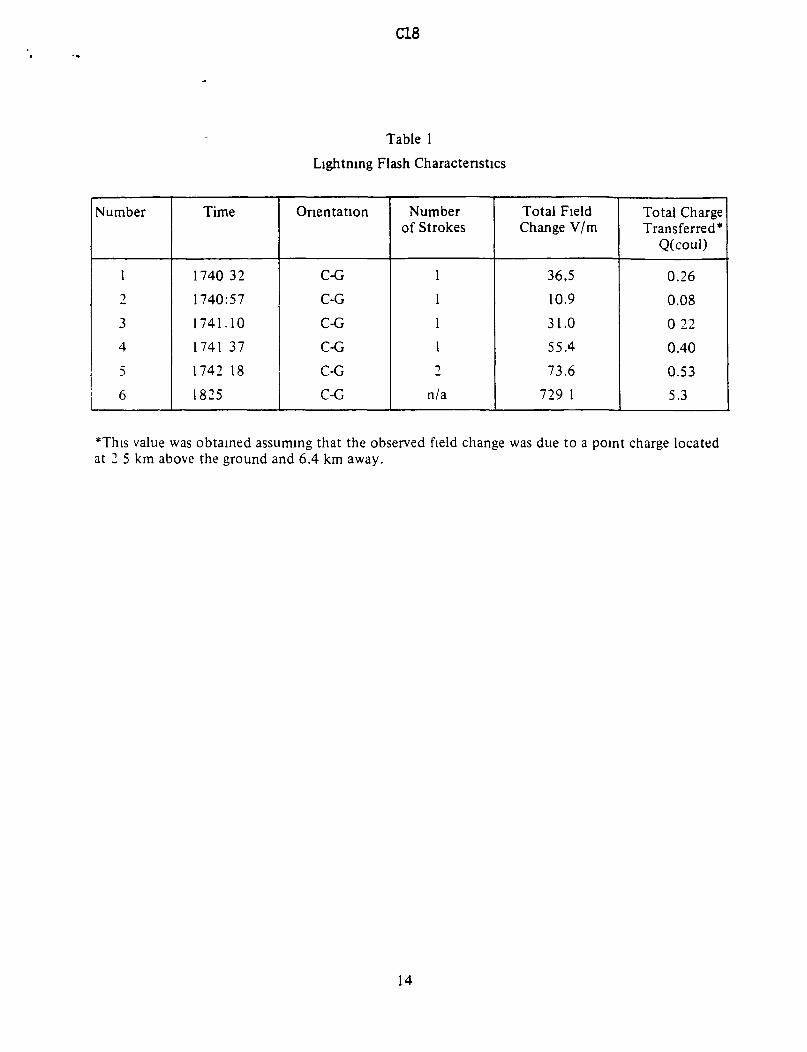
from 3 to 20 kilovolts which is equivalent to 10 to 73 V/m and a charge transfer ot about 0 1 to
0 5 coulombs (Table 1) Note in particular that after the first few strokes, the electric field decays
back to near the starting level and that it is not until after stroke number 5 that a noticeable de-
ciease occurs in the dc electric field. Figure 6 also indicates the readings from the optical light-
ning sensors Each measured lightning flash was between 2 4 x 10^ and 4 0 x 10^ watts at 6 4 km
horizontal range (no data was recorded for flash number 1)

CIO
The slow "electric field changes recorded on the ground during these lightning flashes are
shown in Figure 7. Clearly identifiable field changes were recorded for each of the events seen
with the Hy-wire except for the first. These field changes are in the direction of enhanced fair
weather electric field, and have the sign and abrupt transition characteristic of return strokes which
lower negative charge to the ground (Uman, 1969; Livingston and Knder, 1978, Le Vine, 1978) In
the fifth event (at 17 42.18) two transients are present, suggesting a cloud-to-ground flash with two
return strokes. Fast electric field changes during this period were recorded on magnetic tape and
analyzed later using a Biomation waveform recorder. Fast electric field changes were detected on
the tape corresponding to flashes 3, 4, and 5. Each of these fast field changes were in the direction
associated with return strokes lowering negative charge to the ground. As expected, two fast field
changes were found for Flash 5 corresponding to the two abrupt transitions on the slow electric
field change record. These were the strongest field changes observed among these flashes. Figure 8
shows an expanded record of the slow electric field change for flash 5 at the top and the fast elec-
tric field change for each of the transitions (A and B) at the bottom. The fast electric field changes
were obtained using a Biomation 8100 with a sample rate of 0 2 MS/sample(5 x 10^ samples/second).
The transient wavelorm recorder stores 2000 samples yielding the data window of 400 MS shown.
The fast field changes in Figure 6 have shapes typical of the radiation from return strokes of close
cloud-to-ground flashes (Tiller, et al., 1976. Knder, et al., 1977. Lin, et al., 1979) and are consistent
with the hypothesis that they came trom a storm about 5 km away (Figure 1). The fast field changes
recorded tor events 3 and 4 are shown together with the associated slow field changes in Figure 9
These were of marginal quality but also have a shape consistent with close return strokes which
lower negative charge to ground
Cll
DISCUSSION
The data at the time of the cloud-to-ground flashes (Figure 6) exhibit two features ot par-
ticular interest 1) no changes were observed in the dc electric field prior to the first cloud-to-ground
flash, and 2) the dc electric field after each cloud-to-ground flash decays back toward its preflash
fair weather value. Based on a conventional dipole model for the charge distribution in a thunder-
storm, one would have expected to observe changes in the electrostatic field before the hrst light-
ning flash (i e , to have seen evidence of the dipole as it developed) and to have seen a net dc change
in the electric field after each return stroke (due to charge neutralization in the cloud)
One possible explanation for the absence of a change in the dc electric field prior to the first
lightning flash is that the Hy-wire was located near a field reversal point (Uman. 1969. Chalmers,
1967) for this storm Assuming a dipole model for the charge distribution with an upper positive
charge Q at an altitude H"1" and a lower negative charge - Q at H~, the electrostatic field at the ground
is negative (opposite to the direction of the fair weather field) close to the storm because of the
proximity of the lower negative charge and eventually changes sign and becomes positive further
from the storm. The location of this transition point depends on H"1" and H~ but not on Q. hence,
an observer located at this point would not see a change in the electric field as charge began to sepa-
rate in the thunderstorm. In tact, the storm-sensor geometry during this experiment is quite consis-
tent with this hypothesis For example, assuming the negative charge to be located slightly above
the freezing level at 2.7 km and placing the positive charge at 7 km which is just below the cloud
tops measured by the Spandar radar (7 6 km) one finds a field reversal distance of 6.3 km which is
the distance from Hy-wire to the storm. In fact, this field reversal distance is on the order of 6 km
for a reasonable range of charge locations (6 km < H+ < 7 km and 2 5 km < H~ < 3 5 km) and it
doesn't change very much even if one modifies the charge distribution by assuming a small positive
charge located at the base of the cloud (Uman, 1969.Malan, 1963)
The hypothesis that the Hy-wire was at the field reversal distance would explain why no elec-
trostatic tields were seen pnor to the first cloud-to-ground flashes It also is consistent with the Hy-
wire observations of electric tields after these flashes which consisted of a slow oscillation between
17 40 and 18 10 (Figure 6) followed by a dramatic decrease which began about 18 10 (Figure 5)
and continued to the termination of the Hy-wire flight The electric fields near a field reversal point
are particularly sensitive to small changes in the separation between charges and could exhibit sim-
ilar behavior in response to growth and decay cycles of the storm if these affect the magnitude and

C12
location of the charges. In particular, suppose that the upper positive charge, Q, of a dipole under-
goes a change A in its altitude, H (f A « H, the electric field at the field reversal point D is ap-
proximately E(A) = (QA/47re0) [1 + H2 /(H2 + D2)] [H- + D2]'3/2 The change in electric field is in
the direction opposite to the fair weather field (negative in Figures 5 and 6) and is directly propor-
tional to A and Q Assuming that H = 7 km and D = 6.4 km, as before, and letting Q = IOC and
A = 500 m. one obtains a change in the potential of the Hy-wire of about 50 kV, and if Q = 40 C
which is more typical of an active storm (Uman, 1969), then the change in potential is on the order
of 200 kV These values arc consistent with the changes measured by Hy-wire during the slow
oscillation and rapid negative change after the first cloud-to-ground flashes. Thus, suppose that Hy-
wire was at held reversal point and that following the cloud-to-ground Hashes at 17 40 UT the storm
began to intensify, slightly raising the upper positive charge center in the process The result would
be decreasing (more negative) voltage on Hy-wire. If the charge on the dipole were about 10 C and
the maximum change in height was about 500 m. then the Hy-wire voltage would change trom its
preflash value ot about 40 kV to -10 kV as in Figure 5 If the intensification died tor some reason,
only to begin again in earnest later then one would expect an oscillation followed by a large negative
change as occurs in the Hy-wire data Bipolar cycles ot this sort are not atypical of thunderstorms
(e g Livingston and Krider. 1978) This picture of a weak cycle followed by a strong cycle is also
supported by estimates of the charge transferred by return strokes during the cloud-to-ground flashes
(Table 1) These were small (on the order ot 0 3 C) for the initial flashes at 17 40 and much larger
(5 3 C) for a flash (number 6. Figure 6) recorded jus t before the Hy-wire flight was terminated
A second fea ture of the data that is interesting is the decay of the electric field between the
Joud-to-ground flashes towards its pre-flash value (Figure 6) In the traditional model ot a cloud-
to-ground flash the return stroke transfers charge trom cloud to ground The effect is equivalent to
adding a positive charge to the cloud and should be manifested in an abrupt increase in the dc elec-
tric field in the direction ot the fair weather field In tac t , evidence to support this picture can be
seen in the fast and slow field changes recorded during these flashes (Figures 8 and 9) In the case
ot the fast field changes, an electrostatic contr ibution to the waveform is to be expected from close
ic turn strokes due to the accumulation of charge at the channel ends as current flows along the
channel (e g Le Vine and Meneghim. 1983) This is deaily evident in Figure 8A where the fast
f i e l d change shows a sharp in i t ia l peak (due to the radiation field) followec' by a contribution which
slowly rises as chaige is transtened along the return stroke channel The slow electric field change
system, which has much less bandwidth, responds to the quasi-static conditions before and after the
return stioke Consequently, one would expect it to have a step-like response to the charge transfer

C13
that occurs dunng the return stroke. Such a response is clearly evident in Figures 8 and 9
The decay in the slow electric field change after the return stroke (Figures 8 and 9) reflects
the time constant of the integrator employed in the electronics Presumably, a system wi th a good
dc response would have measured a true step without this decay As mentioned previously, one of
the unique features of the Hy-wire. one which permits it to measure the slowly fluctuating fa i r
weather f ie ld, is that it has a very good dc response This is because of the large terminating
impedance. Rc. designed into the system (Figure 3) Thus, during a return stroke one would expect
the Hy-wire voltage to jump just like the slow electric field changes in Figures 8 and 9, but to re-
main constant after the jump. In fact, the jump is clearly evident in the Hy-wire data at each cloud-
to-ground flash (Figures 5 and 6) and is in the direction indicating that negative charge has been
removed from the cloud However, the electric field change is not constant but decays back toward
its value prior to the flash. The time constant of this decay is on the order of 20 seconds.
The presence of this decay suggests that the charge transferred by the return stroke does not
remain isolated in the cloud but is being, in some manner, neutralized (or shielded) by other charges
m the cloud (e g Ilhngworth, 1971) Similar decays ot the electric field to its pre-flash value are
observed a f t e r cloud-to-ground flashes with tradit ional field mills on the ground (Wilson, 1920,
Wormell, 1939, Mlmgworth. 1971. Jacobson and Knder. 1976) The tunes observed by Hy-wire are
consistent wi th the observations made by Jacobson and Knder (1976) in Florida but appear to be
somewhat larger than the data reviewed by Illmgworth ( 1 9 7 1 ) However, as Ilhngworth points out.
there is evidence to suggest that the time constant ot the decay is somewhat longer near the f i e ld
reversal point
CIA
SUMMARY
Electric field data including several lightning flashes have been collected during the early
phase of a small air mass thunderstorm on July 17, 1982. These data consist of electrostatic field
measurements obtained with the long (~ 300 meter) vertical antenna called Hy-wire, fast and slow
electric field changes using a flat plate antenna located on the ground, and optical radiation inten-
sity obtained using a pair of photodiodes. The data clearly indicate that the several events recorded
at the beginning of this storm were cloud-to-ground flashes.
These data are interesting for the companson it provides of the Hy-wire measunng tech-
nique with the more traditional modes of observing electric fields on the ground. They are also
interesting because no changes were observed by the Hy-wire in the dc electric field prior to the
lightning discharges and because the field changes occurring after cloud-to-ground flashes decayed
back to the pre-discharge value. The data suggest that Hy-wire was at the field reversal distance
for this storm and give an estimate of the time involved in realignment of charge transferred during
the cloud-to-ground flashes.
10
CIS
ACKNOWLEDGEMENTS
The authors would like to thank their engineering and technicalstaffs including Ed Schnauss,
Mitch Dazey, Dave Boulter, and Bobby Wilson. The Hy-wire experiment could not have been eon-
ducted without the extensive help of the tethered balloon crew from NASA-Langley including
Tom Owens. Otto Youngbluth and Dan Poole. nor without the NASA-Wallops Island crew under
Dick Bradford. This research was supported in part by grant NAG5-604 from the National
Aeronautics and Space Administration to the University ot Washington
11
C16
REFERENCES
1. Chalmers, I. A., Atmospheric Electricity, Permagon Press, Oxford, p 515, 1967
2. Holzworth, R. H., "Hy-wire Measurements of Atmospheric Potential," J Geophys. Res., 87(in press) 1983.
3. Holzworth, R H.. Electrodynamics of the Stratosphere Using 5000 m-* Superpressure Bal-loons," in Scientific Ballooning III (COSPAR), W Reidler and M Fnednch (eds.), Perma-gon Press, Oxford, 1983.
4 Holzworth. R H.. M H Dazey. E R Schnauss, and O Youngbluth, "Direct Measurement andLower Atmospheric Vertical Potential Differences." Geo. Res. Lett.. 8, p. 783, 1981
5 Illmgworth, A J , "The Variation ot the Electric Field after Lightning and the Conductivitywithin Thunderclouds." Quart. J Roy. Met. Soc.. Vol 97, pp. 440-456, 1971.
6 Jacobson, E. A . and E P Knder. "Electrostatic Field Changes Produced by Florida Light-ning." J Atmos Sciences. Voi 33 (No. l ) p p . 103-117, 1976.
7. Knder, E. P . C D Weidman. and R C Noggle. "The Electric Fields Produced by LightningStepped Leaders," J Geophys. Res . 82. pp 951-960. 1977
8 Le Vine. D M . "The Temporal Structure of RF Radiation trom Lightning," NASA TM 78113,April 1978
9. Le Vine. D M.. and E P Knder, "The Temporal Structure ot HF and VHP Radiations DuringFlorida Lightning Return Strokes." Geophys. Res. Lett. Vol. 4, pp. 13-16. 1977
10 Le Vine, D M and R Meneghim. "A Solution for the Electromagnetic Fields Close to aLightning Discharge." Proceedings, International Conference on Lightning and StaticElectricity, pp 70-1 to 70-10. Fort Worth. TX. June 1983
11 Lm. Y T.M A Uman. J. A. Tiller, R D Brantley. W H Beasley, E. P. Knder, and C D.Weidman. "Characterization of Lightning Return Stroke Electric and Magnetic Fieldstrom Simultaneous Two-Station Measurements." J Geophys Res.. Vol. 84 (CIO), pp6307-6314, 1979
12 Livingston. J M and E P Knder (1978). "Electric Fields Produced by Florida Thunder-storms," J Geophys. Res.. Vol 83 (No C i ) . p p 385-401
13 Malan. D J., Physics ot Lightning. English University Press. London. 1963.
14 Tiller. J A . M. A Uman. Y. T Lin. R D Brantley and E P Knder. "Electric Field Statisticsfor Close Lightning Return Strokes Near Gainesville. Florida." J Geophys. Res. 81,pp 4430-4434.
15 Weidman. C D. and E P Knder, "The Radiation Wave Forms Produced by Intracloud Light-ning Discharge Processes." J Geophys. Res . Vol 84. (No. 66) pp 3159-3164. 1979
C17
REFERENCES (Cont )
\ 6 Wilson. C. T. R., "Investigations of Lightning Discharges and on the Electric Field of Thunder-storms," Phil. Trans Roy. Soc London. Vol A221 . pp. 73-115. 1920
1 7 Wormeli T W . "The Effects of Thunderstorms and Lightning Discharges on the Earth'sElectric Field." Phil Trans. Roy Soc London. Vol. 238. pp 249-303, 1939
18 Uman. M A . Lightning McGraw-Hill. 1969.
13
CIS
Table 1
Lightning Flash Characteristics
Number
12
3
4
5
6
Time
1740 32
1740:57
1741.10
1741 37
1742 18
1825
Orientation
C-G
C-G
C-G
C-G
C-G
C-G
Numberof Strokes
1
1
1
1•>
n/a
Total FieldChange V/m
36,5
10.9
31.0
55.4
73.6
729 1
Total ChargeTransferred*
Q(coul)
0.26
0.08
022
0.40
0.53
5.3
*This value was obtained assuming that the observed field change was due to a point charge locatedat 2 5 km above the ground and 6.4 km away.
14

C19
—I g-0
e u C*- £DC/5 (—}C9 U. 2o « S^o -a t^., w —
e -a P0 S 3
<j; wi _>.> 0) U00 "S
- C |2v) sd £« ~ ><
«r a.
.-3 02- u -a
2ao»-(A
15
C20
ewtn
0)
a3
oCC
•VWV
QC CJ
-I-
'J*^c
17
C22
.̂ "3C — _2J
J-5 si— -ay O "^ —
S B ~ It_ r-i ~ .
o HiC^l O ba C
00 t± W —
— ^3 O «
s l S *«2 "2 ~ —". — *3 <^oD O ̂ ,.2
i5 S3
« o° ^ - ~2
5 3
^ ^ -^ — —•j 3 o - c
•3 t_ O X —^ ^ S ^ f2 o o = ,~-L O — £ •
.>» vC 30 _;; <
rf
'd
(AM) 39V110A 3dlM-AH
18
C23
g
I I
aUJQ
LUUjO
>-JOOKCVJ
UJQ
I <CM
?"
/
(1I
,1
1
>
1
. . , ,[
CMCD
.8go
g
" 2
oL °
GO
0to£
O
>-3O
LU
oo o
oO O O O O tO O O O^ CVJ C\J ^T
.y .*:c. t-c. 2
3 =02X) Cul 5
o Sa. sj^ 00
OJ _•o 2c «3 T3
.e i
=
J= -* -3" „ y^ c 3tj C. 22•3 ir "3
in
bso
ul
(A>0 3DV110A 3UIM-AH
19

C24
M QOI * 2 -
i_ro
OJ
Lul
CD
^-
0.O
tnao "JSSc ^s '«ao >~* cq
i. "># eg« *
«•a S
Iu ^
^= O
i 5
3
i£OO
(A>l)39VriOA 3dlM-AH
20

C25
-
*•
ro
CVJ
*.cV)O
u_
11
*
I
\ |o
1)
f
1
O-10
* *?
OCVJ
5-
O
OO
t
ii
^
iiiii!
~
t
*o2 S
"]~ c
UJ5
0 h
_|iT)
i
i
O•3
"2 ,-o u
?su
C t-O n
C/l '̂ _
= C« OJ
'-> —
§ o"y ^
ll</) "3
1C
(W/A) S39dVHO Q"I3U OIH10313
21

C26
iCO
o
OCM
-CD
oo-co
toCVJ
to
OO
OO
1 es i2 —5 ,«
0
E «3 <"
|81w5 — Oto oo u
= i JJ^ O ^
^ Sy E «M O £« CQ 9'"— .̂ k
illc i» p-
211"So> o o
= <u-ar- .̂S o
cs cj JSU- G t-
CO
(IM/A) Q13U 01̂ 10313 (W/A) Q13U DldlD313
S)
22

C2?
ffiCD
5O
d
H
.<
L±J
XO
oLd
ro
-CXJ
-O
-sCO
ro
COro
(A.SJQ.Eo</>OOoCVJ
o0>
•^ Ld£ I
ro
Cu,
<uSO
o
•33
oul
23
BIBLIOGRAPHIC DATA SHEET
1 Report No. 2 Government Accession No
TM 85072
4. Title and Subtitl*̂HY-WIRE AND-FAST ELECTRIC FIELD CHANGEMEASUREMENTS NEAR AN ISOLATED THUNDER-STORM
7 Author(s)Robert H. Holzworth and David M Le Vine
9 Performing Organization Name and Address
Orbiting Satellite Project/ScienceGoddard Space Flight CenterGreenbelt, MD 20771
12. Sponsoring Agency Name and Address
National Aeronautics and Space AdministrationWashington, DC 20546
3. Recipient's Catalog No.
5. Report DateAugust 1983
6. Performing Organization Code
9138. Performing Organization Report No
10 Work Unit No.
1 1 . Contract or Grant No.
13. Type of Report and Period Covered
Technical Memorandum (TM)
14. Sponsoring Agency Code
15 Supplementary Notes
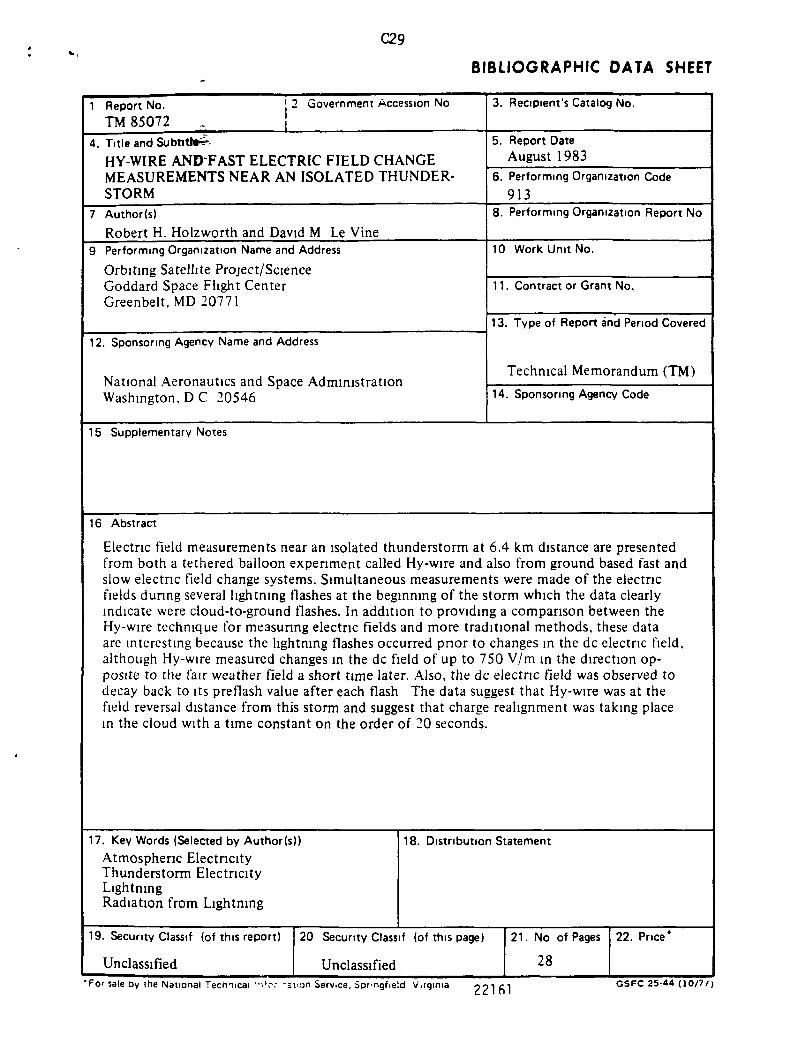
16 Abstract
Electric field measurements near an isolated thunderstorm at 6.4 km distance are presentedfrom both a tethered balloon experiment called Hy-wire and also from ground based fast andslow electric field change systems. Simultaneous measurements were made of the electricfields during several lightning flashes at the beginning of the storm which the data clearlyindicate were cloud-to-ground flashes. In addition to providing a comparison between theHy-wire technique for measuring electric fields and more traditional methods, these dataare interesting because the lightning flashes occurred pnor to changes in the dc electric field,although Hy-wire measured changes in the dc field of up to 750 V/m in the direction op-posite to the fair weather field a short time later. Also, the dc electric field was observed todecay back to its preflash value after each flash The data suggest that Hy-wire was at thefield reversal distance from this storm and suggest that charge realignment was taking placein the cloud with a time constant on the order of 20 seconds.
17. Key Words (Selected by Author(s))
Atmospheric ElectricityThunderstorm ElectricityLightningRadiation from Lightning
18. Distribution Statement
19. Security Classif (of this report)
Unclassified
20 Security Classif (of this page)
Unclassified
21. No of Pages
28
22. Price1
"For sale by the National Techiicai "I'cv "=iion Service, Sppngfield Virqinia GSFC 25-44 (10/7/)