hyaluronic acid-coated silver nanoparticles as a
TRANSCRIPT
S-1
SUPPORTING INFORMATION
Hyaluronic acid-coated silver nanoparticles as a
nanoplatform for in vivo imaging applications
Xin Zhang, †
Meinan Yao, †
Muhua Chen, †
Liqiang Li, †
Chengyan Dong, ‡ Yi Hou,
§Huiyun
Zhao, †,⊥
Bing Jia, *, †,⊥
and Fan Wang,*,†,‡
†Medical Isotopes Research Center and Department of Radiation Medicine, School of Basic
Medical Sciences, Peking University Health Science Center, Beijing 100191, China.
‡Key Laboratory of Protein and Peptide Pharmaceuticals, CAS Center for Excellence in
Biomacromolecules, Institute of Biophysics, Chinese Academy of Sciences, Beijing 100101,
China
§Institute of Chemistry, Chinese Academy of Sciences, Beijing 100190, China
⊥Medical and Healthy Analytical Center, Peking University, Beijing 100191, China.
*Fan Wang. E-mail: [email protected]
*Bing Jia. E-mail: [email protected]

S-2
EXPERIMENTAL SECTION
1. Materials
Ultrapure water (18.2 MΩ) was used throughout the study. All commercially obtained chemicals
were of analytical grade. Silver nitrate (AgNO3) was purchased from Sigma-Aldrich. Hyaluronic
acid (HA) with a molecular weight of 22,000 Da was provided by Zhenjiang Dong Yuan Biotech
Co., Ltd. Sodium borohydride (NaBH4) and sodium citrate tribasic dihydrate were purchased
from Bodi Chemical, Co., Ltd (China). Fmoc-D-Lys-OH·HCl was purchased from GL Biochem,
Ltd. Sodium succinimidyl 6-(2-(2-sulfonatobenzaldehyde)hydrazono)nicotinate (HYNIC-NHS)
was prepared according to a previously reported method1. Na
99mTcO4 was obtained from a
commercial 99
Mo/99m
Tc generator (Beijing Atom High Tech Co., Ltd.). Deuterium oxide (D,
99.9%) was purchased from Cambridge Isotope Laboratories. Cell viability was tested using a
colorimetric cell-counting kit 8 (CCK-8) assay (Dojindo Laboratories, Kyoto, Japan).
2. Cell culture and animal models
The Lewis lung carcinoma (LLC) and RAW264.7 cells were purchased from the American Type
Culture Collection (ATCC) and maintained under standard conditions according to ATCC
guidelines. Both cell lines were grown in high-glucose Dulbecco’s modified Eagle’s medium
supplemented with 10% fetal bovine serum incubated at 37°C in a humidified atmosphere

S-3
containing 5% CO2. The LLC mouse model was established by subcutaneously injecting 5× 10⁶
cells into the right front flank of female C57/BL6 mice. The mice were used for the imaging
study 2 weeks after being inoculated. All animal experiments were performed in accordance with
the guidelines of the Peking University Health Science Center Animal Care and Use Committee.
3. Instruments
The hydrodynamic diameter and zeta potential of the synthesized HA-Ag NPs and citrate-Ag
NPs were analyzed using dynamic light scattering (DLS, Zetasizer Nano, Malvern Instruments,
UK). UV-vis spectra were obtained using a Varian Cary 300 UV-visible spectrometer, and
fluorescence spectra were obtained using a Cary Eclipse spectrometer. Labeling yield and
radiochemical purity of the 99m
Tc-HA-Ag NPs were measured by instant thin-layer
chromatography (ITLC) on a radio thin-layer scanner (Bioscan AR2000, Washington, DC).
Gelman Sciences silica-gel paper strips were used for the ITLC with sodium citrate buffer
(pH=5.0) as an eluent. A SPECT/CT system (NanoScan; Mediso, Budapest, Hungary) was used
to assess the X-ray attenuation of the HA-Ag NPs and capture helical CT and SPECT scans of
the C57/BL6 mice. The CT imaging parameters were as follows: tube energy, 35 kVP, 1,000 µA;
exposure time, 450 ms. 1H NMR spectra were recorded on a Avance III 400 spectrometer using
deuterium oxide (D, 99.9%) as the solvent; the chemical shifts are reported in ppm. Cryo-
transmission electron microscopy (cryo-TEM) images were captured using an FEI TECNAI F30
Field Emission transmission electron microscope operated at 30 kV with a spot size of 3.

S-4
4. Synthesis of HYNIC-conjugated hyaluronic acid (HY-HA)
A solution of 10 mg HYNIC-NHS was mixed with 10 mg of Fmoc-D-Lys-OH·HCl in 250 µL of
N,N-dimethylformamide. The pH was adjusted to 8~9 using 2 µL of N,N-diisopropylethylamine.
The mixture was stirred at room temperature for 20 h. After removal of the Fmoc group with
20% piperidine, the final product, D-Lys-HYNIC, was purified by precipitation in pre-cooled
diethyl ether. Mass spectrometry (MALDI-TOF-MS: m/z, 450.14 for [M-H]+; C19H25N5O6S,
calculated molecular weight 451.15) was used to confirm the identity of the product (Fig. S5).
HA (15 mg) was mixed with 1-ethyl-3-(3-dimethylaminopropyl)carbodiimide (EDC) and N-
hydroxysulfosuccinimide (sulfo-NHS) to form active esters; this solution was then mixed with an
excess of D-Lys-HYNIC in 1 mL of ultrapure water. After the solution was stirred for 12 h at
room temperature, the final product, HYNIC-HA, was isolated by dialysis against ultrapure
water (MWCO 10 kDa). 1H-NMR analysis confirmed the identity of the product (Fig. S4 and
Fig. S6).
5. Synthesis of HA-Ag NPs and citrate-Ag NPs
Silver nitrate (AgNO3) and hyaluronic acid (HA) were dissolved in ultrapure water. HA was
mixed with HY-HA at a molar ratio of 10:1. Freshly prepared aqueous solutions of the HA
mixture (2 mL, 5 mM) and AgNO3 (2 mL, 5 mM) were mixed under vigorous stirring at room
temperature to form HA-Ag(I) complexes. Then, sodium borohydride (NaBH4) solution (250 µL,

S-5
40 mM) was added dropwise, and the solution changed from colorless to yellowish brown. The
final product was obtained at a concentration of 2 mM after the solution was dialyzed against
ultrapure water (MWCO 10 kDa) for 36 h.
The citrate-Ag NPs were synthesized using a similar chemical reduction procedure; AgNO3 and
sodium citrate were first dissolved in ultrapure water. Freshly prepared aqueous solutions of
sodium citrate (2 mL, 5 mM) and AgNO3 (2 mL, 5 mM) were mixed under vigorous stirring at
room temperature, which was followed by the dropwise addition of sodium borohydride
(NaBH4) solution (250 µL, 40 mM). The final product was obtained at a concentration of 2 mM
after the solution was purified by being ultracentrifuged three times at 10,000 g for 5 min using a
30K ultrafiltration device. As shown in Fig. S1, the UV-vis absorption spectra exhibit maximum
peaks for the HA-Ag NPs and citrate-Ag NPs in water at 396 nm and 390 nm, respectively.
6. 99mTc radiolabeling and in vivo SPECT/CT imaging
HYNIC-conjugated HA was labeled with 99m
Tc using tricine and trisodium triphenylphosphine-
3,3’,3’’-trisulfonate (TPPTS) as coligands and was then used as a coating ligand to form the HA-
Ag NPs. After the sample was purified by being ultrafiltrated three times at 10,000 g for 10 min
using a 30K ultrafiltration device, the radiochemical purity of the 99m
Tc-HA-Ag NPs was
determined to be more than 98% using instant thin-layer chromatography (Fig. S7). Using this
method, 99m
Tc complexes and 99m
TcO4− migrated to the solvent front, while
99mTc-HA-Ag NPs
remained at the origin.

S-6
SPECT/CT imaging studies of the 99m
Tc-HA-Ag NPs were performed in LLC tumor-bearing
C57/BL6 mice. Each mouse was injected via the tail vein with 20.35 MBq of 99m
Tc-HA-Ag NPs.
At 2, 4, 8 and 12 h after injection, the mice were anesthetized by inhaling 2% isoflurane and
were imaged using a NanoSPECT/CT camera. The SPECT and CT fusion images were obtained
using the automatic fusion feature of the InVivoScope software (Bioscan Inc.).
7. Cytotoxicity test
RAW 264.7 cells were plated in 96-well plates at a density of 3 x 10⁴
cells in 200 µL of growth
medium per well. After the cells were incubated at 37°C in a humidified 5% CO2 atmosphere
overnight, the wells were treated with 200 µL of different concentrations of HA-Ag NP or
citrate-Ag NP solutions in growth medium. After 24 or 48 h of incubation, the growth medium
was discarded and 10 µL of CCK-8 (in 90 µL of growth medium) was added to each well. After
the cells were incubated at 37°C for another 2 h, the optical density of each well was measured at
490 nm.

S-7
Fig S1. (a) UV-vis absorption spectra of HA-Ag NPs and citrate-Ag NPs in water with maximum
peaks at 396 nm and 390 nm, respectively. (b) Photoemission spectra under excitation at 395 nm.
Inset shows an image of the HA-Ag NPs and citrate-Ag NPs under visible light.

S-8
Fig S2. DLS and zeta potential measurements of as-synthesized HA-Ag NPs (a, c) and HY-HA-
Ag NPs (b, d).
S-9
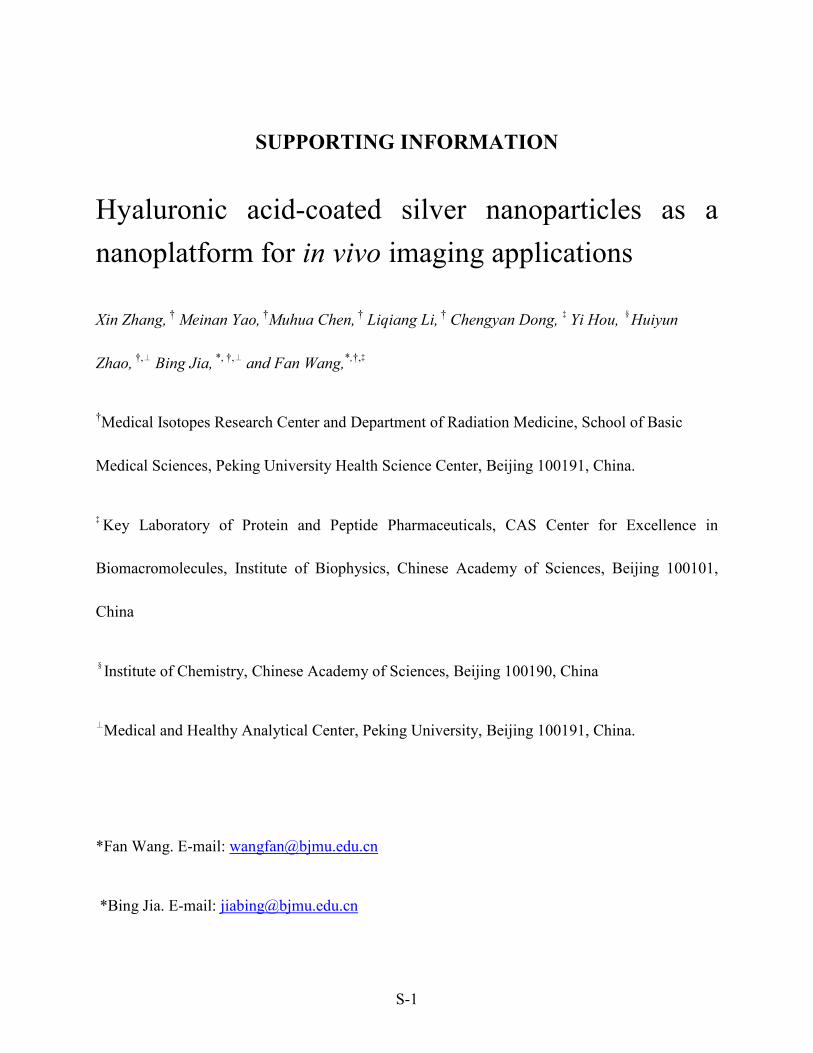
Fig S3. Images of HA-Ag NP aqueous solutions under visible light. Compared with a freshly
prepared sample (a), no color change or precipitate was observed after in a sample that had been
stored for 30 days at 4 °C (b), and the sample remained the same after being centrifuged at 8,000
g for 5 min (c).

S-10
Fig S4. Synthesis of D-Lys-HYNIC and HYNIC-HA.

S-11
Fig S5. Mass spectrometry results of D-Lys-HYNIC (MALDI-TOF-MS: m/z, 450.14 for [M-
H]+; C19H25N5O6S, calculated molecular weight 451.15), confirming the identity of the product.
S-12
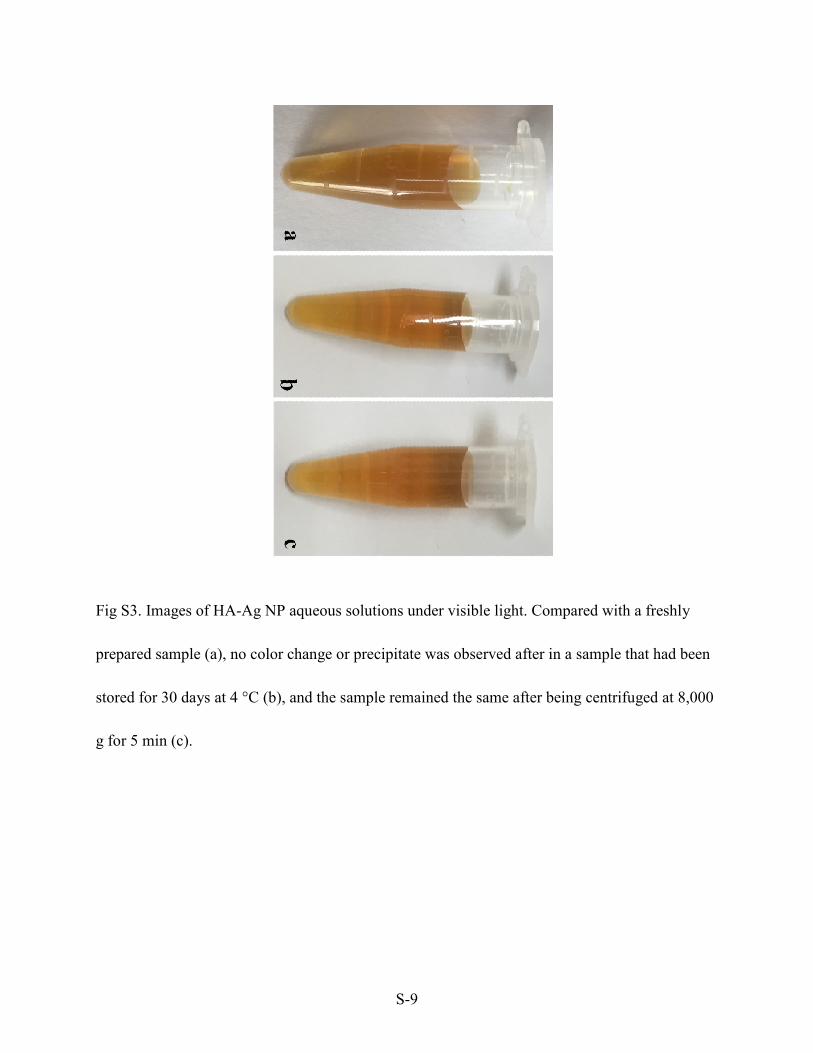
Fig S6. 1H-NMR spectrum of HYNIC-HA. The chemical shifts observed at 7.0–9.0 ppm can be
attributed to the protons of the conjugated HYNIC-NHS.

S-13
Fig S7. ITLC results for 99m
Tc-HA and 99m
Tc-HA-Ag NPs. Using this method, 99m
Tc complexes
and 99m
TcO4−
migrated to the solvent front, while 99m
Tc-HA and 99m
Tc-HA-Ag NPs remained at
the origin.

S-14
Fig S8. Representative whole-body NanoSPECT/CT images of C57 mice with LLC tumor
xenografts obtained at 4, 8, and 12 h post intravenous injection of 99m
Tc-HA (a) and 99m
Tc-HA-
Ag NPs (b).Circles indicate tumors.
S-15
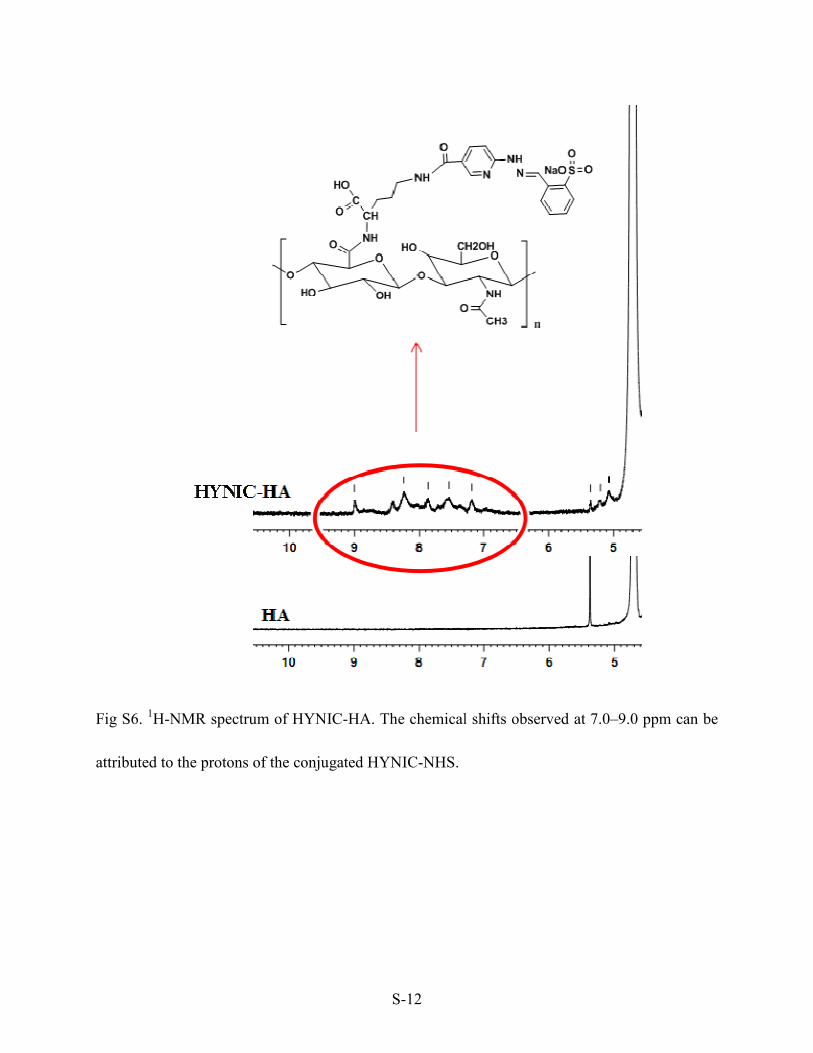
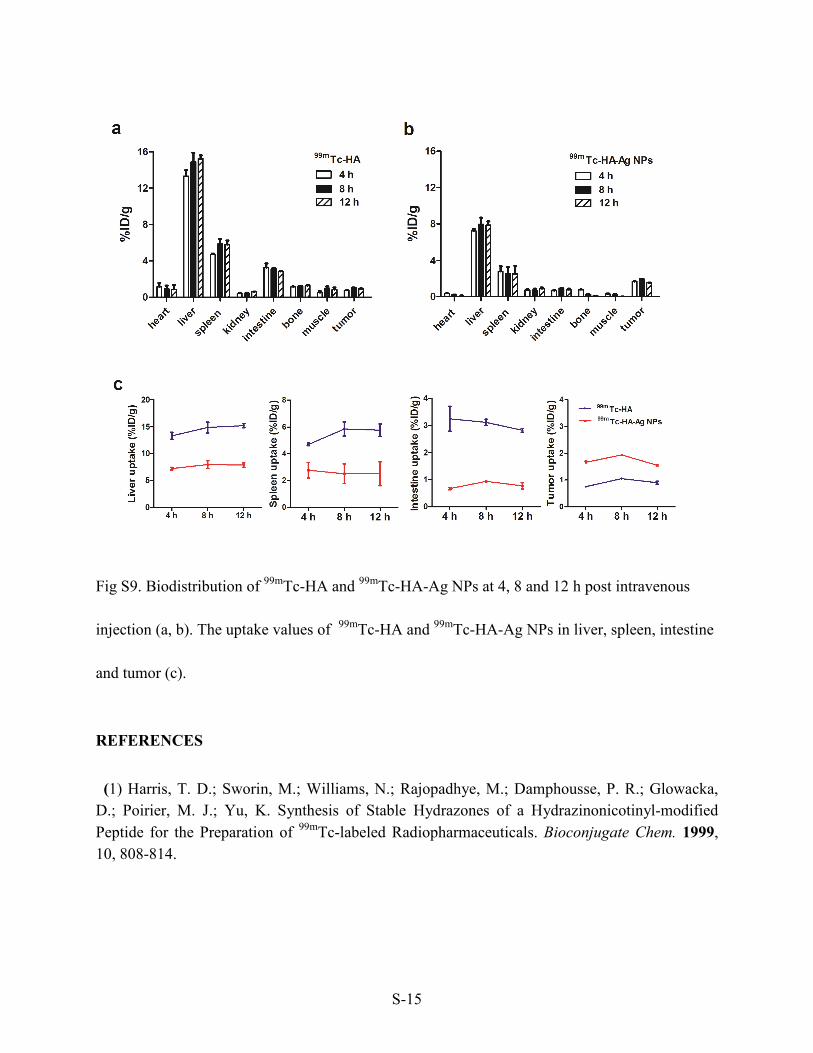
Fig S9. Biodistribution of 99m
Tc-HA and 99m
Tc-HA-Ag NPs at 4, 8 and 12 h post intravenous
injection (a, b). The uptake values of 99m
Tc-HA and 99m
Tc-HA-Ag NPs in liver, spleen, intestine
and tumor (c).
REFERENCES
(1) Harris, T. D.; Sworin, M.; Williams, N.; Rajopadhye, M.; Damphousse, P. R.; Glowacka,
D.; Poirier, M. J.; Yu, K. Synthesis of Stable Hydrazones of a Hydrazinonicotinyl-modified
Peptide for the Preparation of 99m
Tc-labeled Radiopharmaceuticals. Bioconjugate Chem. 1999,
10, 808-814.