hybrid electrical power sysem...
TRANSCRIPT

1
CHAPTER ONE
1.1 INRODUCTION
A small isolated hybrid power system that uses three types of power generation; wind
turbine, photovoltaic modules and diesel generation. The interaction of the wind turbine,
solar PV, diesel generation, and the local load is complicated as the wind, solar and the
load fluctuate during the day. These fluctuations create imbalances in power distribution
since energy sources are not equal to energy sinks and this affects the frequency and the
voltage in the power system. Addition of energy storage helps balance the distribution of
power in the system.
In trying to understand the power system studies are made of interactions among the
power system components and the relative size of the components. Its also studied how
the contribution of either wind or solar energy affect the whole power system and
distribution and also the role of energy storage under the transient conditions caused by
load changes and wind turbine startups.
The diesel generator has a smooth output power, whereas the output of the wind turbine
depends on the wind velocity while PV array output depends on the solar intensity. As
the wind velocity varies, so does the power generation. If the wind speed varies
smoothly, the output power of the wind turbine also changes smoothly. On the other
hand, wind turbulence causes the output power to fluctuate. Varying solar intensity also
affects power generation but not to a larger degree as the wind. The energy storage can
act as a load or as a generator depending on the need.

2
1.2 OVERVIEW
Kina village is located in Meru-Isiolo border in upper eastern province, Kenya. In the
wind resource and solar radiation maps of Kenya, there is evidence that this region has
abundant wind and solar resources that could be commercially utilized to its benefit. It is
in this context that I decided to base the power system in the region. The power system is
to provide electricity to the community in this village.
The stand-alone hybrid wind/photovoltaic/diesel system with back up battery is
demonstrated using data based on this village. The hybrid system was designed to
provide all the electricity used annually by the community. The project proposed
demonstrates that this kind of a system would provide a reliable power for community
use.

3
CHAPTER TWO
2.1The hybrid power system The system consists of five major subsystems, a wind turbine generator; a pv array a
diesel generator, energy storage and the load. These come with their support equipment
including inverters, charge controllers, fuses and circuit breakers and disconnects
2.2 Wind energy Wind energy has been used since time immemorial for pumping water and mill grain
among other uses. This is through use of windmills and wind turbines. One of the most
important applications of wind energy though is electricity generation. Wind turbines can
generate environment friendly electricity. They are suited for generation of grid-
connected electricity as well as generation in isolated places with no utility grid. However
in isolated generation, the power system components (sources and loads) are limited, and
the system are weak in many cases. Thus any changes in input or output of one
component may affect the rest of the power system (small power system) more than in
larger system because in a larger power system the smoothing effect of many components
benefits the overall system.
2.2.1 Wind turbine
The main components of a wind turbine are the rotor of the turbine, which is the prime
mover, and an induction generator. In general, the rotor is connected to the generator via
a gearbox that matches the rotational speed. The simplest system uses fixed-speed
turbine. A fixed-speed turbine must rely on the blade-stall condition to limit the output
power when the winds are at high speed. Although the rotor speed of an induction
generator varies with wind speed, the speed is within 1% to 2% slip. On the other hand,
the wind speed variation may range from 5 m/s to 25 m/s; thus, in terms of the wind
turbine , the induction generator operates at a relatively “fixed speed” compared to the
range of wind speed variation.

4
A wind turbine is designed to produce a maximum of power at wide spectrum of wind
speeds. The wind turbines have three modes of operation:
• Below rated wind speed operation
• Around rated wind speed operation
• Above rated wind speed operation
If the rated wind speed is exceeded the power has to be limited. There are various ways to
achieve this.
Stall: Stalling works by increasing the angle at which the relative wind strikes the blades,
and it reduces the induced drag. Stalling is simple because it can be made to happen
passively (it increases automatically when the winds speed up), but it increases the cross-
section of the blade face-on to the wind, and thus the ordinary drag. A fully stalled
turbine blade, when stopped, has the flat side of the blade facing directly into the wind.
A fixed-speed HAWT inherently increases its angle of attack at higher wind speed as the
blades speed up. A natural strategy, then, is to allow the blade to stall when the wind
speed increases. This technique was successfully used on many early HAWTs. However,
on some of these blade sets, it was observed that the degree of blade pitch tended to
increase audible noise levels.
Pitch control: works by decreasing the angle of attack, which reduces the induced drag
from the lift of the rotor, as well as the cross-section. One major problem in designing
wind turbines is getting the blades to stall or furl quickly enough should a gust of wind
cause sudden acceleration. A fully furled turbine blade, when stopped, has the edge of the
blade facing into the wind.
Standard modern turbines all pitch the blades in high winds. Since pitching requires
acting against the torque on the blade, it requires some form of pitch angle control. Many
turbines use hydraulic systems. These systems are usually spring loaded, so that if
hydraulic power fails, the
Blades automatically furl. Other turbines use an electric servomotor for every rotor blade.
They have a small battery-reserve in case of an electric grid breakdown. Small wind
turbines (fewer than 50 kW) with variable-pitching generally use systems operated by

5
centrifugal force, either by flyweights or geometric design, and employ no electric or
hydraulic controls.
Yawning: Modern large wind turbines are typically actively controlled to face the wind
direction measured by a wind vane situated on the back of the nacelle. Minimizing the
yaw angle (the misalignment between wind and turbine pointing direction), the power
output is maximized and nonsymmetrical loads minimized. However, since the wind
direction varies quickly the turbine will not strictly follow the direction and will have a
small yaw angle on average. The power output losses can simplified be approximated to
fall with cos3 (yaw angle).
Electrical breaking
Braking of a small wind turbine can also be done by dumping energy from the generator
into a resistor bank, converting the kinetic energy of the turbine rotation into heat. This
method is useful if the kinetic load on the generator is suddenly reduced or is too small to
keep the turbine speed within its allowed limit.
Cyclical braking causes the blades to slow down, which increases the stalling effect,
reducing the efficiency of the blades. This way, the turbine's rotation can be kept at a safe
speed in faster winds while maintaining (nominal) power output. This method is usually
not
applied on large grid-connected wind turbines.
Mechanical braking
A mechanical drum brake or disk brake is used to hold the turbine at rest for
maintenance. Such brakes are usually applied only after blade furling and
electromagnetic braking have reduced the turbine speed, as the mechanical brakes would
wear quickly if used to stop the turbine from full
speed. There can also be a stick brake.
Wind energy cost
The main parameters governing wind power economics include the following:
• Investment costs, including auxiliary costs for foundation,

6
• Operation and Maintenance (O&M) costs.
• Electricity production/average wind speed.
• Turbine lifetime.
• Discount rate.
Of these, the most important parameters are the wind turbines’ (WT) electricity
production and their investment costs. As electricity production is highly dependent on
wind conditions, choosing the right site is critical to achieving economic viability.
O&M costs constitute a sizeable share of the total annual costs of a WT. For a new
machine, O&M costs might easily have an average share over the lifetime of the turbine
of approximately 20%-25% of total levellised cost per kWh produced – as long the WT is
fairly new, the share might constitute 10%-15% increasing to at least 20%-35% by the
end of its life.
O&M costs are related to a limited number of cost components:
• Insurance
• Regular maintenance
• Repair
• Spare parts
• Administration
Some of these cost components can be estimated with relative ease. For insurance and
regular maintenance, it is possible to obtain standard contracts covering a considerable
portion of the WT’s total lifespan. On the other hand, costs for repair and related spare
parts are much more difficult to predict. Although all cost components tend to increase,
costs for repair and spare parts are particularly influenced by turbine age, starting low and
increasing over time.
2.2.2 Asynchronous machines
The applications of induction machines are, one as the generator on the wind turbine and
the other as a motor running large pumps. By its nature, an induction motor is an
inductive load. This machine absorbs reactive power either as a motor or a generator. The
reactive power absorbed by the induction motor comes from the line to which it is

7
connected. This is either from the diesel generator or grid. In a hybrid power system the
reactive power comes from the synchronous generator of the diesel gen set. In a wind
turbine the generator fixed capacitor is usually installed to supply some of the reactive
power that the induction generator needs. Figure 3 shows the equivalent circuit of an
induction machines connected to a power system. The power system is represented by
infinite bus Es and the line impedance is represented by reactance Xs.
2.3 Solar energy
2.3.1 Solar photovoltaic technology
Photovoltaic energy is the conversion of sunlight into electricity. A photovoltaic cell,
commonly called a solar cell or PV, is the technology used to convert solar energy
directly into electrical power. A photovoltaic cell is a non-mechanical device usually
made from silicon alloys.
Sunlight is composed of photons, or particles of solar energy. These photons contain
various amounts of energy corresponding to the different wavelengths of the solar
spectrum. When photons strike a photovoltaic cell, they may be reflected, pass right
through, or be absorbed. Only the absorbed photons provide energy to generate
electricity. When enough sunlight (energy) is absorbed by the material (a
semiconductor), electrons are dislodged from the material's atoms. Special treatment of
the material surface during manufacturing makes the front surface of the cell more
receptive to free electrons, so the electrons naturally migrate to the surface.
When the electrons leave their position, holes are formed. When many electrons, each
carrying a negative charge, travel toward the front surface of the cell, the resulting
imbalance of charge between the cell's front and back surfaces creates a voltage potential
like the negative positive terminals of a battery. When the two surfaces are connected
through an external load, electricity flows.

8
The photovoltaic cell is the basic building block of a photovoltaic system. Individual
cells can vary in size from about 1 centimeter (1/2 inch) to about 10 centimeter (4 inches)
across. However, one cell only produces 1 or 2 watts, which isn't enough power for most
applications. To increase power output, cells are electrically connected into a packaged
weather-tight module. Modules can be further connected to form an array. The term
array refers to the entire generating plant, whether it is made up of one or several
thousand modules. The number of modules connected together in an array depends on
the amount of power output needed.
The performance of a photovoltaic array is dependent upon sunlight. Climate conditions
(e.g., clouds, fog) have a significant effect on the amount of solar energy received by a
photovoltaic array and, in turn, its performance. Most current technology photovoltaic
modules are about 10 percent efficient in converting sunlight. Further research is being
conducted to raise this efficiency to 20 percent.
The photovoltaic cell was discovered in 1954 by Bell Telephone researchers examining
the sensitivity of a properly prepared silicon wafer to sunlight. Beginning in the late
1950s, photovoltaic cells were used to power U.S. space satellites. The success of PV in
space generated commercial applications for this technology. The simplest photovoltaic
systems power many of the small calculators and wrist watches used everyday. More
complicated systems provide electricity to pump water, power communications
equipment, and even provide electricity to our homes.
Some advantages of photovoltaic systems are:
1. Conversion from sunlight to electricity is direct, so that bulky mechanical
generator systems are unnecessary.
2. PV arrays can be installed quickly and in any size required or allowed.
3. The environmental impact is minimal, requiring no water for system cooling and
generating no by-products.
Photovoltaic cells, like batteries, generated DC which is generally used for small loads
(electronic equipment). When DC from photovoltaic cells is used for commercial

9
applications or sold to electric utilities using the electric grid, it must be converted to AC
using inverters, solid state devices that convert DC power to AC.
Historically, PV has been used at remote sites to provide electricity. In the future PV
arrays may be located at sites that are also connected to the electric grid enhancing the
reliability of the distribution system. The solar array's power generation capacity is
dependent on the angle of the rays as they hit the modules. Peak power occurs when the
rays are at right angles or perpendicular to the modules. As the rays deviate from
perpendicular, more and more of the energy is reflected rather than absorbed by the
modules. Depending on the application, sun tracking mounts can be used to enhance the
power output by automatically positioning the array.
2.4 Diesel generator
A diesel generator is the combination of a diesel engine with an electrical generator
(alternator) to generate electrical energy. They range from small portable diesel
generators of about 1kVA to 100’s of MVA. The packaged combination of a diesel
engine, a generator and various ancillary devices such as base, canopy, sound attenuation,
control systems, circuit breakers, jacket water heaters, starting systems e.t.c. is referred to
as a generating set or a gen set for short.
Gen sets are selected based on the load they are intended to supply power for, taking into
account the type of load, i.e. emergency or for continuous power, and the size of the load,
and the size of any motors to be started which is normally the critical parameter.
In an electrical system, a diesel generator can be represented as a prime mover and a
generator. In ideal circumstances, the prime mover is capable supplying any power
demand up to rated power at constant frequency, and the synchronous generator
connected to it must be able to keep the voltage at any load condition. Figure 2 is a block
diagram of the diesel generator.
The diesel engine keeps the frequency constant by maintaining the rotor speed constant
via its governor. The synchronous generator must control its output voltage by
controlling the excitation current. Thus, as a unit, the diesel generating system must be

10
able to control its frequency and its output voltage. The inertia of the diesel gen set, the
sensitivity of the governor and the power capability of the diesel engine all affect the
diesel generator’s ability to respond to frequency changes. The ability of the synchronous
generator to control voltage is affected by the field winding time constant, the availability
of DC power to supply the field winding, and the response of the voltage control
regulation mechanism.
2.4.1 Rating
Generators must be able to deliver power required for the hours per year anticipated by
the designer to allow reliable operation and prevent damage. Typically a given set can
deliver power for a few hours per year, or less power continuously. That is a standby set
is only expected to give it’s full capacity for a few hours per year, whereas a continuously
running set would be expected to give a somewhat lower output but continuously. Both
should have reasonable maintenance and reliability.
To meet the above criteria manufacturers give each set a rating on internationally agreed
definitions. These standard rating definitions are designed to allow correct machine
selection and valid comparisons between different machines.
Rating definitions
• Standby rating: this is based on supplying emergency power for the duration of
normal power interruption. There is no sustained over load capability available for
this rating.
• Prime (unlimited running time) rating: this is based on supply of power for
commercial purposes. Prime power is the maximum power available at variable
load
for an unlimited number of hours. A 10% overload capability is available for limited
time. This rating is not applicable to all gen set models. Typical application is where
the generator is the sole source of power.
• Base load (continuous) rating: applicable for supplying power continuously to a
constant load up to a full output rating for unlimited hours. No sustained overload
capability is available for this rating. Also not applicable to all gen set models.

11
In the power system network, the balance of active and reactive power must be
maintained. The diesel genset, thus must be able to keep the power balanced whenever
either the wind strength and/or solar intensity and/or local load vary. For a sufficiently
sized genset, this task is not difficult to accomplish.
Since the generator can be turned on and off, unlike a renewable power source, no
dedicated charge controller is necessary. The generator can be hooked into the system
through either an inverter with generator auto-start features, or a generator auto-start
battery charger. Either of these methods will detect when the batteries are dangerously
low, and will start the generator for as long as needed to charge the storage battery bank.
2.4.2 Synchronous generators
2.4.2.1 Introduction
The synchronous generator is the absolutely dominating generator type in power systems.
It can generate active and reactive power independently and has an important role in
voltage control. The synchronizing torques between generators act to keep large power
systems together and make all generator rotors rotate synchronously. This rotational
speed is what determines the mains frequency, which is kept very close to the nominal
value 50 or 60 Hz. The generator studied here is connected to the national grid, but since
it is very small it has virtually no impact on the rest of the system which therefore can be
modeled as a stiff three-phase AC voltage.
2.4.2.2 Theory
The stator of a synchronous generator holds a three-phase winding where the individual
phase windings are distributed 120° apart in space. The rotor holds a field winding,
which is magnetized by a DC current – the field current If. When the rotor is rotated (by

12
the turbine) the rotating magnetic flux induces voltages Eq in the stator windings. These
voltages are sinusoidal with a magnitude that depends on If, differ by 120° in time and
have a frequency determined by the angular velocity of the rotation.
In steady state, one phase can be modeled as an AC voltage source Eq feeding the current
I against the terminal voltage V through the d-axis synchronous reactance, Xd:
Eq(If) =V+jXdI
The stator windings also have a resistance Ra, which however is very small and is usually
neglected. The voltage V is transformed a number of times and finally appears at the
mains outlet. The mains frequency thus originally comes from the mechanical rotation of
the rotor of the generator.
Synchronous generators come with round (or cylindrical) rotor or with salient pole rotor.
The number of poles (magnetic N and S poles in the rotor) ranges from two to almost one
hundred. The above description is valid for a round rotor generator with two poles, which
is the simplest to describe.
2.4.2.3 Synchronizing a generator to an AC system
Connecting a generator electrically to an AC system is called synchronizing the generator
to the AC system. Before this is done, the generator is accelerated to correct speed and
the rotor is magnetized. The current I resulting at the moment of synchronization depends
in how close Eq and V are to each other. To avoid large currents the phasor values of Eq
and V should be equal. This gives four conditions:
• Same magnitude of Eq and V;
• Same phase of Eq and V.
And even more important (already assumed when working with phasors)
• Same frequency of Eq and V;
• Same phase order of the three-phase systems Eq and V.

13
2.4.2.4 The synchronous generator at steady state
As the expressions for active and reactive power are made more complicated by rotor
saliency, the round rotor case is treated first.
Round rotor machine
The phasor equation Eq=V+jXdI can be illustrated graphically:
where cos� is the power factor of the load. Here the load is inductive, I lags V and �>0.
The power supplied to the load is (per phase):
S = Pe + jQe =V I * = VI cos� + jVI sin�
Scaling the phasor diagram with V/Xd gives:
Active and reactive power can now be expressed as:
S = VI
Pe = VI cos� = EqV/ Xd* sinδ
Qe = VI sin� = EqV/ Xd * cosδ − V2 /Xd
The control inputs at steady state are turbine power Pm and field current If. Changing
Pm while keeping If constant shows that Eq is constant, while δ and Qe are changed.

14
If instead If is increased while Pm is kept constant, it becomes evident that the sign of
Qe can be controlled
Salient pole rotor
The difference between a salient pole rotor and a cylindrical rotor is shown below:
The direct-axis (or d-axis) is defined as the main flux direction of the rotor. The voltage
induced in the stator Eq leads the d-axis by 90°, which is the quadrature-axis (or q-axis)
direction. The fundamental (phasor) voltage equation for a salient pole generator is:
E q = V + jXdI d + jX qI q
which graphically appears as below:

15
Using the d- and q components of current and terminal voltage,
S = Pe + jQe =V I * = Vd + jVq ( )Id + jIq ( )*
Vd + jVq = Vsinδ + jV cosδ
Id = ( Eq – Vq)/
Iq = Vd/ Xq
Note that Pe and Qe for a round rotor generator are obtained by setting Xd=Xq.
2.4.2.5 Dynamic model of the synchronous generator
Assuming that Eq is constant a second order model describes the dynamics:
2H/ ωs * d ω/ dt = Pm-Pe(δ) (2)
dδ/ dt= ωe-ωs
Here ωe is the mechanical angular frequency of the rotor, while ωs,e is its nominal
value. Both these frequencies are given in electrical rad/s (2πf, where f is 50 or 60 Hz),
independent of number of rotor poles.
H is the inertia constant of the machine defined as kinetic energy in Ws divided by the
VA rating. This value is typically in the range 1-10 s. The interpretation of H is the time
it takes (in seconds) to reach standstill if the generator rotating at rated speed with rated
load, is disconnected from the turbine.
δ is the mechanical angle (in rad) between the voltage vector of the network and the
internal voltage Eq vector which is fixed to the rotor. δ is thus measured in a coordinate
system fixed to the rotating rotor.
Pm is the mechanical power input from the turbine, while Pe is the electrical power fed
to the electrical system. Note Pe is obtained from the above expressions but with Xd
16
replaced by X'd and similarly Eq by E'q.
2.4.2.6 The synchronizing torque
At no-load in steady state δ, Pe and Pm are all zero while ωe=ωs,e. Assume that, for
some reason, ωe becomes too high (this could be at the moment of synchronization).
This causes an increase in δ (3), but also in Pe (1). The minus sign in (2) shows that
dωe/dt becomes negative since Pe>Pm. The deviation in ωe is thus corrected and after
some time ωe is equal to ωs,e again. This mechanism synchronizes all synchronous
generators in a network to each other and is the reason for the term synchronization of a
generator. The torque caused by the deviation in δ is called synchronizing torque and is
the reason why systems covering entire continents can be kept together electrically.
The synchronizing power (coefficient) is dPe(δ)/dδ.
2.4.2.7 The Automatic Voltage Regulator
The reactive generation capability of the synchronous generator can be used to control
the voltage at the generator bus. This is done by letting an Automatic Voltage Regulator
(AVR) control the rotor field current which in turn determines the internal voltage E.
The AVR measures the voltage V at the generator terminals and adjusts the field current
so that V is close to a reference value Vref.
2.5 Inverters
Inverter converts the battery power (12V/24/48 D/C) current into conventional A/C
power. This power can be used to run almost any AC appliance absolutely anywhere.
They can run items such as mobile phone chargers, lights, electrical appliances, power
tools, computers, faxes, TV sets, microwave ovens, battery chargers & motors. Rather
than use special 12-volt versions of the appliances to operate an inverter can be used to
power A.C appliances which are relatively cheap.
A battery charger or converter takes normal household AC power and changes it into DC
Power so that you can charge your batteries. It does this using a special circuit that
reduces the voltage by a factor of 20, and a rectifier that changes AC (alternating current)

17
into DC (direct current). An inverter reverses this process by increasing the voltage by 20
times, and by creating AC current out of the battery's DC current.
Modified Sine Wave inverters are the standard. There is also Pure Sine Wave inverters
which are more suited for delicate electrical or electronic items such as stereos &
computers. If you really wish to use those items often with the inverter, then choose a
Pure Sine Wave inverter. If you mostly wish to run lights, TV’s etc, a Modified Sine
Wave inverter is fine for your needs. The difference between them is the Pure Sine wave
inverter produces a slightly better and cleaner current. They are also much more
expensive.
2.6 Charge controllers
A solar charge controller monitors your battery bank's charge level, and prevents over-
charging by stopping the flow of electrical current when the batteries are fully charged.
Most solar controls also include diodes or relays to 'disconnect' the panels from the
battery bank at night.
Otherwise, power can flow backwards from the batteries to the panels, causing a drain on
the battery bank.
The better models of solar controllers will use Pulse Width Modulated (PWM) charging
circuitry, regulating the amount of charging current for faster and more efficient battery
charging. The newest solar control technology, Maximum Power Point Tracking (MPPT)
technology, adjusts voltage to maximize current for charging the batteries.
The controller must be set to the right voltage for the battery bank and solar panels, and
has enough amperage capacity for your solar array's maximum output. If their is a plan
to add more panels to the array, an oversized controller should be installed.
2.7 Batteries
2.7.1 Cell design and theory In a lead-acid cell the active materials are lead dioxide (PbO2) in the positive plate,
sponge lead (Pb) in the negative plate, and a solution of sulfuric acid (H2SO4) in water

18
as the electrolyte. The chemical reaction during discharge and recharge is normally
Discharge
PbO2 + Pb + 2H2SO4 2PbSO4 + 2H20
Charge
This reaction gives the ideal proportions by weight of the reactants to deliver capacity at
a very low discharge rate when the amounts of PbO2, lead and sulphuric acid would be
simultaneously depleted to zero. In actual practice the reactions during discharge are not
carried to completion, and the theoretical capacity 26.805 Ah per chemical equivalent of
reactant is never delivered.
Life is limited normally by the positive plate which is least efficient. An excess of
negative active material (Pb) is designed into the negative plate to extend wet life and
cycle life. An excess of sulfuric acid is ,also present in the electrolyte in most cells to
maintain proper acidity for long life.
As discharge continues, cell internal resistance increases and the cell voltage falls to an
unusable value before more than 30-40 percent of the limiting positive active material is
converted from PbO2 to PbSO4.
In each cell the manufacturer attempts to reduce excess or reserve active materials to
control cost. In many applications the cell designer has a goal of maximum energy output
per unit weight and per unit volume of total cell. Consequently, some cell designs may
become acid limited if the discharge rate is at an amperage below the anticipated cell
design range.
2.7.2 Lead-acid battery construction types
Lead-acid battery types which are now commercially available are classified by type of
positive plate:
• Manchex

19
• Tubular positive plate
• Pasted flat plate
2.7.3 lead-acid cell discharge characteristics
In the lead-acid system the average voltage during discharge, the capacity delivered, and
the energy output are dependent upon the discharge current. A typical example is given
in Figure 2.1
Each cell type, size and design will vary from Figure 2.1 depending upon the cell design
parameters such as the number and thickness of the plates, active material density,
volume and specific gravity of the electrolyte, and the plate grid and separator system
designs.
Useful capacity from a cell is normally defined in terms of discharge hours or ampere-
hours
to the 'knee' of the discharge curve or final voltage. Beyond this point, little capacity is
available. As shown in Figure 2.1, the knee does vary with the discharge rate and represents the low voltage limit for the various rates. Energy output for each rate is the

20
integral of cell power output (volts x amperes) between discharge time zero and the time
corresponding to the knee of the discharge curve, or final voltage. Average discharge
voltages can be calculated by dividing the energy output in watt-hours by the
corresponding capacity in ampere-hours. As an approximation the average voltage is the
voltage at 0.6 times the discharge time to the final voltage.
Discharges may be terminated at some voltage higher than the knee of the curve. This
voltage is called the discharge end voltage. It may be dictated by the test equipment,
photovoltaic system components, or by an arbitrary choice. This end voltage may be a
constant independent of rate of discharge.
When the end voltage is higher than the final voltage, the cell size becomes larger, and
the capacity not used becomes a reserve capacity which can extend cycle life.
In designing a battery for a particular photovoltaic system, the number of battery cells
needed in series can be determined by dividing the lowest specified system voltage by
the final voltage of the cell selected when discharged at the required system rate for that
cell.
This minimum number of cells in series assures the battery discharge voltage will
be at or above the specified minimum voltage in the system voltage window.
The product of a particular current in amperes and the corresponding discharge time in
hours read from this plot gives the rated or experimental mean capacity at any rate
covered by the curve.
Times to other end voltages are often shown as a family of similar curves.
The corresponding initial, average and final voltages are plotted for each discharge time.
The system designer can obtain from this single figure a good estimate of the discharge
time, the discharge capacity and the energy output (product of average voltage and
capacity) at any discharge rate covered by the data.

21
2.7.4 Maintenance of lead-acid batteries
Battery subsystems for photovoltaic installations in remote locations must require low
maintenance. The cost of maintenance can be prohibitive for remote systems in isolated
areas where service personnel can visit the installation no more than once or twice a year.
Attended systems may have trained personnel available to perform maintenance.
Battery designs with greater wet and cycle life, but which may also require greater
maintenance, may be selected for these applications. A key step to long life is to properly
train service personnel using service and operating instructions provided by the battery
and photovoltaic system manufacturers.
Maintenance will normally consist of equalization charges, watering of battery
cells, checks on individual cell voltage and specific gravity and cleaning the tops of cells
of dust, dirt, acid spillage and spray.
2.7.5 Safety precautions
Precautions must be routinely practiced to prevent explosions from ignition of
the flammable gas mixture of hydrogen and oxygen formed during overcharge
of lead-acid cells. The maximum rate of formation is 0.418 liters of hydrogen
and 0.209 liters of oxygen per Ah overcharge at standard temperature and
pressure. The gas mixture is explosive when hydrogen in air exceeds 4 percent
by volume. Standard practice is to set warning devices to alarm at 20-25 percent of this
lower explosive limit (LEL). Low cost hydrogen detectors are available commercially for
this purpose.

22
2.8 Loads
A collection of loads for which the size and the power factor can be programmed
throughout the day represent a typical village load. The voltage at the terminal of the load
varies as a result of voltage drop across the line impedance. The voltage across the line
impedance varies depending on the size of the current and power factor of the load. The
terminal voltage for a wind turbine generator (Vs), as the output current of induction
machine varies from start-up to generating mode. During start-up voltage drops
significantly at the terminal voltage of the induction machine. The voltage drop across the
line impedance is caused by the current surge during start-up. In addition the phase angle
of the stator current is very large and lagging. The combination of a poor power factor
and a lagging, large current surge creates a voltage dip at the terminal of the induction
machine during start-up. Thus a start-up of short duration is preferable to a prolonged
one. Water pump can be used to help balance the reactive power.
2.9 Data acquisition system
A data acquisition system is a device designed to measure and log parameters. The
purpose of the data acquisition system is generally the analysis of the logged data and the
improvement of the object of measurements. The DAS is normally electronics based ,
and made of hardware and software. The hardware part is made of sensors and memory
components. The software part is made of the data acquisition logic and the analysis
software (used to configure the logic or move data from memory to a pc or laptop). Data
logging carried out can be used to measure parameters such as temperature and wind
speed. These are the stored for analysis to improve quality assurance
Data logging system is composed of four elements;
• Measuring output (sensors)

23
• Recording output signals (logger unit)
• Uploading/accessing of recorded data
• Analysis of recorded data (software)
These elements have specific requirements which need to be physically included in the
design process. The sensors must meet certain specifications, and routing of the sensor
cables ensures they will not suffer from electromagnetic interference from other
electronic systems.
Feed-in Tariffs and Related Rules for Electricity from Renewable Energy
General Principles on Feed-in Tariffs
The feed-in tariff (FiT) levels defined by Ministry of Energy MoE in the “Guide for
Investors” on “Feed-in-Tariffs for Renewable Energy Resource Generated Electricity”
(1st Edition, May 2008) are technology-specific depending on:
• Investment costs;
• Operation & Maintenance (O&M) costs;
• Fuel costs (where applicable);
• Financing costs and return on invested capital;
• Estimated lifetime of the power plant;
• Amount of electricity to be generated.
The avoided costs should typically comprise the energy costs incorporating fuel costs and
part of the O&M costs. They should be estimated on the basis of the current energy costs
of the most efficient thermal plant supplying the national grid, presently being medium-
speed diesel (MSD) power plants and the least expensive fuel oil (HFO 180 cSt).
The FiT should be based on the generation costs but also consider the avoided cost, FiT
in other countries and the specific socio-economic conditions of Kenya.

24
They should be on firm or non-firm basis, including grid connection costs, and should be
stepped up as necessary.
GoK guarantees access to the T&D grid pursuant to the provisions of the Grid Code pre-
pared by ERC.
25
CHAPTER THREE:
DESIGN OF THE POWER SYSTEM
3.1 SOLAR PV SIZING
The following steps were used to determine requirements and specify the components
needed.
3.1.1 Determination of the power consumption demands
A list of the appliances and/or loads to be run from the PV system. The power(wattage)
each item consumes while operating was recorded. Specification sheets, local appliance
dealers, and the product manufacturers are other sources of information.
• AC and DC Load
The total Amp Hours per Day used by all the AC and DC loads in the system
were determined.
1. all AC loads were listed, wattage and hours of use per day. Watts were multiplied by
Hrs/day to get watt-hours per day (WH/day). All the watt hours per day were added to
determine AC Watt Hours per day.
2. DC watt hours per day. Total of step 1 was multiplied by 1.2 to correct for inverter
loss.
3. Inverter DC input voltage used;
48V
4. Line 2 was divided by line 3. This is total amp hours per day used by AC loads.
677AH

26
• Calculate your DC loads
5. all DC loads were listed: all the watt hours per day were added to determine D.C Watt
Hours Per day.
120 000 Wh/day
6. DC system voltage used. (Same as line 3)
12V
7. To determine total amp hours per day used by DC loads, line 5was divided by line 6.
10000 Ah/day
8. To determine total amp hours per day used by AC loads line 4 was entered
677 Ah/day
9. lines 7 and 8 were added. This is total average amp hours per day.
10677 Ah/day
3.1.2 Sizing the battery bank
The first decision made was how much storage is to be provided the battery bank. This is
the number of days the system is expected to provide power without receiving an input
charge from the solar array. Proceed as follows;
1. The daily amp-hour requirement was entered. (From the Load Sizing Worksheet)
Daily amp-hour = 10677 Ah
2. The number of days of autonomy which the system would support was chosen.

27
2 days of autonomy
3. the amp-hour requirement was multiplied by the number of days. This is the amount of
amp-hours the system will need to store.
4. The depth of discharge for the battery was chosen. This provides a safety factor so that
over-draining of battery bank is avoided
50% depth of discharge was used
5. The amp-hours (line 3) of storage needed were divided by the depth of discharge (line
4) limit.
6. The multiplier was selected below that corresponded to the average wintertime
ambient temperature the battery bank will experience.
Ambient Temperature Multiplier
80F 26.7C 1.00
70F 21.2C 1.04
60F 15.6C 1.11
50F 10.0C 1.19
40F 4.4C 1.30
30F -1.1C 1.40
20F -6.7C 1.59
A multiplier of 1.11 was chosen

28
7. The amp-hours were multiplied by line 6. This calculation ensures that the battery bank
will have enough capacity to overcome cold weather effects. This number represents the
total battery capacity needed.
8. The amp-hour rating for the battery chosen.
Amp- hour rating of battery = 250Ah
9. The total battery capacity was divided by the battery amp-hour rating and rounded off
to the next highest number. This is the number of batteries wired in parallel required.
10. The nominal system voltage (12 or 24V) was divided by the battery voltage and
rounded off to the next highest number. This is the number of batteries wired in series.
Nominal system voltage = 12V
11. The number of batteries in parallel was multiplied by the number of batteries in
series. This is the number of batteries required.
3.1.3 Sizing the PV array
Module size chosen
Kyocera KC120 module
1. Total average amp hours per day from the Load Sizing Worksheet
10677Ah
2. Line 1 was multiplied by 1.2 to compensate for loss from battery charge/discharge.
12812.4Ah
3. Average sun hours per day in the area.

29
In Meru region radiation = 5.5 - 6.5 kWh/m2/day (solar radiation map). Hence
average sun-hours = 5.5 hrs
4. line 2 was divided by line 3,. This is the total solar array amps required.
2329.95Ah
5. Optimum or peak amps of solar module used. From module specifications.
Peak – amps of module = 7.1 A
6. To determine total number of solar modules in parallel required, line 4 was divided by
line 5.
328
7. The result was rounded off to the next highest whole number.
8. Number of modules needed to provide DC Battery voltage:
DC Battery Voltage # of Modules in each series
string
12 1
24 2
48 4
9. To determine total number of solar modules required, multiply line 7 by line 8.
328
3.2 WIND ENERGY COST
In calculating wind power economics the following parameters were considered

30
• Investment costs, including auxiliary costs for foundation
• Operation and Maintenance (O&M) costs.
• Electricity production/average wind speed.
• Turbine lifetime.
• Discount rate.
As electricity production is highly dependent on wind conditions, choice of the right site
was critical to achieving economic viability. The following sections outline the structure
and development of capital costs and efficiency trends of land based WTs.
3.2.1 Electricity production
From the wind atlas map of Kenya it can be seen that the Meru-North region has a good
wind regime. The wind speed avarages between 5.0 – 8.0 m/s
Wind energy calculations for Kina, Meru-North district
Using the lowest of 5m/s, we can calculate electrical energy available in the wind. The
following formula was applied;
Total power from the wind,
Ptotal = ρ⁄2gc * AVi3 = 13.14 * 10-6 AVi
3
For a 10m diameter wind turbine,
Ptotal = 8.2 kW
With overall efficiency of wind turbine at 30%, the actual power is given by;
Pactual = 2.5 kW
Hence the power obtained from the 10m diameter wind turbine is given is equal to 2.5
kW.
This shows that the region has a favorable wind regime.
3.2.2 Investment cost The wind turbine’s installed capacity cost is dependent on the size. The relative cost
decreases with increase in the size of the turbine.

31
Table 3.1: Cost of wind energy
Size of turbine Cost per kW (Kshs)
1kW – 10 kW 250,000 – 500,000
10 – 1MW 150,000 - 200,000
>1MW 100,000
O & M costs were based on the following
• Insurance
• Regular maintenance
• Repair
• Spare parts
• Administration
3.2.3 Expected results
• The calculations relate to a new land-based small-size WT of 1-10 kW
• Investment costs reflect the range given in table 3.1, a cost per kW of Kshs
300,000/kW.
• The lifetime of the WT is 20 years, in accordance with most technical design criteria.
• The discount rate is assumed to range within an interval of 5% to 10% a year.
• Economic analysis is carried out as simple national economic ones. No taxes,
depreciation, risk premium are taken into account. Everything is calculated at current
market prices.
Hence O&M costs are assumed to be 14 Kshs/kWh as an average over the lifetime of the
WT.
The production of power is the single most important factor for calculating the cost per
generated unit of power. Turbines sited at good wind locations are likely to be profitable,
while those at poor locations may run at a loss.

32
The calculated cost per kWh wind power is thus Kshs 20
3.3 DIESEL GENERATOR ENERGY COST
3.3.1 Typical operating costs Fuel consumption is the major portion of the diesel generator owning and operating cost
for power applications.
• Specific consumption varies but a modern diesel plant consumes between 0.28
and 0.4 litres of fuel per kilowatt hour at the generator terminals.
• Fuel cost Kshs25 – Kshs40/kWh (using diesel at Kshs80/litre)
• Lifetime engine maintenance is about Kshs8 – Kshs16/kWh depending on
different factors
Diesel generator installed capacity cost per kW for small sized is between
90 000 – 150000 Kshs/kW
Cost per Kwh of diesel generation is Kshs 10
3.4 CALCULATING SOLAR COST
Calculating cost per installed peak watt
120Wp module = Kshs 80,000
100Ah battery =Kshs 5,000
10A charge controller =Kshs 8,000
200 W inverter = Ksh 30 000
Other costs =Kshs 10 000
Total cost = Kshs 133 000
Hence cost per installed peak watt of solar Pv = Kshs 1200

33
Calculation of O & M costs
Battery water replacement (twice a year) = Kshs 100 per bottle
= 5 * 2 *100 =kshs1000
Battery replacement (5 years life time) =Kshs 5500
Other costs =Kshs5000
O & M cost =Kshs 11500
Lifecycle cost (5 years) = Kshs144 500
Energy from solar (C.F 23%) =1208 Kwh
Cost per kWh = Kshs 60
3.5 Generation of the load curve
The daily load curve is generated from the hour-to-hour basis usage of the load.
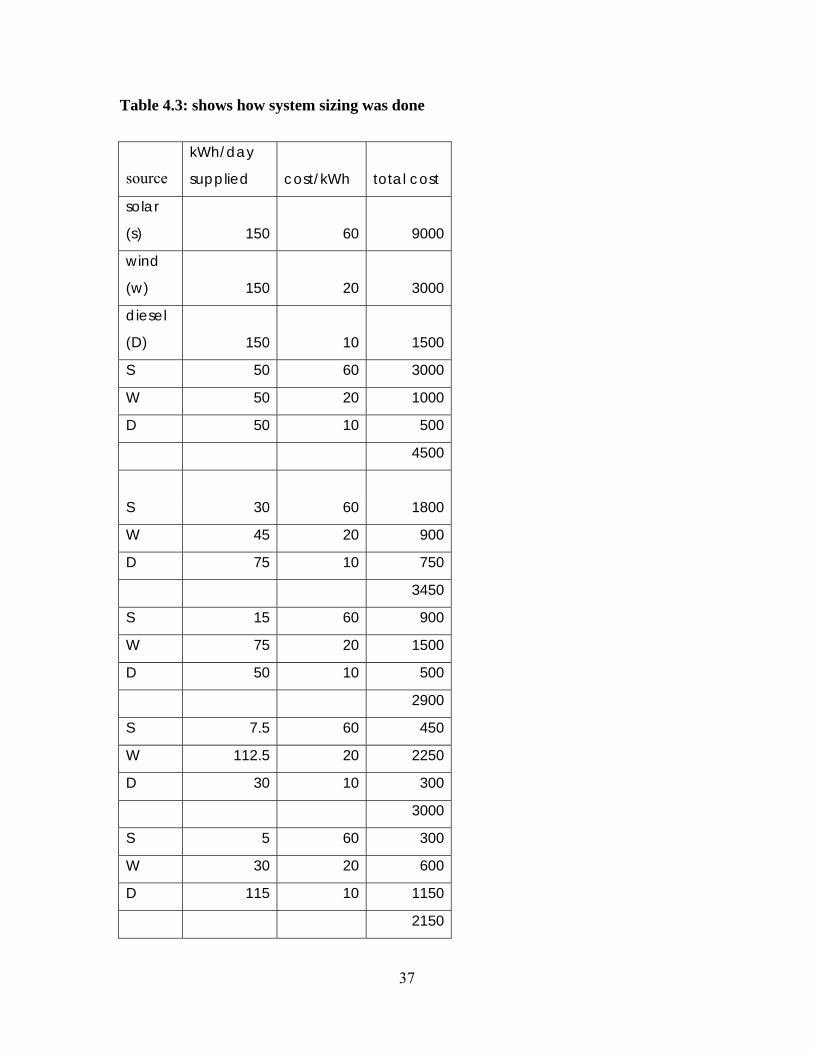
3.6 Sizing of power system
Sizing of the PV, wind diesel H.P.S was done by comparing the per unit energy cost of
the three power sources at different ratios of electrical energy produced, including each
on its own. The ratio at which the system provided the best cost characteristic in the long
term was chosen. Both installed capacity cost and O & M cost were used in the sizing
were used in calculating per unit cost of energy. Table 4.3 shows how sizing was done.
34
CHAPTER FOUR
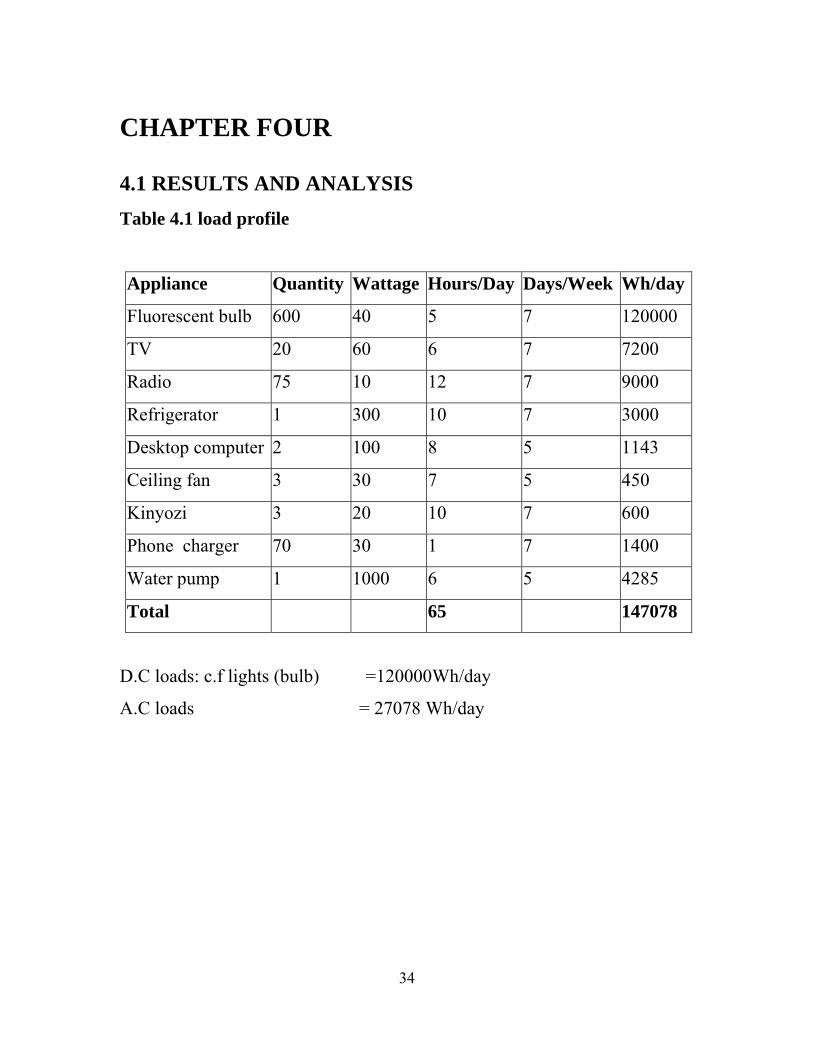
4.1 RESULTS AND ANALYSIS Table 4.1 load profile
Appliance Quantity Wattage Hours/Day Days/Week Wh/day
Fluorescent bulb 600 40 5 7 120000
TV 20 60 6 7 7200
Radio 75 10 12 7 9000
Refrigerator 1 300 10 7 3000
Desktop computer 2 100 8 5 1143
Ceiling fan 3 30 7 5 450
Kinyozi 3 20 10 7 600
Phone charger 70 30 1 7 1400
Water pump 1 1000 6 5 4285
Total 65 147078
D.C loads: c.f lights (bulb) =120000Wh/day
A.C loads = 27078 Wh/day

35
Fig 4.1: load curve
From the above load profile table, it is seen that the community consumes approximately
150 kWh/day.
Thus the design of the power system should be in such a way that this load is met on
average each day. This can only be achieved if there is assurance of availability and
reliability of power all year round. It is with these in mind that the design of the system
incorporated back-up to compliment the renewable energy sources.
The h.p.s therefore must be sized in a manner that it meets this daily watt-hour
requirement, but at the same time should maintain the minimum cost (capital cost and O
& M cost). This means that the cost of different sources of energy to supply the h.p.s
should be such that the lifecycle cost of the power system is minimum.
From the load curve, the peak load is 25kW and the average load is 12kW. It therefore
prudent that the choice of h.p.s components be made in line with these load requirements
in mind.

36
Table 4.2: battery sizing
Daily
amp-
hour
Days of storage
Discharge limit
Ambient temp. multiplier
Total system amp-hour
Amp-hour battery rating
No. of battery (parallel)
10677 2
0.5
1.11
47406
250
200
No of batteries in series
12 divide by 6 = 2
Hence total no of batteries required equals 400
37
Table 4.3: shows how system sizing was done
source
kWh/day
supplied cost/kWh total cost
solar
(s) 150 60 9000
wind
(w) 150 20 3000
diesel
(D) 150 10 1500
S 50 60 3000
W 50 20 1000
D 50 10 500
4500
S 30 60 1800
W 45 20 900
D 75 10 750
3450
S 15 60 900
W 75 20 1500
D 50 10 500
2900
S 7.5 60 450
W 112.5 20 2250
D 30 10 300
3000
S 5 60 300
W 30 20 600
D 115 10 1150
2150

38
From table 4.2, the cheaper approach would be
Solar = 5 kWh/day
Wind = 30 kWh/day
Diesel = 105 kWh/day
To supply 5kWh/day from solar PV with capacity factor of 20% for the area we need;
5 *1000 / (20%*24* 120) = 10 modules
4.2 System Description
The hybrid power system is composed of a 10kW BWC wind turbine, a 1.5
KW Kyocera photovoltaic array, a 25kW BWC diesel generator set and a 250Ah lead-
acid battery. This ensures that reliable power is provided to the community.
The design of the h.p.s allows the diesel generator to run for limited number of hours per
day during high winds and high radiation. This is especially during peak time. The
generator also provides power on-demand in periods of diminished renewable resources
or increased electrical loads. A battery bank provides energy storage allowing days of
independent operation but during.
The H.P.S operates at a nominal voltage of 48 VDC and provides 240 VAC power
for user applications through an inverter.
The major components of the H.P.S include:
• A 10 kW wind turbine with 40m guyed-tower. Includes turbine charge controller.
• 1.5 kW PV array consisting of twenty 120 Wp panels.
• 250 AH lead acid deep discharge, maintenance-free, battery modules.
• 30 Kw Inverter bank
• 30A charge controller

39
• DC power center.
• Anemometer
• Support frame for PV array. Adjustable array angle. About 10 degrees south.
• 25 kW generator.
• Diesel generator support equipment.
• Control equipment
• All system wiring and protective devices including turbine disconnect
• kWh meters
• 48V/12V converters

40
Fig 4.3 Hybrid power system

41
CHAPTER FIVE
CONCLUSION Since lighting is the single largest end use for electricity all rooms should be installed
with the more energy-efficient compact fluorescent fixtures to ensure that building would
make the best use of the electricity to be produced by the h.p.s. Consumers should be
encouraged to use energy efficient appliances to save energy.
Solar system should be mounted and connected the on the roof of pads and buildings
clear of shades. Batteries and other balance of system components should be installed in a
special room.
The turbine should be situated in an elevated area and anemometer installed on top of the
guyed-tower.
System should be designed such that maintenance requirements are limited. Local trained
technicians should be able to perform the maintenance functions. The batteries are the
primary maintenance concern and maintenance is relatively straightforward, involving
checking battery terminals for corrosion, checking the water level in the batteries with a
hydrometer, and equalizing the batteries when necessary. PV array should also be cleaned
the on a regular basis. A record of the local meter readings should be maintained. Diesel
generator should be checked regularly for oil spillages. Replacement of filter and engine
oil should be done after every five years. The wind turbine blades should be regularly
inspected for bending and tear.
Data acquisition system should be in place to monitor the system performance e.g. direct
measurement of the amount of energy delivered by the renewable energy systems (PV
and Wind) and also the whole h.p.s. a fail-safe method of data collection and storage.
Two kilowatt-hour meters should be installed on the AC lines connecting the system to
the inverters. With these new measurements and the existing measurements, the total

42
energy delivered by the renewable energy systems could be directly measured. Monthly
reports should be filed to help test the system performance.

43
REFERENCES
Internet
1. http:/www.nesc.go.ke
2. http:/www.planning. go.ke
.
Publication
Ministry of energy (no.4 sessional paper of 2004 on energy)
Books
1. B.R Gupta
Power system analysis and design
1998
Printed by Rajenda Ravinndra printers, 7361, Ram Nagar, New Delhi
2. H.Lee Willis
Distributed power generation
Published by Merkel Parker ltd, 300

44
APPENDIX
Appendix 1
Calculated Average Figures of Daily Global Horizontal Solar Radiation in Kenya 1985-1991
Since solar energy plays an important role for stand-alone applications, the proper system
design (module size as well as storage capacity) is of major importance. Therefore, the
annual mean radiation is not the appropriate parameter for sizing of an isolated system,
but rather the lowest radiation month or season, respectively, should be the basis for
system design, in order to ensure supply security.

45
Appendix 2
Figure 3-1: Wind Speed in Kenya at 50 m above Ground (calculated by Risø for SWERA)
Regular Wind Speed Patterns

46
An efficient design of an independent wind power system needs to match supply and
production and thus would need a very detailed knowledge, not only on the annual mean
wind speed or mean power density, respectively, but also the typical seasonal or daily
patterns. These variations, due to either macro-climatic (annual patterns) or thermal ef-
fects (daily pattern) are not equal all over the country and would need detailed
investigations, too. Unfortunately, in Kenya there are hardly any measured data available
being suitable for wind energy assessment, so that only some rough statements cane be
made.
47
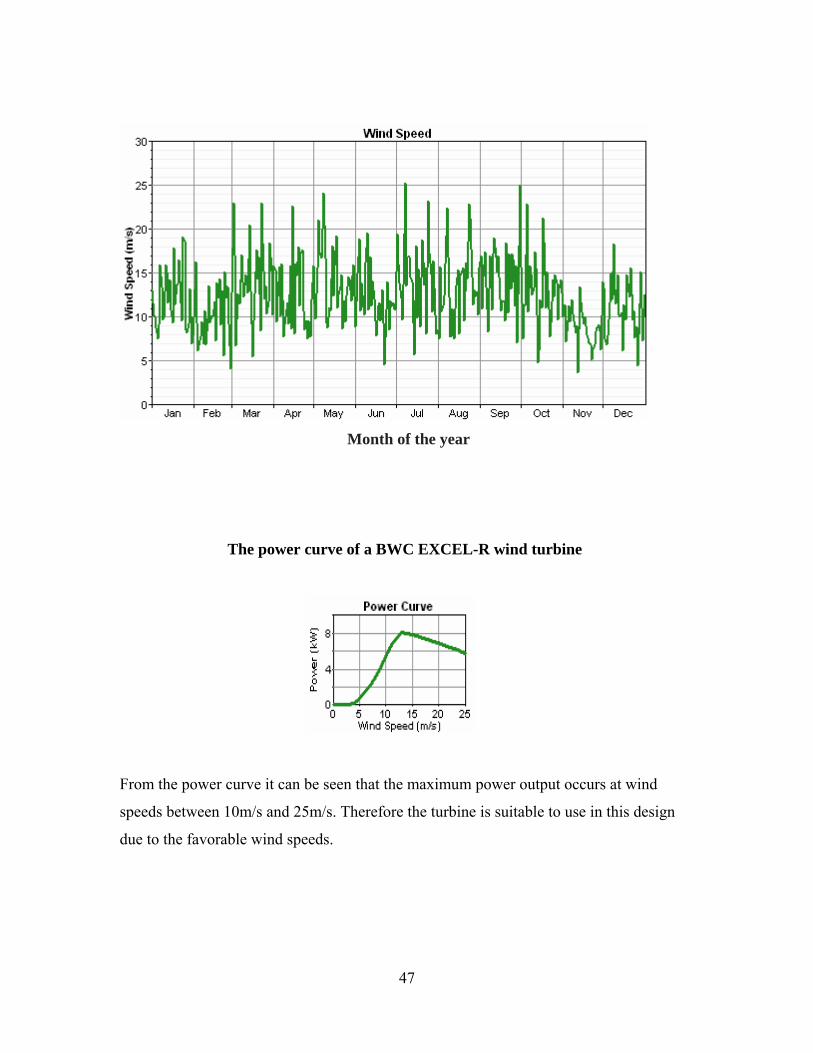
Month of the year
The power curve of a BWC EXCEL-R wind turbine
From the power curve it can be seen that the maximum power output occurs at wind
speeds between 10m/s and 25m/s. Therefore the turbine is suitable to use in this design
due to the favorable wind speeds.