hybrid floating platforms in deep waters (phase ii) · title hybrid floating platforms in deep ......
TRANSCRIPT

Infrastructure Access Report
Infrastructure: UEDIN Curved Wave Tank
User-Project:W2P Performance test
Hybrid Floating Platforms in Deep Waters (Phase II)
Marine Renewables Infrastructure Network
Status: Final Version: 3 Date: 1/2015
EC FP7 “Capacities” Specific Programme
Research Infrastructure Action

Infrastructure Access Report: W2P Performance test
Final draft Page 2
ABOUT MARINET MARINET (Marine Renewables Infrastructure Network for emerging Energy Technologies) is an EC-funded network of research centres and organisations that are working together to accelerate the development of marine renewable energy - wave, tidal & offshore-wind. The initiative is funded through the EC's Seventh Framework Programme (FP7) and runs for four years until 2015. The network of 29 partners with 42 specialist marine research facilities is spread across 11 EU countries and 1 International Cooperation Partner Country (Brazil). MARINET offers periods of free-of-charge access to test facilities at a range of world-class research centres. Companies and research groups can avail of this Transnational Access (TA) to test devices at any scale in areas such as wave energy, tidal energy, offshore-wind energy and environmental data or to conduct tests on cross-cutting areas such as power take-off systems, grid integration, materials or moorings. In total, over 700 weeks of access is available to an estimated 300 projects and 800 external users, with at least four calls for access applications over the 4-year initiative. MARINET partners are also working to implement common standards for testing in order to streamline the development process, conducting research to improve testing capabilities across the network, providing training at various facilities in the network in order to enhance personnel expertise and organising industry networking events in order to facilitate partnerships and knowledge exchange. The aim of the initiative is to streamline the capabilities of test infrastructures in order to enhance their impact and accelerate the commercialisation of marine renewable energy. See www.fp7-marinet.eu for more details.
Partners
Ireland University College Cork, HMRC (UCC_HMRC)
Coordinator
Sustainable Energy Authority of Ireland (SEAI_OEDU)
Denmark Aalborg Universitet (AAU)
DanmarksTekniskeUniversitet (RISOE)
France Ecole Centrale de Nantes (ECN)
InstitutFrançais de RecherchePourl'Exploitation de la Mer (IFREMER)
United Kingdom National Renewable Energy Centre Ltd. (NAREC)
The University of Exeter (UNEXE)
European Marine Energy Centre Ltd. (EMEC)
University of Strathclyde (UNI_STRATH)
The University of Edinburgh (UEDIN)
Queen’s University Belfast (QUB)
Plymouth University(PU)
Spain Ente Vasco de la Energía (EVE)
Tecnalia Research & Innovation Foundation (TECNALIA)
Belgium 1-Tech (1_TECH)
Netherlands Stichting Tidal Testing Centre (TTC)
StichtingEnergieonderzoek Centrum Nederland (ECNeth)
Germany Fraunhofer-GesellschaftZurFoerderung Der AngewandtenForschungE.V (Fh_IWES)
Gottfried Wilhelm Leibniz Universität Hannover (LUH)
Universitaet Stuttgart (USTUTT)
Portugal Wave Energy Centre – Centro de Energia das Ondas (WavEC)
Italy Universitàdegli Studi di Firenze (UNIFI-CRIACIV)
Universitàdegli Studi di Firenze (UNIFI-PIN)
Università degli Studi della Tuscia (UNI_TUS)
Consiglio Nazionale delle Ricerche (CNR-INSEAN)
Brazil Instituto de Pesquisas Tecnológicas do Estado de São Paulo S.A. (IPT)
Norway SintefEnergi AS (SINTEF)
NorgesTeknisk-NaturvitenskapeligeUniversitet (NTNU)

Infrastructure Access Report: W2P Performance test
V3 Final Page 3
DOCUMENT INFORMATION Title Hybrid Floating Platforms in Deep Waters (Phase II)
Distribution Public
Document Reference MARINET-TA1-W2P Performance test
User-Group Leader, Lead Author
Reza Hezari Pedro Mayorga Jorgen Hals
Pelagic Power AS EnerOcean SL EnerOcean SL
User-Group Members, Contributing Authors
Javier Fernández EnerOcean SL Miguel Ángel Jaime EnerOcean SL [Insert name or delete row] [Insert Institution/Company name]
Infrastructure Accessed: UEDIN Curved Wave Tank
Infrastructure Manager (or Main Contact)
Tom Davies
REVISION HISTORY Rev. Date Description Prepared by
(Name) Approved By Infrastructure
Manager
Status (Draft/Final)
01 06/2014 Access Report Javier Fernández First draft
02 10/2014 Jorgen Hals Draft
03 12/2014 Pedro Mayorga Final draft
Infrastructure Access Report: W2P Performance test
V3 Final Page 4
ABOUT THIS REPORT One of the requirements of the EC in enabling a user group to benefit from free-of-charge access to an infrastructure is that the user group must be entitled to disseminate the foreground (information and results) that they have generated under the project in order to progress the state-of-the-art of the sector. Notwithstanding this, the EC also state that dissemination activities shall be compatible with the protection of intellectual property rights, confidentiality obligations and the legitimate interests of the owner(s) of the foreground. The aim of this report is therefore to meet the first requirement of publicly disseminating the knowledge generated through this MARINET infrastructure access project in an accessible format in order to:
progress the state-of-the-art
publicise resulting progress made for the technology/industry
provide evidence of progress made along the Structured Development Plan
provide due diligence material for potential future investment and financing
share lessons learned
avoid potential future replication by others
provide opportunities for future collaboration
etc. In some cases, the user group may wish to protect some of this information which they deem commercially sensitive, and so may choose to present results in a normalised (non-dimensional) format or withhold certain design data – this is acceptable and allowed for in the second requirement outlined above.
ACKNOWLEDGEMENT The work described in this publication has received support from MARINET, a European Community - Research Infrastructure Action under the FP7 “Capacities” Specific Programme.
LEGAL DISCLAIMER The views expressed, and responsibility for the content of this publication, lie solely with the authors. The European Commission is not liable for any use that may be made of the information contained herein.This work may rely on data from sources external to the MARINET project Consortium. Members of the Consortium do not accept liability for loss or damage suffered by any third party as a result of errors or inaccuracies in such data. The information in this document is provided “as is” and no guarantee or warranty is given that the information is fit for any particular purpose. The user thereof uses the information at its sole risk and neither the European Commission nor any member of the MARINET Consortium is liable for any use that may be made of the information.

Infrastructure Access Report: W2P Performance test
V3 Final Page 5
EXECUTIVE SUMMARY After the “concept validation” achieved in the previous round of tests under Marinet program, the tests here focus on an optimized version of the WEC arrays and their influence on the overall stability of the platform. This was done for different wave conditions, varying wave angles including operational and survival modes where the WECs were let free or were strapped to prevent movements, respectively. The results show a clear potential for WECs to improve the stability of the structure (compared with the case with no WECs) with the use of active control system. The control strategies for the point absorbers will be one of the central topics for future investigations. Finally the potential maximum number of WECs and their positions were assessed without any compromise for the performance or survivalability of the platform. Thanks to this test the design was validated achieving a new milestone in our step by step design and validation process.
Infrastructure Access Report: W2P Performance test
V3 Final Page 6
CONTENTS
1 INTRODUCTION& BACKGROUND ........................................................................................................................ 7
1.1 INTRODUCTION.............................................................................................................................................. 7 1.2 DEVELOPMENT SO FAR ................................................................................................................................... 7 1.2.1 Stage Gate Progress ............................................................................................................................... 7 1.2.2 Plan For This Access ............................................................................................................................... 8
2 OUTLINE OF WORK CARRIED OUT ....................................................................................................................... 9
2.1 SETUP ......................................................................................................................................................... 9 2.1.1 Physical model ....................................................................................................................................... 9 2.1.2 Mooring ................................................................................................................................................. 9 2.1.3 Instrumentation ..................................................................................................................................... 9 2.1.4 Model Setup and Calibration ................................................................................................................ 10 2.1.5 First Tests ............................................................................................................................................. 10
2.2 TESTS ........................................................................................................................................................ 11 2.2.1 Sea States and Calibration of Irregular Waves ...................................................................................... 11 2.2.2 Test Plan .............................................................................................................................................. 12
2.3 RESULTS .................................................................................................................................................... 13 2.4 ANALYSIS & CONCLUSIONS ............................................................................................................................ 14
3 MAIN LEARNING OUTCOMES ............................................................................................................................ 15
3.1 PROGRESSMADE ......................................................................................................................................... 15 3.1.1 Progress Made: For This User-Group or Technology .............................................................................. 15
3.2 KEY LESSONS LEARNED .................................................................................................................................. 15
4 FURTHER INFORMATION .................................................................................................................................. 15
4.1 SCIENTIFIC PUBLICATIONS .............................................................................................................................. 15 4.2 WEBSITE .................................................................................................................................................... 15
5 REFERENCES ...................................................................................................................................................... 16
6 APPENDICES ...................................................................................................................................................... 16
6.1 STAGE DEVELOPMENT SUMMARY TABLE ........................................................................................................... 16

Infrastructure Access Report: W2P Performance test
V3 Final Page 7
1 INTRODUCTION& BACKGROUND
1.1 INTRODUCTION W2Power is a novel Hybrid floating platform for wind and wave energy utilization in deep water areas. It consists of a deckles ultra-lightweight triangular semi-submersible platform carrying two standard offshore wind turbines and three linear arrays of wave energy converters. The development is led by two Norwegian SME’s – Pelagic Power AS and Global Maritime AS. Mobilising wave energy resources in addition to the wind resources enables the delivery of renewable electricity also when the wind is low and provides better economics compared to adding more wind capacity. The tests are the follow-up of the tests that were performed during the first access under Marinet, which consisted in a proof of concept that focussed on global motion response and stability for basic evaluation and choice of platform design. For the design that proves to be the most promising, we would like to proceed and carry out performance estimation tests according to the IEA-OES stage development of ocean energy converters. As anticipated after the first set of tests, particular attention is now given to the new design and testing of the WECs of the point absorber type (3 arrays of up to 10 WECs in total) installed on the three sides of the triangular platform. The new design of the WECs is a result of the observations made during the “proof of concept” tests.
1.2 DEVELOPMENT SO FAR
1.2.1 Stage Gate Progress Previously completed: Planned for this project:
STAGE GATE CRITERIA Status
Stage 1 – Concept Validation
Linear monochromatic waves to validate or calibrate numericalmodels of the system (25 – 100 waves)
Finite monochromatic waves to include higher order effects (25 –100 waves)
Hull(s) sea worthiness in real seas (scaled duration at 3 hours)
Restricted degrees of freedom (DofF) if required by the earlymathematical models
Provide the empirical hydrodynamic co-efficient associated withthe device (for mathematical modelling tuning)
Investigate physical process governing device response. May not be well defined theoretically or numerically solvable
Real seaway productivity (scaled duration at 20-30 minutes)
Initially 2-D (flume) test programme
Short crested seas need only be run at this early stage if the devices anticipated performance would be significantly affected by them
Evidence of the device seaworthiness
Initial indication of the full system load regimes
Stage 2 – Design Validation
Accurately simulated PTO characteristics
Performance in real seaways (long and short crested)
Survival loading and extreme motion behaviour.
Active damping control (may be deferred to Stage 3)

Infrastructure Access Report: W2P Performance test
V3 Final Page 8
STAGE GATE CRITERIA Status
Device design changes and modifications
Mooring arrangements and effects on motion
Data for proposed PTO design and bench testing (Stage 3)
Engineering Design (Prototype), feasibility and costing
Site Review for Stage 3 and Stage 4 deployments
Over topping rates
Stage 3 –Sub-Systems Validation
To investigate physical properties not well scaled & validate performance figures
To employ a realistic/actual PTO and generating system & develop control strategies
To qualify environmental factors (i.e. the device on the environment and vice versa) e.g. marine growth, corrosion, windage and current drag
To validate electrical supply quality and power electronic requirements.
To quantify survival conditions, mooring behaviour and hull seaworthiness
Manufacturing, deployment, recovery and O&M (component reliability)
Project planning and management, including licensing, certification, insurance etc.
Stage 4 – Solo Device Validation
Hull seaworthiness and survival strategies
Mooring and cable connection issues, including failure modes
PTO performance and reliability
Component and assembly longevity
Electricity supply quality(absorbed/pneumatic power-converted/electrical power)
Application in local wave climate conditions
Project management, manufacturing, deployment, recovery, etc
Service, maintenance and operational experience [O&M]
Accepted EIA
Stage 5 – Multi-Device Demonstration
Economic Feasibility/Profitability
Multiple units performance
Device array interactions
Power supply interaction & quality
Environmental impact issues
Full technical and economic due diligence
Compliance of all operations with existing legal requirements
1.2.2 Plan For This Access The plan for this access will support the iterative design process by:
Measuring hydrodynamic performance of the floating platforms at 1:100 scale
Validating and calibrating the design tools and methodologies against tank data
Quantify the dynamic behaviour of the hybrid platform under relevant tank test conditions: o In complex and realistic multidirectional sea states o As a function of damper structures (heave plates) - size, shape, weight) or WECs position o With varying implementations of the 3-point mooring system
Infrastructure Access Report: W2P Performance test
V3 Final Page 9
2 OUTLINE OF WORK CARRIED OUT
2.1 SETUP This report includes one round of tests that were performed in two consecutive weeks:
1. 1st to 5th July 2013: Tests on W2Power model with free moving WECs and start of survival mode test. 2. 8th to 12th July 2013: Survival mode tests, base case (without wecs) and Drop tests.
2.1.1 Physical model The model of 1:100 scale was manufactured in Malaga, Spain, with PVC pipes of equivalent dimensions and thicknesses depending of equivalent weights in all its parts. The model of W2Power was fabricated with exchangeable hydrodynamic damping structures (heave plates) and using variable mooring components thus allowing different combinations of these important elements. The new WEC design represents a considerable improvement compared to the old heaving buoy design. It is expected that the new design will be able to absorb more energy from the incoming waves.
(a figure can be inserted later when IP issues are clarified)
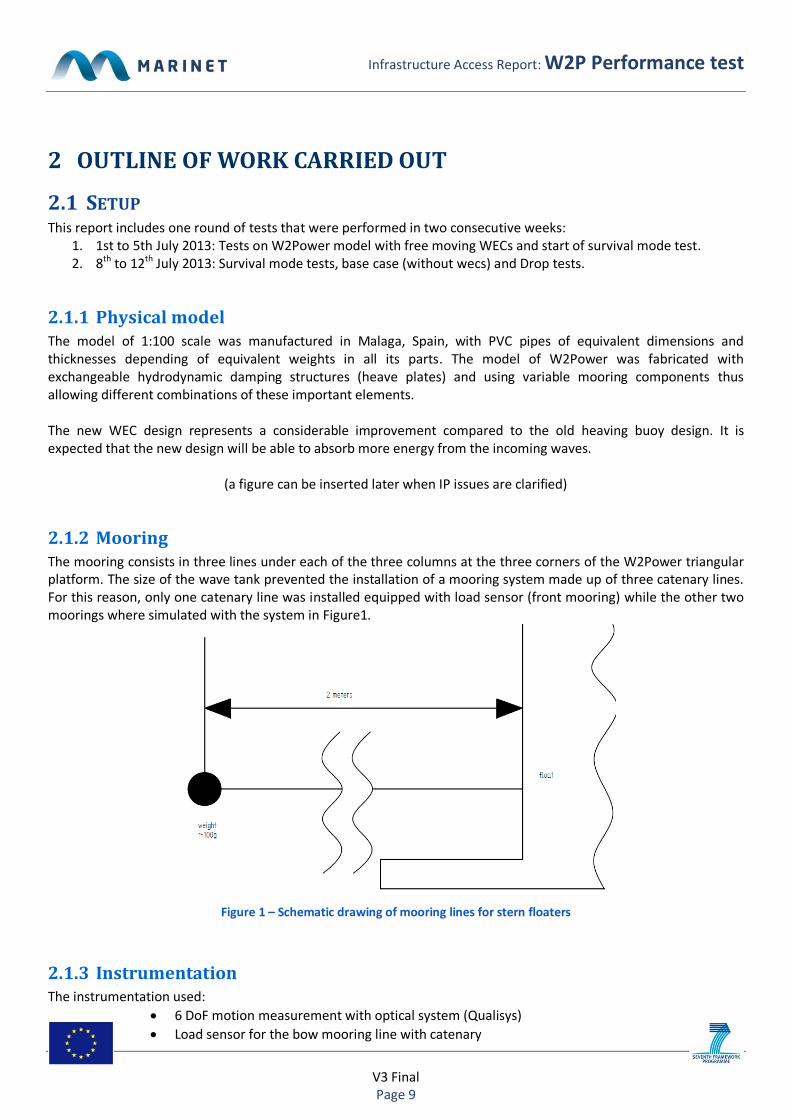
2.1.2 Mooring The mooring consists in three lines under each of the three columns at the three corners of the W2Power triangular platform. The size of the wave tank prevented the installation of a mooring system made up of three catenary lines. For this reason, only one catenary line was installed equipped with load sensor (front mooring) while the other two moorings where simulated with the system in Figure1.
Figure 1 – Schematic drawing of mooring lines for stern floaters
2.1.3 Instrumentation The instrumentation used:
6 DoF motion measurement with optical system (Qualisys)
Load sensor for the bow mooring line with catenary
Infrastructure Access Report: W2P Performance test
V3 Final Page 10
Three axis accelerometer in the position of the nacelle
Photo/video camera
2.1.4 Model Setup and Calibration The main works done before the tests for two models are:
Repair and assembly of the model
Find the CoG (centre of gravity)
Calibrate and install the instrumentation
Design and prepare the mooring
Add ballast to reach the desired draft
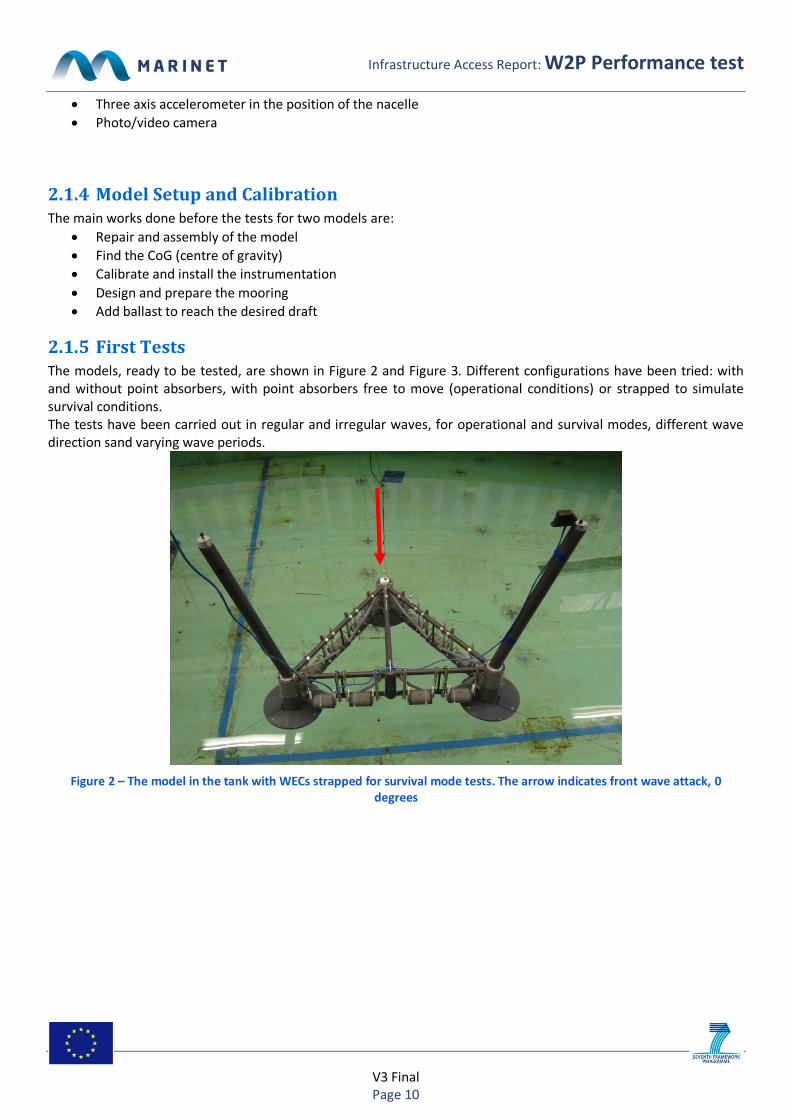
2.1.5 First Tests The models, ready to be tested, are shown in Figure 2 and Figure 3. Different configurations have been tried: with and without point absorbers, with point absorbers free to move (operational conditions) or strapped to simulate survival conditions. The tests have been carried out in regular and irregular waves, for operational and survival modes, different wave direction sand varying wave periods.
Figure 2 – The model in the tank with WECs strapped for survival mode tests. The arrow indicates front wave attack, 0 degrees
Infrastructure Access Report: W2P Performance test
V3 Final Page 11
.
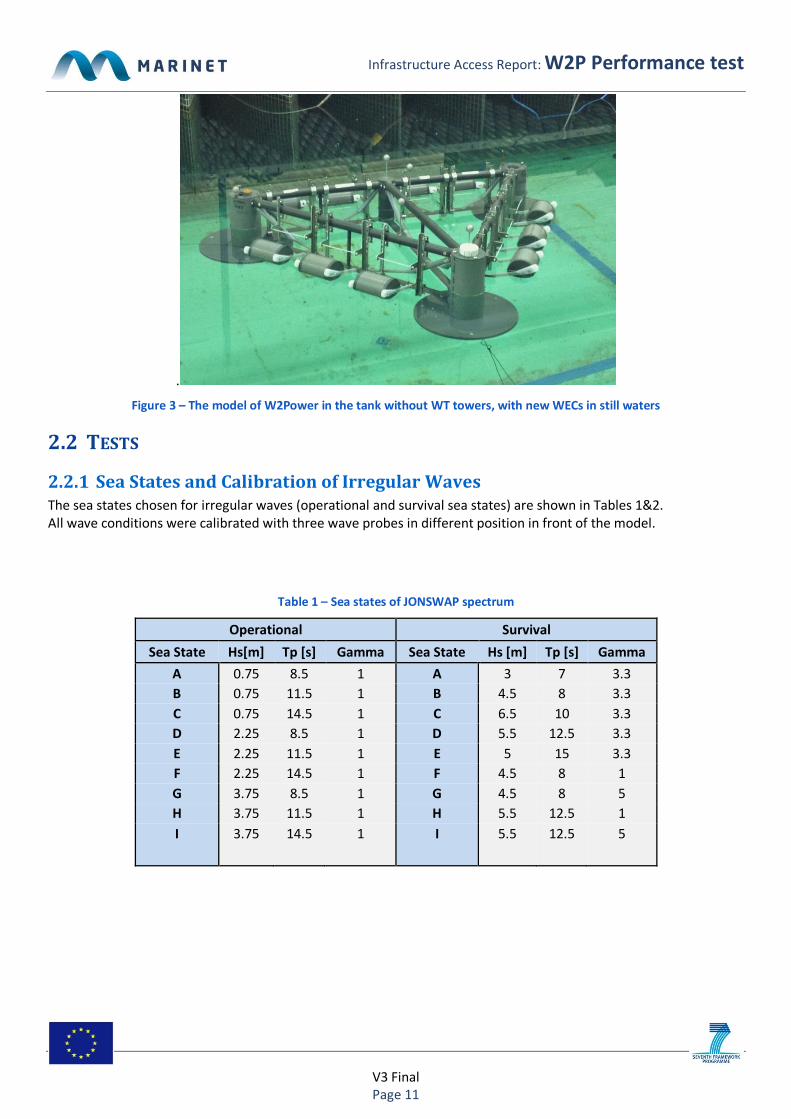
Figure 3 – The model of W2Power in the tank without WT towers, with new WECs in still waters
2.2 TESTS
2.2.1 Sea States and Calibration of Irregular Waves The sea states chosen for irregular waves (operational and survival sea states) are shown in Tables 1&2. All wave conditions were calibrated with three wave probes in different position in front of the model.
Table 1 – Sea states of JONSWAP spectrum
Operational Survival
Sea State Hs[m] Tp [s] Gamma Sea State Hs [m] Tp [s] Gamma
A 0.75 8.5 1 A 3 7 3.3
B 0.75 11.5 1 B 4.5 8 3.3
C 0.75 14.5 1 C 6.5 10 3.3
D 2.25 8.5 1 D 5.5 12.5 3.3
E 2.25 11.5 1 E 5 15 3.3
F 2.25 14.5 1 F 4.5 8 1
G 3.75 8.5 1 G 4.5 8 5
H 3.75 11.5 1 H 5.5 12.5 1
I 3.75 14.5 1 I 5.5 12.5 5

Infrastructure Access Report: W2P Performance test
V3 Final Page 12
2.2.2 Test Plan
Table 2 – Regular tests on model W2Power for different operating modes of WECs
Wave direction
WECs Wave Period [s]
Total 0.65 0.8 1 1.2 1.4 1.6 1.8
0 deg Free 3 3 3 3 3 3 3 21
15 deg Free 1 1 1 1 1 1 1 7
30 deg Free 2 2 2 2 2 2 2 14
0 deg Strapped 2 2 2 2 2 2 2 14
15 deg Strapped 1 1 1 1 1 1 1 7
30 deg Strapped 2 2 2 2 2 2 2 14
0 deg Without 3 3 3 3 3 3 3 21
15 deg Without 1 1 1 1 1 1 1 7
30 deg Without 2 2 2 2 2 2 2 14
17 17 17 17 17 17 17
Grand Total 119
Table 3 – Normal tests on model W2Power for different operating modes of WECs
Wave direction
WECs OperationalSea State
Total A B C D E F G H I
0 deg Free 1 1 1 1 1 1 1 1 1 9
15 deg Free 1 1 1 3
30 deg Free 1 1 1 1 1 1 6
0 deg Without 1 1 1 1 1 1 1 1 1 9
15 deg Without 1 1 1 3
30 deg Without 1 1 1 1 1 1 6
6 6 6 4 4 4 2 2 2
Grand Total 36
Table 4–Survival tests on model W2Power for different operating modes of WECs
Wave direction WECs SurvivalSea State
Total A B C D E F G H I
0 deg Free 1 1 1 1 1 1 1 1 1 9
15 deg Free 1 1 1 3
30 deg Free 1 1 1 1 1 1 1 7
0 deg Strapped 1 1 1 1 1 1 1 1 1 9
15 deg Strapped 1 1 1 3
30 deg Strapped 1 1 1 1 1 1 1 7
0 deg Without 1 1 1 1 1 1 1 1 1 9
15 deg Without 1 1 1 3
30 deg Without 1 1 1 1 1 1 1 7
6 9 9 9 6 6 6 3 3
Grand Total 57

Infrastructure Access Report: W2P Performance test
V3 Final Page 13
Table 5 – Drop tests on model W2Power without WECs
WECs Degree of Freedom Total
Without Heave 4
Without Pitch 4
Without Roll 4
Grand Total 12
2.3 RESULTS This section presents some preliminary results of the platform motion and other interesting values like nacelle accelerations. Due to confidential commercial information in this project, only a few data will be shown. All results are plotted in full scale. The decay test result for the model without WECs is shown in Figure 5. It may be observed that the resonance periods are about 25s for heave.
Figure 1 – Accelerations of decay test without WECs. Initial excursion in heave of about 3.0 m.
The relation between the Response Amplitude Ratio (RAO) to the RAO of base case (red line empty platform, no WECs installed, 1 means same result that for the base case) for different wave directions is shown in Figure6. It shows that in general, for wave periods longer than 8 seconds, both configurations with WECs (free or strapped) increase the stability of the platform or do not vary it significantly compared to the case with no WECs.

Infrastructure Access Report: W2P Performance test
V3 Final Page 14
Figure 2 – Relative RAO for heave (upper) and pitch (lower) for different operating modes of WECs
The relation between the Response Amplitude Ratio (RAO) relative to the RAO of the base case for different wave directions with WECs in normal operating mode is shown in Figure 3 ( in this case the base case is the blue line , wave attack angle 0 degrees, again 1 means same result that for the base case). In general, we can see an increase of the response of the structure for longer wave periods (13-15 sec) when increasing the attack angle from 0 degrees (front wave attack) to 30 degrees (side wave attack). This apparent behaviour repeats itself also for very short periods, but can instead be an erroneous result of the way the RAO are calculated, i.e. dividing the amplitude motion for the wave height, i.e. dividing number for a small number, which is the case of short wave periods. It must be noticed, that while the structure is symmetric to the wave forces and induced motions when attacked from the front by waves (0 degree wave direction), it is not any longer symmetric to the wave forces and induced motions if the wave direction differs from 0 degrees, anyway the absolute RAOs are small for all the cases tested (only relatives value shown here due to confidentiality).
Figure 3 – Relative RAO for heave with WECs in normal operating mode
2.4 ANALYSIS & CONCLUSIONS The W2Power structure stability is not in the overall negatively affected by the presence of wave absorbers. At the contrary, WECs can even improve motion performance in specific sea states. It should be noted that that in the case strapped WECs (survival mode) they act as neutral floats submerged volumes that provide stability (pitch in Figure 2). In the cases in which the platform was less stable due to the absorbers, it is necessary to locate and perform an active control of the dynamic absorbers in order to restrict platform motion response to waves. In a real case in which the wave absorbers could suffer any kind of failure or in very extreme sea conditions, these tests have shown that there is a way to lock said floats at the lower position and these will improve even more the response of the platform.

Infrastructure Access Report: W2P Performance test
V3 Final Page 15
3 MAIN LEARNING OUTCOMES
3.1 PROGRESSMADE
3.1.1 Progress Made: For This User-Group or Technology The tests carried out have been a continuation of the first round of tests under Marinet (application 71 Hybrid Floating Platforms in Deep Waters, Phase I) which consisted on the proof of concept of the W2Power platform. In addition to stability investigations, two types of wave absorbers were implemented on the platform and the relative differences on the motion response were discussed. According to the results the W2Power platform has proven to be a suitable design for the combination of wind and wave energy. In this second step the behaviour of the platform with the introduction of new, optimized wave absorbers is investigated. As the stage of testing proceeds, there is more attention for the design details and for the quality of the results. The results obtained in this second round of tests were very satisfactory. The modes tested (strapped and free WECs for survival and operational mode simulation respectively) showed no major destabilization, moreover in some cases improving the response of the platform. However, at later stages of development it is expected that an active control strategy can be implemented in such absorbers so that they can provide added stability if required by the incoming wave conditions. In the near future the efforts will be addressed to design and test of a more realistic mooring design also in presence of wind in order to quantify their induced forces and to characterize the movement associated with the concept of "wind-vanning platform".
3.2 KEY LESSONS LEARNED It is very important to have a professionally constructed model that is waterproof so not to allow any leaking
The implementation of WECs in predefined formation does not affect negatively the stability of a floating platform.
The right survival mode selection can improve significantly the behaviour of the platform in extreme wave conditions (survival conditions)
4 FURTHER INFORMATION
4.1 SCIENTIFIC PUBLICATIONS List of any scientific publications made (already or planned) as a result of this work:
A paper called “Design and Performance Validation of a Hybrid Offshore Renewable Energy Platform." has been submitted and will be presented to the IEEE EVER 2015 to be held in Monaco in April 2015.
EnerOcean showed the testing plan and previous results of testing in previous phase in the MARINET user’s conference held in ROME MARINET USERWORKSHOP 6th of November 2013.
Part of these results has been published in the Technical deliverables of Wp3 and Wp4 FP7 TROPOS project.
A presentation in the Spanish APPA Marina session in Genera Energy conference held in Madrid in February 2015 shown part of the results.
4.2 WEBSITE Websites: www.pelagicpower.no www.w2power.com www.enerocean.com

Infrastructure Access Report: W2P Performance test
V3 Final Page 16
5 REFERENCES
6 APPENDICES
6.1 STAGE DEVELOPMENT SUMMARY TABLE The table following offers an overview of the test programmes recommended by IEA-OES for each Technology Readiness Level. This is only offered as a guide and is in no way extensive of the full test programme that should be committed to at each TRL.

Infrastructure Access Report: W2P Performance test
V3 Final Page 17