hybrid-od matrix based simulation approach to identify...
TRANSCRIPT
Hybrid-OD Matrix based Simulation Approach to Identify E-Charging Hotspots in Transport Network
Eiman Y. ElBanhawy, Ruth Dalton, Venky N. Shankar, Karim A. Abdel Warith
Northumbria University, Northumbria University, The Penn State University, Purdue University [email protected], [email protected], [email protected], [email protected]
Abstract- The use of bottom up approach simulation in
transportation provides a rich framework for behaviours to emerge through interactions. The agent based modeling is a modeling technique that takes into account the attributes, constraints and variables imposed by the agent and the environment. Focusing on a alternative means of transport and in particular electric vehicles, this paper is taking place. The study proposes an integrated approach to identify electric charging hotspots in urban areas. It investigates coupling travel demand modeling to multi-model simulation technique. This is conducted through a case study; trip distribution and traffic data is provided for the given urban area. Socioeconomic and technical fundamentals of the EV system are addressed to shed light on the possibility of having integrated interactive design configurations of EV system in metropolitan areas. The outcome of the study can potentially be used in planning for future e-mobility.
Keywords- agent based modeling; comfort zone; electric vehicle; hybrid simulation.
I. NTRODUCTION
One of the main related economic issues to urban areas is
the transportation. Studying and analyzing transportation network, transit, and modes is a part of the urban economics studies which basically is a function of urban spatial structure and the location of households and firms [1]. The expansion of the urban patterns and tapestries causes a higher demand of transportation which in return has negative environmental impacts. Energy issues course through the heart of U.S. economic, environmental and national security interests. Transportation is a major contributor to GHGs and CO2 emissions which means it has to be part of the solution. Reliance on oil and other fossil fuels contributes to the worldwide pollution that causes global warming, which also threatens economic and national security.
More comprehensive energy policies have to be passed on and implemented to control the negative burden of main contributors such transport sector. Talents and resources must focus more on shaping smart and clean alternative transportation systems. Promoting clean means of transportation doesn’t only rely on the initiatives, incentives and programs provided by the government and local authorities, it is an interdisciplinary coursework engaging policy makers, manufactures, technology providers, and the most important is the end users. Capturing end users’
perspectives and feedbacks is a crucial socio-economic factor to understand real users’ demand.
The utilization of computed based representation has proven successful in simulating different real-time phenomena. Vehicular simulation is one of the advanced simulation applications that are capable of simulating mobility population, behavioral characteristics, and direct and indirect interactions [2]. This type of simulation can be achieved via two different approaches; mathematical (centralized) or behavioral (decentralized). In a centralized approach, car- following laws and scheduling techniques are used, which are not generic and cannot portray many traffic phenomena, facets, and behavioral characteristics. On the contrary, decentralized simulation is more appropriate to the population behavior being simulated [3]. Hence, the present study falls under this approach. Particularly in the area of vehicle movements, the use of computer platforms via modeling and simulation reduces the expense and length of their strategies before starting the prototype construction. Little research has been conducted in the area of simulating green mobility [4].
A. Introducing EV System Attributes In transport modeling, Artificial Intelligence (AI) takes
place to capture the social interaction and depict individual behavior and pattern. Whatsoever the objective of the modeling is, the main goal of agents is to reach their desire with the minimum travel cost. Whether the simulation’s level of abstraction is individual or aggregate, the system as whole (system equilibrium) or individual (user equilibrium), works on that aim to be achieved. The road network is a complex system to the agent to observe. Agents are autonomous elements which learn from their previous situation and adjust itself to the new situation. The situation is more complicated when there are several routes to be considered to reach from point 1 to point 2. Each route has different characteristics which involve congestion, matrix distance, traffic lights, capacity, speed, volume. In this context, the charging is another attribute is to be added to the road design characteristic. These charging facilities (CF) have specific dynamic and static design features to name but a few: on street or off street, single or multiple points per site, charging type (type 1, 2 or 3), operator service, parking facility, tariff, and availability.
978-1-4799-2262-8/14/$31.00 ©2014 IEEE
B. Outling the Problem The planning of e-charging is a new area
literature showed the attention given to pbattery technology and lifetime [5], hier[6], grid portioning methods [6] and [7], mtree [8], genetic algorithms [9], location as[10], placement problem [11], optimizaFrontier for equilibrium based traffic assigdistribution [12] and [13].The problem hplanning and constructive analysis start to tinstallation of the network. Prior strategic pto overcome the majority of EV users adepend on domestic charging; however, thithe EV market due to the range limit of thereliable publically available recharging faposition the green transport in the automotiadvanced batteries and utilities technologfactors roadmap a mainstream future marke
C. Study Objective This study is a part of empirical researc
interoperability of electric mobility (e-mometropolitan areas. With an interdisciplinarea of research is addressed. This study bof work conducted in [14]-[15] contribute presenting a hybrid simulation model marrmetropolitan area. Previous publicationsintegrating space syntax technique iunavailability of transport analysis and it [16]. This study is using the same hybrid aintegrating it with travel demand modeling controlling the movement in the road netwo
The study projects the behavioural simulation and how this influentially drivedesign of the model. It examines an attributelectric charging (e-charging) as a newly be added and considered as a design chanetwork while designing EV infrastructureas EV system lexicon as it provides neceneeded from trip distribution models population.
D. Train of Thoughts The study starts with prior research emp
mobility context. Secondly, the sociobehavassumptions needed to simulate EV populaThis is followed by a discussion of the trOrigin-Destination (OD) approach to be uBy this part, the study develops a framewthe notion through a case study in PennsAmerica.
II. EV SOCIOBEHAVIORAL-TECHNIC
Despite the ecological benefits EV offeris yet more important, Fig. 1. EV piinnovative forms of transport that
a of research. Little power distribution, rarchical clustering minimum spanning ssignment problem
ation using Pareto gnment and power happens when the take place after the planning is needed across the regions is is not promoting e vehicle. Having a cility would better ive market with the gies. All these key et.
ch looking into the obility) systems in nary approach the builds on this body to the literature by
rying OD matrix of s were addressing in light of the showed successful
approach; however, technique which is
ork. element of the
s the configuration te of road network, crucial attribute to
aracteristic of road e network. It works essary information
to simulate EV
ploying ABM in e-vioral and technical ation are addressed. rip assignment and used in the model.
work and elaborates sylvania, States of
CAL PROJECTION
rs, driving comfort ioneers strive for allow for more
independency and respect to ehas been bolstered over the ypublic attitude, consumer acceprationale behind the purchase anthe continuing success and for are potential socio-technical band widespread of EVs. These the battery capacity and car understand this, an intuitive poris the vital spine in urban areas expansion that is taking placcertain points, Origins and DTraffic Analysis Zones (TAZs),the more these points, denoted comfort zone of the driver, network. The comfort zone is nan elastic changeable and indivias the very inner circle and reflects the irregularity of the measured by time of driving, particular destination the driveEV to non-EV systems, the coless mileage due to the range limzone is the very outer circle Circle). The distance between tmileage the driver would comabout the state of the battery, Eq (
A. The Link: Integrating Sociotec In the simulation environme
battery inside the EV, Fig. consumption in different possexplained in the following sectagent architecture and build thcomputing parts of the simulatechnical aspects need to be conthat it can be modelled. Simple the agent from a driver perspecsummarise the logic behind the
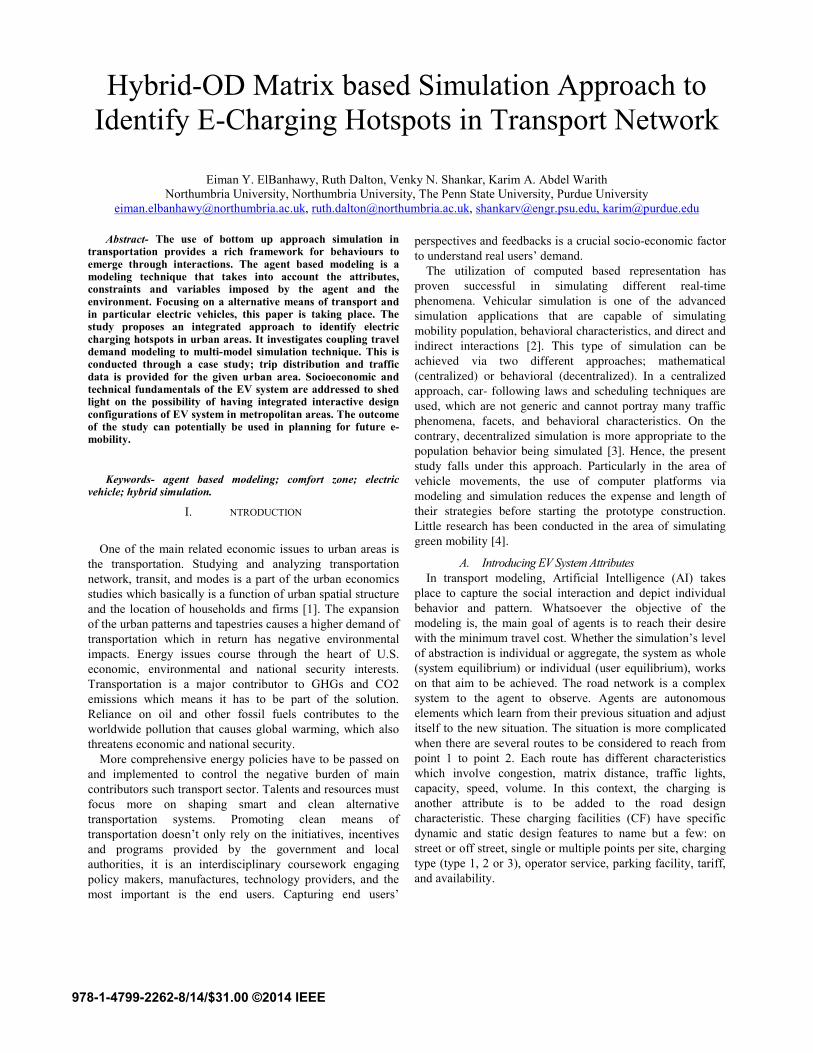
Fig. 1. Road trips and comfort zonthe road trips in areas with the charg.
environment [17]. E-mobility years but giving attention to ptance, drivers’ feedback and nd usability is fundamental for planning purposes [18].There
barriers to consumer adoption barriers are mainly related to limited range. In order to
rtray should do that. Transport especially with the everlasting e. People commute between
Destinations (OD), or zones, , in the road network. In Fig.1, as small circles are within the the more integrated is the
not a rigid confined zone; it is idual-based zone. It is denoted the poly line around which zone (EV Circle). It can be miles travelled by car, or a
er tends to target. Comparing omfort zone of the EV covers mitation. The non-EV comfort with its poly line (Non-EV
the two circles forms the extra mmute feeling uncomfortable q. 1 ) (1)
chnical with Traffic Management
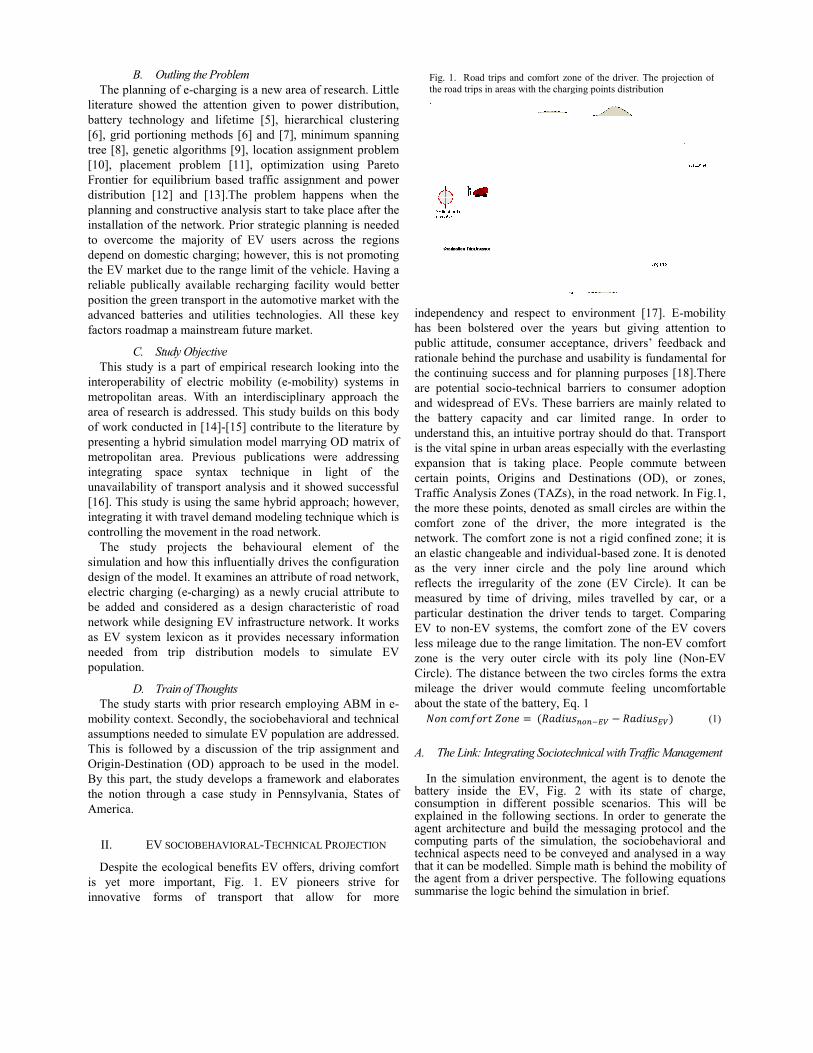
nt, the agent is to denote the 2 with its state of charge,
sible scenarios. This will be tions. In order to generate the
he messaging protocol and the ation, the sociobehavioral and nveyed and analysed in a way math is behind the mobility of
ctive. The following equations simulation in brief.
ne of the driver. The projection of ging points distribution

( ∗ ) ) Where α and β are factors, D is the diameter of E (1 ) ∗ ∗ ƒ(30% 70%)
( ) ∗ ( / / ( )
( ) (1 ) ∗ ∗( ( % ( . 9)) .
+ + ∗ / (8)
III. THE USE OF AGENT BASED MODEL
The use The use of bottom up appro
transportation provides a rich framework emerge through interactions. Agent Based is a relatively new technique for exploringcomplex systems [19] and capturing socialABM is employed to understand how to behaviour and to identify rigorous and effquantify this behaviour [21]. It is a modeltakes into account the attributes, constraimposed by the nature of the agent and thevolving nature of social sciences, andindividual decision making [19]. Transporta wide range of application; however, it casubsets depends on the aims and objecti
Fig. 2. Road trips and comfort zone of the driver. Troad trips in areas with the charging points distribu
Fig. 2. Road trips and comfort zone of the driver. Troad trips in areas with the charging points distribu
( ∗ + ∗ (2)
EV Zone.
(2) (3)
(1,2) (4) ) 1 (5) (1 )(1 ) ∗ (6) (1,2 ) ∗ (7) +
LING IN E-MOBILITY
oach simulation in for behaviours to Modelling (ABM)
g the behaviour of l interactions [20] . generate emergent
ffective methods to ling technique that
aints and variables e environment, the d the changes of tation modelling is n be classified into ives of the virtual
simulation. Modelling low carsubset of conventional vehicdifferent level of abstraction. and non-electric vehicles populcommon, but extra ordinary par
Another application of ABMpurchase decision. It has beesimulate individuals’ behavioupredict the evolution of the EVobjectives [23]. ABM was stakeholders as manufactureconsumers with their choice ditheory is employed as being thetheoretical paradigm for mwhether purchase, transport moIn some previous works, indiinfluence are the two influentiain others the decision is probabon the vehicle attributes lappearance, maintenance, runnwhich are can be called as diffuattributes can decide the markadoption[25].
[23] Has managed to desemulating energy companies, technology providers, and dealeVehicle-to-Grid technology haABM simulation. Agents tookvehicle controllers, batteries anIn [27], ABM was employed tprofile and time to the smart gri
IV. TRAVEL DE
Estimates of the volume of tor locations a necessary steDistribution models includng famodels require the number oproduction of transport nodes, This looks at the factors causingin four main categories[28]: hobased school-HBS, home basedNHB, Fig. 3. Alternative confihave started to evolve in socirelated research. Space syntax estimate conventional vehicularOrigin-Destination matrix trip obtained [29]; [30]. O-D matrixgenerated from the attraction anarea.
This process acquires socioecsome basic assumptions related between the number of the tripattributes.
The projection of theution. The projection of the
ution.
rbon emissions vehicles is a les simulation which has a Both, electric vehicles (EVs) lations would have features in radigms [22].
M related to EV is the vehicle en increasingly employed to ur and purchase decisions to V market share with different able to denote the market es, local authorities, and imensions. In literature, utility e richest and most widely used
modelling individual choices ode, or route choices[23] [24]. ividual preference and social al choice dimensions; whereas, bilistic. The decision is based ike price, range, capacity,
ning cost, safety; acceleration usion dynamics. Analysing the ket penetration and future EV
sign multi agent modelling local authorities, consumers,
ers. Analysis of powe train and as been also applications of k different roles as being the d charging infrastructure [26]. to determine the optimal load id.
EMAND MODELING
travel between zones, districts, ep in transportation studies. actor, gravity and opportunities f trips due to attraction and which is the trip generation.
g travel. Trips can be classifed ome based work-HBW, home
d other-HBO, non-home based-iguration modeling techniques ioeconomic and demographic is an alternative approach to
r travel demand without using data, which is difficult to be
x is a trip distribution process nd production list for the given
conomic and land use data and to travel cost, and the relation
ps generated and attractiveness

There are several means of trip distributior Gravity models. The first takes into accogrowth rate to predict the number of trips previous study. The latter technique basedNewton’s law of gravitation forming a simpthe force of attraction between two proportional with the masses (mass TATAZ2) and inversely proportional to thdistance. [31].
V. CASE STUDY-THE BASEL
The The Borough of State CollegPennsylvania where a high tendency ecosystem and smart initiatives comparedtaking place. The borough has a central uattracts residents of nearby towns and subdaily from-to State College. The modelpredict the behavioral dynamics of EV sysurban context. The Borough is “landlockedpart built out, the reversal in population grothat the community is redeveloping underas stated in retail market report. Populationwith a growth rate 1.12% (2010-2013) [32]
The zoning shows the eleven district zonCollege Heights, Penn State Campus, HighHolmes Foster, State College South, Tus
Fig. 4. State College with the inner urban core hZone
Fig. 3. Trip generation-activity related road tripinter-cities scale. The more these locations arezone, the higher the usability of EV system
ion: Growth Factor ount the population and it is based on
d its theory on the ple equation where TAZs is directly
AZ1 multiplied by he square of the
LINE ZONE
ge is located in of having green
d to other states is urban tapestry that burbia to commute l is developed to tem in the selected
d” and for the most owth is an indicator rutilized properties, n in 2013 is 42,503 .
ning/ areas, Fig. 4: hlands, Vallamont, ssey view Nittany
Hills East & Penfield, Greentrliterature and a conducted quesdeveloped regarding the potentform the future EV populatianalysis and socioeconomic awas outlined as well as the prosindicators as well as on house otaken into account. The downtoState College South form the arareas would generate an expect3.1% of the total Borough houscalculation to less than 14 EV inSouth, Eq. 9 (23% % (3,506 (% (5 Where the 3% is the expected EV ma
1. The Baseline Zone-OFor the baseline zone, highlig
data is tabulated in origin and tables summarize all the trips geand feeding in. This shows the is presented as an example omatrix for the zone-outside anavailable. Further calculations ademonstrates the calculation toOD Matrix
TABOD MATRIX - POINTS (1, 2, 3,
1 18 7 2 18 7 3 18 1 19 0 2 19 0 3 19 1 20 0 2 20 0 3 20
1 22 0 2 22 0 3 22
1 23 18 2 23 19 3 23
1 24 9 2 24 10 3 24 1 26 9 2 26 9 3 26
1 27 9 2 27 9 3 27
1 39 0 2 39 0 3 39
1 40 0 2 40 0 3 40
TABLOD MATRIX - POINTS (10, 11, 17
10 18 0 11 18 0 17 18
10 19 0 11 19 0 17 19
10 20 0 11 20 0 17 20
10 22 0 11 22 0 17 2210 23 10 11 23 9 17 2310 24 11 11 24 10 17 2410 26 16 11 26 15 17 2610 27 16 11 27 15 17 27
10 39 7 11 39 7 17 39
10 40 7 11 40 7 17 40
TABLOD MATRIX- POINTS (22, 25, 34
22 18 25 25 18 8 34 18
22 19 44 25 19 0 34 19
22 20 22 25 20 11 34 20
highlighted: Baseline
ps, metropolitan and e within the comfort
rees, and Orchard Park. From stionnaire, observations can be tial targeted group which will ion. Based on demographic
assessment, the baseline zone spective EV population. Social wnership and family size were own area with Highlands and rea of the study. In total, these ted EV population of 23% and sing units, 280. This pulls the n Highlands and State College
) ∗) ∗5%) * (5%)) (9) arket growthrate, 2020.
OD Matrix ghted in Fig.4, trip distribution destinations Tables 1-4. The enerated from outside the zone attractiveness of the zone and f the available data set. OD nd Inside-inside Zone is also are to be applied to all. Fig. 6 o develop a cumulative smart
BLE I 5, & 9) FEEDING THE ZONES
7 5 18 12 9 18 0 0 5 19 0 9 19 0 0 5 20 7 9 20 0
0 5 22 0 9 22 0
19 5 23 21 9 23 9
10 5 24 11 9 24 10 9 5 26 10 9 26 16
9 5 27 10 9 27 15
0 5 39 8 9 39 7
0 5 40 8 9 40 7
LE 2 , 19, & 21) FEEDING THE ZONES
8 10 19 18 13 21 18 11
9 8 9 19 0 21 19 0
0 9 19 20 11 21 20 10
2 8 19 22 0 21 22 0 3 17 19 23 20 21 23 30 4 8 19 24 14 21 24 8 6 0 19 26 9 21 26 7 7 8 19 27 8 21 27 7
9 9 19 39 9 21 39 0
0 0 19 40 0 21 40 0
LE 3 , 37, &38) FEEDING THE ZONES
8 0 37 18 16 38 18 19
9 0 37 19 21 38 19 21
0 0 37 20 9 38 20 17

22 22 0 25 22 0 34 22 0 37 2
22 23 38 25 23 34 34 23 0 37 2
22 24 50 25 24 15 34 24 7 37 222 26 27 25 26 15 34 26 0 37 2
22 27 11 25 27 42 34 27 0 37 2
22 39 28 25 39 7 34 39 10 37 3
22 40 12 25 40 7 34 40 7 37 4
TABLE 4 OD-MATRIX - POINTS (43, 45, 46, 42, & 8, 28, AND 41
43 18 35 45 18 24 46 18 14 42 1
43 19 37 45 19 9 46 19 10 42 1
43 20 30 45 20 14 46 20 17 42 2
43 22 42 45 22 20 46 22 7 42 243 23 67 45 23 66 46 23 54 42 243 24 49 45 24 73 46 24 39 42 243 26 47 45 26 114 46 26 57 42 243 27 24 45 27 110 46 27 90 42 2
43 39 50 45 39 33 46 39 27 42 3
43 40 50 45 40 33 46 40 27 42 4
Note: Points 6, 7, 12, 13, 29, 30, 31, 33, 35, 36 andtrips to the zone.
VI. CREATION OF A VALUE- SMAR
To simulate the EV population, there knowledge, level of detailing, and certain complexity needed to smoothly run the mreliable and meaningful results. The method is being used where the agent is troad network is denoted via the discrete eabout this method are in [14] and [16availability of the State College OD matrsection discusses steps needed to model EV
2. The Network and the OD MatrixTo simplify the modeling paragon, o
thoroughly analyzed. Point 1 is the chosen oFig. 5. Transport system nodes inside the Baselinnumbered, point 1 is highlighted as an example
Fig. 6. Detalied Smart OD matrix for one produzone. This is to be done to every point inside/ ouside
22 19 38 22 36
23 18 38 23 36
24 20 38 24 38 26 13 38 26 25
27 0 38 27 13
39 20 38 39 97
40 13 38 40 39
1) FEEDING THE ZONES 18 46 8 23 9
19 73 8 24 7
20 39 28 26 15
22 39 28 27 8 23 126 41 39 18 24 64 41 40 18 26 62 27 60
39 47
40 47
d 44 don’t originate any
RT OD MATRIX
is a threshold of level of technique
model and produce hybrid simulation the battery and the event. More details ]. In light of the
rix, hereinafter, the V environment.
x one path is being origin, Figs. 5-6
From the first table, the first ijourneys from point1 to the Bas
Using Eq. 5, the number of TAZ centroid 1 (point 1) are calwith a different State of the Bmention that the farther the orwill use up the charge. For simupopulation is owing Nissan LEwith (City Centre mode). This idistribution of the randomness varies between (70%-30%) char
3. The Mobility PatternThe The model counts the nu
the number of stopped cars, whthe critical battery zone, CBZ. Tagent, some events occur whiltaken. The agent has a designedcolor of the entity reflects the the agent starts with blue (30 %(20 %< battery <30%), then red
The agent follows two statements: Blue and Red, Figwhen the iteration starts. The following the smart OD maupdating the color of it, first cselfish; it wants to reach the travel cost. This is calculated aaware ahead with the nodesencounter, till the battery color t
4. Critical Zone BatteryOnce this happens, 20% char
red statement new computatioplace. During this phase, the behagent changes as it starts lookpoint. In other word, the agent travel cost adding to it the objective will be finding the shopoint, and the preference will bcharging point.
ne Zone in red and
uction point 1-baselinee the
Fig. 7. Comupational Statements
input is identified which is the eline Zone. expected cars originated from lculated. Each EV is generated Battery (SOB), Eq. 3. Not to rigin is, the faster the battery ulation purpose, the whole EV EAF model [33] [34] driving s reflected by having a normal of batteries states. The SOB
rged, Eq. 3.
n Governing the Agent umber of all generated cars and hich means these cars, entered Throughout the journey of the le some decisions need to be d state chart [16] and [15]; the state of the agent (battery) as
%< battery <70%), then yellow d (20 %< battery < zero).
main nested computational . 7. The blue statement starts agent cruises in the network
atrix, consuming energy and command, Fig.7. The agent is destination with the minimal
and tabulated and the agent is s and the decisions it will turns red.
ry (The Red Zone) rged, the CBZ starts where the onal statement starts to take havior and the objective of the king for the nearest charging starts looking for the minimal charging attribute. So, the
ortest route that has a charging be to the nearest and available

VII. DISCUSSION
The study is employing hybrid simulation modeling approach to assist planning authorities and policy makers identifying e-charging hotspot. The integrated integral approach is examining a new technique which is coupling ABM and DE with smart-OD matrix. Smart OD matrix is a modified OD matrix established from the traffic information provided. The modified OD matrix is smart in a way that it helps in developing EV system model with the needed knowledge and sufficient level of detailing nevertheless avoiding complexity and unnecessary big data interrogation.
The fundamental part of the study is the creation of the smart OD matrix and integrating it with the sociobehavioral and technical projection of the system. The study presents design basic and key elements of the EV system modeling configuration, in the case of integrating trip distribution as vehicle movement prediction technique.
VIII. CONCLUSION
The smart OD is developed and converted into stochastic attributes to be added to the road nodes. It offers predefined paths to agents to reach their destinations. The new part added to the model is the vehicular prediction movement technique. Having said that space syntax is a successful alternative way to predict the movement via the spatial configuration attributes of the network, hereby, the travel distribution technique is employed. The study proposed engaging transport demand modeling as the urban layer of the model in order to predict the vehicular movement of the EVs’ population within the system. The employed simulation methodology is capable to identify the e-charging hotspot in the urban area. The study integrates technical assumptions such as batteries, ranges, driving mode, and simulation time.
ACKNOWLEDGMENT
The The author would like to acknowledge the e-mobility NSR-Electric Mobility Partnership (e-mobility nsr) Project for funding the PhD research.
REFERENCES [1] J. M. Quigley, “Program on Housing and Urban Policy: Urban
Economics.” p. 6, 2008. [2] D. Helbing Balietti, S., “How to Do Agent-Based Simulations in
the Future,” 2011. [3] M. P. Doniec. A, “A behavioral multi agent model for raod traffic
simulation. ,” Eng. Appl. Artif. Intell., vol. 21, p. pp., 11., 2008. [4] H. N. De Melo, J. P. Trovão, S. Member, and P. G. Pereirinha,
“Batteries Usability for Electric Vehicle Powertrain,” pp. 1–7. [5] G. Lacey, G. Putus, T. Jiang, and R. Kotter, “The Effect of Cycling
on the State of Health of the Electric Vehicle Battery,” in UPEC, 2013.
[6] L. Lindblad, “Deployment Methods For Electric Vehicle Infrastructure,” Uppsala University, 2012.
[7] S.�; GE, L. FENG, and H. LIU, “The Planning of Electric Vehicles Charging Station Based on Grid Partition Method,” IEEE, pp. 2726–2730, 2011.
[8] S. Najafi, S. H. Hosseinian, M. Abedi, A. Vahidnia, and S. Abachezadeh, “A Framework for Optimal Planning in Large Distribution Networks,” IEEE Trans. Power Syst., vol. 24, no. 2, pp. 1019–1028, 2009.
[9] J. Dong, C. Liu, and Z. Lin, “Charging infrastructure planning for promoting battery electric vehicles: An activity-based approach using multiday travel data,” Transp. Res. Part C Emerg. Technol., vol. 38, pp. 44–55, Jan. 2014.
[10] T. D. Chen, K. M. Kockleman, and M. Khan, “The Electric Vehicle Charging Station Location Problem: A Parking-Based Assignmnet Method for Seattle,” in The 92nd Annual Meeting of the Transportation Research Board in Washington DC, 2013.
[11] A. Y. S. Lam, Y.-W. Leung, and X. Chu, “Electric Vehicle Charging Station Placement�: Formulation , Complexity , and Solutions,” arXiv, vol. 2, no. 1310.6925, pp. 1–10, 2014.
[12] W. Yao, J. Zhao, F. Wen, Z. Dong, Y. Xue, Y. Xu, and K. Meng, “A Multi-Objective Collabrative Planning Strategy for Integrated Power Distribution and Electric Vehicle Charging System,” IEEE Trans. Power Syst., 2014.
[13] F. He, D. Wu, Y. Yin, and Y. Guan, “Optimal deployment of public charging stations for plug-in hybrid electric vehicles,” Transp. Res. Part B Methodol., vol. 47, pp. 87–101, Jan. 2013.
[14] E. ElBanhawy, R. Dalton, and K. Nassar, “Integrating Space-Syntax And Discrete-Event Simulation For E-Mobility Analysis,” Am. Soc. Civ. Eng., vol. 1, no. 91, pp. 934–945, 2013.
[15] E. . ElBanhawy, R. . Dalton, and C. Anumba, “The Agent Based Modeling of E-Mobility,” in IEEE Transportation Electrification Conference and Expo, 2014.
[16] E. Elbanhawy and R. Dalton, “Syntactic Approach To Electric Mobility IN Metropolitan Areas NE 1 district core,” in 9th Int. Symposium on Spatial Data HandlingSpace Syntax Sympouim, Korea, 2013.
[17] M. Pierre, C. Jemelin, and N. Louvet, “Driving an Electric Vehicle. A Sociological Analysis on pioneer Users,” Energy Effic. Transp. Mobil., vol. 4, no. 4, pp. 511–522, 2011.
[18] R. Ozaki and K. Sevastyanova, “Going Hybrid: An analysis of consumer purchase motivations,” Energy Policy, no. 39, pp. 2217–2227, 2011.
[19] M. Abbas, “Agent Based Modeling and Simulation,” Artif. Intell. Appl. to Crit. Transp. Issues, vol. E-C168, 2012.
[20] T. M.�; Sweda and K. Diego, “An Agent-Based Information System for Electric Vehicle Charging Infrastructure Deployment,” 2012.
[21] W. K. V. . Chan, Y.-J. . Son, and C. M. . Macal, “Agent based Simulation Tutorial: Simulation od Emergant Behavior and Differences between Agent-Based Simulation and Discrete-Event Simulation,” in Winter Simulation Conference, 2010, pp. 135–150.
[22] E. . ElBanhawy, R. Dalton, E. . Thompson, and R. Kotter, “Real-Time E-Mobility Simulation in Metropolitan Area,” in 30th eCAADe Conference, 2012, pp. 533–546.
[23] E. Shafiei, H. Thorkelsson, E. Asgeirsson, B. Davidsdottir, M. Raberto, and H. Stefansson, “An Agent-based Modelling Approach to Predict the Evolution of Market Share of Electric Vehicles: A Case Study from Iceland,” Technol. Forecast. Soc. Change, no. 79, pp. 1628–1653, 2012.
[24] J. K. Dagsvik, T. Wennemo, D. G. Wetterwald, and R. Aaberge, “Potential demand for alternative fuel vehicles,” Transp. Res. Part B Methodol., vol. 36, no. 4, pp. 361–384, 2002.
[25] A. Namatame, H. . Morita, and K. . Matsuyama, “Agent based Modelling for the Study of Diffusion Dynamics,” in Spring Simulation Multiconference, 2009, pp. 22–27.
[26] M. Lützenberger, J. Keiser, N. Masuch, and S. Albayrak, “Agent Based Assistance for Electric Vehicles An Evaluation,” in The 8th international conference on Active Media Technology Active Media Technology, 2012, pp. 145–154.
[27] S. Acha, K. Vandam, J. Keirstead, and N. Shah, “Integrated Modelling Of Agent-Based Electric Vehicles into Optimal Power Flow Studies ,” 21st Int. Conf. Electr. Distrib. Frankfurt, 6-9 June 2011, 2011.
[28] W. Martin and N. McGuckin, “Travel Estimation Techniques for Urban Planning,” 1998.
[29] P. Abhijit, “An integrated approach to modeling vehicular movement networks: Trip assignment and space syntax,” 2009.
[30] P. Abhijit, “Axial analysis: a syntactic approach to movement network modelling.,” Inst. T. Planners, India J., vol. 1, no. 8, pp. 29–40, 2011.
[31] T. V. . Mathew and K. V. . Rao, Krishna, “Trip Distribution,” in in ntroduction to Transportation Engineering, 2006.
[32] S. C. Council, “Borough of State College Government – Council Members. Retrieved on,” 2013. [Online]. Available: http://www.statecollegepa.us/index.aspx?NID=32.
[33] M. Boxwell, “Be Green, Owing and Electric Car,” 2011. [Online]. Available: http://www.owningelectriccar.com/electric-car-range.html.
[34] M. Brain, “How Electric Cars Work,” How stuff works, 2012. [Online]. Available: http://auto.howstuffworks.com/electric-car5.htm.