hybrid tio /zno nanopowder for several dyes- … · prominent competitor due to its ease of...
TRANSCRIPT

International Journal of Science and Research (IJSR) ISSN (Online): 2319-7064
Index Copernicus Value (2015): 78.96 | Impact Factor (2015): 6.391
Volume 6 Issue 8, August 2017
www.ijsr.net Licensed Under Creative Commons Attribution CC BY
Hybrid TiO2/ZnO Nanopowder for Several Dyes-
Sensitized Solar Cell
Dheyaa B. Alwan1 , Falah H. Ali
2
1Ministry of Education, Karkh / 1, Secondary distinguished Harthiya of Baghdad, Iraq
2Phsics Department, College of Science, University of Baghdad, Iraq
Abstract: In this research, hybrid solar cells created on the basis of (TiO2/ZnO), where the performances of two kinds of the
semiconductor are similar to make paste that is applied as electrode dye molecules absorb photons of falling light rays.These solar cells
have preferred an alternative to traditional photovoltaic cells that rely on dyes due to improved properties performance. The dyes solar
cell usually consists of four parts: conductive glass (FTO) , an electrolyt solution, dyes and TiO2/ZnO electrode. solar cell depends on
some characteristics, including technique and preparation of paste (TiO2/ZnO) , which is important to obtain the best efficiency and
used the method of Doctor blade. We proved that mixed dyes give higher conversion efficiency than if they were alone such as
ruthenium dye (Ru) has better photovoltaic properties compared to other two dyes eosin (EO) and methyl red (Mth). Photovoltaic
parameters like, Overall conversion efficiency (η) of glass substrate solar cell film thickness (16 µm) with efficiency three dyes of
ruthenium, eosin and meth red were found (2.11 % , 0.84 %and 0.43 %) respectively, while best efficiency (2.29%) was found when
mixing the together dyes with each other 3ruthenuim dye +7methyl red dye at percentage 75 % / 25% under 40 mW/cm2 illumination .
Keywords: Hybrid TiO2/ZnO electrode, Dyes mixing, DSSC
1. Introduction
The dye-sensitized solar cell (DSSC), as a potential
marketing renewable energy device, has attracted great
interest due to its low cost, compared with the traditional Si
solar cell [1,2]. The structure of a DSSC is made of three
main parts; counter electrode, photo anode and an
electrolyte. Counter electrode, normally conductive glass
and a fluorine- doped tin oxide (FTO) the most commonly
used, coated with few atomic layers of carbon or platinum,
in order to catalyse the redox reaction of (I−/I
3−) reaction
with the electrolyte. Photo anode is constructed from
semiconductor oxide porous film on a conductive glass
substrate anchored amono layer of dye. The electrolyte can
be made from organic solvent containing a red-ox couple
such as iodide/tri-iodide [3]. Sensitizing dye plays an
important role in the absorption of the photons and
generation of electron and hole pairs; the charge carriers are
transferred to the photoelectrode and the electrolyte. It is
well known that the number of sensitizing dye molecules
adsorbed on a photoelectrode is one of the key factors in determining the short circuit current density (Jsc) and hence
the efficiency in DSSCs [4]. The quality and anchoring of
the dye to the surface of semiconductor oxide porous film
are important processes determining the photo conversion
efficiency PCE of the cell[5].The huge mesoporous surface
allows for an adsorption of a sufficiently large number of
dye molecules for efficient light harvesting[5,6]. The
highest efficiency of DSSC was observed for cells sensitized
by ruthenium complexes adsorbed on naocrystalline TiO2,
which reached 11%–12%, but they are still not suitable due
to the high cost [7].
Ru (II) is the most efficient dye due to its numerous
advantageous features, such as good absorption, long
excited-state lifetime, and highly efficient metal-to-ligand
charge transfer. Ru bipyridyl complexes are excellent
photosensitizers due to the stability of the complexes’
excited states and the long-term chemical stability of
oxidized Ru (III) [8]. the maximum certified efficiency for
DSSCs is much lower compared to silicon based solar cells.
Much research has been focused on enhancing the
performance of DSSC with different anode materials such as
TiO2, ZnO, SnO2, Nb2O5 etc. while TiO2 is dominated most
of times [9]-[10]. Recently, ZnO, with similar band gap to
that of TiO2, appears to be an alternative material for the
fabrication of high efficiency DSSCs. It possesses high
environmental stability and high electron mobility,
providing a direct conduction pathway for rapid collection of
electrons at the substrate of the photoanode [11]-[12].
Though power conversion efficiency of solar cells based on
ZnO is lower than that of TiO2, ZnO is still regarded as a
prominent competitor due to its ease of synthesis and
flexibility on the nanostructure morphologies. In addition,
the electron mobility of ZnO is higher than that of TiO2, the
charge recombination rate of ZnO is lower than that of TiO2,
and the electron lifetime of ZnO is longer than that of TiO2
[13, 14]. Those characteristics are beneficial for solar cell
applications. The efficiency limitation of theDSSCs is
considered as a big challenge to be In commercial
application widely.Various strategies are being employed to
overcome such intrinsic limitation[15].
2. Experimental
2.1 Materials
Titanium dioxide powder anatase ( 25 nm) is purchased
from MK nano Canada), ZnO (50 nm) ) is purchased from
China , Conductive glass (Fluorine doped tin oxide, FTO,
sheet resistance 7sq−1 transmission (80%) and Ethylene
glycol from GCC England, acetic acid solution-from SCR-
china, iodine (I2) and potassium iodide (KI) and e (H2PtCl6)
were purchased from Erftstadt Germany. And N719 stands
for di-tetrabutylammoniumcisbis (isothiocyanate) bis (2,22
-bipyridyl-4,42 - dicarboxylate) ruthenium complex both
supplied by [Solaronix] . A dye eosin- Y was bought from
SCR-china as sensitizers and methyl red dye purchased from
Paper ID: ART20176256 DOI: 10.21275/ART20176256 1609

International Journal of Science and Research (IJSR) ISSN (Online): 2319-7064
Index Copernicus Value (2015): 78.96 | Impact Factor (2015): 6.391
Volume 6 Issue 8, August 2017
www.ijsr.net Licensed Under Creative Commons Attribution CC BY
Germany. Distilled water and Ethanol purchased from
Fluka. multimeter is dvice used to measure short circuit
current and open circuit voltage Which directly connects to
electrodes solar cell. It is also used to find out conductive
side of the glasses from China.
2.2 Preparation of the TiO2/ZnO solution
First start by making the mixture TiO2/ZnO paste with
powder preparation ZnO and TiO2 according to the
following steps: (1) material TiO2 powder and ZnO powder
are weighed, (2) the mixture of w/w: TiO2/ZnO were
nanoparticles according to the following percentages : 100%
TiO2 + 0% ZnO , 75% TiO2 + 25% ZnO , 50% TiO2 + 50%
ZnO , 25% TiO2 + 75% ZnO, 0% TiO2 +100% ZnO or
(100/0, 75/25, 50/50, 25/75,0/100) respectively.(3) The
(TiO2 / ZnO) powder have been grinding by using mortar
and pestle for 20 minut in order to prevent powder
aggregation. (4) into the mixed solvent composed of 75mL
of ethanol and 25mL of water, The solution was mixed until
it became uniform and lump-free and Suspension is then
stored and allows equilibrating for 15 minutes,then after that
we follow the way doctor blade method [16]. (5) two clean
FTO glass substrates were used as positive and negative
electrodes with a 1 cm2 space between the two electrode
surfaces; (6) the sample film was immersion in the dyes; (7)
finally, Annealing temperature above 723 K (450 oC) for 0.5
h, has a significant effect on the film morphology as well as
more TiO2 paste cohesion of the substrate [17].
2.3 Dye sensitization of TiO2 / ZnO films
Dyes have a significant and significant effect on solar cells
and the intensity of lighting also has a clear effect on cell
performance with TiO2 / ZnO films prepared by the above
procedure on FTO glass substrates was immersed into an
organic dyes , ruthenium dye N719 (5×10⁻⁴
M) ,eosin dye
(2×10⁻⁴
M ) methyl red dye (3×10⁻³
M ) . In the case of
mixing pigments left immersed for a period of 2.5 hours .
The dye-coated electrodes were copiously washed with
ethanol before their use in DSSC, the electrodes were left in
the oven (100 0C) for 5 min to remove any ethanol or
humidity that could be present in the pores of the films.
Therefore, it is highly recommended that the prepared TiO2 /
ZnO films must be annealed at a temperature of 723 K (450 oC) before being immersed into the sensitizing dyes.
3. DSSC Performance
Fill factor for DSSC was calculated from equation (1). The
conversion efficiency of solar cell can be calculated from the
output of short circuit current and open circuit voltages
according to the following relationship:
FF = (Jmax × Vmax)/ (Jsc × Voc)….(1)[18]
𝜂 = (Jsc × Voc ×FF ) / Pin× 100% ….(2)[18]
where Pin is the total is solar power incident on the cell.
Where is the power incident light equal 40 mW /cm2 for air
mass (AM) 1.5. The fill factor (FF) is the ratio of the
maximum power from the solar cell to the product of open-
circuit voltage (Voc) and the short-circuit current density
(mA/cm2) (Jsc) , Where is the current at maximum output
power and voltage at maximum output power ( J max , Vmax )
respectively.
4. Results and Discussion
4.1. Absorption spectrum of three dyes
Figure (1) three dyes were used as sensitizers in solar cells,
the most important of which is the dye of Ruthenium
because it occupies a wide range of the spectrum with three
absorption peaks at (350 nm, 382nm, 533 nm), Its spectrum
does not exceed the limits of the red zone where the
efficiency of the dye is limited. While eosin dye, it is less
efficient to occupy part of the visible spectrum and have two
peaks at (525nm,410 nm). The third type of methyl red dye
which is the least efficient possession of only one peak at
)422nm) , This means weak to absorb most of the solar
spectrum.
Figure (1) : Absorption spectrum for three dyes (a) Ruthenium dye (Ru) (b) Eosin dye (EO ) (c) Methyl red dye (Meth)
4.3 Effect of thickness on efficiency
Film thickness layer on the electrode influences the
efficiency of the solar cell because this layer absorbs the dye
and thus the transition time of the electron. The higher
thickness layer made on the pole the less permeability
according to the Lambert Bear law as well as the dispersion
of light because of the surface roughness and the
aggregation particles, and may get cracks in the layer due to
this increase film layer [19] .After several tests it was found
that the highest efficiency was found when thickness of
film ) 16 μm (This is within the thickness preferred [20]. As
shown in fig (2).
Paper ID: ART20176256 DOI: 10.21275/ART20176256 1610

International Journal of Science and Research (IJSR) ISSN (Online): 2319-7064
Index Copernicus Value (2015): 78.96 | Impact Factor (2015): 6.391
Volume 6 Issue 8, August 2017
www.ijsr.net Licensed Under Creative Commons Attribution CC BY
Figure 2: Thickness film vs efficiency
4.4. Effect of thickness on the current for solar cell
Figure (3) we observe increase current as the thickness layer
increases until it reaches the thickness (16µm) where the
current is the greatest value and the best efficiency as in the
following results
Isc =2 mA ,Imax =1.7 mA ,Voc = 0.55 mV , Vmax = o.47 mV,
FF = 0.75 , 𝜂 = 2 % .
After this point begins to descend due to increased thickness
of the layer that leads to slow electron transmission.
Figure 3: Effect thickness on the current
4.5. Effect of dyes on efficiency
Dyes play a major role in the work of solar cells as shown in
table )1). The first model (without ZnO) is the efficiency of
the second place in terms of preference dyes (Ruthenium Ru,
Eosin EO, Methyl red dye Mth), while the second model
efficiency is better after mixing the ratio (TiO2 / ZnO) is
(75/25) in the three dyes.Zinc oxide increased open circuit
voltages, This ratio was sufficient to improve the efficiency
solar cell . In the following models , Zno increase , over
(25%) led to a decrease in efficiency as indicated in the table
because particles size of zinc oxide is more than titanium
dioxide, great molecules size lead less surface area of the
dye absorption therfore , decreases efficiency and the
electron transfer process is available. As shown figure (4) .
Table 1: Effect dyes on efficiency
Red dye
𝜂% Eosin dye
𝜂% Ru dye
𝜂% TiO2 / ZnO w/w
0.4 0.79 2 100/0
0.43 0.84 2.11 75/25 0.3 0.65 1.65 50/50
0.24 0.51 1.5 25/75 0.19 0.38 1.32 0/100
Figure 4: Effect dyes on efficiency
4.6 Effect of mixing dyes on the efficiency
Table (2) shows the absorption spectrum of the mixed dyes
ruthenium (Ru), eosin (EO) and methyl red (Mth) with the
absorbability range of 200 - 700 nm. The same method was
used to determine the efficiency. When examining the
absorption of the dyes after blending. I had two groups terms
of number peaks because increasing the peaks means their
absorption spectrum is high especially in the visible light
area. First set with three peaks figure (5). From the result in
Table 2, the DSSC of the combined dye mixture had
improved photoelectric conversion efficiency. This is
attributed to a synergistic sensitization by the dye mixture
leading to higher efficiency [21]. The peak of pigments
mixed in this table showed that mixed blended dyes showed
different wavelengths because of the difference in their
absorption and composition .
Paper ID: ART20176256 DOI: 10.21275/ART20176256 1611
International Journal of Science and Research (IJSR) ISSN (Online): 2319-7064
Index Copernicus Value (2015): 78.96 | Impact Factor (2015): 6.391
Volume 6 Issue 8, August 2017
www.ijsr.net Licensed Under Creative Commons Attribution CC BY
Table 2: Effect mixing dyes on efficiency
TiO2/ ZnO
(dyes ml)
100/0 (eff%) 75/25
(eff%)
50/50
(eff%)
25/75
(eff%)
0/100
(eff%)
1)5Ru+1EO+4Mth.red 2.15 2.25 1.88 1.72 1.5
2)3Ru+7Mth.red 2.21 2.29 2 1.7 1.6
3)1Ru+9Mth.red 2.17 2.2 1.9 1.62 1.5
4)4Ru+5EO+1Mth.red 2.13 2 1.85 1.65 1.42
9)8Ru+2Mth.red 1.8 1.87 1.62 1.46 1.26
10)2Ru+2EO+6Mth.red 1.7 1.9 1.4 1.25 1.16
11)6Ru+4EO 2.2 2.27 2.13 2 1.44
12)7Ru+2EO+1Mth.red 1.8 1.96 1.5 1.37 1.2
13)2Ru+5EO+3Mth.red 1.4 1.52 1.15 1.1 0.9
14)8Ru+2EO 1.3 1.6 1.14 1 0.84
Figure (5) we observe the best model for mixture of dyes are
models (2,11,1) respectively with the best efficiency (2.29%,
2.27% , 2.25%) respectively for having three peaks (305nm,
389 nm ,492 nm), (299 nm , 397 nm , 519 nm) ,(300 nm,
385 nm, 513 nm) respectively.
Figure 5: Absorption mixture dyes
Second group table (3), which has two peaks, means the
amount of absorption of the solar spectrum less than the first
group. Under conditions illumination intensity has stronger
influence on the performance of cell with TiO2- ZnO
nanoparticles when volum ) 75/25(. Under the illumination
intensity of 40 mW/ cm2, Where efficiency is shown in the
following figure (6) .
Table 3: Effect mixing dyes on efficiency
TiO2/ ZnO
(dyes ml)
100/0
(eff%)
75/25
(eff%)
50/50
(eff%)
25/75
(eff%)
0/100
(eff%)
5)1Ru+9EO 2.1 2.15 1.63 1.44 1.21
6)6Ru+4Mth.red 2 2.5 1.8 1.6 1.4
7)2Ru+2EO+6Mth.red 1.91 2.10 1.75 1.61 1.5
8)1Ru+3EO+6Mth.red 1.85 1.93 1.53 1.42 1.21
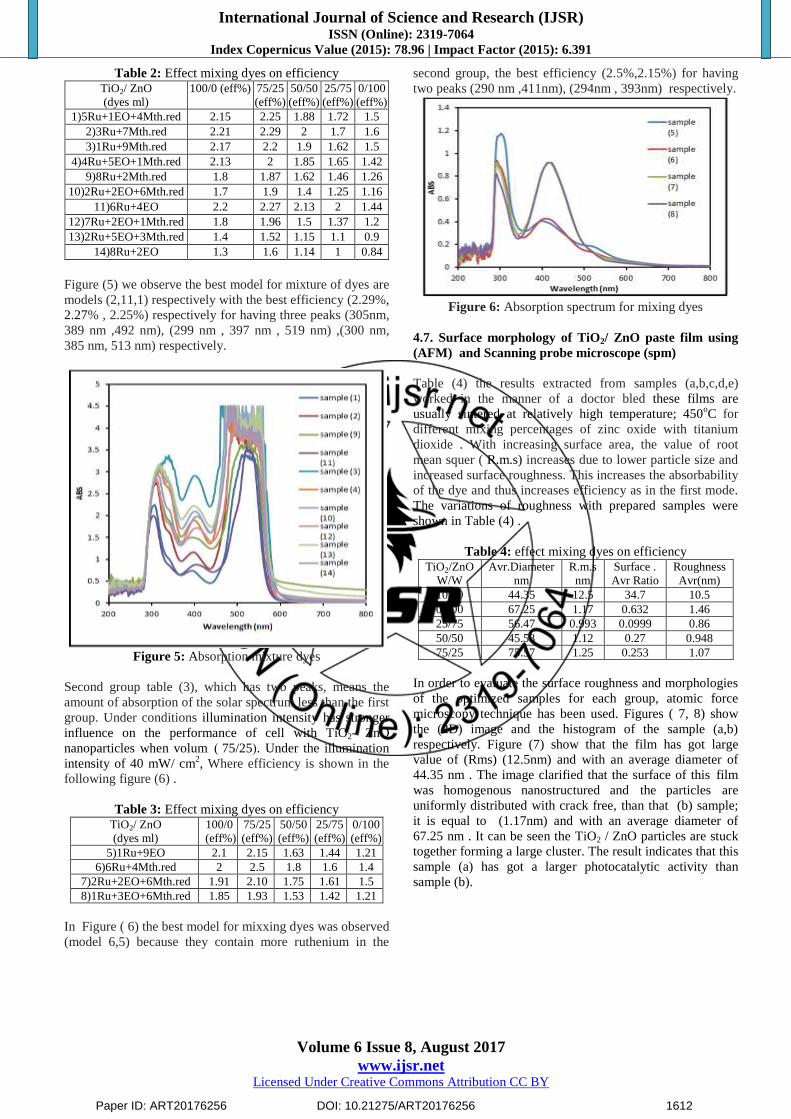
In Figure ( 6) the best model for mixxing dyes was observed
(model 6,5) because they contain more ruthenium in the
second group, the best efficiency (2.5%,2.15%) for having
two peaks (290 nm ,411nm), (294nm , 393nm) respectively.
Figure 6: Absorption spectrum for mixing dyes
4.7. Surface morphology of TiO2/ ZnO paste film using
(AFM) and Scanning probe microscope (spm)
Table (4) the results extracted from samples (a,b,c,d,e)
worked in the manner of a doctor bled these films are
usually sintered at relatively high temperature; 450oC for
different mixing percentages of zinc oxide with titanium
dioxide . With increasing surface area, the value of root
mean squer ( R.m.s) increases due to lower particle size and
increased surface roughness. This increases the absorbability
of the dye and thus increases efficiency as in the first mode.
The variations of roughness with prepared samples were
shown in Table (4) .
Table 4: effect mixing dyes on efficiency TiO2/ZnO
W/W
Avr.Diameter
nm
R.m.s
nm
Surface .
Avr Ratio
Roughness
Avr(nm)
100/0 44.35 12.5 34.7 10.5
0/100 67.25 1.17 0.632 1.46
25/75 56.47 0.993 0.0999 0.86
50/50 45.53 1.12 0.27 0.948
75/25 75.57 1.25 0.253 1.07
In order to evaluate the surface roughness and morphologies
of the optimized samples for each group, atomic force
microscopy technique has been used. Figures ( 7, 8) show
the (2D) image and the histogram of the sample (a,b)
respectively. Figure (7) show that the film has got large
value of (Rms) (12.5nm) and with an average diameter of
44.35 nm . The image clarified that the surface of this film
was homogenous nanostructured and the particles are
uniformly distributed with crack free, than that (b) sample;
it is equal to (1.17nm) and with an average diameter of
67.25 nm . It can be seen the TiO2 / ZnO particles are stuck
together forming a large cluster. The result indicates that this
sample (a) has got a larger photocatalytic activity than
sample (b).
Paper ID: ART20176256 DOI: 10.21275/ART20176256 1612

International Journal of Science and Research (IJSR) ISSN (Online): 2319-7064
Index Copernicus Value (2015): 78.96 | Impact Factor (2015): 6.391
Volume 6 Issue 8, August 2017
www.ijsr.net Licensed Under Creative Commons Attribution CC BY
Figure 7: (2D) image and histogram of TiO2 / ZnO (100/0 %)
Figure 8: (2D) image and histogram of TiO2 / ZnO (0% /100 %)
Figures (9,10,11) shows the (2D) image and the histogram
of (TiO2 / ZnO) composite samples. Film (e) becomes more
efficiency than (c,d) films because the addition of (ZnO)
changes the surface area of the (TiO2) nanoparticles in the
composite paste. It is believed that the (ZnO) nanoparticles
increase current open circuit. The film (c) has got a very
small roughness (Rms = 0.99nm), Therefore this sample will
show a very low photocatalytic activity. Aggregates generate
(TiO2 / ZnO) an effective light scattering and thus
significantly increasing traveling distance of the light within
the photoelectrode film.
Figure 9: (2D) image and histogram of TiO2 / ZnO (25 % /75 %)
Paper ID: ART20176256 DOI: 10.21275/ART20176256 1613

International Journal of Science and Research (IJSR) ISSN (Online): 2319-7064
Index Copernicus Value (2015): 78.96 | Impact Factor (2015): 6.391
Volume 6 Issue 8, August 2017
www.ijsr.net Licensed Under Creative Commons Attribution CC BY
Figure 10: (2D) image and histogram of TiO2 / ZnO (50 % /50 %)
Figure 11: (2D) image and histogram of TiO2 / ZnO (75 % /25 %)
5. Conclusion
Hybrid TiO2 / ZnO photo- anodes were prepared using
doctor bled method , Our results reveal that at an optimal
thickness16µm . Photovoltaic performance of cell with ZnO-
TiO2 nanoparticles is superior to that of cell with pure ZnO
or pure TiO2 nanoparticles. The illumination intensity has
stronger influence on the performance of cell with ZnO-TiO2
nanoparticles. Under the illumination intensity of 40 mW
cm-2. The best efficiency of solar cell with TiO2- ZnO equal
75% /25% nanoparticles is 2.29 % , while 1.32 % and 2 % in
case of cell with TiO2 and ZnO, respectively. We conclude
that the mixed dye has a higher conversion efficiency than
the dye, which is on its own. So they provide higher
efficiency than dye on their own. The mixed dye has higher
conversion efficiency than dyes prepared by either
ruthenium dye , eosin dye or methyl red dye. Therefore, the
mixed dye in this study provides a more efficient incident
photon-to-electron conversion. From table (4) increase
titanium doxide leads to increasing of the roughness
situation. There is not much difference in the
microstructures except that .agglomeration has increased in
the film sintered at 4500C which has led to degradation in
the performance of DSSC as obvious from the electrical
studies due to increased particle size.
6. Acknowledgment
Authors would like to thank Dr. Kathum Aadim at
Department of Physics, College of Science, Baghdad
University for his notes and valuable assistance in testing
there samples.
References
[1] B. O’Regan and M. Gr€atzel, A low-cost, high-
efficiency solar cell based on dye-sensitized colloidal
TiO2 films Nature, 1991, 353, 737
[2] J. B. Xia, N. Masaki, M. Lira-Cantu, Y. Kim, K. J.
Jiang and S. Yanagida, Influence of Doped Anions on
Poly(3,4-ethylenedioxythiophene) as Hole Conductors
for Iodine-Free Solid-State Dye-Sensitized Solar Cells,
J. Am. Chem. Soc., 2008, 130, 1258.
[3] Dheyaa B. Alwan , Effect of Solvent type and
Annealing Temperature on Efficiency for Eosin -y Dye
Sensitized Solar Cells , Iraqi Journal of Science, 2016,
Vol. 57, No.4A, pp: 2429-2435 .
[4] B. C. Jeon, M. S. Kim, M. J. Cho, D. H. Choi, K.-S.
Ahn, J. H. Kim, Effect of solvent on dye-adsorption
process and photovoltaic properties of dendritic organic
dye on TiO2 electrode of dye-sensitized solar cells,
Synthetic Metals.188, 130– 135, (2014).
[5] N.Papageorgiou, W.F.Maier, M.Grätzel; an iodine
triiodide reduction electrocatalyst for aqueous and
organic media, J.Electrochem.Soc., 144(3), 876-884
(1997).
[6] N.Papageorgiou; CoorChem Rev., 248, 1421 (2004).
[7] Sofyan A. Taya, Taher M. EL-Agez, Kamal S.
Elrefi,and Monzir S. Abdel-Latif. 2015 . Dye-sensitized
solar cells based on dyes extracted from dried plant
leaves. Turk J Phys, 39: 24 – 30.
Paper ID: ART20176256 DOI: 10.21275/ART20176256 1614

International Journal of Science and Research (IJSR) ISSN (Online): 2319-7064
Index Copernicus Value (2015): 78.96 | Impact Factor (2015): 6.391
Volume 6 Issue 8, August 2017
www.ijsr.net Licensed Under Creative Commons Attribution CC BY
[8] S. A. Taya, T. M. El-Agez, H. S. El-Ghamri, M. S.
Abdel-Latif, International Journal of Materials Science
and Applications, 2 (2) (2013) 37-42.
[9] M. Zi, M. Zhu, L. Chen, H. Wei, X. Yang, and B. Cao,
―ZnO photoanodes with different morphologies grown
by electrochemical deposition and their dye-sensitized
solar cell properties,‖ Ceram. Int., vol. 40, pp. 7965-
7970, January 2014.
[10] B. Y. Jeong and E. H. Jung, ―Micro-mountain and
nano-forest pancake structure of Nb2O5 with surface
nanowires for dye-sensitized solar cells,‖ Met. Mater.
Int., vol. 19, pp. 617-622, May 2013.
[11] Q. Zhang, C. S. Dandeneau, X. Zhou, and G. Cao,
―ZnO nanostructures for dye-sensitized solar cells,‖
Adv. Mater., vol. 21, pp. 4087-4108, July 2009.
[12] F. Xu and L. Sun, ―Solution-derived ZnO
nanostructures for photoanodes of dye-sensitized solar
cells,‖ Energy Environ. Sci., vol. 4, pp. 818-841,
December 2010.
[13] Quintana M, Edvinsson T, Hagfeldt A and Boschloo G
2007 Comparison of dye-sensitized ZnO and TiO2 solar
cells: studies of charge transport and carrier lifetime J.
Phys. Chem. C 111 1035-41
[14] Martinson A B F, Goes M S, Fabregat-Santiago F,
Bisquert J, Pellin M J and Hupp J T 2009 Electron
transport in dye-sensitized solar cells based on ZnO
nanotubes: evidence for highly efficient charge
collection and exceptionally rapid dynamics J. Phys.
Chem. A 113 4015-21
[15] A.Alessandra, L.A.Naomi, M.J.Attila, D.Lynn,
W.Pawel, O.L.David, S.Kenji,M.Shogo,
S.Leone;Energy Environ.Sci., 2, 1069.1073 (2009).
[16] Sabarinath, S. , Subaganesh Rajni, K.S. and
Ramachandran,T. 2014 .Fabrication and optimization of
parameters for dye sensitized solar cell. IJRET, 3(1), pp.
2319- 2321.
[17] Y. Kim, H. Kang , Y. Jang, S. Lee, S. Lee, K. Jung, J.
Lee, and M. Kim, Int. J. Mol. Sci. 9 (2008) 2745-2756.
the composite films were annealed at 450◦C for 0.5 h.
[18] J. Gong, J. Liang, K. Sumathy, Review on dye-
sensitized solar cells (DSSCs): Fundamental concept s
and novel materials, Renewable and Sustainable Energy
Reviews.16, 5848 –5860, (2012).
[19] M. M. Hasan, A. S. M. A. Haseeb, R. Saidur, and H. H.
Masjuki, Effects of annealing treatment on optical
properties of Anatase TiO2 thin films, International
Journal of Chemical and Biological Engineering, vol. 1,
2, (2008).
[20] AbdulKareem A.Al-Khafaji1, Dheyaa B.Alwan2, Falah
H.Ali3, Wesam A.A.Twej , Influence of grain size,
electrode type and additives on dye sensitized , ESAIJ,
12(6), 2016 [217-223].
[21] K. Tennakone, G. R. R. A. Kumara, A. R.
Kumarasinghe, P. M. Sirimanne and K. G. U.
Wijayantha, “Efficient Pho- to sensitization of
Nanocrystalline TiO2 Films by Tannins and Related
Phenolic Substances,” Journal of Photo- chemistry &
Photobiology A: Chemistry, Vol. 94, No. 2-3, 1996, pp.
217-220
Paper ID: ART20176256 DOI: 10.21275/ART20176256 1615