hydraulic performance of polymer modified bentonite
TRANSCRIPT

University of South FloridaScholar Commons
Graduate Theses and Dissertations Graduate School
7-6-2004
Hydraulic Performance of Polymer ModifiedBentoniteJessica A. SchenningUniversity of South Florida
Follow this and additional works at: https://scholarcommons.usf.edu/etdPart of the American Studies Commons
This Thesis is brought to you for free and open access by the Graduate School at Scholar Commons. It has been accepted for inclusion in GraduateTheses and Dissertations by an authorized administrator of Scholar Commons. For more information, please contact [email protected].
Scholar Commons CitationSchenning, Jessica A., "Hydraulic Performance of Polymer Modified Bentonite" (2004). Graduate Theses and Dissertations.https://scholarcommons.usf.edu/etd/1238

Hydraulic Performance of Polymer Modified Bentonite
by
Jessica A. Schenning
A thesis submitted in partial fulfillment of the requirements for the degree of
Master of Science in Civil Engineering Department of Civil and Environmental Engineering
College of Engineering University of South Florida
Major Professor: Alaa Ashmawy, Ph.D.
Manjriker Gunaratne, Ph.D. Rajan Sen, Ph.D.
Date of Approval: July 6, 2004
Keywords: Engineered Clay, Permeability, Swell Index, Liners, Barriers
© Copyright 2004, Jessica A. Schenning

DEDICATION
I would like to dedicate this thesis to my husband, without whose support I would not
have been able to continue my education to this degree. I would also like to express
thanks to my family for their encouragement throughout my education.

ACKNOWLEDGMENTS
I would like to express my sincere appreciation to my major professor,
Dr. Alaa Ashmawy, for his inspiration, guidance and support throughout this study. I
also would like to thank Dr. Manjriker Gunaratne and Dr. Rajan Sen for their service as
committee members. For their assistance in the lab, I wish to extend a special thanks to
Jeremy Runkle and Whitney Allen.
This research was supported by the National Science Foundation and the
Department of Civil and Environmental Engineering at the University of South Florida. I
would also like to recognize Jane Davis of Emerging Technologies for her advice and the
donation of materials.

TABLE OF CONTENTS
LIST OF TABLES iv LIST OF FIGURES v ABSTRACT xi CHAPTER 1 INTRODUCTION 1 1.1 Background 1 1.2 Research Scope and Objective 2 1.3 Organization of Thesis 3 CHAPTER 2 MATERIALS 4 2.1 Bentonite 4 2.1.1 Clay Mineralogy 5
2.1.1.1 Swelling and Adsorption 7 2.1.1.2 Cation Exchange Capacity 9
2.1.1.3 Diffuse Double Layer 13 2.1.2 Experimental Materials 19 2.2 Polymers 21 2.2.1 Chemical Composition 21
2.2.2 Clay-Polymer Interaction 23 2.2.2.1 Cationic Interaction 24 2.2.2.2 Anionic Interaction 25 2.2.2.3 Nonionic Interaction 26
2.2.3 Experimental Materials 27 2.2.3.1 Polymer Titration 30
2.2.3.2 Theoretical Charge Density 32 CHAPTER 3 EXPERIMENTAL BACKGROUND AND LITERATURE REVIEW 34
3.1 Clay Fabric 34 3.2 Permeability Theory 35
3.3 Geosynthetic Clay Liners 37 3.3.1 Valence 38 3.3.2 Concentration 40 3.3.3 Pre-Hydration 40 3.3.4 Void Ratio 41
i

3.3.5 Testing Procedures 42 3.4 Modified Clays 42 3.4.1 Organobentonites 43 3.4.2 Polymer Treatment 44
CHAPTER 4 EQUIPMENT AND EXPERIMENTAL METHODS 46 4.1 Testing Program 46
4.2 Sample Preparation 47 4.2.1 Mixing Procedure 47 4.2.2 Grinding Technique 48 4.3 Equipment 50 4.4 Permeability Measurement 52
4.4.1 Sample Preparation 52 4.4.2 Consolidation Technique 52
CHAPTER 5 TESTS AND RESULTS 56 5.1 Swell Index 56 5.2 Liquid Limit 61 5.3 Specific Gravity 63 5.4 Permeability Tests 65 5.4.1 Permeant Solutions 65 5.4.2 Test Measurements 66 5.4.3 Permeant 67 5.4.4 First Wetting Solution 71 5.4.5 Void Ratio 73 5.4.6 Polymer Charge 75 5.4.7 Gradient 77 5.4.8 Electrical Conductivity and pH 79 CHAPTER 6 DISCUSSION AND ANALYSIS 81 6.1 Mixing Ratio 81
6.2 Effect of Sample Preparation 82 6.3 Swell Index 83 6.4 Effect of Permeant 83
6.5 Effect of Pre-hydration 84 6.6 Effect of Void Ratio 85 6.7 Effect of the Mechanism of Interaction 85
6.7.1 Effect of Cationic Interactions 86 6.7.2 Effect of Nonionic Interactions 88 6.7.3 Effect of Anionic Interactions 89
CHAPTER 7 CONCLUSIONS AND RECOMMENDATIONS 91 7.1 Summary 91 7.2 Conclusions 91
ii

7.3 Recommendations for Future Work 92 REFERENCES 94 APPENDICES 97 Appendix A: Permeability Test Results 98 Appendix B: Swell Index Test Results 123 Appendix C: Liquid Limit Test Results 126
iii

LIST OF TABLES
Table 2.1 Hydrated Radii of Cations 18 Table 2.2 Polymer Material Data 28 Table 2.3 EC and pH of Experimental Polymers 29 Table 2.4 Standard Titration Solutions 30 Table 2.5 Experimental Charge Densities of Polymers 32 Table 5.1 Experimental Values of Liquid Limits 62 Table 5.2 Measured Specific Gravity 64 Table 5.3 Pre-hydrated vs. Non-Pre-hydrated 72 Table 5.4 Effect of Void Ratio With Deionized Water Permeant 74 Table 5.5 Effect of Polymer and Permeant on Hydraulic Conductivity 77 Table 5.6 Electrical Conductivity and pH of Permeants 79 Table 6.1 Polymer Mix at %CEC of Clay 81 Table A.1 Laboratory Permeability Tests 98
iv

LIST OF FIGURES Figure 2.1 Mineral Layers (a) Silicon Tetrahedral (b) Octahedral 5 Figure 2.2 Montmorillonite (a) Layered Structure (b) Mineral Stacking 6 Figure 2.3 Clay-Water Interactions (a) Hydrogen Bonding (b) Ion Hydration (c) Dipole Attraction 8 Figure 2.4 Cation Association 9 Figure 2.5 Methylene Blue (a) Molecule (b) Clay Surface Adsorption 10 Figure 2.6 Experimental Values of CEC of Na-Bentonite 12 Figure 2.7 Ion Distribution in Diffuse Double Layer 14 Figure 2.8 Ion Distribution in Interacting Double Layers 16 Figure 2.9 Electric Potential Distributions 17 Figure 2.10 Stern Layer and the Potential Distribution 19 Figure 2.11 Experimental Liquid Limit of Na-Bentonite 20 Figure 2.12 Experimental Swell Index of Na-Bentonite 20 Figure 2.13 Polyacrylate 21 Figure 2.14 Polyacrylamide 22 Figure 2.15 Poly(acrylic acid) 22 Figure 2.16 Adsorption of Uncharged Polymer on Clay 24 Figure 2.17 Clay Interaction 24 Figure 2.18 Interaction Between Anionic Polymers and Clays 26
v
Figure 2.19 Polymer Granules 27 Figure 2.20 EC and pH Measurement Devices 29 Figure 2.21 Titration Setup (a) Cationic (b) Anionic 31 Figure 3.1 Clay Fabric (a) Dispersed (b) Collapsed (c) Aggregated 35 Figure 3.2 Mechanism of Flow (a) Hydraulic (b) Chemical 36 Figure 3.3 Effect of Valence 39 Figure 3.4 Effect of Void Ratio 41 Figure 4.1 Clay Polymer Interaction (a) Not Heated (b) Heated 48 Figure 4.2 Clay Sample After Drying 49 Figure 4.3 Mechanical Crushing (a) Ball Mill (b) Grinder 49 Figure 4.4 Modified Clay in Powder Form 50 Figure 4.5 Permeability Cell 51 Figure 4.6 Consolidation of Sample in Permeameter 53 Figure 4.5 Laboratory Pressure Panel Setup 54 Figure 5.1 Hydrated Swell Volume 57 Figure 5.2 Swell Index in Deionized Water 58 Figure 5.3 Effect of Charge Density on Swell Index 59 Figure 5.4 Effect of Polymer on Swell Volume 60 Figure 5.5 Experimental Values of Liquid Limits 62 Figure 5.6 Heated vs. Non-Heated Clays 63 Figure 5.7 Permeability Measurement Values 66 Figure 5.8 Effect of Valence on High Cationic Modified Clay 68
vi

Figure 5.9 Effect of Valence on Low Cationic Modified Clay 68 Figure 5.10 Effect of Valence on Nonionic Modified Clay 69 Figure 5.11 Effect of Valence on Low Anionic Modified Clay 70 Figure 5.12 Effect of Valence on Medium Anionic Modified Clay 70 Figure 5.13 Effect of Pre-hydration Condition 71 Figure 5.14 Pre-hydrated vs. Non-Pre-hydrated 72 Figure 5.15 Effect of Void Ratio on Modified Clay Permeated with DI Water 73 Figure 5.16 Effect of Void Ratio on High Cationic Clay Permeated with CaCl2 74 Figure 5.17 Effect of Void Ratio on Nonionic Clay Permeated with CaCl2 75 Figure 5.18 Effect of Polymer Clay Permeated with H2O 76 Figure 5.19 Effect of Polymer When Permeated With CaCl2 76 Figure 5.20 Effect of Polymer 77 Figure 5.21 Effect of Gradient 78 Figure 5.22 EC and pH of Effluent of Nonionic Clay Permeated with CaCl2 80 Figure 5.23 EC and pH of High Cationic Permeated With MgCl2 80 Figure 6.1 Effect of Valence on Modified Clay 84 Figure 6.2 Effect of Void Ratio 85 Figure 6.3 Cationic Polymer Interaction 86 Figure 6.4 Nonionic Polymer Interaction 88 Figure 6.5 Anionic Polymer Interaction 89 Figure A.1 Coefficient of Permeability vs. Duration – 1-Ch 99 Figure A.2 Coefficient of Permeability vs. Pore Volume – 1-Ch 99 Figure A.3 Coefficient of Permeability vs. Duration – 2-Ch 100
vii

Figure A.4 Coefficient of Permeability vs. Pore Volume – 2-Ch 100 Figure A.5 Coefficient of Permeability vs. Duration – 3-Ch 101 Figure A.6 Coefficient of Permeability vs. Pore Volume – 3-Ch 101 Figure A.7 Coefficient of Permeability vs. Duration – 4-Ch 102 Figure A.8 Coefficient of Permeability vs. Pore Volume – 4-Ch 102 Figure A.9 Coefficient of Permeability vs. Duration – 5-Ch 103 Figure A.10 Coefficient of Permeability vs. Pore Volume – 5-Ch 103 Figure A.11 Coefficient of Permeability vs. Duration – 6-Ch 104 Figure A.12 Coefficient of Permeability vs. Pore Volume – 6-Ch 104 Figure A.13 Coefficient of Permeability vs. Duration – 1-Cl 105 Figure A.14 Coefficient of Permeability vs. Pore Volume – 1-Cl 105 Figure A.15 Coefficient of Permeability vs. Duration – 2-Cl 106 Figure A.16 Coefficient of Permeability vs. Pore Volume – 2-Cl 106 Figure A.17 Coefficient of Permeability vs. Duration – 3-Cl 107 Figure A.18 Coefficient of Permeability vs. Pore Volume – 3-Cl 107 Figure A.19 Coefficient of Permeability vs. Duration – 1-N 108 Figure A.20 Coefficient of Permeability vs. Pore Volume – 1-N 108 Figure A.21 Coefficient of Permeability vs. Duration – 2-N 109 Figure A.22 Coefficient of Permeability vs. Pore Volume – 2-N 109 Figure A.23 Coefficient of Permeability vs. Duration – 3-N 110 Figure A.24 Coefficient of Permeability vs. Pore Volume – 3-N 110 Figure A.25 Coefficient of Permeability vs. Duration – 4-N 111
viii

Figure A.26 Coefficient of Permeability vs. Pore Volume – 4-N 111 Figure A.27 Coefficient of Permeability vs. Duration – 1-Al 112 Figure A.28 Coefficient of Permeability vs. Pore Volume – 1-Al 112 Figure A.29 Coefficient of Permeability vs. Duration – 2-Al 113 Figure A.30 Coefficient of Permeability vs. Pore Volume – 2-Al 113 Figure A.31 Coefficient of Permeability vs. Duration – 3-Al 114 Figure A.32 Coefficient of Permeability vs. Pore Volume – 3-Al 114 Figure A.33 Coefficient of Permeability vs. Duration – 1-Am 115 Figure A.34 Coefficient of Permeability vs. Pore Volume – 1-Am 115 Figure A.35 Coefficient of Permeability vs. Duration – 2-Am 116 Figure A.36 Coefficient of Permeability vs. Pore Volume – 2-Am 116 Figure A.37 Coefficient of Permeability vs. Duration – 3-Am 117 Figure A.38 Coefficient of Permeability vs. Pore Volume – 3-Am 117 Figure A.39 Coefficient of Permeability vs. Duration – 4-Am 118 Figure A.40 Coefficient of Permeability vs. Pore Volume – 4-Am 118 Figure A.41 Coefficient of Permeability vs. Duration – 5-Am 119 Figure A.42 Coefficient of Permeability vs. Pore Volume – 5-Am 119 Figure A.43 Coefficient of Permeability vs. Duration – 1-B 120 Figure A.44 Coefficient of Permeability vs. Pore Volume – 1-B 120 Figure A.45 Coefficient of Permeability vs. Duration – 2-B 121 Figure A.46 Coefficient of Permeability vs. Pore Volume – 2-B 121 Figure A.47 Coefficient of Permeability vs. Duration – 3-B 122 Figure A.48 Coefficient of Permeability vs. Pore Volume – 3-B 122
ix

Figure B.1 Swell Index of High Cationic Modified Clay 123 Figure B.2 Swell Index of Low Cationic Modified Clay 123 Figure B.3 Swell Index of Nonionic Modified Clay 124 Figure B.4 Swell Index of Low Anionic Modified Clay 124 Figure B.5 Swell Index of Medium Anionic Modified Clay 125 Figure B.6 Swell Index of Unmodified Bentonite Clay 125 Figure C.1 Liquid Limit – Not Heated High Cationic 126 Figure C.2 Liquid Limit – Not Heated Low Cationic 126 Figure C.3 Liquid Limit – Not Heated Nonionic 126 Figure C.4 Liquid Limit – Not Heated Low Anionic 127 Figure C.5 Liquid Limit – Not Heated Medium Anionic 127 Figure C.6 Liquid Limit – Heated High Cationic 127 Figure C.7 Liquid Limit – Heated Low Cationic 128 Figure C.8 Liquid Limit – Heated Nonionic 128 Figure C.9 Liquid Limit – Heated Low Anionic 128 Figure C.10 Liquid Limit – Heated Medium Anionic 129 Figure C.11 Liquid Limit – Heated and Not Heated Bentonite 129
x
HYDRAULIC PERFORMANCE OF POLYMER MODIFIED BENTONITE
Jessica A. Schenning
ABSTRACT
Bentonite clay is widely used in barrier systems due to its low hydraulic conductivity and
it high swell capacity. Exposure to inorganic solutions can cause significant increases in
hydraulic conductivity, due to changes in the surface chemistry and fabric. This
phenomenon can be attributed to a reduction in the thickness of the double layer, due to
the cation exchange capacity of the clay. The clay can be modified with polymers to
render it less susceptible to chemical attack. The treatment process allows the clay to be
engineered to enhance specific properties, such as permeability and sorption. In the
present study, engineered soils are prepared by sorbing organic polymers to the surface of
Na-bentonite. Three classes, cationic, anionic and nonionic polymers are investigated.
The sorbents are water-soluble compounds based on the polymerization of acrylamides
(PAM). Mixing and sample preparation techniques are developed and discussed. The
interaction of the polymeric compounds and the clay mineral surface are evaluated by
testing the liquid limit, swell index and specific gravity of the soils. Permeability tests
are performed to determine if the polymer treatment enhances the hydraulic performance
of the clay when permeated with highly concentrated salt solutions. The effect of
xi

permeant, void ratio, initial wetting condition and preparation techniques are found to
have a significant affect on the hydraulic conductivity.
xii

CHAPTER 1
INTRODUCTION
1.1 Background
Disposal of solid wastes in landfill facilities has, in some cases lead to
contamination of the groundwater, by failing to retain leachates. Environmental
and health awareness has lead to rigorous regulation of the municipal solid waste
landfills, and therefore a focus to design more secure landfills by improving the
lining and covering systems. Currently, the most effective hydraulic barriers are
composite systems, which include combination geomembrane/clay lining systems
and geosynthetic clay liner. Bentonite clay is widely used in these composites for
waste containment due to its low hydraulic conductivity, high swelling potential
and high cation exchange capacity.
When exposed to high concentrations of inorganic pollutants, degradation of
the bentonite clay can occur and a subsequent increase in the hydraulic
conductivity. This phenomenon is attributed to the changes that occur in the
diffuse double layer of the bentonite, due to its cation exchange capacity.
Particularly, when the replacement of sodium ions is with higher valence ions,
such as calcium occurs. The development of alternative methods for better
containment is centered on engineered clays with improved hydraulic and sorptive
characteristics. Organic compounds and polymers can be used to modify
bentonite clay for this purpose. Researchers have indicated the suitability of
organically modified clays for landfill lining (Lo et al., 1997). Various
1
manufacturers have proposed polymer treatment of the clay as a means of
resisting contamination, but the performance of such materials in the long term
and in aggressive environments has not been fully evaluated (Ashmawy et al.,
2002).
1.2 Research Scope and Objective
This study aims to evaluate polymer modified bentonite clay for use as
alternative liners. The research project addresses technical issues related to the
hydraulic, mechanical, and chemical compatibility of polymer-modified clays in
landfill lining applications. The main objectives of this study are:
1.
2.
3.
To establish preparation techniques for the polymer modified
clays.
To evaluate the mechanical and hydraulic properties with
respect to their chemical stability.
To relate the effect of the polymer to the clay mineralogy and
evaluate their chemical interaction.
This research evaluates the hydraulic performance of clays modified with anionic,
nonionic and cationic polymers under prolonged exposure to inorganic leachates.
Laboratory permeability tests were performed on the each of the modified clays under
various conditions to assess hydraulic conductivity. The permeants used in this study
were NaCl, CaCl2 and MgCl2. The affect of the ionic charge and charge density of the
polymer, void ratio, permeant solution and wetting conditions on the permeability are
examined. Additional laboratory tests were conducted to better characterize the other
engineering properties of the modified clay.
2
1.3 Organization of Thesis
Chapter 2 discusses the materials used for this study. Bentonite clay mineralogy,
information concerning the diffuse double layer and its interactions, adsorption and
cation exchange mechanisms are discussed. Experimental characterization of the
bentonite used in this investigation includes specific gravity, liquid limit, swell index and
cation exchange capacity. Background material related to polymers, such as chemical
compositions and effect of charge with respect to clay interactions are presented.
Chapter 3 reviews past literature and introduces topics related to this thesis, such as
the factors affecting hydraulic performance of pure bentonite and sorption and hydraulic
characteristics of modified clays. The previous findings have been used as guidelines for
the experimental methods carried out in this research.
The equipment and experimental methods are outlined in Chapter 4. The procedures
developed for sample preparation and test set-up are described in detail. Chapter 5
presents the experimental data. This includes specific gravity, liquid limit, swell index,
and permeability measurements for the modified clays. Chapter 6 includes analysis of
the experimental data. Discussion of the effect of clay-polymer interactions on the
mechanical properties of the soil, as well as the rationalization of experimental variables
is presented. Chapter 7 summarizes experimental findings and concludes with
suggestions for future work.
3

CHAPTER 2
MATERIALS
2.1 Bentonite
Montmorillonite is a clay mineral within the smectite group. It forms by
weathering or hydrothermal alteration of other aluminum-rich minerals and is particularly
common in altered volcanic ashes called bentonite. Bentonite clay occurs at several
stratigraphic horizons within the Ordovician Platteville and Decorah Formations, which
are widely exposed in Wyoming, Wisconsin, North Dakota, South Dakota and Utah.
This bentonite was formed mostly in the Cretaceous to Miocene age, but are known to be
as old as Jurassic and as recent as Pleistocene.
To be economically mineable, bentonite deposits must be close to the surface. The
material overlying the bentonite must first be removed using a bulldozer or excavator.
The surface of the bentonite bed must be carefully scraped to remove impurities.
Depending on the thickness and grade variation, the bentonite may be scraped off one
layer at a time or excavated with bucket loaders. The bentonite is processed by drying,
grinding and bagging.
Bentonite, termed “the clay of a 1000 uses” is used commercially in everything
from cosmetics and pharmaceuticals, to hazardous waste treatment. In construction,
bentonite plays a large role in drilling operations and many environmental retention
applications. The unique engineering properties of bentonite are directly related to the
clay mineralogical structure.
4

2.1.1 Clay Mineralogy
Clay minerals are a part of the phyllosilicate mineral family, but due to
differences in layering, crystal formation and substitutions, they can range widely in
properties. Bentonite is a naturally occurring hydrated aluminum silicate. Although
sodium bentonite has its name because the majority of the exchangeable cations adsorbed
are sodium, it is important to note that other cations such as calcium and magnesium are
present in lesser quantities.
The basic building blocks of the clay mineral are tetrahedral and octahedral
structures. The silicon tetrahedron, (Si4O10)4- are organized such that the base oxygens
are shared to form a sheet structure, shown in Figure 2.1. The thickness of the silicon
sheet in a clay mineral structure is 4.63 Å.
(b)
(a)
Aluminums, Magnesiums, etc. Hydroxyls
SiliconesOxygens
Figure 2.1 Mineral Layers (a) Silicon Tetrahedron (b) Octahedron
(After Mitchell, 1993)
The octahedral sheet is made up of aluminum or magnesium coordinated with
oxygens or hydroxyls. Depending on the valence of the cations present in sheets, different
minerals are formed. Dioctahedral structures are formed when the coordinated cation is
5

trivalent, such as aluminum. Gibbsite has the composition of Al2(OH)6 and is found in
bentonite. Similarly, trioctahedral structures are formed when divalent cations are present.
Brucite, Mg3(OH)6 has magnesium as the coordinated cation. The thickness of the
octahedral sheet in a clay mineral structure is 5.05 Å.
Smectite has a 2:1 basic mineral structure, meaning that there are two tetrahedral
silica sheets layered with one octahedral aluminum sheet. The total basal spacing of the
layered structure is 9.6 to 21 Å. Montmorillonite is dioctahedral, with a composition of
(OH)4Si8Al4O20·H2O, prior to any substitutions being made, shown in Figure 2.2.
However, approximately every sixth aluminum ion is replaced with a magnesium cation
through isomorphous substitution. Since Al3+ is replaced by Mg2+ the result is a net
negative charge in the mineral structure.
9.6 Å to ∞
H2O + Cations in interlayer spacing
(a) (b)
Figure 2.2 Montmorillonite (a) Layered Structure (b) Mineral Stacking (After Mitchell, 1993)
Surrounding these structures are loosely held hydrated cations, which are attracted
by the net negative charge of the particle. The negative charge comes from isomorphous
substitution of Al3+ for Si4+ in the silica sheet or a divalent ion for the Al3+ in the tetrahedral
sheet. However, broken bonds near the particle edge can also account for some of the
negative charge.
6

A particle of bentonite has a plate-like shape with a very high aspect ratio, about
1:100. One particle is approximately 100 nm in width and 4 to 5 nm in height. The large
length of the particle is typically no more than 1 to 2 µm. This high aspect ratio yields a
very large specific surface, 800 m2/gram, including the interlayers. The specific surface in
combination with the net charge and weak bonds gives bentonite its high potential to swell
and readily exchange cations.
There are five possible types of interlayer bonding possible in layer silicates
(Marshall, 1964, Mitchell, 1993). Parallel layers that are neutral are bound by weak van der
Waals forces. When there are opposing layers oxygens and hydroxyls, or hydroxyls and
hydroxyls, such as in gibbsite, hydrogen bonding can occur and remain stable in the
presence of water. Neutral silicate layers are held by hydrogen bonds that are weakened
and separated in the presence of water molecules. The cations that are present to balance
negative charge help to bond the layers together. These bonds are weak and easily
separated when water and other polar fluids are adsorbed on the surface.
2.1.1.1 Swelling and Adsorption
Water is adsorbed on or associated with the particle surface through hydrogen
bonds, ion hydration, attraction by osmosis and dipole attraction, as shown in Figure 2.3.
Water penetrates the intercrystalline structure causing the silicate layers to separate; this
phenomenon is called interlayer swelling. Several layers of water dipoles can form into
stacked, tetrahedral structures, causing the separation. Water is adsorbed on to the
particle surface by hydrogen bonds. Interlayer cations become hydrated with large
energy of hydration; enough to overcome the weak van der Waals attraction between
layers (van Olphen, 1977). Clays also swell due to forces of repulsion between adjacent
particles. This repulsive energy is the difference in osmotic pressure between the
midpoint of two plates and the solution. Electrolyte concentration, cation valance,
dielectric constant and pH of a solution affect the repulsive forces. During this expansion
7

the basal spacing increases from approximately 9.6 Å, when dried at 100°C to 12.5 to 21
Å, when wet due to the presence of water in the interlayer.
Water dipoles have a charge distribution that allows ion hydration. Cations attract
the negative side of the water molecule, while anions attract the positive side. If the
energy of hydration is less than that of normal water, the water molecule becomes a
hydration shell for the ion. Even when not hydrated, ions cause the water molecules to
have a certain arrangement and orientation. Due to the high concentration of ions, the
water dipole is strongly attracted to the mineral surface, through diffusion by osmosis.
This can cause an arrangement of the dipoles, which leads to a disorientation at the
midplane region when two particles are close. To balance these charges cations are
present midway between the particles.
(a) (b) (c)
Figure 2.3 Clay-Water Interactions (a) Hydrogen Bonding (b) Ion Hydration (c) Dipole Attraction (After Mitchell, 1993)
There are three mechanisms of association for ions (van Olphen, 1977). Inner
sphere cations are not hydrated and are held tightly through ion fixation involving ionic
or covalent bonding. Outer sphere cations are hydrated ions that are adsorbed on the
particle surface. In the diffuse ion swarm, hydrated ions associate through electrostatic
attraction with particle, but do not bind to the surface. The ions located in the outer
sphere complex and the diffuse ion swarm are relatively loosely held by the particle and
8

can be easily leached, and therefore are considered to be readily exchangeable. These
mechanisms of association are shown in Figure 2.4.
Figure 2.4 Cation Association (After van Olphen, 1977)
2.1.1.2 Cation Exchange Capacity
In solution, the cations adsorbed on the surface can be replaced by other cations.
The cations that are associated with the clay surface through electrostatic attraction,
which are the outer sphere complexes and the diffuse ions are considered readily
exchangeable (Sposito, 1989). The replacing power is the ability of a cation to replace
another and is primarily a function of the valence and ion size. Typically, the higher
valence replaces lower valence cations and ions with smaller ionic radii are less
replaceable than larger ions. The trend of replaceability is as follows:
Na+ < K+ < Mg2+ < Ca2+
However, in highly concentrated solutions of a cation with low replacing power, it
is possible for the lower to replace a higher-powered cation through mass action.
The cation exchange capacity of clay is caused by the unbalanced negative charge
resulting from isomorphous substitution, broken bonds along the particle edges and
replacement. Since most of the negative charge is caused by the isomorphous
9

substitution of a lesser valance cation, the exchange capacity is a measurement of the
degree of this substitution. The cation exchange capacity is the quantity of positively
charged ions that a clay mineral can accommodate on its negative charged surface. The
cation exchange capacity, CEC is typically expressed as milliequivalents per 100 grams
(mEq/100 g) and can be determined experimentally using the methylene blue test. The
constant surface charge density is used to characterize clay particles and can be found by
dividing the CEC by the specific surface.
The methylene blue test yields a methylene blue capacity, which gives an estimate
of the total cation exchange capacity, as well as approximation of the specific surface of a
clay sample. The test works by replacing the natural exchangeable cations of the clay
with methylene blue compounds. Taylor (1985) presented the following reaction for the
irreversible process:
Na Bentonite + Methylene Blue Hydrochloride → MB Clay + Na Chloride
Methylene blue is an organic base in combination with an acid and has a chemical
composition C16H18N3SCl. The particle, shown in Figure 2.5 has dimensions of
approximately 17Å x 7.6Å x 3.25Å. After the exchange, the methylene blue particles are
adsorbed to the entire external surface of the clay particle, which allows for an
approximation of the specific surface. After all the natural ions of the clay are replaced,
saturation is achieved. This is the end point and noted by the formation of a blue "halo"
around a drop of solids placed on filter paper.
(a) (b)
Figure 2.5 Methylene Blue (a) Molecule (b) Clay Surface Adsorption (After Taylor, 1985 and Santamarina et al.,2002)
10
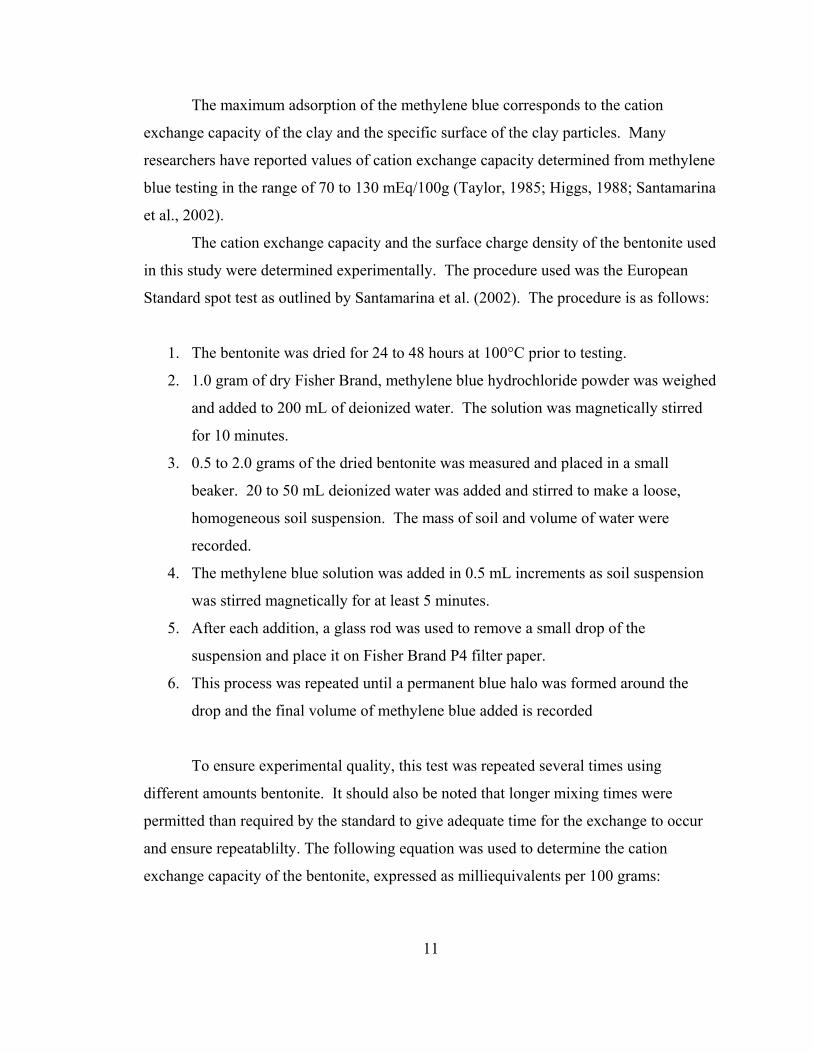
The maximum adsorption of the methylene blue corresponds to the cation
exchange capacity of the clay and the specific surface of the clay particles. Many
researchers have reported values of cation exchange capacity determined from methylene
blue testing in the range of 70 to 130 mEq/100g (Taylor, 1985; Higgs, 1988; Santamarina
et al., 2002).
The cation exchange capacity and the surface charge density of the bentonite used
in this study were determined experimentally. The procedure used was the European
Standard spot test as outlined by Santamarina et al. (2002). The procedure is as follows:
1. The bentonite was dried for 24 to 48 hours at 100°C prior to testing.
2. 1.0 gram of dry Fisher Brand, methylene blue hydrochloride powder was weighed
and added to 200 mL of deionized water. The solution was magnetically stirred
for 10 minutes.
3. 0.5 to 2.0 grams of the dried bentonite was measured and placed in a small
beaker. 20 to 50 mL deionized water was added and stirred to make a loose,
homogeneous soil suspension. The mass of soil and volume of water were
recorded.
4. The methylene blue solution was added in 0.5 mL increments as soil suspension
was stirred magnetically for at least 5 minutes.
5. After each addition, a glass rod was used to remove a small drop of the
suspension and place it on Fisher Brand P4 filter paper.
6. This process was repeated until a permanent blue halo was formed around the
drop and the final volume of methylene blue added is recorded
To ensure experimental quality, this test was repeated several times using
different amounts bentonite. It should also be noted that longer mixing times were
permitted than required by the standard to give adequate time for the exchange to occur
and ensure repeatablilty. The following equation was used to determine the cation
exchange capacity of the bentonite, expressed as milliequivalents per 100 grams:
11

g) (mEq/100 (g)wt dry(cc) solutionMBof
(g)wt dryMB x (cc) added
Clayg100x
.Vol1000x
87.319MB.C.E.C =
Figure 2.6 shows the range of experimentally determined values for the cation
exchange capacity. The average value for the cation exchange capacity of the bentonite
used in this study was determined to be 85.54 mEq/100g, but all values fell in the range
of 80 to 90 mEq/100g.
75 80 85 90
CEC (mE/100g)
0.5 g1.0 g1.5 g2.0 g
Figure 2.6 Experimental Values of CEC of Na-Bentonite
The experimental specific surface of the clay was also calculated using the
following equation:
( ))g(wtdryClay
1AAN5.0(mL)solution MB of .Vol
(g)dry wt MB87.319
1S MBvs =
where N is the number of 0.5 mL increments added, Av is Avagadro’s number (6.02 x
1023/mole) and AMB is the area covered by one molecule of methylene blue (assumed to
be 130 Å2.) The average specific surface of this bentonite was found to be 677.62
m2/gram. This value is with in the expected range for montmorillonite, which is 400 to
800 m2/gram (Mitchell, 1993). Santamarina et al. (2002) reported 700 m2/gram for Na-
montmorillonite with methylene blue determination.
12

The charge density of the clay can be determined knowing the cation exchange
and the specific surface. The charge density is given by the following expression:
⋅Γ=σ 2m
CF
where F is a Faraday, or 96,500 Coulombs and Γ is given by the following expression:
=Γ 2m
meqSS
CEC
Using the experimental values determined for the cation exchange capacity and
the specific surface the charge density of the bentonite is determined to be approximately
0.1218 C/m2. The values of the cation exchange, specific surface and charge density are
important to the clay’s interaction with polymers.
2.1.1.3 Diffuse Double Layer
Cations neutralize the negative charge of the clay surface. Additional salt
precipitates are associated with the surface of the clay. When the clay is wet, the salt
precipitates go into solution. There is a high salt content at the mineral surface due to
adsorbed cations. The escaping tendency due to diffusion and the opposing electrostatic
attraction leads to ion distributions adjacent to a clay particle in suspension as shown in
the Figure 2.7 (Mitchell, 1993).
13

Figure 2.7 Ion Distribution in Diffuse Double Layer (After Mitchell, 1993)
This area adjacent to the particle surface is called the diffuse double layer or
adsorbed layer. The Gouy-Chapman Theory describes the behavior of this region. The
assumptions made by the theory are, first that there is no interaction between the ions,
which are considered to be point charges. Next, the charge on the particle surface is
considered to have a uniform distribution. Finally, the permittivty of the molecules does
not depend on their location. This theory is for the one-dimensional conditions only and
the particle surface must be large with respect to the thickness of the diffuse layer.
The ion distribution in the charged surface region is determined by the
temperature and the energy required to bring the ion from an infinite distance away to the
point where the electrostatic potential is to be considered. This distribution is given by a
Boltzmann equation:
−
=kT
EEexpnn i0i0ii
ni is the number of ions of type i per unit volume of bulk solution, E is the potential
energy, T is the temperature in Kelvin and k is the Boltzmann constant. This relationship
is combined with the Poison equation, which relates potential, charge and distance, gives
14

one expression for potential and ion concentration, as a function of distance from the
surface in the diffuse layer. The Poison-Boltzmann equation is relevant for the case of a
single cation and single anion with equal valence and represented by the following
expression:
ψ−
ε−=
ψkT
evsinhven2dxd i0
2
2
The distribution of ions in the double diffuse layer is influenced by the surface
potential and the properties of the pore fluid. The slope of the potential function of the
clay surface is given by:
2zsinh)kTn8( 2
1
0ε=σ
where n0 is the concentration of ions at the surface, ε is the static permittivty, k is the
Boltzmann constant, T is the temperature in degrees Kelvin, and z is equal to the
potential at the surface. The potential function decreases exponentially at increasing
distances from the surface. This model is for a single diffuse layer that has no interaction
with the diffuse layers of other particles.
The double layers of clay particles overlap causing interaction between the two
diffuse regions. Figure 2.8 models two parallel clay plates and the charge distribution in
the interacting area. The distribution of the potential has a similar shape in this region.
The distance between the two particles is 2d. Due to this region of overlap there is the
development of a midplane potential.
15
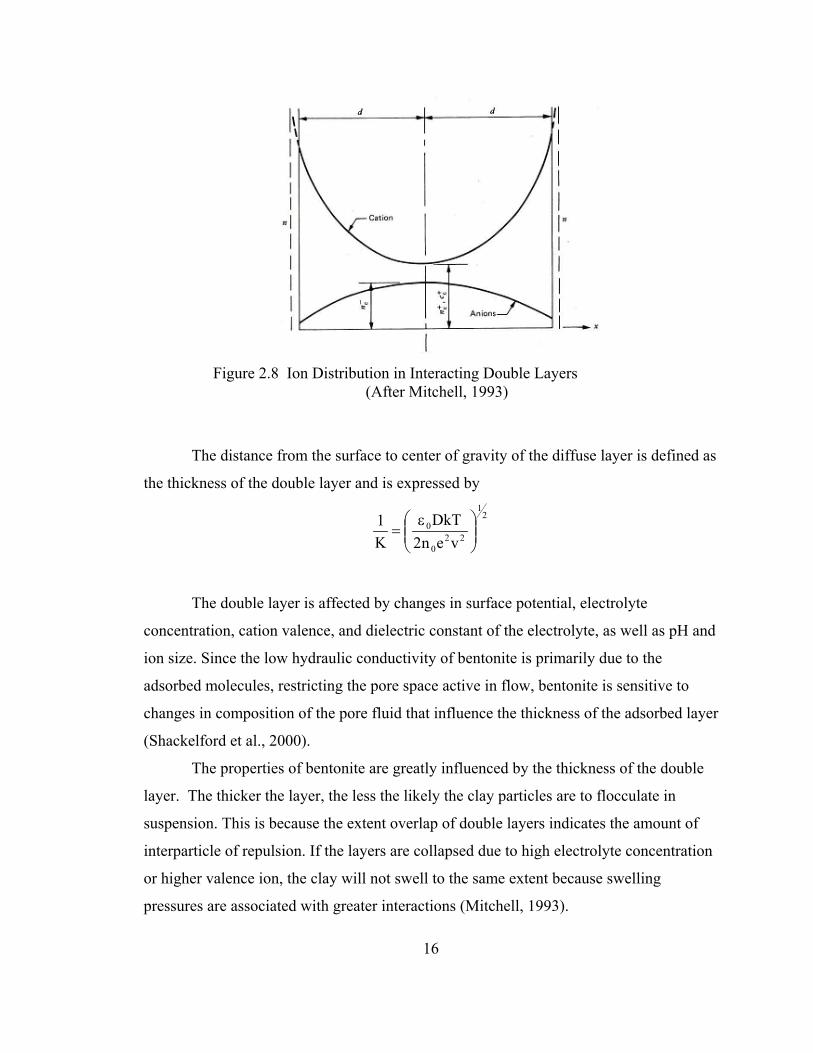
Figure 2.8 Ion Distribution in Interacting Double Layers (After Mitchell, 1993)
The distance from the surface to center of gravity of the diffuse layer is defined as
the thickness of the double layer and is expressed by
21
220
0
ven2DkT
K1
ε=
The double layer is affected by changes in surface potential, electrolyte
concentration, cation valence, and dielectric constant of the electrolyte, as well as pH and
ion size. Since the low hydraulic conductivity of bentonite is primarily due to the
adsorbed molecules, restricting the pore space active in flow, bentonite is sensitive to
changes in composition of the pore fluid that influence the thickness of the adsorbed layer
(Shackelford et al., 2000).
The properties of bentonite are greatly influenced by the thickness of the double
layer. The thicker the layer, the less the likely the clay particles are to flocculate in
suspension. This is because the extent overlap of double layers indicates the amount of
interparticle of repulsion. If the layers are collapsed due to high electrolyte concentration
or higher valence ion, the clay will not swell to the same extent because swelling
pressures are associated with greater interactions (Mitchell, 1993).
16

As the concentration of ions of the increases, the double layer thickness is
suppressed, due to the inverse relationship in the expression 1/K. Increases in electrolyte
concentration reduce the surface potential, but also greatly increase the decay of potential
with distance (Mitchell, 1993). This is demonstrated in Figure 2.9. The potential
approaches the clay surface as the concentration increases. This distribution affects the
midplane potential and reduces interparticle interactions.
Electric Potential
Distance from Colloidal Particle
Figure 2.9 Electric Potential Distributions
The contraction of high swelling clays in ionic solution is due to a compression of
the clay double layer (van Olphen, 1977). This is due to diminished particle interactions.
Cation valence has an inverse relationship to the thickness of the double layer. Due to
preferential adsorption, polyvalent cations collapse the double layer by replacing more
than one monovalent cation. Commonly divalent, Ca2+ replaces naturally occurring Na+
in bentonite suppressing the diffuse double layer.
Cations that are present in the diffuse double layer are hydrated, meaning that
they have a shell of water molecules surrounding them. Table 2.1 gives values for the
radius of the hydrated ions of interest.
17

Table 2.1 Hydrated Radii of CationsIon Hydrated Radius (Å)
K+ 3.8 – 5.3
Na+ 5.6 – 7.9
Ca2+ 9.6
Mg2+ 10.8
The Gouy-Chapman Theory was improved to better define the layer immediately
next to the particle. Stern-Gouy model does not make the assumption that the adsorbed
cations are point charges, rather assumes the size of the hydrated ion. The Stern layer is a
thin film of hydrated cations and oriented water dipoles that are immobilized by strong
interaction with the clay surface. This layer falls in between the surface and the diffuse
layer. The concentration of the hydrated cations near the surface is a function of the
electric potential of the negative charge of the clay. Similar to the Gouy-Chapman
theory, this concentration decreases at increasing distances from the particle surface. The
Debye length, λ is the distance to the center of the diffuse layer and is given by:
ηεε
=λ 220
Fv2RT
where ε is the static permittivty, T is the temperature in degrees Kelvin, F is Faraday’s
constant. The effect of the Stern layer on cation concentrations can be seen in Figure
2.10. It extends out further from the surface than predicted by the Gouy-Chapman theory
because the ion takes up space. The larger the hydrated ion, the greater the thickness of
the Stern layer.
18

Figure 2.10 Stern Layer and the Potential Distribution
(After Mitchell, 1993)
2.1.2 Experimental Materials
The clay used in this study is Extra High Yield Bentonite, which is a sodium
bentonite from Wyoming. It is premium grade bentonite powder, processed and
manufactured by Wyo-Ben, Inc. This material is designed for use as an efficient lubricant
for drilling applications. The clay is packaged in 50-lb bags and was stored in bins at
room moisture and temperature. A series of laboratory tests have been conducted to
classify the geotechnical soil properties of the bentonite used in this study. These values
will be used to evaluate the effect of the various polymers on the bentonite and the extent
of interaction. The experimental values for soil properties of the polymer-modified clays
are presented in Chapter 5.
Bentonite has a very high liquid limit due to its ability to adsorb water on the very
large specific surface of the particle and to allow water into the interlayer. The liquid
limit of the sodium bentonite has been widely published to be in the range of 330% to
600% (Bardet, 1997; Mitchell, 1993). The liquid limit of the bentonite used was
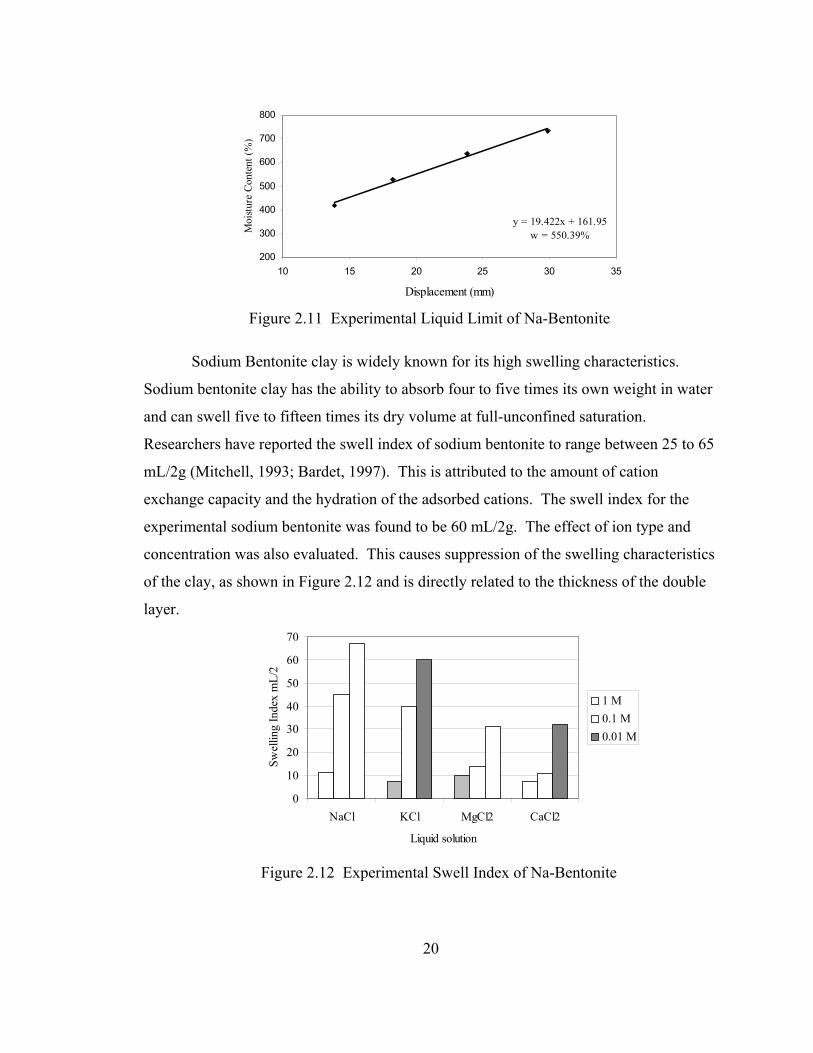
experimentally determined to be approximately 550% as shown in Figure 2.11.
19
y = 19.422x + 161.95w = 550.39%
200
300
400
500
600
700
800
10 15 20 25 30 35
Displacement (mm)
Moi
sture
Con
tent
(%)
Figure 2.11 Experimental Liquid Limit of Na-Bentonite
Sodium Bentonite clay is widely known for its high swelling characteristics.
Sodium bentonite clay has the ability to absorb four to five times its own weight in water
and can swell five to fifteen times its dry volume at full-unconfined saturation.
Researchers have reported the swell index of sodium bentonite to range between 25 to 65
mL/2g (Mitchell, 1993; Bardet, 1997). This is attributed to the amount of cation
exchange capacity and the hydration of the adsorbed cations. The swell index for the
experimental sodium bentonite was found to be 60 mL/2g. The effect of ion type and
concentration was also evaluated. This causes suppression of the swelling characteristics
of the clay, as shown in Figure 2.12 and is directly related to the thickness of the double
layer.
0
10
20
30
40
50
60
70
NaCl KCl MgCl2 CaCl2
Liquid solution
Swel
ling
Inde
x m
L/2
1 M0.1 M0.01 M
Figure 2.12 Experimental Swell Index of Na-Bentonite
20

2.2 Polymers
2.2.1 Chemical Composition
Polymers are formed by chemical reactions in which a large number of repeating
molecules called monomers are joined sequentially to form a chain. The physical and
chemical properties of a polymeric chain are completely different then the properties of
the monomers that make it up. Both naturally occurring and synthetic polymers exist.
While synthetic polymers are commercially available in a wide of range molecular
weights, typically polymers are naturally high molecular weight compounds.
Polyelectrolytes are water-soluble polymers that are comprised of many repeating
units that are polymerized to have a net ionic charge. Depending on the monomer used,
they can have a positive charge (cationic), negative charge (anionic) or have electrical
neutrality (nonionic.) Naturally, these polymers tend to exist in coils, curled around one
another, however, when they are put into solution the polymer chains uncurl and lengthen
due to the repulsive forces between the ionized groups.
Although, there are many different types of polymers commercially available, this
discussion will focus on derivatives of the polymerization of acrylamide, as this is the
material used in the study. Acrylamide is a derivative of the acrylate family of polymers,
which have the chemical structure shown in Figure 2.13.
Figure 2.13 Polyacrylate
21

Polyacrylamide or PAM is a polymer known for its great affinity for water and is
commonly used in products such as in diapers and potting soil. Polyacrylamide is an
acrylate polymer formed from acrylamide subunits. The chain of polyacrylamide has
hydrogen on every other carbon replace by an amide group, and is given by the structure
in Figure 2.14.
Figure 2.14 Polyacrylamide
The amide functional group is -CONH and it allows for linking between polymer
strands. One molecule can react with the same group of another molecule, forming a link
between them with the structure –CONHCO–. The unlinked amide groups can form
hydrogen bonds with water because they contain –NH2 groups. This allows
polyacrylamide to absorb many times its mass in water. In the presence of ionic
substances, the polyacrylamide will release the absorbed water due to interference with
the hydrogen bond. These polymers can be easily cross-linked, meaning that parallel
chains can be covalently bonded together. The polyacrylamide structure can be cross-
linked or non-cross-linked, but since the cross-linked bond is more rigid the cross-linked
polymers are not water-soluble.
All the polymers used in this study have polyacrylamide backbones but the net
ionic charge is obtained by further polymerization. The anionic and nonionic are formed
using poly(acrylic acid) which has the structure shown in Figure 2.15.
Figure 2.15 Poly(acrylic acid)
22

The cationic derivatives are much more complex, typically involving co-
polymerization with quaternary ammonium ion (NH4+). There are many possible
structures for any of these polymers, but they are classified according to net charge and
density of the charge along the polymer chain.
2.2.2 Clay – Polymer Interaction
Three classes of polymers, cationic, anionic and nonionic are used to modify the
clay in this study. The clay-polymer interaction varies according to the molecular
weight, surface charge and charge density of the polymer. The nature of these
interactions is of interest because it affects the engineering properties of the soil.
A polymer chain is long and flexible which allows the polymer to adopt various
shapes and to be attached by numerous segment-surface bonds. A typical interfacial
conformation consists of tails, loops and trains. Trains have intimate contact with the
clay surface, while the tails and loops are not adsorbed. Polymer adsorption is pictured in
Figure 2.13. Generally, the adsorption of a polymer increases with the length of the
chain, up to a limiting molecular weight. However, all polymers may not be able to enter
the interlayers of the clay structure, due to their molecule or coil size. X-ray diffraction
analysis has indicated that some polyacrylamide polymers have successfully entered the
interlayer spacing (Gungor and Ece, 1999). Polymers compete with water molecules for
adsorption of the surface.
23

Hydrated cations
Polymer chain
Clayparticle
Water molecules
Figure 2.16 Adsorption of Uncharged Polymer on Clay (After Theng, 1979)
Adsorption of polymers will cause changes in the double layer of the clay. The
changes in the Gouy layer are attributed to the loops and tails, while changes in the Stern
layer are attributed to the trains, shown in Figure 2.14. Because these regions are altered,
so is the net interaction energy of the region. In some cases, the polymer will form a
bridge between two adjacent plates, thus reducing the forces of tension between the two.
Stern Layer Gouy Layer
Adsorbed Cations Hydrated Cations Anion Adsorbed Polymer Chain
Figure 2.17 Clay Interaction (after Theng, 1979)
2.2.2.1 Cationic Interaction
Cationic polyacrylamide is a non-crosslinked long-chain polymer made of the
monomer acrylamide. The presence of the co-polymer, quaternary ammonium group
24

within the backbone of this molecule ensures that it maintains its very strong cationic
charge. The co-polymer is a cationic derivative of acrylic acid.
Polycations are absorbed via the cation exchange capacity of the clay. The
bentonite has monovalent sodium as its exchangeable cation, which can be easily
replaced by one of the many charges along the chain. Higher charge density polymers
have a higher adsorption capacity. When polymers of low cationicity are absorbed, a
significant proportion of the polymer extends away from the surface in loops and tails
(Breen and Watson, 1998). This has been shown to lead to interparticle bridging and/or
wrapping of the clay particle. However, at values greater than 15% active polymer, the
polymer is found to collapse onto the surface, with few loops or trains. This process is
not likely to be reversed because it would require instantaneous desorption of all trains of
the polycation and diffusion away from the surface (Breen, 1999).
2.2.2.2 Anionic Interaction
Anionic polyacrylate is a polymer of acrylamide. The structure is
(CH2=CHCOO-H) and it is synthesized from the linear polymerization of acrylic acid.
Since the basic polymer unit is acrylic acid the polymer has the potential to carry a high
charge along its chain.
The surface of the clay particle is negative, so it would be expected that an
anionic polymer would be repelled. However, early work by Ruehrwein and Ward
(1952) and Parfitt and Greenland (1970) has shown that anionic adsorption is possible.
The bonding mechanisms of polyanions are electrostatic attraction, hydrogen bonding
and van der Waals forces. Due to repulsive forces anionic polymers can remain
suspended winding through the diffuse layer. At lower pH levels, electrostatic repulsion
is weakened and there is increased chain coiling, which allows for some anion adsorption
(Theng, 1979). As the charge density increases, the chain becomes longer and less
flexible, which promotes bridging. In the presence of salts, the negative charges are
shielded from one another allowing the polyanion to coil and collapse on the clay surface
25
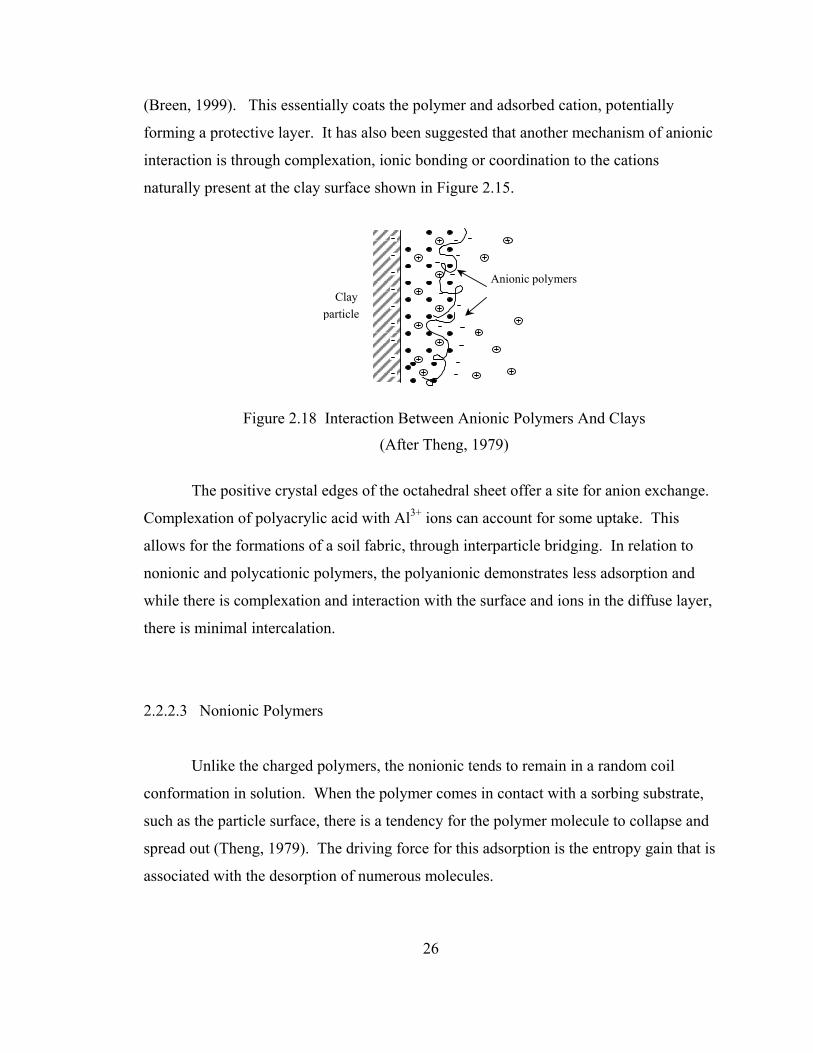
(Breen, 1999). This essentially coats the polymer and adsorbed cation, potentially
forming a protective layer. It has also been suggested that another mechanism of anionic
interaction is through complexation, ionic bonding or coordination to the cations
naturally present at the clay surface shown in Figure 2.15.
Anionic polymers
Clayparticle
Figure 2.18 Interaction Between Anionic Polymers And Clays
(After Theng, 1979)
The positive crystal edges of the octahedral sheet offer a site for anion exchange.
Complexation of polyacrylic acid with Al3+ ions can account for some uptake. This
allows for the formations of a soil fabric, through interparticle bridging. In relation to
nonionic and polycationic polymers, the polyanionic demonstrates less adsorption and
while there is complexation and interaction with the surface and ions in the diffuse layer,
there is minimal intercalation.
2.2.2.3 Nonionic Polymers
Unlike the charged polymers, the nonionic tends to remain in a random coil
conformation in solution. When the polymer comes in contact with a sorbing substrate,
such as the particle surface, there is a tendency for the polymer molecule to collapse and
spread out (Theng, 1979). The driving force for this adsorption is the entropy gain that is
associated with the desorption of numerous molecules.
26

Polyacrylamide can be strongly adsorbed to and/or associated with the particle
surface. Depending on the size, or molecular weight, some polyacrylamide chains can be
accessible to all surfaces of the sodium bentonite, due to the separation of the silicate
layer caused by swelling. Coordination complexes can be formed between the
exchangeable cations and the amide groups of the polymer, which explains the strong
binding of the polymers, particularly in divalent systems (Tanihara and Nakagawa, 1975).
When the nonionic polymer is added to the clay without the presence of electrolytes, a
network of polymer-clay links is formed. If electrolytes are then introduced, the polymer
chain is likely to spread out over the surface and interparticle bridging is maintained.
2.2.3 Experimental Materials
The polymers used for this study were supplied by Emerging Technologies, Inc.
All polymers are synthetic, organic water-soluble polymers based on the polymerization
of polyacrylamide. The polymers were white, granular solids and were stored in air-tight
containers at room temperature prior to use, shown in Figure 2.16.
Figure 2.19 Polymer Granules
The exact chemical composition of the polymers was considered to be proprietary
information and, therefore, not supplied by the company. The technical data supplied by
Emerging Technologies are listed in Table 2.2. It also should be noted that the melting
27

point for all the polymers is > 200°C. The anionic polymers used are comprised of units
of acrylic acid, which provide the negative electrical charge. The cationic polymers
however, rely on three functional groups to impart the active charge and the specific
chemical make up was not supplied.
Table 2.2 Polymer Material Data
Product Charge Bulk Density
(lbs/ft3)
Molecular
Weight
(Daltons x 106)
Weight
Percent
Ionic
Solution Viscosity
0.5% in Dist Water
(CP)
Effective
pH
Range
10G-80A Medium
Anionic 44 3 – 4 40 > 4500 6 – 13
10G-70A Low
Anionic 42 3 – 4 15 > 2000 5 – 12
10G-20 Nonionic 41 4 – 6 N/A > 200 0 – 13
10G – 90C Low
Cationic 36 3 – 4 12 – 15 > 1000 1 – 13
10G-100C High
Cationic 38 10 55 > 5000 1 – 13
The electrical conductivity and pH was measured for all the polymers. 0.25
grams of each of the polymers was slowly and carefully added to a beaker with 400 mL
of deionized water and magnetically stirred for 1.5 to 2 hours until all of the polymer was
dissolved. The electrical conductivity of the solutions was measured using the Accumet
AB30, 4-cell conductivity meter and the pH using the Accumet AP63 pH meter shown in
Figure 2.17. Both instruments were calibrated with the standardizing solutions prior to
measurement. The results of these measurements are shown in Table 2.3
28
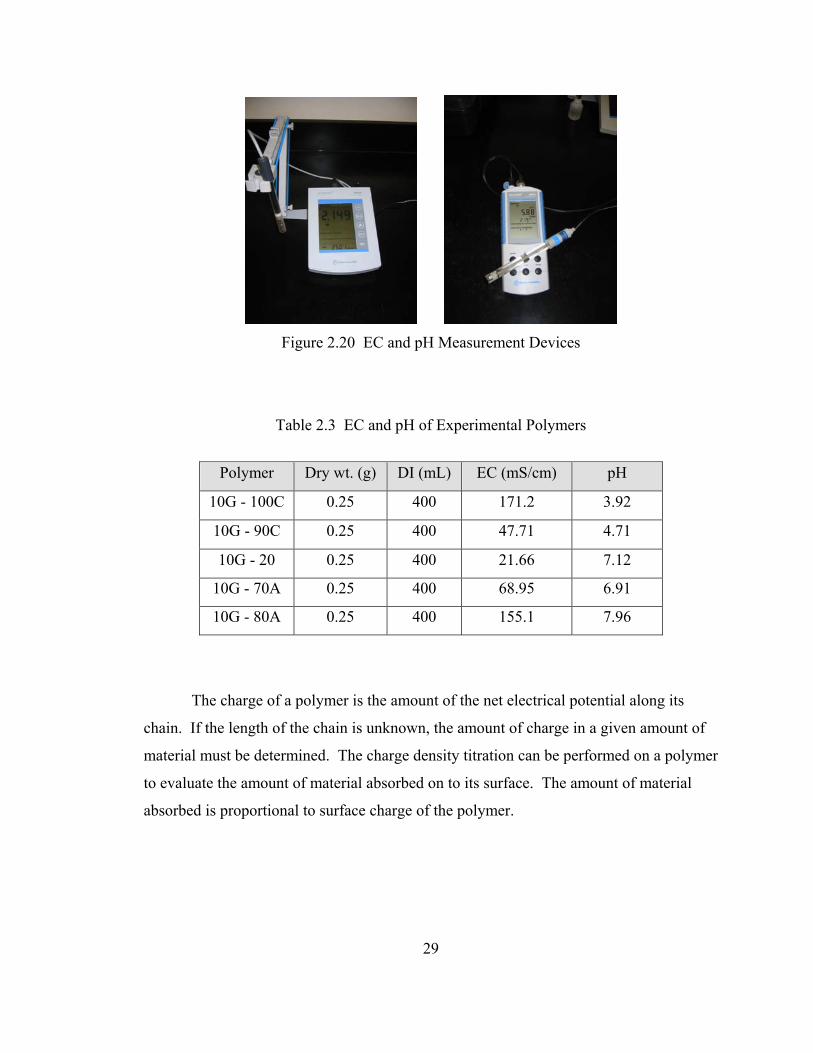
Figure 2.20 EC and pH Measurement Devices
Table 2.3 EC and pH of Experimental Polymers
Polymer Dry wt. (g) DI (mL) EC (mS/cm) pH
10G - 100C 0.25 400 171.2 3.92
10G - 90C 0.25 400 47.71 4.71
10G - 20 0.25 400 21.66 7.12
10G - 70A 0.25 400 68.95 6.91
10G - 80A 0.25 400 155.1 7.96
The charge of a polymer is the amount of the net electrical potential along its
chain. If the length of the chain is unknown, the amount of charge in a given amount of
material must be determined. The charge density titration can be performed on a polymer
to evaluate the amount of material absorbed on to its surface. The amount of material
absorbed is proportional to surface charge of the polymer.
29
2.2.3.1 Polymer Titration
The colloid titration method is one way to estimate the net charge density. What
is actually measured is the capacity of the mixture to adsorb a polyelectrolyte of opposite
net charge. A small amount of indicator dye is added to a known volume of cationic
solution. The cationic polymer solution is titrated with a negatively charged solution with
known properties. Complexation between the dye and the negatively charged polymer
causes the color-change at the endpoint. This process is slightly modified for the anionic
polymers, where a back titration must be performed. A small amount of the anionic is
first treated with the cationic standard and then titrated with the negative solution. At the
endpoint the amount adsorbed can be calculated and related to the surface charge density
of the polymer.
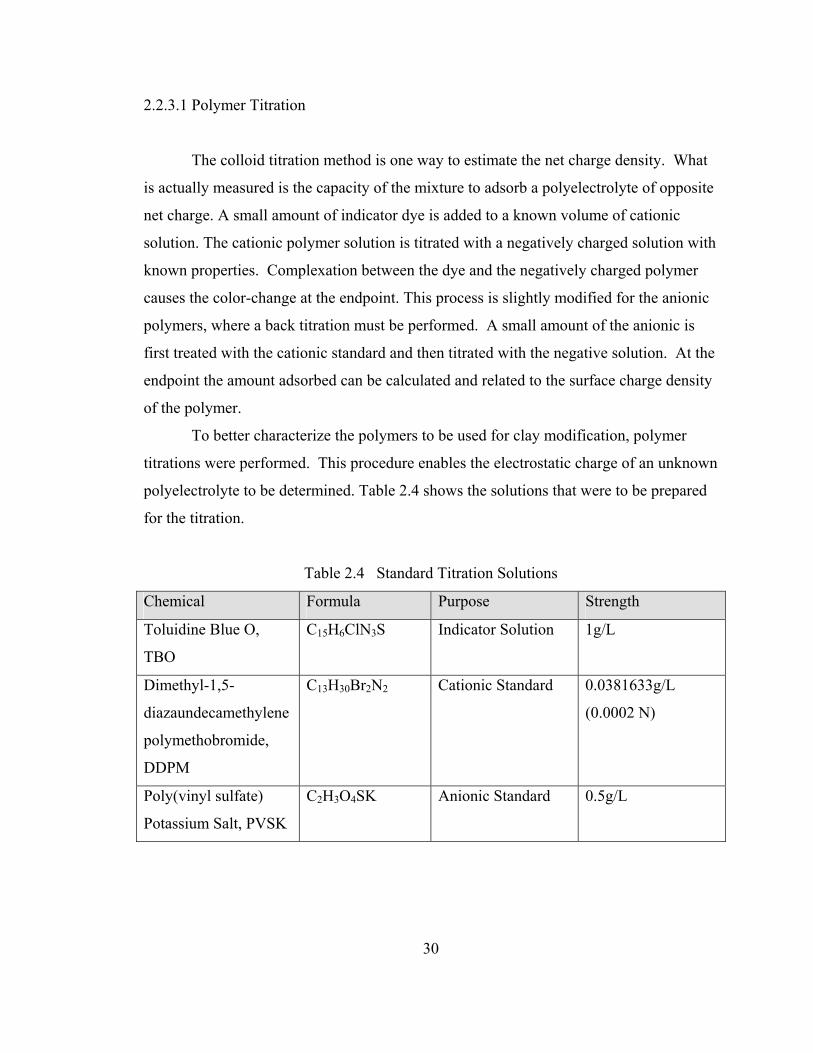
To better characterize the polymers to be used for clay modification, polymer
titrations were performed. This procedure enables the electrostatic charge of an unknown
polyelectrolyte to be determined. Table 2.4 shows the solutions that were to be prepared
for the titration.
Table 2.4 Standard Titration Solutions
Chemical Formula Purpose Strength
Toluidine Blue O,
TBO
C15H6ClN3S Indicator Solution 1g/L
Dimethyl-1,5-
diazaundecamethylene
polymethobromide,
DDPM
C13H30Br2N2 Cationic Standard 0.0381633g/L
(0.0002 N)
Poly(vinyl sulfate)
Potassium Salt, PVSK
C2H3O4SK Anionic Standard 0.5g/L
30
The experimental procedure, Charge Density Determination for Organic
Polyelectrolytes was followed. First, all solutions were prepared to the concentrations
given above. The PVSK must be standardized with the DDPM to obtain the normality of
the PVSK. The PVSK was placed in a burette on a ring stand centered over a magnetic
stirring plate with a solution of 10 mL of the DDPM containing 2 drops of the TBO. The
PVSK was added to this solution until streaks of purple appeared in the solution. The
solution was then added dropwise until a light purple color was achieved. The total
amount of PVSK added was recorded and used to calculate its normality.
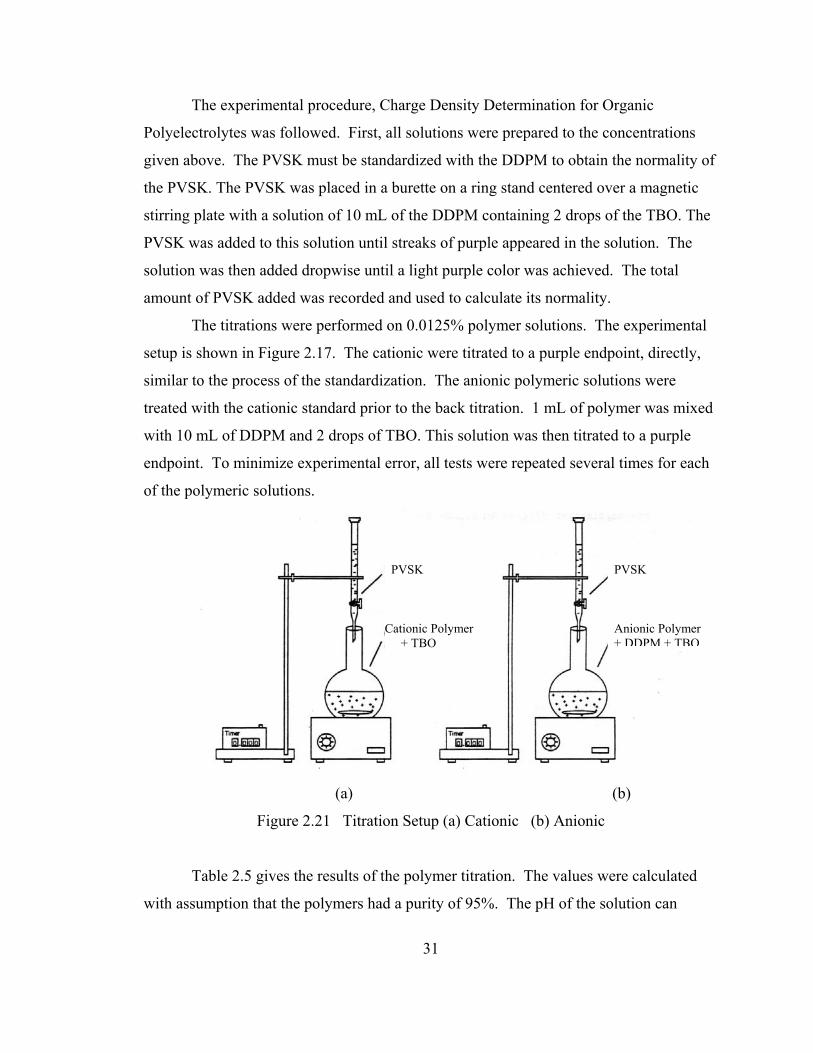
The titrations were performed on 0.0125% polymer solutions. The experimental
setup is shown in Figure 2.17. The cationic were titrated to a purple endpoint, directly,
similar to the process of the standardization. The anionic polymeric solutions were
treated with the cationic standard prior to the back titration. 1 mL of polymer was mixed
with 10 mL of DDPM and 2 drops of TBO. This solution was then titrated to a purple
endpoint. To minimize experimental error, all tests were repeated several times for each
of the polymeric solutions.
PVSK PVSK
Anionic Polymer + DDPM + TBO
Cationic Polymer + TBO
(a) (b)
Figure 2.21 Titration Setup (a) Cationic (b) Anionic
Table 2.5 gives the results of the polymer titration. The values were calculated
with assumption that the polymers had a purity of 95%. The pH of the solution can
31
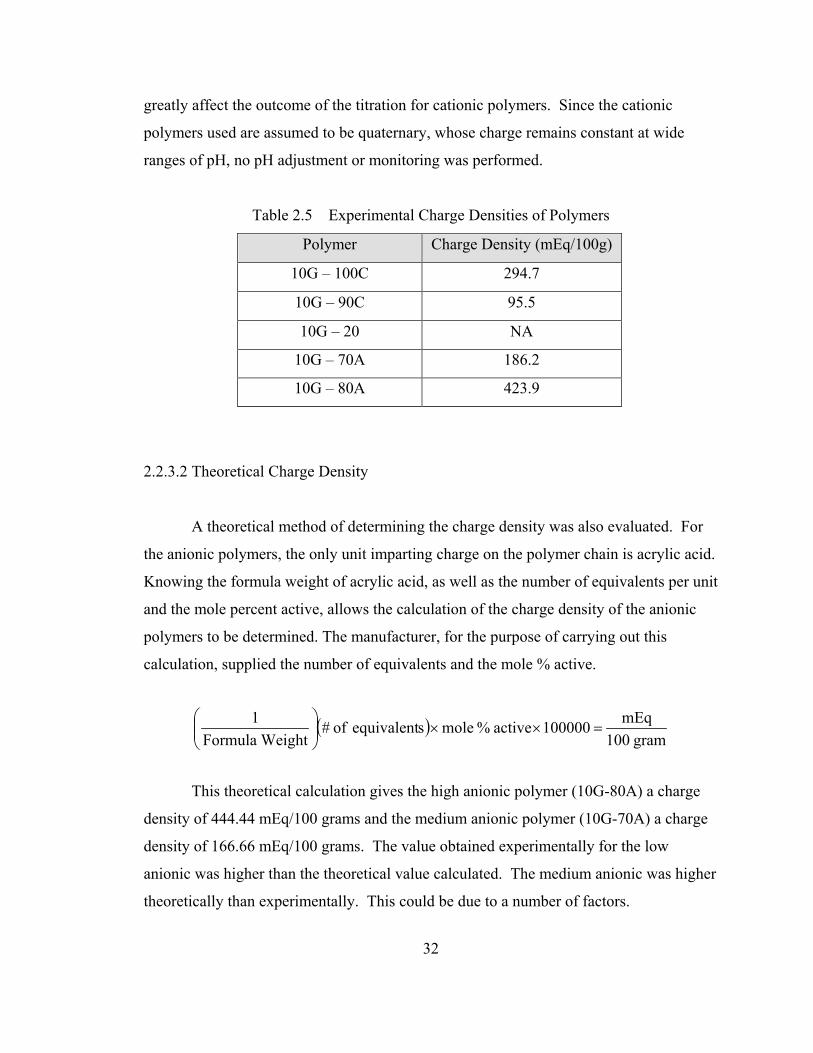
greatly affect the outcome of the titration for cationic polymers. Since the cationic
polymers used are assumed to be quaternary, whose charge remains constant at wide
ranges of pH, no pH adjustment or monitoring was performed.
Table 2.5 Experimental Charge Densities of Polymers
Polymer Charge Density (mEq/100g)
10G – 100C 294.7
10G – 90C 95.5
10G – 20 NA
10G – 70A 186.2
10G – 80A 423.9
2.2.3.2 Theoretical Charge Density
A theoretical method of determining the charge density was also evaluated. For
the anionic polymers, the only unit imparting charge on the polymer chain is acrylic acid.
Knowing the formula weight of acrylic acid, as well as the number of equivalents per unit
and the mole percent active, allows the calculation of the charge density of the anionic
polymers to be determined. The manufacturer, for the purpose of carrying out this
calculation, supplied the number of equivalents and the mole % active.
( )gram100
mEq100000active%molesequivalentof#WeightFormula
1=××
This theoretical calculation gives the high anionic polymer (10G-80A) a charge
density of 444.44 mEq/100 grams and the medium anionic polymer (10G-70A) a charge
density of 166.66 mEq/100 grams. The value obtained experimentally for the low
anionic was higher than the theoretical value calculated. The medium anionic was higher
theoretically than experimentally. This could be due to a number of factors.
32

Assumptions were made for the purity of the polymers, and the mole % active was
supplied in a range. Experimental error with titrations could lead to inaccurate results,
particularly with the preparation of the standard and polymer solutions, which requires
the measurement of very small masses and mixing of very dilute solutions.
33
CHAPTER 3
EXPERIMENTAL BACKGROUND & LITERATURE REVIEW
3.1 Clay Fabric
Na-bentonites have a small crystal size and high water binding capacity, which
allow the clay to exist in a dispersed arrangement. The hydrated sodium ions surround
the clay particles and contribute to the thickness of the diffuse double layer. The
electrostatically bound hydrated shells hinder pore waster flow through this region, which
gives the bentonite its low permeability characteristics. When cation exchange occurs in
the bentonite, in particular the replacement of monovalent cations with polyvalent
cations, there is an alteration in the clay fabric. The dispersed clay tends to aggregate or
become more coarsely dispersed caused by changes in the diffuse layer and reduction of
interparticle forces. Egloffstein (2001) reported that exchanging calcium for bentonite
for the natural bentonite resulted in a loss of water of 6% to 12%.
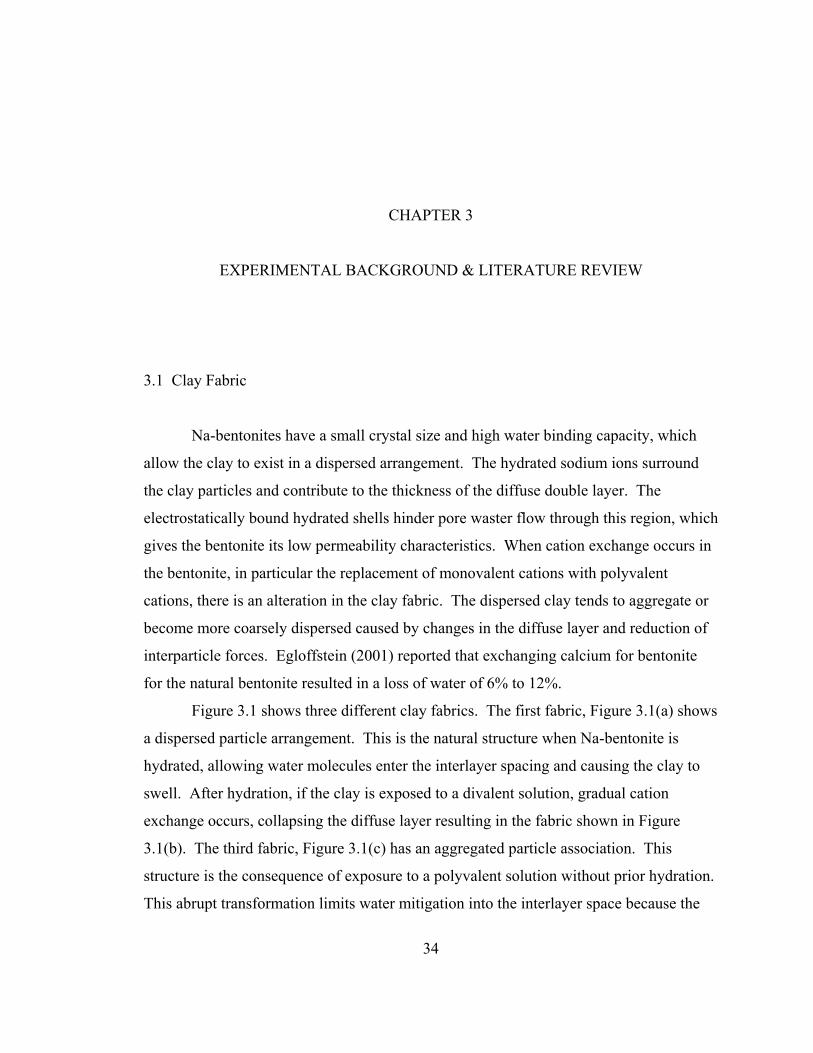
Figure 3.1 shows three different clay fabrics. The first fabric, Figure 3.1(a) shows
a dispersed particle arrangement. This is the natural structure when Na-bentonite is
hydrated, allowing water molecules enter the interlayer spacing and causing the clay to
swell. After hydration, if the clay is exposed to a divalent solution, gradual cation
exchange occurs, collapsing the diffuse layer resulting in the fabric shown in Figure
3.1(b). The third fabric, Figure 3.1(c) has an aggregated particle association. This
structure is the consequence of exposure to a polyvalent solution without prior hydration.
This abrupt transformation limits water mitigation into the interlayer space because the
34

electrostatic forces between the cation and the clay particle surface are larger than the
hydration forces of the divalent cation (Ashmawy et al., 2002).
Figure 3.1 Clay Fabric (a) Dispersed (b) Collapsed (c) Aggregated (After Ashmawy et al.,2002; Egloffstein, 2001)
Several investigators have reported that the order that permeant liquids are
introduced to bentonitic barrier materials can have a significant effect on the final
hydraulic conductivity (Shakelford et al., 2000; Ashmawy et al., Daniel et al., 1993). The
permeability is influenced by these changes because the flow path is affected. The
dispersed fabric results in the lowest permeability because the homogeneous arrangement
has the least amount of flow-efficient pore space. On the other hand, the aggregated
fabric allows the greatest amount of flow because of the formation of open pore space.
Mitchell (1993) describes the soil fabric consisting of three parts, the microfabric,
minifabric and macrofabric, which can all affect the flow of fluid. The microfabric
consists of the natural particle aggregates, which in the presence of water are well
dispersed and allow little flow through the soil. The minifabric is described as an “inter-
assemblage” of pore and aggregates, which can carry greater volumes of flow. Cracks
and fissures in the soil fabric are considered to be part of the macrofabric.
3.2 Permeability Theory
Soils can conduct the flow of fluid, electricity, chemicals and heat. For relevance
to the current study fluid and chemical flow will be discussed. Hydraulic flow through a
35

soil mass is demonstrated in Figure 3.2 (a). According to Darcy’s law, there is a
proportional relationship between the flow rate and the hydraulic gradient for porous
media, which is represented by the following expression:
qh = khihA
where qh is the hydraulic flow, ih is the hydraulic gradient, A is the cross sectional area of
flow and kh is the coefficient of permeability of the soil or porous media. In a given soil
the value of kh may vary a few orders of magnitude, as a result of changes in fabric, void
ratio and water content (Mitchell, 1993). For this reason, the coefficient of permeability
is a parameter that is thoroughly investigated, particularly when the performance of a
hydraulic barrier is vital. Laboratory tests can be conducted to determine the coefficient
of permeability of soil. The two main types of tests are constant head and falling head
permeability tests, each have many variations with numerous experimental setups.
∆H
C1 C2
(a) (b)
Figure 3.2 Mechanism of Flow (a) Hydraulic (b) Chemical
Chemical flow, or diffusion, is driven by a chemical potential and concentration
gradient, shown in Figure 3.2 (b) and is defined by Fick’s law. Diffusion is the
movement of chemical molecules from a region of higher concentration to one of lower
concentration. Fick’s first law is applicable only to steady state diffusion, and is given by
the following expression:
ADiJ cD −=
36
where D is the diffusion coefficient, ic is the chemical gradient, and A is the cross
sectional area of the flow. However, Fick’s second law for transient diffusion is used for
analysis of diffusive flow in soils because it considers the time rate of change of
concentration with distance.
Coupled flow is a flow of one type, driven by a different type of potential
gradient. The transport of pore water containing chemicals under a hydraulic gradient is
called advection. The advective transport is related to the velocity of the fluid, while the
non-advective transport is called the diffusive flux. In laboratory permeability tests
where the soil is permeated with chemical solutions the primary mechanism of chemical
transport is advection.
Bentonite can display a membrane-like property that affect the chemical transport
by causing the restriction or retardation of certain ions due to electrostatic forces in the
diffuse double layer. Sorption, or the binding of chemicals on solids, is significant
because it retards the rate of chemical transfer. Chemicals in soils tend to establish a
balance between the amount on the solid surfaces and the amount in solution. Some
chemicals exist primarily in the liquid phase, while others are strongly adsorbed and exist
primarily on the solid surfaces due to the cation exchange of the mineral surface. Ion
exchange processes are equilibrium processes, which means that the exchange occurs
until an adsorption balance between the clay surface and the solution is achieved.
Malusis and Shackelford (2004) evaluated the hydraulically driven and diffusive
chemical transport in GCL to evaluate the coupled solute transport theory. Solute
transport analyses for natural and engineered barriers consisting of low permeability
clays are performed using models based on advective-dispersive transport theory.
3.3 Geosynthetic Clay Liners
Geosynthetic clay liners (GCLs) are composite materials that consist of a very
thin layer of bentonite sandwiched between two layers of geotextile or bonded to a
geomembrane. They are increasingly used as hydraulic barriers in lining systems. GCLs
37
are effective barriers because of the unique properties of bentonite. In the presence of
water, the bentonite swells to seal holes and create a very low permeability lining.
However, when this liner is permeated with liquids other than water, such as in the case
of a landfill, increases in hydraulic conductivity have been reported in many cases.
Several companies have marketed “chemical resistant” bentonites that have been
treated to maintain hydraulic performance in the presence of chemicals. The soil
additives and methods of treatment are typically proprietary information. Many
laboratory studies have been conducted on the bentonite from various geosynthetic clay
liners, treated and non-treated to evaluate the performance of the commercial products
(Ruhl and Daniel, 1997; Shan and Lai, 2002; Ashmawy et al., 2002; Shackelford, at al.,
2000). Although no long-term testing has been fully carried out, research results appear
promising in many cases.
In reviewing the literature on hydraulic testing of bentonite and GCLs, it can be
seen that there are factors that affect the hydraulic performance which are thoroughly
investigated. All the factors relate directly to the properties of the clay’s micro and
macro structure and include valence and concentration of the electrolyte, void ratio, first
wetting condition, and gradient. Correlations between index properties and hydraulic
conductivity have been made, as well. These findings will be discussed in the following
section in detail.
3.3.1 Valence
The influence of valence has been shown to be evident in free swell tests
conducted on GCL bentonite by Shackelford, et al. (2000). The test was performed
according to ASTM D 5890, The Standard Test for Swell Index of Clay Mineral
Components of Geosynthetic Clay Liners. The bentonite was hydrated with deionized
water and three different 0.025 M chloride solutions. The results, shown in Figure 3.1,
show the change in swell according to the valence of the cation.
38

The highest valence cation, Al3+, has the largest affect on the swelling capacity of
the clay, which is consistent with the Gouy-Chapman and Stern-Gouy theories. The
swell in deionized water is only slightly larger that in the LiCl, due to the monovalency
of the cation. The Li+ may replace the Na+, but the little change in swell because the
minimal change in double layer thickness due to the 1:1 exchange. Permeability tests
were also conducted on the GCL bentonite permeated with the same concentration
solutions as above. The findings were consistent with changes in the thickness of the
diffuse layer. The hydraulic conductivity reported for the monovalent permeant was 3
orders of magnitude lower than that of the divalent.
Figure 3.3 Effect of Valence (After Shackelford et al., 2000)
Jo et al. (2001) investigated the influence of single-species salt solutions of
various concentration, cation valence and pH on the swelling and hydraulic conductivity
of nonprehydrated GCLs. It was found that monovalent cations reduce the swelling to
different degrees depending on the hydrated radius of the cation. Divalent cations
suppressed the swell more notably than the monovalent, however the species was found
to be less influential on the degree of swell. Valence, concentration and pH were found
to have analogous effects on swelling and hydraulic conductivity.
Ruhl and Daniel (1997) described the response of geosynthetic clay liners to
permeation with various chemical solutions and leachates. Ca2+ solutions were found to
be far more aggressive to the GCLs than real leachates due to the lower concentration of
39

cations. Contaminant resistant bentonites produced variable results, as some are more
resistant to specific chemicals.
Experimental results have shown that Ca2+ from dilute solutions can gradually
exchange the naturally occurring Na+ on the exchange complex, resulting in gradual
compression of the adsorbed layer and consequent gradual increase in hydraulic
conductivity (Shakelford et al., 2002). This is shown to occur at very large pore volumes
of flow, which indicates that the cation exchange can occur over a long period of time.
3.3.2 Concentration
The concentration of a permeant influences the hydraulic and swell properties of
GCL bentonite. Concentrations were varied from 0.01 to 0.1 M. It is shown that as the
electrolyte concentration increases, the swell volume decreases and the hydraulic
conductivity increases, which indicate a reduction in the thickness of the double layer.
This is consistent with the equations for the thickness of the double layer. At 1M the
interlayer spacing is nearly as small as possible, consisting of about four monolayers of
water regardless of cation spacing (Zhang et al., 1995).
Shackelford et al. (2000) discussed the factors affecting the hydraulic
conductivity of GCLs permeated with high concentrations of monovalent and any
concentration of divalent solutions. The importance of allowing the test to run for
sufficient period of times was highlighted.
3.3.3 Pre-Hydration
Pre-hydration has been highlighted in the literature as an important consideration
in the performance of bentonite and CGLs. Ashmawy et al. (2002) demonstrated the
effect of pre-hydration on untreated and polymer treated bentonite. The significant
increases in hydraulic conductivity were attributed to the changes that occur in the fabric.
40

It was found that the polymer treated clays only demonstrated limited improvement over
the unmodified bentonite. Shan et al. (2002) evaluated the effect of hydrating liquid on
the hydraulic properties of GCLs and similar conclusions are made of the importance of
pre-hydration. Jo et al. (2001) found that at concentrations of 1M and above the effect of
valence was not observed for nonprehydrated samples.
Chemical resistant GCLs were tested in nonprehydrated conditions and found to
have very high hydraulic conductivities, which indicates the sensitivity of even treated
clays to the first wetting fluid. Ruhl and Daniel (1997) warn that laboratory tests where
samples are fully prehydrated may not simulate actual field conditions and predict values
for the permeability that are far lower than when implemented in the field.
3.3.4 Void Ratio
Void ratios are found to have a considerable impact on the permeability of
bentonite and GCLs. The thickness of the diffuse layer determines what portion of the
voids is available for flow. At lower void ratios there thickness of the double layer is
reduced, which means that there is a higher midplane potential and a more “crowded”
diffuse ion swarm. This greatly restricts flow, whereas if particle are further apart there is
less interaction between the diffuse layers allowing higher hydraulic conductivity.
Figure 3.4 Effect of Void Ratio ( after Shackelford et al., 2000)
41

The effect of varying the voids can be seen in Figure 3.2 where ebf is the final
bulk void ratio. It can be seen that the trend is the greater the void ratio, the higher the
permeability. The effect of varying the void ratio appears to be independent of the effect
of change in the thickness of the adsorbed layer. The trends of change are fairly uniform
despite the changes in cation concentration. The effect of the void ratio is found to be
more prominent in soils that have not been prehydrated.
3.3.5 Testing Procedures
Hydraulic conductivity alone does not give a clear indication as to when a test
should be terminated. Shakelford et al. (1998) suggest using the electrical conductivity
and pH as an indicator of the chemical composition of the effluent to determine chemical
equilibrium. If chemical equilibrium is not achieved, there is still a long-term potential
for an increase in hydraulic conductivity.
Hydraulic gradient can have an affect on the hydraulic conductivity due to the
high seepage flows. The ASTM standard recommends a maximum of 30 for the
hydraulic gradient; however, Rad et al. (1994) have shown that the hydraulic conductivity
of a GCL is unaffected at gradients as much as 2800.
3.4 Modified Clays
Sensitivity to pore fluid conditions can be reduced by modifying the clay. The
engineered modifications use the cation exchange capacity of the clay to sorb organic
compounds to the surface. The hydraulic and sorptive properties can be enhanced
depending on the compound used to treat the clay. Chemically resistant bentonites have
been developed for applications where chemical interactions are likely to affect the
adsorbed layer and consequently, the hydraulic conductivity (Shackelford et al., 2000).
42
3.4.1 Organobentonites
Modified clays have shown great potential as adsorbents for organic pollutants.
Organobentonites are clays that have been organically modified to increase pollutant
retention and resist pollutant transport. Extensive research has been conducted on the
sorptive properties of these materials (e.g. Bartelt-Hunt et al., 2003; Lo et al., 1997).
Organic compounds interact with play particles by adsorption, ion exchange and
intercalation. The properties of the organoclays are a function of the base clay and
organic compound. When an organic molecule enters the interlayer or penetrates
between the silicate layers, the molecule is said to have intercalated. Size is a limiting
factor for these interactions. Some organic compounds are larger than the exchange sites
of the surface of the clay, which hampers ion exchange. Similarly if a compound is too
large it is prevented from entering the interlayer. Organic compounds have been shown
to force the spacing of the interlayers apart (Li et al., 1996).
Organophillic clays are commonly manufactured to enhance the sorptive
properties to target organic compounds. Organobentonites are the most common of this
type. They are made by exchanging the naturally occurring Na2+, Ca2+ and Mg2+ with an
organic compound, typically quaternary ammonium cations. The sorption of nonpolar
organic pollutants has been found to be several magnitudes greater on organobentonites
than unmodified clays. This process changes the clay from a hydrophilic, or “water
loving” to a hydrophobic, or “water hating” clay. Organobentonites can retain low
permeability in the presence of nonpolar liquids and are stronger and less compressible
than unmodified clay (Bartelt-Hunt et al., 2003).
In research by Bartelt-Hunt et al. (2003) and Redding and Burns (2002), the clays
were prepared in quaternary ammonium cations solutions at percentages of the cation
exchange capacity of the clay, ranging from 20% to 125% to assess the organic uptake.
The quantity of the organic cation was determined by
43

ZGMWMCECM
fcationclay
cation
⋅⋅⋅=
where f is the fraction of CEC satisfied by the organic cation, Mcation is the mass or
organic cation required to achieve the desired fraction of CEC, CEC is the cation
exchange capacity of the base clay, Mclay is the mass of the base clay, GMWcation is the
gram molecular weight of the organic cation and Z is the moles of charges per equivalent.
Using this equation to determine the quantity, organic solutions were added to the Na-
bentonite. This allowed the effect on the surface chemistry be related to the actual
organic uptake to be quantified.
The presence of large particle forces opening the interlayer was verified by the
result of lower specific gravity of the soil due to a less dense configuration. A trend of
increasing organic content with decreasing density was observed. The free swell of the
organobentonite in organic phase liquids was 2 to 4 times the volume of the unmodified
bentonite. The hydraulic conductivity of organobentonites has been found to be
unacceptably high. Techniques such as mixing the modified clay with unmodified clay to
improve hydraulic response are currently being investigated at the University of Virginia.
3.4.2 Polymer Treatment
Polymer modification of the bentonite has been introduced commercially in GCLs
and drilling muds, however data concerning the treatment process is limited. One study
conducted by Liao (1989) investigated polymer/bentonite/soil admixtures as hydraulic
barriers. A blend of water soluble, high molecular weight linear and cross-linked
acrylamide based polymers were used as admixtures at 1 wt%. The permeants used were
brine and gasoline. Some of the polymers, which were all proprietary, were found to
improve the hydraulic performance, while others had little impact. It was concluded that
polymer modification can be effective for creating low permeability seals. A great deal
of research has been conducted on clay polymer interactions for water treatment and
44

industrial process applications. Although many of these studies are for different
engineering applications, the findings can be applied for modification of clay for
containment purposes.
Gungor and Ece (2002) examined the adsorption of nonionic polymers on Na-
Bentonite and found that the extent of interaction was determined by a number of
parameters including polymer concentration, molecular weight, functional groups of the
polymer, clay/water ratio, surface charge of the clay particles, pH and temperature.
Adsorption occurs when the polymer has preferential affinity to the surface over water
molecules. Their studies revealed that the polymer interaction occurred only at the
particle surface not the interlayer. Polymers were shown to bridge particles, which
resulted in larger aggregated particles. For this bridging to occur the polymer loops must
be able to span the distance between particles caused by electrostatic repulsion, or the
thickness of the double layer.
Breen and Watson (1998) investigated polycation exchanged clays. The
polycations were adsorbed. The conclusion was that polycation-exchanged clays offer
the promise to be tailored as adsorbents for organic pollutants. The study did not
examine the hydraulic properties of the soils, but focused on the polymer uptake and
pollutant sorption capacity.
Churchman (2001) examined the formation of complexes between bentonite and
various cationic polyelectrolytes, one of which was polyacrylamide. Clay polymer
reactions were found to be complete at low polymer/clay ratios. The focus of this
research was to remove nonionic and anionic pollutants. It was found that lower polymer
loadings resulted in the largest amount of nonionic uptake, while higher loadings were
more likely to adsorb anionic pollutants.
45
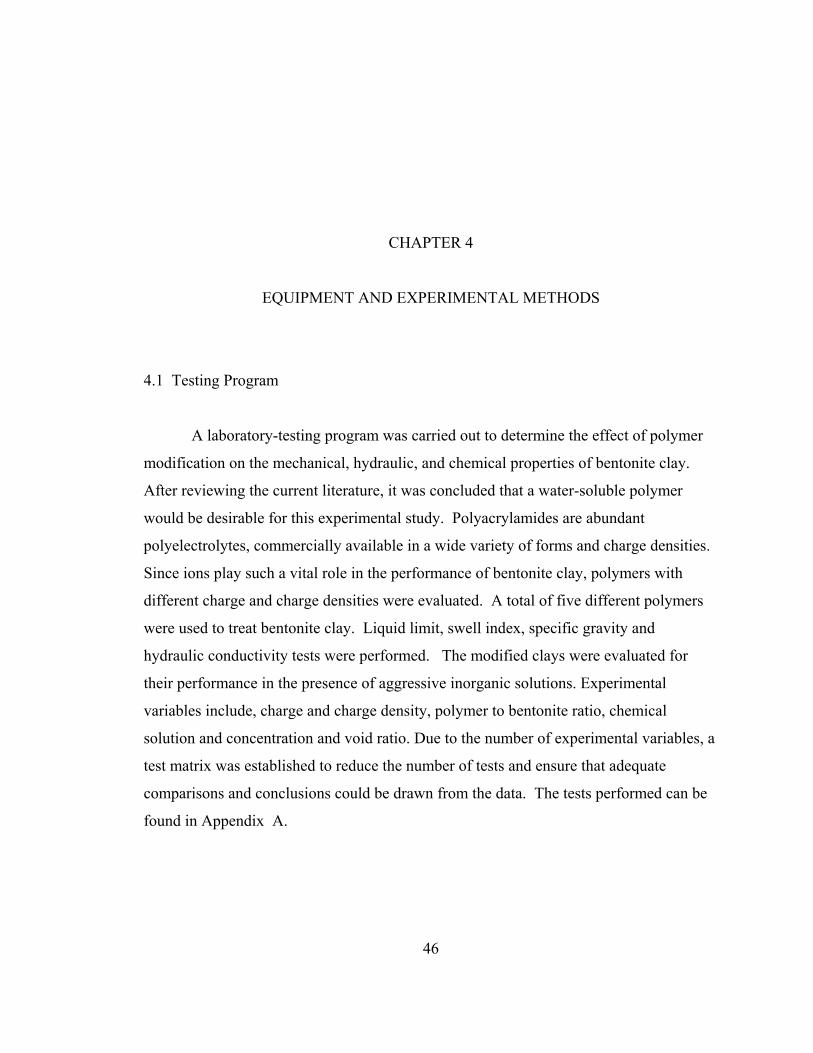
CHAPTER 4
EQUIPMENT AND EXPERIMENTAL METHODS
4.1 Testing Program
A laboratory-testing program was carried out to determine the effect of polymer
modification on the mechanical, hydraulic, and chemical properties of bentonite clay.
After reviewing the current literature, it was concluded that a water-soluble polymer
would be desirable for this experimental study. Polyacrylamides are abundant
polyelectrolytes, commercially available in a wide variety of forms and charge densities.
Since ions play such a vital role in the performance of bentonite clay, polymers with
different charge and charge densities were evaluated. A total of five different polymers
were used to treat bentonite clay. Liquid limit, swell index, specific gravity and
hydraulic conductivity tests were performed. The modified clays were evaluated for
their performance in the presence of aggressive inorganic solutions. Experimental
variables include, charge and charge density, polymer to bentonite ratio, chemical
solution and concentration and void ratio. Due to the number of experimental variables, a
test matrix was established to reduce the number of tests and ensure that adequate
comparisons and conclusions could be drawn from the data. The tests performed can be
found in Appendix A.
46

4.2 Sample Preparation
Since the commercial methods used to treat bentonite are unknown, a technique to
achieve soil polymer interactions was developed for the soil samples. The extent of the
interaction was only evaluated by comparing the performance of the modified clay. The
process of sample preparation was the most rigorous portion of the laboratory
experimentation. The following describes the mixing techniques used for the treatment
and modification of the soils.
4.2.1 Mixing Procedure
Two weight percent ratios of polymer to bentonite mixes were examined in this
study, 0.5 wt% and 1.0 wt%. All polymers were dissolved in deionized water using a
magnetic stirrer prior to mixing with the bentonite. Approximately 0.025% solutions
were prepared by very slowly adding the granular polymer to the deionized water. It was
necessary to add the polymer very slowly to avoid flocculation of the polymer granules.
The stirrer was set on medium mixing speed and stirring times ranged from 45 minutes to
3 hours for the polymers to be completely dissolved.
The bentonite was dried at 50°C, measured and placed in a large metal bowl. The
polymer solution was then added directly to the dry clay and mixed with an electric hand
mixer. The beaker was flushed several times with deionized water, which was added to
the mix to ensure that all the polymer solution was added. Additional deionized water
was added slowly to bring the mixture to a thick slurry. In order to enhance polymer
dispersion and to ensure that the mixture was homogeneous, the soil was mixed for 45
minutes with the electric hand stirrer. The slurry was then covered and permitted to
hydrate for 24 hours. After the 24-hour period, a small amount of water was added and
the slurry was mixed for another 10 minutes.
The presence of adsorbed water on the interaction of the clay and polymers was
evaluated by testing two drying conditions. Two sets of soils were prepared one that was
47
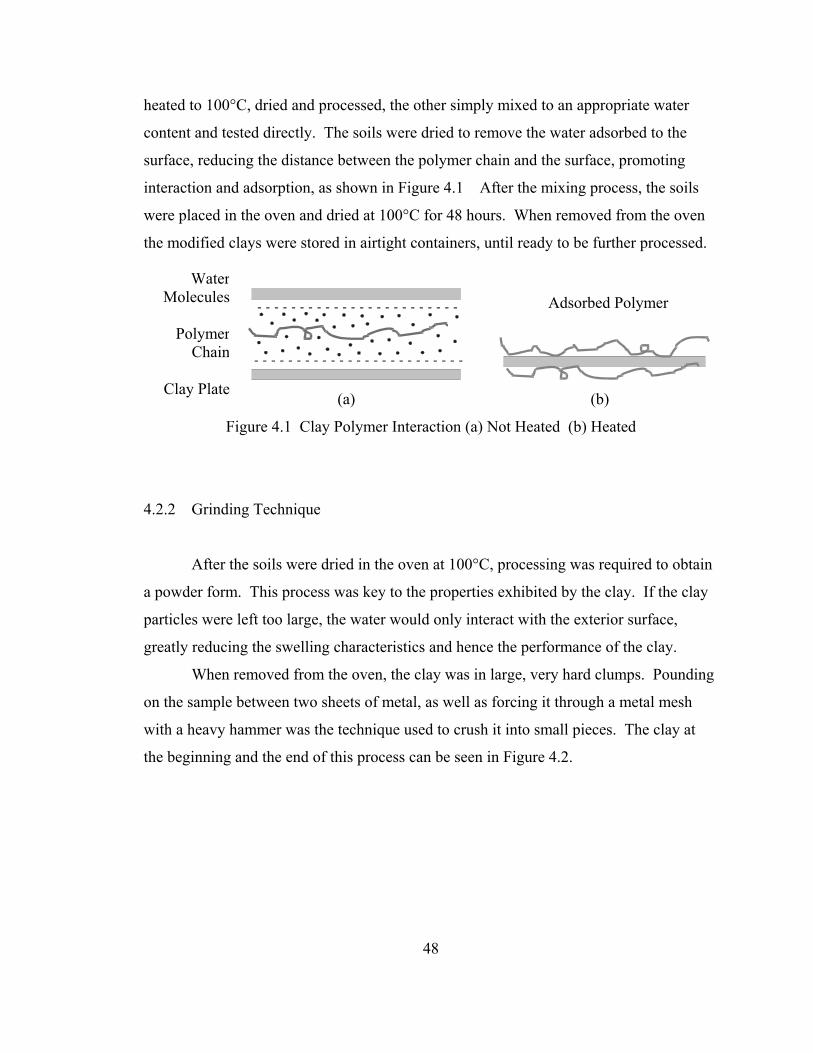
heated to 100°C, dried and processed, the other simply mixed to an appropriate water
content and tested directly. The soils were dried to remove the water adsorbed to the
surface, reducing the distance between the polymer chain and the surface, promoting
interaction and adsorption, as shown in Figure 4.1 After the mixing process, the soils
were placed in the oven and dried at 100°C for 48 hours. When removed from the oven
the modified clays were stored in airtight containers, until ready to be further processed.
- - - - - - - - - - - - - - - - - - - - - - - -
- - - - - - - - - - - - - - - - - - - - - - - - -
(a) (b)
WaterMolecules
PolymerChain
Clay Plate
Adsorbed Polymer
Figure 4.1 Clay Polymer Interaction (a) Not Heated (b) Heated
4.2.2 Grinding Technique
After the soils were dried in the oven at 100°C, processing was required to obtain
a powder form. This process was key to the properties exhibited by the clay. If the clay
particles were left too large, the water would only interact with the exterior surface,
greatly reducing the swelling characteristics and hence the performance of the clay.
When removed from the oven, the clay was in large, very hard clumps. Pounding
on the sample between two sheets of metal, as well as forcing it through a metal mesh
with a heavy hammer was the technique used to crush it into small pieces. The clay at
the beginning and the end of this process can be seen in Figure 4.2.
48

Figure 4.2 Clay Sample After Drying
The next phase of the grinding process involved one of the two mechanical
processes, which were a ball mill and a grinder. The ball mill contained 100 stainless
steel balls, which crushed the sample. The clay samples were placed in the ball mill and
permitted to crush for 24 hours. The powder was separated with a sieve and the
remaining large particles were placed back in the ball mill to crush for another 24-hour
period. This process was repeated until the entire sample was crushed.
(a) (b)
Figure 4.3 Mechanical Crushing: (a) Ball Mill (b) Grinder
A grinder was also used to crush samples and was found to be a highly efficient
because it was designed to reduce material to small particles. This method was very fast
and resulted in far less loss of material than the ball mill method for preparing the
modified clay sample.
49

Both the procedures for the grinder and the ball mill can be standardized to obtain
uniform sample production. The grinder has settings for coarseness, speed and the
number of passes through the machine that can be controlled. The ball mill does not offer
variable speeds, however the number of steel balls, as well as the tumbling time can be
modified. The clay was finally pulverized by hand with a mortar and pestle, to ensure a
fine powder and visually inspected to be homogeneous throughout. The grain size
distribution of the modified soils was not evaluated but the product was a very fine
powder, similar in texture to the original pure bentonite, see Figure 4.4. The powders
were stored in airtight containers prior to testing.
Figure 4.4 Modified Clay in Powder Form
4.3 Equipment
All the permeability tests were run in rigid wall permeameter cells. The basic
apparatus, ordered from CETEC was manufactured for the constant head permeability
test. The cell had to be modified to suite this experimental application. 3-inch inner
diameter, ¼ inch thick clear acrylic pipe was cut into 6-inch sections to serve as the rigid
wall of the permeameter. These sections were then marked with the height in millimeters
from the base of the cell to allow for of the change in head of the influent. The outflow
standpipes were made out of clear acrylic burettes with graduation marks to the 0.2 mL.
The burettes had an inner diameter of ½ inch and could hold up to 33 mL of effluent.
The burettes were permanently fixed to the cells and sealed using silicone sealant. The
50

top plate of the manufactured permeameter had an inlet value. A Swageloc fitting was
added to make the cell compatible with the pressure tubes.
Porous plates were used as a filter medium to maintain the consistency of the sample
during preparation and testing. The porous plates had to be modified to prevent any
channeling along the side of the rigid-wall and to avoid any material escaping during the
consolidation phase. The porous plates are 3-inches in diameter and ¼-inch thick, before
modification. A small groove was scored in the edge of each of the porous plates using a
handsaw. The purpose of cutting this groove was to seat an o-ring 2.5-in in diameter.
Silicone sealant was used create a good seal between the porous plate, o-ring and cell
wall. Two-inch diameter clear acrylic pipes were cut to use as an internal piston for
consolidation and template to ensure that when the cell was setup the maximum sample
thickness was constant at 7-mm for all tests. Figure 4.5 shows a diagram of the
permeameter after the modifications.
Clay Sample
Influent
Internal Piston/Template
Rigid Wall
Knobs
Pressure Inlet
Effluent
Outflow Pipe
Porous Plates
Figure 4.5 Permeability Cell
51
4.4 Permeability Measurement
4.4.1 Sample Preparation
The following procedure for the preparation of a sample was developed and all
samples were tested in this manner. The powdered modified clay was dried at 100˚C for
24 hours prior to weight measurement. Depending upon the test, 15 to 25 grams of dried
sample was weighed and 150 to 200 mL of deionized water was added. The sample was
prepared over its liquid limit to the consistency of thick slurry. Although the volume
swells greater than the final desired volume, it was required to ensure that sample is
entirely hydrated. The sample was mixed for approximately 40 minutes until
homogeneous, and covered for 24 hours to allow full hydration. This method was
adopted to allow for full saturation of the sample, which is outlined in the ASTM
standard.
The permeameter was then assembled placing one porous plate at the bottom of
the cell with a piece of P4 filter paper cut to size on top of it. To ensure that the exact
desired amount of material was placed in the cell, the difference of mass was taken. Since
both the original mass of soil and volume of water added were known, assuming the
mixture is homogenous, the exact amount of material added to the cylinder was
calculated through mass reduction. Depending upon the void ratio desired for the test,
either 10 or 20 grams (dry weight) was added to the cell. The sample was then placed into
the cell and another filter paper was wetted onto the top porous plate, which was fitted
into the top of the cell.
4.4.2 Consolidation Technique
The consolidation portion of the sample preparation was started by pushing the
porous plate to the surface of the slurry using the piston. The sample thickness, prior to
consolidation varied according to the amount and type of polymer used in the clay, as the
52

liquid limits varied and some were more prone to swell than others. A few inches of
water were added to both the influent and effluent sides of the sample to monitor the pore
fluid that was draining from the top and bottom of the sample during the consolidation
phase. The porous plate was placed at a 90° angle with the wall of the cell, which
ensured a good seal. The internal piston is centered on top of the porous plate and the top
portion of the cell was assembled. The effluent valve was ensured to be in the open
position. The screws were tightened very slowly to allow for pore water pressure inside
the sample to dissipate. The knobs were turned approximately 1/32 of a turn every 15 to
20 minutes or whenever the pressure had dissipated. The purpose of consolidating the
sample in this manner is to create an even distribution of the void ratio within the fully
saturated sample. The process of consolidation can be seen in Figure 4.6.
Figure 4.6 Consolidation of Sample in Permeameter
Once the permeameter was closed tightly with the piston inside, the sample
thickness was 7 mm. The top was removed, once all the pore water pressure had
dissipated and the water was removed from the cell. Any soil that was present above the
top porous plate was collected, dried and weighed. The weight was then subtracted from
the total mass of the sample for accurate determination of the void ratio. This minimal
loss occurred primarily at the beginning of the consolidation phase and was due to the
porous plate not having good contact with the cell initially.
53
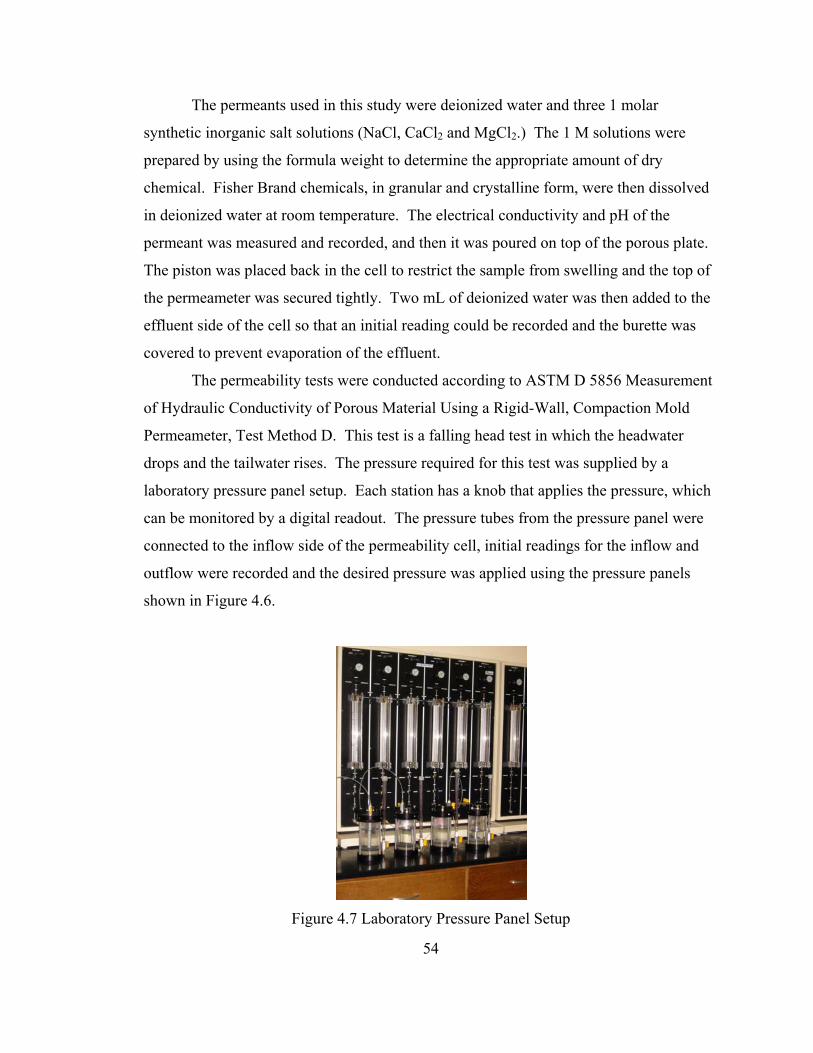
The permeants used in this study were deionized water and three 1 molar
synthetic inorganic salt solutions (NaCl, CaCl2 and MgCl2.) The 1 M solutions were
prepared by using the formula weight to determine the appropriate amount of dry
chemical. Fisher Brand chemicals, in granular and crystalline form, were then dissolved
in deionized water at room temperature. The electrical conductivity and pH of the
permeant was measured and recorded, and then it was poured on top of the porous plate.
The piston was placed back in the cell to restrict the sample from swelling and the top of
the permeameter was secured tightly. Two mL of deionized water was then added to the
effluent side of the cell so that an initial reading could be recorded and the burette was
covered to prevent evaporation of the effluent.
The permeability tests were conducted according to ASTM D 5856 Measurement
of Hydraulic Conductivity of Porous Material Using a Rigid-Wall, Compaction Mold
Permeameter, Test Method D. This test is a falling head test in which the headwater
drops and the tailwater rises. The pressure required for this test was supplied by a
laboratory pressure panel setup. Each station has a knob that applies the pressure, which
can be monitored by a digital readout. The pressure tubes from the pressure panel were
connected to the inflow side of the permeability cell, initial readings for the inflow and
outflow were recorded and the desired pressure was applied using the pressure panels
shown in Figure 4.6.
Figure 4.7 Laboratory Pressure Panel Setup
54

Readings of the inflow, outflow and pressure were recorded periodically. When
the volume of the outflow was sufficient, the leached sample was removed completely
from the burette using a small pipette and the electrical conductivity and pH were
measured using the Accumet AB30, 4-cell conductivity meter and the Accumet AP63 pH
meter. Deionized water was added to bring the level to 2 mL, just as in the beginning of
the test. Each of the effluent samples was diluted with 2-mL of deionized water due the
initial condition required. The necessary calculations to consider this dilution were taken
in to account. To examine the effect of the gradient the pressure was varied over the
course of the tests. After the permeability stabilized, the pressure was increased to
increase the gradient across the sample.
According to the ASTM, the test was halted when there were less than a 25%
change in four or more consecutive values of hydraulic conductivity. Also, 2-pore water
flows were considered the minimum flow quantity prior to the termination of any test.
55

CHAPTER 5
TESTS AND RESULTS
5.1 Swell Index
The swelling of a clay is caused by the type of cation adsorbed on the surface and the
interaction between the cations, clay surface and water molecules. The effect of the
polymer to the swell property must be evaluated to ensure that the ability to form a seal is
not too greatly diminished. The test method used for quantifying the swelling property
for use in geosynthetics clay liners is ASTM D 5890 - Standard Test Method for Swell
Index of Clay Mineral Component of Geosynthetic Clay Liners. This index tests is useful
for establishing the relative quality of the swell properties of the modified clay mineral,
as well as assessing its compatibility with a permeant liquid.
The test was performed on each of the modified clay powders prepared at 1 wt%
and heated to 100°C. Deionized water was used as the control and tests were run in
solutions of NaCl, KCl, CaCl2, and MgCl2 to assess the effect on the swelling properties
due to the collapse of the diffuse double layer. The concentration of these solutions was
varied to demonstrate the effect of molarity on the size of the diffuse double layer.
Prior to the test all samples were oven dried for 24 hours at 100˚C to ensure that
most of the water was removed from the sample. Solutions were prepared at 0.01 M, 0.1
M and 1M and 90 mL of each was placed in a 100 mL graduated cylinder. As specified
in ASTM D 5890, 2 grams of the soil was weighed out for each cylinder. Every ten
minutes, 0.1 gram of the soil was sprinkled slowly over the surface of the solution until
all of the 2 grams had been added. Then additional solution was added to raise the
56

volume to 100 mL. The temperature was then recorded and the cylinder covered to sit
undisturbed for an additional 20 hours and hydrate, shown in Figure 5.1. After this
period, the temperature was taken and the free swell volume of the hydrated clay mineral
was then recorded in units of mL/2g.
Figure 5.1 Hydrated Swell Volume
Figure 5.2 shows the affect of the polymer treatment on the swell index of the
clay in deionized water. There is little differentiation between the affects of different
types of polymer treatment, but overall the presence of polymer reduces the free swell
capacity of the clay sample. The heated bentonite was mixed in a slurry, heated and
processed exactly as the modified soils, only without the addition of any polymers. This
shows that the preparation of the clay samples accounts for a significant portion of this
reduced swelling behavior.
57
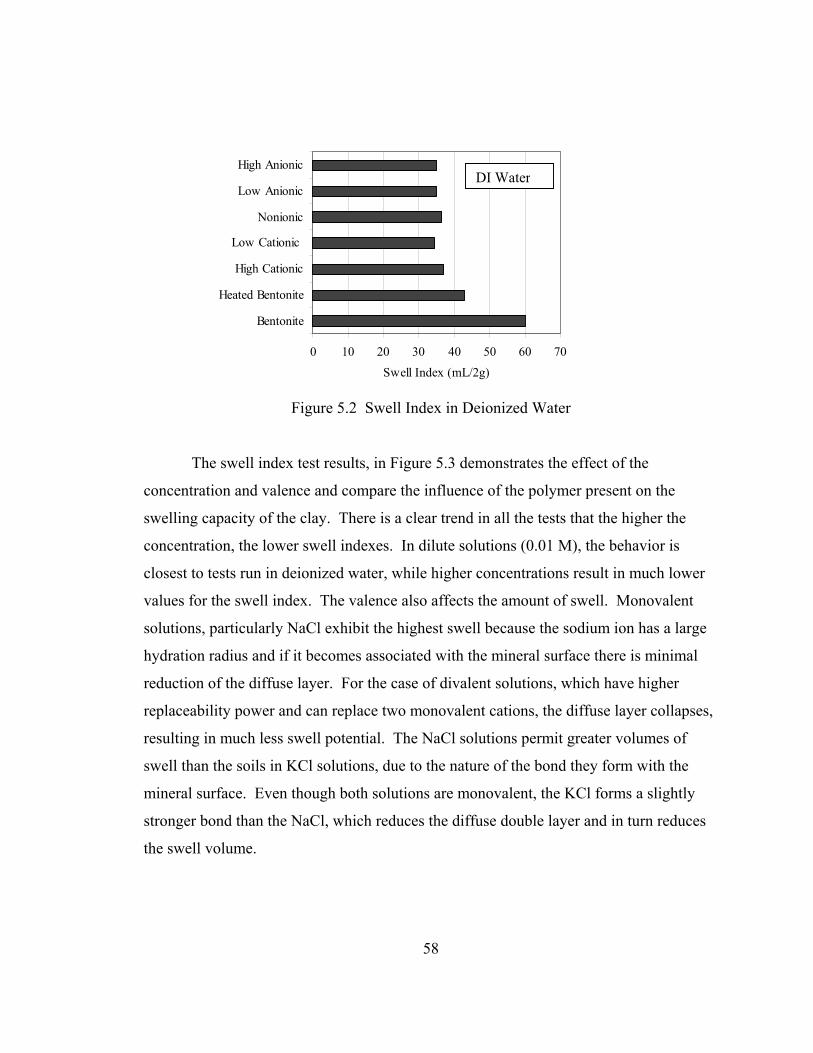
0 10 20 30 40 50 60 70
Bentonite
Heated Bentonite
High Cationic
Low Cationic
Nonionic
Low Anionic
High Anionic
Swell Index (mL/2g)
DI Water
Figure 5.2 Swell Index in Deionized Water
The swell index test results, in Figure 5.3 demonstrates the effect of the
concentration and valence and compare the influence of the polymer present on the
swelling capacity of the clay. There is a clear trend in all the tests that the higher the
concentration, the lower swell indexes. In dilute solutions (0.01 M), the behavior is
closest to tests run in deionized water, while higher concentrations result in much lower
values for the swell index. The valence also affects the amount of swell. Monovalent
solutions, particularly NaCl exhibit the highest swell because the sodium ion has a large
hydration radius and if it becomes associated with the mineral surface there is minimal
reduction of the diffuse layer. For the case of divalent solutions, which have higher
replaceability power and can replace two monovalent cations, the diffuse layer collapses,
resulting in much less swell potential. The NaCl solutions permit greater volumes of
swell than the soils in KCl solutions, due to the nature of the bond they form with the
mineral surface. Even though both solutions are monovalent, the KCl forms a slightly
stronger bond than the NaCl, which reduces the diffuse double layer and in turn reduces
the swell volume.
58
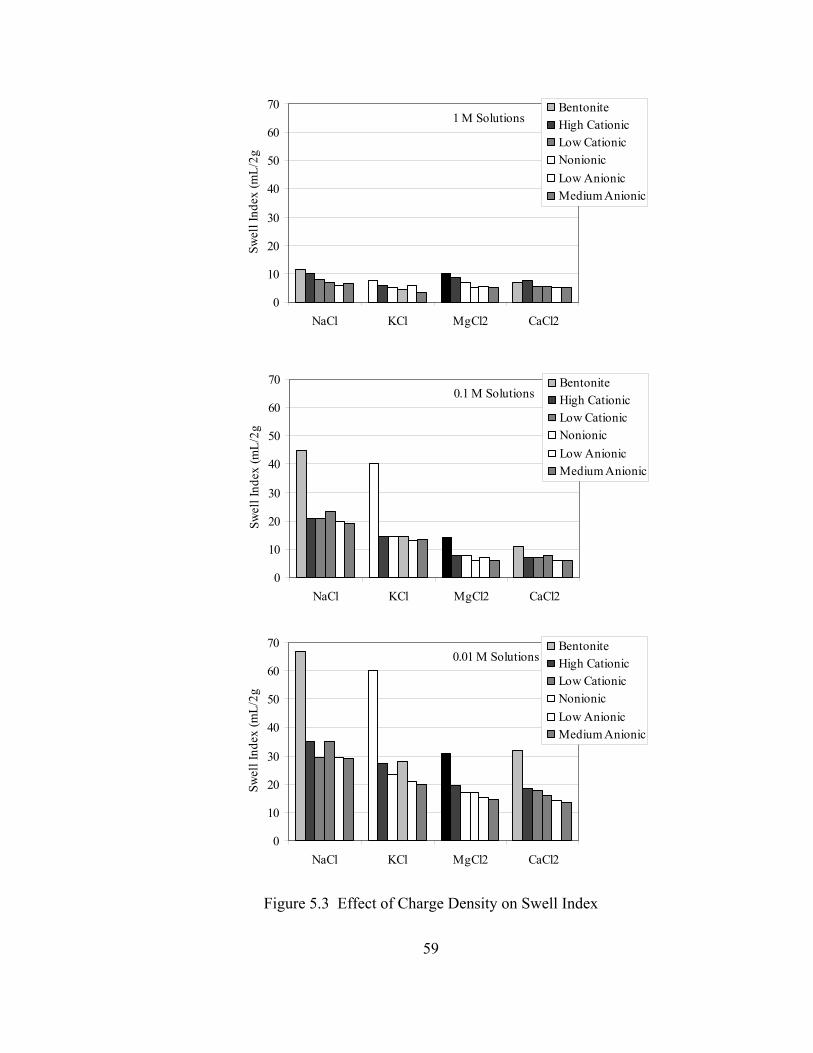
0
10
20
30
40
50
60
70
NaCl KCl MgCl2 CaCl2
Swel
l Ind
ex (m
L/2g
BentoniteHigh CationicLow CationicNonionicLow AnionicMedium Anionic
1 M Solutions
0
10
20
30
40
50
60
70
NaCl KCl MgCl2 CaCl2
Swel
l Ind
ex (m
L/2g
BentoniteHigh CationicLow CationicNonionicLow AnionicMedium Anionic
0.1 M Solutions
0
10
20
30
40
50
60
70
NaCl KCl MgCl2 CaCl2
Swel
l Ind
ex (m
L/2g
BentoniteHigh CationicLow CationicNonionicLow AnionicMedium Anionic
0.01 M Solutions
Figure 5.3 Effect of Charge Density on Swell Index
59

The influence of polymer charge is also demonstrated in Figure 5.4. This
particular data set is for high cationic and medium anionic polymer treated clays tested in
the three concentrations and the swell volumes are plotted as a function of the type of
solution. It can be seen that the slope, which has a downward trend, decreases as the
molarity increases. It can be seen that the 1M KCl has a larger impact on the swell than
the divalent solutions for both the cationic and the anionic solutions. This trend is not
observed in bentonite, so it may be attributed to the presence of the polymer. The
cationic polymer clay consistently shows superior swelling potential. This indicates that
the anionic polymer contributes to the reduction of the diffuse layer more than the
cationic polymer. This could also be a sign that the cationic polymer has a greater
affinity for water.
Figure Effect of Polymer Charge on Swell Index L
05
10152025303540
0 1 2 3 4 5
iquid solution
i
0.01 M - Anionic0.01 M - Cationic 0.1 M - Anionic0.1 M - Cationic 1 M -Anionic1 M - Cationic
NaCl KCl MgCl2 CaCl2
Swel
lng
Inde
x m
L/2
Swel
lInd
ex(m
L/2g
)
Figure 5.4 Effect of Polymer on Swell Volume
There are several possible sources of inconsistency for the swell index test such as
failing to spread the clay evenly over the surface, friction between the graduated cylinder
and the soil and possibly not waiting adequate time for hydration. Bentonite clay can
exhibit swelling up to 400 hours (Lin, 1998), but ASTM suggests only a 16-hour period
for hydration. Additional swell index experimental data can be found in Appendix C.
60

5.2 Liquid Limit
The liquid limit test was performed on all the modified clays. The ASTM
Standard, which outlines the Casagrande method, cannot be performed effectively on
bentonite, so the British standard of the Cone Penetration Test was followed. The cone
penetration apparatus has a dial gage that measures the displacement of a free-falling
cone into a soil sample. The weight of the cone is calibrated such that when the
displacement is equal to 20 mm, the soil has reached the liquid limit. The procedure was
repeated at increasing water contents, with at least two displacements below and two
displacements above 20 mm. The series of data was plotted to obtain the liquid limit.
Clays were prepared with 0.5 wt% and 1.0 wt% polymer for testing. Two sets of
samples were tested (1) immediately after being mixed and hydrated and (2) after being
oven dried at 100°C for at least 24 hours and prepared as described in Chapter 4. Figure
5.5 groups the polymer by charge and charge density and shows the effect of weight %
polymer and heat. Additional test results can be found in Appendix C.
An increase in weight percent of these polymers lead to an increase in the liquid
limit in all cases for anionic and nonionic clays. This trend was maintained even after
heating, the samples containing 1.0 wt% had a higher liquid limit than samples of 0.5
wt%. This similarity in behavior may be related to the types of polymer. The nonionic
and anionic polymers have a very similar poly(acrylic acid) structural backbone, but
difference in charge. The results show that the difference charge density between
medium and low anionics had a minimal impact. When compared to the liquid limit of
pure bentonite for the non-heated case, the addition of anionic polymers increased the
liquid limit. This was not true, however when the heated samples were compared with
the heated pure bentonite, as decrease in liquid limit was measured. The nonionic
polymer in the unheated case had the most notable influence on the liquid limit, but when
heated the behavior was similar to that of the anionic modified clays.
The behavior of the cationic modified clay was different than the others and no
notable trend could be observed. The amount of polymer did not consistently change the
liquid limit, nor did the charge density of the polymer. The high cationic reduced the
61

liquid limit below that of pure bentonite, while the values increased for the low cationic.
Even the amount of polymer added did not display results consistent with the trend for
anionic clay. The liquid limit increased with increasing polymer content for the low
cationic, but decreased with increasing polymer content for the high cationic. Although,
both are cationic the polymers they have different structures, which could be responsible
for the inconclusive trends. Another probable reason for this data is the polymers affinity
for water, which may be different for these polymers. Unlike the others, the high cationic
did not display a large reduction in liquid limit from non-heated to heated, which may
indicate that polymer exchange for the hydrated ions took place in the non-heated case.
0
200
400
600
800
1000
1200
MediumAnionic
Low Anionic Nonionic Low Cationic High Cationic
LL (%
)
0.5 wt% Polymer1.0 wt% Polymer0.5 wt% Polymer Heated1.0 wt% Polymer Heated
Figure 5.5 Experimental Values of Liquid Limits
Table 5.1 Experimental Values of Liquid Limits
Weight % High Anionic
Low Anionic Nonionic Low
Cationic High
Cationic 0.5 – Not Heated 626.37 635.12 908.03 626.7 533.5 1.0 – Not Heated 651.57 671.63 1004.27 691.94 498.04
0.5 – Heated 421.37 402.95 382.02 411.02 382.02 1.0 - Heated 460.41 525.79 457.6 291.44 419.26
62
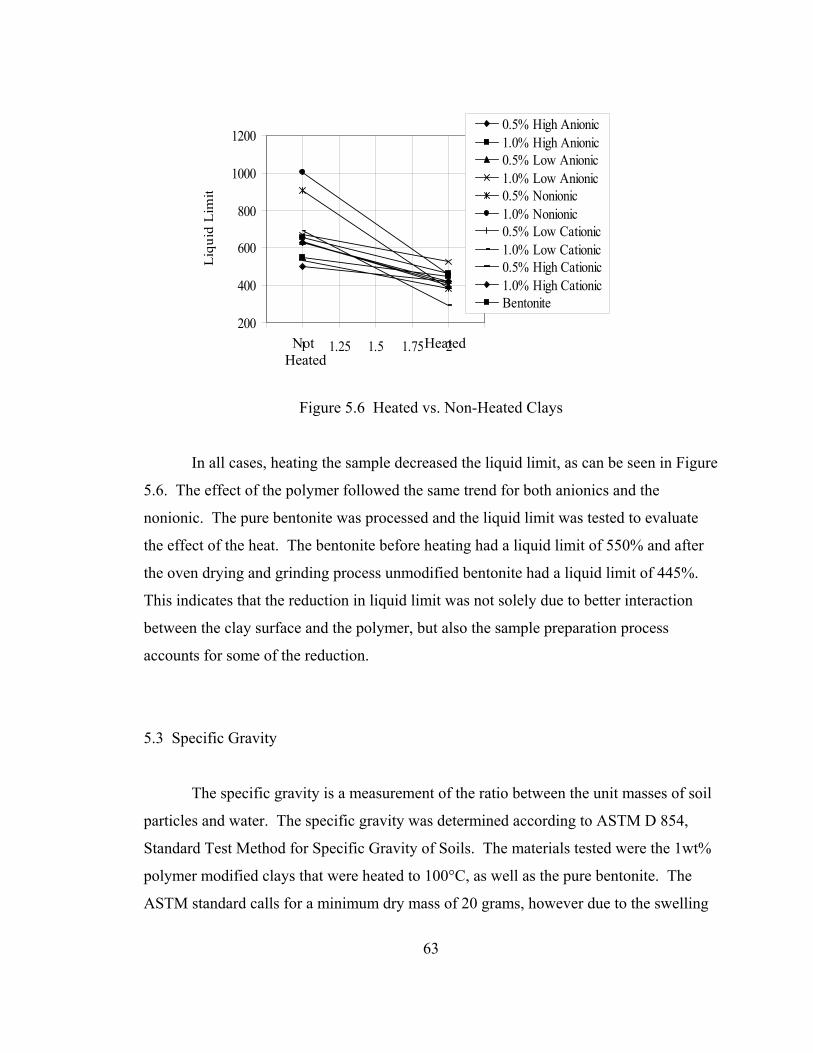
200
400
600
800
1000
1200
0.75 2.25
Liq
uid
Lim
it
0.5% High Anionic1.0% High Anionic0.5% Low Anionic1.0% Low Anionic0.5% Nonionic1.0% Nonionic0.5% Low Cationic1.0% Low Cationic0.5% High Cationic1.0% High CationicBentonite
1 1.25 1.5 1.75 2 Not Heated Heated
Figure 5.6 Heated vs. Non-Heated Clays
In all cases, heating the sample decreased the liquid limit, as can be seen in Figure
5.6. The effect of the polymer followed the same trend for both anionics and the
nonionic. The pure bentonite was processed and the liquid limit was tested to evaluate
the effect of the heat. The bentonite before heating had a liquid limit of 550% and after
the oven drying and grinding process unmodified bentonite had a liquid limit of 445%.
This indicates that the reduction in liquid limit was not solely due to better interaction
between the clay surface and the polymer, but also the sample preparation process
accounts for some of the reduction.
5.3 Specific Gravity
The specific gravity is a measurement of the ratio between the unit masses of soil
particles and water. The specific gravity was determined according to ASTM D 854,
Standard Test Method for Specific Gravity of Soils. The materials tested were the 1wt%
polymer modified clays that were heated to 100°C, as well as the pure bentonite. The
ASTM standard calls for a minimum dry mass of 20 grams, however due to the swelling
63
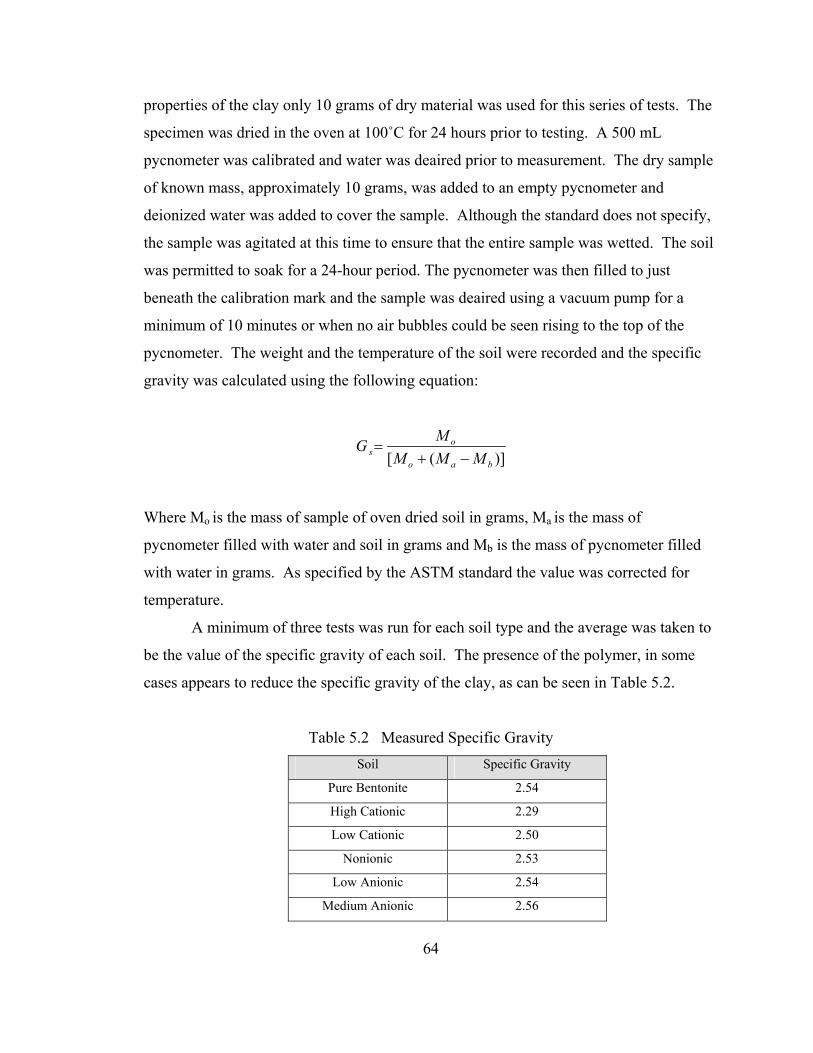
properties of the clay only 10 grams of dry material was used for this series of tests. The
specimen was dried in the oven at 100˚C for 24 hours prior to testing. A 500 mL
pycnometer was calibrated and water was deaired prior to measurement. The dry sample
of known mass, approximately 10 grams, was added to an empty pycnometer and
deionized water was added to cover the sample. Although the standard does not specify,
the sample was agitated at this time to ensure that the entire sample was wetted. The soil
was permitted to soak for a 24-hour period. The pycnometer was then filled to just
beneath the calibration mark and the sample was deaired using a vacuum pump for a
minimum of 10 minutes or when no air bubbles could be seen rising to the top of the
pycnometer. The weight and the temperature of the soil were recorded and the specific
gravity was calculated using the following equation:
)]([ bao
os MMM
MG−+
=
Where Mo is the mass of sample of oven dried soil in grams, Ma is the mass of
pycnometer filled with water and soil in grams and Mb is the mass of pycnometer filled
with water in grams. As specified by the ASTM standard the value was corrected for
temperature.
A minimum of three tests was run for each soil type and the average was taken to
be the value of the specific gravity of each soil. The presence of the polymer, in some
cases appears to reduce the specific gravity of the clay, as can be seen in Table 5.2.
Table 5.2 Measured Specific Gravity Soil Specific Gravity
Pure Bentonite 2.54
High Cationic 2.29
Low Cationic 2.50
Nonionic 2.53
Low Anionic 2.54
Medium Anionic 2.56
64

The values of the specific gravity less than that value determined for bentonite
indicate a less dense configuration. This is similar the behavior observed in
organobentonites, which has been attributed to the intercalation of the large organic
molecules (Redding and Burns, 2000). The anionic and nonionic modified clays showed
little change from the measured value of pure bentonite. The medium anionic polymer
slightly increased the specific gravity. The cationic polymers reduced the specific
gravity, with the high charge density polymer reducing it significantly. It is possible that
the high cationic separated the crystal structure upon entering the interlayer creating a
less dense crystalline arrangement and thus a lower specific gravity.
5.4 Permeability Tests
The test setup and methods were conducted as described in Chapter 4 for all the
permeability tests. The following section describes the test measurements and presents
the data collected.
5.4.1 Permeant Solutions
The base line permeant was deionized water and the other permeants were all 1 M
synthetic inorganic solutions, which were selected to simulate the aggressive chemical
environment of a landfill. The effect of cation valence and size on the hydraulic
performance of the modified bentonite is evaluated. The NaCl is monovalent with a large
hydrated ion radius, while CaCl2 and MgCl2 are divalent, with different hydrated ion
sizes. Only permeation with a single salt species at a constant concentration of 1 M was
evaluated in this study.
65

5.4.2 Test Measurements
The tests were performed on all samples to evaluate the effect of polymer
treatment. The procedure outlined in Chapter 4 was followed to run all tests. The
measurements of inflow height, outflow volume and time were used to calculate the
permeability using the following equation as outlined by the ASTM Standard for this
experimental setup:
( )
+
=2
1
outin
outin
hhln
aaAtLaak
where h1 = (h1-h2)initial + [(P1-P2)/ρw]initial and the h2 = (h1-h2)final + [(P1-P2)/ρw]final. Since
the outflow of the permeameter is graduated to record the volume, an extra conversion
had to change this measurement into a head. Figure 5.7 shows how these measurements
were made from this test set up. The value of Pout is equal to zero and the cross sectional
area of the inflow, ain is equal to the cross sectional area of the sample, A.
P2
aout
ain
h1 A
L
P1
h2
Figure 5.7 Permeability Measurement Values
66

The factors varied during the permeability tests included permeant liquid, void
ratio, first wetting solution and gradient. Since the aim of this investigation is to asses the
polymers influence on the hydraulic performance when permeated with inorganic
solutions, deionized water was used as the base line permeant for all the tests. All
permeability test results are presented in Appendix A. The permeability data is reported
as a function of the pore volumes of flow and duration of the test. Some of the plots
contain points that are inconsistent with the general trends of the graph. These points can
be attributed to pressure fluctuations caused by the pressure panel. Particular scatter is
observed in the initial data points, which coincide with lower gradients. Generally, the
data is more stable at gradients of 500 and above.
There were several tests performed. To organize the data and obtain a clear
picture of the effectiveness of the polymer treatment, the results are grouped according to
the experimental variables, which are permeant, first wetting solution, void ratio, and
polymer.
5.4.3 Permeant
Figure 5.8 shows the results of the high cationic clay at a void ratio of 7.14,
permeated with each of the permeant solutions. The test with CaCl2 was carried out to 12
pore volumes of flow to obtain the termination criterion. This demonstrates the effect of
the valence and hydrated ion size of the permeant on the coefficient of permeability.
Deionized water had the lowest permeability of 3.43x10⁻⁹ cm/s, followed by NaCl, MgCl2
and CaCl2, which were 1.45x10⁻⁸ cm/s, 1.09x10⁻⁷ cm/s and 3.93x10⁻⁸ cm/s, respectively.
This follows the same trend as the replaceability power. The divalent cations replace the
natural sodium and collapse the double layer. The behavior of the high cationic modified
soil with respect to the valence of the permeant is similar to the behavior reported for
GCL bentonite. Aside from pressure fluctuations, stable values of permeability were
observed after 2 pore volumes of flow.
67

1.0E-10
1.0E-09
1.0E-08
1.0E-07
1.0E-06
1.0E-05
0.0 2.0 4.0 6.0 8.0 10.0
Pore volume
Coe
ffici
ent o
f per
mea
bilit
y, k
(cm
/s)
DI WaterNaClMgCl2CaCl2
High Cationice = 7.14 Continued to 12
pore volumes
Figure 5.8 Effect of Valence on High Cationic Modified Clay
It can be seen from Figure 5.9 that the low cationic clay at a lower void ratio of
3.07 had a slightly different trend. The MgCl2 permeant results in the highest
permeability value of 2.78x10⁻⁹ cm/s. The CaCl2 has a lower permeability of 7.05x10⁻¹⁰
cm/s followed by the deionized water with a permeability of 2.35x10⁻¹⁰ cm/s. The data
was fairly unstable until about 1 pore volume of flow, when the gradient for the MgCl2
and CaCl2 was increased. The MgCl2 test was carried out to 12.5 pore volumes of flow.
1.0E-11
1.0E-10
1.0E-09
1.0E-08
1.0E-07
0.0 1.0 2.0 3.0 4.0 5.0 6.0
Pore volume
Coef
ficien
t of p
erm
eabi
lity,
k (c
m/s)
.
DI WaterMgCl2CaCl2
Low Cationice = 3.07
Continued to 12.5 pore volumes
Figure 5.9 Effect of Valence on Low Cationic Modified Clay
68

The nonionic clay was tested with deionized water and CaCl2 at void ratios of
3.07 and 3.14, as shown in Figure 5.10. There was a slight difference in the void ratio
due to a small amount of material loss during the consolidation phase of the sample
preparation. The increase in the coefficient of permeability when exposed to divalent
CaCl2 is from 1.61x10⁻¹⁰ to 3.49x10⁻¹⁰ cm/s. The effect of the polymer interaction may be
responsible for the minimal increase in hydraulic conductivity when exposed to divalent
solution.
1.0E-11
1.0E-10
1.0E-09
1.0E-08
1.0E-07
0.0 1.0 2.0 3.0 4.0
Pore volume
Coe
ffici
ent o
f per
mea
bilit
y, k
(cm
/s)
DI Water, e=3.07CaCl2, e=3.14
Nonionic
Figure 5.10 Effect of Valence on Nonionic Modified Clay
At a void ratio of 3.07, the low anionic clay was permeated with deionized water,
NaCl and CaCl2 and the results are shown in Figure 5.11. The hydraulic performance
when permeated with NaCl and CaCl2 is essentially the same, having coefficient of
permeability values of 2.8x10⁻⁹ cm/s and 2.95x10⁻⁹ cm/s. The deionized water permeant
resulted in a lower value 1.28x10⁻⁹ cm/s. The scatter in the initial portion of the
deionized water data was due to pressure panel fluctuations at the low pressure, which
stabilized at higher gradients.
69

1.0E-10
1.0E-09
1.0E-08
1.0E-07
0.0 1.0 2.0 3.0 4.0 5.0 6.0 7.0
Pore volume
Coe
ffici
ent o
f per
mea
bilit
y, k
NaClCaCl2DI Water
Low Anionice = 3.07
Figure 5.11 Effect of Valence on Low Anionic Modified Clay
Figure 5.12 shows the test results for medium anionic modified clay permeated
with deionized water, NaCl and CaCl2 at a void ratio of 3.07. The test with NaCl solution
results in the lowest permeability of 8.11x10⁻¹¹ cm/s. The deionized water gives
1.85x10⁻¹⁰ cm/s and CaCl2, 3.58x10⁻¹⁰ cm/s. The medium anionic maintained a low
hydraulic conductivity and the variation when permeated with different solutions was
within one order of magnitude. It is interesting to note that the NaCl permeant resulted in
significantly lower hydraulic conductivities for the medium anionic. Although the
variation is small, it is different than what is typically observed in pure bentonite samples.
This is possibly due to the negative polymer’s association with the hydrated NaCl cation.
1.0E-11
1.0E-10
1.0E-09
1.0E-08
0.0 0.5 1.0 1.5 2.0 2.5
Pore volume
Coe
ffici
ent o
f per
mea
bilit
y, k
DI WaterNaClCaCl2
Medium Anionice = 3.07
Figure 5.12 Effect of Valence on Medium Anionic Modified Clay
70

5.4.4 First Wetting Solution
Figure 5.13 demonstrates the effect of first wetting solution and pre-hydration.
The modified clays were mixed directly with a 1M solution of CaCl2 and permeated with
the same chemical. The sample preparation followed the same procedure; however
instead of adding deionized water to create a slurry, 1M CaCl2 was used. The samples
were consolidated in the same manner and the fluid dissipated from the pores was
discarded and replaced with fresh 1M CaCl2.
1.0E-09
1.0E-08
1.0E-07
1.0E-06
1.0E-05
1.0E-04
0.0 5.0 10.0 15.0 20.0
Pore volume
Coe
ffici
ent o
f per
mea
bilit
y, k
(cm
/s)
High Cationic, e=3.07Nonionic, e=3.07Medium Anionic, e=3.07Bentonite, e = 3.07Permeant: CaCl2
Figure 5.13 Effect of Pre-hydration Condition
A significant increase in the hydraulic conductivity was observed and the polymer
was not found to enhance the performance of the clay. When compared to the pre-
hydrated condition increase ranged from one up to four orders of magnitude as shown in
Table 5.3 and Figure 5.14. This comparison demonstrates changes in clay fabric
formation, when exposed directly to divalent cations. Overall, it is clear that the
hydration is key to the formation of the dispersed particle arrangement required to
maintain low values of permeability. The cationic had similar measurements of
permeability to pure bentonite, while all the treatment with the other polymers tested
71
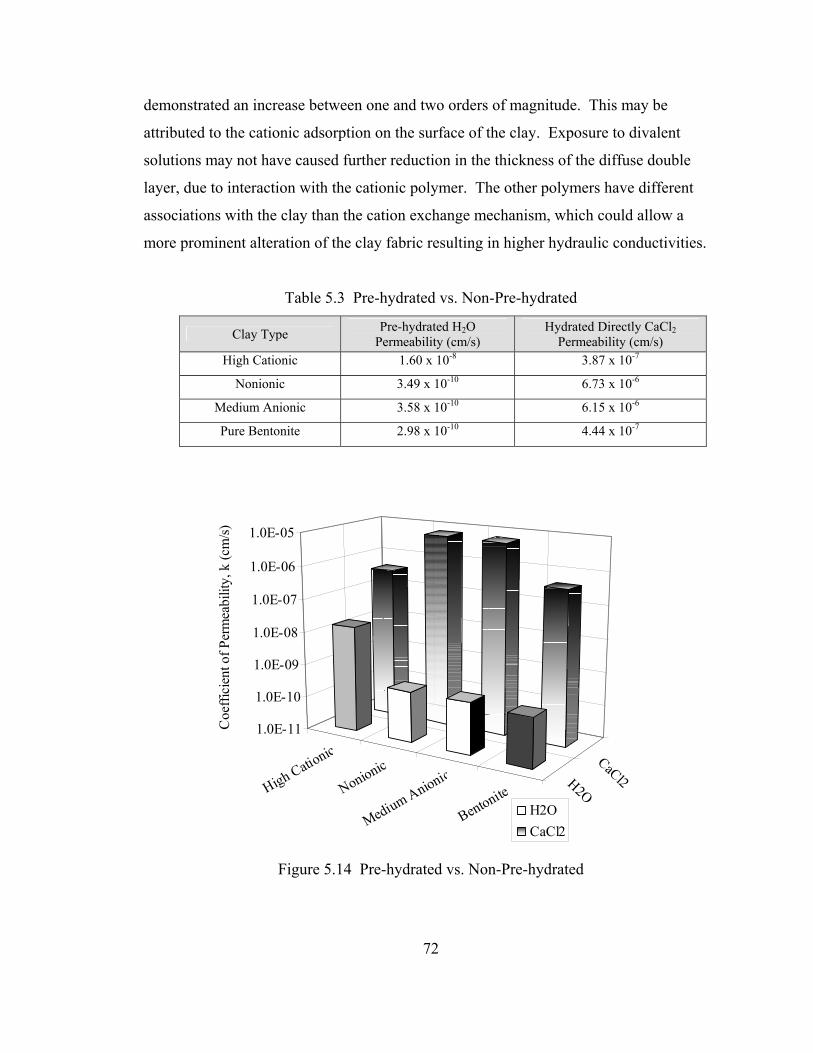
demonstrated an increase between one and two orders of magnitude. This may be
attributed to the cationic adsorption on the surface of the clay. Exposure to divalent
solutions may not have caused further reduction in the thickness of the diffuse double
layer, due to interaction with the cationic polymer. The other polymers have different
associations with the clay than the cation exchange mechanism, which could allow a
more prominent alteration of the clay fabric resulting in higher hydraulic conductivities.
Table 5.3 Pre-hydrated vs. Non-Pre-hydrated
Clay Type Pre-hydrated H2O Permeability (cm/s)
Hydrated Directly CaCl2 Permeability (cm/s)
High Cationic 1.60 x 10⁻⁸ 3.87 x 10⁻⁷
Nonionic 3.49 x 10⁻¹⁰ 6.73 x 10⁻⁶
Medium Anionic 3.58 x 10⁻¹⁰ 6.15 x 10⁻⁶
Pure Bentonite 2.98 x 10⁻¹⁰ 4.44 x 10⁻⁷
High Cationic
Nonionic
Medium Anionic
BentoniteH2O
CaCl2
1.0E-11
1.0E-10
1.0E-09
1.0E-08
1.0E-07
1.0E-06
1.0E-05
H2OCaCl2
Coe
ffici
ent o
f Per
mea
bilit
y, k
(cm
/s)
Figure 5.14 Pre-hydrated vs. Non-Pre-hydrated
72

5.4.5 Void Ratio
The void ratio effect on the hydraulic conductivity of the modified clays was
evaluated by examining two conditions. The void ratios were determine by calculating
the oven-dried weight of the sample, specific gravity and the volume the soil occupied,
which was constant due to the permeability cell setup. The oven-dried weights chosen
for this study were 10 grams and 20 grams, which gave void ratios of 7.14 and 3.07,
respectively. In every test run, regardless of the polymer treatment the void ratio of the
soil greatly influence the measurement of permeability. This is consistent with results of
previous research conducted at the University of South Florida on pure bentonite
samples. This effect is likely to be more prominent in the treated clays, because of their
diminished swell capacity. Bentonite samples were not tested for their change in
hydraulic conductivity due to void ratio changes.
Figure 5.15 compares the effects of void ratio for the high cationic, nonionic and
medium anionic when permeated with deionized water. The effect of void ratio
demonstrates a clear trend; the higher the void ratio, the higher the hydraulic
conductivity. The values of permeability for all the modified clays at a lower void ratio
are all very similar, given in Table 5.4; however at higher void ratios some variability can
be observed. The change in void ratio had the most effect on the nonionic clay, followed
by the high cationic and the medium anionic clays.
1.0E-11
1.0E-10
1.0E-09
1.0E-08
1.0E-07
0.0 0.5 1.0 1.5 2.0 2.5 3.0 3.5
Pore volume
High Cationic, e = 3.07High Cationic, e = 7.14Nonionic, e = 3.07 Nonionic, e = 7.14Medium Anionic, e = 3.07Medium Anionic, e = 7.14
Permeant: DI H2O
Coe
ffic
ient
of p
erm
eabi
lity,
k.C
oeff
icie
nt o
f Per
mea
bilit
y, k
(cm
/s)
Figure 5.15 Effect of Void Ratio on Modified Clay Permeated with DI Water
73

Table 5.4 Effect of Void Ratio With Deionized Water Permeant
Modified Clay e = 3.07 e = 7.14
High Cationic 1.66x10⁻¹⁰ 3.43x10⁻⁹
Nonionic 1.61x10⁻¹⁰ 5.20x10⁻⁹
Medium Anionic 1.56x10⁻¹⁰ 1.51x10⁻⁹
When permeated with a divalent solution (CaCl2) the same trend occurs, however
the extent of influence was less than with water, shown in Figure 5.16. It would be
expected that the effect of void ratio would be less prominent in deionized water than in
ionic solutions due to changes in the clay fabric, but this was not observed. The
permeability was fairly high when compared to the other modified clays. Although the
performance was not enhanced, this demonstrates that polymer-clay interaction took
place. The cationic polymer adsorbed on the surface may create a fabric that is less
sensitive to the change in void ratio. It is that the polymer clay system may cause a
different redistribution of voids upon exposure to the divalent solution, compared to
unmodified bentonite.
74
1.0E-10
1.0E-09
1.0E-08
0.0 5.0 10.0 15.0
Pore volume
e = 3.17e = 7.14
1.0E-07
1.0E-06
1.0E-05 High CationicPermeant: CaCl2
Coe
ffici
ent o
f per
mea
bilit
y, k
Coe
ffic
ient
of P
erm
eabi
lity,
k (c
m/s
)
Figure 5.16 Effect of Void Ratio on High Cationic Clay Permeated with CaCl2

The nonionic clay was permeated with CaCl2 at the two void ratios and the results
are shown in Figure 5.17. As with all the other tests, the trend of increasing permeability
with increasing void ratio is observed. Similar to the test permeated with DI water, the
variation between the hydraulic conductivity for the two void ratios is most prominent
with nonionic clay than the high cationic clay. The nonionic clay’s permeability changed
from 2.45x10⁻⁹ at a void ratio of 7.14 to 3.49x10⁻¹⁰ at a void ratio of 3.07.
1.0E-10
1.0E-09
1.0E-08
1.0E-07
0.0 1.0 2.0 3.0 4.0 5.0 6.0
Pore volume
e = 3.17e = 7.14
NonionicPermeant: CaCl2
Coe
ffici
ent o
f per
mea
bilit
y, k
Coe
ffic
ient
of P
erm
eabi
lity,
k (c
m/s
)
Figure 5.17 Effect of Void Ratio on Nonionic Clay Permeated with CaCl2
5.4.6 Polymer Charge
All the modified soils and bentonite at a void ratio of 3.07 were permeated with
deionized water. With the exception of the low anionic clay, which had a higher
coefficient of permeability, all the clays performed relatively the same. The high
cationic, medium anionic and nonionic actually performed slightly better than the
unmodified bentonite. A trend can be observed in the permeability measurements of
initially higher values until the values stabilize. This is likely due to a redistribution of
the voids.
75

1.0E-10
1.0E-09
1.0E-08
0.0 0.5 1.0 1.5 2.0 2.5 3.0 3.5
Pore volume
Coe
ffici
ent o
f per
mea
bilit
y, k.
Low CationicHigh CationicLow AnionicMedium AnionicBentoniteNonionic
Permeant: H2Oe = 3.07
Figure 5.18 Effect of Polymer Clay Permeated with H2O
In the presence of 1M CaCl2 and increase in the coefficient of permeability was
noted for all the modified soils, as well as the bentonite. This was expected due to the
valence and hydrated ion size of the CaCl2. The medium anionic and nonionic modified
clays maintained reasonably low hydraulic conductivity despite the exposure to a divalent
solution. The low anionic clay did not perform well in comparison to the unmodified
bentonite. The hydraulic conductivity of the high cationic soil, which is not shown in the
Figure 5.18, increased two orders of magnitude, indicating a diminished double layer.
Figure 5.19 Effect of Polymer When Permeated With CaCl2
1.0E-10
1.0E-09
1.0E-08
0.0 0.5 1.0 1.5 2.0 2.5 3.0 3.5 4.0 4.5 5.0
Pore volume
Coe
ffici
ent o
f per
mea
bilit
y, k.
Low CationicMedium AnionicBentoniteNonionic Low Anionic
Permeant: CaCl2e = 3.07
Continued to 9 pore volumes
76

Figure 5.19 compares the performance according to the variation in charge of the
polymer used to treat the bentonite. It can be seem that the high cationic and the low
anionic clays do not improve the performance of unmodified bentonite. Both soils have
significant increases in permeability when exposed to CaCl2. All the treated soils
maintained similar hydraulic conductivity when permeated with deionized water, with the
exception of the low anionic polymer, which increased the hydraulic conductivity.
1.0E-11 1.0E-10 1.0E-09 1.0E-08 1.0E-07
High Cationic
Low Cationic
Nonionic
Low Anionic
Medium Anionic
Bentonite
Coefficient of Permeability, k (cm/s)
CaCl2H2O
e = 3.07
Figure 5.20 Effect of Polymer
Table 5.5 Effect of Polymer and Permeant on Hydraulic Conductivity
Permeant High Cationic
Low Cationic Nonionic Low
Anionic Medium Anionic Bentonite
H2O 1.66E-10 2.34E-10 1.61E-10 1.28E-09 1.85E-10 2.98E-10 CaCl2 1.60E-08 7.05E-10 3.49E-10 2.95E-09 3.58E-10 7.33E-10
5.4.7 Gradient
Laboratory hydraulic gradients should duplicate field conditions; however testing
would take an unacceptable amount of time, so gradients are increased. The increase can
cause uneven consolidation resulting in inaccurate values of permeability resulting in
erroneously low values for the permeability. To evaluate the influence of the gradient on
77
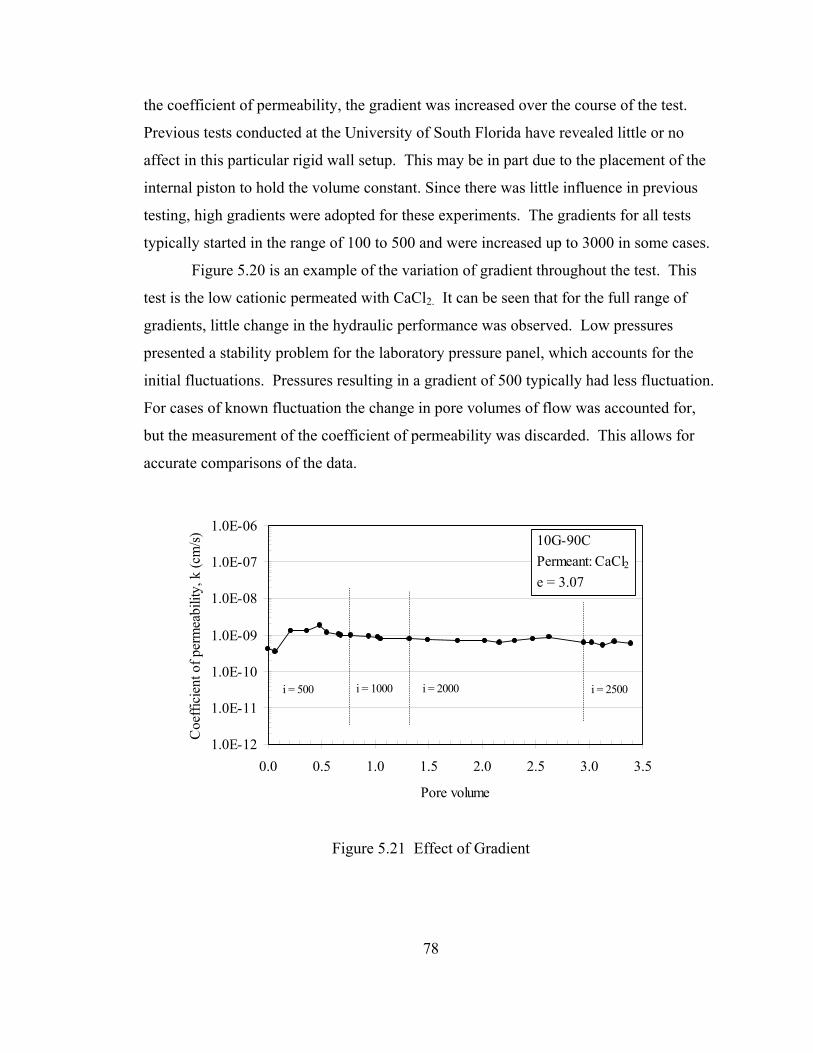
the coefficient of permeability, the gradient was increased over the course of the test.
Previous tests conducted at the University of South Florida have revealed little or no
affect in this particular rigid wall setup. This may be in part due to the placement of the
internal piston to hold the volume constant. Since there was little influence in previous
testing, high gradients were adopted for these experiments. The gradients for all tests
typically started in the range of 100 to 500 and were increased up to 3000 in some cases.
Figure 5.20 is an example of the variation of gradient throughout the test. This
test is the low cationic permeated with CaCl2. It can be seen that for the full range of
gradients, little change in the hydraulic performance was observed. Low pressures
presented a stability problem for the laboratory pressure panel, which accounts for the
initial fluctuations. Pressures resulting in a gradient of 500 typically had less fluctuation.
For cases of known fluctuation the change in pore volumes of flow was accounted for,
but the measurement of the coefficient of permeability was discarded. This allows for
accurate comparisons of the data.
1.0E-12
1.0E-11
1.0E-10
1.0E-09
1.0E-08
1.0E-07
1.0E-06
0.0 0.5 1.0 1.5 2.0 2.5 3.0 3.5
Pore volume
Coe
ffici
ent o
f per
mea
bilit
y, k
(cm
/s)
10G-90CPermeant: CaCl2e = 3.07
i = 2000 i = 2500i = 1000i = 500
Figure 5.21 Effect of Gradient
78

5.4.8 Electrical Conductivity and pH
Table 5.6 shows the measured values for chemical permeants. These
measurements were taken prior to the start of the test and were not monitored during the
test. The measurements were made with the Accumet AB30, 4-cell conductivity meter
and the pH using the Accumet AP63 pH meter, which were calibrated prior to
measurement.
Table 5.6 Electrical Conductivity and pH of Permeants Chemical Electrical Conductivity (mS/cm) pH
Deionized Water 0.0034 6.98
NaCl (Sodium Chloride) 92.9 6.2
MgCl2 (Magnesium Chloride) 119.2 6.19
CaCl2 (Calcium Chloride) 150.1 10.27
The electrical conductivity and pH of the effluent was measured to determine
when and if the samples had reached stability. The measured values for electrical
conductivity were adjusted to account for the 2-mL dilution in addition to any required
dilution to prepare enough fluid for measurement. The values measured of the effluent
could be compared to the initial values of the influent. Chemical stability was not used as
a termination criterion and therefore not all tests were permitted to run until chemical
equilibrium was achieved. There is the possibility that polymer leaching had an impact
on the measurement of the electrical conductivity and the pH of the effluent.
Figure 5.21 shows the electrical conductivity profile of the effluent for a test on
nonionic modified clay permeated with CaCl2. The electrical conductivity appears to
reach equilibrium in the range of 130.5 mS/cm and the pH was in the range of 6.8 to 7.
The electrical conductivity and the pH of the influent were measured to be 150.1 mS/cm
and 10.27. Chemical stability was achieved at approximately twelve days, which
corresponds to about four pore volumes of flow.
79

1.0E+00
1.0E+01
1.0E+02
1.0E+03
4.0 6.0 8.0 10.0 12.0 14.0 16.0 18.0
Duration (days)
Elec
trica
l con
duct
ivity
(mS/
cm)
5
5.5
6
6.5
7
7.5
8
8.5
9
pH
ECpH
10G-20Permeant: CaCl2e = 7.14
Figure 5.22 EC and pH of Effluent of Nonionic Clay Permeated with CaCl2
Figure 5.22 shows the high cationic clay permeated with MgCl2, which appears to
reach chemical equilibrium with respect to the electrical conductivity in the range of 100
mS/cm and pH in the range 6.8 to 7.0. The influent had a measured electrical
conductivity and pH of 119.2 mS/cm 6.19, respectively. Chemical stability seems to
have been achieved at approximately five days, which corresponds to four pore volumes
of flow. Since the equilibrium electrical conductivity values are slightly lower than the
measured inflow values, it is possible that some chemical retention is occurring.
1.0E-01
1.0E+00
1.0E+01
1.0E+02
1.0E+03
0.0 2.0 4.0 6.0 8.0 10.0 12.0
Duration (days)
Elec
trica
l con
duct
ivity
(mS/
cm)
55.566.577.588.599.510
pHECpH
10G-100CPermeant: MgCl2e = 7.30
Figure 5.23 EC and pH of High Cationic Permeated With MgCl2
80

CHAPTER 6
DISCUSSION AND ANALYSIS
6.1 Mixing Ratio
The polymer to clay ratio was mixed according to the dry weight percent.
However, organically modified clays are prepared by mixing organic cationic solutions at
percentages of the total cation exchange of the bentonite. This ratio for the polymer
treatment of clays can be examined for the charged polymers with the information
obtained from the polymer titration, methylene blue test and the limited information
supplied from the manufacturer of the polymers. For the samples prepared at 1.0 wt%,
for example there was 1 gram of polymer for every 100 grams of bentonite. The
experimentally determined value for the cation exchange capacity of the bentonite was 83
mEq/100g. The polymer titrations gave charge densities for each of the polymers that
were converted in to compatible units of mEq/100g. With all this information, the ratio
of polymer added to the total cation exchange capacity of the clay can be approximated.
The results for a 1.0 wt% mixture are presented in Table 6.1.
Table 6.1 Polymer Mix at %CEC of Clay
Polymer % CEC of Bentonite
High Cationic 3.47
Low Cationic 1.12
Nonionic Not Evaluated
Low Anionic 2.19
Medium Anionic 4.99
81

The ratios are quite low in comparison to percentages reported for
ororganobentonites, where solutions containing as much as 125% of the cation exchange
of the bentonites were used to treat the clay. The polymer modified clays demonstrated
markedly different properties with a small amount of polymer addition, which lead to the
decision to test polymer treatment at 1.0 wt%. This drastic change in property could
possibly be attributed to the inert portion of the polymers.
6.2 Effect of Sample Preparation
The sample preparation technique was developed through literature review of
organobentonites. Redding and Burns (2000) treated clays with organic solutions and
used similar techniques to process the samples. The processing of the polymer modified
clays, which involved the sample being oven-dried at 100˚C and pulverized to a powder,
had an influence on the properties of the modified soils. The swell index and liquid limit
tests were performed on both heated and unheated samples of bentonite to better assess
the clay’s response to the preparation process. The swelling was reduced from 60
mL/2grams to 41 mL/2 grams for the sample that was processed. The liquid limit of the
bentonite was reduced from 550% to 445%. These are substantial changes in the
properties. Although, the effects the processing had on the hydraulic properties were not
evaluated in this study, it is likely that the performance would be impacted. Many
researchers have linked properties such as swell index and liquid limit to the hydraulic
conductivity (Shackelford et al., 2000; Jo et al., 1997)). The effect of this processing
technique may inhibit this relationship.
Researchers at the University of South Florida have investigated the effect of heat
on the mineral structure using X-ray diffraction (XRD). It has been found that the
changes were insignificant in sample heated to 50˚C due to the unaffected presence of
interlayer water. However, when heated to 100˚C the XRD test results revealed changes
in the microstructure due to the removal of the tightly bound water molecules from the
interlayer.
82

The reduction of the sample into a fine powder also may have affected the
properties of the clay. The grinding process imparts a great deal of heat in the
microstructure due to breaking of bonds, potentially having a similar effect as oven
drying. The particle size distribution is another variable. Although, samples were
processed in the same manner, because the particles were so fine, only visual inspection
was used to ensure uniformity. This process in addition to the presence of polymers
could lead to a variation in particle sizes which could affect the properties.
6.3 Swell Index
The swell index was more affected by the sample preparation process than the
polymer interactions. The results for the swell behavior of the polymer treated clays in
solutions of different valences are consistent with the findings of for bentonite
(Shackelford et al., 2000). The trend of replaceability could be observed in the swell
volumes, indicating that the cations had an impact on the diffuse double layer of the
modified clays. Highly concentrated (1M) solutions suppressed the swell volume the
most, while dilute solutions (0.001M) exhibited volumes similar to deionized water.
Generally, the greater the concentration, the less impact the valence had on the swell
volume. The variation between the swell in MgCl2 and CaCl2 was far less notable than
the variation between NaCl and KCl. Jo et al. (2001) found similar finding and attributed
the difference in sensitivity between monovalent and polyvalent to osmotic swelling,
which is generally only associated with monovalent cations.
6.4 Effect of Permeant
The type, valence and concentration have been well documented as influential
factors affecting the hydraulic conductivity of bentonite and GCLs (Ruhl and Daniel,
1997; Jo et al., 2001). The valence of the cation present in the permeant influenced the
83
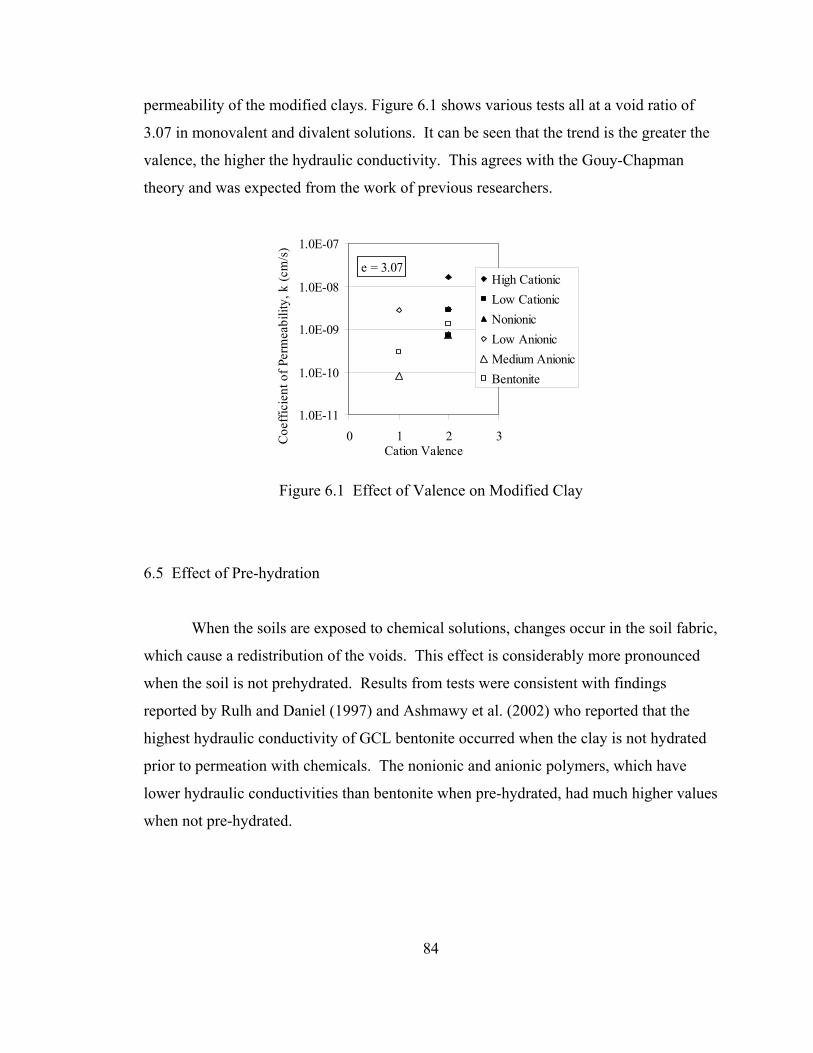
permeability of the modified clays. Figure 6.1 shows various tests all at a void ratio of
3.07 in monovalent and divalent solutions. It can be seen that the trend is the greater the
valence, the higher the hydraulic conductivity. This agrees with the Gouy-Chapman
theory and was expected from the work of previous researchers.
1.0E-11
1.0E-10
1.0E-09
1.0E-08
1.0E-07
0 1 2 3Cation Valence
Hyd
raul
ic C
ondu
ctiv
itHigh CationicLow CationicNonionicLow AnionicMedium AnionicBentonite
Coe
ffic
ient
of P
erm
eabi
lity,
k (c
m/s
)e = 3.07
Figure 6.1 Effect of Valence on Modified Clay
6.5 Effect of Pre-hydration
When the soils are exposed to chemical solutions, changes occur in the soil fabric,
which cause a redistribution of the voids. This effect is considerably more pronounced
when the soil is not prehydrated. Results from tests were consistent with findings
reported by Rulh and Daniel (1997) and Ashmawy et al. (2002) who reported that the
highest hydraulic conductivity of GCL bentonite occurred when the clay is not hydrated
prior to permeation with chemicals. The nonionic and anionic polymers, which have
lower hydraulic conductivities than bentonite when pre-hydrated, had much higher values
when not pre-hydrated.
84
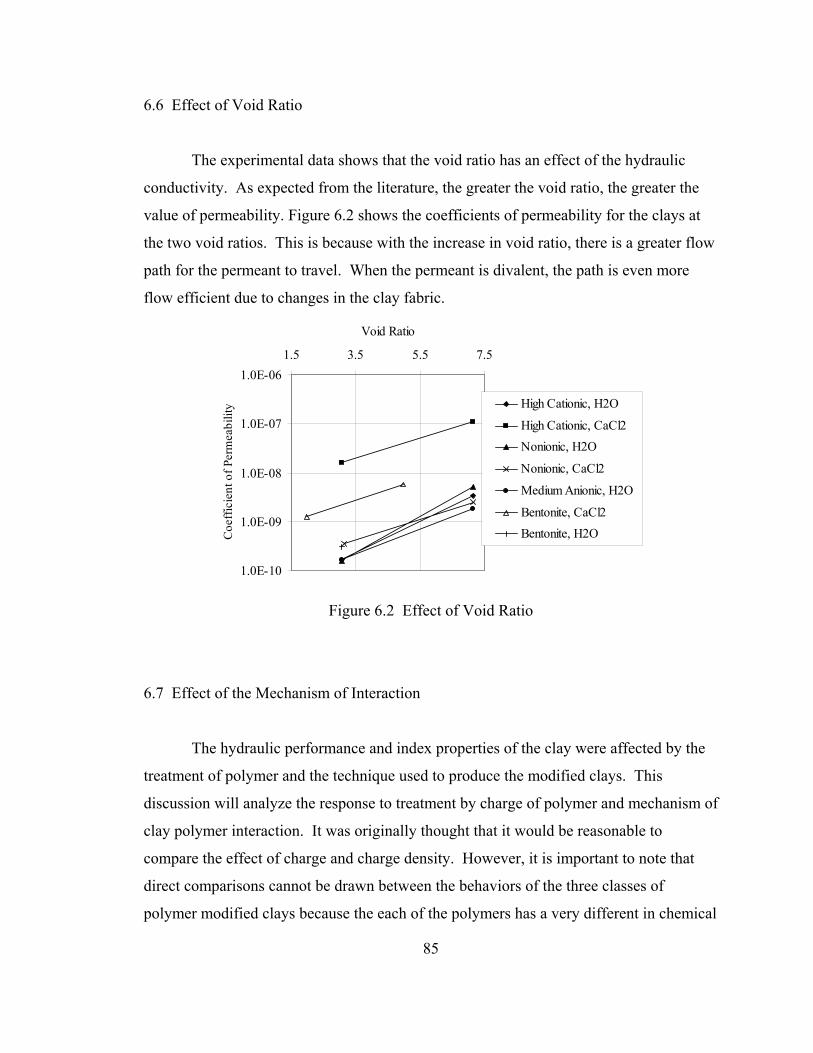
6.6 Effect of Void Ratio
The experimental data shows that the void ratio has an effect of the hydraulic
conductivity. As expected from the literature, the greater the void ratio, the greater the
value of permeability. Figure 6.2 shows the coefficients of permeability for the clays at
the two void ratios. This is because with the increase in void ratio, there is a greater flow
path for the permeant to travel. When the permeant is divalent, the path is even more
flow efficient due to changes in the clay fabric.
1.0E-10
1.0E-09
1.0E-08
1.0E-07
1.0E-061.5 3.5 5.5 7.5
Void Ratio
Coe
ffic
ient
of P
erm
eabi
lity High Cationic, H2O
High Cationic, CaCl2Nonionic, H2O
Nonionic, CaCl2
Medium Anionic, H2O
Bentonite, CaCl2Bentonite, H2O
Figure 6.2 Effect of Void Ratio
6.7 Effect of the Mechanism of Interaction
The hydraulic performance and index properties of the clay were affected by the
treatment of polymer and the technique used to produce the modified clays. This
discussion will analyze the response to treatment by charge of polymer and mechanism of
clay polymer interaction. It was originally thought that it would be reasonable to
compare the effect of charge and charge density. However, it is important to note that
direct comparisons cannot be drawn between the behaviors of the three classes of
polymer modified clays because the each of the polymers has a very different in chemical
85

make-up, which alters the clay polymer interaction. Comparisons can be made about the
effect of the polymers on the clay and inferences made about the interactions.
6.7.1 Effect of Cationic Interactions
After reviewing the literature, it was initially hypothesized that the cationic
polymers would have the strongest interaction with the bentonite, due the cation
exchange capacity of the clay. Assuming that this interaction takes place, the expectation
is that the cationic clays would exhibit the best performance and produce the most
chemical resistant barrier of the modified soils. However, the results indicate a much
different trend with respect to the hydraulic conductivity. The high cationic modified clay
demonstrated no improvement over unmodified bentonite, while the low cationic did
show minimal improvement.
The primary reason for this variation in performance is thought to be the type of
polymer chosen for the treatment. The high cationic polymer may not have the same
affinity for water molecules as the natural sodium. The high cationic polymers may have
exchanged for the naturally occurring sodium adsorbed to the clay surface, shrinking the
double layer. This would cause the high cationic polymer to have a similar affect as a
polyvalent cation, such as Ca2+ or Mg2+. Rather than help reduce the permeability in the
presence of highly concentrated solutions, the collapsed configuration allows the
permeants to pass at high rates. The low cationic clay has less charge and a lower
molecular weight, which would have to a different and more ideal interaction with the
mineral surface.
+
+ + + + + +
Figure 6.3 Cationic Polymer Interaction
86

This thought contradicts the behavior exhibited in the swell index test. If the
above were true, the swelling would be expected to be the lowest in unmodified
bentonite. The high cationic clays, which exhibited the highest swell capacities, also
displayed the highest hydraulic conductivity when the sample was pre-hydrated. This
differs from the trend observed in bentonite, where higher swell volumes are associated
with lower hydraulic conductivities (Jo et al., 2001). Organically modified bentonites
have demonstrated behavior contrary to that of unmodified bentonite with respect to this
relationship, as well. The difference in swelling response may be due to changes in the
surface chemistry of the clay. The low anionic displayed moderate swell and had a very
slight improvement over bentonite.
Previous research performed at the University of South Florida has found that the
swell test is not a good indicator of the hydraulic performance of polymer-modified clays.
Rather, it was determined that the liquid limit of polymer treated clay, has a more defined
relationship to the hydraulic conductivity. It has been found that the higher the liquid
limit, the lower the hydraulic conductivity. The high cationic polymer has a lower liquid
limit in both the heated and the non-heated samples than the unmodified bentonite, which
may explain the higher permeability. The low cationic had the lowest liquid limit of all
the polymers tested, which contradicts relationship between the liquid limit and the
permeability. The lack of an identifiable trend limits this analysis.
The cationic clay performed better than the other modified clays and similar to the
bentonite when permeated directly with CaCl2 without pre-hydration. The effect of
prehydration on permeability has been investigated for bentonite and contaminant
resistant bentonite (Ruhl and Daniel, 1997). The results varied over two orders of
magnitude for the contaminant resistant bentonite, which indicates that the variation in
treatment has a large impact on the performance, particularly when not pre-hydrated.
The permeability of pure bentonite increases due to cation exchange and collapse of the
diffuse layer, but pre-hydration greatly reduces the effect. The pre-hydration has less of
an effect on the cationic clay because the cation exchange has likely already occurred
during the formation of the polymer clay fabric.
87

Another possible source of this behavior of the cationic modification is the size of
the polymer. Molecular weight can play an important role in surface interactions and the
high cationic polymer has a molecular weight 10 x 106 Daltons, which indicates a very
large molecule in comparison to the size of the clay particle. This polymer may not have
the opportunity to intercalate due to its size, hence minimizing interactions. The results
showed that the low cationic modified soil had lower permeability than the high cationic.
The low cationic have a smaller molecular weight of 3 to 4 x 10⁶ Daltons, therefore the
size of lower charge density polymer may account for its performance.
6.7.2 Effect of Nonionic Interactions
The nonionic polymer interacts with the clay by the formation of coordination
complexes with the exchangeable cations. The polymers tend to spread out over the
surface of the clay. This association is very different from that of the cationic polymer
because the replacement of the natural cations does not take place, which is key to
explaining the differences in the hydraulic response. When spread out, the polymer coats
the clay, which may protect also the adsorbed cations rendering the clay more resistant to
chemical attack.
+ + + + + +
Figure 6.4 Nonionic Polymer Interaction
High liquid limits have been correlated to increased hydraulic performance in
bentonite, which agrees with the performance of the nonionic clay. The nonionic polymer
demonstrated the highest liquid limit as well as low permeability, which is in line with
the correlation between hydraulic conductivity and liquid limit. Low permeability was
maintained when exposed to monovalent and divalent solutions. Although improvement
88
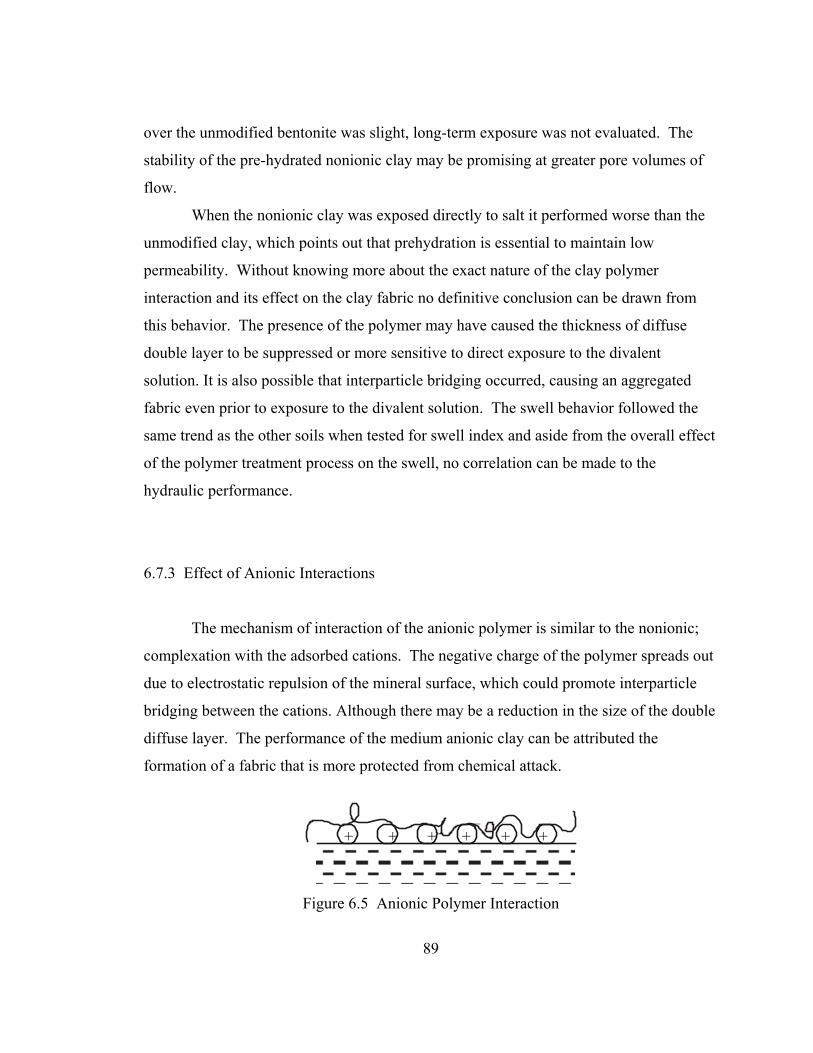
over the unmodified bentonite was slight, long-term exposure was not evaluated. The
stability of the pre-hydrated nonionic clay may be promising at greater pore volumes of
flow.
When the nonionic clay was exposed directly to salt it performed worse than the
unmodified clay, which points out that prehydration is essential to maintain low
permeability. Without knowing more about the exact nature of the clay polymer
interaction and its effect on the clay fabric no definitive conclusion can be drawn from
this behavior. The presence of the polymer may have caused the thickness of diffuse
double layer to be suppressed or more sensitive to direct exposure to the divalent
solution. It is also possible that interparticle bridging occurred, causing an aggregated
fabric even prior to exposure to the divalent solution. The swell behavior followed the
same trend as the other soils when tested for swell index and aside from the overall effect
of the polymer treatment process on the swell, no correlation can be made to the
hydraulic performance.
6.7.3 Effect of Anionic Interactions
The mechanism of interaction of the anionic polymer is similar to the nonionic;
complexation with the adsorbed cations. The negative charge of the polymer spreads out
due to electrostatic repulsion of the mineral surface, which could promote interparticle
bridging between the cations. Although there may be a reduction in the size of the double
diffuse layer. The performance of the medium anionic clay can be attributed the
formation of a fabric that is more protected from chemical attack.
+ + + + + +
Figure 6.5 Anionic Polymer Interaction
89

It is possible that this system is more sensitive to the pre-hydration condition
because the protective polymer layer may become easily dissociated from the surface in
the presence of divalent cations. Since the diffuse layer thickness is already reduced
from the interaction with the polymer, subsequent collapse is rapid. However, when the
clay is pre-hydrated it is probable that there is the formation of a hydration shell around
the whole bentonite-polymer complex. Similar to unmodified bentonite, the presence of
water greatly reduced the hydraulic conductivity. The added protection of the polymer
enhanced the hydraulic performance for the medium anionic, when permeated with
divalent solution slightly over that of bentonite. The low anionic did not have the same
hydraulic response as the medium anionic. This behavior can not be explained without
having more information about the specific polymers; however it is likely due to the
lesser charge and the chemical structure of the clay.
The property tests did not demonstrate clear trends, which limits the extent of
analysis that can be carried out. The trend of the swell volume for the anionic clays in
the various solutions at different concentration was generally the same all the other soils
tested. However, the swell volume was generally the least, when compared to cationic
and nonionic clays. For the medium anionic, this is inconsistent with test results from
bentonite, where swell volume is closely related to hydraulic conductivity.
90

CHAPTER 7
CONCLUSIONS AND RECOMMENDATIONS
7.1 Summary
Changes in the clay fabric cause significant increases in the hydraulic
conductivity of clay when permeated with high concentrations of inorganic solutions.
The aim of this study was to examine the characteristics of polymer amended clays for
the potential use in barrier systems. Sodium bentonite was modified by sorbing cationic,
nonionic, and anionic, water-soluble, polymers on to the mineral surface of the clay. The
index properties and the hydraulic conductivity were determined for comparison with
unmodified bentonite to evaluate the modified clays resistance to chemical attack.
7.2 Conclusions
It can be concluded that interaction occurred between the polymers and the clay
mineral surface due to changes in the hydraulic and index properties of the amended clay.
Due to the different charges and molecular structure of the polymeric compounds, each
polymer associated with the clay in a different manner. Comparisons can be made as to
the effect of a polymer; however the lack of identifiable trend in the results greatly limits
the analysis of the materials. The most significant result from this study is that presence
of the high cationic polymer did not necessarily enhance the hydraulic performance of the
bentonite. This indicates that utilizing the cation exchange capacity of the clay for
polymer sorption may not be effective in reducing the permeability of the clay. The low
91

anionic clay, also did not demonstrate positive effect on the hydraulic performance of the
bentonite. However, the results could not be related to the index properties and therefore
are inconclusive. The hydraulic conductivity of the clay modified with nonionic and
medium anionic, and low cationic polymers demonstrated slight improved performance
over unmodified bentonite when the samples were prehydrated. The polymers may have
chemical resistant potential, but no definitive conclusion can be made without further
investigation of the hydraulic performance. It can be concluded, however that
nonprehydrated samples treated with nonionic and anionic polymers do not perform well.
As previously demonstrated in pure bentonite, prehydration, void ratio and permeant
solution had a considerable affect on the performance of all the treated clays.
7.3 Recommendations for Future Work
During the course of this study, several other points of interest were identified that
could potentially be beneficial to a complete investigation. These topics were not
included in this study, but are recommendations for future work.
A full characterization of the polymer, including the chemical make-up and
charge density would allow for a better assessment of the polymer bentonite relations.
The preparation technique was not concluded to be beneficial, and therefore it is not
recommended that same mixing procedure be used in the future for polymer modification
of bentonite. A possible solution is to adopt a dry mixing procedure and to eliminate the
heating and grinding process, which were influential on the properties of the clay.
However, if a similar preparation technique were used, it would be valuable to have a
better illustration of the interaction and surface chemistry, which could be obtained by
analyzing the modified clays with the scanning electron microscope. The polymer could
be added as a percentage of the cation exchange capacity of the clay, rather than a weight
percent. The addition of much larger amounts of polymer could also be investigated for
92

the hydraulic response. Another, potential method for improving the mixture of the soil
would be to prepare the soil as outlined in this thesis and mix the treated bentonite with
unmodified bentonite creating a non-homogeneous mixture.
Experimentally, a few topics worthy of further investigation were encountered.
First, long term analysis of the effluent to determine full chemical equilibrium would be
desirable. In this study, only advective flow was analyzed, however the scope could be
expanded to include diffusive flow along with the development of the retention and
sorptive characteristics of the treated clay.
While information pertaining to the clay-polymer relationship and its influence of
the hydraulic properties of bentonite has been investigated, the test results are
inconclusive as to whether or not polymer-modification can enhance hydraulic
performance. Although this study was not conclusive concerning the specific polymer
interactions and the effect on hydraulic conductivity, additional research may be
promising. Polymers have the potential to improve the properties and performance of
bentonite, as has been demonstrated in commercially sold contaminant resistant
bentonites.
93

REFERENCES
Ashmawy, A.K., El-Hajji, D., Sotelo, N., and Muhammad, N. (2002), “Hydraulic Performance of Untreated and Polymer-Treated Bentonite in Inorganic Landfill Leachates,” Clay and Clay Minerals, Vol. 50, No. 5, pp. 546-552. Breen, C., (1999) “The Characterization and use of Polycation-exchanged Bentonite,” Applied Clay Science, Vol. 15, pp. 187-219. Breen, C., and Watson, R. (1998), “ Polycation-Exchanged Clays as Sorbants for Organic Pollutants: Influence of Layer Charge on Pollutant Sorption Capacity,” Journal of Colloid anf Interface Science, Vol. 208, pp. 422-429. Bartelt-Hunt, S.L., Burns, S.E., and Smith, J.A. (2003), “Nonionic organic solute sorption onto two organobentonites as a function of organic-carbon content,” Journal of Colloid and Interface Science, Vol. 266, pp. 251-258. Churchman, G.J. (2002), “Formation of Complexes Between Bentonite and Different Cationic Polyelectrolytes and Their Use as Sorbents for Non-ionic and Anionic Pollutants,” Applied Clay Science, Vol. 21, pp. 177-189. Egloffstein, T.A. (2001), “Natural Bentonites-influence of the ion exchange and partial desiccation on permeability and self-healing capacity of bentonites used in GCLs,” Technical Note, Geotextiles and Geomembranes, Vol. 19, pp. 427-444. Gungor, N., and Ece, O.I. (1999), “Effect of the Adsorption of Non-ionic Polymer Poly(vinyl)pyrolidone on the Rheological Properties of Na-Activated Bentonite,” Materials Letters, Vol. 39, pp. 1-5. Higgs, N.B. (1988) “Methylene Blue Adsorption as a Rapid and Economical Method of Detecting Smectite,” Geotechnical Testing Journal, Vol. 11, No. 1, pp. 68-71. Jo, H.Y., Katsumi, T., Benson, C.H., and Edil, T.B. (2001), “Hydraulic Conductivity and Swelling of Nonprehydrated GCLs Permeated with Single-Species Salt Solutions,” Journal of Geotechnical and Geoenvironmental Engineering, ASCE, Vol. 127, No. 7, pp. 557-567.
94

Li, J. Smith, J.A., and Winquist, A.S. (1996), “Permeability of Earthen Liners Containing Organobentonite to Water and Two Organic Liquids,” Environmental Science and Technology, Vol.320, No. 10, pp. 3089-3093. Liao, W.A. (1989), “Polymer/Bentonite/Soil Admixtures as Hydraulic Barriers,”SPE Drilling Engineering, June, pp.153-161. Lo, I.M., Mak, R.K., and Lee, S.C.H. (1997), “Modified Clays for Waste Containment and Pollutant Attenuation,” Journal of Environmental Engineering, Vol.123 No. 1, pp. 25-32. Malusis, M.A., and Shackelford, C.D. (2004), “Predicting Solute Flux through a Clay Membrane Barrier,” Journal of Geotechnical and Geoenvironmental Engineering, ASCE, Vol. 130, No. 5, pp. 477-487. Malusis, M.A., Shackelford, C.D., and Olsen, H.W. (2003), “Flow and Transport Through Clay Membrane Barriers,” Engineering Geology, Vol. 70, pp. 235-248. Mitchell, J.K,. “Fundamentals of Soil Behavior,” Second Edition, John Wiley and Son, Inc., New York, New York, 1993. Petrov, R.J., Rowe, K., and Quigley, R.M. (1997), “Comparison of Laboratory-Measured GCL Hydraulic Conductivity Based in Three Permeameter Types,” Geotechnical Testing Journal, Vol. 20, No. 1, pp. 49-62. Redding, Andria And Burns, Susan, (2000), “Compressibility And Index Properties Of Organic Exchanged Bentonite,” Geotechnical Special Publication, ASCE, No. 105, P. 142-150. Ruhl, Janice L. and Daniel, David E. (1997), “Geosynthetic Clay Liners Permeated with Chemical Solutions And Leachates,” Journal Of Geotechnical And Geoenvironmental Engineering, Vol. 123, No. 4, Apr, pp.369-381. Santamarina, J.C., Klein, K.A., Wang, Y.H., and Prencke, E. (2002), “Specific Surface: Determination and Relevance,” Canadian Geotechnical Journal, Vol. 39, pp. 233-241. Shackelford, Charles D., Benson, Craig H., Katsumi, Takeshi., Edil, Tuncer B., and Lin, L. (2000), “Evaluating The Hydraulic Conductivity Of GCLs Permeated With Non-Standard Liquids,” Journal of Geotextiles and Geomembranes, Vol. 18, Pp. 133-161. Shan H.-Y., Lai Y.J., (2002), “Effect Of Hydrating Liquid On The Hydraulic Properties Of Geosynthetic Clay Liners,” Geotextiles And Geomembranes v 20, n 1, February, pp. 19-38.
95
Sposito, G., “The Chemistry of Soils,” Oxford University Press, Inc, New York, New York, 1989. Taylor, R.K. (1985), “Cation Exchange in Clays and Mudrocks by Methylene Blue,” Journal of Chem.Tech Biotechnol., Vol. 35A, pp. 195-207. Tanihara, K. and Nakagawa, M. (1975), “ Flocculation Treatment of Waste Water Container Montmorillonite. IV. Interlamellar Complex Formation Between Various Ion Forms of Montmorillonite and Poly(ethylene oxide) or Polyacrylamide, Nippon Kagaku Kaidhi, No. 5: 782-789. Theng, B.K.G., “Formation and Properties of Clay-Polymer Complexes,” Elsevier Scientific Publishing Company, New York, New York, 1979.
van Olphen, H,, “An Introductions to Clay Colloid Chemistry,” Second Edition, John Wiley and Sons, Inc., New York, New York, 1977.
96

APPENDICES
97

Appendix A Permeability Test Results
Table A.1 Laboratory Permeability Tests
Test Polymer Permeant Void Ratio Pre-Hydrated 1st Wetting Liquid
1-Ch High Cationic H2O 7.14 Yes H2O
2-Ch High Cationic H2O 3.07 Yes H2O
3-Ch High Cationic NaCl 7.14 Yes H2O
4-Ch High Cationic CaCl2 7.14 Yes H2O
5-Ch High Cationic CaCl2 7.14 Yes H2O
6-Ch High Cationic MgCl2 7.14 Yes H2O
7-Ch High Cationic CaCl2 3.07 No CaCl2
8-Ch High Cationic CaCl2 7.14 No CaCl2
1-Cl Low Cationic H2O 3.07 Yes H2O
2-Cl Low Cationic CaCl2 3.07 Yes H2O
3-Cl Low Cationic MgCl2 3.07 Yes H2O
1-N Nonionic H2O 7.14 Yes H2O
2-N Nonionic H2O 3.07 Yes H2O
3-N Nonionic CaCl2 7.14 Yes H2O
4-N Nonionic CaCl2 3.07 Yes H2O
5-N Nonionic CaCl2 3.07 No CaCl2
1-Al Low Anionic H2O 3.07 Yes H2O
2-Al Low Anionic NaCl 3.07 Yes H2O
3-Al Low Anionic CaCl2 3.07 Yes H2O
1-Am Medium Anionic H2O 7.14 Yes H2O
2-Am Medium Anionic H2O 3.07 Yes H2O
3-Am Medium Anionic NaCl 3.07 Yes H2O
4-Am Medium Anionic CaCl2 3.07 Yes H2O
5-Am Medium Anionic MgCl2 3.07 Yes H2O
6-Am Medium Anionic CaCl2 3.07 No CaCl2
1-B Bentonite H2O 3.07 Yes H2O
2-B CaCl2 3.07 Yes H2O
3-B Bentonite MgCl2 3.07 Yes H2O
4-B Bentonite CaCl2 3.07 No CaCl2
Bentonite
98

Appendix A (continued)
1.0E-10
1.0E-09
1.0E-08
1.0E-07
1.0E-06
0 5 10 15Duration (days)
Coe
ffici
ent o
f per
mea
bilit
y, k
(cm
/s) 10G-100C
Permeant: DI Watere = 7.14
Figure A.1 Coefficient of Permeability vs. Duration – 1-Ch
1.0E-10
1.0E-09
1.0E-08
1.0E-07
0.0 1.0 2.0 3.0 4.0 5.0 6.0 7.0
Pore volume
Coe
ffici
ent o
f per
mea
bilit
y, k
(cm
/s)
10G-100CPermeant: DI Watere = 7.14
Figure A.2 Coefficient of Permeability vs. Pore Volume – 1-Ch
99

APPENDIX A (continued)
1.0E-12
1.0E-11
1.0E-10
1.0E-09
1.0E-08
1.0E-07
0 10 20 30 40 50 60 7Duration (days)
Coe
ffici
ent o
f per
mea
bilit
y, k
(cm
/s)
10G-100CPermeant: DI Watere =3.07
0
Figure A.3 Coefficient of Permeability vs. Duration – 2-Ch
1.00E-11
1.00E-10
1.00E-09
1.00E-08
1.00E-07
0.0 0.5 1.0 1.5 2.0 2.5 3.0 3.5 4.0
Pore volume
Coe
ffici
ent o
f per
mea
bilit
y, k
(cm
/s)
10G-100CPermeant: DI Watere =3.07
Figure A.4 Coefficient of Permeability vs. Pore Volume – 2-Ch
100

Appendix A (continued)
1.0E-11
1.0E-10
1.0E-09
1.0E-08
1.0E-07
1.0E-06
1.0E-05
1.0E-04
0 5 10 15 20 25 30 35Duration (days)
Coe
ffici
ent o
f per
mea
bilit
y, k
(cm
/s) . 10G-100C
Permeant: NaCle = 7.14
Figure A.5 Coefficient of Permeability vs. Duration – 3-Ch
1.0E-10
1.0E-09
1.0E-08
1.0E-07
1.0E-06
1.0E-05
0.0 1.0 2.0 3.0 4.0 5.0 6.0 7.0
Pore volume
Coe
ffici
ent o
f per
mea
bilit
y, k
(cm
/s)
10G-100CPermeant: NaCle = 7.14
Figure A.6 Coefficient of Permeability vs. Pore Volume – 3-Ch
101

Appendix A (continued)
1.0E-09
1.0E-08
1.0E-07
1.0E-06
1.0E-05
0 2 4 6 8 10Duration (days)
Coe
ffici
ent o
f per
mea
bilit
y, k
(cm
/s)
10G-100CPermeant: CaCl2e = 7.14
12
Figure A.7 Coefficient of Permeability vs. Duration – 4-Ch
1.0E-08
1.0E-07
1.0E-06
1.0E-05
0.0 2.0 4.0 6.0 8.0 10.0 12.0 14.0 16.0
Pore volume
Coe
ffici
ent o
f per
mea
bilit
y, k
(cm
/s)
10G-100CPermeant: CaCl2e = 7.14
Figure A.8 Coefficient of Permeability vs. Pore Volume – 4-Ch
102

Appendix A (continued)
1.0E-10
1.0E-09
1.0E-08
1.0E-07
1.0E-06
0 5 10 15 20Duration (days)
Coe
ffici
ent o
f per
mea
bilit
y, k
(cm
/s)
10G-100CPermeant: CaCl2e = 3.07
Figure A.9 Coefficient of Permeability vs. Duration – 5-Ch
Po
1.0E-10
1.0E-09
1.0E-08
1.0E-07
1.0E-06
1.0E-05
0.0 2.0 4.0 6.0 8.0 10.0 12.0 14.0
re volume
Coe
ffici
ent o
f per
mea
bilit
y, k
(cm
/s)
10G-100CPermeant: CaCl2e = 3.07
Figure A.10 Coefficient of Permeability vs. Pore Volume – 5-Ch
103

Appendix A (continued)
1.0E-09
1.0E-08
1.0E-07
1.0E-06
1.0E-05
0 1 2 3 4 5 6Duration (days)
Coe
ffici
ent o
f per
mea
bilit
y, k
(cm
/s)
10G-100CPermeant: MgCl2e = 7.30
7
Figure A.11 Coefficient of Permeability vs. Duration – 6-Ch
1.0E-09
1.0E-08
1.0E-07
1.0E-06
0.0 1.0 2.0 3.0 4.0 5.0 6.0 7.0 8.0
Pore volume
Coe
ffici
ent o
f per
mea
bilit
y, k
(cm
/s)
10G-100CPermeant: MgCl2e = 7.30
Figure A.12 Coefficient of Permeability vs. Pore Volume – 6-Ch
104

Appendix A (continued)
1.0E-11
1.0E-10
1.0E-09
1.0E-08
1.0E-07
0 5 10 15Duration (days)
Coe
ffici
ent o
f per
mea
bilit
y, k
(cm
/s) 10G-90C
Permeant: DI H2Oe = 3.32
Figure A.13 Coefficient of Permeability vs. Duration – 1-Cl Po
1.0E-11
1.0E-10
1.0E-09
1.0E-08
0.0 0.5 1.0 1.5 2.0 2.5 3.0 3.5 4.0
re volume
Coe
ffici
ent o
f per
mea
bilit
y, k
(cm
/s)
10G-90CPermeant: DI H2Oe = 3.32
Figure A.14 Coefficient of Permeability vs. Pore Volume – 1-Cl
105

Appendix A (continued)
1.0E-12
1.0E-11
1.0E-10
1.0E-09
1.0E-08
1.0E-07
1.0E-06
0 5 10 15Duration (days)
Coe
ffici
ent o
f per
mea
bilit
y, k
(cm
/s) 10G-90C
Permeant: CaCl2e = 3.07
Figure A.15 Coefficient of Permeability vs. Duration – 2-Cl
A.1 Coefficient of Permeability vs. Duration – 1-Ch 1 Po
1.0E-12
1.0E-11
1.0E-10
1.0E-09
1.0E-08
1.0E-07
1.0E-06
0.0 0.5 1.0 .5 2.0 2.5 3.0 3.5
re volume
Coe
ffici
ent o
f per
mea
bilit
y, k
(cm
/s)
10G-90CPermeant: CaCl2e = 3.07
Figure A.16 Coefficient of Permeability vs Pore Volume – 2-Cl
106

Appendix A (continued)
1.0
eabi
li
1.0E-11
1.0E-10
1.0E-09
E-08
1.0E-07
1.0E-06
0 5 10 15Duration (days)
Coe
ffici
ent o
f per
mty
, k (c
m/s)
10G-90CPermeant: MgCl2e = 3.07
Figure A.17 Coefficient of Permeability vs. Duration – 3-Cl
1.0E-11
1.0E-10
1.0E-09
1.0E-08
1.0E-07
1.0E-06
0.0 2.0 4.0 6.0 8.0 10.0 12.0 14.0 16.0
Pore volume
Coe
ffici
ent o
f per
mea
bilit
y, k
(cm
/s)
10G-90CPermeant: MgCl2e = 3.07
Figure A.18 Coefficient of Permeability vs. Pore Volume – 3-Cl
107

Appendix A (continued)
1.0E-12
1.0E-11
1.0E-10
1.0E-09
1.0E-08
1.0E-07
1.0E-06
0 2 4 6 8Duration (days)
Coe
ffici
ent o
f per
mea
bilit
y, k
(cm
/s)
10G-20Permeant: H2Oe = 7.14
10
Figure A.19 Coefficient of Permeability vs. Duration – 1-N Po
1.0E-11
1.0E-10
1.0E-09
1.0E-08
1.0E-07
1.0E-06
0.0 2.0 4.0 6.0 8.0 10.0 12.0
re volume
Coe
ffici
ent o
f per
mea
bilit
y, k
(cm
/s)
10G-20Permeant: H2Oe = 7.14
Figure A.20 Coefficient of Permeability vs. Pore Volume – 1-N
108

Appendix A (continued)
1.00E-11
1.00E-10
1.00E-09
1.00E-08
1.00E-07
0 5 10 15 20 25Duration (days)
Coe
ffici
ent o
f per
mea
bilit
y, k
(cm
/s) 10G-20
Permeant: H2Oe = 3.07
Figure A.21 Coefficient of Permeability vs. Duration – 2-N
1.00E-11
1.00E-10
1.00E-09
1.00E-08
0.0 0.5 1.0 1.5 2.0
Pore volume
Coe
ffici
ent o
f per
mea
bilit
y, k
(cm
/s)
10G-20Permeant: H2Oe = 3.07
Figure A.22 Coefficient of Permeability vs. Pore Volume – I-N
109
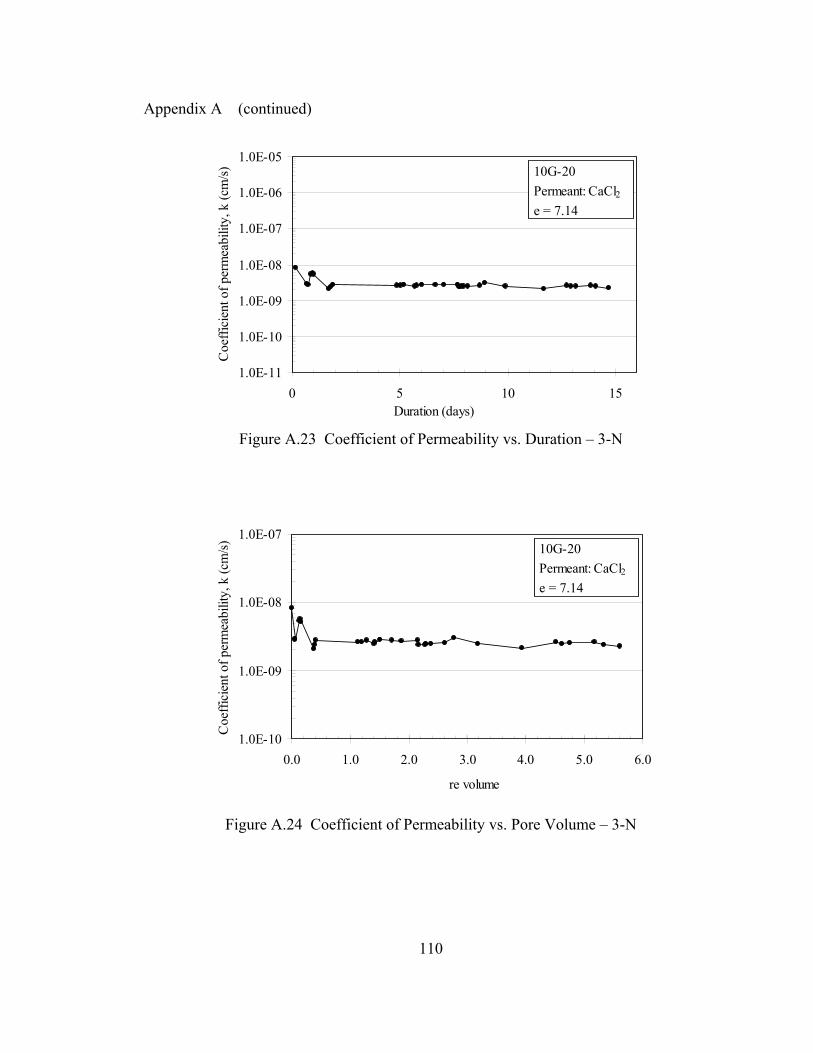
Appendix A (continued)
1.0E-11
1.0E-10
1.0E-09
1.0E-08
1.0E-07
1.0E-06
1.0E-05
0 5 10 15Duration (days)
Coe
ffici
ent o
f per
mea
bilit
y, k
(cm
/s) 10G-20
Permeant: CaCl2e = 7.14
Figure A.23 Coefficient of Permeability vs. Duration – 3-N Po
1.0E-10
1.0E-09
1.0E-08
1.0E-07
0.0 1.0 2.0 3.0 4.0 5.0 6
re volume
Coe
ffici
ent o
f per
mea
bilit
y, k
(cm
/s)
10G-20Permeant: CaCl2e = 7.14
.0
Figure A.24 Coefficient of Permeability vs. Pore Volume – 3-N
110
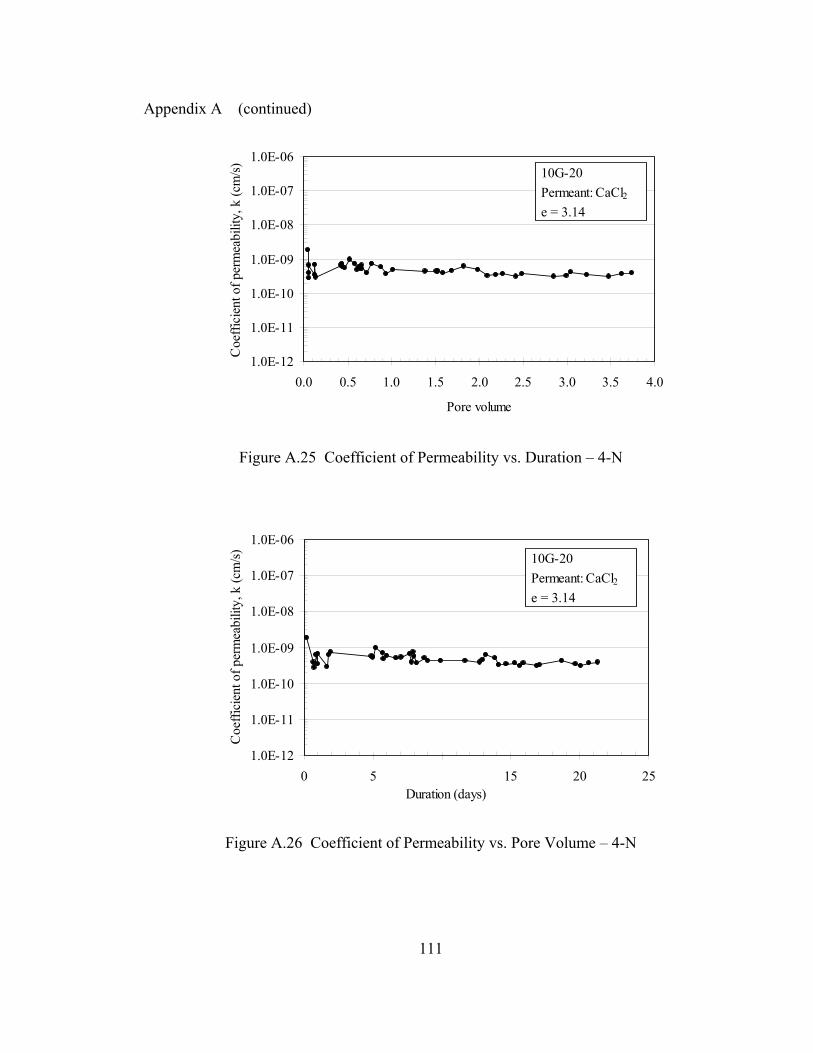
Appendix A (continued)
1.0E-12
1.0E-11
1.0E-10
1.0E-09
1.0E-08
1.0E-07
1.0E-06
0.0 0.5 1.0 1.5 2.0 2.5 3.0 3.5 4.0
Pore volume
Coe
ffici
ent o
f per
mea
bilit
y, k
(cm
/s)
10G-20Permeant: CaCl2e = 3.14
Figure A.25 Coefficient of Permeability vs. Duration – 4-N 10
1.0E-12
1.0E-11
1.0E-10
1.0E-09
1.0E-08
1.0E-07
1.0E-06
0 5 15 20 25Duration (days)
Coe
ffici
ent o
f per
mea
bilit
y, k
(cm
/s)
10G-20Permeant: CaCl2e = 3.14
Figure A.26 Coefficient of Permeability vs. Pore Volume – 4-N
111
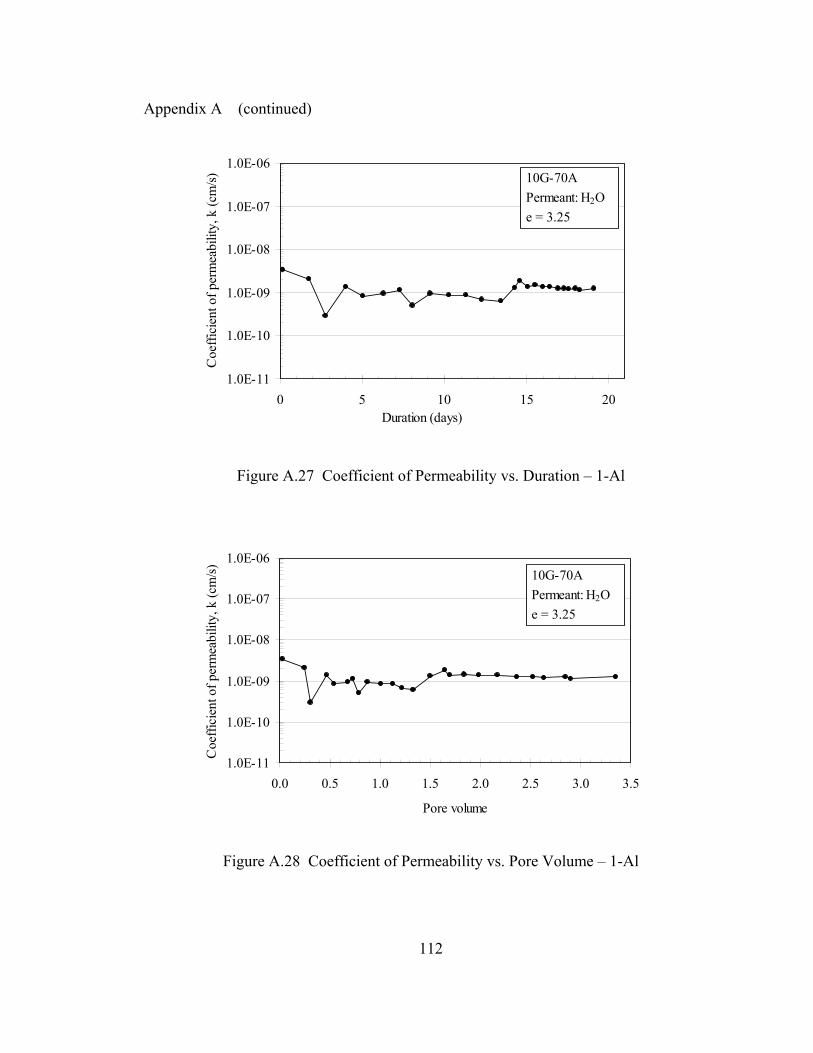
Appendix A (continued)
1.0E-11
1.0E-10
1.0E-09
1.0E-08
1.0E-07
1.0E-06
0 5 10 15 20Duration (days)
Coe
ffici
ent o
f per
mea
bilit
y, k
(cm
/s) 10G-70A
Permeant: H2Oe = 3.25
Figure A.27 Coefficient of Permeability vs. Duration – 1-Al
1.0E-11
1.0E-10
1.0E-09
1.0E-08
1.0E-07
1.0E-06
0.0 0.5 1.0 1.5 2.0 2.5 3.0 3.5
Pore volume
Coe
ffici
ent o
f per
mea
bilit
y, k
(cm
/s)
10G-70APermeant: H2Oe = 3.25
Figure A.28 Coefficient of Permeability vs. Pore Volume – 1-Al
112

Appendix A (continued)
1.0E-11
1.0E-10
1.0E-09
1.0E-08
1.0E-07
1.0E-06
0 2 4 6 8 10Duration (days)
Coe
ffici
ent o
f per
mea
bilit
y, k
(cm
/s) 10G-70A
Permeant: NaCle = 3.07
12
Figure A.29 Coefficient of Permeability vs. Duration – 2-Al
1.0E-11
1.0E-10
1.0E-09
1.0E-08
1.0E-07
1.0E-06
0.0 1.0 2.0 3.0 4.0 5.0
Pore volume
Coe
ffici
ent o
f per
mea
bilit
y, k
(cm
/s)
10G-70APermeant: NaCle = 3.07
Figure A.30 Coefficient of Permeability vs. Pore Volume – 2-Al
113

Appendix A (continued)
1.0E-12
1.0E-11
1.0E-10
1.0E-09
1.0E-08
1.0E-07
1.0E-06
0 5 10Duration (days)
Coe
ffici
ent o
f per
mea
bilit
y, k
(cm
/s)
10G-70APermeant: CaCl2e = 3.07
15
Figure A.31 Coefficient of Permeability vs. Duration – 3-Al
1.0E-12
1.0E-11
1.0E-10
1.0E-09
1.0E-08
1.0E-07
1.0E-06
0.0 2.0 4.0 6.0 8.0 10.0
Pore volume
Coe
ffici
ent o
f per
mea
bilit
y, k
(cm
/s) 10G-70A
Permeant: CaCl2e = 3.07
Figure A.32 Coefficient of Permeability vs. Pore Volume 3-Al
114

Appendix A (continued)
1.0E-11
1.0E-10
1.0E-09
1.0E-08
1.0E-07
0 2 4 6 8 10Duration (days)
Coe
ffici
ent o
f per
mea
bilit
y, k
(cm
/s)
10G-80APermeant: H2Oe = 7.14
12
Figure A.33 Coefficient of Permeability vs. Duration – 1-Am Po
1.0E-11
1.0E-10
1.0E-09
1.0E-08
1.0E-07
0.0 1.0 2.0 3.0 4.0
re volume
Coe
ffici
ent o
f per
mea
bilit
y, k
(cm
/s)
10G-80APermeant: H2Oe = 7.14
Figure A.34 Coefficient of Permeability vs. Pore Volume – 1-Am
115

Appendix A (continued)
1.0E-13
1.0E-12
1.0E-11
1.0E-10
1.0E-09
1.0E-08
1.0E-07
0 5 10 15 20Duration (days)
Coe
ffici
ent o
f per
mea
bilit
y, k
(cm
/s)
10G-80APermeant: H2Oe = 3.07
Figure A.35 Coefficient of Permeability vs. Duration – 2-Am
1.0E-13
1.0E-12
1.0E-11
1.0E-10
1.0E-09
1.0E-08
1.0E-07
0.0 0.5 1.0 1.5 2.0 2.5
Pore volume
Coe
ffici
ent o
f per
mea
bilit
y, k
(cm
/s)
10G-80APermeant: H2Oe = 3.07
Figure A.36 Coefficient of Permeability vs. Pore Volume – 2-Am
116

Appendix A (continued)
1.0E-12
1.0E-11
1.0E-10
1.0E-09
1.0E-08
1.0E-07
0 5 10 15 20 25 30Duration (days)
Coe
ffici
ent o
f per
mea
bilit
y, k
(cm
/s) 10G-80A
Permeant: NaCle = 3.10
Figure A.37 Coefficient of Permeability vs. Duration – 3-Am
1.0E-12
1.0E-11
1.0E-10
1.0E-09
1.0E-08
1.0E-07
0.0 0.5 1.0 1.5 2.0 2
Pore volume
Coe
ffici
ent o
f per
mea
bilit
y, k
(cm
/s)
10G-80APermeant: NaCle = 3.10
.5
Figure A.38 Coefficient of Permeability vs. Pore Volume – 3-Am
117
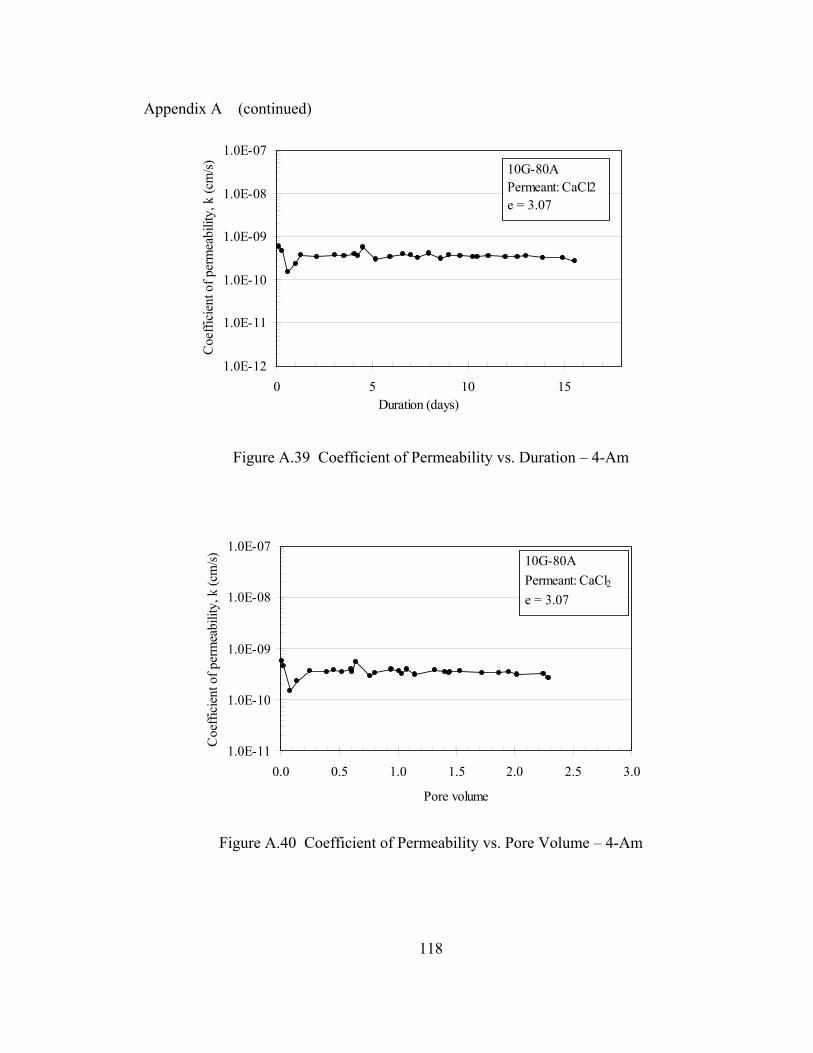
Appendix A (continued)
1.0E-12
1.0E-11
1.0E-10
1.0E-09
1.0E-08
1.0E-07
0 5 10 15Duration (days)
Coe
ffici
ent o
f per
mea
bilit
y, k
(cm
/s)
10G-80APermeant: CaCl2e = 3.07
Figure A.39 Coefficient of Permeability vs. Duration – 4-Am
1.0E-11
1.0E-10
1.0E-09
1.0E-08
1.0E-07
0.0 0.5 1.0 1.5 2.0 2.5 3
Pore volume
Coe
ffici
ent o
f per
mea
bilit
y, k
(cm
/s)
10G-80APermeant: CaCl2e = 3.07
.0
Figure A.40 Coefficient of Permeability vs. Pore Volume – 4-Am
118
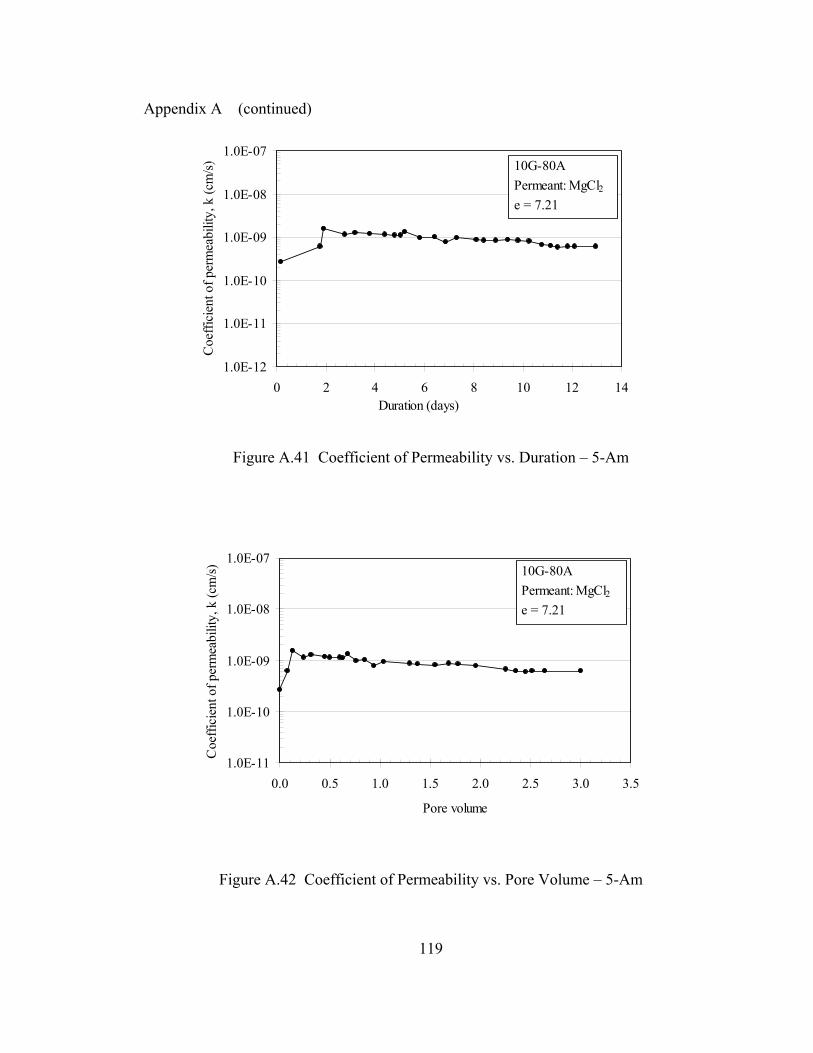
Appendix A (continued)
1.0E-12
1.0E-11
1.0E-10
1.0E-09
1.0E-08
1.0E-07
0 2 4 6 8 10 12Duration (days)
Coe
ffici
ent o
f per
mea
bilit
y, k
(cm
/s) . 10G-80A
Permeant: MgCl2e = 7.21
14
Figure A.41 Coefficient of Permeability vs. Duration – 5-Am
1.0E-11
1.0E-10
1.0E-09
1.0E-08
1.0E-07
0.0 0.5 1.0 1.5 2.0 2.5 3.0 3.5
Pore volume
Coe
ffici
ent o
f per
mea
bilit
y, k
(cm
/s)
10G-80APermeant: MgCl2e = 7.21
Figure A.42 Coefficient of Permeability vs. Pore Volume – 5-Am
119

Appendix A (continued)
1.0E-12
1.0E-11
1.0E-10
1.0E-09
1.0E-08
1.0E-07
0 5 10 15 20 25Duration (days)
Coe
ffici
ent o
f per
mea
bilit
y, k
(cm
/s)
BentonitePermeant: H2Oe = 3.07
Figure A.43 Coefficient of Permeability vs. Duration – 1-B
1.0E-12
1.0E-11
1.0E-10
1.0E-09
1.0E-08
1.0E-07
0.0 0.5 1.0 1.5 2.0 2.5
Pore volume
Coe
ffici
ent o
f per
mea
bilit
y, k
(cm
/s)
BentonitePermeant: H2Oe = 3.07
Figure A.44 Coefficient of Permeability vs. Pore Volume – 1-B
120

Appendix A (continued)
1.0E-12
1.0E-11
1.0E-10
1.0E-09
1.0E-08
1.0E-07
1.0E-06
0 5 10 15Duration (days)
Coe
ffici
ent o
f per
mea
bilit
y, k
(cm
/s) Bentonite
Permeant: CaCl2e = 3.07
Figure A.45 Coefficient of Permeability vs. Duration – 2-B
1.0E-12
1.0E-11
1.0E-10
1.0E-09
1.0E-08
1.0E-07
1.0E-06
0.0 1.0 2.0 3.0 4.0 5.0
Pore volume
Coe
ffici
ent o
f per
mea
bilit
y, k
(cm
/s)
BentonitePermeant: CaCl2e = 3.07
Figure A.46 Coefficient of Permeability vs. Pore Volume – 2-B
121

Appendix A (continued)
1.0E-12
1.0E-11
1.0E-10
1.0E-09
1.0E-08
1.0E-07
0 2 4 6 8 10Duration (days)
Coe
ffici
ent o
f per
mea
bilit
y, k
(cm
/s)
BentonitePermeant: MgCl2e = 3.07
12
Figure A.47 Coefficient of Permeability vs. Duration – 3-B
1.0E-11
1.0E-10
1.0E-09
1.0E-08
1.0E-07
0.0 1.0 2.0 3.0 4.0
Pore volume
Coe
ffici
ent o
f per
mea
bilit
y, k
(cm
/s)
BentonitePermeant: MgCl2e = 3.07
Figure A.48 Coefficient of Permeability vs. Pore Volume – 3-B
122

Appendix B: Swell Index Test Results
05
10152025303540
0 0.2 0.4 0.6 0.8 1 1.2Liquid Solution Concentration (M)
Sw
ell I
ndex
mL
/2g
NaClKClMgCl2CaCl2
High Cationic
Figure B.1 Swell Index of High Cationic Modified Clay
0
5
10
15
20
25
30
35
0 0.2 0.4 0.6 0.8 1 1.2Liquid Solution Concentration (M)
Sw
ell I
ndex
mL
/2g
NaClKClMgCl2CaCl2
Low Cationic
Figure B.2 Swell Index of Low Cationic Modified Clay
123

Appendix B (Continued)
0
5
10
15
20
25
30
35
40
0 0.2 0.4 0.6 0.8 1 1.2Liquid Solution Concentration (M)
Sw
ell I
ndex
mL/
2gNaClKClMgCl2CaCl2
Nonionic
Figure B.3 Swell Index of Nonionic Modified Clay
0
5
10
15
20
25
30
35
0 0.2 0.4 0.6 0.8 1 1.2Liquid Solution Concentration (M)
Sw
ell I
ndex
mL
/2g
NaClKClMgCl2CaCl2
Low Anionic
Figure B.4 Swell Index of Low Anionic Modified Clay
124

Appendix B (Continued)
0
5
10
15
20
25
30
35
0 0.2 0.4 0.6 0.8 1 1.2Liquid Solution Concentration (M)
Sw
ell I
ndex
mL
/2g
NaClKClMgCl2CaCl2
Medium Anionic
Figure B.5 Swell Index of Medium Anionic Modified Clay
01020304050607080
0 0.2 0.4 0.6 0.8 1 1.2Liquid Solution Concentration (M)
Sw
ell I
ndex
mL
/2g
NaClKClMgCl2CaCl2
Bentonite
Figure B.6 Swell Index of Unmodified Bentonite Clay
125
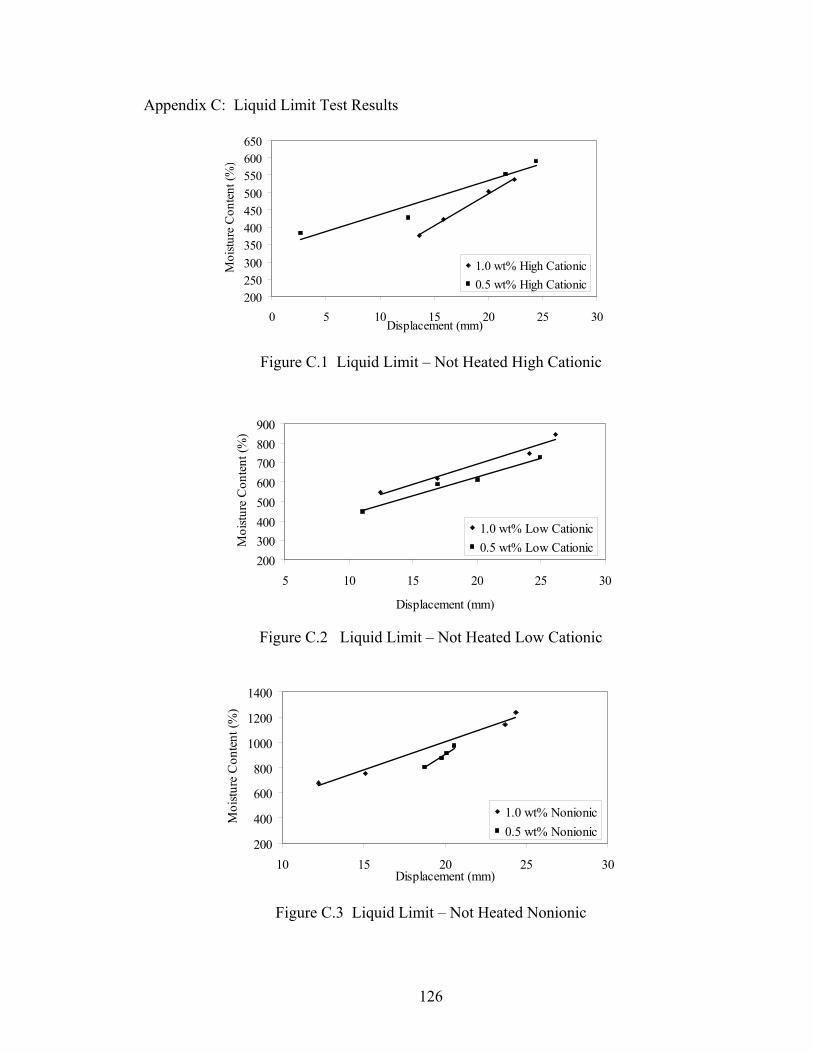
Appendix C: Liquid Limit Test Results
200250300350400450500550600650
0 5 10 15 20 25 30Displacement (mm)
Moi
sture
Con
tent
(%)
1.0 wt% High Cationic0.5 wt% High Cationic
Figure C.1 Liquid Limit – Not Heated High Cationic
200300400500600700800900
5 10 15 20 25 30
Displacement (mm)
Moi
sture
Con
tent
(%)
1.0 wt% Low Cationic0.5 wt% Low Cationic
Figure C.2 Liquid Limit – Not Heated Low Cationic
200
400
600
800
1000
1200
1400
10 15 20 25 30Displacement (mm)
Moi
sture
Con
tent
(%)
1.0 wt% Nonionic0.5 wt% Nonionic
Figure C.3 Liquid Limit – Not Heated Nonionic
126

Appendix C (Continued)
200300400500600700800
10 15 20 25 30
Displacement (mm)
Moi
stur
e C
onte
nt (%
)1.0 wt% Low Anionic
0.5 wt% Low Anionic
Figure C.4 Liquid Limit – Not Heated Low Anionic
200
300
400
500
600
700
800
8 13 18 23 2Displacement (mm)
Moi
sture
Con
tent
(%)
1.0 wt% Medium Anionic
0.5 wt% Medium Anionic
8
Figure C.5 Liquid Limit – Not Heated Medium Anionic
100150200250300350400450500550
5 10 15 20 25 3Displacement (mm)
Moi
sture
Con
tent
(%)
1.0 wt% High Cationic
0.5 wt% High Cationic
0
Figure C.6 Liquid Limit – Heated High Cationic
127

Appendix C (Continued)
0
100
200
300400
500
600
700
5 10 15 20 25 30 35
Displacement (mm)
Moi
sture
Con
tent
(%)
1.0 wt% Low Cationic0.5 wt% Low Cationic
Figure C.7 Liquid Limit – Heated Low Cationic
0
100
200
300
400
500
600
5 10 15 20 25 30
Displacement (mm)
Moi
sture
Con
tent
(%)
1.0 wt% Nonionic0.5 wt% Nonionic
Figure C.8 Liquid Limit – Heated Nonionic 70
0
100200
300
400
500600
0
5 10 15 20 25 30 3
Displacement (mm)
Moi
sture
Con
tent
(%)
1.0 wt% Low Anionic0.5 wt% Low Anionic
5
Figure C.9 Liquid Limit – Heated Low Anionic
128
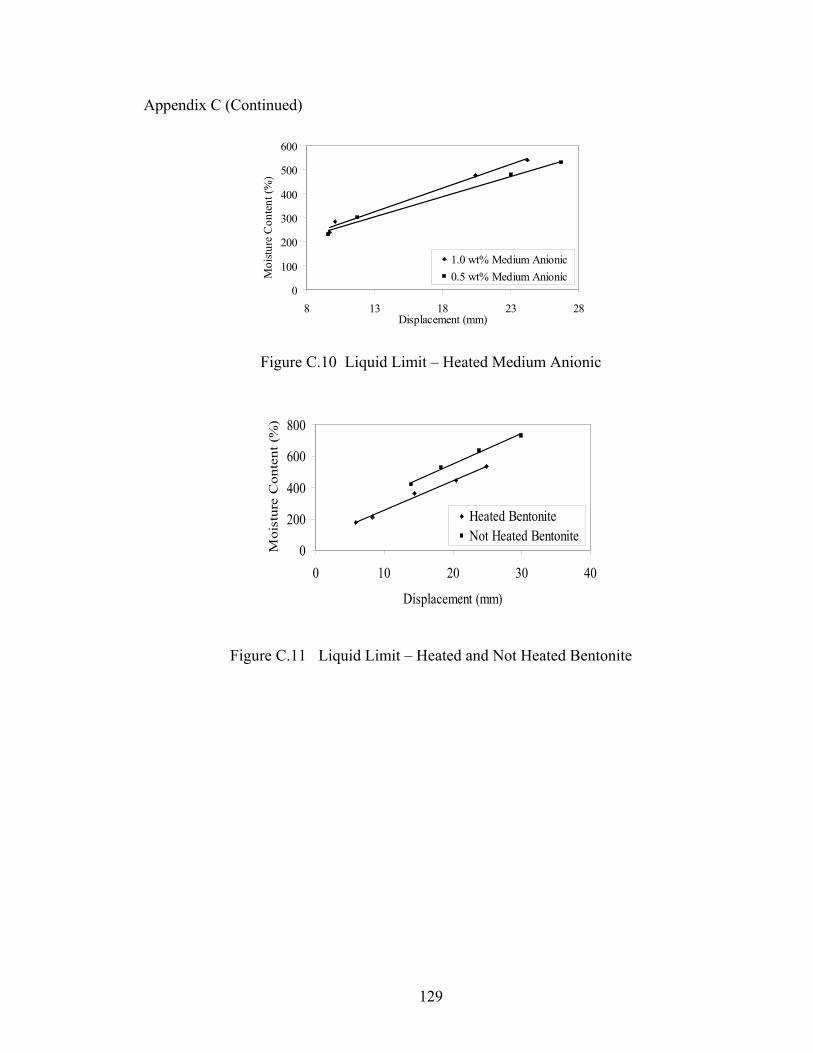
Appendix C (Continued)
0
100
200
300
400
500
600
8 13 18 23Displacement (mm)
Moi
sture
Con
tent
(%)
1.0 wt% Medium Anionic0.5 wt% Medium Anionic
28
Figure C.10 Liquid Limit – Heated Medium Anionic
0
200
400
600
800
0 10 20 30 4
Displacement (mm)
Moi
stur
e C
onte
nt (
%)
Heated BentoniteNot Heated Bentonite
0
Figure C.11 Liquid Limit – Heated and Not Heated Bentonite
129