hydrobase operations guide.docx€¦ · web viewfig 5.8 crest history. ... fig 9.7 radar...
TRANSCRIPT
HydroBase Operations GuideWHFS Support Group
June 10, 2015
Table of Contents1.0 Introduction..............................................................................................................................3
1.1 Starting the HydroBase Application..................................................................................3
1.2 Primary button functions..................................................................................................3
1.3 Troubleshooting HydroBase Operations...........................................................................3
2.0 The main HydroBase Window..................................................................................................4
2.1 Station List Filter Options window....................................................................................5
3.0 The File Menu...........................................................................................................................6
3.1 Preferences.......................................................................................................................6
4.0 The Location Menu...................................................................................................................6
4.1 Add Location/Modify Location.........................................................................................6
4.2 Contacts..........................................................................................................................10
4.3 County/Zone UGC...........................................................................................................11
4.4 Gage History...................................................................................................................12
4.5 Data Sources...................................................................................................................13
4.5.1 DCP Page.................................................................................................................134.5.2 Observer Page.........................................................................................................144.5.3 Telemetry Page.......................................................................................................15
5.0 The River Gage Menu.............................................................................................................15
5.1 River Gage.......................................................................................................................15
5.1.1 Geophysical Page....................................................................................................165.1.2 Additional Info........................................................................................................18
5.2 Flood Category................................................................................................................18
5.3 Impact Statement...........................................................................................................19
5.4 Low Water Statement.....................................................................................................20
5.5 Flood Damage.................................................................................................................21
5.6 Rating Curve...................................................................................................................22
5.7 Unit Hydrograph Editor...................................................................................................23
1 of 46
5.8 Crest History...................................................................................................................24
5.9 Low Water......................................................................................................................25
5.10 Benchmark......................................................................................................................25
5.11 Datum.............................................................................................................................26
5.12 Description.....................................................................................................................27
5.13 Publications....................................................................................................................28
5.14 References......................................................................................................................28
6.0 The Reservoir Menu...............................................................................................................29
7.0 The Data Ingest Menu............................................................................................................30
7.1 Ingest Filter.....................................................................................................................30
7.2 Adjustment Factors.........................................................................................................32
7.3 QC/Alert/Alarm Limits....................................................................................................33
7.4 Data Purge Parameters...................................................................................................34
7.5 Start/Stop SHEFdecoder (AWIPS1 only)..........................................................................35
8.0 The Reports Menu..................................................................................................................36
8.1 Flood Report...................................................................................................................36
8.2 Text Reports...................................................................................................................37
9.0 The Setup Menu.....................................................................................................................38
9.1 Administration................................................................................................................38
9.2 Cities (AWIPS1 only).......................................................................................................38
9.3 Reference Fields.............................................................................................................39
9.4 States/Counties/Zones...................................................................................................40
9.5 RiverPro General Parameters.........................................................................................40
9.6 RiverPro Forecast Groups/Points....................................................................................41
9.7 Radar Locations..............................................................................................................42
9.8 Areal Definitions.............................................................................................................43
9.9 Vector Definitions (AWIPS1 only)...................................................................................44
9.10 NWR Transmitter............................................................................................................44
9.11 Time Series Group Configuration....................................................................................45
9.12 HydroGen Configuration.................................................................................................46
2 of 46
1.0 IntroductionThe primary function of the HydroBase application is to provide a user-friendly interface to
the static lookup tables in the IHFS database. Each of the different windows accesses a specific table or tables in the database. HydroBase has been re-engineered in AWIPS2, but to the user there are very few noticeable changes. A few of the menu items have been removed, but the appearance and function of the remaining HydroBase windows are the same.
1.1 Starting the HydroBase ApplicationFrom the AWIPS menu on an LX workstation, select “start CAVE (lx) / TextWS (xt)”. Click on
the Hydro icon, and from the HydroApps menu select Hydro Database manager, then enter the password if requested.
1.2 Primary button functions The functions of the most commonly occurring buttons used in HydroBase are the following:
OK – Save the changes to the database and close the GUI.
Close – Close the GUI without saving the current window contents.
Cancel – Discard any changes and close the GUI.
Apply – Save the changes to the database and do not close the GUI.
New – Create an entry with empty boxes for a new entry. The “OK” or “Apply” buttons will be needed to save any changes to the database.
Delete – Delete the highlighted entry from the database table. A confirmation box will appear asking the user if they do want to delete this entry. After the user clicks “OK” in the Confirmation box, the entry is deleted from the database.
1.3 Troubleshooting HydroBase OperationsHydroBase does not produce a log file where it documents errors. The error messages, which
are generally SQL errors passed back from the IHFS database, appear in pop-up windows and in the xterm window that starts along with the AWIPS1 HydroBase application. Errors displayed in the pop-ups are generally not descriptive enough to properly identify the cause of the error message. In AWIPS1, more detailed information is displayed in the xterm and this usually will guide the user to the solution. In AWIPS2, the xterm does not exist, but it is possible that more detailed error messages will be displayed in the pop-ups.
General note: unless otherwise specified, all date fields must be entered in the form MM/DD/YYYY, or an error message will appear.
3 of 46
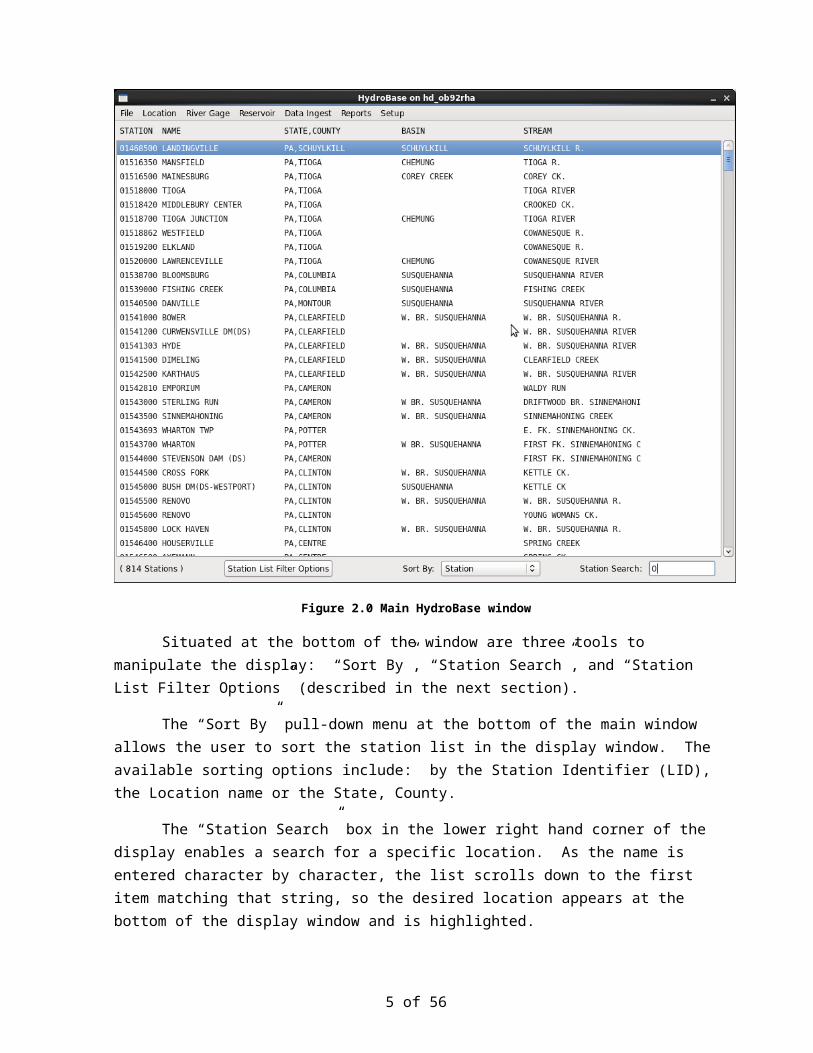
2.0 The main HydroBase WindowThe main window displays all of the locations in the location table, along with some basic
geographical information. The selected station in this window is used for the windows under the Location, River Gage and Reservoir menus.
Figure 2.0 Main HydroBase window
Situated at the bottom of the window are three tools to manipulate the display: “Sort By”, “Station Search”, and “Station List Filter Options” (described in the next section).
The “Sort By” pull-down menu at the bottom of the main window allows the user to sort the station list in the display window. The available sorting options include: by the Station Identifier (LID), the Location name or the State, County.
The “Station Search” box in the lower right hand corner of the display enables a search for a specific location. As the name is entered character by character, the list scrolls down to the first item matching that string, so the desired location appears at the bottom of the display window and is highlighted.
4 of 46
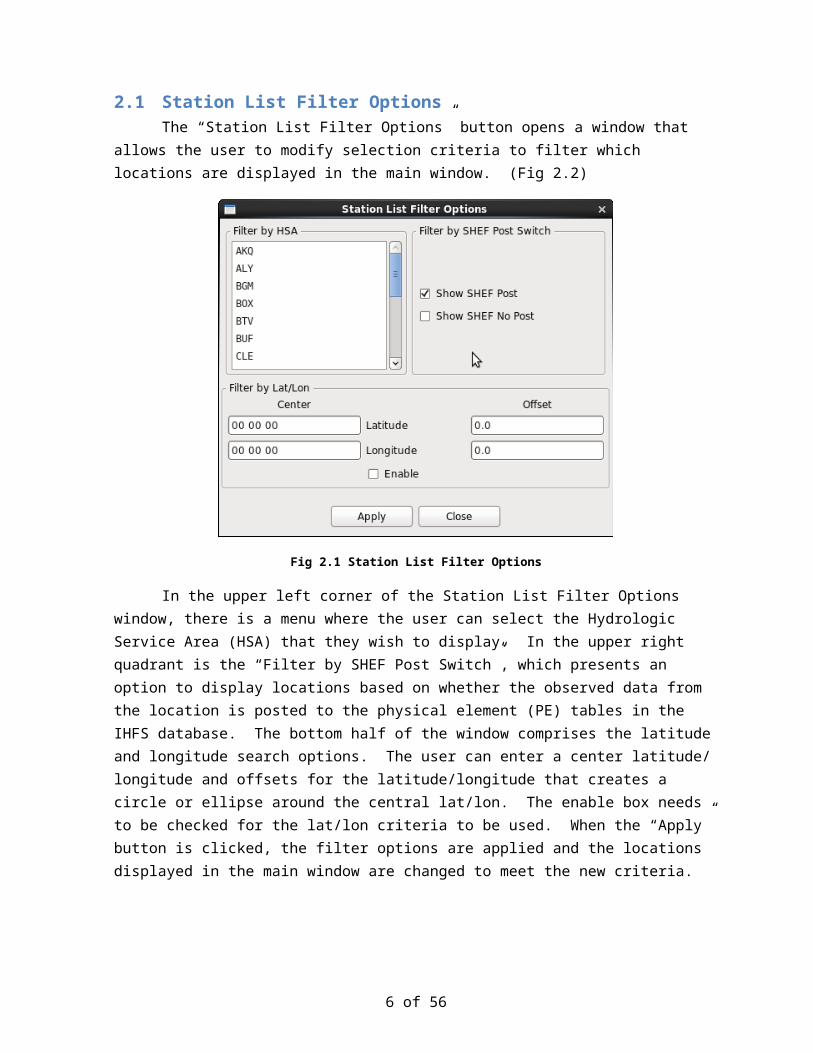
2.1 Station List Filter OptionsThe “Station List Filter Options” button opens a window that allows the user to modify
selection criteria to filter which locations are displayed in the main window. (Fig 2.2)
Fig 2.1 Station List Filter Options
In the upper left corner of the Station List Filter Options window, there is a menu where the user can select the Hydrologic Service Area (HSA) that they wish to display. In the upper right quadrant is the “Filter by SHEF Post Switch”, which presents an option to display locations based on whether the observed data from the location is posted to the physical element (PE) tables in the IHFS database. The bottom half of the window comprises the latitude and longitude search options. The user can enter a center latitude/ longitude and offsets for the latitude/longitude that creates a circle or ellipse around the central lat/lon. The enable box needs to be checked for the lat/lon criteria to be used. When the “Apply” button is clicked, the filter options are applied and the locations displayed in the main window are changed to meet the new criteria.
5 of 46
3.0 The File MenuThe File menu contains only two items: the Preferences window and the “Exit” button.
3.1 PreferencesThe Preferences window allows the user to choose the information that is displayed for each
location in the main HydroBase window and its default sort criteria. The preferences are saved when “OK” is clicked, and are used in the current session, but are not saved for use the next time that HydroBase is started. The checkboxes in the “Window Title String” section have no real effect. The “Fields Included” checkboxes control which fields are displayed in the main window, up to 3. The “Sort Criteria” checkboxes define the default ordering of the locations in the main window.
Fig 3.1 Preferences
4.0 The Location MenuThe Location window accesses the location table in the IHFS database and a number of other
tables that pertain to all locations in the IHFS database location table, meaning the data are not confined to river locations.
4.1 Add Location/Modify LocationThe “Add Location” and “Modify Location” menu items link to the same window. The
“Modify Location” menu item will fill in the boxes with information for the location that is highlighted in the main window, while the “Add Location” menu item will open a blank version of the window. This window contains two Page views, which can be selected from the pull-down menu in the upper left-hand corner, “Geophysical” (shown in Fig 4.1.1) and “Additional Info” (Fig 4.1.3).
6 of 46
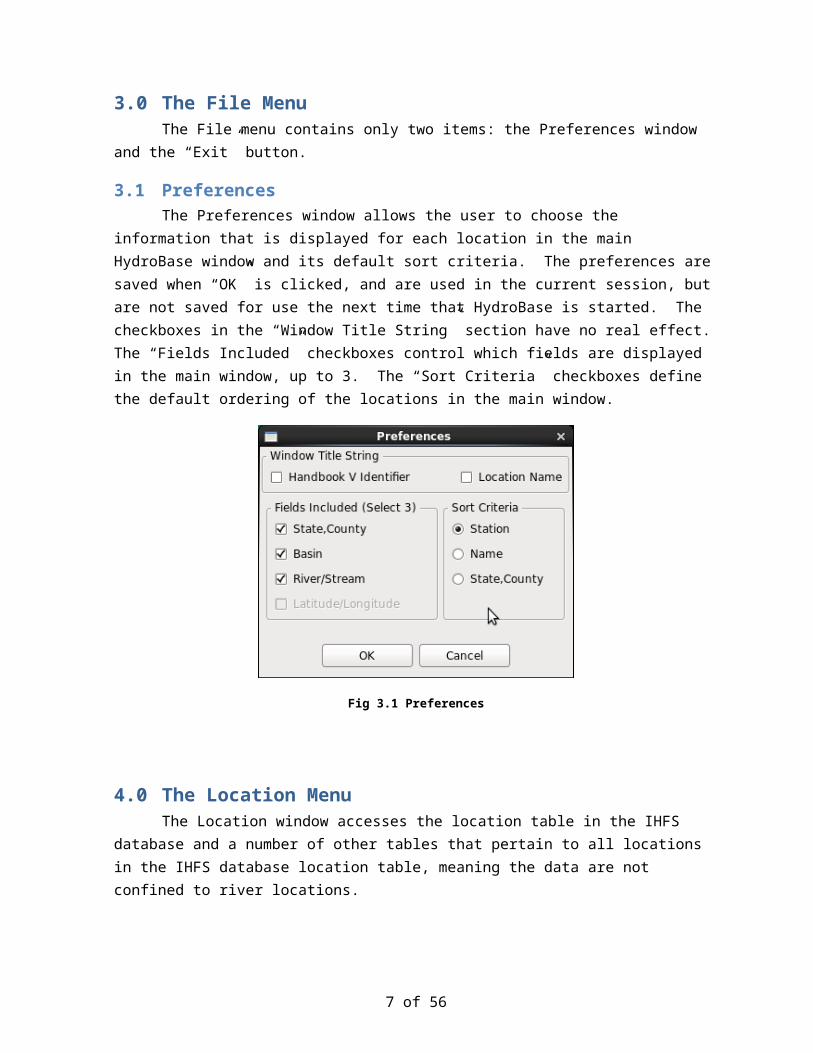
Fig 4.1.1 Modify Location – Geophysical View
The database requires that the latitude, longitude, county and state be explicitly defined in the GUI. Other fields, such as HSA, Network, RFC, WFO and Time Zone need to be defined, but the default values in the GUI may be used. The “Station Characteristics” section pulls information from the ingest filter and some other tables to display what type of data this station is associated with. The “Inactive” switch next to the “Location” box controls whether the location is used in RiverPro. If the “Inactive” box is checked, the location will not be displayed in RiverPro.
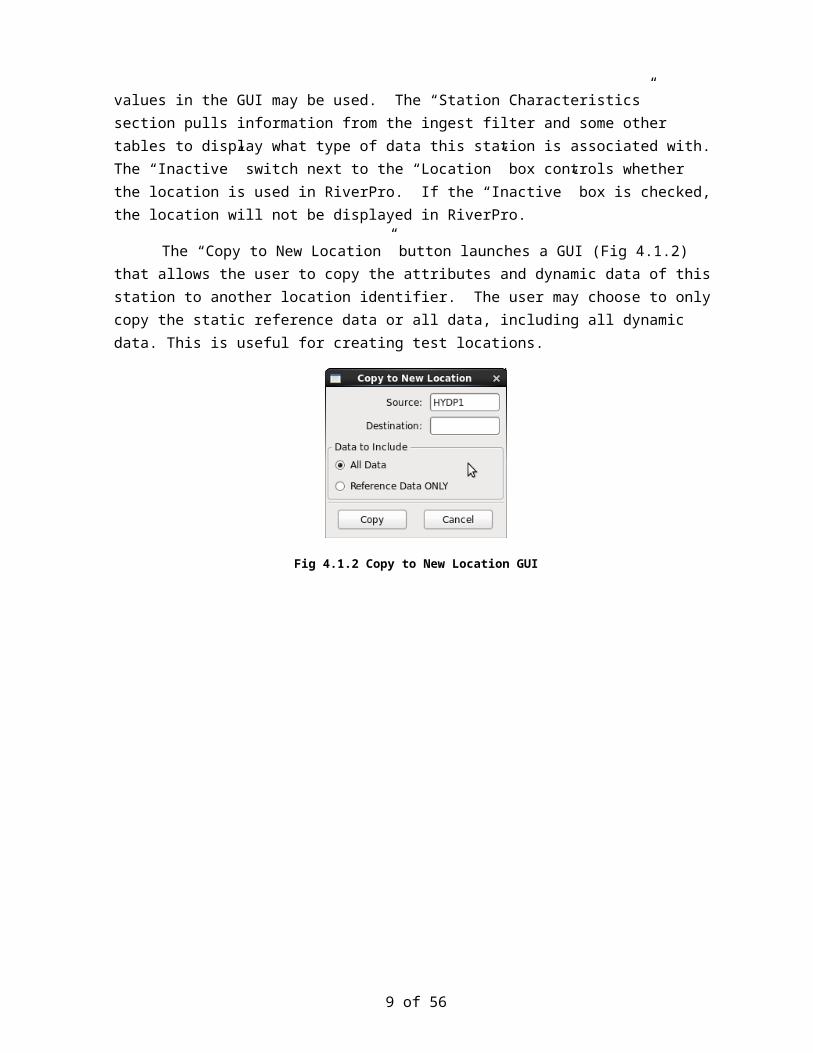
The “Copy to New Location” button launches a GUI (Fig 4.1.2) that allows the user to copy the attributes and dynamic data of this station to another location identifier. The user may choose to only copy the static reference data or all data, including all dynamic data. This is useful for creating test locations.
7 of 46
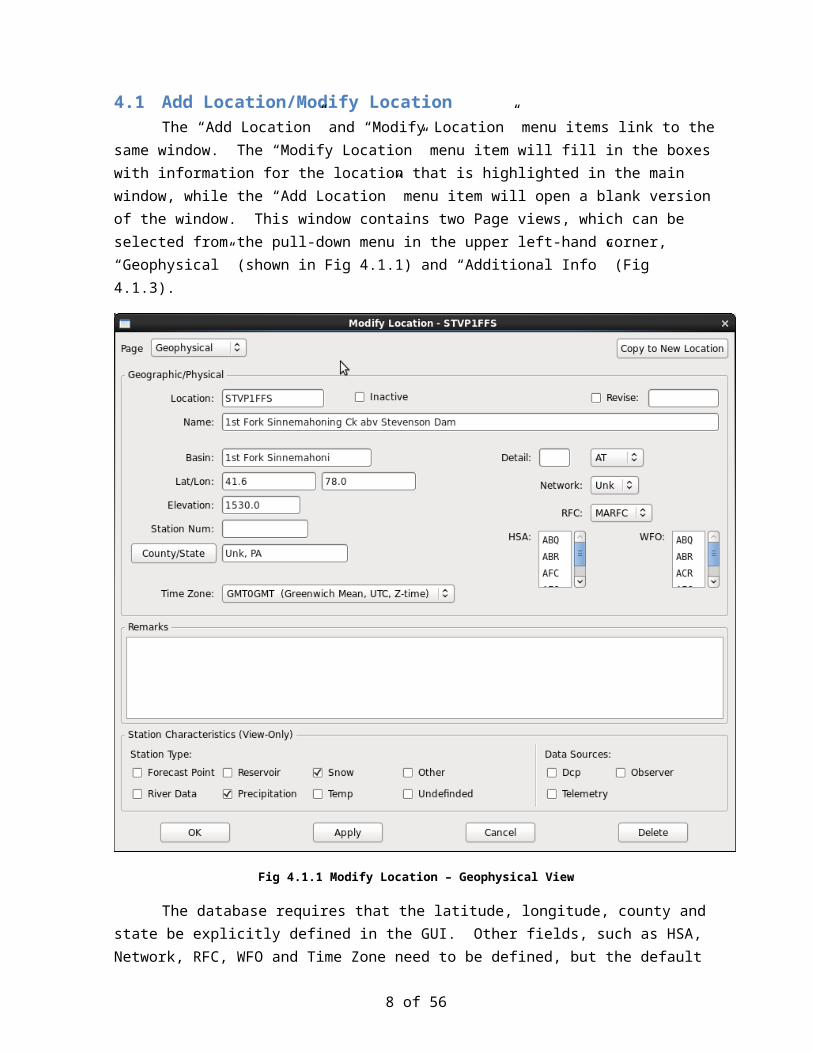
Fig 4.1.2 Copy to New Location GUI
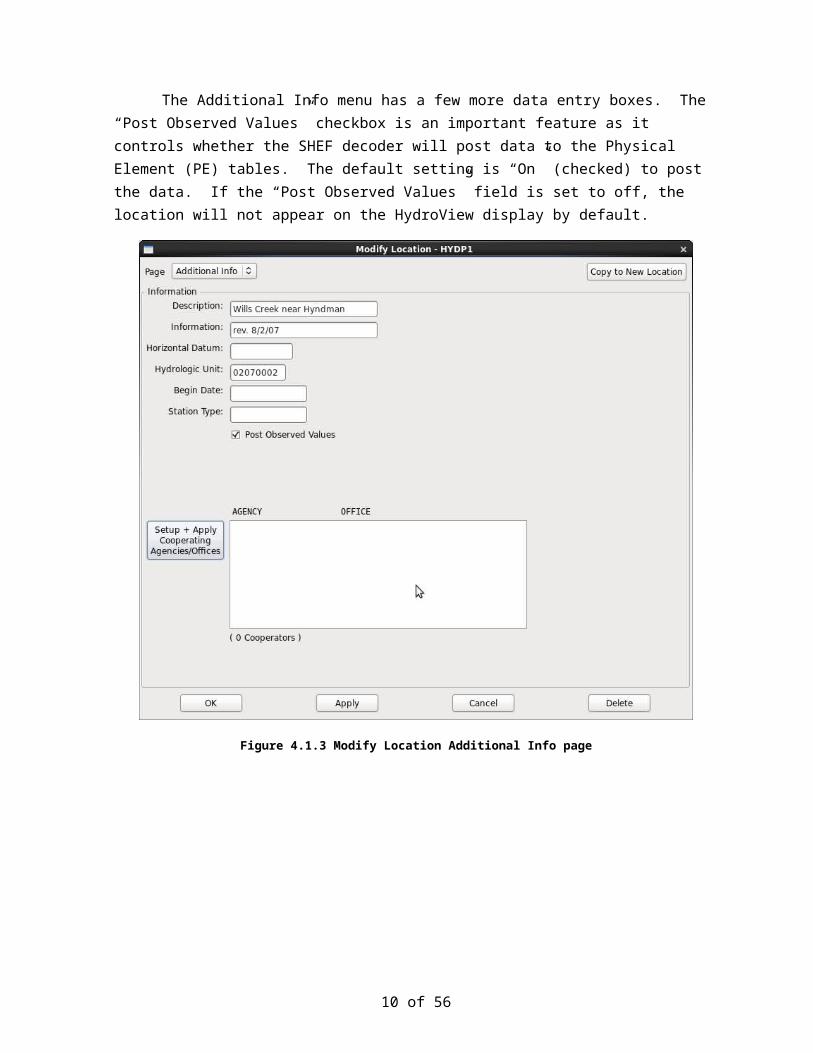
The Additional Info menu has a few more data entry boxes. The “Post Observed Values” checkbox is an important feature as it controls whether the SHEF decoder will post data to the Physical Element (PE) tables. The default setting is “On” (checked) to post the data. If the “Post Observed Values” field is set to off, the location will not appear on the HydroView display by default.
Figure 4.1.3 Modify Location Additional Info page
8 of 46
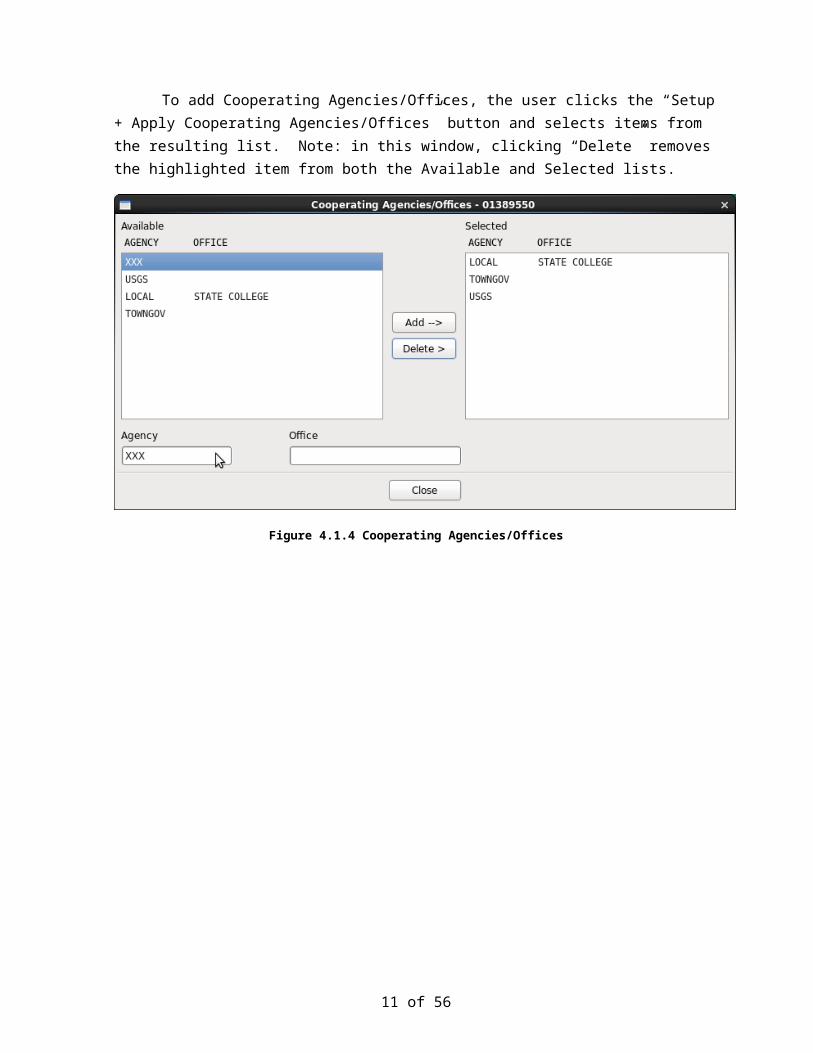
To add Cooperating Agencies/Offices, the user clicks the “Setup + Apply Cooperating Agencies/Offices” button and selects items from the resulting list. Note: in this window, clicking “Delete” removes the highlighted item from both the Available and Selected lists.
Figure 4.1.4 Cooperating Agencies/Offices
9 of 46
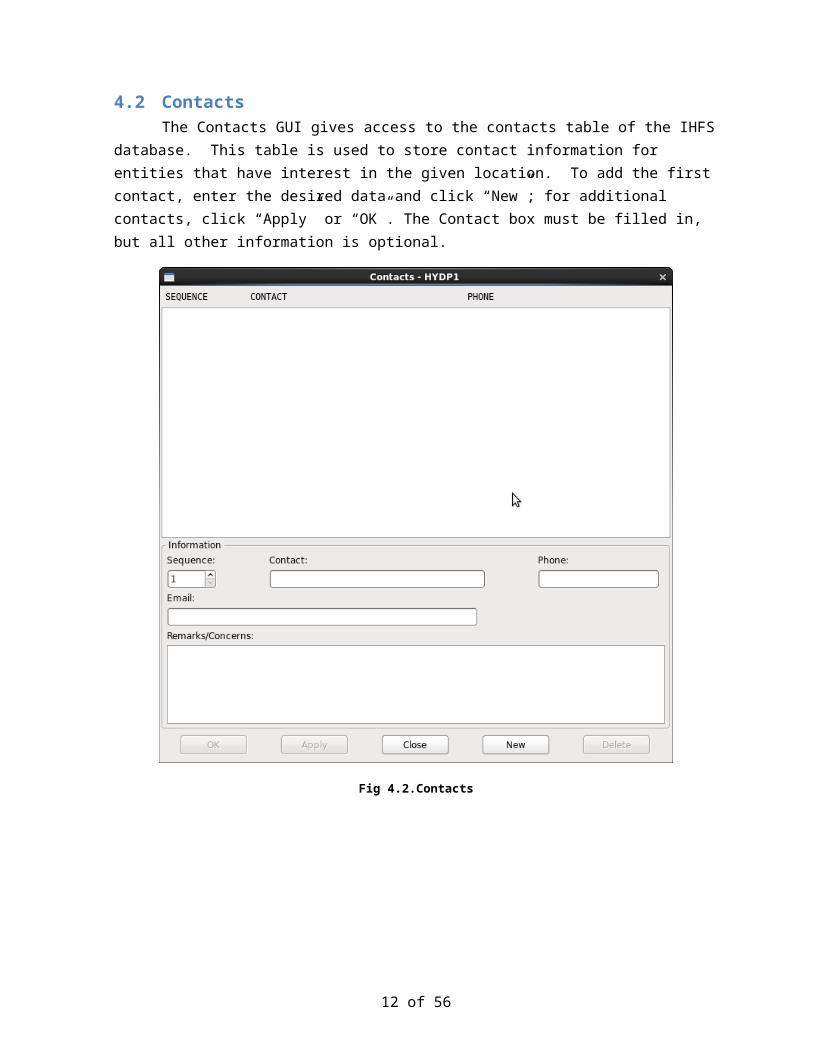
4.2 ContactsThe Contacts GUI gives access to the contacts table of the IHFS database. This table is used
to store contact information for entities that have interest in the given location. To add the first contact, enter the desired data and click “New”; for additional contacts, click “Apply” or “OK”. The Contact box must be filled in, but all other information is optional.
Fig 4.2.Contacts
10 of 46
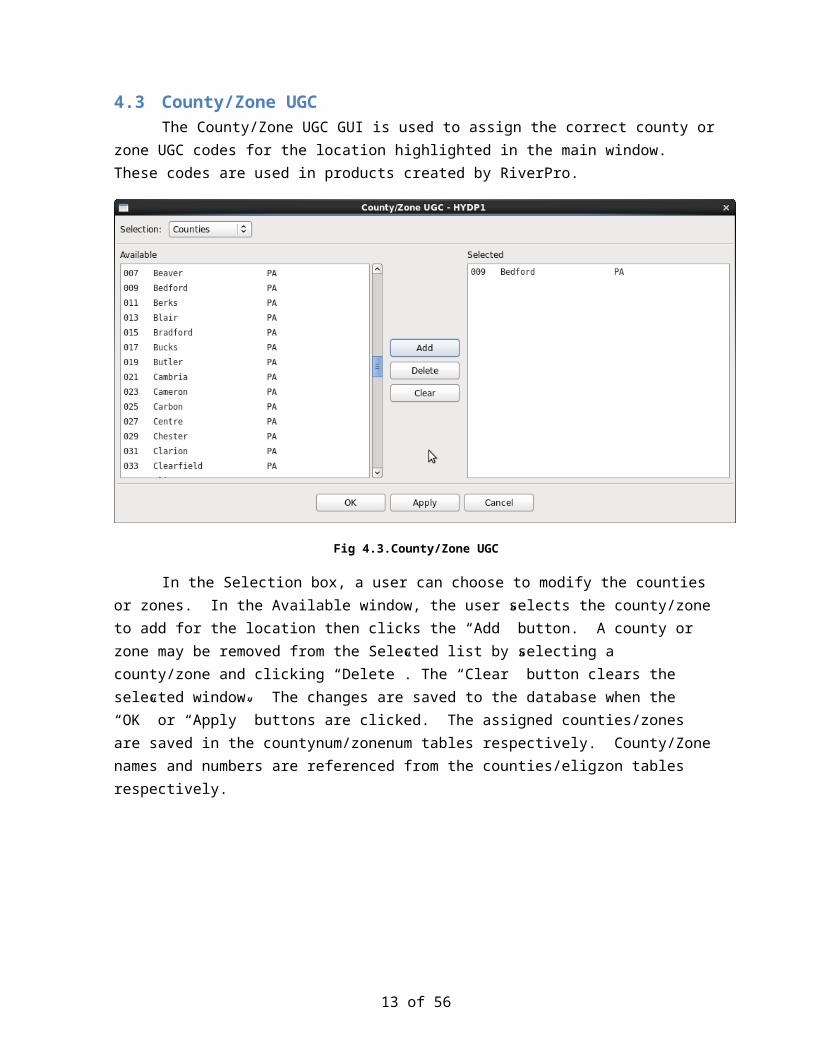
4.3 County/Zone UGCThe County/Zone UGC GUI is used to assign the correct county or zone UGC codes for the
location highlighted in the main window. These codes are used in products created by RiverPro.
Fig 4.3.County/Zone UGC
In the Selection box, a user can choose to modify the counties or zones. In the Available window, the user selects the county/zone to add for the location then clicks the “Add” button. A county or zone may be removed from the Selected list by selecting a county/zone and clicking “Delete”. The “Clear” button clears the selected window. The changes are saved to the database when the “OK” or “Apply” buttons are clicked. The assigned counties/zones are saved in the countynum/zonenum tables respectively. County/Zone names and numbers are referenced from the counties/eligzon tables respectively.
11 of 46
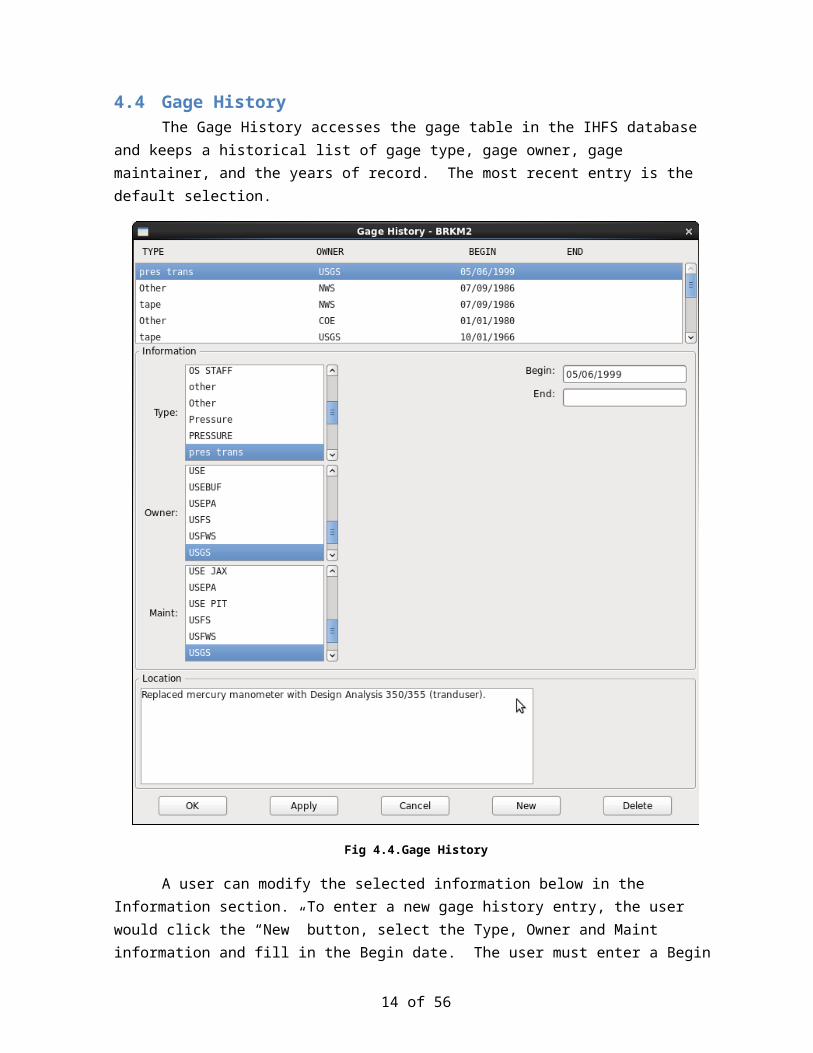
4.4 Gage HistoryThe Gage History accesses the gage table in the IHFS database and keeps a historical list of
gage type, gage owner, gage maintainer, and the years of record. The most recent entry is the default selection.
Fig 4.4.Gage History
A user can modify the selected information below in the Information section. To enter a new gage history entry, the user would click the “New” button, select the Type, Owner and Maint information and fill in the Begin date. The user must enter a Begin date or else an error will be generated. As gage info is added it is displayed in the table at the top. To delete an entry from this table, highlight it and click the “Delete” button.
12 of 46
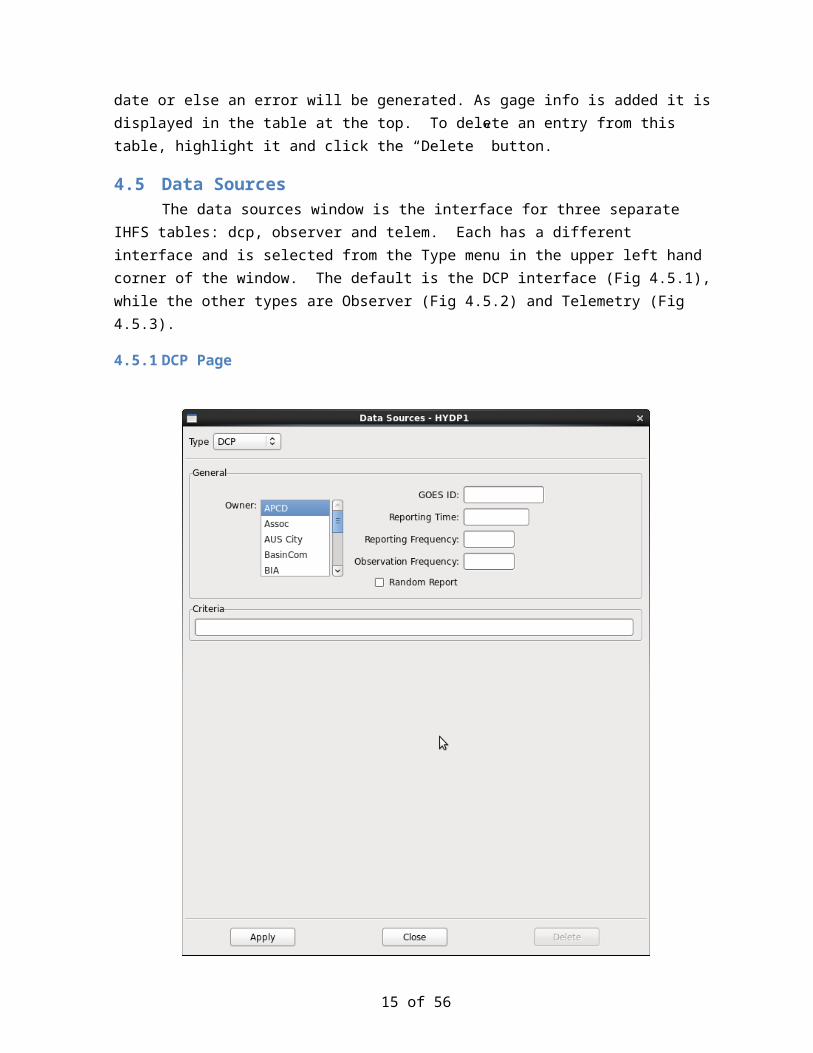
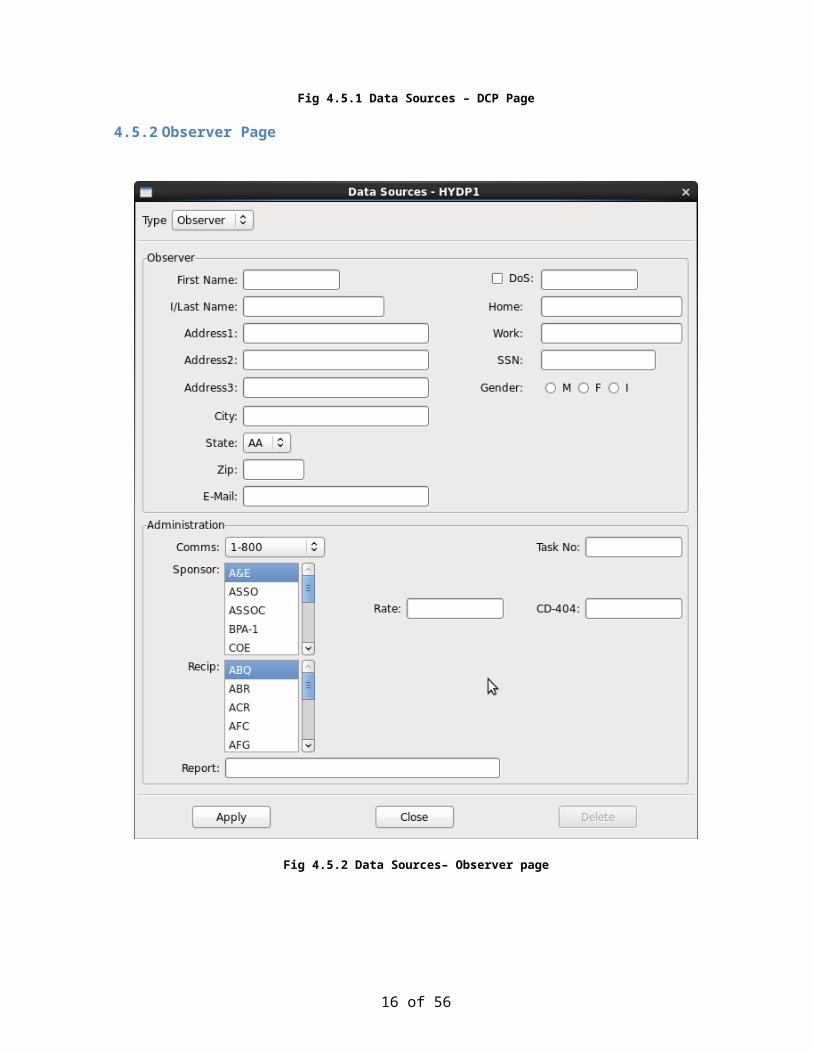
4.5 Data SourcesThe data sources window is the interface for three separate IHFS tables: dcp, observer and
telem. Each has a different interface and is selected from the Type menu in the upper left hand corner of the window. The default is the DCP interface (Fig 4.5.1), while the other types are Observer (Fig 4.5.2) and Telemetry (Fig 4.5.3).
4.5.1 DCP Page
Fig 4.5.1 Data Sources – DCP Page
13 of 46
4.5.2 Observer Page
Fig 4.5.2 Data Sources– Observer page
14 of 46
4.5.3 Telemetry Page
Fig 4.5.3 Data Sources– Telemetry Page
5.0 The River Gage MenuThe GUIs that are accessed from the River Gage menu are interfaces for IHFS database tables
that contain information about locations that are river or stream gauges.
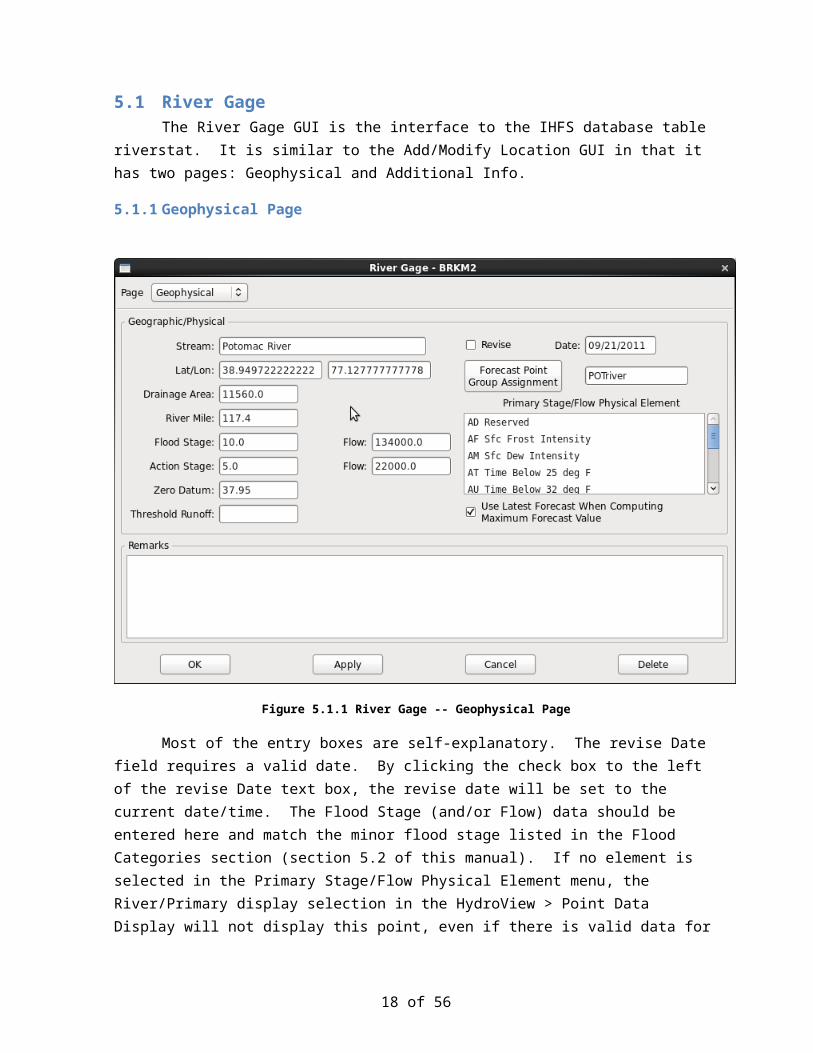
5.1 River GageThe River Gage GUI is the interface to the IHFS database table riverstat. It is similar to the
Add/Modify Location GUI in that it has two pages: Geophysical and Additional Info.
15 of 46
5.1.1 Geophysical Page
Figure 5.1.1 River Gage -- Geophysical Page
Most of the entry boxes are self-explanatory. The revise Date field requires a valid date. By clicking the check box to the left of the revise Date text box, the revise date will be set to the current date/time. The Flood Stage (and/or Flow) data should be entered here and match the minor flood stage listed in the Flood Categories section (section 5.2 of this manual). If no element is selected in the Primary Stage/Flow Physical Element menu, the River/Primary display selection in the HydroView > Point Data Display will not display this point, even if there is valid data for it. This parameter is also used by RiverPro to determine which physical element to use for its observed and forecast time series.
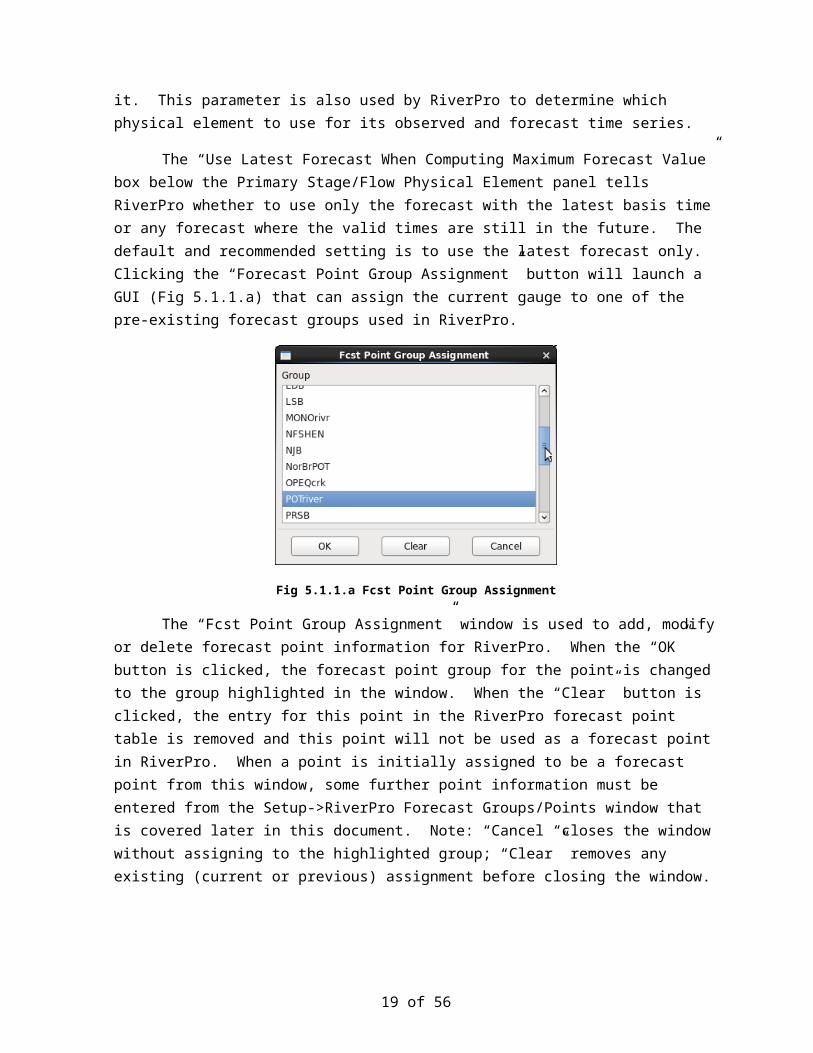
The “Use Latest Forecast When Computing Maximum Forecast Value” box below the Primary Stage/Flow Physical Element panel tells RiverPro whether to use only the forecast with the latest basis time or any forecast where the valid times are still in the future. The default and recommended setting is to use the latest forecast only. Clicking the “Forecast Point Group Assignment” button will launch a GUI (Fig 5.1.1.a) that can assign the current gauge to one of the pre-existing forecast groups used in RiverPro.
16 of 46
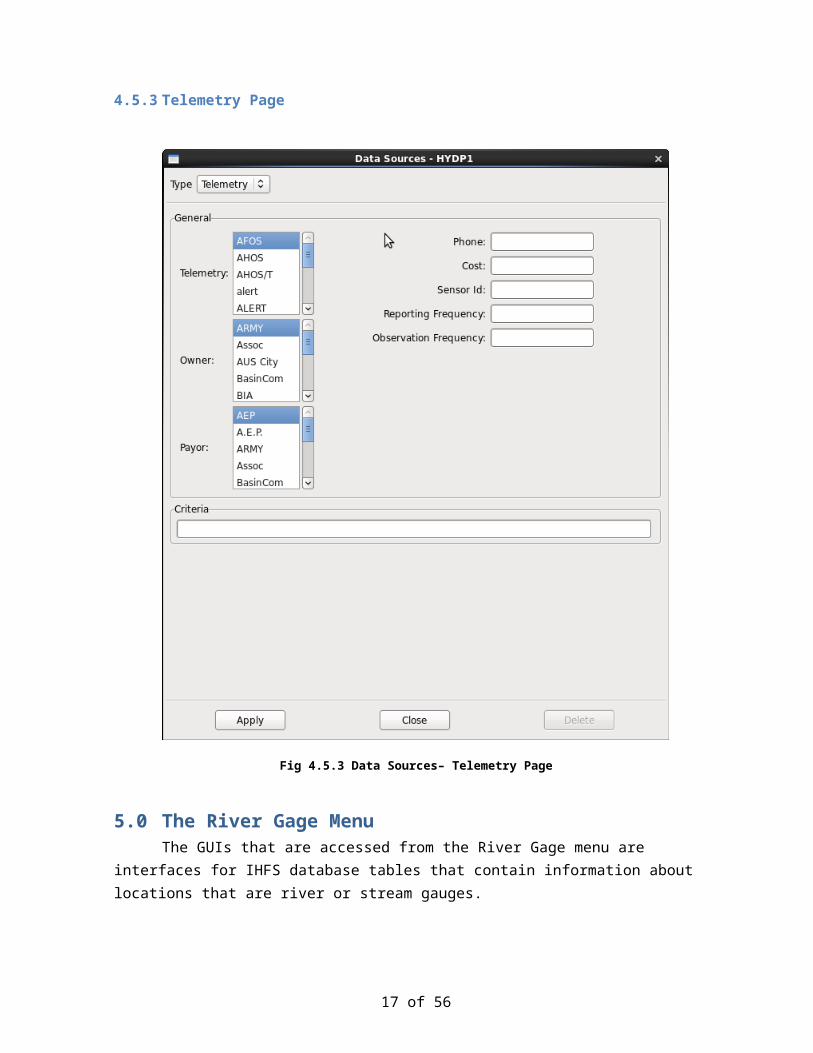
Fig 5.1.1.a Fcst Point Group Assignment
The “Fcst Point Group Assignment” window is used to add, modify or delete forecast point information for RiverPro. When the “OK” button is clicked, the forecast point group for the point is changed to the group highlighted in the window. When the “Clear” button is clicked, the entry for this point in the RiverPro forecast point table is removed and this point will not be used as a forecast point in RiverPro. When a point is initially assigned to be a forecast point from this window, some further point information must be entered from the Setup->RiverPro Forecast Groups/Points window that is covered later in this document. Note: “Cancel “closes the window without assigning to the highlighted group; “Clear” removes any existing (current or previous) assignment before closing the window.
17 of 46
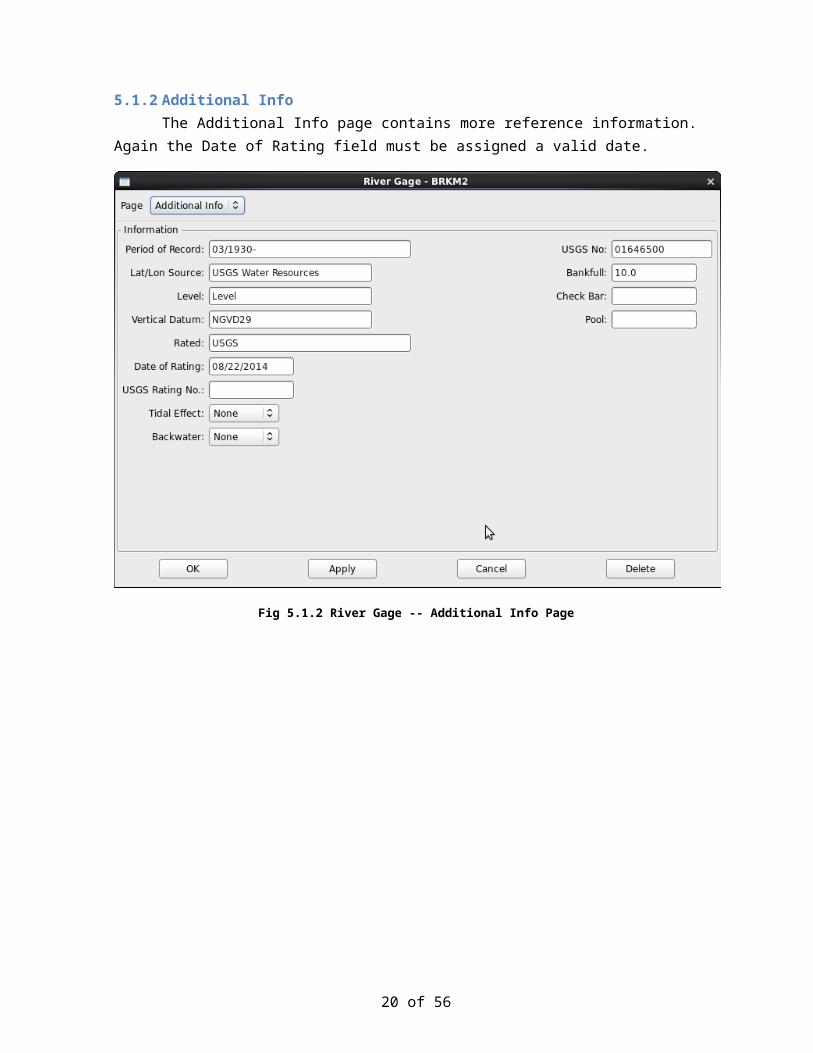
5.1.2 Additional Info The Additional Info page contains more reference information. Again the Date of Rating field
must be assigned a valid date.
Fig 5.1.2 River Gage -- Additional Info Page
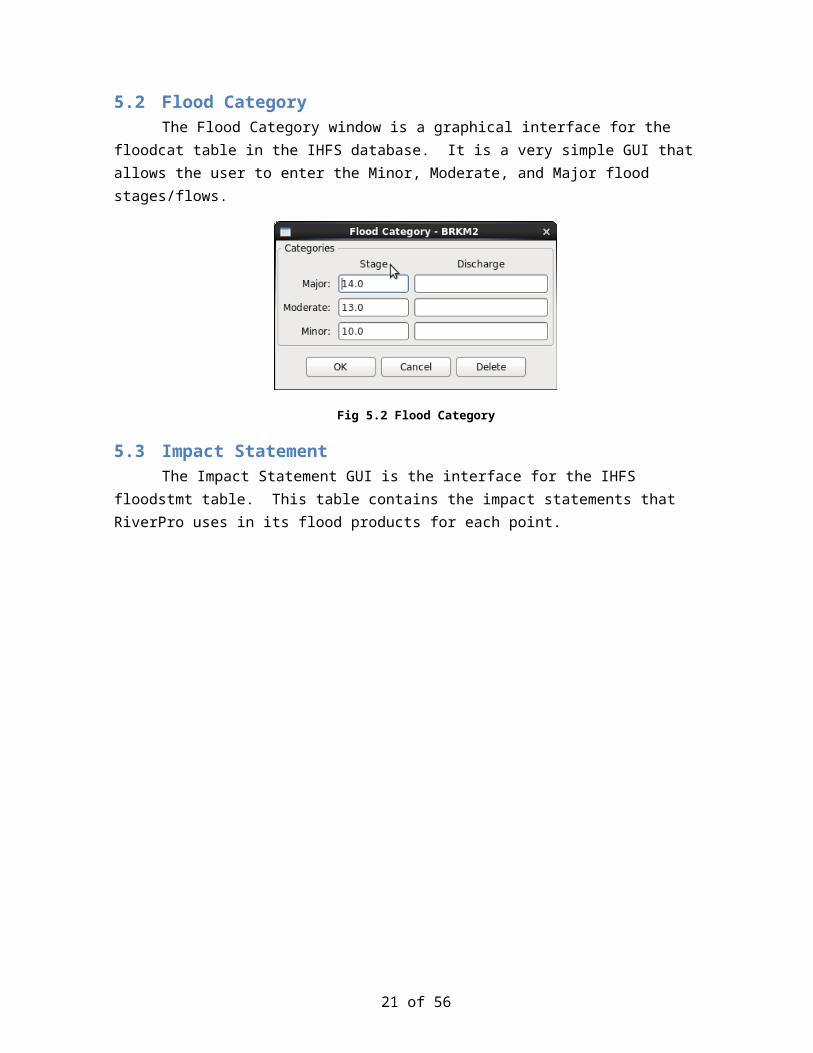
5.2 Flood CategoryThe Flood Category window is a graphical interface for the floodcat table in the IHFS
database. It is a very simple GUI that allows the user to enter the Minor, Moderate, and Major flood stages/flows.
Fig 5.2 Flood Category
18 of 46
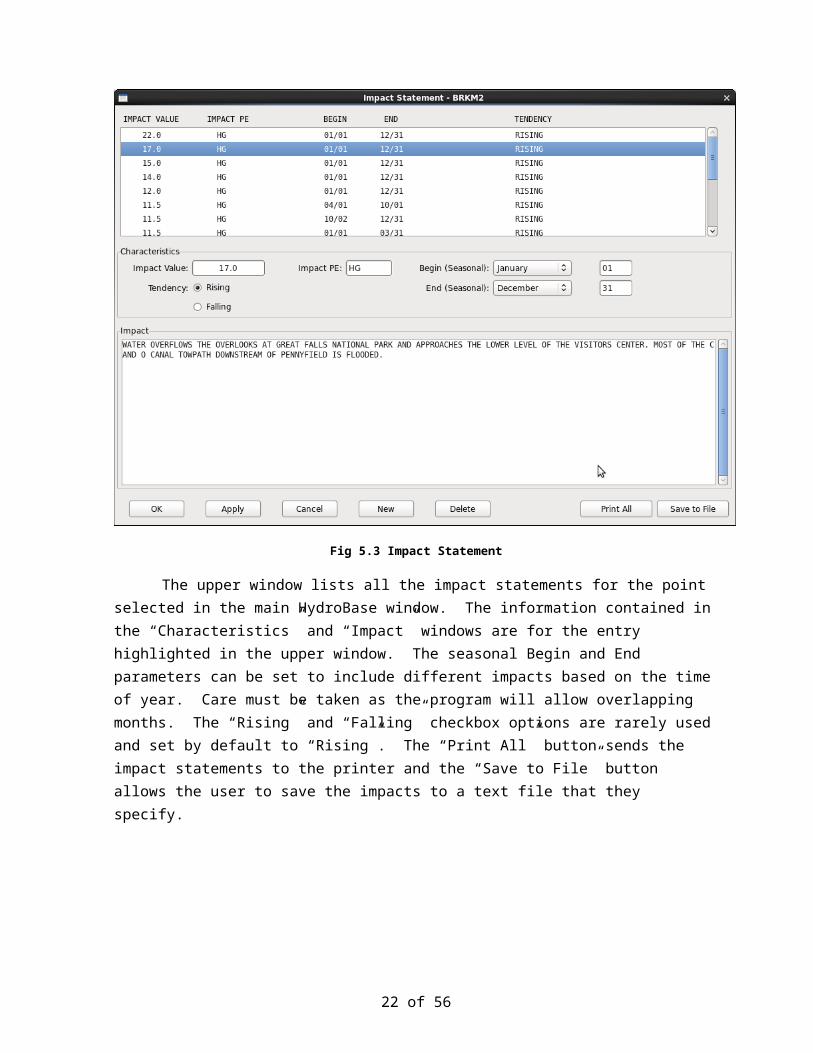
5.3 Impact StatementThe Impact Statement GUI is the interface for the IHFS floodstmt table. This table contains
the impact statements that RiverPro uses in its flood products for each point.
Fig 5.3 Impact Statement
The upper window lists all the impact statements for the point selected in the main HydroBase window. The information contained in the “Characteristics” and “Impact” windows are for the entry highlighted in the upper window. The seasonal Begin and End parameters can be set to include different impacts based on the time of year. Care must be taken as the program will allow overlapping months. The “Rising” and “Falling” checkbox options are rarely used and set by default to “Rising”. The “Print All” button sends the impact statements to the printer and the “Save to File” button allows the user to save the impacts to a text file that they specify.
19 of 46
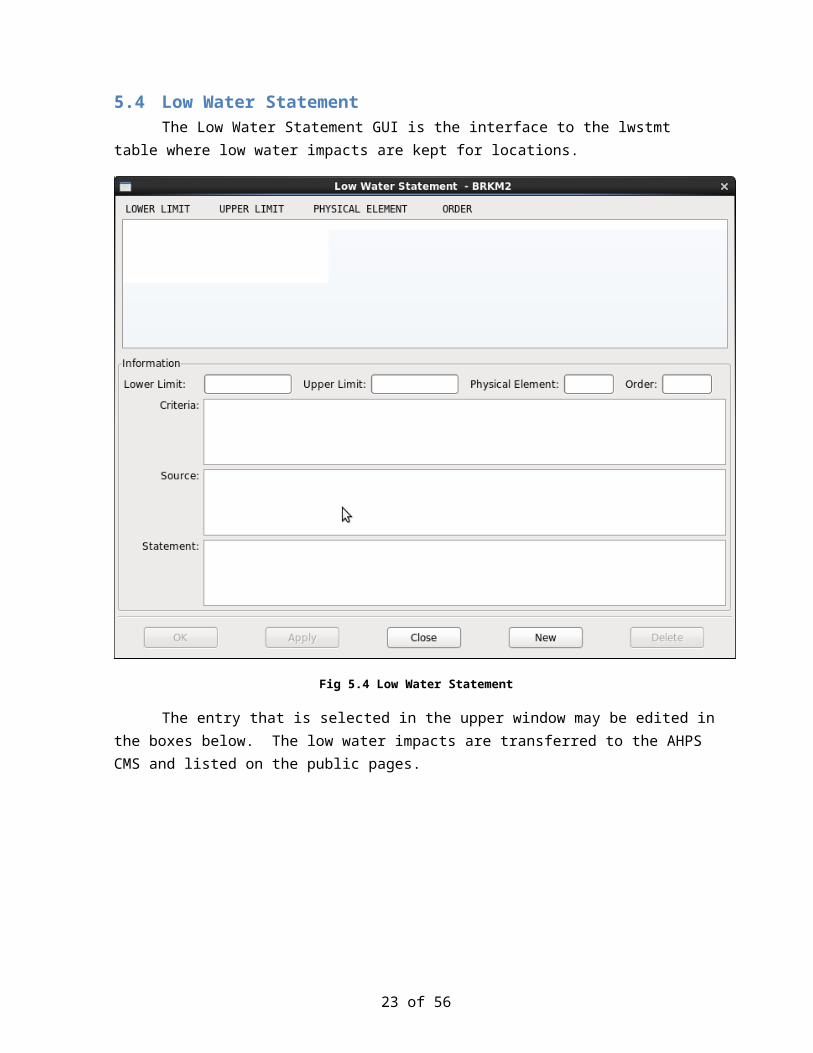
5.4 Low Water StatementThe Low Water Statement GUI is the interface to the lwstmt table where low water impacts
are kept for locations.
Fig 5.4 Low Water Statement
The entry that is selected in the upper window may be edited in the boxes below. The low water impacts are transferred to the AHPS CMS and listed on the public pages.
20 of 46
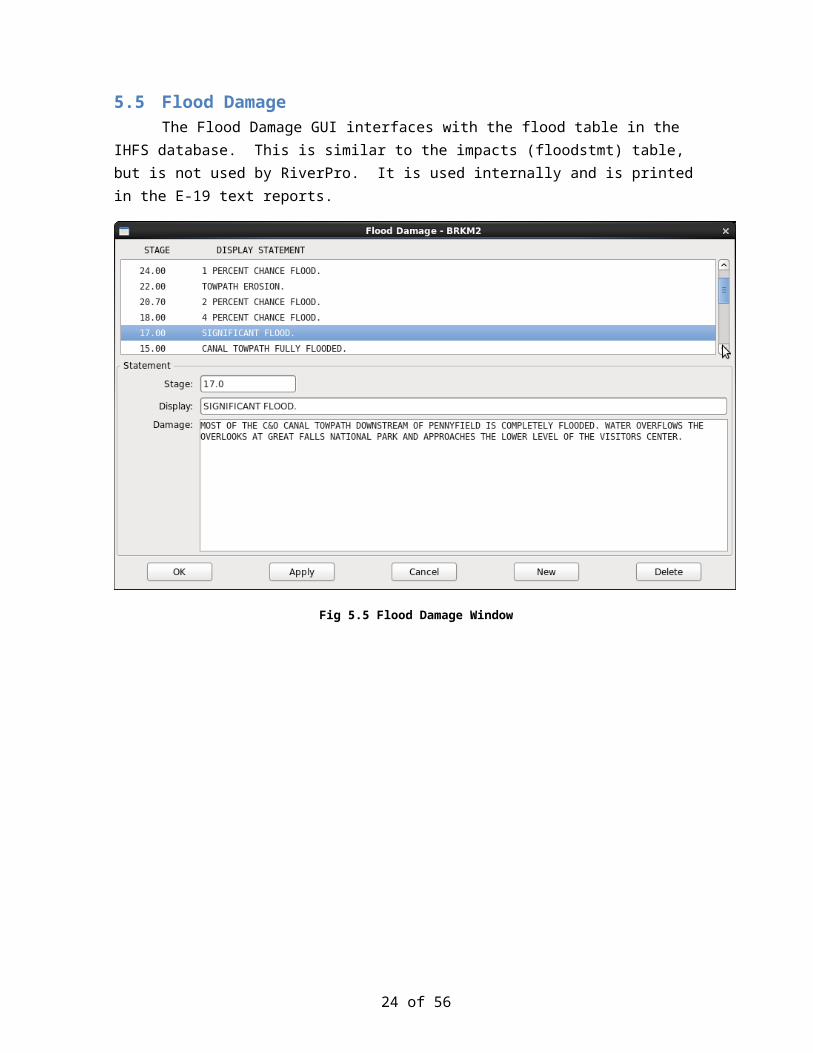
5.5 Flood DamageThe Flood Damage GUI interfaces with the flood table in the IHFS database. This is similar to
the impacts (floodstmt) table, but is not used by RiverPro. It is used internally and is printed in the E-19 text reports.
Fig 5.5 Flood Damage Window
21 of 46
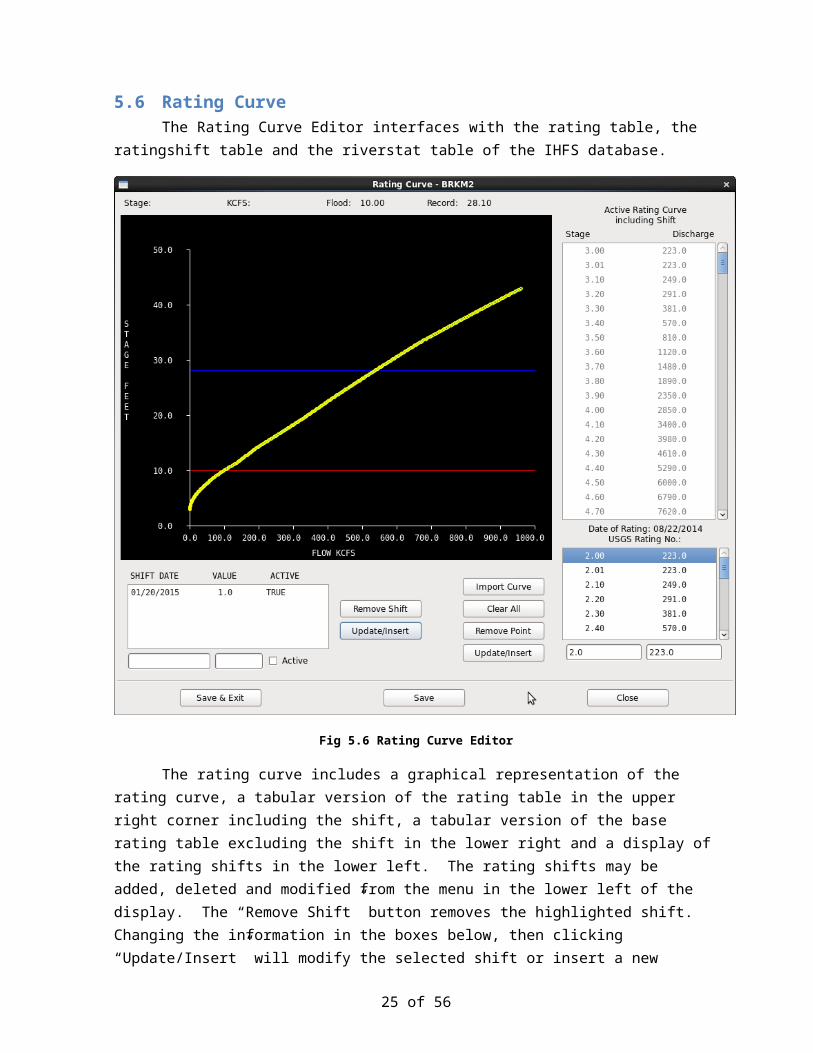
5.6 Rating CurveThe Rating Curve Editor interfaces with the rating table, the ratingshift table and the riverstat
table of the IHFS database.
Fig 5.6 Rating Curve Editor
The rating curve includes a graphical representation of the rating curve, a tabular version of the rating table in the upper right corner including the shift, a tabular version of the base rating table excluding the shift in the lower right and a display of the rating shifts in the lower left. The rating shifts may be added, deleted and modified from the menu in the lower left of the display. The “Remove Shift” button removes the highlighted shift. Changing the information in the boxes below, then clicking “Update/Insert” will modify the selected shift or insert a new shift. The “Active” checkbox indicates whether the shift is to be applied to the rating curve or not. If more than one of the shifts is set to Active, then the most recent active shift is used. Again the shift date is in the form MM/DD/YYYY.
22 of 46
The base rating curve may be modified with the buttons and text boxes on the lower right of the display. The Date of Rating and USGS Rate Number are pulled from the riverstat table and may be edited in the River Gage GUI. If no rating curve is present, then the “Import Curve” button will be enabled and a rating table from a text file may be imported into the database. The “Clear All” button deletes the entire rating curve from the database while “Remove Point” button deletes the selected stage/discharge pair. The “Update/Insert” button will apply changes made in the text boxes below the table to the selected point or insert a new point.
Modifications made in the editor are not saved to the database until either the “Save Changes” or “Save and Exit” buttons are clicked.
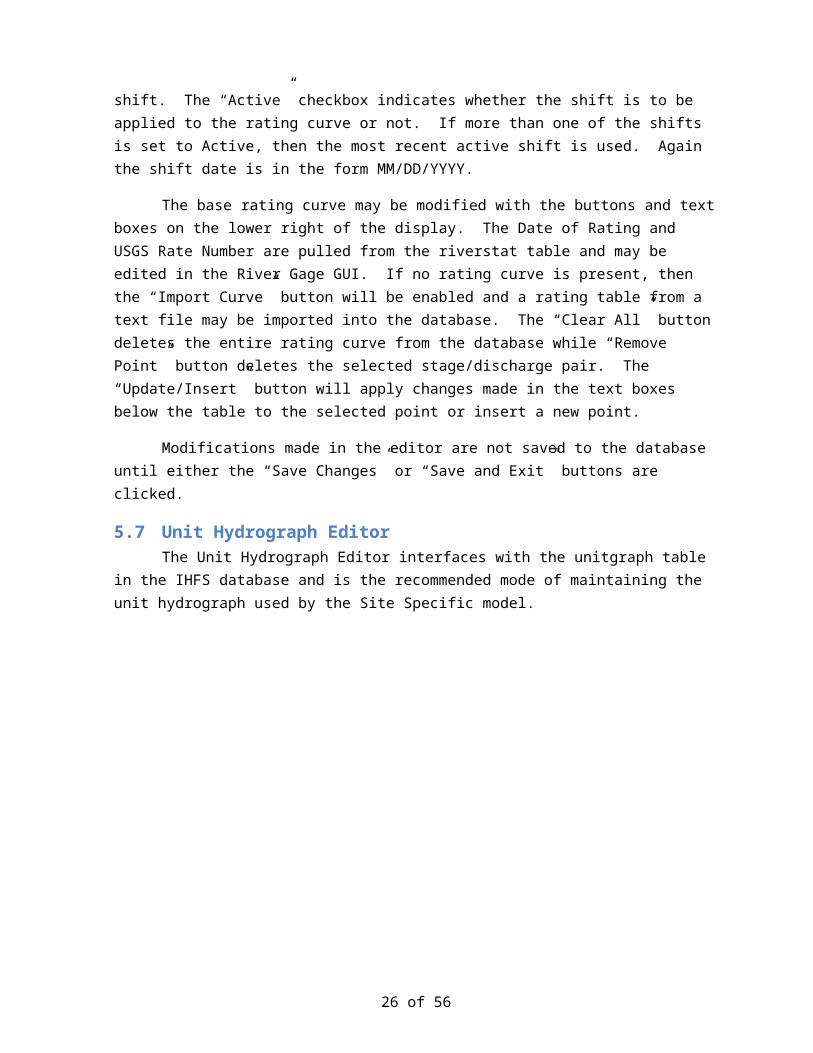
5.7 Unit Hydrograph EditorThe Unit Hydrograph Editor interfaces with the unitgraph table in the IHFS database and is
the recommended mode of maintaining the unit hydrograph used by the Site Specific model.
Fig 5.7 Unit Hydrograph Editor
The Unit Hydrograph Editor has a graphical display for the selected unit hydrograph and a tabular display for all unit hydrograph points. There may be more than one unit hydrograph at each location and they would appear in the table below the graph. Below the table is a section to modify or add entries in the unitgraph table. The “Save” and “Delete” buttons on the bottom of the display function on the entire unit hydrograph.
23 of 46
Hydrographs may be imported from a text file or exported to a text file in the /awips2/edex/data/share/hydroapps/whfs/local/data/import/ directory in AWIPS2 (or the /awips/hydroapps/whfs/local/data/import/ directory in AWIPS1).
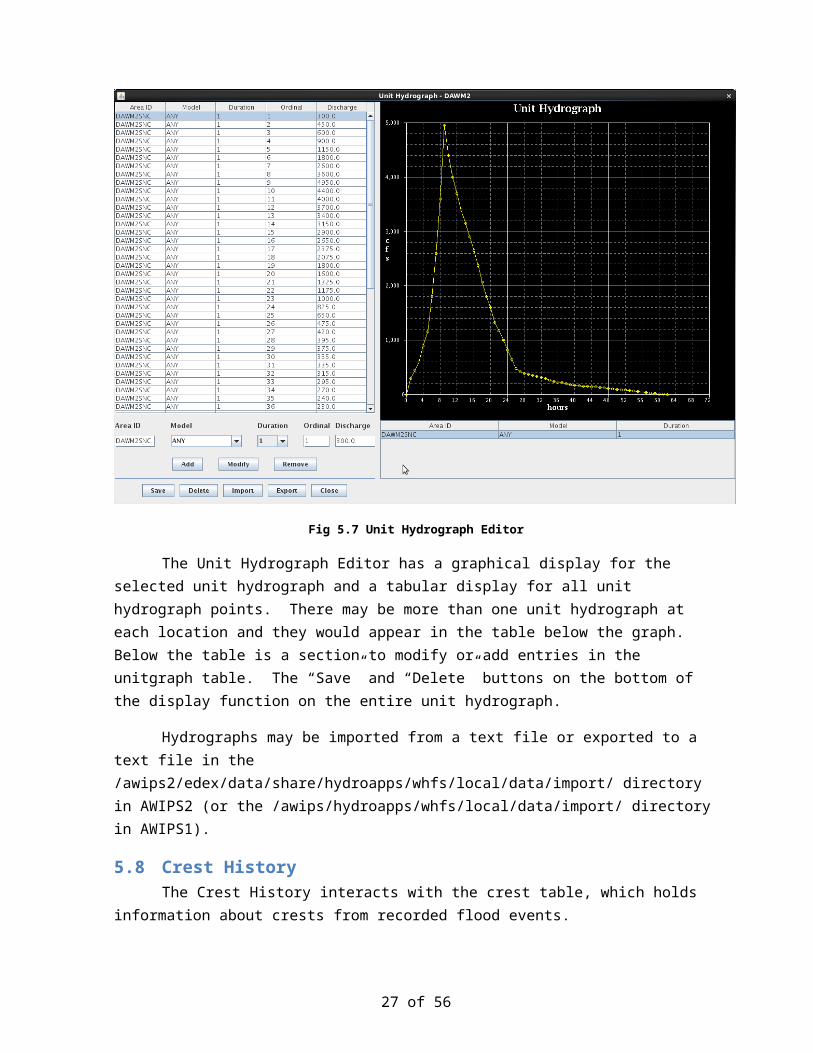
5.8 Crest HistoryThe Crest History interacts with the crest table, which holds information about crests from
recorded flood events.
Fig 5.8 Crest History
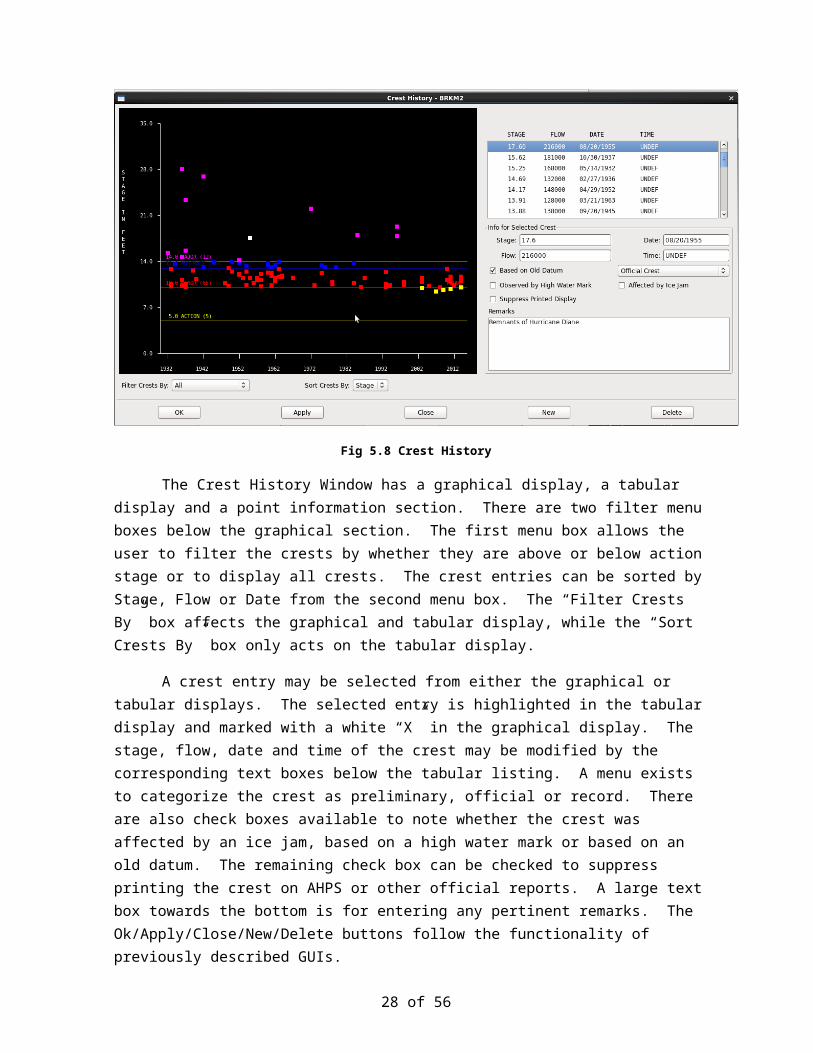
The Crest History Window has a graphical display, a tabular display and a point information section. There are two filter menu boxes below the graphical section. The first menu box allows the user to filter the crests by whether they are above or below action stage or to display all crests. The crest entries can be sorted by Stage, Flow or Date from the second menu box. The “Filter Crests By” box affects the graphical and tabular display, while the “Sort Crests By” box only acts on the tabular display.
A crest entry may be selected from either the graphical or tabular displays. The selected entry is highlighted in the tabular display and marked with a white “X” in the graphical display. The stage, flow, date and time of the crest may be modified by the corresponding text boxes below the tabular listing. A menu exists to categorize the crest as preliminary, official or record. There are also check boxes available to note whether the crest was affected by an ice jam, based on a high water mark or based on an old datum. The remaining check box can be checked to suppress printing the crest on AHPS or other official reports. A large text box towards the bottom is for entering any pertinent remarks. The Ok/Apply/Close/New/Delete buttons follow the functionality of previously described GUIs.
24 of 46
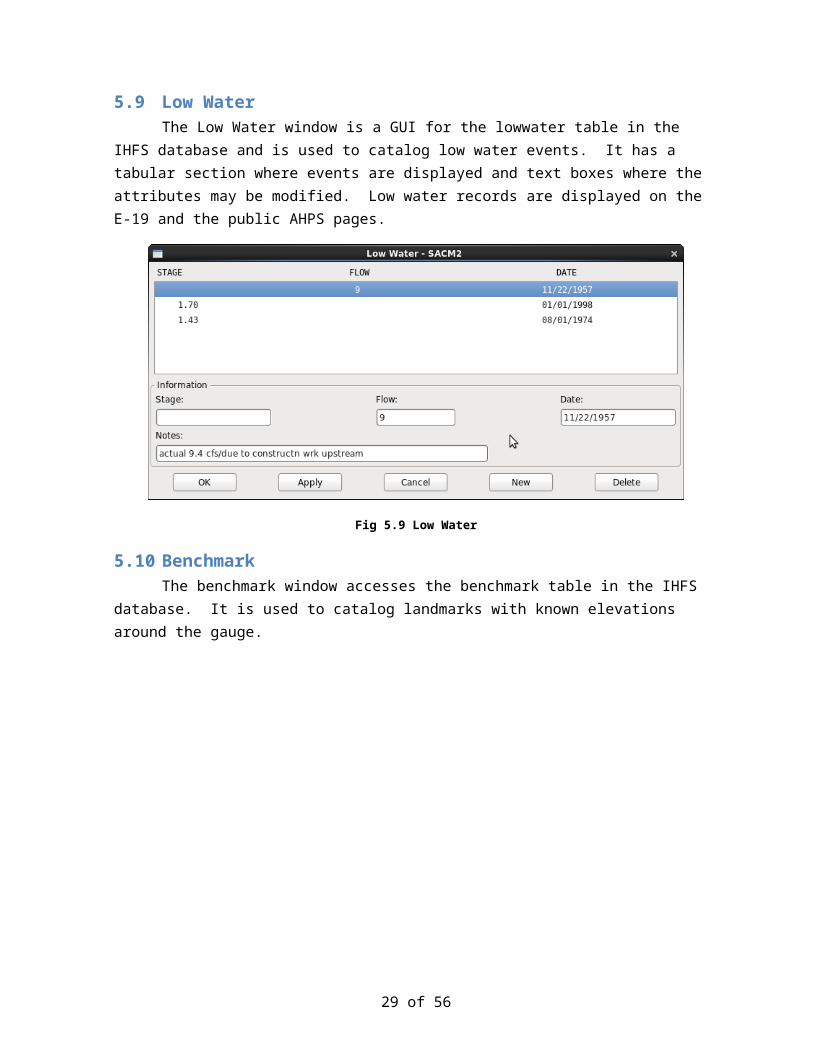
5.9 Low WaterThe Low Water window is a GUI for the lowwater table in the IHFS database and is used to
catalog low water events. It has a tabular section where events are displayed and text boxes where the attributes may be modified. Low water records are displayed on the E-19 and the public AHPS pages.
Fig 5.9 Low Water
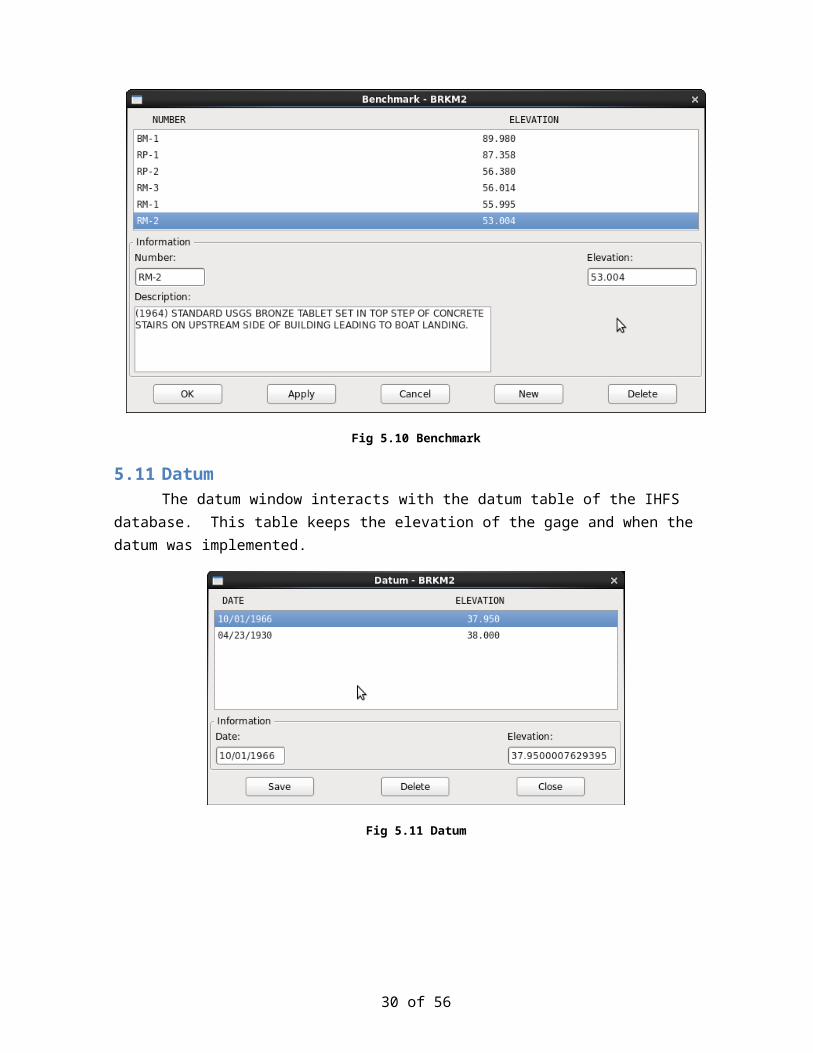
5.10 BenchmarkThe benchmark window accesses the benchmark table in the IHFS database. It is used to
catalog landmarks with known elevations around the gauge.
Fig 5.10 Benchmark
25 of 46
5.11 DatumThe datum window interacts with the datum table of the IHFS database. This table keeps the
elevation of the gage and when the datum was implemented.
Fig 5.11 Datum
26 of 46
5.12 DescriptionThe description window interfaces with the descript and locarea tables in the IHFS database.
These tables contain descriptions of the environment around the gauge. Several of these attributes are used by RiverPro.
Fig 5.12 Description
The proximity field at the top of the GUI is used in RiverPro as the <Proximity> variable. It describes how the gauge is situated with respect to its listed location. The pull-down menu accesses the proximity table so that only a predetermined list of attributes is allowable. The Reach field is also used by RiverPro as the <Reach> variable and also to denote whether the location is a weir location. RiverPro has special processing available for weir locations, which is triggered when the word “weir” appears in the Reach field. See the RiverPro manual for more details about the weir processing.
The “Affected Areas” field is from the locarea table and equivalent to the <LocGeoArea> variable in RiverPro. This field is sometimes used to save lat/lon points for polygon drawing on the national warnings map.
27 of 46
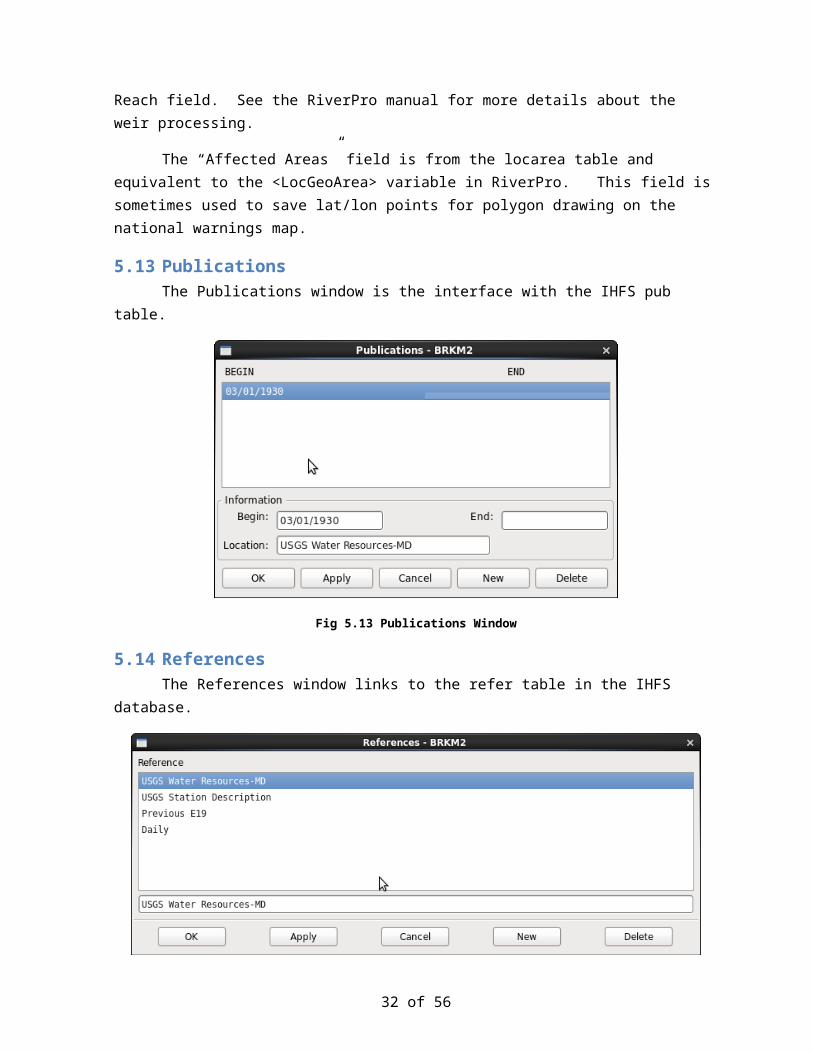
5.13 PublicationsThe Publications window is the interface with the IHFS pub table.
Fig 5.13 Publications Window
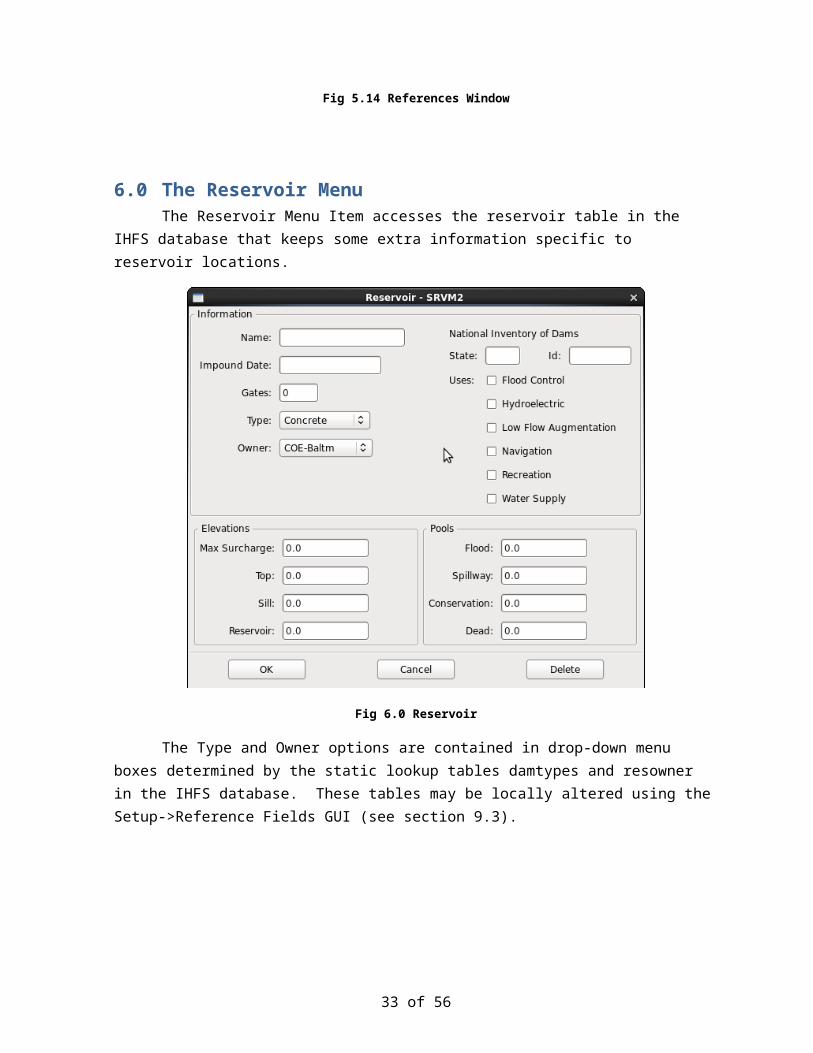
5.14 ReferencesThe References window links to the refer table in the IHFS database.
Fig 5.14 References Window
28 of 46
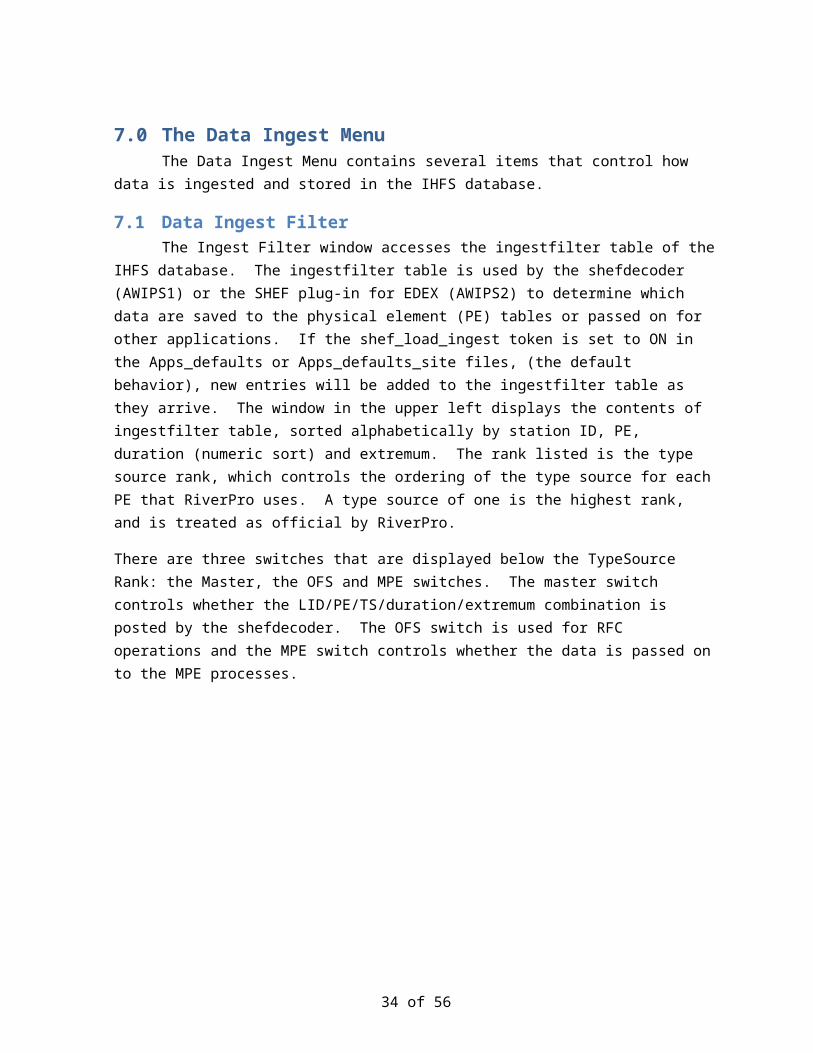
6.0 The Reservoir MenuThe Reservoir Menu Item accesses the reservoir table in the IHFS database that keeps some
extra information specific to reservoir locations.
Fig 6.0 Reservoir
The Type and Owner options are contained in drop-down menu boxes determined by the static lookup tables damtypes and resowner in the IHFS database. These tables may be locally altered using the Setup->Reference Fields GUI (see section 9.3).
29 of 46
7.0 The Data Ingest MenuThe Data Ingest Menu contains several items that control how data is ingested and stored in
the IHFS database.
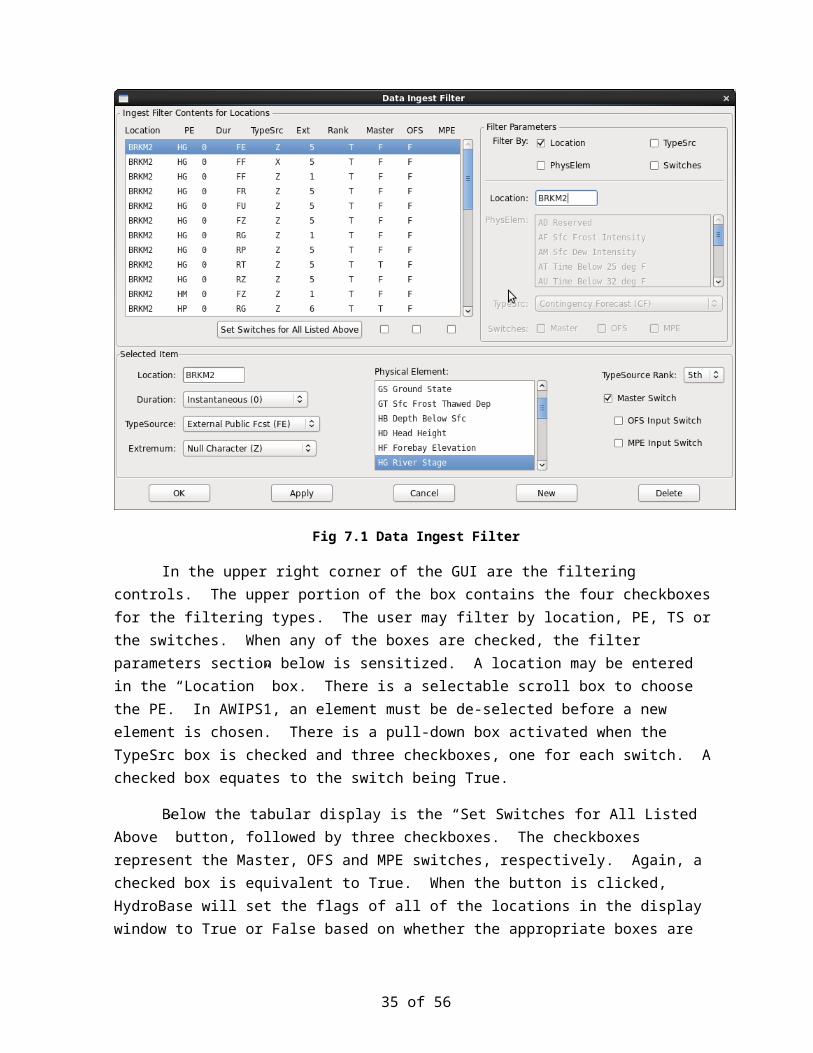
7.1 Data Ingest FilterThe Ingest Filter window accesses the ingestfilter table of the IHFS database. The ingestfilter
table is used by the shefdecoder (AWIPS1) or the SHEF plug-in for EDEX (AWIPS2) to determine which data are saved to the physical element (PE) tables or passed on for other applications. If the shef_load_ingest token is set to ON in the Apps_defaults or Apps_defaults_site files, (the default behavior), new entries will be added to the ingestfilter table as they arrive. The window in the upper left displays the contents of ingestfilter table, sorted alphabetically by station ID, PE, duration (numeric sort) and extremum. The rank listed is the type source rank, which controls the ordering of the type source for each PE that RiverPro uses. A type source of one is the highest rank, and is treated as official by RiverPro.
There are three switches that are displayed below the TypeSource Rank: the Master, the OFS and MPE switches. The master switch controls whether the LID/PE/TS/duration/extremum combination is posted by the shefdecoder. The OFS switch is used for RFC operations and the MPE switch controls whether the data is passed on to the MPE processes.
30 of 46
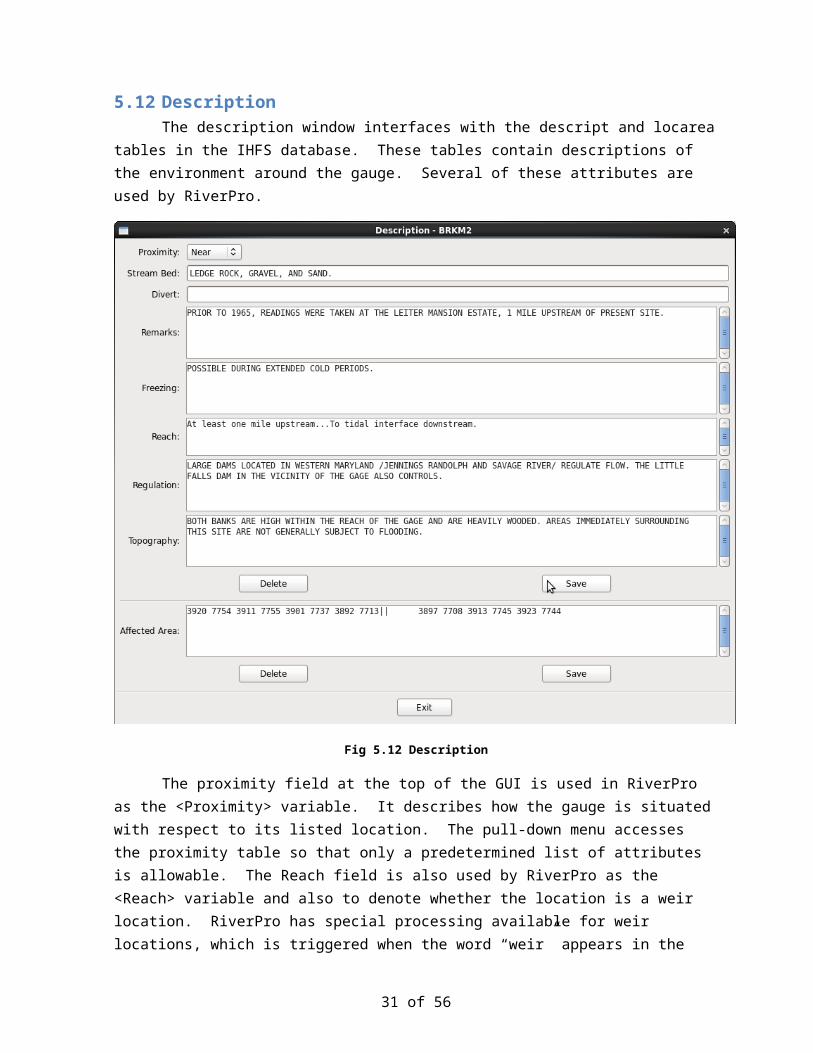
Fig 7.1 Data Ingest Filter
In the upper right corner of the GUI are the filtering controls. The upper portion of the box contains the four checkboxes for the filtering types. The user may filter by location, PE, TS or the switches. When any of the boxes are checked, the filter parameters section below is sensitized. A location may be entered in the “Location” box. There is a selectable scroll box to choose the PE. In AWIPS1, an element must be de-selected before a new element is chosen. There is a pull-down box activated when the TypeSrc box is checked and three checkboxes, one for each switch. A checked box equates to the switch being True.
Below the tabular display is the “Set Switches for All Listed Above” button, followed by three checkboxes. The checkboxes represent the Master, OFS and MPE switches, respectively. Again, a checked box is equivalent to True. When the button is clicked, HydroBase will set the flags of all of the locations in the display window to True or False based on whether the appropriate boxes are checked or not. If a filter is applied to the display window, only the entries that are visible in the display window are updated.
The area in the bottom one third of the GUI is devoted to the ingestfilter entry that is currently highlighted. New entries may be added or current entries updated by changing the Duration, TypeSource, Extremum and Physical Element parameters. The list of allowable values is read from the shefdur, shefts, shefex and shefpe static IHFS lookup tables. The TypeSource Rank parameter on the right hand side of the GUI is important for RiverPro operations. If the rank is not explicitly set, it will default to 1. If all type sources are ranked 1, then RiverPro will choose the “official” time series to use based on alphabetical order of the type source.
31 of 46
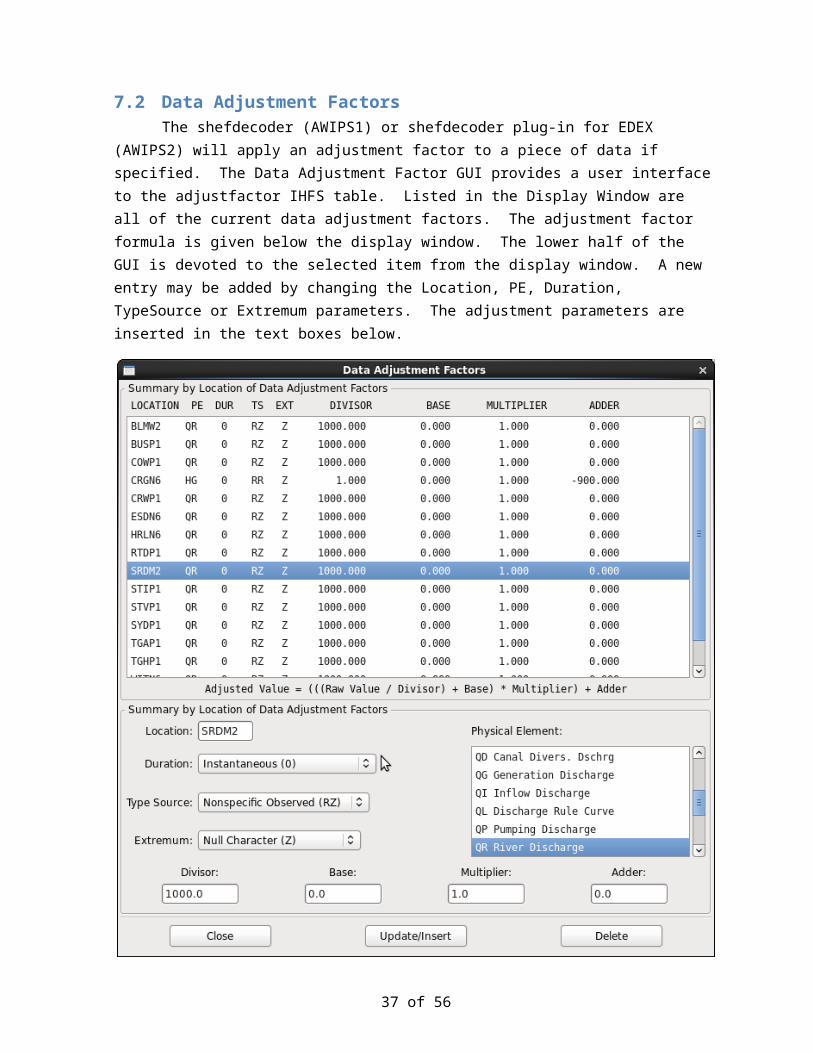
7.2 Data Adjustment FactorsThe shefdecoder (AWIPS1) or shefdecoder plug-in for EDEX (AWIPS2) will apply an
adjustment factor to a piece of data if specified. The Data Adjustment Factor GUI provides a user interface to the adjustfactor IHFS table. Listed in the Display Window are all of the current data adjustment factors. The adjustment factor formula is given below the display window. The lower half of the GUI is devoted to the selected item from the display window. A new entry may be added by changing the Location, PE, Duration, TypeSource or Extremum parameters. The adjustment parameters are inserted in the text boxes below.
Fig 7.2 Data Adjustment Factors
32 of 46
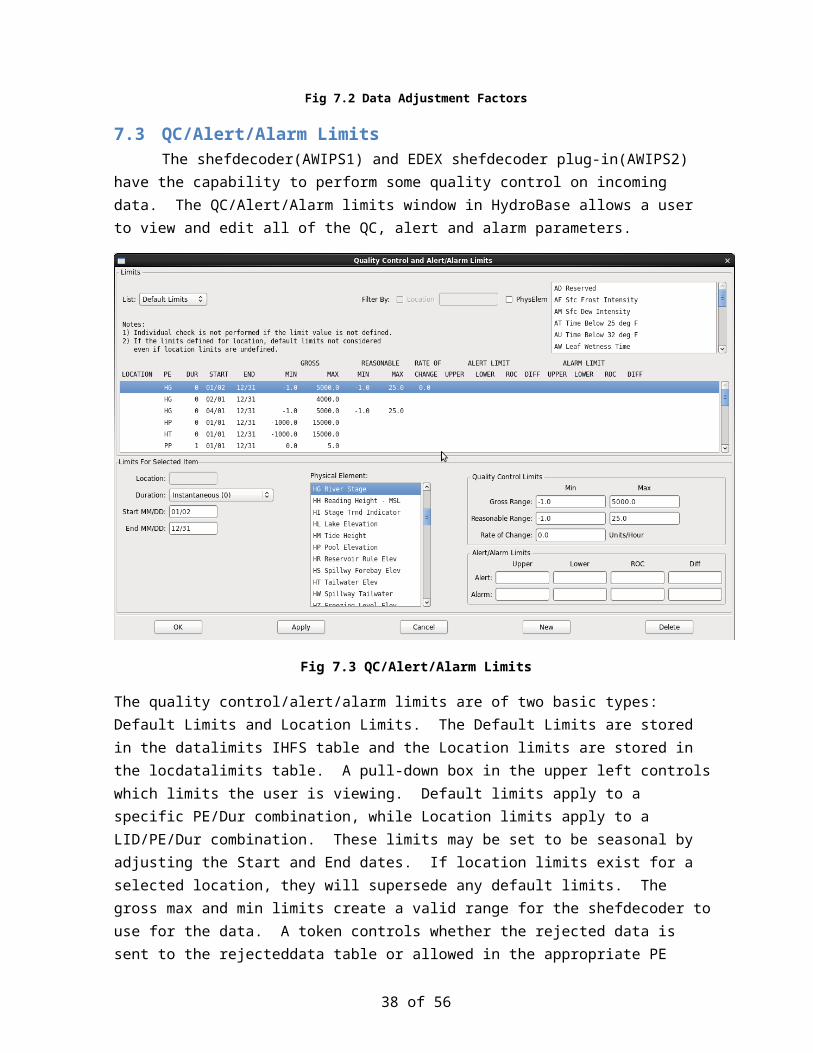
7.3 QC/Alert/Alarm LimitsThe shefdecoder(AWIPS1) and EDEX shefdecoder plug-in(AWIPS2) have the capability to
perform some quality control on incoming data. The QC/Alert/Alarm limits window in HydroBase allows a user to view and edit all of the QC, alert and alarm parameters.
Fig 7.3 QC/Alert/Alarm Limits
The quality control/alert/alarm limits are of two basic types: Default Limits and Location Limits. The Default Limits are stored in the datalimits IHFS table and the Location limits are stored in the locdatalimits table. A pull-down box in the upper left controls which limits the user is viewing. Default limits apply to a specific PE/Dur combination, while Location limits apply to a LID/PE/Dur combination. These limits may be set to be seasonal by adjusting the Start and End dates. If location limits exist for a selected location, they will supersede any default limits. The gross max and min limits create a valid range for the shefdecoder to use for the data. A token controls whether the rejected data is sent to the rejecteddata table or allowed in the appropriate PE table with a QC code of “B”. This is controlled by the token ‘shef_post_baddata’ in the Apps_defaults/Apps_defaults_site files. The default behavior is to place the data in the rejecteddata table. Incoming data outside of the reasonable range is given a QC code of questionable and posted to the PE tables. Alert and Alarm values are used to flag incoming data that it is above or below a threshold and load that data into the alertalarmval table. Another application runs to produce the actual workstation alerts and alarms. Rate of change parameters may be set to flag rapidly changing data. For more detailed information about the IHFS Quality Control suite of programs, the user is directed to the “Alert and Alarm” and “IHFS Quality Control” documents.
33 of 46
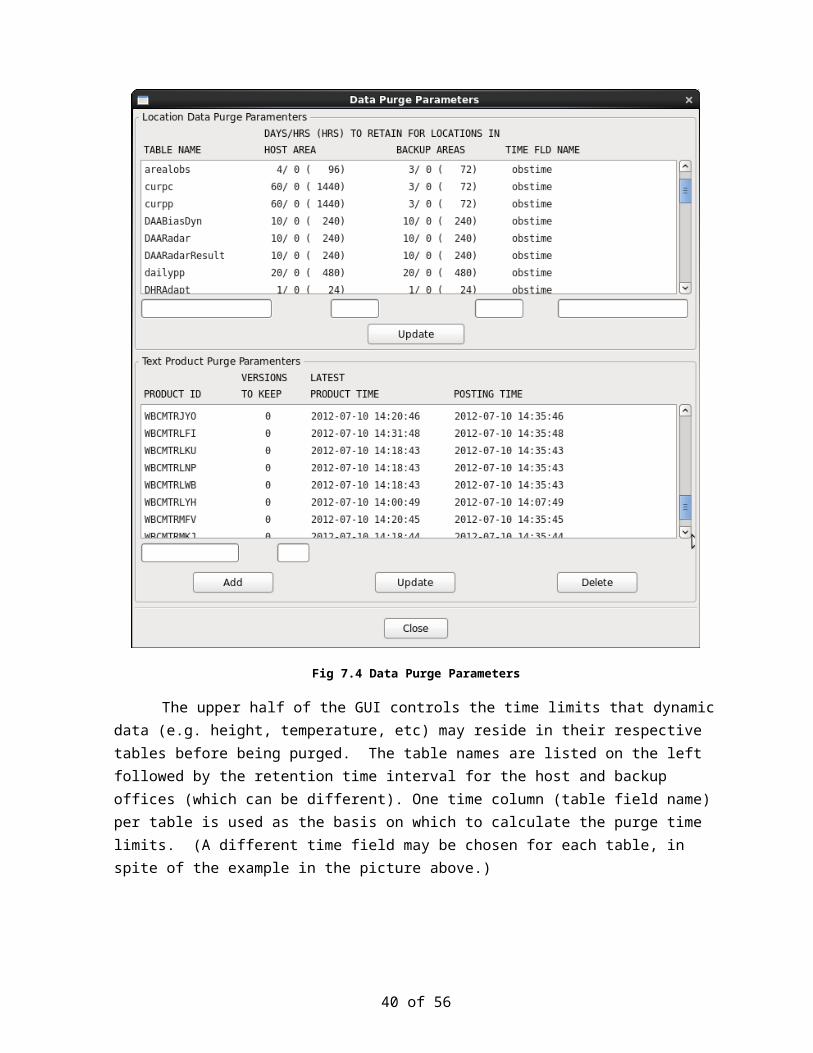
7.4 Data Purge ParametersThe Data Purge Parameter window allows the user to access the purgedyndata and
purgeproduct tables of the IHFS database. These tables contain the purge parameters for the dynamic data tables and the product table in the IHFS database, and are read by the purge processes.
Fig 7.4 Data Purge Parameters
The upper half of the GUI controls the time limits that dynamic data (e.g. height, temperature, etc) may reside in their respective tables before being purged. The table names are listed on the left followed by the retention time interval for the host and backup offices (which can be different). One time column (table field name) per table is used as the basis on which to calculate the purge time limits. (A different time field may be chosen for each table, in spite of the example in the picture above.)
34 of 46
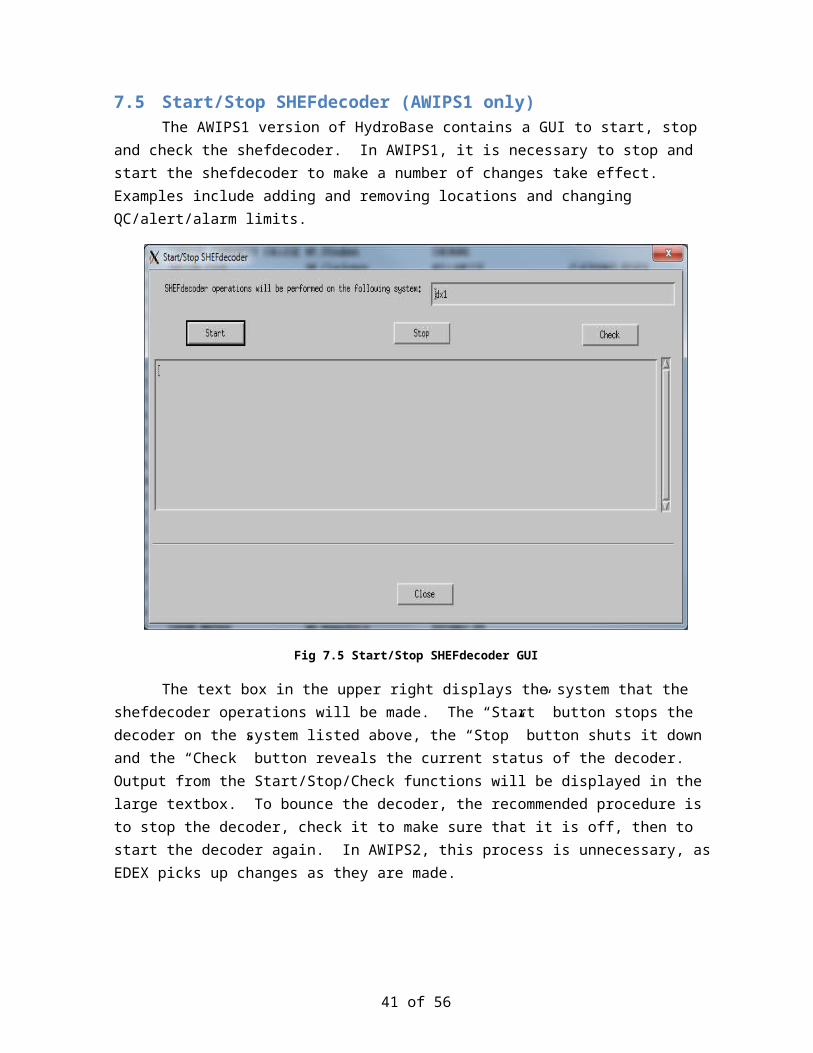
7.5 Start/Stop SHEFdecoder (AWIPS1 only)The AWIPS1 version of HydroBase contains a GUI to start, stop and check the shefdecoder. In
AWIPS1, it is necessary to stop and start the shefdecoder to make a number of changes take effect. Examples include adding and removing locations and changing QC/alert/alarm limits.
Fig 7.5 Start/Stop SHEFdecoder GUI
The text box in the upper right displays the system that the shefdecoder operations will be made. The “Start” button stops the decoder on the system listed above, the “Stop” button shuts it down and the “Check” button reveals the current status of the decoder. Output from the Start/Stop/Check functions will be displayed in the large textbox. To bounce the decoder, the recommended procedure is to stop the decoder, check it to make sure that it is off, then to start the decoder again. In AWIPS2, this process is unnecessary, as EDEX picks up changes as they are made.
35 of 46
8.0 The Reports Menu
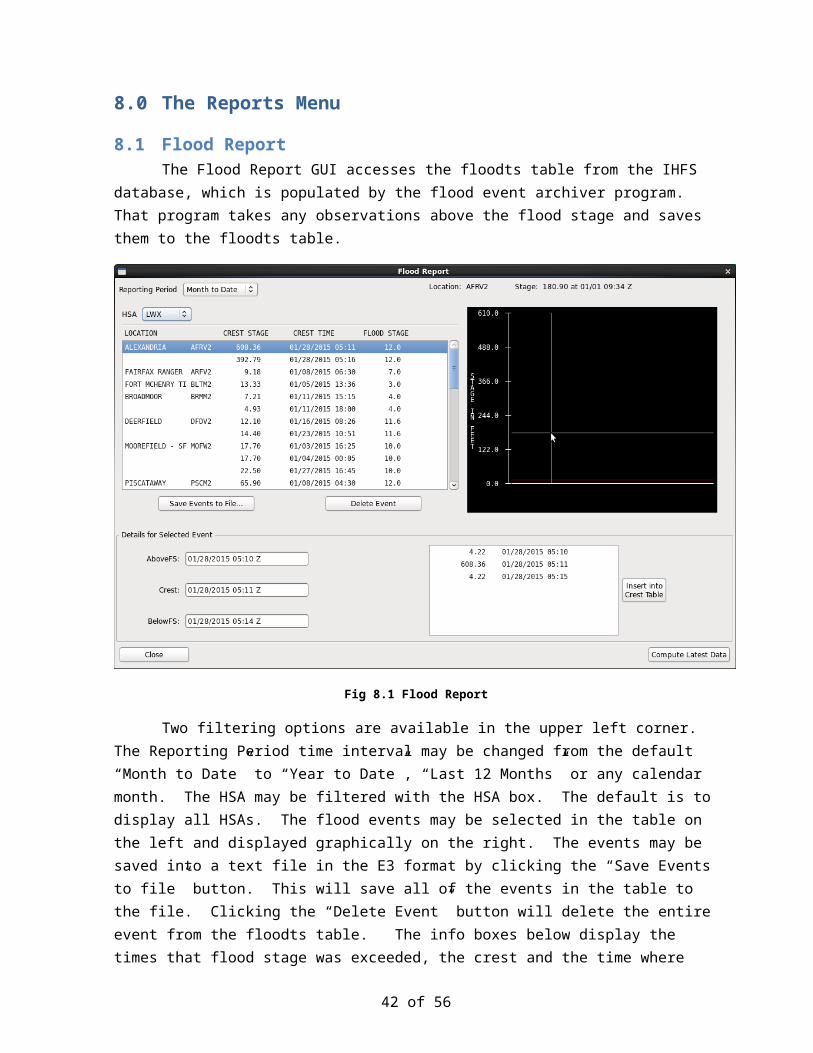
8.1 Flood ReportThe Flood Report GUI accesses the floodts table from the IHFS database, which is populated
by the flood event archiver program. That program takes any observations above the flood stage and saves them to the floodts table.
Fig 8.1 Flood Report
Two filtering options are available in the upper left corner. The Reporting Period time interval may be changed from the default “Month to Date” to “Year to Date”, “Last 12 Months” or any calendar month. The HSA may be filtered with the HSA box. The default is to display all HSAs. The flood events may be selected in the table on the left and displayed graphically on the right. The events may be saved into a text file in the E3 format by clicking the “Save Events to file” button. This will save all of the events in the table to the file. Clicking the “Delete Event” button will delete the entire event from the floodts table. The info boxes below display the times that flood stage was exceeded, the crest and the time where the observations dropped below the flood stage. In the lower right corner of the GUI, there is a table that displays all of the observations associated with the flood event displayed on the graph. The data may be highlighted here, and either inserted into the crest table or deleted from the list by the buttons to the right. Located in the lower right corner of the display is the “Compute Latest Data” button, which will run the flood sequencer and update the display.
36 of 46
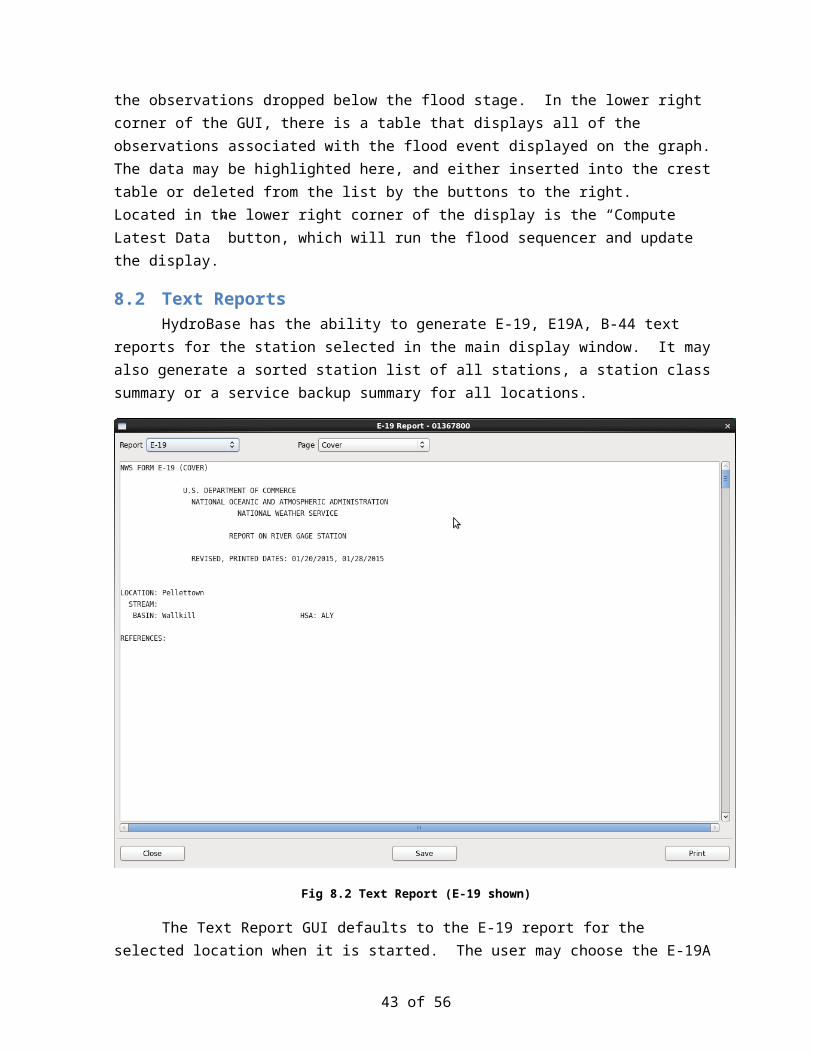
8.2 Text ReportsHydroBase has the ability to generate E-19, E19A, B-44 text reports for the station selected in
the main display window. It may also generate a sorted station list of all stations, a station class summary or a service backup summary for all locations.
Fig 8.2 Text Report (E-19 shown)
The Text Report GUI defaults to the E-19 report for the selected location when it is started. The user may choose the E-19A and B-44 reports for the selected station or a Sorted Station List, Station Class or Service Backup summary for all locations from the Report pull-down menu. For the E-19 report, a second pull-down menu to the right of the Report menu is used to jump to specific section of the E-19. There is no second menu for the E-19A, B-44 and Station Class options. For the Sorted Station List and Service Backup options, an additional menu exists to provide sorting options. At the bottom of the GUI, there are buttons to “Close” the GUI, “Print” the report or “Save” it to a text file.
37 of 46
9.0 The Setup MenuThe Setup menu contains GUIs for a number of static tables in the IHFS database.
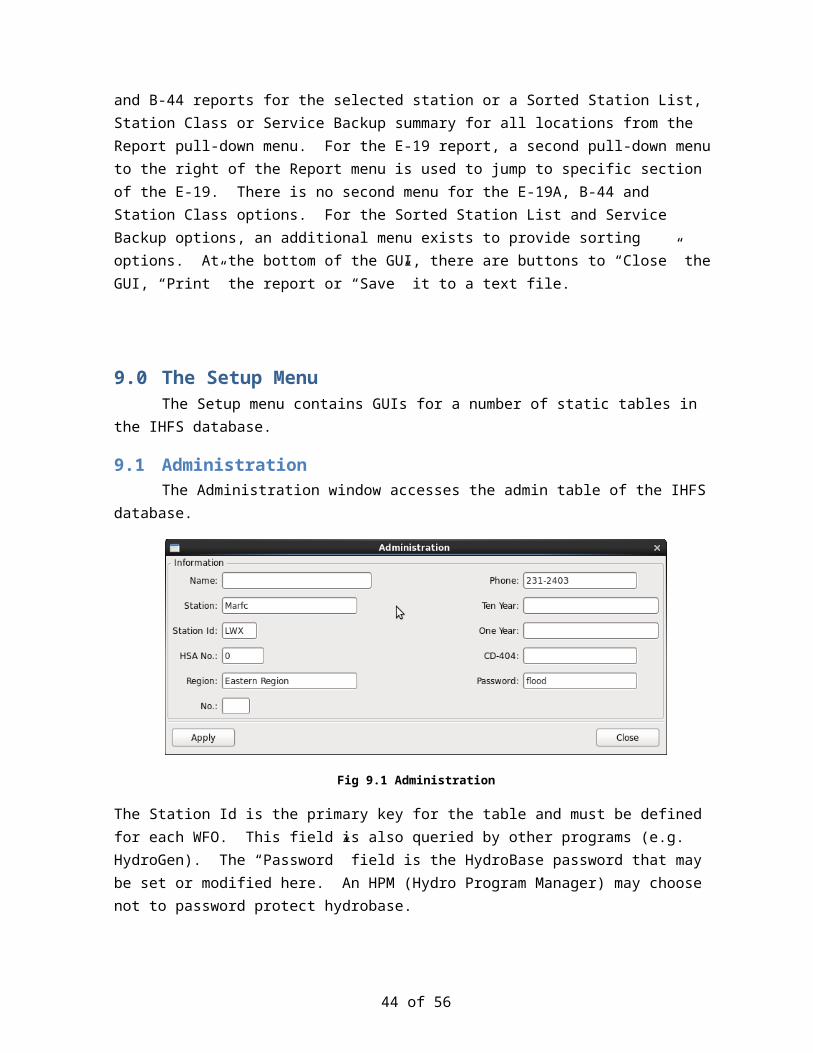
9.1 Administration The Administration window accesses the admin table of the IHFS database.
Fig 9.1 Administration
The Station Id is the primary key for the table and must be defined for each WFO. This field is also queried by other programs (e.g. HydroGen). The “Password” field is the HydroBase password that may be set or modified here. An HPM (Hydro Program Manager) may choose not to password protect hydrobase.
9.2 Cities (AWIPS1 only)The Cities Window is a graphical interface for the city table in the IHFS database in AWIPS1.
The information from this table is used to plot the cities and towns on the HydroView display. In AWIPS2, this functionality is replaced by a shapefile in the CAVE display.
Fig 9.2 Cities
38 of 46
All of the cities and towns are displayed in the upper window. When a location is selected, its attributes may be modified. The “Add” button inserts the data in the text boxes into the database, while the “Update” button updates the highlighted entry. There are no constraints on the table and duplicates may be added to the table.
9.3 Reference FieldsThe Reference Fields GUI is the interface for two reservoir reference tables: damtype and
resowner.
Fig 9.3 Reference Fields
The Field pull-down menu selects the reference table that is being accessed. The “Reservoir Owner” refers to the resowner table, while the “Reservoir Type” refers to the damtypes table. The “Add” button inserts a new value, the “Update” button updates the highlighted entry with data in the text box and the “Delete” button removes the highlighted entry.
39 of 46
9.4 States/Counties/ZonesThis GUI accesses the state, counties and eligzon tables in the database.
Fig 9.4 States/Counties/Zones
The buttons in the three windows function in the same way. One note is that counties and eligzon tables have foreign key constraints that may be accidentally violated by errors, resulting in a database error. In the counties table, the WFO, Primary and Secondary fields depend on the wfo table, while the State field refers back to the state table.
9.5 RiverPro General ParametersThe RiverPro General Parameters GUI accesses the rpfparams table in the database. It
defines several default parameters for RiverPro that may be overridden by individual location settings and template settings.
Fig 9.5 RiverPro General Parameters
40 of 46
The time span parameters define the time window that RiverPro will use to extract data from the database for use in the products. These parameters may be overridden by location-specific values. Below the Time-Span Parameters and on the left side are the Missing String Parameters. These control the default values used by RiverPro to represent missing data attributes in the products. These values will be used in the event that they are not defined in the product templates themselves. The remaining items control the event expiration time of the VTEC product listed. These parameters are also overridden by the location specific database entries.
9.6 RiverPro Forecast Groups/PointsThis is the GUI for two IHFS database tables: rpffcstpoint and rpffcstgroup. They contain the
attributes of the RiverPro forecast points and the forecast groups respectively.
Fig 9.6 RiverPro Forecast Groups/Points
The upper portion of the GUI is devoted to the forecast groups. The “Apply FcstGroup” button updates the entry for the selected group id. The attributes are the unique group ID, the group name/description, the ordinal which is used to order the groups in the RiverPro window, and the Recomm All field. The Recomm All field is a Yes/No field that controls whether the non-flood points
41 of 46
in a group are included in a flood warning/statement for that group. The buttons to add a group and delete a group are located at the bottom of the GUI.
The lower portion of the window displays the location specific attributes of the selected point in the group highlighted above. For a full description of the fields here, see the RiverPro Appendices. It should be noted that the Primary and Secondary backups for each point must be upper case. As in the example above, lower-case or mixed-case HSAs may exist in the hsa table as choices. The Observed BackHrs and Forecast FwdHrs override the values set in the RiverPro general parameters (see section 9.5) to define the time data window. The VTEC Adjust End Hrs field controls the VTEC event end time parameter. The final VTEC event end time is calculated by adding this time offset to the event end time computed by RiverPro. The “Apply FcstPoint” button applies the changes to the database. Note that a point may not have its group assignments changed in this GUI. This is accomplished from the River Gage->River Gage GUI (section 5.1).
9.7 Radar LocationsThe Radar Locations GUI accesses the radarloc table that is used by MPE fieldgen and the
BIAS message generator.
Fig 9.7 Radar Locations
It is important that the Active box is checked; otherwise MPE will ignore DPA products from this radar. The Bias Source needs to be correctly assigned for each of the radars as well. It may be assigned to either the RFC that contains the radar or to the local WFO. Bias messages for the local radar are produced at the WFO and optionally sent back to the ORPG. See the Precipitation Bias Message document for further details of the bias generation.
42 of 46
9.8 Areal DefinitionsThe Areal Definitions window accesses the geoarea table in the database and is the interface
for a script that loads this table from text files.
Fig 9.8 Areal Definitions
The Areal Definitions GUI has a pull-down menu in the upper left-hand corner that allows the user to display a certain type of geographical boundary. The options are counties, zones, basins and reservoirs. The geoarea database table contains basic information about each polygon, while the line segments themselves are contained in the linesegs table. In AWIPS1, HydroView reads binary files containing the geographic information, while in AWIPS2 this is accomplished by CAVE reading shapefiles.
This GUI allows the user to edit the underlying text file, then run a script to import the text file into the database and create updated text files for HydroView to use. The user can use the “Edit File” button to open a text editor and modify the text file, then click the “Import to Database” button to run the script. Clicking “Review Log” allows the user to examine the outcome of the script. It is important to maintain the basin definitions in AWIPS2 since this data is used by SSHP and the MAP pre-processor. The user is referred to the SSHP Operations Guide for further details.
43 of 46
9.9 Vector Definitions (AWIPS1 only)The Vector Definitions GUI is unique in that it does not access a database table. It does
access text files for four different types of vectors: Rivers, Streams, Highways and Roads.
Fig 9.9 Vector Definitions
This GUI functions in a similar manner to the areal definitions GUI. A pull-down menu where the user selects the vector type is located in the upper left-hand corner of the window. The “Edit File” button starts a text editor with the listed .dat file. After the edits are saved, the “Create Binary Files” button runs the script that converts the text file into a binary file for HydroView to use. Clicking “Review Logs” will display the log file for the most recent execution of the script.
9.10 NWR TransmitterThe NWR Transmitter GUI accesses two IHFS tables (nwrtransmitter, countytransmit) that
RiverPro uses to create products for Weather Radio.
Fig 9.10 NWR Transmitter
44 of 46
The upper portion of the window displays the transmitter information, while the lower portion displays the counties assigned to the selected transmitter. Selecting a county in the “Counties Covered” menu and clicking “Delete” removes that assignment for the transmitter. By clicking the “Add” button from the “Available Counties” menu, the highlighted county is assigned to the selected transmitter. For further information on the usage of this data, refer to chapter 7 in the RiverPro manual.
9.11 Time Series Group ConfigurationIn AWIPS1, this menu option opens a text editor for the group_definition.cfg that is used by
time series in the Pre-Defined Group Mode. In AWIPS2, this file is accessed through the localization perspective. The user is referred to the Time Series Operations Guide for details on how to configure this file.
Fig 9.11 CAVE Localization Perspective
45 of 46
9.12 HydroGen Configuration This GUI accesses the hgstation table, which controls the data flow from the WFO to AHPS.
Fig 9.12 HydroGen Configuration
The hgstation table is the master control for the HydroGen program that runs at the WFO. This table controls which Location ID (LID)/Physical Element (PE)/Type Source (TS)/Forecast Type Source combinations are gathered by the program and sent to the AHPS servers. Multiple PE/type source/forecast type source combinations are allowed for an LID, but it is not recommended to send different forecast type sources for an LID/PE combination. The entries may be modified in the Selected Item section of the display.
A new location is added by simply erasing the Location in the Selected Item section and entering the new location. However, it must have been previously added to the database via the River Gage dialog. The “Save” button saves the data to the database, while the “Delete” button deletes the selected entry.
46 of 46