hydrocarbon processing july 2013
TRANSCRIPT

We’re Not Exaggerating. Our Boilers are something to brag about. We custom design and custom build boilers to perform effi ciently, safely and cleanly. Your RENTECH boiler will lower operating costs, reduce emissions, and provide faster start-up and cool-down. You’ll fi nd satisfi ed customers on six continents with specialty boilers, HRSGs, wasteheat boilers and fi red packaged watertube boilers from RENTECH. We’ve been designing and building boilers for people who know and care since 1996.
WWW.RENTECHBOILERS.COM

HydrocarbonProcessing.com | JULY 2013
®
REFINERY OF THE FUTURENew catalysts, processes,
modeling and more shift
how existing and new refineries
are designed and operated
CHANGING ECONOMICSNew refineries and growing
transportation fuel markets
are reorganizing the global
refining industry
ENERGY EFFICIENCYOptimizing heat-transfer
opportunities reduces
energy costs and losses

Unlike a phony cowboy who is all hat with no cattle, a boiler from RENTECH will pass muster.
Each boiler is designed and built to meet its demanding specifications and operate in its unique conditions in a variety of industries, including refining, petro-chemical and power generation. Our quality control system assures you that RENTECH boilers are safe, reliable and efficient.
For a real, genuine, original boiler, you can depend on RENTECH. Honestly.
WWW.RENTECHBOILERS.COM
Select 52 at www.HydrocarbonProcessing.com/RS

Cover Image: Eni has constructed the first commercial-scale conversion unit applying the Eni Slurry Technology (EST) process. With 23,000 bpd of capacity, the EST unit
can upgrade extra-heavy crude into high-quality middle distillates. Startup of this facility is scheduled for 2013. Photo courtesy of Eni SpA.
JULY 2013 | Volume 92 Number 7HydrocarbonProcessing.com
SPECIAL REPORT: REFINERY OF THE FUTURE
39 Asia: Future challenges and opportunities for refining
S. Sivanandam
43 Enhance refinery profitability with modeling innovations
R. Beck, D. Ajikutira, L. Herrmann and V. Ye
47 The future of automation is now
D. C. Clark and M. A. Turk
51 Processing shale oils requires innovative solutions
B. Wright and C. Sandu
57 Use 3D visualization to improve refinery engineering and design
S. Bennett
61 Optimize amine units and improve refinery profitability
J. Zurlo, GE Water & Process Technologies
67 Consider catalytic dewaxing as a tool to improve
diesel cold-flow properties
R. A. Rakoczy and P. M. Morse
71 Recover value through recycled oil-bearing materials
S. Hopper
HPI FOCUS: ENERGY EFFICIENCY
77 Are you using pinch technology effectively
in your daily operations?—Part 2
Z. Milosevic, A. Rudman and R. Brown
VALVES—SUPPLEMENT
V-85 Use wireless valve-monitoring technology to your advantage
T. Sequeira
GAS PROCESSING SUPPLEMENT
105 Technology and Business Information
for the Global Gas Processing Industry
DEPARTMENTS
4 Industry Perspectives
8 Brief
11 Impact
17 Innovations
25 Construction Profile
96 Marketplace
100 Advertiser index
COLUMNS
27 Reliability
Expect adversity, but plan for success
31 Integration Strategies
Virtualization goes mainstream
33 Boxscore Construction
Analysis
Outlook for major revamp projects—Part 1
102 Engineering Case Histories
Case 73: Useful troubleshooting tools to keep at hand
38
V-85
33

4�JULY 2013 | HydrocarbonProcessing.com
P. O. Box 2608Houston, Texas 77252-2608, USAPhone: +1 (713) 529-4301Fax: +1 (713) 520-4433Editorial@HydrocarbonProcessing.comwww.HydrocarbonProcessing.com
President/CEO John Royall
Vice President Ron Higgins
Vice President, Production Sheryl Stone
Business Finance Manager Pamela Harvey
Part of Euromoney Institutional Investor PLC. Other energy group titles include: World Oil and Petroleum Economist
Publication Agreement Number 40034765 Printed in USA
Industry PerspectivesPUBLISHER Bret Ronk [email protected]
EDITORIALEditor Stephany RomanowManaging Editor Adrienne BlumeReliability/Equipment Editor Heinz P. BlochTechnical Editor Billy ThinnesOnline Editor Ben DuBoseAssociate Editor Helen MecheDirector, Data Division Lee NicholsContributing Editor Loraine A. HuchlerContributing Editor William M. GobleContributing Editor ARC Advisory Group
MAGAZINE PRODUCTIONVice President, Production Sheryl StoneManager, Editorial Production Angela BatheArtist/Illustrator David WeeksGraphic Designer Amanda McLendon-BassManager, Advertising Production Cheryl Willis
ADVERTISING SALESSee Sales Offices, page 100.
CIRCULATIONDirector, Circulation Suzanne McGehee
+1 (713) 520-4440 [email protected] price (includes both print and digital versions): Print—One year $239, two years $419, three years $539. Digital format—One year $239. Airmail rate outside North America $175 additional a year. Single copies $35, prepaid.
Because Hydrocarbon Processing is edited specifically to be of greatest value to people working in this specialized business, subscriptions are restricted to those engaged in the hydrocarbon processing industry, or service and supply company personnel connected thereto.
Hydrocarbon Processing is indexed by Applied Science & Technology Index, by Chemical Abstracts and by Engineering Index Inc. Microfilm copies avail-able through University Microfilms, International, Ann Arbor, Mich. The full text of Hydrocarbon Processing is also available in electronic versions of the Business Periodicals Index.
ARTICLE REPRINTSIf you would like to have a recent article reprinted for an upcoming confer-ence or for use as a marketing tool, contact Foster Printing Company for a price quote. Articles are reprinted on quality stock with advertisements removed; options are available for covers and turnaround times. Our minimum order is a quantity of 100.
For more information about article reprints, call Rhonda Brown with Foster Printing Company at +1 (866) 879-9144 ext. 194 or e-mail [email protected].
Hydrocarbon Processing (ISSN 0018-8190) is published monthly by Gulf Publishing Company, 2 Greenway Plaza, Suite 1020, Houston, Texas 77046. Periodicals postage paid at Houston, Texas, and at additional mailing office. POSTMASTER: Send address changes to Hydrocarbon Processing, P.O. Box 2608, Houston, Texas 77252.
Copyright © 2013 by Gulf Publishing Company. All rights reserved.
Permission is granted by the copyright owner to libraries and others registered with the Copyright Clearance Center (CCC) to photocopy any articles herein for the base fee of $3 per copy per page. Payment should be sent directly to the CCC, 21 Congress St., Salem, Mass. 01970. Copying for other than personal or inter-nal reference use without express permission is prohibited. Requests for special permission or bulk orders should be addressed to the Editor. ISSN 0018-8190/01.
US ethane advantage appears only temporary
The ethane advantage held by the US petrochemical indus-try is very real, but it may not last that long. Out of hundreds of votes cast in April and May by readers, about 80% predicted North American ethane feedstocks would remain cost-advan-taged to the US for 10 years or fewer.
Plans for new capacity. Numerous new cracker projects are slated to come onstream in the second half of this decade, as companies seek to capitalize on the surge of shale-derived feedstocks. As many as 12 companies, including Dow Chemi-cal (FIG. 1), have expressed formal interest or plans.
But if the latest poll is to be believed, timing is a significant is-sue. That is, companies need to complete construction as soon as possible in order to take advantage of short-term margins.
Competition from LNG exports. One obstacle to the US petrochemical industry’s advantage could come in the form of increased LNG exports. If more export projects are approved, it means more of the shale gas will be sent to foreign buyers. That could, in turn, raise demand and domestic ethane prices due to increased competition.
Chemical companies such as Dow, however, say the US would be better served to export manufactured goods rather than raw materials. The outcome of this dispute could go a long way in determining long-term competitiveness.
An expanded version of Industry Perspectives can be found online at HydrocarbonProcessing.com.
HP Poll Question: Compared to the rest of the world, how long will the US hold its “ethane advantage” of cheap petrochemical feedstock?
HydrocarbonProcessing.com reader response:
Up to 5 years ...................................................................................................................31%Up to 10 years ............................................................................................................... 49%Longer ................................................................................................................................ 20%
FIG. 1. Dow Chemical is planning to build a new cracker at its complex in Freeport, Texas.

Select 93 at www.HydrocarbonProcessing.com/RS

www.ConstructionBoxscore.com
DISCOVER THE NEW CONSTRUCTION BOXSCORE DATABASE
Hydrocarbon Processing’sConstruction Boxscore Database, the most reliable source to track active construction projects in the refi ning, petrochemical, gas processing, LNG and solids industries throughout the world, now reaches further and is more powerful than ever before! Refi nery Middle East Kuwait Kuwait KNPC 615 Mbpd 30000
Air Separation Middle East Yanbu Saudi Arabia GAS Natl Ind Gases Co 10 MMtpy 5000
Refi nery Middle East Yanbu Saudi Arabia Saudi Aramco\Sinopec 2.5 MMtpy 1200
Refi nery Middle East Tabriz Iran NIOEC 710 Mtpy 871
Gasoline Middle East Bandar Abbas Iran NIOEC 400 Mbpd 7000
Bitumen Middle East Kirkuk Iran North Refi neries Co. 17 Mbpd 1000
Butane Isomerisation Middle East Nasiriyah Iran SCOP 400 Mbpd 1300
Distiller, Vac Middle East Sohar Oman Orpic - 141
PROJECT LISTING RESULTS
EXPORT TO EXCEL
WWW.CONSTRUCTIONBOXSCORE.COM

• Project details for more than 3,500 active, global construction contracts including
contact information for key personnel
• Advanced search that fi lters the listings by project type, scope, region, investment and more
• Daily updates for new and newly updated projects
• The weekly Boxscore Update e-newsletter with new listings and trends analysis
EXPANDED DETAIL AND SCOPE
Project Information
Now Includes:
• Contact information for key personnel
• Total and per unit project cost
• Date that the project was last reported or updated
Sign up for a Boxscore DemoConstructionBoxscore.com/
Demo
Subscribe Today ConstructionBoxscore.com/
Subscribe
Lee NicholsDirector of Data Division
Phone/Fax: +1 (713) 525-4626

| Brief
Gazprom Neft refines Euro 5 diesel fuelGazprom Neft’s Moscow oil refinery has launched production of Euro 5 diesel
fuel. Starting last month, all diesel fuel supplied by the Moscow oil refinery to
the Russian market was expected to meet the Euro 5 standard. Production of
Euro 5 diesel at the refinery began after the reconstruction of the 2 million tpy
diesel fuel hydrotreater unit was completed. The new unit has helped reduce
sulfur content in the fuel to 10 parts per million, which is 35 times less than that
in Grade 3 fuel (the baseline fuel approved for use in Russia). The Moscow oil
refinery has been producing motor fuels of Grade 4 and higher since April 2012.

Hydrocarbon Processing | JULY 2013 9
BILLY THINNES, TECHNICAL EDITOR / [email protected]
Brief
The American Petroleum Institute (API) filed a brief with the Supreme Court regarding the US EnvironmentalProtection Agency’s (EPA’s) recent approval of a blend of 15% ethanol and 85% gasoline (E15). The API said that higher ethanol blends can damage engines and cause vehicles that use it to break down, even on vehicles that the EPA has approved to use the fuel, according to Coordinating Research Council (CRC) testing. Several auto manufacturers have said they will not honor warranties when E15 causes damage. The API wants the EPA to immediately finalize the 2013 ethanol mandate and also lower the 2014 ethanol mandate to protect consumers from the introduction of E15. The interest group further noted that it is part of a broad coalition of food, livestock, consumer and environmental groups that oppose the EPA’s approval of E15.
Tesoro will pay a $1.1 million penalty to resolve claims that it failed to comply with requirements under theUS Clean Air Act at four of its refining facilities that produce conventional gasoline. In its complaint, the US EPA alleged that Tesoro failed to comply with record keeping, reporting, sampling and testing requirements at its facilities in Anacortes, Washington; Kenai, Alaska; Salt Lake City, Utah; and Mandan, North Dakota. The settlement requires that Tesoro implement an environmental compliance and auditing plan designed to prevent future violations and ensure compliance with the EPA’s fuels regulations.
The US Energy Department has conditionally authorized Freeport LNG Expansion and FLNG Liquefaction LLC(Freeport) to export domestically produced liquefied natural gas (LNG) from the Freeport LNG Terminal on Quintana Island, Texas, to countries that do not have a free trade agreement (FTA) with the US. Freeport previously received approval to export LNG from this facility to FTA countries on February 10, 2011. Subject to environmental review and final regulatory approval, the facility is conditionally authorized to export at a rate of up to 1.4 Bcfd for a period of 20 years. The Department granted the first authorization to export LNG to non-FTA countries in May 2011 for the Sabine Pass LNG Terminal in Cameron Parish, Louisiana, at a rate of up to 2.2 Bcfd.
The UK has become a member of a new international Renewables Club that promises to promote and scale up the global use of green energy sources, such as wind and solar power. The Renewables Club is a coalition of 10 countries led by Germany, that together account for more than 40% of the world’s investment in renewables energy. Ministers from each of the countries signed a communiqué pledging to accelerate the roll-out of renewable energy technologies by sending strong political messages in support of the business and environmental benefits associated with clean energy. Specifically, the club will
promote the boost that renewable energy projects can bring in terms of prosperity, sustainable development and attempts to mitigate climate change at this year’s United Nation’s climate change conference in Poland.
The European Union has responded to what it considers unfair biodiesel imports from Argentina and Indonesia. Anti-dumping duties, placed on behalf of European fuel producers, have now been imposed on biodiesel imports originating from those two countries. The new regulation acknowledges claims about the distortive effects of differential export taxes (DETs) on the European market. The European biodiesel producers claim that the DET system in Argentina and Indonesia depressed prices of soybean and palm oil and therefore distorted the costs to biodiesel producers.
“This decision represents a first step to counter uncompeti-tive biodiesel imports from these countries,” said European Bio-diesel Board (EBB) Secretary General Raffaello Garofalo. “Yet there is serious concern that the current DET policies in both countries will keep fostering unfair imports. On behalf of the whole EU biodiesel industry, the EBB calls for higher additional anti-subsidy duties to be defined in the next months as accurate and dissuasive measures to counter unfair biodiesel trade.”
The European Commission has prepared a draft regulation on international carbon credits as a response to excessive credits in the EU emissions trading system (EU ETS). The proposed regulation specifies the maximum limits up to which operators under the EU ETS may use eligible credits from the Kyoto Protocol’s project-based mechanisms for compliance with emission limits from 2013 to 2020. From 2008 to 2012, operators used over one billion international credits. Under the proposed rules, EU ETS participants operating stationary installations can use the amount of international credit entitlements specified in the national allocation plans for the 2008 to 2012 period or up to 11% of the free allocation of EU allowances granted to them in that period, if that quota is higher. Other entitlements would apply to operators of stationary installations who were new entrants after 2008 and to operators of stationary installations in new sectors included in the scope of the EU ETS after 2012. As they did not receive such free allocations or entitlements for international credit use in Phase 2, they will be able to use international credits up to a maximum of 4.5% of their verified emissions during the 2013 to 2020 period.
Syntroleum Corp. has filed suit in Singapore against Neste Oil Singapore over a patent dispute involving ahydrocracking process for biological feedstocks. Syntroleum alleges that Neste is operating a renewable diesel refinery in Singapore that produces renewable diesel fuel and bio-naphtha using processes covered in Syntroleum’s patent.

The Emerson logo is a trademark and service mark of Emerson Electric Co. ©2013 Fisher Controls International LLC. D352205X012 MZ31
Emerson’s industry leading Fisher® easy-e™ control valve—available in NPS 1 thru 36—provides users with high performance and reliability.
The easy-e control valve continues to evolve, bringing you innovative and reliable technology to help solve your toughest challenges. It undergoes rigorous lifecycle testing, so you don’t have to worry about your unit going down unexpectedly. Don’t trust your process to cheap valves. Use the Fisher easy-e control valve to keep your operation running. Day and night. To learn more, visit www.Fisher.com/Reliable
YOU CAN DO THAT
My unit is down again. Perfect.These cheap valves just don’t hold up.I need reliable technology to keep running 24/7/365—no surprises.

Hydrocarbon Processing | JULY 2013 11
Impact
BILLY THINNES, TECHNICAL EDITOR / [email protected]
Canadian crude production projected to double by 2030
A report from the Canadian Association of Petroleum Pro-ducers (CAPP) forecasts Canadian crude oil production will more than double to 6.7 million bpd by 2030 from 3.2 MMb-pd in 2012 (FIG. 1). This includes oil sands production of 5.2 MMbpd by 2030, up from 1.8 MMbpd in 2012.
While the overall trend is similar to last year’s forecast, the notable differences include an increase in total production of 500 Mbpd by 2030. The increase includes incremental conven-tional production of 300 Mbpd by 2030 and oil sands produc-tion of 200 Mbpd by 2030. This year’s forecast also includes a progressive shift toward more supply from oil sands in-situ, or drilling, production.
“Stronger performance for conventional tight oil in Canada and the United States, coupled with oil sands growth from Can-ada, enables greater North American energy security,” said Greg Stringham, a CAPP executive. “It creates further opportunities to replace foreign crude oil imports in both Canada and the United States, and to increase exports to new markets beyond North America.”
Crude. Oil sands production growth reflects Canada’s supply potential and the growing international demand for oil. In 2012, 1.8 MMbpd were produced, including 800 Mbpd from mining operations and 1 MMbpd from in-situ operations. By 2030, in-situ production is forecast at 3.5 MMbpd and mining produc-tion is forecast at 1.7 MMbpd.
Conventional tight oil production is increasing because new technology allows industry to produce oil from formerly un-economic resources, reversing a significant declining produc-tion trend over the last decade. Production was 1.2 MMbpd in 2012. It is expected to rise to 1.4 MMbpd by 2015 and remain at about that level throughout the forecast period. Supply from the Atlantic Canada offshore is unchanged throughout the fore-cast period at about 200 Mbpd.
Increasing Canadian oil supply is aimed at markets in East-ern Canada, traditional and new markets in the US (displacing imports from less secure foreign sources), and growing markets in Asia. A broad range of new transportation projects, including both pipeline and rail, are being advanced to move this growing supply to markets.
US targets Iran’s petrochemical industryThe US Treasury Department, acting in concert with the US
Department of State, recently took action to target Iran’s petro-chemical industry (FIG. 2). As Iran’s oil revenues continue to fall due to international sanctions, the Iranian government has in-creasingly turned to other industries to make up for lost profits. One of these sectors is the petrochemical industry, which is now
the second largest source of revenue for the Iranian government. The US government is targeting this revenue stream by both des-ignating companies involved in transactions with the sector and identifying several petrochemical companies as subject to sanc-tions because they are controlled by the Iranian government.
“We are committed to intensifying the pressure against Iran, not only by adopting new sanctions, but also by actively enforc-ing our sanctions and preventing sanctions evasion. Today’s actions take aim at revenues from Iran’s petrochemical sector, as well as deceptive schemes Iran has employed in an effort to evade sanctions on its oil sales and its airlines,” said US Treasury Under Secretary for Terrorism and Financial Intelligence David S. Cohen. “We will continue to work with our partners around the world to ensure that the sanctions pressure on Iran builds so long as Iran continues to defy its obligation to comply with its international obligations.”
0
1
2
3
4
5
6
7
8
2030202820262024202220202018201620142012201020082006
Pentanes
Millio
n bar
rels
per d
ay
Actual Forecast
Eastern Canada
Conventional light
June 2012 forecast
Conventional heavy
Oil sands growth
Oil sands operatingand in construction
FIG. 1. Canadian oil sands and conventional production, 2006 to 2030.
FIG. 2. Iranian petrochemical companies are facing additional scrutiny from the US government.

12�JULY 2013 | HydrocarbonProcessing.com
Impact
The US government imposed sanctions on Cyprus and Ukraine-based Ferland Co. Ltd. because the company “facili-tated deceptive transactions for, or on behalf of, the National Iranian Tanker Co. (NITC), which was identified as a govern-ment of Iran entity in July 2012.” In March 2013, Ferland and NITC cooperated to sell Iranian crude oil to help Iran evade international sanctions. The scheme involved ship-to-ship transfers of oil between three oil tankers.
The US government also identified eight Iranian petro-chemical companies that are owned or controlled by the gov-ernment of Iran, including: Bandar Imam Petrochemical Co., Bou Ali Sina Petrochemical Co., Mobin Petrochemical Co., Nouri Petrochemical Co., Pars Petrochemical Co., Shahid Tondgooyan Petrochemical Co., Shazand Petrochemical Co. and Tabriz Petrochemical Co. The US Department of State also sanctioned two companies for knowingly engaging in a significant transaction for the purchase or acquisition of petro-chemical products from Iran.
Global distribution of natural catastrophes in 2012
In 2012, there were 905 natural catastrophes worldwide, 93% of which were weather-related disasters. In terms of over-all and insured losses ($170 billion and $70 billion, respective-ly), 2012 did not follow the records set in 2011 and could be defined as a moderate year on a global scale. But the US was seriously affected by weather extremes, accounting for 69% of
overall losses and 92% of insured losses due to natural catas-trophes worldwide. This information is derived from a report compiled by the Worldwatch Institute.
Of the 905 documented loss events, 45% were meteorolog-ical events (storms), 36% were hydrological events (floods), and 12% were climatological events such as heat waves, cold waves, droughts and wildfires. The remaining 7% were geo-physical events (earthquakes and volcanic eruptions). This distribution deviates somewhat from long-term trends, as, be-tween 1980 and 2011, geophysical events accounted for 14% of all natural catastrophes.
Deaths during natural catastrophes in 2012 stood at 9,600, which was substantially below the 10-year annual average of 106,000.
Some two-thirds of the global overall losses and 92% of the insured losses in 2012 were due to weather-related events in the US. Hurricane Sandy, the summer-long drought in the US Midwest, and severe storms with tornadoes accounted for $100 billion of the overall losses. The insurance industry cov-ered $58 billion of this. These losses were the second high-est overall and insured losses since 1980 in the US. The most expensive year in the US was 2005, when Hurricane Katrina hit the coast of Mississippi and the city of New Orleans. The rest of the 2012 overall losses occurred in Europe (13%) and Asia-Pacific (17%). The insured losses for these two regions were well below the average and accounted for 8% of the total.
Around 59% of overall losses in 2012 were attributable to
PanaFlow HT
In hazardous environments safety comes first
SILCer tified
GE
Select 151 at www.HydrocarbonProcessing.com/RS

ThyssenKrupp Uhde
ThyssenKrupp Uhde –Engineering with ideas.The key to our success is the creativity and resourcefulness of our employees. And it is this that keeps turning major challenges into solutions that are not only brilliant and innovative, but often set the standard for the entire engineering sector.
www.thyssenkrupp-uhde.de
Select 81 at www.HydrocarbonProcessing.com/RS

14�JULY 2013 | HydrocarbonProcessing.com
Impact
storms, compared with the long-term average of 39%. Earth-quakes accounted for 12% of overall losses, but that was only half the 1980 to 2011 average.
In 2012, some 15% of global natural catastrophes occurred in Europe. The southern part of Europe was affected by drought conditions, especially parts of Italy, Spain, Portugal, Croatia, Bosnia and Herzegovina, Serbia and Slovenia, with a total of $3.8 billion in overall losses. Also, severe dry conditions affected parts of Russia and Kazakhstan, with agricultural losses reaching $600 million for Russia alone.
Some 11% of natural catastrophes happened in Africa, slight-ly above the long-term average of 9%. All of these events in 2012 were weather-related. A severe flood hit Nigeria from July to October, causing overall losses of $500 million and killing 360 people. This flood was one of the five deadliest events in 2012.
The Asia-Pacific region accounted for 43% of all natural ca-tastrophes worldwide in 2012. Only 17% of overall losses came from Asia-Pacific, well below the long-term average of 45% since 1980, with most of the events being floods and storms.
Further highlights from the report:• Some 37% of natural catastrophes occurred in Asia, 26%
in the US, 15% in Europe, 11% in Africa, and 6% in Australia/Oceania.
• Just 5% of natural catastrophes in 2012 affected South America, and 86% of these were weather-related events.
• The drought that affected the US Midwest in the summer of 2012 was responsible for overall losses of $20 billion.
HSE remains a major concern for the oil and gas industry
Health, safety and environment (HSE) concerns remain the top issue on the oil and gas industry’s risk agenda, according to a new report from Ernst & Young.
“The industry is undergoing intense focus on safety and envi-ronmental risk preparedness and mitigation, and in light of cor-porate social responsibilities, economic challenges and regulatory pressure, managing this risk is vital for long-term sustainability,” said Dale Nijoka, Ernst & Young’s global oil and gas leader.
The research also identified regulatory compliance, price volatility and the challenge associated with accessing reserves and markets as the top three risks. A new entrant into the top 10 risks this year is cyber security, as cyber attacks or cyber theft of intellectual property could pose a major threat to a company’s operations.
Aside from the risk rankings, the report also lists growing op-portunities in the sector. Emerging market demand leads in this category, moving up three places since the 2011 report. One Ernst & Young partner pointed out that growth rates in emerg-ing markets have consistently remained higher for the last three years, and the rise of the middle class and increasing urbaniza-tion will significantly increase energy demand.
Other key opportunities listed include new infrastructure to gain access to markets, safety and risk management used as a partnership enabler and new markets for natural gas.
Select 152 at www.HydrocarbonProcessing.com/RS

JOHNSON SCREENS® GLOBAL FIELD SERVICE______
WE APPLY OUR EXPERTISE FROM INITIAL PRODUCT DESIGN THROUGH PROPRIETARY FABRICATION, INSPECTION, TESTING, INSTALLATION AND START-UP. OUR ACQUIRED EXPERIENCE GIVES US A WEALTH OF KNOWLEDGE WHICH WE MAKE AVAILABLE TO YOU THROUGH OUR FIELD SERVICE TEAMS AND IN-HOUSE TECHNICAL SUPPORT GROUPS.
Project engineering assistance for revamping or upgrading Technical assistance when damage is found or assumed on reactor internals Internal expertise after catalyst unloading On-site installation of Johnson Screens® equipment Supervision of contractor’s installation
BILFINGER WATER TECHNOLOGIESwww.water.bilfinger.com
AUSTRALIA - ASIA PACIFIC Phone +61 7 3867 5555
EUROPE - MIDDLE EAST - AFRICAPhone +33 5 4902 1600
JAPAN Phone +81 55 997 8511
NORTH, SOUTH & CENTRAL AMERICAPhone +1 651 636 3900
Select 88 at www.HydrocarbonProcessing.com/RS

1219
_e
Whatever the impurity, whatever the composition, Air Liquide Global E&C Solutionshas the right treatment.
The composition of natural gas varies tremendously: almost every source
The options for treatment are almost
provide solutions for all types of natural gas, including associated and unconventional
MIOGE 2013, 25 - 28 June
Pavilion 1 | Booth A 524
www.engineering-solutions.airliquide.com
Select 101 at www.HydrocarbonProcessing.com/RS

Hydrocarbon Processing | JULY 2013 17
Innovations
ADRIENNE BLUME, MANAGING EDITOR
Training simulator to aid ethylene operators
Hyperion Systems Engineering has delivered to the Linde Group an opera-tor training simulator (OTS) for ONGC Petro-additions Ltd.’s ethylene plant in Dahej, India. The OPaL Dahej plant will be India’s largest ethylene plant, and the center of a larger petrochemical com-plex. Linde built the turnkey plant for ONGC Petro-additions Ltd. (OPaL), together with consortium partner Sam-sung Engineering of Korea.
Hyperion and OPaL representatives will participate and jointly present the successful delivery of the Dahej ethyl-ene plant OTS system at the annual In-ternational Refining and Petrochemical Conference (IRPC), which will be held on July 9–11, 2013, in New Delhi, In-dia. Hyperion’s project scope included the design and delivery of an operator training simulator system for the dual-feed cracker unit (DFCU) and associ-ated units with Honeywell Experion Control system.
The OTS solution includes a hybrid system for the distributed control system (DCS) using emulated controllers and real operator trainee stations. Hyper-ion has developed a high-fidelity, plant-specific simulator for the Dahej ethylene plant. The OTS allows the operators to experience many operating situations in a short training time. The simulator system represents the best method for conducting supervised training exercis-es and helps reduce operational errors. The use of the OTS is expected to result in maximization of plant availability, increase of plant productivity and im-provement of product quality.
Select 1 at www.HydrocarbonProcessing.com/RS
Gas analyzer offers continuous optical scanning
Servomex’s new SERVOTOUGH SpectraScan (FIG. 1) is a real-time opti-cal analyzer that uses the Precisive field-proven optical bench, offering innovative
capability in the continuous analysis of light hydrocarbons C1 to C5+. This tech-nology is faster, less complex and more reliable than the gas chromatograph tech-niques traditionally used in light hydro-carbon applications.
The analyzer’s measurement technol-ogy utilizes near-infrared and infrared absorption spectroscopy with spectral scanning, coupled with chemometric-based data processing. A flow-through cell utilizes a patented spectrometer de-sign for a high-quality optical measure-ment, resulting in a high signal-to-noise ratio that gives a highly stable and ac-curate measurement. No separation col-umns or valves are required.
The SpectraScan analyzer achieves precise separation of hydrocarbons into constituent components through an advanced tunable filter spectroscopy analysis algorithm. Optimized with cross-interference modeling, spectral nonlinearity compensation and peak shifting compensation, this algorithm delivers interference compensation with a permanent span calibration, low cross-interference (< 0.2%), high baseline sta-bility and a linear response throughout the scanning range.
Wavelength scanning is achieved by a custom-designed tunable band-pass filter, with a unique design that enables simultaneous scanning of selected wave-length bands for gases, including meth-ane, ethane, propane, isobutane, n-bu-tane, propylene and ethylene.
The SpectraScan analyzer also deliv-ers a range of auxiliary cost and operat-ing benefits. A fixed hardware configu-ration means that maintenance costs are low, while the infrared technique re-quires no carrier gas and, consequently, has minimal installation infrastructure requirements. The analyzer is available in two configurations: a 19-in., rack-mounted, general-purpose unit; and a wall-mounted, safe-area version certified to CSA Class 1, Division 2 and ATEX Zone 2 standards.
Select 2 at www.HydrocarbonProcessing.com/RS
Software updates improve process optimization
Aspen Technology launched the lat-est release (version 8.2) of its aspenONE software on the opening day of its OPTI-MIZE 2013 user conference, which Hy-drocarbon Processing staff attended. The new software features industry innova-tions for process manufacturing along with significant enhancements to the company’s engineering and manufactur-ing and supply chain products.
The new aspenONE. A new, web-based user interface allows process indus-try professionals to work with aspenONE software anytime and anywhere, and it makes aspenONE the industry’s first web-based software for process modeling and manufacturing. Through one con-sistent interface, users can access all As-penTech products through web-enabled devices. With the new aspenONE, en-terprises can now empower users to tap the full range of AspenTech products without specialized product training or desktop installation. Users can now ac-cess the optimization software via tablet, laptop or desktop computer.
The aspenONE Exchange. This content marketplace allows engineers to source equipment data, third-party con-tent and AspenTech resources from one location, directly from Aspen Plus and Aspen HYSYS, for faster, more accurate process design. By providing content in aspenONE Exchange, equipment manu-facturers and third-party developers can
FIG. 1. Servomex’s SpectraScan analyzer offers continuous analysis of light hydrocarbons.

18�JULY 2013 | HydrocarbonProcessing.com
Innovations
directly reach the industry’s largest cross-section of process engineers.
The Aspen PIMS Platinum. This software provides refinery planners with an intuitive, web-based interface that al-lows them to quickly evaluate multiple sce-narios. Version 8.2 adds the ability to run planning cases and modify data directly in flowsheet views to easily identify market opportunities. Planners can now visualize constraints, evaluate economics, and see the immediate impact of adjustments to the plan to make more profitable decisions.
Advances in aspenONE Engineering software. Product enhancements include expanded solids-modeling capabilities in Aspen Plus software for the specialty chemicals and agro-chemicals industries. Also, updates to the Aspen Economic Evaluation software allow engineers to ensure that designs comply with API RP 14C safety requirements for more accu-rate economic evaluation of oil and gas assets, from conceptual design to detailed cost estimation.
Select 3 at www.HydrocarbonProcessing.com/RS
Liquid-measurement system improves batch processing
Flow-Cal Inc. has released an advanced liquid-measurement system that automates the complex process of batch and ticket processing (FIG. 2). Due to increased acces-sibility of liquid-rich shale formations, the US fuel market has been experiencing a sig-nificant upsurge. With support from major shale players, Flow-Cal developed the En-terprise version 8 with liquids multifaceted system, allowing companies to streamline liquids-measurement operations while en-hancing the integrity of their data.
This enterprise-level application pro-vides for the import, validation, edit and storage of hourly, daily and/or batch data while maintaining an audit trail that meets API guidelines. Enterprise version 8 with liquids has opened new markets and cre-ated opportunities with companies focus-ing on chemicals, oil or refined products. At the same time, Flow-Cal’s existing cus-tomer base is expanding its use of Flow-Cal systems, adding the liquid functional-ity to gas-measurement systems.
Several long-time customers like Chesapeake Operating, ConocoPhil-lips, WPX Energy, and MarkWest Energy have upgraded to the liquid functionality. Many more of Flow-Cal’s gas customers are planning upgrades in 2013.
Select 4 at www.HydrocarbonProcessing.com/RS
All-weather color camera enhances plant monitoring
Yokogawa Electric Corp. has released the first model in the new FIELDEYE II series of all-weather, charge-coupled de-vice (CCD) cameras for the monitoring
of plant facilities and premises. This new model, the FC33U (FIG. 3), is compact and has pan-tilt functionality, but it is not explo-sion-proof. Yokogawa plans to release an explosion-proof model by the end of 2013.
In contrast to the FIELDEYE series, which used an aluminum enclosure, FIELDEYE II enclosures are made of ro-bust, corrosion-resistant SUS316L stain-less steel (SS). Although SS is about three times denser than aluminum, the new enclosures weigh about the same as the aluminum enclosures used on earlier prod-ucts, due to their small size and the use of a thin-wall SS casting process. With these characteristics, the FC33U model is easy to install and can be used in a variety of locations. Other standard features include superior sensitivity (minimum illumina-tion of 0.5 lux), zoom magnification (36× optical and 20× digital), and horizontal resolution (650 TV lines).
Select 5 at www.HydrocarbonProcessing.com/RS
Synthetic lubricants developed for rotary compressors
Ultrachem has released a new line of high-performance synthetic lubricants—the Chemlube Plus Series (FIG. 4)—de-signed for use in a wide variety of rotary screw and rotary vane compressors, as well as centrifugal compressors and vacu-um pumps. The Chemlube Plus Series is fully compatible with most rotary screw compressor oils, and can be used to top off and replace existing fluids.
The lubricants are made with a ther-mally and oxidatively stable polyolester (POE) blend. These oils were designed to take advantage of superior lubricat-ing properties inherent in POEs, and yet be economical, by combining them with less-expensive synthetics.
These fully synthetic, premium lubri-cants are formulated to form less varnish under high-temperature applications and to be more resistant to acidic intake air than polyalkylene glycol coolants. Under nor-mal operating conditions, users can expect to obtain up to 11,000 hours of lubricant service life in rotary screw compressors. The line is available in International Stan-dards Organization grades 32, 46 and 68.
Chemlube Plus Series lubricants offer several performance benefits:
• Reduce oil disposal with extended drain intervals
• Wide operating temperature range
FIG. 2. Flow-Cal’s advanced liquid-measurement system automates batch processing.
FIG. 3. Yokogawa Electric Corp.’s all-weather, CCD camera monitors plant facilities and premises.
FIG. 4. Ultrachem’s Chemlube Plus Series synthetic lubricants can be used in a variety of rotary compressors.

RELIABLE SWISS QUALITY
API 618Rod load up to 1'500 kN/335'000 IbsPower up to 31'000 kW/42'100 HP
FULL RANGE:
YOU GET MORE THAN JUST A PROCESS GAS COMPRESSOR
Lubricated up to 1'000 bar, non-lubricated up to 300 bar
For highest availability: We recom-mend our own designed, in-house engineered compressor valves and key compressor components
Designed for easy maintenance
We are the competent partner with the full range of services – worldwide
→ www.recip.com/api618
Rod load up to 1'500 kN/335'000 IbsPower up to 31'000 kW/42'100 HP
FULL RANGE:
YOU GET MORE THAN JUST APROCESS GAS COMPRESSOR
For highest availability: We recom-mend our own designed, in-house engineered compressor valves and
Designed for easy maintenance
We are the competent partnerwith the full range of services
YOUR BENEFIT: LOWEST LIFE CYCLE COSTS
Select 79 at www.HydrocarbonProcessing.com/RS

Innovations
20
• Excellent anti-wear protection• Compatibility with most compres-
sor oils• Improved safety with high flash-
point.Select 6 at www.HydrocarbonProcessing.com/RS
Analytical sensors do not require transmitters
KROHNE recently introduced SMARTSENS, the first family of 2-wire
loop-powered analytical sensors with in-tegrated transmitter technology (FIG. 5). SMARTSENS sensors significantly re-duce the risk of failures along the chain from sensor to process control system, and ease the handling of analytical sensors. The first step includes the sensors for pH, oxidation-reduction potential and con-ductivity, followed by other parameters.
Until the release of SMARTSENS, analytical sensors required a proprietary
transmitter onsite to translate the sen-sor signals to the process control system. Considering the possible error by the re-quirements of IEC 61508/IEC 61511 in the chain, the transmitter represents the main source of error in percentage. False installation and cabling or configuration of the transmitter are frequently occur-ring problems. To eliminate these risks, KROHNE miniaturized the transmitter and fitted it into the sensor head. Any SMARTSENS sensor can be connected directly to the process control system, featuring direct communication via a 4 mA–20 mA signal or HART Commu-nication Protocol. Therefore, KROHNE is the first provider to offer a direct con-nection from sensor to process control system via a standardized Fieldbus.
All SMARTSENS sensors are digital and can be calibrated or recalibrated off-line, in a laboratory, under controlled con-ditions. The sensors will store the calibra-tion data, and they can be plugged in again onsite. For offline calibration, the sensor can be connected directly to a PC running the same PACTware (field-device tool/device-type manager) as applied in the asset management system, using a USB interface cable for bidirectional HART 7 communication and power supply.
Target industries for SMARTSENS include chemical, pharmaceuticals, food and beverage, as well as power, wa-ter and wastewater applications. Each SMARTSENS sensor is specifically de-signed for its area of application; approv-als and certificates range from installation in explosive areas to hygienic areas.
Select 7 at www.HydrocarbonProcessing.com/RS
FIG. 5. KROHNE’s SMARTSENS is the first family of 2-wire loop-powered analytical sensors with integrated transmitter technology.
1972 Buick GS Stage 1
Creating Value.Carver Pump Company2415 Park AvenueMuscatine, IA 52761563.263.3410Fax: 563.262.0510www.carverpump.com
Do you have flows up to9,000 GPM (2,000m3/hr), heads up to 720 ft (220 M), speeds up to 3,500 RPM, andtemperatures up to 600°F(315°C)? Then you need Carver PumpAPI Maxum Series muscle!Specifically designed to meet the needs of theHydrocarbon Processing Industry, the API MaxumSeries is fully compliant with API 610 Specifications.Manufactured in 35 sizes, standard materials ofconstruction include S-4, S-6, C-6 and D-1, withothers available upon request. Standard featuresinclude a 682 Mechanical Seal compatible sealchamber and the ability to operate up to 400°Fwithout external cooling. Options include a varietyof mechanical seals, lubrication/cooling arrange -ments, auxiliary protection devices and certifiedtesting capabilities. Whatever your requirements,let us build the muscle you need!
API Maxum
Select 153 at www.HydrocarbonProcessing.com/RS
Expanded versions of these items can be found online at HydrocarbonProcessing.com.

Gulf Publishing Company is Hosting its Inaugural Gas–to–Liquids Technology Forum Gas–to–Liquids are poised to make a major impact. We invite you to be a part of this special event dedicated to the latest applications and advancements in this increasingly important area.
Attendees will get Answers to Questions Like: • How will GTL cover the demand gap for petrochemical production in North America and globally?
• What are the major trends in GTL processing, particularly in small–scale and mobile GTL?
• What innovations in catalysts will improve capital and operating costs for GTL facilities?
• How will new GTL production technologies help transform GTL fuel supplies for North America?
Who Should Attend: • Professionals at Engineering & Construction,
Petrochemical, Lubricant, Refi ning, and Process Control Companies
• Specialized Equipment Providers
• Consultants
JULY 30–31, 2013Norris Conference Centers –
CityCentre Houston, Texas
GulfPub.com/GTL

Agenda Day 1: Tuesday, July 30 7:30–8:30 a.m. Registration8:30–8:05 a.m. Opening Remarks: John Royall, President and CEO, Gulf Publishing8:45–9:15 a.m. Keynote: ExxonMobil (invited) 9:15–9:45 a.m. Break
SESSION 1 Session Chair: Stephany Romanow, Editor, Hydrocarbon Processing
9:45–10:10 a.m. GTL as a use for fl are gas/Mobile/modular GTL units for onshore/offshore, stranded gas, fl ared gas by Srinivasan Ambatipati, R3Sciences10:10–10:35 a.m. DME Developments: Opportunities and Challenges by Dr. Ronald Sills, XTL & DME Institute SM10:35–10:55 a.m. Gas lift in offshore production by Robert (Bob) Herrmann, Tetrahedron, Inc.10:55–11:20 a.m. Smaller Scale GTL—an Economic Solution for Distributed Gas by Paul Schubert, Velocys11:20–11:45 a.m. Off Balance-Sheet Project Risk by Ms. Anindita Moitra, Indian Oil Corporation Limited11:45 a.m.–12:45 p.m. Lunch12:45–1 p.m. Coffee and Dessert in Exhibit hall
SESSION 2 Session Chair: Syamal Poddar, President, Poddar & Associates
1–1:25 p.m. Case Study: Gas to Olefi ns Via Methanol Conversion: Low Cost Stranded Methane Opportunities by Tara Fatima, Study Manager, Bechtel Hydrocarbon Technology Solutions, Inc
1:25–1:40 p.m. Questions and Answers1:40–2:05 p.m. Advances & Challenges in Syngas Preparation for Different Applications by
V.K. Arora, Kinetics Process Improvements, Inc2:05–2:35 p.m. Break
SESSION 3 Session Chair: TBD
2:35–3:05 p.m. An Alternative for Liquid Fuel Production: ExxonMobil’s Methanol to Gasoline (MTG) Technology by Mitch Hindman, ExxonMobil Research and Engineering Company3:05–3:50 p.m. Panel Discussion: Process Control Challenges in GTL
Moderator: Syamal Poddar, President, Poddar & Associates Panelists: Bill Poe, Senior Principal Technical Sales, Invensys; Randy Miller,
Americas Sales Manager, Honeywell; Emerson (confi rmed); AspenTech (invited)3:50–4:05 p.m. Questions and Answers4:05 p.m. Closing Remarks: John Royall, President & CEO, Gulf Publishing Company

Agenda Day 2: Wednesday, July 31 7:30–8:30 a.m. Registration8:30–8:45 a.m. Opening Remarks: John Royall, President and CEO, Gulf Publishing8:45–9:15 a.m. Keynote: Shell (invited)9:15–9:45 a.m. Break
SESSION 4 Session Chair: Adrienne Blume, Managing Editor, Hydrocarbon Processing
9:45–10:10 a.m. Modular GTL – Transformational Gas Solution for the Upstream Industry by Iain Baxter, CompactGTL10:10–10:35 a.m. Effect of Capillary Pressure on Reservoir Performance of Conventional and Naturally Fractured Reservoirs by M. Shams, Cairo University10:35–10:55 a.m. Aluminum Compact Heat Exchange Reactor for Fischer–Tropsch Synthesis by Dr. Zhijun Jia, Chart Industries10:55–11:20 a.m. Reformer Furnace Outlet Systems by Daniel Barnett, BD Energy Systems, LLC11:20–11:45 a.m. Thermochemical Conversion of Syngas to Ethanol by Dave Sams, PhD, Albemarle Corp 11:45 a.m.–12:45 p.m. Lunch12:45–1:00 p.m. Coffee and Dessert in Exhibit hall
SESSION 5 Session Chair: Jerry Gump, P.E., Consultant, Baker & O’Brien, Inc.
1–1:25 p.m. Case Study: Studies on the development of FTS catalyst for GTL–FPSO applications by Dong Ju Moon, KIST
1:25–1:40 p.m. Questions and Answers1:40–2:05 p.m. A New Economic Paradigm for GTL: Cost–effective technology enables
conversion of natural gas to drop–in liquid fuels at small–scale by Dr. George Boyajian, Primus Green Energy
2:05–2:35 p.m. Break
SESSION 6Session Chair: Sanjiv Save, PhD, Director, Hydrocarbon Processing, Hatch Ltd.
2:35–3:05 p.m. Strategy to monetize natural gas reserves – A New dawn for GTL? By Zameer Patel, Oryx GTL3:05–3:50 p.m. Next generation facilities by John Oyen, ABB Inc.3:50–4:05 p.m. Preparations for FGTL Methanol & Gasoline from Flare & Stranded Gases by Steve Worley, Worley Engineers Inc.4:05 p.m. Closing Remarks: John Royall, President & CEO, Gulf Publishing Company
JULY 30–31, 2013Norris Conference Centers – CityCentre Houston, Texas
GulfPub.com/GTL

Register Today!The abundance of natural gas, rising crude oil prices, and
environmental regulations have led to increasing interest in Gas–to–Liquids (GTL) processes. New advancements in Fischer–
Tropsch synthesis (FT), Syngas–to–Gasoline plus (STG+), and other GTL technology are leading the development of modular
GTL units capable of scaling down production. The ability for small–scale production allows approximately 40% of gas fi elds to
become economically viable sources for GTL plants.
The advantages of the conversion of associated gas through GTL technologies include: the elimination of fl aring, the unlocking of constrained oil production, increased revenues and reserves, and the ability for modular units to be relocated when a producing gas well
is depleted. Industry innovators like Sasol, Shell and BP have made GTL project announcements/plans, and numerous companies are currently involved in the development of mobile GTL units at well sites and remote refi neries.
Don’t miss this opportunity to learn about the economic viability of GTLs and to connect with top operators and technology leaders from across the global hydrocarbon processing industry.
Visit GulfPub.com/GTL or Call +1 (713) 520–4402 to Register.
Registration Type Regular Price
Single Attendee $990
Team of Two $1,815
Sponsor or ExhibitParticipate as a sponsor or exhibitor at GTL Technology Forum 2013. For more information, contact your local Hydrocarbon Processingsales representative or Bret Ronk, publisher, at +1 (713) 520–4421 or [email protected].
For more information about participating in this event, please contact Melissa Smith, events director at +1 (713) 520–4475 or [email protected].
Hosted by:

Hydrocarbon Processing | JULY 2013 25
Construction Profile
STEPHANY ROMANOW, EDITOR
European refiner makes significant processing advancements
At the Sannazzaro de’ Burgondi re-finery, Eni is moving forward with lead-ing-edge technological breakthroughs to produce “clean” transportation fuels. This refinery has a balanced 190,000 bpd of capacity with a conversion index of 78%. It is among the most efficient facilities operating in Europe. Located in the Po Valley, this refinery supplies the trans-portation fuel markets in Northwestern Italy and Switzerland. With a high degree of flexibility and conversion capacity, the Sannazzaro refinery has the capability to process a wide range of feedstocks. From a logistical standpoint, this refinery is locat-ed along the route of the Central Europe Pipeline, which links the Genoa terminal with French-speaking Switzerland.
The Sannazzaro refinery has two pri-mary crude distillation units and associ-ated processing facilities, including three desulfurization units. Conversion is sup-ported through a fluid catalytic cracker, two hydrocrackers that enable middle-distillate conversion, and a visbreaking thermal conversion unit. A gasification facility further upgrades the heavy resi-due from the visbreaking (tar) unit and produces synthetic gas (syngas), which is sent to the nearby EniPower power plant at Ferrera Erbognone.
Eni constructed the first commercial-scale conversion unit applying the Eni Slurry Technology (EST) process. With 23,000 bpd of capacity, the EST unit can upgrade extra-heavy crude containing a high sulfur content into high-quality mid-dle distillates—in particular, gasoil. In ad-dition, this conversion process nearly elim-inates fuel oil yields to zero. Startup of this facility is scheduled in 2013. Eni’s research and development (R&D) group is investi-gating another advanced conversion tech-nology called Slurry Dual Catalyst, which is a second-generation advancement of the EST process. The Slurry Dual Catalyst is based on the combination of two nano-
catalysts. This new catalyst system could lead to a similar processing breakthrough as the EST process, by increasing produc-tivity and improving product quality while reducing capital and operating costs.
Likewise, Eni is developing a new pro-prietary hydrogen production technology known as Short Contact Time-Catalytic
Partial Oxidation or SCT-CPO. Detailed engineering and design efforts are ongo-ing for the SCT-CPO process at the San-nazzaro refinery. This advanced reform-ing technology transforms gaseous and liquid hydrocarbons (also derived from biomass) into syngas (carbon monoxide and hydrogen) at competitive costs.
FIG. 1. Eni’s EST unit at the Sannazzaro de’ Burgondi refinery (center of photo) will enable upgrading unconventional crudes into cleaner fuels.
FIG. 2. Lifting reactors into place at Eni’s Sannazzaro de’ Burgondi refinery for the EST Project.

2
1
3
4
5
6
7
8
9
10
11
12
13
15
14
16
17
18
19
20
21
22
23
24
25
26
27
cen
tim
ete
r 1:
1
Big changesSOMETIMES START SMALL.CATALYST SOLUTIONS THAT DELIVER VALUE:CLARIANT CATALYSTS.
Our products are small, but they deliver big value. Use our high-performance catalysts to make more of what you want and less of what you don’t, all with less energy. We are ready for your big challenges.
WWW.CATALYSTS.CLARIANT.COM
Trust our long experience from predecessor companySüd-Chemie.
17 2
013
Select 59 at www.HydrocarbonProcessing.com/RS

Hydrocarbon Processing | JULY 2013 27
Reliability HEINZ P. BLOCH, RELIABILITY/EQUIPMENT EDITOR
Expect adversity, but plan for success
Consider that a major oil refinery was planning a substantial modernization project in 2008. Energy efficiency gains and the ability to process a more readily available crude slate were key motivating factors. With the 2008 economic downturn, field erection stopped due to the usual financial considerations.
Unfortunately, in late 2008, much of the new equipment was either on its way or had just arrived at the field staging area. There was no budget for state-of-the-art equipment pro-tection and preservation as successfully practiced in the 1960s and that is often described in books and articles, as shown in FIG. 1.1 Equipment stored without the best available protec-tion invites problems. Without protection, plant staff should expect adversity.
Protecting assets in the field. Contrast such risky unpro-tected storage with the decades-old best-available practice of protection with oil mist. Filling or “blanketing” all internal equipment spaces with oil mist was effective and economical. Both indoor and outdoor storage were applied on hundreds of process pumps in many plants beginning about 1965.2 Staging yards similar to the one shown in FIG. 1 used the same oil-mist consoles, which would later serve hundreds of pumps in their designated process units.
Combining project management and maintenance/reliabil-ity wisdom as a planning style has proved eminently successful for over 40 years. At one facility, in 1979, equipment mortality of machines kept in an oil-mist staging yard was kept well be-low 3%. In stark contrast, the 2013 probable failure rate upon startup after 18 months of unprotected storage at another facil-ity is estimated at 30%.
Startup of equipment stored without first implementing proactive remedial steps can be costly. To have 30% of 200 pro-cess pumps fail upon startup is unacceptable. Assuming a cost of $20,000 per pump, over a million dollars would be spent on repairing improperly stored equipment plus the costs for lost production time. Evasive action and risk reduction is needed on equipment that has not been optimally preserved.
Preservation provides profits. Fluid machinery left in the open without full protection for more than six months should not be expected to run flawlessly. Bearings and mechanical seals are likely to fail before they reach the end of their respec-tive design lives. Accordingly, reasonable risk reduction steps should be pursued:
• The cleaning and dismantling of equipment or replace-ment parts should be prioritized by criticality.
• The dismantling and reassembly of critical machines should be entrusted to highly competent individuals. Deliver-ables and accountabilities should be defined in writing. With
these definitions, carefully scrutinize vendor responses in the bid evaluations and seek qualified vendors. The lowest bidders are rarely the most qualified vendors.
• Designate an “owner” for each piece of equipment that is being dismantled. Use conscientious and experienced indi-viduals to act as “owners” during the equipment inspection and rebuilding process.
• Give the “owner” a checklist of points or items to ascer-tain. The list should include items that are often overlooked, as
FIG. 1. Pumps and motors in an outdoor oil mist preservation (staging) yard. Source: Lubrication Systems Division of Colfax Industries, Houston, Texas.
FIG. 2. A risky pump bearing housing with areas that could bring on seemingly elusive failures.3

28�JULY 2013 | HydrocarbonProcessing.com
Reliability
shown in FIG. 2. The “owner” must certify that elusive failure causes have been addressed.
• Require the “owner” to be present when the equipment is first started up. On all machines that have been stored with inadequate protection, and irrespective of criticality, let a des-ignated “owner” take vibration and thermal imaging readings during the startup process and daily thereafter. An “owner” can handle 6–8 machines; this level of involvement can be dis-continued once the operating staff can take over their routine monitoring duties.
Pay now or pay later. Belatedly implementing these failure-reducing action steps will not be cheap. The monetary outlay ranks somewhere between oil-mist preservation (approxi-mately $200,000 in 2007) and having 60 near-catastrophic failure events if nothing is done. From an organizational view-point, reliability thinking and equipment preservation issues should always be presented to management at an early stage.
Inadequately stored equipment will be risky to operate; ac-cordingly, monies spent on suitable up-front preservation will pay dividends over the long term. A refinery should expect ad-versity in the short run and plan for long-term success. For hy-drocarbon processing facilities, the company and site philoso-phy should be safety, quality and unity every day in all ways. This guide drives steps needed to achieve these commendable goals.
While safety and quality are self-explanatory, unity begs a definition. Unity denotes that all employees should be of one
mind when it comes to implementing whatever is the safest and represents lasting value. While dissent is permitted, unity means that those who question the pathways to safety and quality by declining to allocate needed resources must accept two obligations: 1) list their dissenting views in writing, and 2) accept accountability for actions and funds withheld.
Yet, some large companies are hurt by listening to opinions instead of insisting on informed cost justifications that are based on facts. There are strong incentives to involve bright subject-matter experts on new projects.
LITERATURE CITED 1 Bloch, H. P. and A. Shamim, Oil Mist Lubrication: Practical Applications, The
Fairmont Press, Lilburn, Georgia, 1998, pp. 143–154. 2 Budris, A., Pump Users Handbook: Life Extension, 3rd Ed., The Fairmont Press,
Lilburn, Georgia, 2010, pp. 279–304. 3 Bloch, H. P., Pump Wisdom, John Wiley & Sons, Hoboken, New Jersey, 2011, pg. 16.
LIVE WEBCAST: JULY 25, 2013 | 10 a.m. CDT, 11 a.m. EDT, 3 p.m. GMT
During this exclusive webcast, Lee Nichols, Director, Data Division, Gulf Publishing Company, will highlight current trends in construction activity in the refi ning, gas processing and petrochemical industries around the globe. This includes a detailed breakdown of active and new project construction numbers by region, sector, and status; growing regions of activity; leaders in the industry; and the future of downstream construction activity moving forward.
Hydrocarbon Processing’s Construction Boxscore Database provides users with real-time access to the information they need to make informed business decisions, recognize trends and increase sales to the global hydrocarbon processing industry.
Register Today at HydrocarbonProcessing.com
Boxscore Global Construction Activity
Lee Nichols
Director, Data Division, Gulf Publishing Company
HEINZ P. BLOCH resides in Westminster, Colorado. His professional career commenced in 1962 and included long-term assignments as Exxon Chemical’s regional machinery specialist for the US. He has authored over 520 publications, among them 18 comprehensive books on practical machinery management, failure analysis, failure avoidance, compressors, steam turbines, pumps, oil-mist lubrication and practical lubrication for industry. Mr. Bloch holds BS and MS degrees in mechanical engineering. He is an ASME Life Fellow and maintains registration as a Professional Engineer in New Jersey and Texas.

limiting factors lovelimitless possibilitiesOvercome limiting factors affecting refinery capacity and operating flexibility with BASF innovative FCC products, services and solutions. Our products deliver value to enhance sustainability and performance.
At BASF, we create chemistry for a sustainable future.
� Catalysts � Co-Catalysts � Additives � Services and Solutions
www.catalysts.basf.com/refining
Select 70 at www.HydrocarbonProcessing.com/RS

SUPERIOR SPRAY. SERIOUS RESULTS.Whether you need to cool gas, dissolve salts in an overhead line or inject chemicals to prevent corrosion, we can help optimize injector performance. Here's how:
• Assistance with nozzle selection, spray direction and injector placement. There are dozens of factors to consider before choosing a spray nozzle, determining whether to spray co- or counter-current and identifying the proper placement of an injector in a vessel. We can help you evaluate your process conditions and then design an injector to provide optimal performance
• Design validation using Computational Fluid Dynamics (CFD) and Fluid Structure Interaction (FSI).We use powerful modeling tools to simulate your environment, confirm the injector will provide the expected spray performance and withstand process conditions such as thermal stresses, heat transfer, vortex shedding and more
• Proven track record. Companies like Technip, Mustang Engineering, Bechtel, Shell and many others rely on us to manufacture B31.1 and B31.3 code-compliant injectors and conduct radiographic, hydrostatic, ferrite tests and more
Learn More. Call 1.800.95.SPRAY or visit spray.com/injectors
This injector sprays liquid into gas and is just one of many used for gas cooling, water wash, desuperheating, steam quench, slurry backflush and more.
WIDE RANGE OF HYDRAULIC & GAS ATOMIZING NOZZLES INCLUDING CLOG-RESISTANT STYLES
DOZENS OF INJECTOR DESIGNS AVAILABLE
Unmatched Global Engineering, Manufacturing & Technical Support Nozzles | Control Systems | Headers & Injectors | Research & Testing
1.800.95.SPRAY
CFD MODEL ILLUSTRATES PERFORMANCE BASED ON INJECTOR PLACEMENT
ZENS OF INJECTORSIGNS AVAILABLEUDING
STANT STYLE
Select 66 at www.HydrocarbonProcessing.com/RS

Hydrocarbon Processing | JULY 2013 31
Integration Strategies
PETER REYNOLDS, CONTRIBUTING EDITOR
Virtualization goes mainstream
Virtualization, a computing approach that decouples hardware and software, is rapidly gaining traction in the traditionally con-servative automation and control industry. With its roots in the in-formation technology (IT) world, virtualization was initially met with skepticism for industrial applications. But this has changed. Acceptance is now largely driven by end users demanding lower costs and increased efficiency of existing computing resources.
Most major automation suppliers support virtualization in some form, predominantly for PC and/or server virtualization. With virtualization, a single computer can host multiple instances of the same or different software applications as if each was run-ning in its own dedicated computer. This is true regardless of the specific operating systems applied. In this manner, much of the hardware simply goes away, offering significant benefits over the life cycle of an automation system. These benefits include reduced hardware and associated support costs, less space requirements, lower electricity requirements (both to operate the computers and for the associated heating, ventilation and air conditioning needs) and increased scalability.
Since these benefits clearly outweigh any perceived or actual risks associated with the technology, ARC Advisory Group be-lieves that the trend will continue and accelerate as control-sys-tem architectures evolve.
Virtualization rapidly gaining traction in automation. For computing devices, virtualization began in corporate IT depart-ments. It has moved into manufacturing/processing facilities’ con-trol-system architectures. Historically, due to their conservative nature, control and automation departments were slow to adopt to virtualization, which requires an additional layer of specialized soft-ware and concentrates (rather than distributes) processing power and applications. This created concerns over the impact of hard-ware failures on critical operational applications. However, rapid advancements in virtualization software technology and extensive field experience have addressed and resolved these concerns.
In many cases, virtualization was thrust upon automation de-partments and suppliers through corporate-level pressures to save costs at the operating companies. Initially, virtualization was used solely at the operator interface level, where one server with sev-eral thin-client terminals replaced dedicated PCs. Once this use of virtualization proved itself, many virtualized applications were implemented successfully at the operations management level. Today, it is common to see historians, engineering functions and optimization packages all running on one physical device rather than on separate dedicated devices.
Virtualization facilitates upgrades and expansions.Reducing the numbers of PCs and servers used for automation and supervisory applications can lower both capital and operating
costs by decreasing the number of computers required, consoli-dating space requirements for expensive control and rack rooms, conserving energy consumption, and cutting maintenance and support requirements.
Virtualization also saves costs during upgrades and expansions because the existing server can usually accommodate additional virtual machines (VMs). This allows new applications to be add-ed without incremental hardware costs, and it can be done online, avoiding significant and costly production interruptions.
VMs are highly portable; software maintenance personnel can migrate them to different physical machines. This enables maintenance to be performed on the hardware without impact-ing production operations, and loads can be balanced more ef-ficiently across the physical infrastructure. Also, if a physical server fails, its VM can quickly be restarted on another system. Such flexibility makes VMs a great solution for business continu-ity and disaster recovery.
Will the trend continue? Much of the hardware in a control system has been gradually replaced by software through virtu-alization and other techniques. The question is: “Will the trend continue and what hardware will need to be replaced?”
ARC believes the virtualization trend will continue. It is part of the larger trend in the automation and control industry in which less physical hardware is required, and software functionality is replacing physical devices across the control architecture. For ex-ample, we have seen much of the physical input/output (I/O) of both process automation systems and safety-integrated systems move to largely software-based configurable I/O. In this case, one smart physical I/O board running software has replaced as many as 20 physical part-numbered I/O hardware boards.
Physical networks of Ethernet cables and switches are also being virtualized with virtual local area networks (VLANs). So what is left to virtualize? At this time, even though the control functionality in large-scale process-control systems is largely pro-grammed in software, that control software still runs in purpose-built physical devices, often in redundant configurations. Given the rapid pace of technology and the accelerated acceptance of virtualization techniques elsewhere in the system, it is anyone’s guess about how long this will last.
PETER REYNOLDS has more than 20 years of professional experience in process control, advanced automation applications, information technology, enterprise and supply chain in the downstream oil refining and petroleum product marketing industry. Prior to joining ARC in 2011, Mr. Reynolds served as the strategic planning manager for automation and IT at Irving Oil in Saint John, New Brunswick, Canada. Irving Oil operates Canada’s largest refinery.

Select 100 at www.HydrocarbonProcessing.com/RS

Hydrocarbon Processing | JULY 2013 33
Boxscore Construction Analysis
LEE NICHOLS, DIRECTOR, DATA DIVISION
Outlook for major revamp projects—Part 1
Worldwide, refiners are investing bil-lions in upgrading and modernization projects. These efforts are focused on:
• Increasing flexibility to process heavier, sourer crudes
• Improving energy efficiency• Meeting pending environmental
standards and regulations• Increasing yields of higher-value
petroleum products.
African refiners are working to fur-ther develop and modernize the region’s hydrocarbon processing industry. To meet growing domestic demand, Algeria plans to double its refining capacity over the next five years. Algeria’s state-owned energy company, Sonatrach, will invest $80 billion (B) in oil and natural gas proj-ects to boost refining and petrochemical capacity. This investment is driven to curb the country’s reliance on imported fuel. The plan calls for the construction of 4–5 new refineries and the moderniza-tion of Algeria’s existing refineries.
The $1 B Algiers refinery rehabilita-tion and adaptation project will revamp the plant to increase processing capac-ity from 2.7 million tpy (MMtpy) to 3.6 MMtpy. The project will include
the revamp of existing units to produce Euro-grade fuels. Technip was awarded a lump-sum turnkey (LSTK) contract for the complete scope of work, including the design, supply of equipment and bulk material, construction and startup.
The scope of the contract includes the revamp of the existing crude distillation unit (CDU) for 35% higher throughput capacity, revamps of the residual fluid catalytic cracking (RFCC) and mercap-tan-removal units, and the moderniza-
tion of the refinery’s instrumentation and electrical network. New, gasoline-specif-ic units will be constructed along with a new wastewater treatment unit.
Skikda, Algeria’s largest refinery, is undergoing a major expansion and up-grade. The $2.6 B project will increase refining capacity to 330,000 barrels per day (Mbpd). Samsung Engineering was awarded an LSTK contract for engi-neering, procurement and construction (EPC) services. The scope includes the
FIG. 2. Shell’s ethylene complex on Bukom Island, Singapore. Photo courtesy of Photographic Services, Shell International Ltd.
FIG. 1. Proposed location of Ecopetrol’s Barrancabermeja project.

How can KBR answer your refining challenges?
Hydroprocessing SolutionsKBR Technology cooperates with Shell Global
Solutions to l icense a wide range of industry-
leading hydroprocessing technologies - including
hydrotreating, mild hydrocracking (MHC), full
conversion hydrocracking, lube oil hydroprocessing
and engineering and technical services.
Cutting-edge licensed technologies from Shell
Global Solutions can be leveraged to improve refinery
profitabil ity. These technologies can help refiners
raise capacities, take advantage of oppor tunity
crudes and meet str ingent specifications.
Visit hydroprocessing.kbr.com to learn more about how we can address your challenges.
hydroprocessing.kbr.com
© 2013 KBR, Inc. All Rights Reserved.
Select 96 at www.HydrocarbonProcessing.com/RS

Boxscore Construction Analysis
35
upgrade of existing facilities, and com-missioning is scheduled for mid-2013.
Latin America is playing host to several major refinery revamp projects. In Colombia, state-owned oil company Ecopetrol will expand and upgrade its two largest refineries to satisfy surg-ing demand for transportation fuels. Refinería de Cartagena SA (Reficar), a subsidiary of Ecopetrol, is investing over $6 B to modernize and expand its Carta-gena refinery.
CB&I was awarded an EPC contract for both the construction of a new, 165 Mbpd refinery, located adjacent to the Cartagena refinery, and the revamp of the existing, 80 Mbpd refinery. Once com-pleted, these projects will relieve regional refining constraints and enable Reficar to process heavier, sourer crudes into clean, ultra-low-sulfur gasoline and diesel.
Ecopetrol’s modernization project at the Barrancabermeja refinery (FIG. 1) will increase refining capacity from 250 Mbpd to 300 Mbpd. The $3 B project will add heavy crude processing capability and provide a processing scheme to meet projected Colombian clean-fuels speci-fications for 2013. The project includes the construction of new units, revamps of the diesel and gasoline hydrotreaters, and the dismantling of the existing CDU and vacuum distillation unit (VDU).
Foster Wheeler (FW) will provide front-end engineering design (FEED) and project management consulting (PMC) for the project, including de-tailed engineering for the CDU revamp. FW will also assist Ecopetrol in the EPC contractor selection process and super-vise the EPC and construction contrac-tors. Ecopetrol closed its EPC tender bids in February 2013, and the selection process is underway. Completion of the project is scheduled for 2016.
Petroperu, Peru’s state-owned oil company, will invest $2 B to modern-ize and upgrade the Talara refinery. The project’s main objectives are to reduce sulfur levels, provide flexibility to refine heavy crude from northern Peru, and in-crease processing capacity from 65 Mbpd to 95 Mbpd.
To reduce gasoline imports, Mexico’s state-owned oil company, Pemex, will upgrade its fourth-largest refinery. The $3 B Salamanca refinery upgrade project will increase capacity to 236 Mbpd and
enable the processing of heavy crudes. Salamanca’s reconfiguration will boost diesel and gasoline production while reducing fuel oil output. Construction began in 2012, and operations are sched-uled to commence in 2015.
The Asia-Pacific region has the great-est demand growth for energy. Due to a widening gap between oil consump-tion and demand, Indonesia is investing
heavily in the construction and revamp of domestic refineries. These measures are focused on decreasing subsidized oil imports and supporting Indonesia to be self-sufficient in fuel supplies by 2017.
Pertamina, Indonesia’s state-owned oil company, is investing $1.5 B on the up-grade and expansion of its Cilacap refin-ery. Located on the island of Java, Cilacap is Indonesia’s largest oil refinery, with 348,000 Mbpd of capacity. The expan-
Select 154 at www.HydrocarbonProcessing.com/RS
36�JULY 2013 | HydrocarbonProcessing.com
Boxscore Construction Analysis
sion will add 62 Mbpd of capacity with the construction of an RFCC complex.
Construction on the project began in December 2011, and completion is scheduled for 3Q 2014. Major contract awards include:
• Foster Wheeler—PMC contract for the RFCC project, which includes managing the EPC contractor on behalf of Pertamina
• Adhi-Goldstar—EPC construction contract for the RFCC unit. Adhi-Gold-star is a consortium of Adhi Karya and GS Engineering and Construction.
Pertamina will invest an additional $1.5 B to upgrade its Balikpapan refinery. The 260 Mbpd refinery will be upgraded to process heavier, sourer crudes. Com-pletion is set for 2016.
To meet rising demand for ethylene in Asia, Shell is upgrading its Shell Eastern Petrochemicals Complex (FIG. 2) located
on Singapore’s Bukom Island. The up-grade, which includes debottlenecking the 800,000-tpy cracker, will increase ole-fins and aromatics production by 20% to 1 MMtpy.
On nearby Jurong Island, Shell is ramp-ing up polyols production. The upgrade project will increase capacity by 60%, from 130,000 tpy to 360,000 tpy. Existing facilities will be optimized, and a catalyst will improve the onsite conversion of pro-pylene oxide and ethylene oxide to poly-ols. The expansion and upgrade is sched-uled for completion in 2014.
In India, Bharat Petroleum Corp. Ltd. (BPCL) is investing $4 B to expand and modernize its Kochi refinery. The integrat-ed refinery expansion project will increase processing/upgrading capacity from 9.5 MMtpy to 15.5 MMtpy. Improvements will include processing and upgrading capacity to produce auto fuels compliant
with Euro 3 and Euro 4 specifications, along with increased propylene produc-tion. The propylene streams will be direct-ed to the new, $1 B petrochemical complex adjacent to the Kochi refinery. Completion of the project, including the petrochemical complex, is scheduled for December 2015.
Continuing the outlook for major hy-drocarbon processing revamp projects around the world, next month’s Con-struction Boxscore Analysis will examine upgrade and revamp activities in Europe, the Middle East and the United States.
LIVE WEBCAST: JULY 18, 2013 | 10 a.m. CDT, 11 a.m. EDT, 3 p.m. GMT
Register Today at HydrocarbonProcessing.com
During this exclusive webcast, Heinz Bloch, Reliability/Equipment Editor for Hydrocarbon Processing, will explain some compressor issues and map out practical remedies that have worked in his 50 years of professional experience. Remedial or preventive actions must be taken by operators, technicians, engineers, and managers. Heinz will provide methods learned to prevent process compressor failures.
Topics discussed in his presentation will include centrifugal, rotary positive displacement and reciprocating compressors, as well as missed opportunities to get to the bottom of compressor failures, and actions taken by leading performers to operate some machines without shutdown for fi ve, eight, and more years.
Heinz P. Bloch is the one of the HPI’s most foremost experts in Reliability and Maintenance. As Reliability/Equipment Editor for Hydrocarbon Processing, his areas of responsibility include HP Reliability column and maintenance and reliability coverage. Heinz is a registered professional engineer who has more than 50 years of HPI experience, holds 7 US patents and has authored over 540 technical papers and 18 books. For 24 years, Heinz was an Exxon Chemical Co. machinery specialist and held positions worldwide. He holds BS and MS degrees in mechanical engineering.
HEINZ BLOCH: PROCESS GAS COMPRESSOR FAILURE AVOIDANCE
Detailed and up-to-date information for active construction projects in the refining, gas processing, and petrochemical industries across the globe | ConstructionBoxscore.com
LEE NICHOLS is director of Gulf Publishing Company’s Data Division. He has five years of experience in the downstream industry and is responsible for market research and trends analysis for the global downstream construction sector.

For more information about UOP, visit www.uop.com©2010 UOP. All Rights Reserved.
refining your profit
UOP helps you exceed your goals with innovative technology,catalysts and optimization solutions specifically designed tomeet your needs.
UOP hydroprocessing solutions and optimization services are designed to help
you maximize your return on investment and grow your business. As regional
market demands shift, we provide the process technologies, catalysts and
services that will meet your changing business needs. Our experts work closely
with you to meet your desired yields and product specifications including
ultra-low sulfur diesel standards while improving your operational efficiency.
Backed by over 50 years of hydroprocessing innovations, UOP offers the best and most advanced solutions
to keep your business one step ahead.

| Special Report
REFINERY OF THE FUTURE How will crude oil refineries operate 20–50 years from now? Major influencing
factors reshaping refinery design and operation include access to crudes, location to
markets, size and complexity of facilities, market demand, cost control and pending
regulations on safety, finished product specification, and environmental performance
of the refinery and its refined products. Likewise, advances in instrumentation, data
collection and communication, and equipment and process monitoring are redefining
plant intelligence. Many criteria factor into designing and maintaining a safe, reliable,
efficient and, most importantly, profitable refinery. The July special report provides
insight into the new technologies and trends reshaping the global refining industry.
This aerial view shows construction at Eni’s Sannazzaro de’ Burgondi refinery.
Eni is installing the first commercial-scale conversion unit applying the Eni Slurry
Technology (EST) process; see full story on page 25. Photo courtesy of Eni SpA.

Hydrocarbon Processing | JULY 2013 39
Special Report Refinery of the Future S. SIVANANDAM, Wood Mackenzie, Singapore
Asia: Future challenges and opportunities for refining
Over the past decade, the global refining business has been through a roller-coaster of events. The golden age of refining that started 10 years ago did not last very long. It was imme-diately followed by economic uncertainty created through a global financial crisis and European debt crisis, which further delayed economic recovery. However, oil demand growth in Asia remained resilient throughout this period. Despite strong oil demand growth prospects, there are some headwinds for the Asian refining industry over the next few years due to the rapid developments in the other regions. These developments will collectively change the global refining landscape.
Asia leads demand growth for oil. Fortunately, Asia, as a re-gion, has the highest growth potential for oil demand, as shown in FIG. 1. This region remains the global engine of growth ac-counting for half of the incremental oil demand from 2012 to 2018. During this period, Asian oil demand is expected to grow at an average of 2.2%/yr, outperforming the global growth rate of 1.4%/yr. That’s certainly good news for Asian refiners as they would be the first to serve their local market.
Undoubtedly, China has been driving demand growth; this nation accounts for two-thirds of Asian demand growth fol-lowed by India and economies in Southeast Asia. Favorable de-mographics—such as a young population, rising income levels, aspirations toward higher standards of living, and, to an extent, subsidies—are the key drivers for growth in these markets. The developed Asian nations, namely Japan, Australia, South Korea and Taiwan, are similar to the Western advanced economies; they have lower growth prospects.
Looking at oil demand by sector, transportation is the pri-mary driver, followed by the petrochemical sector. China’s car population is expected to grow the fastest; China’s car parc (number of cars per 1,000 people) is expected to increase from 64 in 2012 to 110 by 2018. A quick comparison of China’s car parc statistics with the present US car parc of 735 shows the huge potential China has to offer in terms of new passenger car demand. Likewise, Asian gross domestic production (GDP) is forecast to increase strongly at 4.5%/yr from 2012 to 2018. The corresponding infrastructure growth will stimulate de-mand for diesel and gasoil. For Asia, the downside to Asian oil demand from alternative feedstocks (natural gas and coal), al-ternate technologies (gas-to-liquids and coal-to-liquids), pen-etration of renewables (biodiesel and ethanol) and removal of subsidies is limited.
Crude oil reality for Asia. New oil demand increases the need for additional refining capacity and associated capital in-
vestment. Despite fuel subsidies affecting refining investments in certain countries, Asia has successfully attracted investors from the other regions. Many crude-oil producers outside Asia are investing in new Asian grassroots refineries to secure crude oil offtake. This trend has been observed in several major re-finery investments in China, Vietnam and Indonesia, where the potential investors are crude producers from the Middle East (ME), Russia and Venezuela.
Asian national oil companies (NOCs) also see a strategic fit in having joint-venture partnership with crude suppliers to mitigate the challenge of declining domestic crude production amidst robust demand growth. Mature oil fields in Asia are well past their production peak; thus, oil import dependency of Asian countries is expected to increase substantially. Conse-quently, security of crude supply is important for both existing and new refining capacity in Asia.
While securing crude volumes is important, it is equally vi-tal to purchase the right quality of crude. Most of the planned new grassroots refineries are highly complex and are configured to process heavy crudes. Likewise, new revamp/debottleneck projects are aimed at installing upgrading units to increase com-petitiveness via a greater ability to process heavy, lower-cost crude oils. Interestingly, the global balances for heavy crudes based on an ideal demand and crude supply suggest that heavy crude will be short, as shown in FIG. 2.
Heavy crudes are being consumed at the source by the new refining projects in the ME and Latin America, leaving less for Asia. There is a mismatch between the expectation and the real-ity with respect to heavy crudes availability. Interestingly, light crudes are expected to be in global surplus largely due to the tight-oil revolution in the US. This has the potential to narrow the light-heavy differential, which could impact the return on investment for many upgrading projects in Asia.
0.0
0.5
1.0
1.5
2.0
2.5
3.0
0
1,000
2,000
3,000
4,000
5,000
6,000
AsiaPacific
ME LatinAmerica
NorthAmerica
GreaterEurope
FSU Sub-SaharanAfrica
Oil d
eman
d gro
wth,
thou
sand
bpd
Demand growthAverage annual growth rate (RHS)
Aver
age a
nnua
l gro
wth r
ate,
%
Source: Wood Mackenzie Product Markets Service
FIG. 1. Oil demand growth by region, 2012–2018.

40�JULY 2013 | HydrocarbonProcessing.com
Refinery of the Future
Intensifying inter-regional competition. In complete contrast to Asia, domestic crude production in the form of tight oil has revived the US refining industry. Tight-oil pro-
duction and transportation bottlenecks have created condi-tions in which WTI pricing is at deep discount to Brent. Re-sult: US refiners enjoy a huge feedstock cost advantage and, thus, better refining margins. FIG. 3 shows the 2012 net cash margin estimates for the top quartile refineries in the three re-gions—the US, Europe and Asia. This figure clearly illustrates the high margins that US refiners are enjoying compared to their counterparts in Europe or Asia.
With the Brent-WTI differential expected to remain wide even in the foreseeable future, the US will remain as the most competitive refining region. US refinery utilization rates are
expected to be higher than that of Asia and Europe. High refinery utilization rates are expected to re-duce the US gasoline deficits and increase distillates surplus, thus paving the way for exports.
New renaissance for some. This renaissance in US refining will have a profound effect on the Eu-ropean refining industry. Unfortunately, Europe has lower refinery utilization rates; even worse, this re-gion can expect another round of capacity rational-ization. However, this does not necessarily translate into opportunity for Asia. The new investments in the ME and Former Soviet Union (FSU) will better serve the European markets due to their proximity and competitiveness. From 2012 to 2018, the ME will have eight new grassroots refineries (about the same as China) come onstream with 2.2 MMbpd of total capacity. The region will have an incremental
demand growth of just 1.5 MMbpd. Clearly, the ME is posi-tioning itself as an export refining center. Similarly, the FSU region is also embarking on residue upgrading investments to make its refineries more competitive.
What does this mean for Asian refiners? With these rap-idly changing regional supply/demand dynamics, there is a four-way competition between the US, ME, FSU and Asia to meet the growing diesel deficits in Europe. North Asian diesel exporters will struggle to place barrels in Europe due to this competition. Even export refiners from India could find their export prospects diminishing. However, recently enacted die-sel fuel price reforms could enable Indian private refineries to increase their focus on the domestic market. Moreover, capac-ity rationalization in Japan and Australia will absorb some of the excess diesel barrels within Asia.
Gasoline can pose a more serious problem to Asian export refiners. By 2018, we expect a global gasoline surplus. The sur-plus is mainly due to the projected reduction in the US gaso-line deficits and new ME refining capacity. This reduces the opportunity for Asian exports targeting US and ME markets. Result: The outlook for refiners that maximize gasoline pro-duction in Asia is bleaker than those that maximize diesel.
Despite a positive outlook for oil demand in Asia, increas-ing competition from other regions puts the Asian export refiners at a disadvantage in terms of inter-regional trade. However, some Asian export refiners are highly competitive and could survive even in a weaker refining environment, thus challenging the viability of the less-complex refineries in the region. Therefore, securing the right quality of crude oil, increasing refinery competitiveness and adapting to fast-changing inter-regional trade dynamics are some of the key challenges for Asian refiners.
SURESH SIVANANDAM is Wood Mackenzie’s APAC downstream senior analyst, based in Singapore. He analyses the region’s short-term and long-term outlook for the refined products market. Also, he is involved in the refinery competitive ranking of Asian refineries. To request more information related to this article, please visit Wood Mackenzie’s website at www.woodmac.com/hpjuly2013.
-800
-600
-400
-200
0
200
400
600
800
2018
Glob
al cru
de oi
l bala
nce,
thou
sand
bpd
Heavy (< 28 API)Medium (≥ 28 and ≤ 38 API)Light ( > 38 API)
Source : Wood Mackenzie Product Markets Service.
FIG. 2. 2018 Global crude oil balance—supply vs. ideal demand.
05
10152025303540
Source: Wood Mackenzie Refinery Evaluation Model
2012
Net c
ash m
argin
, $/b
bl USAsiaEurope
FIG. 3. Estimated 2012 net cash margin for the regional top-quartile refineries.
The Asia-Pacific region is the largest oil
demand and refining center worldwide.
This region benefits from a growing
consumer market. However, lack
of domestic crude oil reserves and
diminishing output complicate future
design and operation of Asian refineries.

EDV® Technology provides refiners with an economic and reliable means for controlling
emissions of pollutants (PM, PM10, SOX, HAPs, NOX ) from FCCUs and other stationary sources.
Write, call or fax Belco Technologies Corporation.
TM © Belco Technologies Corporation
Reducing refinery emissions has never been so easy.
88
Copyright © 2010 DuPont. The DuPont Oval Logo, The miracles of science ™, and BELCO® are registered trademarks or trademarks of E.I. du Pont de Nemours and Company or its affiliates. All rights reserved.
Select 97 at www.HydrocarbonProcessing.com/RS

Select 67 at www.HydrocarbonProcessing.com/RS

Hydrocarbon Processing | JULY 2013 43
Special Report Refinery of the Future R. BECK, D. AJIKUTIRA, L. HERRMANN and V. YE,Aspen Technology Inc., Burlington, Massachusetts
Enhance refinery profitability with modeling innovations
Refining operations continue to be a crucial but challenging element in the pe-troleum value chain; critical to the ability to bring hydrocarbons to market, but, in many instances, still a challenge in terms of attaining targeted levels of profitabil-ity. Fortunately, there have been rapid in-novations and advances in several of the key enabling modeling technologies that contribute to the ability to react to techni-cal and business changes. There are more innovations on the horizon. Refinery as-sets and operations are in the midst of an evolution, both in terms of the worldwide distribution and age of refining capacity, and the demand for flexibility in crude se-lection and product portfolios.
Software innovations discussed here fall into four general groups. One area of innovation is the workflow and usability of sophisticated refinery modeling tools. Increasingly, high-fidelity models are be-ing used for refinery operation, planning, maintenance, cost feasibility and trouble-shooting. The importance of these de-velopments cannot be understated as a new generation of engineers enters the workforce.
A second area involves breakthroughs in the integration of models that en-able optimization and improvement on a refinery-wide basis, such as heat inte-gration, energy savings and capacity im-provement. A third area involves advanc-es in underlying science and methods, including improved molecular modeling and better statistical models to character-ize and represent properties of crude oil, and transparent reactor models that pro-vide rapid updating of planning models. A final and increasingly important advance encompasses new usability paradigms that provide mobile access to all plant models and data anytime, anywhere.
The business result of the above ad-vances is a significantly improved ability of the organization to respond to crude selection and product contract opportu-nities, reduction in energy consumption, and improved sustainability and control. These are the requirements of the next generation of refineries.
Faster training. Process modeling sys-tems that can represent, characterize, model and optimize refineries involve considerable complexity of functional-ity, tools, options and reporting capabili-ties. As the functionality of these models increased over the past 15 years, the us-ability of the modeling systems did not improve at a parallel pace, and, in many cases, it became problematic.
Over the past year, in-depth analyses of how a modeler builds and employs a refinery simulation model has led to more easily accessed models, more easily un-derstood interfaces and improved work-flows.1 FIG. 1 shows a stylized program ribbon as implemented for properties analysis and for simulation modeling.
High-fidelity exchanger models. Re-fineries have an ongoing focus on reduc-ing their energy footprint by optimizing energy use through operating, equip-
ment, maintenance and process-configu-ration strategies. The use of more rigor-ous models for heat exchangers, and the embedding of those models within the refining simulation model, have proven to be an important step for making refin-eries more energy efficient. By modeling heat exchangers more accurately, process design optimization can be less conserva-tive, making the process more profitable. Early identification of structural challeng-es, such as vibration or fluid momentum (Rho V2) problems, means a shorter cycle from conception to feed.
Rigorous models also calculate pres-sure drops that help design related equipment, such as pumps. These rigor-ous modeling results are used to plan the upgrading or reconfiguring of heat ex-changers as a method of utilizing energy more efficiently and to ensure that the selected exchanger configurations are optimal for the conditions under which they will operate.
A full geometric predesign of heat exchangers and incorporation of the ex-changer in the simulation is now possible. This has resulted in engineers, equipment designers and operators having early and greater fidelity in examining the impact of design and operations decisions on heat use in the plant.
FIG. 1. Ribbon bars for physical properties and simulation modes characterize the new generation of process modeling tools.

44�JULY 2013 | HydrocarbonProcessing.com
Refinery of the Future
Another important aspect of heat ex-changer design that relates to energy ef-ficiency, as well as to efficient operation, is equipment fouling. Rigorous heat ex-changer models can be used to calculate fouling resistance. This provides operat-ing benefits because, as fouling increases, equipment throughput sharply decreas-es, creating serious efficiency issues, as shown in FIG. 2.
This heat exchanger modeling for fouling was used by a major chemicals producer and refiner when modeling a heat exchanger train. The refinery was ex-periencing significant increases in operat-ing costs because of heat exchanger foul-ing. The lack of a rigorous model meant that the refiner was unable to accurately calculate the fouling of single exchang-ers, as well as the entire train, and it had no means to estimate output temperature increases after the train was cleaned. With a rigorous model, the company was able to accurately model the fouling and de-termine how often the heat exchangers needed to be cleaned for optimal opera-tion. The profit resulting from those im-provements alone is estimated at between $1.5 million (MM)/yr and $2 MM/yr.2
Molecular modeling and assay. In most geographies, the selection of crude oils available as refinery inputs has wid-ened, introducing more operating choic-es. Crude oils are complex mixtures, and, depending on where the crude is sourced, they can vary greatly in composition. Due to the large number of different hydro-carbon molecules that can be present in petroleum, it is infeasible to fully define the composition of the mixture. However, each crude oil type has unique molecular
and chemical characteristics, so an assay is used to evaluate the properties of the petroleum and obtain data to characterize crude oil feeds. By characterizing these assays, refiners can see whether a specific crude oil feedstock is compatible with a particular petroleum refinery or if it will cause quality, yield, economic or environ-mental issues.
Evaluations are costly and tedious, and they result in a limited set of property measurements for the crude. Thus, statis-tical extrapolation and interpolation, as well as estimation methods, are used to predict missing properties for refinery planning and process simulation.
These statistical methods have been used extensively in the industry, but the limited assay data makes precise fitting dif-ficult, which can result in incorrect charac-terizations that will impact the accuracy of the model. Modelers must take advantage of special factors or handles provided by traditional assay characterization tools to ensure that the results are correct and lead to realistic modeling outcomes. Recent research has focused on improving such tools to more fully incorporate the engi-neering knowledge of the problem, with the goal of better results.
Traditional analytical approaches suf-fer from extrapolation limitations, de-pending on the assay data available. With the selection of crudes on the market be-coming heavier, the need for a new and fundamentally better methodology for crude assays is more important than ever.
An exciting new innovation, molecule-based characterization, offers the stron-gest scientific basis for the prediction of crude oil properties, as it bases its calcula-tions on the chemical compositions of the
hydrocarbon constituent molecules and on accurate molecular thermodynamic models for hydrocarbon mixtures.3
This approach to crude characterization has, as a basis, the principle that all hydro-carbon molecules can be constructed from a set of different structural segments, which can be described as a specific structural combination of carbon, hydrogen, sulfur, nitrogen and oxygen atoms. By modeling the complex hydrocarbons in the crude oil as a series of repeating molecular segments, the assay characterization has significantly improved accuracy, especially for heavier and increasingly varied crudes, such as high-sulfur oil. Refiners and planners are better able to estimate the properties of the crude oil feedstock, which results in more accurate reaction modeling.
Furthermore, using the same, improved assay characterization method for both the simulation model of the refinery and reac-tors, and the planning model for refinery operations, leads to overall improvements in the ability to make economically opti-mized decisions and to successfully pre-dict refinery conditions and performance.
High-fidelity reactor models. The im-provements seen in modeling software in recent years have been especially remark-able in the reactor design area. These rig-orous reactor models have accounted for significantly more accurate determina-tions of equipment operations and easier identification of possible optimizations.
In addition, whereas before it was nec-essary to model these reactors separately and modify connecting streams by hand, it is now possible to model them in one integrated flowsheet.4 This advancement has become more significant as more
Furnace not limiting
>$2MM
Furnace outlet T (FOT)
Furnace inlet T (FIT)
Profit
Furnace duty
Throughput
Energy recoveryin feed preheat train
FIG. 2. Example of impact of fouling on refinery furnace systems.
Furnace limitingKeep furnace outlet temp at specification; reduce throughput
>$2MM
>$7-12MM
FOT
Profit
Furnace duty
Throughput
Energy recoveryIn feed preheat train

Hydrocarbon Processing | JULY 2013 45
Refinery of the Future
reactors are added to refineries, since it enables modeling of the interactions be-tween reactors to better understand and optimize the process.
The increase in the number of reac-tors is due primarily to the availability of heavier crudes. To keep up with this trend, modeling software has focused on ex-panding the properties available to model heavy crudes and, therefore, improve their reaction modeling, as mentioned in the previous section.
To make the use of heavier crudes more economically feasible, refineries have been adding cracking units to break the heavier crudes into simpler hydrocarbons to ob-tain the desired product blends. These sophisticated and vital cracking units must be rigorously modeled to serve this pur-pose, which increases the need for rigorous modeling software that can perform with-in the context of a wider simulation model.
The trend toward adding reactors is seen, for example, in Royal Dutch Shell adding hydrocrackers to three refineries in Holland, China and Poland. In all three cases, the hydrocrackers were added to take advantage of heavier crudes, which are more economical than lighter crudes.5
Modeling these hydrocrackers is extreme-ly important for making this process fea-sible and will become more so, as more of these units are added to refineries.
Planning model. Another important de-velopment in refinery modeling involves advances in the ability of integrated soft-ware to update widely used refinery planning models more accurately, more frequently and with less specialized ex-pertise.6 Support for this activity within the newest releases of refinery simulation models leads to better accuracy in the planning model for feedstock selection. The automation and demystifying of these interfaces is increasingly important as the addition of reactors increases the complexity of the process.
With the ability to model how reactors influence the end product, modeling soft-ware can interface with planning software to assist in the selection of the best feed-stock for the desired products. Since the reactors involved in the process need to be rigorously modeled to give an accurate result, it is crucial to have planning soft-ware that can interface with the modeling software to give the most accurate results possible. The result is optimized reactor
operating conditions and product output. In the past, this activity always required a heavy dose of expert consulting input, the resources for which were not always avail-able; however, that is no longer the case.
Mobile interfaces to refinery models.With the advent of mobile technology and the increasing number of users of portable devices, it seems logical for refining and engineering companies to take advantage of these new capabilities to maximize pro-ductivity. By introducing applications that allow users to access process charts and data securely, without having to be onsite and without having to be experts in the un-derlying tools and models, managers and engineers can instantly receive updates and access models to keep track of plants wherever they are located (FIG. 3).
The ability to manage various process-es from any location can help companies substantially reduce costs, while also in-creasing flexibility and worker efficiency. With the popularity of tablets and smart-phones on the mobile devices market, these applications can take advantage of the convenience of monitoring ongoing activities at the plant from anywhere.
Additionally, these devices have the added benefit of being always on, always with the user and usually connected to a global network. By providing a mobile in-terface for engineering applications, users will rarely be in a position where they will not be able to access data securely and in-stantly. This key innovation ensures that companies keep up with, and take full ad-vantage of, modern shifts in technology.
More innovations to come. The inno-vations described here have largely been introduced over the past two years, great-ly accelerating the pace of innovation and modeling power for refinery operations, improvements and design. This pace of innovation is unlikely to slow down. A number of exciting improvements are on the horizon, which will add powerful optimization capabilities into the process modeler’s simulation work space in areas such as heat integration, column optimi-zation and economics.
Additionally, the refinery manager can expect important advances in the power and value of mobile interfaces to give the manager access to key refinery performance information, anywhere and anytime, and to give the engineer access to the technical details required to make improvements to the performance.
LITERATURE CITED 1 Press release, Aspen Technology, December 10, 2012. 2 Berlin, G. Y. and P. Robert, “Quantifying and moni-
toring fouling of refinery heat exchangers,” INEOS, AspenTech User Conference, 2008.
3 Press release, Aspen Technology, “New assay man-agement functionality in Aspen PIMS software opti-mizes crude purchasing decisions and increases prof-itability,” August 27, 2012.
4 Shethna, H., “Operations support for refinery plan-ning and simulation,” Saudi Aramco, 2013 Optimize Global Conference, May 7, 2013.
5 Shell Global Solutions, “Key lessons from success-ful hydrocracker projects,” Hydrocarbon Processing supplement, September 2011.
6 Briggs, B. and K. Lau, “Webinar with BP: Improving refinery margins with hydroprocessing model appli-cations,” BP Refining and Logistics, January 10, 2012.
Author biographies can be found online at HydrocarbonProcessing.com.
FIG. 3. Innovative access to refinery models on mobile devices is growing.

Our Safety Services are a Breed Apart
Bridging the Gap Between Safety and Productivity
We’re not one of the pack — We don’t sell safety equipment. Safety isn’t our side business either. Instead, we provide the safety manpower and methods to help you drive your safety culture and program from the top down and the bottom up during turnarounds, shutdowns and projects when your safety team is stretched thin.
Trained for better fi eld performance — We augment your staff with specialists. They are specifi cally and rigorously trained to perform their assigned tasks. (Why pay craft/helper wages for holewatch/fi rewatch?) We also provide permit specialists, planners, safety advisors, auditors/inspectors, coordinator services, HSE consulting and more. Select one, some or all of our services.
Good behavior gets rewarded — Our clients tell us how our services consistently save them time and money. One client estimated that our tracking process eliminated 900 hours of craft standby time alone. Another said our permitting processes impacted his critical path work saving around $800,000.
Call now to learn more about our reliable breed of safety.
Phone: 800-994-2339
E-mail: ssmith@certifi edsafety.netwww.certifi edsafety.net
League City, Texas • Benicia, California • Whiting, Indiana
Select 86 at www.HydrocarbonProcessing.com/RS

Hydrocarbon Processing | JULY 2013 47
Special Report Refinery of the Future D. C. CLARK and M. A. TURK,Invensys Operations Management, Houston, Texas
The future of automation is now
Regulatory control systems—from pneumatic single loop controllers to modern distributed control systems—have proven to be very successful in managing the basics of plant operations, regardless of the nature of the processes involved. Over time, technological advancements have enabled dramatic improvements to be made in the functionality that process automation systems provide, enabling them to perform in-creasingly complex tasks. However, until recently, the primary purpose of these systems has been to control process variables, such as temperatures, pressures, levels and flows, with the goal of achieving stable and safe plant operations.
In response to myriad internal and external pressures that affect process plant performance and competitiveness, auto-mation systems are undergoing significant enhancements and expansions of their functionality. The emphasis in the past was on improving process efficiency, while, in the future, it will fo-cus on improving business performance. In other words, you have to have the former before you can hope to get the latter.
To understand process automation’s current state, we start by examining the history of automation technology in the con-text of the business drivers over the past half century that are responsible for the technology evolution (and, in some cases, revolution) in this field. We then look at advances in measure-ment systems and the new classes of variables, like financial performance indicators, that are being brought into process automation systems to address current business drivers and competitive pressures affecting process plants.
These advances, coupled with the effect of changes in the speed of information access and sharing, demand that a new perspective on operations be adopted. This, in turn, is driv-ing further evolution of automation system capabilities and an increasing reliance on value-add applications to both improve and provide real-time feedback about the economic perfor-mance of process plants. Taken together, this nexus of busi-ness drivers and technological advancements has resulted in a new class of automation technology, the enterprise control system, which provides the foundation for production opera-tions management, with its purpose to effectively close the “business control loop.” This will greatly facilitate collabora-tion for improved decision making and enable companies to manage their processes as a business, just as they manage their business as a process.
History of automation technology. The last 60-plus years have seen companies with a primary focus in the hydrocarbon processing industry (HPI) changing in response to competi-
tive pressures. In the middle of the last century, these compa-nies made significant investments in product chemistry and R&D activities to create molecules with commercial appeal. The industry was focused on “what to make.” In the latter de-cades, the emphasis shifted to one of “how to make it.” Process efficiency and cost management became strategic initiatives. Present global competition and economic uncertainty have made it imperative for companies in the HPI to devote their energies to maximizing profits by optimizing their operations. This shifting focus is illustrated in FIG. 1.
Simply put, this business driver evolution has shifted com-pany strategies from those focused on improving process ef-ficiency to those focused on improving business performance. These evolving strategies have had profound effects on organi-zations and the technologies they need to achieve and maintain competitiveness. Let’s take a brief look at the resulting changes in automation technology.
In the 1950s, prior to the advent of the “digital age” in pro-cess automation, control systems were designed to hold pro-cess conditions at their target values (in the face of measured and unmeasured disturbances), using straightforward single loop, feedback proportional integral derivative (PID) control strategies. This approach produced satisfactory results as long as concerted efforts were made to keep the control loops correctly tuned. Such regulatory control systems remain a key compo-nent of all process automation architectures.
As process technologies became more complex in response to competitive pressures to improve product quality and yields while reducing operating costs, greater demands were placed on process control systems to manage these processes at the higher levels of performance required to meet operating objec-tives. As a result, significant advancements were made in the
1950 1975 2010
What to make How to make it How to makeit profitably
Key considerations
Drive
rs in
the
proc
ess i
ndus
try
Key considerations Key considerations
FIG. 1. Evolution of process industry drivers.
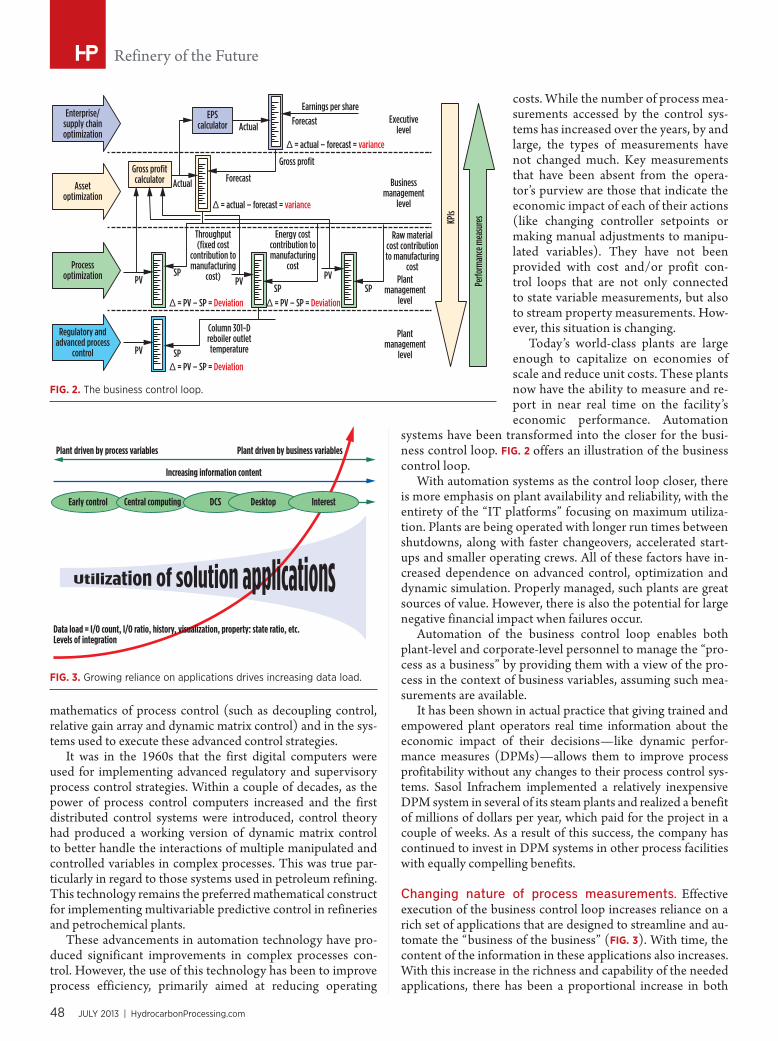
48�JULY 2013 | HydrocarbonProcessing.com
Refinery of the Future
mathematics of process control (such as decoupling control, relative gain array and dynamic matrix control) and in the sys-tems used to execute these advanced control strategies.
It was in the 1960s that the first digital computers were used for implementing advanced regulatory and supervisory process control strategies. Within a couple of decades, as the power of process control computers increased and the first distributed control systems were introduced, control theory had produced a working version of dynamic matrix control to better handle the interactions of multiple manipulated and controlled variables in complex processes. This was true par-ticularly in regard to those systems used in petroleum refining. This technology remains the preferred mathematical construct for implementing multivariable predictive control in refineries and petrochemical plants.
These advancements in automation technology have pro-duced significant improvements in complex processes con-trol. However, the use of this technology has been to improve process efficiency, primarily aimed at reducing operating
costs. While the number of process mea-surements accessed by the control sys-tems has increased over the years, by and large, the types of measurements have not changed much. Key measurements that have been absent from the opera-tor’s purview are those that indicate the economic impact of each of their actions (like changing controller setpoints or making manual adjustments to manipu-lated variables). They have not been provided with cost and/or profit con-trol loops that are not only connected to state variable measurements, but also to stream property measurements. How-ever, this situation is changing.
Today’s world-class plants are large enough to capitalize on economies of scale and reduce unit costs. These plants now have the ability to measure and re-port in near real time on the facility’s economic performance. Automation
systems have been transformed into the closer for the busi-ness control loop. FIG. 2 offers an illustration of the business control loop.
With automation systems as the control loop closer, there is more emphasis on plant availability and reliability, with the entirety of the “IT platforms” focusing on maximum utiliza-tion. Plants are being operated with longer run times between shutdowns, along with faster changeovers, accelerated start-ups and smaller operating crews. All of these factors have in-creased dependence on advanced control, optimization and dynamic simulation. Properly managed, such plants are great sources of value. However, there is also the potential for large negative financial impact when failures occur.
Automation of the business control loop enables both plant-level and corporate-level personnel to manage the “pro-cess as a business” by providing them with a view of the pro-cess in the context of business variables, assuming such mea-surements are available.
It has been shown in actual practice that giving trained and empowered plant operators real time information about the economic impact of their decisions—like dynamic perfor-mance measures (DPMs)—allows them to improve process profitability without any changes to their process control sys-tems. Sasol Infrachem implemented a relatively inexpensive DPM system in several of its steam plants and realized a benefit of millions of dollars per year, which paid for the project in a couple of weeks. As a result of this success, the company has continued to invest in DPM systems in other process facilities with equally compelling benefits.
Changing nature of process measurements. Effective execution of the business control loop increases reliance on a rich set of applications that are designed to streamline and au-tomate the “business of the business” (FIG. 3). With time, the content of the information in these applications also increases. With this increase in the richness and capability of the needed applications, there has been a proportional increase in both
Enterprise/supply chainoptimization
Assetoptimization
Actual
EPScalculator
KPIs
Perfo
rman
ce m
easu
res
Forecast
ActualExecutive
level
Businessmanagement
level
Raw materialcost contributionto manufacturing
costPlant
managementlevel
Plantmanagement
level
Column 301-Dreboiler outlettemperature
Throughput(fixed cost
contribution tomanufacturing
cost)
Energy costcontribution tomanufacturing
cost
SPSP
SP
SP
PV
PV
PV PV
ForecastEarnings per share
Gross profit
Processoptimization
Regulatory andadvanced process
control
Δ = actual – forecast = variance
Δ = actual – forecast = variance
Δ = PV – SP = Deviation Δ = PV – SP = Deviation
Δ = PV – SP = Deviation
Gross profitcalculator
FIG. 2. The business control loop.
Plant driven by process variables Plant driven by business variables
Increasing information content
Early control
Data load = I/O count, I/O ratio, history, visualization, property: state ratio, etc.Levels of integration
Central computing DCS Desktop Interest
FIG. 3. Growing reliance on applications drives increasing data load.

Hydrocarbon Processing | JULY 2013 49
Refinery of the Future
the total I/O count in a plant and in the I/O ratio. In the early days, typical I/O ratios were about 1-2:1, with I/O counts on the order of 4,000. Today, the ratios are 7-9:1, and the counts often exceed 75,000. Why? Because the applications demand an ever increasing amount of input informa-tion to deliver the functionality demanded of them.
Furthermore, to improve visibility into the busi-ness performance of the plant, it is necessary to have better measurements of the process stream proper-ties that provide the value uplift for which the plant was designed. Online process measurement technol-ogy is advancing at a rapid pace such that robust, relatively inexpensive stream property measurement sensors will soon become commonplace in petro-leum refineries and petrochemical plants. These measurements will facilitate the ability of operations personnel to make decisions based on profitability, not expediency.
New perspective on operations. One of the key driving forces responsible for the changing nature of automation systems—going beyond control of processes to control of business performance—is the dramatic reduction in the time constant of information flow across the globe. It was not too many years ago that it took days for information to travel from one part of the world to another. This relatively long time constant of information flow (τIF) allowed petroleum refin-ers and petrochemical producers sufficient time to respond to events that affected them, since the time constant of the refinery’s or petrochemical plant’s decision-making process (τDP) was shorter than τIF. Telex and facsimile transmission re-duced the τIF somewhat, but plants were still able to respond in a timely manner.
As little as 20 years ago, no one in the HPI spoke about the need for agility to achieve and sustain competitiveness. But, as the saying goes, “times have changed.” Today, information flow across the globe is, for all intents and purposes, instantaneous, such that τIF is approaching zero. The same cannot be said for τDP. While automation technology has enabled τDP to shrink, it is still large compared to τIF It is not surprising that many HPI facilities have either changed hands or shuttered due to their lack of competitiveness and profitability. The challenge remains to continue to cost-effectively apply automation technology, information management tools and modern decision making paradigms in ways that further reduce the value of τDP.
Patchwork of applications vs. enterprise control system. One of the primary causes of a high τDP is the fact that many of today’s HPI facilities and businesses are managed using a patchwork of loosely coupled applications. While these myriad of applications—some of which are “mission criti-cal”—may be connected to plant information and/or corpo-rate business networks, Microsoft Excel remains the preferred mechanism for sharing information among these applications. This is not only time consuming and manpower intensive, but it also lacks the robustness and cost-effectiveness demanded of high-performance companies.
The good news is that the industry is at the nexus of a tech-nology revolution that has finally enabled realization of the
vision for an integrated enterprise control system. This was referred to in the past as computer integrated manufacturing (CIM). This revolution includes:
• Service-oriented architectures• Cloud computing• Solid-state high-speed memory devices• Parallel computing• Virtualization• A wealth of off-the-shelf hardware platforms and software
applications• Definition and widespread acceptance of industry stan-
dards that allow for greater interoperability and lower costs• Wireless communications• Cyber security.Due to these technologies, it is now possible to tightly
couple business performance/strategy with process effi-ciency/execution via a production operations management/enterprise control system (FIG. 4). This “system of systems” is based on the modular integration of applications that are custom-tailored to industry needs. Empowered individuals at all levels of the organization now have the capability at their fingertips to measure business performance in near real time and then use this information to make decisions and take ac-tions quickly and correctly in order to correct for deviations from plan or to reinforce positive behaviors. The net result is a significant decrease in τDP which makes an organization more responsive to market forces and, therefore, better able to compete in the global HPI.
Businessperformance
Custo
mers
Supp
liers
Time
Processefficiency
Execution
StrategyYears/
months
Seconds
Handled byERP systems (1990s)
Production operationsmanagement
aka “the future”Measure... Empower... Improve
Handled byDCS/PLC systems (1980s)
FIG. 4. Production operations management system.
As little as 20 years ago, no one in the HPI
spoke about the need for agility to achieve
and sustain competitiveness. But, as the
saying goes, “times have changed.” Today,
information flow across the globe is, for all
intents and purposes, instantaneous.

50�JULY 2013 | HydrocarbonProcessing.com
Refinery of the Future
Other enterprise control system benefits are cross-disci-plinary collaboration enabled by new visualization techniques and new tools to convert vast amounts of data into informa-tion. Agility is enhanced by being able to make use of remote expertise and decentralized, but coordinated plant operations.
The future is now. Real time is the new frontier of sustain-able value creation. An enterprise control system extends the control loop concept into the business of operations. It en-ables understanding of:
• The what —business variances right now, as in the right information, to the right people, at the right time, in the right context
• The why—root cause connections to variances.And it provides the ability to:• Control/automate the routine• Look forward/set most profitable pathway.This new way of doing business allows companies in the
HPI to identify future profitability opportunities and have a small enough τDP to take advantage of them. The result is faster “time to profits.”
Benefit sources include:• Cross-platform integration• Real-time schedule feeds forward from operations, not
just to operations• Built-in robustness and fault tolerance• Smarter asset management maintenance strategies
• Dynamic simulation, online optimization for process and business to run online “what if ” scenarios
• Inventory reductions• Ability to quickly and correctly identify the point-of-no-
return on operating costs• Capability to run a virtual “single plant” across many ac-
tual sites/locations• Quality improvement (waste down and yield up)• Enhanced cyber security• Agile real time business finance visibility of asset uti-
lization.In summary, as automation moves into asset optimization, it
spans all elements of operations and becomes the vehicle to run your process as a business. The future of automation is now and it is indeed bright.
DON CLARK is the vice president of global process industry solutions for Invensys. He has more than 30 years of industry experience. He has a bachelor of science degree in chemistry from California State University in Fullerton and a master of science degree in chemical engineering from the University of Houston in Texas.
MARTIN TURK is the director of hydrocarbon processing industry solutions for Invensys. He has more than 40 years of industry experience. He has a bachelor’s degree in chemical engineering from the University of Dayton and a PhD in chemical engineering from the University of Notre Dame.
VIEW ON DEMAND
Register Today at HydrocarbonProcessing.com
During this exclusive webcast, Heinz Bloch, Reliability/Equipment Editor for Hydrocarbon Processing will provide clear guidance and practical advice on decisions made during projects that have a direct and benefi cial impact on refi neries and plants. Heinz will discuss budgeting, Machinery Quality Assessment (MQA), machinery storage preservation, modern 3D printer methods of pattern production, standardization and more.
Heinz P. Bloch is the one of the HPI’s most foremost experts in Reliability and Maintenance. As Reliability/Equipment Editor for Hydrocarbon Processing, Heinz’s areas of responsibility include HP Reliability column and maintenance and reliability coverage. Heinz is a registered professional engineer who has more than 50 years of HPI experience, holds 7 US patents and has authored over 540 technical papers and 18 books. For 24 years, Heinz was an Exxon Chemical Co. machinery specialist and held positions worldwide. He holds BS and MS degrees in mechanical engineering.
HEINZ BLOCH: TEN GREAT PROJECT DECISIONS WITH POSITIVE LONG-TERM RESULTS

Hydrocarbon Processing | JULY 2013 51
Special Report Refinery of the Future B. WRIGHT and C. SANDU,Baker Hughes, Sugar Land, Texas
Processing shale oils requires innovative solutions
The refining of shale oil (also known as tight oil) extracted through fracturing from fields such as Eagle Ford, Utica and Bakken has become prevalent in many areas of the US. Al-though these oils are appealing as refinery feedstocks due to their availability and low cost, processing can be more difficult.
The quality of the shale oils is highly variable. These oils can be high in solids with high melting point waxes. The light paraf-finic nature of shale oils can lead to asphaltene destabilization when blended with heavier crudes. These compositional fac-tors have resulted in cold preheat train fouling, desalter upsets, and fouling of hot preheat exchangers and furnaces. Problems in transportation and storage, finished-product quality, as well as refinery corrosion, have also been reported. Operational issues have led to cases of reduced throughput and crude unit shut-downs. The problems encountered with shale oil processing and possible prediction and control strategies will be presented.
NEW RESOURCESThe production of shale gas and oils has increased rapidly due
to significant advancements in drilling technology and hydrau-lic fracturing. Coupling chemical treatments to the mechanical drilling capabilities has enabled increased production efficiency.
In September 2012, shale oil production was reported to be nearly 1 million bpd (1 MMbpd). The most prolific production locations are in North Dakota (Bakken), Texas (Eagle Ford), Ohio, Pennsylvania (Marcellus and Utica), Colorado, Kansas, Nebraska and Wyoming (Niobrara). Other locations identified for probable shale oil production are in New Mexico, Oklaho-ma and Utah. By 2020, production will be at least 10 MMbpd, based on expanded drilling activity, as shown in FIG. 1.1 The predictions are largely dependent on the volatility of oil prices, technical advancements, capital expenditure, infrastructure needs, and challenges associated with the processing of these abundant resources.
The properties of shale oils are significantly different than typical crude oils. As a result, a series of challenges needs to be solved to ensure uninterrupted transportation and refining of shale oils. The main challenges encountered with these feed streams will be discussed, including issues in storage, transpor-tation, refining and finished fuel quality.
PHYSICAL AND CHEMICAL CHARACTERISTICSUnlike most crude oils, shale oils are light, sweet oils, with
a high paraffinic content and low acidity. They also have mini-mal asphaltenic content phase and varying contents of filter-able solids, hydrogen sulfide (H2S) and mercaptans. TABLE 1 is
a comparison of the oil characteristics typical for shale oil, and it includes data for Eagle Ford and Bakken shale oils.2 There are significant differences in the sulfur content and the filterable solids loading. In addition, the streams from a shale oil produc-tion region can have significant variability, as shown in FIG. 2.These were shale oil samples from one field, with colors ranging from pale amber to black.
Solids loading of samples from a single producing region can be highly variable and associated with the stage of fracturing and production from which the oil is produced. TABLE 2 shows typical analytical results on the three shale oil samples from FIG. 1. Filterable solids ranged from 176 pounds per thousand barrels (PTB) to 295 PTB.
Paraffin. The paraffin content of shale oil is one of the main properties that contributes to downstream problems from trans-portation and storage to refinery processing. Analyses of one batch of shale oil revealed paraffin chains containing well over 50
TABLE 1. Eagle Ford and Bakken shale oil property comparison
Parameter Eagle Ford Bakken
API 52 40.8
TAN, g KOH/g < 0.05 0.09
Sulfur, wt% < 0.2 0.304
Asphaltene, wt% 0.1 0.41
Resin, wt% 1.6 4.95
Filterable solids, PTB 225 76
0
2
4
6
US oi
l pro
ducti
on, M
Mbpd
1980
1984
1988 1992
1996
2000
2004
2008 2012
2016
2020
2024
2028
2032
8
10
12
Shale oilNGLsCrude oil with shale oil
FIG. 1. Forecast prediction of US oil production. Source: EIA.

52�JULY 2013 | HydrocarbonProcessing.com
Refinery of the Future
carbons. Similar paraffin analyses have been observed from mul-tiple shale oils. To understand fouling due to wax deposition, a carbon-chain profile analysis should be performed to document the molecular-weight distribution (MWD) and the melting points of the waxes in the system. FIG. 3 illustrates the character-ization of waxes from Eagle Ford and Bakken oil samples. Some samples of Eagle Ford shale oil contain over 70 carbon paraffins.
Due to their paraffinic nature, mixing shale oil with as-phaltenic oil leads to destabilization of the asphaltene cores. Asphaltenes are polar compounds that influence emulsion sta-bility. Once the asphaltenes destabilize, they can agglomerate, leading to larger macro-molecules. On hot surfaces, agglomer-ated asphaltenes easily crack or dehydrogenate and gradually form coke-like deposits.
Several shale oil production locations have high H2S load-ing. To ensure worker safety, scavengers are often used to reduce H2S concentrations. The scavengers are often amine-based products —methyl triazine, for instance—that are converted into mono-ethanolamine (MEA) in the crude distillation unit (CDU). Unfortunately, these amines contribute to corrosion problems in the CDU. Once MEA forms, it rapidly reacts with chlorine to form chloride salts. These salts lose solubility in the hydrocarbon phase and become solids at the processing tem-peratures of the atmospheric CD towers and form deposits on the trays or overhead system. The deposits are hygroscopic, and, once water is absorbed, the deposits become very corro-sive. These physical properties are responsible for the problems that are being experienced by refineries handling shale oils.
Extraction and production. The challenges associated with the production of shale oils are a function of their composition-al complexities and the varied geological formations where they are found. These oils are light, but they are very waxy and reside in oil-wet formations. These properties create some of the main difficulties associated with shale oil extraction. Such problems include scale formation, salt deposition, paraffin wax deposits, destabilized asphaltenes, corrosion and bacteria growth. Multi-component chemical additives are added to the stimulation fluid to control these problems.
Shale oils are characterized by low-asphaltenic content, low-sulfur content and a significant MWD of the paraffinic wax content. Paraffin carbon chains of C10 to C60 have been found, with some shale oils containing carbon chains up to C72. To control deposition and plugging in formations due to paraffins, the dispersants are commonly used. In upstream applications, these paraffin dispersants are applied as part of multifunctional additive packages where asphaltene stability and corrosion con-trol are also addressed simultaneously.
Scale deposits of calcite, carbonates and silicates must be controlled during production or plugging problems arise. A wide range of scale additives is available. These additives can be highly effective when selected appropriately. Depending on the nature of the well and the operational conditions, a specific chemistry is recommended or blends of products are used to address scale deposition.
Storage and transportation. Another challenge encoun-tered with shale oil is the transportation infrastructure. Rapid distribution of shale oils to the refineries is necessary to main-tain consistent plant throughput. Some pipelines are in use, and additional pipelines are being constructed to provide consistent supply. During the interim, barges and railcars are being used, along with a significant expansion in trucking to bring the vari-ous shale oils to the refineries. Eagle Ford production is esti-mated to increase by a factor of 6—from 350,000 bpd to nearly 2 MMbpd by 2017; more reliable infrastructures are needed to distribute this oil to multiple locations. Similar expansion is es-timated for Bakken and other shale oil production fields.
The paraffin content of the shale oils is impacting all trans-portation systems. Wax deposits have been found to coat the walls of railroad tank cars, barges and trucks. Waxy deposits in pipelines regularly require pigging to maintain full throughput. Bakken shale oil is typically transported in railcar, although
TABLE 2. Physical properties of Eagle Ford shale oil samples
Parameter Yellow Red Black
API 55 44.6 52.3
TAN, g KOH/g < 0.05 0.07 < 0.05
Sulfur, wt% < 0.2 < 0.2 < 0.2
Na, ppm 1 1.6 1.6
K, ppm 0.3 0.4 0.5
Mg, ppm 3.4 2.9 3
Ca, ppm 2.6 2.8 3.8
Asphaltenes, wt% 0 0 0.1
Resin, wt% 0.5 3.2 1.6
Filterable solids, PTB 176 295 225
FIG. 2. Color variation of Eagle Ford shale oil.
0
1
2
3
4
5
6
7
Para
ffin d
istrib
ution
, % m
ass
C8 C12 C16 C20 C24Carbon chain length
BakkenEagle Ford
C28 C32 C36 C40
FIG. 3. Paraffin chain distribution for Bakken and Eagle Ford shale oils.

Hydrocarbon Processing | JULY 2013 53
Refinery of the Future
pipeline expansion projects are in progress to accommodate the long-term need. These railcars require regular steaming and cleaning for reuse. Similar deposits are being encountered in trucks being used for shale oil transportation. The wax de-posits also create problems in transferring the shale oils to re-finery tankage. FIG. 4 shows samples of deposited wax collected from pigged pipelines in shale oil service.
Multiple chemical and mechanical solutions are used to mitigate these deposit problems. A combination of chemical-additive treatment solutions involving paraffin dispersants and flow drag-reducer technologies has proven to be effective in pipeline applications. Wax dispersants and wash solvents have been used to clean transportation tanks and refinery storage vessels. In the case of pipeline fouling management, a combina-tion of these technologies, coupled with frequent pigging, are the main means to mitigate wax deposition. Preventive foul-ing control programs have been developed to manage the wax deposition occurring in storage tanks. By injecting the proper chemical treatment to control wax buildup in storage tanks, the production field and refinery can handle and transfer larger quantities of oil without significant plugging issues.
One other problem encountered in storing and transporting shale oils is the concentrations of light ends that accumulate in the vapor spaces, requiring increased safety and relief systems. Shipping Bakken crude via barges was challenged by the in-creased levels of volatile organic compounds (VOCs). Vapor-control systems should be used to ensure a safe environment.
Due to the paraffinic nature of shale oils and their lack of heavy bottoms, most refineries mix crude oil with the shale oil. Unfortunately, the shale oils have low aromatic content, so mixing with conventional crude oil often leads to asphaltene destabilization. If blended oils are transported, the deposits can consist of waxes and precipitated asphaltenes. Dispersants specifically designed for both hydrocarbon types can control deposit formation during transportation. Until a proper trans-portation infrastructure is built, significant variation of shale oil shipments and potential for contamination are still possible. Refineries are already experiencing the impact of the quality variation of shale oil feeds, and of processing challenges.
REFINERY IMPACTSDue to the variation in solids loading and their paraffinic
nature, processing shale oils in refinery operations offers sev-eral challenges. Problems can be found from the tank farm to the desalter, preheat exchangers and furnace, and increased corrosion in the CDU. In the refinery tank farm, entrained solids can agglomerate and rapidly settle, adding to the sludge layer in the tank bottoms. Waxes crystalize and settle or coat the tank walls, thus reducing storage capacity. Waxes will sta-bilize emulsions and suspend solids in the storage tanks, lead-ing to slugs of sludge entering the CDU. Waxes will also coat the transfer piping, resulting in increased pressure drop and hydraulic restrictions.
Mixing asphaltenic crude with paraffinic shale oils leads to asphaltene destabilization that contributes to stable emulsions and sludge formation. To control these problems, wax-crystal modifiers or paraffin dispersants can be applied successfully. Wax-crystal modifiers must be added when the shale oil is still hot from the formation. When the paraffins begin to leave the
liquid phase, wax modifiers are ineffective, and paraffin disper-sants are required to control deposition.
Desalter operations may suffer from issues related to the shale oil properties. Solids loading can be highly variable, lead-ing to large shifts in solids removal performance. Sludge layers from the tank farm may cause severe upsets, including growth of stable emulsion bands and intermittent increases of oil in the brine water. Agglomerated asphaltenes can enter from storage tanks or can flocculate in the desalter rag layer, leading to oil slugs in the effluent brine.
Solutions include using tank farm additives to control the formation of sludge layers, along with specially designed as-phaltene dispersants and aggressive desalter treatments to ensure optimum operation. Pretreatment, coupled with high-performance desalter programs, have provided the best over-all desalter performance and desalted crude quality; multiple treatment options for both areas can ensure maximum perfor-mance. FIG. 5 is an example of applying a tank pretreatment. A crude-oil tank treatment program was initiated that broke waxy emulsions in tankage, enabling improved water resolution of the raw crude oil and minimizing sludge and solids entering the desalter. This program provided significant improvement of solids released into the desalter brine water compared to previous operations. Prior to initiating the pretreatment pro-gram, solids in the brine averaged 29 PTB, and the emulsion band control was sporadic. After the tank pretreatment pro-gram started, the desalter emulsion band could be controlled with the emulsion breaker program, and solids removal to the brine water increased by a factor of 8 to an average of 218 PTB.
FIG. 4. Waxy deposits removed from shale oil pipelines.
Two months operation
Brine
wate
r filte
rable
solid
s, PT
B
High-water level
Average 217.9 PTBAverage 28.6 PTB
Mudwashoff
0
100
200
300
400
500
FIG. 5. Tank pretreatment impact on desalter filterable solids.

54�JULY 2013 | HydrocarbonProcessing.com
Refinery of the Future
Preheat exchanger fouling has been observed in the cold train before the desalters and in the hot train after the desalt-ers. Cold train fouling results from the deposition of insoluble
paraffinic hydrocarbons, coupled with agglomerated inorganic solids. Solutions to cold train exchanger fouling include the ad-dition of wax dispersants and other oil management best prac-tices to ensure consistent solids loading with minimum sludge processing.a Crude oil management can include additives to stabilize asphaltenes and surfactants that resolve emulsions and improve water separation.a These practices also include proactive asphaltene stability testing to ensure that the crude blends to be processed retain an acceptable compatibility level.
Hot train fouling occurs from destabilized asphaltenes that agglomerate and form deposits. These materials entrain in-
organics, such as iron sulfide and sediments from production formations, into the deposit matrix. Some deposits, including high molecular-weight paraffins, become complex with the as-
phaltene aggregates. Mixing shale oils with asphaltenic crude oils results in rapid asphaltene agglomeration. Rapid hot train exchanger fouling has been seen in units running crude blends with asphaltene concen-trations of 1% or less. TABLE 3 shows the analysis from a hot exchanger deposit that had to be shut down for cleaning after only a short time online. This hydrogen-to-carbon ratio is consistent with asphaltenic deposits.
Feed analyses of the shale oil and crude blend being processed revealed poor stability of the asphaltenes. Asphaltene stability tests are used to measure the ability of a crude oil blend to hold asphaltenes in solu-tion.3, a The method utilizes light scattering, coupled with automatic titration, to force asphaltene destabi-lization and agglomeration.
As titration begins, the oil becomes less opaque and the light intensity increases. When the destabilization point is reached and the asphaltenes rapidly agglomerate and floccu-late, the fluid opacity suddenly increases. Inflection points on the curve show where asphaltenes become unstable: farther to the right indicates higher stability asphaltenes, while inflection points farther to the left suggest unstable asphaltenes. FIG. 6shows asphaltene stability results for several crude blends, along with a test on Eagle Ford shale oil. An inflection point was not achieved for the shale oil because it has no asphaltenes to floc-culate. Typical crude oils are shown, with asphaltene stability index (ASI) results around 120. When the shale oil was blended with the typical crude oils at a ratio of 80/20, the measured as-phaltene stability result was less than 30, indicating rapid and uncontrollable destabilization of the asphaltenes.
If the asphaltenes in the crude blend were not being rap-idly destabilized, the asphaltene stability would have been well above 120. This data shows that mixing certain crude oils with shale oil can result in rapid asphaltene deposition. New tech-nology can provide the capability to rapidly perform asphaltene stability measurements onsite with a high degree of accuracy.4, a
Hot-train exchanger fouling can be controlled through an-tifoulant additives designed to control the agglomeration and deposition of asphaltenes and entrained inorganic solids. An-other fouling control strategy is to do regular analysis of the stability of the asphaltenes in the crude oil blend under consid-eration for processing. This information can guide operations to minimize fouling problems.
CDU atmospheric furnace fouling has also been observed at several refineries processing shale oils, especially those pro-cessing a blend of asphaltenic crude and shale oils. In some cases, the fouling rate was so severe that the crude unit had to be shut down for furnace pigging. CDU furnace operations with conventional crude oils experience little to no fouling, and these furnaces can easily run for 5 to 6 years between turn-arounds. FIG. 7 shows the rate of fouling in a unit processing a mixture of shale oil with crude vs. the rate of fouling with more typical crude feeds.
Depending on the asphaltene stability of the shale oil/crude oil blend, the furnace skin temperatures can climb by 0.5°F/day to 2°F/day vs. more typical operations of 0.1°F or less. To
ASI
Shale oilCrude for blendingShale blended with crude
Inten
sity
0
200
0 50 100 150 200 250
400
600
800
1,000
1,200
FIG. 6. Asphaltene stability index testing of shale oil and shale oil/crude blends.
Days online
Shale oil with crude oil operationTypical blended crude operation
Tube
-skin
tem
pera
ture,
°F
500
550
600
650
700
750
800
850
900
0 50 100 150 200 250
FIG. 7. Atmospheric furnace skin temperature trends.
Shale oils have changed the crude supply
in the US market. Many refineries are
taking steps to process these oils. Yet,
shale oils contribute to multiple problems
in transportation, storage and refining.
Wax deposits are problematic due to the
paraffinic nature of the shale oils, which
causes asphaltene destabilization.

Hydrocarbon Processing | JULY 2013 55
Refinery of the Future
control furnace fouling when processing shale oils blended with various crude oils, constant monitoring of the asphaltene destabilization potential is required. Setting a minimum limit on the ASI ensures that the majority of the asphaltenes stay in solution. This limit should be developed for each unit, based on correlations between the rate of furnace fouling being expe-rienced and the stability index. Using appropriate antifoulant additives can control agglomeration of asphaltenes and dis-perse offending materials into the bulk oil phase.
Shale oils often contain high concentrations of H2S that re-quire treatment with scavengers due to safety purposes. Amine-based scavengers often decompose as the crude oil is preheated through the hot preheat train and furnace, forming amine frag-ments. MEA, one of the most commonly used amines, readily forms an amine-chloride salt in the atmospheric tower. These salts deposit in the upper sections. Often, under-deposit cor-rosion is the major cause of failures in process systems because CDU tower under-salt corrosion rates can be 10 to 100 times faster than a general acidic attack. Mitigation strategies in-clude controlling chloride to minimize the chloride traffic in the tower top and overhead, increasing the overhead operating temperature so that the salts move further downstream in the overhead system, and acidifying the desalter brine water to in-crease removal of amines into the water phase.
Finished fuels. The quality of the finished fuels from refining shale oils has changed significantly. As the shale oils have higher light-ends content, one benefit is increased production of naph-tha for gasoline, and stable diesel and jet distillates. These in-creased volumes can boost refinery margins. However, due to the chemical nature of these shale oil feeds, several challenges can be encountered. The streams are more paraffinic—thus, they suffer from poor pour and cloud-point properties. In addi-tion, shale oils are lower in sulfur content, so the need for lubric-ity additives is anticipated. Effective additives can be used to improve all distillate stream properties. Conductivity can also be off-spec; a combination of lubricity/conductivity improvers can raise the quality of the distillate. To optimize chemical treat-ment program, testing on specific product streams is required and suitable product selection should be customized. TABLE 4 summarizes the main issues identified for different distillate cuts that a refiner can experience as well as chemical and me-chanical solutions that can mitigate these challenges.
Preparing to process shale oils. The risks that shale oils present can be successfully managed. The first step is to iden-tify the onset of all concerns. To be prepared for processing shale oils, monitoring protocols can provide advance warning of any negative aspects of shale oil processing and the impacts on product quality, thus enabling the refiner to take corrective measures early.
ACKNOWLEDGMENTThe article is a revised and updated version from an earlier presentation at the
American Fuel and Petrochemical Manufacturers (AFPM) Annual Meeting, March 17–19, 2013, at San Antonio, Texas.
The authors acknowledge the contributions from several colleagues in provid-ing information used in this article, including Dr. Larry Kremer, Thomas Falkler, Tomasa Ledesma, Molly Cooper, Waynn Morgan and the Finished Fuels group. The authors also thank Baker Hughes for allowing this article to be published.
NOTES a CRUDE OIL MANAGEMENT, ASIT and FIELD ASIT SERVICES are trade-
marks of Baker Hughes Incorporated.
LITERATURE CITED1 US Energy Information Administration, Shale Plays Report, May 9, 2011.2 Kremer, L., “Shale Oil and Solutions,” COQA Meeting, November 2012.3 Stark, J. L. and S. Asomaning, “Crude Oil Blending Effects on Asphaltene Stability
in Refinery Fouling,” Petroleum Science and Technology, Vol. 21, Nos. 3 & 4, 2003.4 Sandu, C. and T. Falkler, “New Field Tool Helps Refiners Detect Incompatible
Feedstocks, Prevent Operational Problems,” ERTC 2012.
BRUCE WRIGHT, a Baker Hughes senior technical support engineer for downstream chemicals, is based in Sugar Land, Texas, and specializes in the hydrocarbon processing industries. With more than 30 years of industry experience, he is involved in technical support and troubleshooting of refinery fouling problems. Mr. Wright has experience as a product development research scientist and also in environmental, health and safety compliance. He is an inventor or co-inventor on eight US patents and has published nine technical papers. Mr. Wright is a 1977 graduate of the Rensselaer Polytechnic Institute with a BS degree in chemical engineering. He also holds an MBA degree from the University of Houston. Mr. Wright is a registered professional engineer in the state of Texas, and is a member of the American Institute of Chemical Engineers.
DR. CORINA SANDU, a Baker Hughes R&D manager for downstream chemicals, is responsible for leading a team of scientists who are researching and developing upgraded and novel technologies to increase refinery industry processing performance. She is located in Sugar Land, Texas. Dr. Sandu holds a PhD in materials chemistry from the University of Houston, and a post-doctorate from Rice University. She is a member of the American Chemical Society and the Society of Petroleum Engineers. Dr. Sandu has authored and co-authored 24 publications in peer-reviewed journals and holds five patents.
TABLE 4. Possible problems and solutions for fi nished fuels from shale-oil processing
Distillate Challenge Solutions
Light ends (C3–C4) Copper strip corrosion Corrosion inhibitors
Naphtha Water shedding, corrosion
Corrosion inhibitors, microbial control
Jet fuel Lubricity, conductivity, water shedding, stability
Various lubricity additives, fi ltration devices, dry solid systems, microbial control
Diesel Lubricity, conductivity, stability, water shedding
Various lubricity additives, de-hazers, microbial control
Residual fuel oil Asphaltene instability, gum deposits
Blending and compatibility monitoring
Asphaltene stabilizers
Paraffi n dispersants
TABLE 3. Hot train exchanger deposit analyses of shale oil with asphaltenic crudes in wt%
Sample C H N O Cl Fe S
H/C atomic
ratio Ash Summary
Exchanger 1-crude side
82 8 1 2 1 6 1.16 1 Asphaltenes
Exchanger 2-crude side
78 7 1 4 1 1 8 1.07 3 Asphaltenes
Exchanger 3-crude side
81 8 1 2 1 7 1.18 3 Asphaltenes

Burn it and go for the SNOXTM solution
- no use of limestone - no gypsum residue - no water consumption - significant cost savings - improved energy efficiency - low maintenance costs - environmentally compliant - reduced CO2 footprint
Contact us to learn more about how Topsøe’s SNOXTM technology can benefit your business
WWW.TOPSOE.COM
Stuck with heavy fuel oil?
Select 103 at www.HydrocarbonProcessing.com/RS

Hydrocarbon Processing | JULY 2013 57
Special Report Refinery of the Future S. BENNETT, AVEVA Solutions Ltd., Cambridge, UK
Use 3D visualization to improve refinery engineering and design
One of the most significant outcomes of rapidly increasing computing power has been in three-dimensional (3D) visualiza-tion; oil discovery makes extensive use of it, for example. To a professional respon-sible for the safe and efficient operation of an oil and gas facility, today’s immersive 3D computer games might seem like only a form of engaging relaxation. However, the world is changing. The visualization technologies pioneered for the games in-dustry will play important roles in the life-cycles of tomorrow’s capital assets.
Technology involving 3D visualiza-tion has long been essential to the work of the engineering designer, but lush vi-sual rendering has historically been sac-rificed for more immediately productive uses of available processing power, such as responsiveness and sophisticated clash detection. However, to overlook the po-tential of realistic 3D representation is to miss an opportunity to increase design productivity and quality.
Recent research has shown that only a limited set of visual cues is necessary to create a convincing representation of reali-ty. These cues can be incorporated into de-sign solutions, providing designers with a highly intuitive visualization that does not have an adverse impact on system perfor-mance. Interactive controls enable a user to adjust three rendering elements: edge definition, highlighting and shadowing. The result is surprising: As the settings are adjusted, simple geometric shapes quickly assume convincing, solid forms and un-ambiguous positions in the virtual plant.
The result is a new level of intuitive interaction with the design model. As a designer moves an object, the subtle cues of shadows and highlights make its actual 3D location more obvious. The result is a small but valuable improvement in the time and effort required to position an ob-
ject or to route a pipe. Aggregate this across the many individual positioning opera-tions performed every day during design development, and the result is significant. Design productivity increases, saving time and effort through quicker, more accurate positioning and less repositioning. Soft clashes—those between collision spaces around objects—can be avoided almost unconsciously, as shadows indicate prox-imity between the objects (FIG. 1).
Upgrading assets. New design has im-proved with advances in 3D modeling technology, but can the same approach help with brownfield projects? Here, the challenge has always been in the limita-tions of available surveying methods. However, rapid advances in 3D laser scanning systems have not only overcome this, but have also unlocked a new level of capability in upgrading and revamping older facilities.
Among recent advances, 3D scanning captures far more detail at greater accura-
cy than any other method. Today’s scan-ners generate accurate, photorealistic 3D representations of an in-service facility, and they can do so quickly and without disruption to normal operations (FIG. 2). Additionally, they are becoming increas-ingly affordable, compact and easy to use.
Software advances have brought ways to exploit the value of the rich data gen-erated. Initially, relatively sparse “point-cloud” 3D representations of the as-op-erating plant could be referenced within a design system, enabling new design to be aligned accurately with existing construc-tion. This offered considerable advan-tages for revamp projects, as new design could be created and fabricated in the confidence that it would fit correctly the first time, during onsite installation.
New design has been taken further in the latest software releases. These can combine both design models and laser-scan models in the same 3D environment (FIG. 3). The improved design visualiza-tion described above is matched by high-
FIG. 1. A new level of intuitive interaction with the visually realistic design model makes the avoidance of clashes easier, saving valuable design time.

58�JULY 2013 | HydrocarbonProcessing.com
Refinery of the Future
definition laser-scan data, so that the designer can work intuitively with both types of information. Now, for the first time, the real and the virtual worlds can be integrated in a common environment.
This integration brings important benefits. One is the ability to efficiently reverse-engineer existing plant construc-
tion. Software now enables, for example, a cylindrical array of 3D scan data points to be recognized as representing a pipe run. By comparing its diameter with available pipes in the system catalogue, it then of-fers the designer a shortlist of candidate pipe specifications. The correct specifi-cation is determined from the piping and
instrumentation diagram (P&ID) and se-lected from the shortlist, whereupon the software creates a native, intelligent pipe object accurately coaligned with its scan representation. Current capabilities cover pipes, nozzles and steel beams, increasing productivity on some of the most repeti-tive aspects of reverse engineering.
The lean revolution. The most far-reach-ing benefit of integrating as-designed and as-built elements lies in the enabling of “lean construction” methodologies. Lean has long been a discussion topic in the plant industries, but until now they have lacked the key to unlock it. By exploiting the ease and affordability of laser scan-ning at every stage in the fabrication and construction sequence, and by integrating the data with the as-designed model, the feedback loop between design, fabrication and construction can be closed.
In one-off capital projects, if a costly item is made incorrectly, the program im-pact can be considerable. But if the devia-tion can be identified immediately and in detail, an informed decision can be made to mitigate its impact and protect the pro-gram. For example, consider a project that requires a concrete base with a number of mounting points for key modules. The concrete is poured, but only when the modules are being installed is it discov-ered that some mounting positions are in-correct. Crisis management ensues, with inevitable cost and schedule overruns.
It is, of course, possible to survey the foundation as soon as the concrete is ad-equately cured for walking. An accurate, photorealistic 3D scan can be immediately sent to the design office, loaded into the design system and quickly compared with the design model. Immediate, informed action can be taken to recover the situation and protect the project schedule. This ac-tion might, for example, involve rerouting pipes or access structures, or authorizing a design modification to the affected plant modules while they are still in fabrication.
Into operations. Plant operators have long regarded 3D as a tool exclusive to de-signers. However, the industry is now rap-idly coming to recognize the considerable value of 3D visualization when applied to plant operations. With realistic, immer-sive visualization of complex engineering assets, one can learn by doing in a safe en-vironment, just as in a flight simulator.
FIG. 3. New software releases can combine design models and laser-scan models in the same 3D environment.
FIG. 2. Today’s laser scanners can generate accurate, photorealistic 3D representations of an in-service facility.

Hydrocarbon Processing | JULY 2013 59
Refinery of the Future
Staff training and procedure planning are obvious applications for this technol-ogy. People learn most effectively by do-ing, and they understand most easily by seeing. Three-dimensional visualization can be used by new recruits for facility familiarization, in preparation for visits to remote facilities or for updating skills and procedures following plant modifications (FIG. 4). It can cover training in opera-tions or safety procedures, such as testing the most complex “what-if ” emergency-response scenarios or collaborative plan-ning between multi-site teams.
These examples are obvious applica-tions of 3D technology. However, there are even more powerful ways to use 3D. State-of-the-art information manage-ment technologies enable 3D data—whether a CAD model, a laser-scan rep-resentation or both—to be integrated and cross-referenced with every other type of engineering or operational data. This enables 3D views to be combined with other information. For example, if a leaking valve is reported, an engineer can quickly locate it in the 3D view, and then view or navigate to its related informa-tion, such as its location on the P&ID, its full specification, maintenance history, spares availability, etc. (FIG. 5).
Maintenance management is made easier with applications that show the physical locations of current and planned work orders on a 3D representation of the facility. This is a powerful tool for avoid-ing potential clashes between apparently unrelated tasks.
The ability to apply color-coding to objects in the 3D model view can also be exploited for purposes such as risk-based inspection (RBI) planning. By color-coding the various lines according to, for example, fluid carried or operating temperature, it becomes possible to do a virtual walk-down to trace the route of a particular line, checking its proximity to adjacent objects. This process can be per-formed in locations that would be inac-cessible at the physical plant.
3D from start to finish. To summa-rize, 3D is entering a new era. Simplified representations of design objects are be-ing replaced with realistic renderings that are intuitive and easy to manipulate. Also, 3D has moved out of the design office to bring its power to every aspect of asset lifecycle management.
Combining more powerful design functionalities with the ability to accu-rately capture the as-built asset and asso-ciate both types of information with every other type is transforming the way plants are created, operated and maintained. The digital 3D counterparts of tomor-row’s plants will be essential to their effi-cient design, construction and operation.
Additionally, it is now practicable to bring yesterday’s plants into the digital world of 3D models and integrated infor-mation, to enable their continuing safe
and efficient operation, upgrade and life-cycle management.
SIMON BENNETT is a senior product business manager for AVEVA. With a background in civil engineering, he has over 10 years of experience as a software product manager, having worked for a number of commercial off-the-shelf and enterprise software companies. Mr. Bennett joined AVEVA in 2008, where his product-management experience allowed him to play an important role in organizing the AVEVA NET family of products. More recently, he was responsible for launching AVEVA’s new plant design product, AVEVA Everything3D, and is currently driving AVEVA’s “Future of Plant Design” marketing initiative.
FIG. 4. 3D visualization can be used for facility familiarization, in preparation for visits to remote facilities or for updating skills and procedures.
FIG. 5. State-of-the-art information management technologies enable 3D data to be integrated and cross-referenced with engineering or operational data.

Even the most seasoned refi nery managers may see four to fi ve FCCU revamps throughout their career. AltairStrickland’s managers and craftsmen have performed, on average, four to fi ve FCCU revamps per year since 1976. This experience is the kind of advantage you need to help you manage and execute a successful project.
We address constructability issues early on through pre-planning, computer imaging, 3-D surveys and AutoCAD®
models. Then, unlike most mechanical contractors, we often construct life-size wooden mock-ups of various sections to make sure a human, with tools, can access and work effectively and safely in tightly confi ned spaces.
Our crews, from craft to top management, have worked on so many turnarounds and revamps that
they can identify and quickly correct a problem, and work around a snag or lagging schedule.
We also don’t choose between quality and safety. We think our clients should have the best of both.
Our safety record is amazing. We just completed a 1,317,269-work-hour job for a client with zero BLS/
OSHA recordable injuries. Zero injury is our goal on every project we do. Our quality is evident during start-up. Our level of productivity is evident when you look at the project’s fi nal time/cost.
If there’s an FCCU revamp in your future, make the process as pain free as possible by putting the best hands in the business to work for you.
Want hands-on experience?We’ve got it – HANDS DOWN.
1605 S. Battleground Road | La Porte, TX 77571 | 281-478-6200 | 1-800-478-6206Visit our newly updated website at www.altairstrickland.com
Select 75 at www.HydrocarbonProcessing.com/RS

Hydrocarbon Processing | JULY 2013 61
Special Report Refinery of the Future J. ZURLO, GE Water & Process Technologies,
The Woodlands, Texas
Optimize amine units and improve refinery profitability
The alkanolamine system in a refinery, better known as the amine unit, is used to remove hydrogen sulfide (H2S), carbon dioxide (CO2) and mercaptans (collectively referred to as acid gases) from process gas and liquid hydrocarbon streams. Amine units are an essential part of the refinery operation to maintain product quality and environmental compliance. Their impor-tance is increasing as refinery feeds become more sour and refinery product sulfur limits are lowered. A poorly operated amine unit can result in high amine losses, poor unit reliability, amine solution contamination, off-specification products, op-erating headaches and increased operating costs to the refinery.
Despite their importance, amine unit operations are often not well understood or operated optimally. This is likely due to several factors, including:
• Amine units enable a refinery to make a profit, but do not directly produce a profitable product
• The various parts of an amine unit are typically spread out across different operating units: lean amine solvent is typi-cally pumped to absorber towers in the process units contain-ing the production fluids, then rich amine is pumped back to the stripper tower for acid gas removal, so control of the entire circuit is not straightforward
• Many refinery amine units are operated well beyond their original design capacities
• Amine systems are often robust enough to maintain refin-ery product quality, even when operating far from either origi-nal design or best operating practices.
Conversely, there are many benefits that can be realized by improving amine unit operations, such as: more consistent product quality, resulting in reduced frequency of event-driven activities to blend off or re-treat episodic off-spec products; low-er energy costs; reduced costs for filters, activated carbon and re-placement amine; improved reliability, which lowers equipment replacement/repair costs; and improved operation of the sulfur plant by providing a more consistent feed quality to this unit.
Solomon Associates recently wrote that the world’s top per-forming refineries, as measured by their semi-annual bench-mark studies, consistently perform above average in several key categories, including: operational availability, maintenance cost efficiency index, energy intensity index and return on invest-ment.1 Improving operation of the amine unit can help to im-prove each of these factors.
Although there are differences in the configuration, de-mands and operation of almost every amine system in a refin-
ery, a consistent approach can be applied to these systems to improve operations and performance. The main factors to im-proving amine system performance include:
1. Define the operating conditions that are optimal for the refinery and amine unit configurations as well as the needs for acid gas removal
2. Establish an amine management program to assess cur-rent conditions and identify improvement opportunities in both operations and amine conditions
3. Identify and implement any changes to the mechanical, operational or chemical configuration that would provide sig-nificant improvement to operations.
Best practice operating conditions. Amine treatment units are fairly robust in nature and can still perform adequately when operated a fair margin from design conditions. However, amine operation often deviates significantly from optimum. Initiating relatively small operating changes to move back toward opti-mum operation can result in significant cost savings without any sacrifice in performance. An example is that many amine units operate at a higher circulation rate than needed to meet product specifications. This may be to maintain a high safety margin or in response to a transient upset condition where oper-ations have not been returned to normal settings. High circula-tion rates use more energy to pump the amine solution; require more steam energy in the stripper to heat more amine; and in-crease tower liquid velocities, which increases foaming tenden-cy and amine loss through higher entrainment rates. TABLE 1outlines several key operating guidelines by unit equipment type to help maintain optimum operation.
Amine management program. Another key aspect of suc-cessfully operating an amine unit for optimal performance is a good amine management program. This involves monitoring the condition of the amine solution and managing the feed qual-ity, operating conditions and the amine solvent itself to avoid issues associated with highly contaminated or degraded amine.
An effective amine management program requires frequent inspection and analysis of the amine solution at regular inter-vals. This starts with a simple observation of the lean amine sol-vent itself. The circulating solvent should be clear, bright and free of visible solids. FIG. 1 shows samples from three different amine systems and highlights the range of visual condition in amine solvent. One can easily envision how the unit using the

62�JULY 2013 | HydrocarbonProcessing.com
Refinery of the Future
TABLE 1. Key operating guidelines by unit equipment type to help maintain optimum operation
Unit/Parameter
Consequence if:
Too low/Erratic Too high/Building
Gas absorber towers
Inlet temperature—product or amine Foaming Low acid gas absorption
Rich amine loading Corrosion risk—high amine circulation rates Corrosion in hot rich section
Liquid / vapor velocities Channeling—low acid gas absorption Amine loss—entrainment
Tower pressure Foaming/low acid gas absorption Fouling
Bottoms level Foaming Fouling
Defoamer injection rate N/A Fouling, foaming, amine degradation, reduced carbon bed life (product type dependent)
Liquid absorber towers
Inlet temperature—product or amine Emulsion control issues Low acid gas absorption
Rich amine loading Corrosion risk—high amine circulation rates Corrosion in hot rich section
Liquid/vapor velocities Channeling—low acid gas absorption Amine loss—entrainment
Amine/product interface level Low contact time—low acid gas absorption Amine loss—entrainment
Tower Pressure Low acid gas absorption Fouling
Amine stripper (Regenerator)
Reboiler heat fl ux High lean amine loading—insuffi cient acid gas stripping
Fouling, amine degradation, corrosion risk
Refl ux ratio High amine loss High lean amine loading—insuffi cient acid gas stripping, increased energy demand
Tower pressure Foaming Fouling, high lean amine loading—insuffi cient acid gas stripping
Bottoms level Foaming Fouling
Defoamer injection rate N/A Fouling, foaming, amine degradation, reduced carbon bed life (product type dependent)
Refl ux water ammonium bisulfi de concentration
N/A Corrosion potential, fouling potential
Rich amine fl ash drum/separators
Oil skimming rate Fouling/foaming High amine loss—uncontrolled amine solvent bleed, high nitrogen to waste treatment plant
Residence time Fouling/foaming—poor hydrocarbon removal, separation chemical treatment required
Flash gas rate Corrosion potential—hot rich section High amine loss, fl are gas/downstream issues
Solvent fi ltration
Filter element micron rating Operating cost increase—high fi lter change frequency Fouling—insuffi cient particulate removal
Carbon bed life Amine degradation, feed contaminants high, increased fouling potential
N/A
Lean amine fi lter bypass loop fl owrate
Insuffi cient particulate removal Operating cost increase—high fi lter change frequency, low carbon bed effi ciency
Amine solvent
Heat stable amine salts (HSAS) concentration
N/A Corrosion potential, fouling potential, insuffi cient acid gas absorption
Heat stable salts concentration High amine loss—high purge/makeup of fresh solvent
Corrosion potential, fouling potential, Insuffi cient acid gas absorption
HSAS neutralization rate/frequency N/A Corrosion potential, fouling potential
Amine concentration Insuffi cient acid gas absorption, high energy costs—increased stripping requirements
Increased corrosion—high rich amine loading, foaming/emulsion
Corrosion monitoring Uncontrolled corrosion—not caught until unit operations are aff ected
N/A

Hydrocarbon Processing | JULY 2013 63
Refinery of the Future
solvent on the right will have more operating issues than the unit using the solvent on the left. Please note also that rectify-ing an amine unit whose solvent condition has degraded to the state of the solvent on the right can take several weeks of active management to bring the unit back to best practice conditions. It pays to identify and correct issues with amine solvent condition early, and to act aggressively.
In addition to visual observation, a “foam shake” test should be performed daily on the unit. This test involves partially filling a clear jar or bottle with cool lean amine, shaking vigorously for several seconds, and then observing the foam height above the liquid and the time it takes for the foam to dissipate (known as the break time). An amine solvent in good condi-tion can form a foam layer, but this foam should dis-sipate in a few seconds. Longer break times indicate that the amine solution is starting to accumulate contaminants that can cause operating issues such as high amine losses from foaming, trouble meeting treated fluid specifications, and re-duction in amine unit treating capacity.
Other daily monitoring should include amine concentra-tion, lean and rich amine loading and ammonium bisulfide concentration in the reflux drum of the amine stripper.
On a monthly basis (or quarterly for units that do not show high stress), the lean amine should be analyzed for sol-ids, metals and acid contamination levels.
In addition to monitoring the solvent itself, monitoring the equipment associated with handling amine contamination should be monitored and conditions recorded. Carbon filter bed life, filter change frequency, skim rate on the rich flash drum/three-phase separator and knockout drum liquid accu-mulation rates should be tracked to detect signs of increased contamination and/or amine degradation.
Finally, routine monitoring is essential for early detection of corrosion potential in the amine unit. Regular results from corrosion detection devices can show when and where corro-sion is taking place and allow for a targeted action plan to cor-rect the problem prior to equipment failure and/or premature unit outage due to reliability issues.
Optimization case history. A refinery on the US Gulf Coast was experiencing several issues in its amine unit operation. These included:
• Excessive foaming in the contactor towers• Rapid fouling in the lean/rich heat exchangers• Upsets to the fluid catalytic cracking unit (FCCU) op-
eration related to emulsion issues in the liquid contactor• Lean and rich filters that were being changed four to six
times per month due to rapid pressure drop increase• High steam usage.An assessment of the unit operations was made, and several
changes were recommended to improve operations, including changes to the operating conditions and treatment programs. The refinery has estimated that the performance improve-ments at the amine unit have resulted in operating cost savings of over $550,000 annually in energy, maintenance avoidance and material operating expenses.
Actions were taken in a stepwise approach, both to determine the system impact from the changes and to optimize operating
expenses. Although there were several areas that would benefit from improvement, an immediate issue that was addressed was the repeated upsets to the FCCU operation due to poor per-formance in the liquefied petroleum gas (LPG) liquid-liquid
amine contactor tower. Stable emulsions formed when the amine and LPG were mixed in the contactor tower caused high amine losses through carryover, loss of tower operating control and periods of LPG product not meeting H2S specification lim-its. An emulsion breaker designed specifically for liquid-liquid amine contactors was applied to the system, the stable emulsion was broken and LPG operations returned to normal. The ap-plication of this treatment was optimized over the next several months, while the next phase—changes to the operation of the amine system—was being implemented.
Amine circulation rates and changes to several of the con-tactor towers were modified to increase the concentration of
FIG. 1. Samples from three different amine systems.
0.000
Rich l
oad,
mol/
mol
0.100
0.200
0.300
0.400
0.500
0.600
0.700
2011–2012 data
FIG. 2. The rich loading was increased about 25% over the course of several months.
Routine monitoring is essential for early
detection of corrosion potential in the
amine unit. Corrosion detection devices
can show where corrosion is taking place
and allow for a plan to correct the problem
prior to equipment failure.

Refinery of the Future
64
acid gas absorbed in the circulating amine solvent, known as rich loading. Increasing rich loading improves operating effi-ciency, but care must be taken to avoid an increase in corrosion in the hot rich amine section of the amine unit. As illustrated in FIG. 2, the rich loading was increased about 25% over the course of several months, from an average of 0.30 mol/mol to 0.38 mol/mol. Please note the slight gap in the chart data is due to a maintenance turnaround in March 2012.
Analysis of filter elements and deposits collected in the unit identified that corrosion byproducts, degraded amine and high silica in the amine unit were the main contributors to equipment fouling. Specifically impacted were the lean/rich heat exchanger,
the filter elements and the stripper tower reboiler, which led to high steam requirements to maintain stripper tower operation.
Further investigation showed that this refiner was using a silicone-based defoamer to combat the frequent foaming events in the contactor towers. While this type of product can be ef-fective, overuse can result in foam stabilization and contribute to system fouling. This defoamer was replaced with a non-sili-cone product to address the negative effects of high defoamer demand while the root cause, system corrosion, was addressed.
A short maintenance outage was taken to clean the heat ex-change equipment in the amine unit and to prepare the unit for application of an amine system corrosion inhibitor. Perfor-mance of the system was assessed after the outage, and it was determined that steam use in the stripper reboiler was reduced by about 27% (FIG. 3). Improving corrosion control in the sys-tem allowed the gains realized from cleaning to be maintained.
Reducing system corrosion has also had the benefit of signifi-cantly reducing filter change frequency, from four to six times per month to once per month (FIG. 4). Each rapid drop in pressure represents a filter change. Filter change frequency is now being held at once per month by procedure, not by pressure drop limi-tation. This is illustrated by noting that the pressure spikes on the chart are much lower than in the past. The filter elements are being changed according to the calendar, not the pressure drop.
Improve reliability. Amine units are an essential unit opera-tion to maintain product specification and to safely handle the acid gases in the refinery operation. Attention to oper-ating parameters, amine system conditions and performance can minimize operating costs and improve refinery unit reli-ability and operations.
ACKNOWLEDGMENTSThe author would like to thank Michael Bloss, Patricio Ayala and Chad Ashman
for their contributions to this article.
LITERATURE CITED1 Proops, K., “World’s best refineries,” Fuel, March 2013.
JEFFREY A. ZURLO is a senior strategic projects manager for GE Water & Process Technologies. He has 22 years of experience in process engineering, refinery treatment sales and services, hydrocarbon product applications and technical support. Mr. Zurlo provides global technical support to the refining industry, with a principal focus on best practices and amine sweetening programs. He began his career with GE in 1997 and holds a BE degree in chemical engineering.
0
10
20
30
40
50
60
Steam
ratio
, lb/b
bl
2011–2012 data
FIG. 3. After the outage, steam use in the stripper reboiler was reduced by about 27%.
0
2
4
6
8
10
12
14
Lean
amine
filte
r �P,
psi
2011–2012 data
FIG. 4. Filter change frequency was reduced from four to six times per month to once per month.
In Memoriam: Mr. Biuk Sepehrar March 24, 1921 — May 10, 2013
We are sad to learn of the recent passing of Mr. Biuk Sepehrar, a former offi cial of the National Iranian Oil Company (NIOC) and the National Iranian Petrochemical Company (NPC). Mr. Sepehrar attended Abadan Technical Institute renamed Abadan Institute of Technology (AIT), in Abadan, Iran, graduating in 1946 and subsequently starting his services at the Abadan refi nery.
Mr. Sepehrar was assigned to complete the fi rst Abadan refi nery lube oil unit. This British-designed unit was left incomplete during the nationalization of the oil industry in Iran in 1951. The commissioning of this unit in 1952 was a source of great national pride and was considered a major milestone in the Iranian oil and petrochemical industry.
Sepehrar was assigned to Shiraz Petrochemical in 1962 to supervise the commissioning of the fi rst Iranian fertilizer complex. In 1964, he joined the project team of the Tehran refi nery and later as refi nery manager. This was the fi rst Iranian refi nery capitalized and built by the NIOC. Later, in 1972, Sepehrar became director of all new refi neries in the nation, with the exception of the Tehran refi nery.
In 1975, Mr. Sepehrar became the managing director of the Shahpur Chemical Company (renamed Razi Chemical Company after 1979), which, during the 1970s, was the largest petrochemical complex in the Eastern Hemisphere. After the 1979 Iranian Revolution, Mr. Sepehrar retired and left Iran. Subsequently, later he acted as senior consultant to new refi neries in Saudi Arabia and South Korea.
Biuk Sepehrar was one of the most highly qualifi ed, upright and well-disciplined professionals in the industry and a dedicated mentor to his employees, some of whom are presently working in oil, gas and petrochemical industries worldwide. Mr. Sepehrar is survived by his wife and highly educated children.
Mr. Sepehrar, we, your students, love you and promise to follow in your footsteps.
Select 155 at www.HydrocarbonProcessing.com/RS

The Best Compressor
for Hydrogen
Service
gasoline desulfurizationdiesel desulfurizationhydrotreating
steam methane reformerPSAdissociation process
Kobelco Screw CompressorsWith suction/discharge pressures up to 1500 psig (100 barg), Kobelco oil-injected screw compressors are excelling in many hydrogen applications, including:
They are also ideal for other process gas services, such as fuel gasboosting for gas turbines, natural gas, coke oven gas, PP and PE process gas, helium and more.
The screw design is inherently reliable and can operate continuously for more than five years. Lube oil injected into the compressor acts as a sealant, lubricant and coolant – allowing the compressor to operate more efficiently with hydrogen and other low molecular weight gases.
Kobelco screw compressors are the environmental choice, too. They reduce power consumption, eliminate emissions and decrease noise, pulsation and vibration.
Kobelco manufactures screw, reciprocating and centrifugal compressors, allowing us to provide the optimum technology for you.
Ask Kobelco! The Best Solution for Any Gas Compression.
Kobelco Compressors America, Inc.Houston, [email protected]
Kobe Steel, Ltd.Tokyo +81-3-5739-6771Munich +49-89-242-1842
www.kobelcocompressors.com
Select 82 at www.HydrocarbonProcessing.com/RS

Treating SolutionsProven
Results
Merichem Company provides a diversified portfolio of products and services to a wide range of operations, including the refining and petrochemicals industries. With more than 1,000 licensed process units worldwide, Merichem is the leader in licensing patented process technologies and supplying proprietary equipment to provide hydrocarbon treating solutions and by-product management services that remove sulfur and other impurities from hydrocarbon liquids and gases.
SCAN THE QR CODE WITH YOUR MOBILE DEVICE TO SEE OUR COMPLETE PORTFOLIO OF
TREATING SOLUTIONS.
www.merichem.com
Select 84 at www.HydrocarbonProcessing.com/RS

Hydrocarbon Processing | JULY 2013 67
Special Report Refinery of the Future R. A. RAKOCZY and P. M. MORSE,Clariant, Munich, Germany
Consider catalytic dewaxing as a tool to improve diesel cold-flow properties
Diesel engines rely on effective dispersion of fuel to ensure efficient combustion. In cold weather regions, maintaining the fluidity flow of fuels can be difficult. Catalytic dewaxing is a selective hydrocracking process that provides a valuable im-provement to low temperature performance of middle distillate feedstocks. It greatly improves cloud point (CP) and cold-filter plugging point (CFPP) properties of diesel fuels.
Background. At present, most US refineries are optimized for the production of gasoline, i.e., fluid catalytic cracking (FCC) units. With the growing interest in diesel-powered passenger cars, existing refineries will not be able to serve that new de-mand for clean diesel. Investments in new technologies to pro-duce high-performance transportation fuels will be necessary. Fuel performance in diesel engines is directly linked to fluidity characteristics in the engine. The highly sophisticated injection technology relies on quick and complete dispersion within the combustion chamber. At low ambient temperatures, the cold-flow properties of typical middle distillate cuts are not adequate.
Several options are typically applied to improve cold-flow properties in diesel transportation fuels, including kerosine blending, undercutting, use of additives (mainly at fuel termi-nals) and catalytic dewaxing. Combined kerosine blending/un-dercutting with the addition of cold-flow improvers has some applicability, although it does not work in all cases. As high-val-ue kerosine is mainly used for jet fuel, blending into lower-value diesel fuel is only acceptable if there is no alternative outlet. Seasonal undercutting of middle-distillate fractions will reduce total diesel yield as higher boiling-point fractions end up in the low-value fuel oil (FO) pool.
The application of versatile cold-flow improvement addi-tives, typically done at product terminals or blending sections, is very efficient to tailor flow properties like viscosity index (VI) or pour point (PP). However, the impact on cold-flow filter plugging point is limited, and the impact on CP may even be negative in some cases.
A selective hydrocracking catalyst has proven to be a robust approach for catalytic dewaxing—a process that can be used to address all aspects of cold-flow performance.a
Middle-distillate properties. For diesel fuel, middle distil-lates have boiling-point curves in the range of 150°C (300°F) to 400°C (750°F). In addition to environmental specifications regarding sulfur, nitrogen and aromatics impurities, combustion
behavior (cetane number and heating value), viscosity and flow behavior specifications are important performance factors for diesel fuels. The top four globally standardized properties are:
• VI• PP• CP• CFPP.Whereas VI and PP primarily describe the quality of the mid-
dle-distillate fluidic behavior and its ability to be transported from tank to engine, CP and PP describe the ability to filter and dis-perse the fuel at lower temperatures. The VI is calculated by the kinematic viscosity at 40°C (100°F) and 60°C (140°F). At higher VIs, the change of kinematic viscosity with temperature is lower. The PP is the lowest temperature at which a liquid will pour or flow under prescribed conditions. It is an approximate indication of the lowest temperature at which the liquid can still be pumped.
FIG. 1. Solidification of diesel fuel in a fuel-filtering device after sudden temperature drop. Photo courtesy of Fordaq IHB.
Nonadecane: (C19) 33°C (91°F)Hexadecane: (C16) 18°C (64°F)Tridecane: (C13) -5°C (23°F)
2,6,10,11-Tetramethylpentadecane: (C19) -100°C (-148°F)
6-Methyloctadecane: (C19) -4°C (25°F)
2-Methyldodecane: (C13) -28°C (-18°F)
7,8-Dimethyltetradecane: (C16) -86°C (122°F)
FIG. 2. Simplified molecular structure and melting points of selected long-chain hydrocarbons typically found in middle-distillate cuts and diesel fuel.

Refinery of the Future
68
The CP is the temperature at which small crystals occur (tur-bidity) in defined measurement equipment. The CFPP is the
temperature at which a filter starts to plug in a defined filtration set-up. If seasonal cold-flow specifications are not met, an unex-pected cold snap can lead to equipment damage, as shown in FIG. 1.
Selective cracking of middle-distillate feedstocks. The cracking of middle distillate to select paraffinic and isoparaffinic molecules and their melting points is summarized in FIG. 2. As the melting point of a particular hydrocarbon molecule in the middle-distillate fraction is strongly linked to cold-flow proper-ties, middle distillates with a high content of isoparaffins have some advantages. Therefore, middle distillates with more paraf-
finic hydrocarbons but poor cold-flow properties can be con-verted into middle distillates with good cold-flow properties by
increasing the isoparaffin-to-paraffin ratio.Two types of catalytic conversion are possible: de-
waxing by isomerization, and dewaxing by selective cracking. A catalyst system can selectively crack par-affinic hydrocarbons of middle-distillate feedstocks.a
The cracking function in this novel catalyst is per-formed by a solid-acid ingredient based on a medium pore-size zeolite that shape-selectively differentiates between branched isoparaffins and linear normal-paraffins. As shown in FIG. 3, only unbranched normal paraffins (n-paraffins) can enter the pores and be con-verted into smaller molecules via cracking. The cata-lyst includes a zeolite with a unique acidity profile that provides outstanding robustness and flexibility for
use with a variety of feedstocks.a In addition, a second catalytic-base-metal function allows fast hydrogen transfer for efficient product release and coke prevention.
Dewaxing service. The catalyst has been commercially avail-able for nearly 20 years. It can be used as a stand-alone solu-tion, or within an existing middle-distillate hydrotreater or ul-tra-low-sulfur diesel unit, as shown in FIG. 4. Middle distillates with a wide variety of cut points can be processed. As basic nitrogen has a particular influence on total catalyst activity, the placement of a small bed of cobalt (Co)-molybdenum (Mo) or nickel (Ni)-Mo hydrotreating catalysts in front can be helpful, particularly for a stand-alone operation.b
Using selective-hydrocracking catalysts within an existing middle-distillate hydrotreating unit is a very common practice. This catalyst can be used with nearly all types of feedstocks, whether straight-run or converted (such as cracker or visbreak-er or coker gasoil) refinery product streams. Its properties are tailored to fit to all hydrotreating catalysts commercially avail-able. Selective cracking is an endothermic process; therefore, the placement of a hydrocracking catalyst bed between two hydrotreating catalyst beds in a hydrodesulfurization (HDS) reactor allows optimum heat integration and very favorable product qualities for cold flow and color. Moreover, commer-cial experience confirms the control of dewaxing activity ac-cording to seasonal demand even without quenching capabili-
The development of energy-efficient,
direct-ignition diesel engines, with highly
sophisticated and sensitive-injection
nozzles, demand high-performance fuels.
Cold-flow properties are important.
Catalytic dewaxing is a vital process for
refineries focused on diesel production.
FIG. 3. Molecular sieving effect for selective cracking of linear paraffinic molecules in zeolite pores.
Select 156 at www.HydrocarbonProcessing.com/RS

Hydrocarbon Processing | JULY 2013 69
Refinery of the Future
ties. In some cases, a two-reactor solution with bypass lines, as represented in FIG. 5, is the most favorable.
The use of selective hydrocracking catalysts can moderately reduce diesel production and increase hydrogen consumption, depending on operational severity and cold-flow improvement requirements. However, many selective hydrocracking installa-tions circumvent diesel yield loss by applying feedstock com-ponents with higher final boiling point (higher cut point). This action allows the conversion of a portion of non-blendable in-termediates into higher-value diesel components to compen-sate for reduced diesel production.
An additional feature of the selective-hydrocracking cata-lyst system is the reduced gas-make. This is very important for existing hydrotreating units, as the formation of light hydro-carbons has no big impact on recycle gas density. Therefore, it does not interfere with the recycle-gas compressor operation. Finally, using a selective dewaxing catalyst as a drop-in replace-ment does not require cost intensive revamp or exchange of recycle compressors. Only minimal modifications of product stabilizers may be necessary to handle higher naphtha volumes in rare cases.
ACKNOWLEDGMENTThe article is a revised and updated version from an earlier presentation at the
American Fuel and Petrochemical Manufacturers (AFPM) Annual Meeting, March 17–19, 2013, at San Antonio, Texas.
NOTES a HYDEX-G is used for selective hydrocracking of long-chain n-paraffins to
improve the cold-flow properties of middle distillates. Its most common applica-tion is for sulfur-containing diesel streams in combination with HDS catalysts in an integrated system. It is a registered product of Clariant.
b HDMax is a hydrotreating catalyst series developed primarily for severe hydrotreat-ing operation of waxes and lube oil stocks. It is a registered product of Clariant.
LITERATURE CITED 1 Koehler, E. O., “Catalytic dewaxing with zeolites for improved profitability of
ULSD production in from zeolites to porous materials,” 40th International Zeolite Conference.
2 Xu, R., Z. Gao, J. Chen and W. Yan, Studies in surface science and catalysis, Elsevier, 2007, p. 7.
3 Weyda, H. and E. Koehler, Proceedings of the 12th Symposium of KFUPM Research Institute, December 2002.
DR. RAINER ALBERT RAKOCZY is the global product manager for zeolite-based fuel upgrading and fuel production catalysts with Clariant. He started with Süd-Chemie in 2005 and headed the solid-catalyst research department. Dr. Rakoczy studied chemistry at the University of Stuttgart and worked also in the field of PCB production (IBM and Hewlett-Packard) and microprocess engineering (FZ Karlsruhe). Dr. Rakoczy has a deep background in the field of zeolites. He is an elected member of the Zeolite Group board of the German ProcessNet Association (DECHEMA).
DR. PAIGE MARIE MORSE is the global marketing manager for the catalysts business of Clariant; she is based in Munich, Germany. Previously, she held technical and business development roles at Dow and Shell in the US. Dr. Morse holds a PhD in chemistry from the University of Illinois.
FeedMakeup H2
Guard bed
Catalytic dewaxing bed
Hydrofinishing bed
XX
X
Y Y
Purge gasA) B)
Wild naphtha
Diesel
Heavies
Gas FeedMakeup H2
Amine unitHDS bed
HDS bed
Catalytic dewaxing bedHydrofinishing bed
Purge gas
Wild naphtha
Diesel
Heavies
Gas
H2S
FIG. 4. Dewaxing by selective cracking with hydrocracking catalyst in a stand-alone unit (a), or within an existing middle-distillate hydrotreating unit (b).
HDS
HDS
HDS
FeedMakeup H2
Amine unit
Purge gas
Wild naphtha
Diesel
Heavies
Gas
H2S
Catalyticdewaxing
Hydro-finishing
FIG. 5. Combined hydrotreating and dewaxing unit for optimal seasonal diesel service.
TABLE 1. General specifi cations of a new dewaxing catalyst in combination with HDS operation
Applicable feedstocks LGO, HGO, VGO, VBGO, LCGO, HCGO, CGO
Operation pressure, bar (psi) 30–150 (435–2,000)
Operation temperature, °C (°F) 280–380 (530–720)
LHSV according to cold-fl ow improvement service, h–1
0.5–8
Tolerance to sulfur, wt% < 2.5
Tolerance to basic nitrogen, wt-ppm < 1,000
Regenerability Yes (in-situ and ex-situ)
Presulfi ding According to HDS catalyst procedure
Production: Light hydrocarbons, wt% 0.5–5
Naphtha, wt% 1–15
Diesel, wt% 80–99

© 2013 by AMETEK Inc. All rights reserved.
The new WDG-V.Impressing even theworld’s most demandingcombustion manager.
The new AMETEK Thermox WDG-V extractive combustion analyzer offers industry-leading safety support. First in its class to be third-party certified forSIL-2 implementation in safety-instrumented systems, the WDG-V provides a complete solution for combustion process control and safety.
Reliable detection of low-combustion oxygen and/or high CO in a fired heateror boiler is critical to burner management system effectiveness. The WDG-Vanalyzer monitors hot, wet flue gas to minimize excess oxygen, lower NOx emissions, and improve operating efficiency in power generation and petrochemical refining. It can also monitor methane levels to assure safe burner startup and shutdown.
The all-new WDG-V. Combustion management and safety capabilities so good, they make this guy jealous. Learn more at www.ametekpi.com.
Select 57 at www.HydrocarbonProcessing.com/RS

Hydrocarbon Processing | JULY 2013 71
Special Report Refinery of the Future S. HOPPER, Veolia Water Americas, Houston, Texas
Recover value through recycled oil-bearing materials
The ability to recycle byproducts as feedstocks, rather than discard them as wastes, helps optimize refining efficiency and presents the potential for substantial environmental and economic benefits. Robust recycling solutions, particularly in the face of diversified crude slates, will help refineries keep pace with shifting production and refining requirements as unconventional resources experience heavy growth in North America. This alternative thinking has resulted in eco-nomic advantages gained by efficiently processing millions of barrels contain-ing oily residuals each year, while reduc-ing chemical, maintenance, disposal and transportation costs.
Along with an increase in a more vari-able crude slate come new and special challenges to the management of residu-als from refining process operations. The various byproduct streams from crude processing and related activities have his-torically yielded challenging economics compared to the demand for sustainable and environmentally sound solutions.
While most refinery process designs offer significant latitude in the handling of crude, they can be negatively impacted by the production of oil-bearing second-ary materials (such as problematic de-salter emulsions and oily residuals from various refining units). In particular, oil-water-solid emulsions that are difficult to separate can create issues in the biological wastewater treatment unit, negatively im-pacting the performance of unit compo-nents like flotation separators. The result is typically higher chemical, operation and maintenance costs. These emulsions can also negatively affect refinery pro-duction. Moreover, the costs associated with discarding such streams may be sig-nificant, not only because such streams are hazardous waste when discarded, but also because they represent lost produc-tion value that must be subsequently re-
placed by additional virgin feedstocks. Consequently, refineries generally prefer to process the difficult and voluminous emulsion, which requires storage of the streams, typically in tanks originally in-tended to store crude or other products.
While expansions and upgrades can help to sustain a robust treatment infra-structure, the design of older systems can sometimes impose practical limitations on such corrections. For example, as the hydraulic residence times decrease in a floatation cell, this will typically result in a commensurate increase in treatment chemical dosage as operations struggle to combat the performance decline. Another outcome can be higher sludge blowdown volumes intended to mitigate potential downstream unit operation up-sets. To keep these operations moving while still being able to contend with the increased blowdown volumes, partner-ships with service providers that provide recycling solutions (ancillary separation and recovery) have helped refineries mit-igate these issues, regain the lost efficien-cies, and further increase overall recovery of hydrocarbons.
Sustainable solutions that maximize resource recycling into ongoing produc-tion processes in a cost-effective manner while minimizing environmental impact have become a key value proposition for refinery industry leaders.
Oil-bearing secondary material.Every refinery generates oil-bearing sec-ondary materials as part of normal op-erations. These materials (mixtures of oil, water and solids) cover a broad com-position range. For example, in desalter, API and related separations equipment, the predominant phase is water, while in tank farms and fluid catalytic cracking unit (FCCU) slurries, the oil and solids phases are relatively high with little to no water present. The source operation also
factors heavily into how much volume is generated. While API separators can gen-erate thousands of barrels per month of blowdown, sludge accumulated in tank farms grows at a comparatively slower and almost surreptitious rate. Regardless of source or composition, refineries must generally take one of two actions to facili-tate turn rates associated with the tanks utilized for storage and handling of these oil-bearing materials:
• Process them into the refining pro-cess, or
• Discard them—disposing them as costly hazardous wastes imposes long-term risks and responsibilities on the refinery.
Clearly, processing into the refining process is the ideal solution.
Recovery approaches. Several physi-cochemical processes can be used to recycle oil-bearing materials within a refinery. Often, they are paired with le-veraging the refinery’s coking operation (where available) to provide a tightly integrated solution that maximizes mate-rial recovery into an ongoing production process while at the same time helping to minimize waste generation.
The most fundamental level of avail-able alternatives involves simple filtra-tion/dewatering. This process can be applied to reduce the stream volume, typically leaving an oily cake (which, if not recycled into the refining process must be disposed as a hazardous waste) and a water phase, which is transferred to the refinery’s wastewater treatment unit. The efficacy of this approach is largely contingent upon the oil and solids con-tent and total composition of the materi-al stream. Unfortunately, it is often ineffi-cient, operator intensive, and susceptible to changes in feed composition.
Moving to the next level, a three-phase, high-speed decanter centrifuge

72�JULY 2013 | HydrocarbonProcessing.com
Refinery of the Future
can be used. This will generally afford relatively clean oil that is suitable for introduction into the ongoing refinery production processes, and water streams (less than 1,500 ppm total oil and solids) that are suitable for transfer to the refin-ery’s wastewater treatment plant. When conducted with the proper process, this approach will also generate an oil-bearing material solids phase conducive to fur-ther processing and introduction into the refinery’s ongoing production processes.
The most aggressive approach is to forcibly desorb the volatile phases at high temperature, recovering all water and oil, and leaving a dry solid phase. The oil and water phases are then con-densed, with the oil being returned to the refinery’s ongoing production pro-cesses (and a potential for the water to be beneficially reused within the refinery’s processes). Inherent in the thermal de-sorption option is the use of a centrifuge to provide a preliminary, gross separa-tion for the phases prior to desorption. Indeed, the three-phase decanter is at the heart of most robust oil-bearing material recycling processes.
For a prominent Gulf Coast refin-ery in Louisiana, recycling oil-bearing secondary materials via centrifugation followed by the injection of properly prepared oil-bearing material solids into its coker is helping to improve efficien-cies and also to reduce costs (FIG. 1). The process recycles the oil-bearing material
streams in compliance with all applicable regulations. Leveraging the coker, the fraction of oil not recovered during cen-trifugation becomes part of the coker’s product. The residual, non-volatile sol-ids do not harm the coke and become a minor inert fraction. Consequently, the process helps the refinery to address con-siderations related to tankage availability and also assists in minimizing waste gen-eration while increasing refining utiliza-tion. In this manner, the utilization of oil within the residuals is maximized, and the separated water phase does not repre-sent an increased burden on the wastewa-ter treatment unit. In other words, the re-cycling process deployed at the refinery helps to both reduce costs and protect the environment.
Three-phase centrifuge. Effective oil, water and solids phase separation is criti-cal in a successful oil-bearing secondary materials recycling process. While vari-ous processes can be used to accomplish phase separation, few offer the cost-ef-fective and robust performance that the three-phase centrifuge does, especially when supported by experienced process and operational know-how. The process generally includes the following steps:
• Transfer the oil-bearing material stream(s) from the source operations via pipeline or vacuum trucks
• Process the material to a centrifuge, which separates the oil, water and solids
• Introduce the recovered oil into the refinery’s ongoing production processes, with the water being sent to the refinery’s wastewater treatment unit
• Choose one of three options: Sta-bilize and prepare the solids for injection into the refinery’s coker unit; further process them via thermal desorption; or invoke disposal options.
The entire process is monitored from a single control room using instrumenta-tion and control hardware and software.
Leveraged, integrated solution. In a petroleum refinery, a coker unit ther-mally cracks residual heavy oil from the vacuum distillation column (resids) into lower-molecular-weight products, leav-ing a solid carbon (coke) phase. The overhead gas and heavy oil phase is con-densed and recovered, while the solid coke can be used as a fuel (low purity) or further processed into anodes (high purity). A coker unit is particularly well-suited for use in an integrated oil-bearing material recycling process because the prepared solids closely resemble nu-merous refinery intermediate streams that comprise typical coker feedstocks (feed-side injection), and their use in this process helps to facilitate increased ma-terials recovery (gas overhead and coke products). The prepared solids may also be used as a quenching agent during the coke cooling period (quench-side injec-tion), and US Environmental Protection Agency (EPA) guidance indicates that oil recovery from prepared solids dur-ing the quenching process is comparable to efficiencies associated with a coking operation’s feedstock side. The prepared solids can be fed during the feed, quench or both portions of a cycle.
The coke’s end use (fuel or anode) and the feedstock composition injected during feed/quench may impose limits on the amount of prepared oil-bearing material solids that can be used. In par-ticular, limits placed on sulfur, ash and other key physical/chemical properties can set quantifiable limits on the amount that can be used. A detailed mass bal-ance is useful when assessing composi-tion and mass-based limits. Conversely, for prepared solids fed during the cycle’s quench portion, the overhead setpoint temperature will typically govern the amount of such streams that can be fed; this is essentially an energy balance con-
FIG. 1. Invoking strategies that focus on recycling oil-bearing secondary materials can help refineries boost efficiencies and reduce costs.

Hydrocarbon Processing | JULY 2013 73
Refinery of the Future
sideration. Given the various sizes, ages and operating conditions associated with cokers across the industry, every situa-tion warrants a separate analysis.
No matter how or when the prepared solids are fed to the coker unit (feed or quench), the basic processing through the centrifugation operation is essentially the same. Afterward, the oil-bearing ma-terial solids may be prepared specifically to address the preferred coker injection process. A general processes summary is explored here.
Coker feed-side injection. In these applications, oil-bearing material solids produced by the centrifuge operation are prepared into slurry that will not settle or stratify. This involves a proper ratio of solids, oil and water. Improper prepara-tion can cause problems with the coker operation, including foaming and in-creased water load.
Because modifications to coke drums are costly and can only be completed during unit turnarounds, the use of ex-isting nozzles and piping is generally de-sired. Possible injection points include the residual feed line or any existing nozzle large enough to accommodate the necessary flow. Use of the antifoam injection line is not recommended, as this is critical and best not compounded with other feedstocks.
Coker quench-side injection. Quench-side injection typically requires slurries with a different ratio than feed-side injection slurries. Because this ma-terial is introduced to the coker after the coke bed has formed, the material stream must be processed in a manner that fa-cilitates optimal permeability through the coke bed. Compared to feed-side injection, quench-side injection is gener-ally more attractive because it does not require additional equipment or energy to remove water prior to injection. Also, quench-side injection does not impact the coker feed rates because the aqueous slurry simply replaces quench water that would otherwise be used after coking is completed anyway.
Thermal desorption. As an alternative to coker injection, thermal desorption also helps to increase oil recovery and water phases for introduction into the re-fining process. There are, however, two key disadvantages associated with this option as compared to using a coker:
1. Where a coker exists, there is no need to install the additional equipment required for thermal desorption. Thus,
capital costs are much lower when using coker injection.
2. Despite the increased materials recovery associated with thermal desorp-tion, the operations produce a solids phase that must be disposed (because no further hydrocarbons can be recovered from the material).
In a typical thermal desorption process, the oil-bearing material solids produced by the centrifuge operation (referred to as cake) are recycled via two processing stag-es. The first stage removes the water and a significant fraction of the organics from the cake. This low-temperature stage uti-lizes an indirect heat source (gas or elec-tric) and the equipment operates under an inert atmosphere (typically nitrogen). In the next stage, the dried cake is processed in a high-temperature compartment that completes removal of organics, leaving clean, dry solids. The vapors produced by each stage are condensed, facilitating the recovery of oil and water phases, which are separated and returned to the refin-ery’s ongoing production process.
The resulting solids need to be char-acterized as hazardous waste unless a del-isting exemption is obtained. Delisting is a regulatory authorization that allows
specific wastes from a particular generat-ing facility to be conditionally removed from the hazardous waste list. Success-
ful petitions for delisting authorization include economic benefits for the peti-tioner and significant benefits for the en-vironment as well.
Recycling via thermal desorption presents significant benefits to the re-finery by recovering all oil, minimizing the amount of solids requiring disposal (which also has a positive impact on dis-posal-related expenses), and, in the case of successful delisting petitions, helping to diminish the costs and liabilities asso-ciated with hazardous waste disposal. For instance, a major refinery in Louisiana utilizes thermal desorption to recover an estimated 31,000 barrels of oil per year, and, as a result of its successful delisting petition, the resulting solids that com-ply with the delisting conditions may be characterized as a nonhazardous-waste stream when disposed.
Comparison. General end results as-sociated with the oil-bearing secondary material recycling processes can be il-lustrated by a hypothetical comparison, which assumes a refinery produces 1,000 barrels of an oil-bearing material stream (with 5%wt solids, 15%wt oil, and 80%wt water) that is recycled and produces
Processing/handling options
From APIFrom DNF
Oily residualsfeedstock
Preparationstep Centrifuge
Cake
Coker quench Coker feed DisposalThermaldesorption
Oil to refinery
Water to WWTPFrom tank farm
Slop oil
FIG. 2. Various options for oil-bearing secondary material recycling processes.
Recycling via thermal desorption presents significant benefits to the refinery by recovering all oil, minimizing the amount of solids requiring disposal and diminishing liabilities.

Refinery of the Future
74
cake that is 40%wt solids, 10%wt oil and 50%wt water. A block diagram of the various options is shown in FIG. 2. TABLE 1summarizes the general disposition of oil, water and solids for each approach.
Some key conclusions from the table include:
• Dewatering is the least attractive approach, as the solids generated would be hazardous
• Coker quench or feed yield com-plete recovery for all water and oil with no residual solids phase
• While coker quench may initially ap-pear to recover more oil, solids prepared for coker feed have a much larger percentage of oil than solids prepared for coker quench; however, both operations maximize the oil recovery that is introduced into ongoing refinery production processes
• Thermal desorption affords com-plete recovery for all oil and water phas-es but generates solids that still must be disposed; these solids will generally be classified as hazardous waste unless a suc-cessful delisting petition is secured (and
its conditions are met for each applicable batch of solids).
Further to the environmental and eco-nomic benefits, an effective oil-bearing secondary materials recycling/manage-ment program provides a more robust operation that can also help refineries im-prove tankage utilization (freeing space oc-cupied by such materials). It also provides additional latitude in the operation of units that produce such material streams, since operators have additional confidence that the blowdown will not be as likely to create process upsets downstream.
As the oil and gas industry continues on a projected path of strong growth, the technologies and services applied to en-hance recovery and improve the opera-tion will become increasingly important. Successful partnerships that leverage in-tegrated, holistic solutions are a key to success.
STEVE HOPPER is executive vice president of Veolia Water Americas Industrial Business Group, a part of Veolia Water North America. The company provides water and wastewater partnership services to industrial and municipal customers.
TABLE 1. General disposition of oil, water and solids for each approach
Process approach
Oil bbl (approximate) to
production process
Water bbl (approximate) transferred to
refi nery’s WWTU
Solids tons (approximate)
disposition
Dewatering 154 818 17.9 (all disposed, as hazardous waste)
Coker quench 154 647 0 (all processed via coker)
Coker feed 83 867 0 (all processed via coker)
Thermal desorption
164 871 7.3 (all disposed, either as hazardous waste, or, if delisted, potentially nonhazardous waste
+1 (713) 520-4426 l [email protected]
www.GulfPub.com
Featuring more than 70 routines associated with control valves, rupture
disks, fl ow elements, relief valves and process data calculations,
InstruCalcTM is one of the industry’s most popular desktop applications for
instrumentation calculations and analyses.
Features:• Graphs for Control Valves and Flow Elements
• Restriction devices
• Material yield strengths fi le
• ISO orifi ce plate calculations have been updated to ISO 5167, 2003
• Relief Valve programs, sudden entrance and exit to the calculations.
ooooooommmmmmm+1 (
• Relief VVVValvev pprorororoggggggg
The industry-standard software for instrumentation design
NEWVersion 8.1
Select 159 at www.HydrocarbonProcessing.com/RS

1-800-662-6367 www.omi-industries.com
You wouldn’t choose to wear it as a cologne. Why smell it all?
Ecosorb non-toxic additives safely, effectively and affordably
eliminate bitumen odors without the use of masking agents.
EAU REALLY? SOME SCENTS MAKE NO SENSE.
Select 91 at www.HydrocarbonProcessing.com/RS

Select 61 at www.HydrocarbonProcessing.com/RS

Hydrocarbon Processing | JULY 2013 77
HPI Focus Energy Efficiency Z. MILOSEVIC, A. RUDMAN and R. BROWN,KBC Process Technology, UK
Are you using pinch technology effectively in your daily operations?—Part 2
In Part 1, the basic principle of pinch technology and appli-cations were presented. Pinch technology is a valuable tool in the design of greenfield HPI facilities. More importantly, such tools provide great benefits in the revamp of existing energy networks. Such investigation tools do have daily applications when applied. Are you using pinch technology to optimize your facility on a daily basis?
Finding scope for improvement—Revamp targeting.The inefficiencies that are typically found in existing preheat trains are:
• High design ΔTmin at the pinch—insufficient exchanger area installed originally
• Cross-pinch heat transfer—poor exchanger positioning• Poor exchanger area utilization—poor exchanger posi-
tioning, crisscrossing, and perhaps too much area used in the wrong place.
The benchmarking procedure described earlier identifies the efficiency gap between the actual and optimally designed pre-heat train. Applying revamp targeting methodology establishes how much of this gap can be closed via economical projects, and it forms the basis for capital expenditure of a cost-effective retrofit. Retrofit projects fall broadly into three main categories:
• Projects to increase heat recovery from hot streams by re-covering heat wasted to air/water coolers.
• Projects to maximize use of a low-cost utility. For exam-ple, replacing HP steam with LP steam, or replacing part of the furnace duty with steam heating, where possible.
• Projects to address other energy-related process issues such as unit debottlenecking, capacity or processing severity increase, pressure drop reduction, etc.
Developing a process for revamp targets has a long history, and the research efforts still continue. Finding the optimum solution, technically and economically, in a multiple-constraint problem, such as the revamp of an existing preheat train, is a very complex task. The main issues are:
• What is the correct ΔTmin for revamps?• How to best use the existing exchanger area?• How to minimize area addition?• How to remove the constraints imposed by the existing
HEN configuration?In a grassroots design, the capital/energy trade-off is found
by optimizing the ΔTmin at the pinch. The “grassroots curve” (FIG. 9) shows the area vs. energy function; it is the grassroots
optimum—its position is determined by optimizing ΔTmin in the “area vs. energy” trade-off.
The existing design, shown by the red dot in FIG. 9, is above the grassroots curve because it will not perform better than a grassroots pinch design. The grassroots optimum case would have lower surface area than the existing design. However, in a revamp situation, there is usually no benefit from not using the existing area. Therefore, the objective is to make the best use of what is already installed. Ideally, the designer would want to proceed horizontally, maintaining the same area, but using it better, to reduce energy consumption. This would be pos-sible if the existing network were “elastic,” i.e., if the network structure could be easily changed and the surface area could be easily re-distributed among exchangers. This is rarely possible. A realistic revamp project will follow a curve that represents increased area requirements and reduced energy requirements, as shown in FIG. 9. A curve with better economics is closer to the grassroots curve.
The designer’s objective in setting a retrofit target is to de-velop a targeting curve that provides the best economics after accounting for all practical issues and constraints. This can be accomplished by using the “area efficiency” concept.2, 3 Area efficiency measures the effectiveness of the surface area used in a network, based on the grassroots case. Area efficiency is defined as the ratio of the grassroots area target (at the exist-ing energy consumption) and the existing network area. To
Energy
Goodeconomics
Infeasible
Existingnetwork
“Grassroots”optimum
Do not discardexisting area
Grassrootstradeoff curve
Pooreconomics
Area
Ideal scenario
FIG. 9. Grassroots design area utilization curve.

78�JULY 2013 | HydrocarbonProcessing.com
Energy Efficiency
develop a retrofit targeting curve, assume that a good retrofit will at least maintain the existing surface area efficiency, i.e., α = constant. Based on the α = constant, a retrofit targeting curve is developed; it maintains the same area efficiency as the existing design. This is largely a software-led process.
IDENTIFYING EFFECTIVE IMPROVEMENT PROJECTS
In simple heat-exchanger systems, involving one or two ex-changers, the improvement options are intuitive, and may be found by inspection. They may involve adding area to a sin-gle exchanger, using some heat-transfer enhancements (e.g., twisted tubes), or moving exchanger shells around and repip-ing. However, in complex networks, a systematic approach is needed to maximize the improvement potential. This implies applying computer-based revamp techniques that involve the
path pinch concept, utilizing the network’s loops and paths and introducing “enabling” projects when the network is constrained. Very often, the design inefficiencies result from cross-pinch heat exchange. There is a simplified procedure that a plant engineer may use to find potential improvements
in simpler networks.
Cross-pinch elimination procedure. Many cross-pinch inefficiencies arise from exchanger matches, as shown in FIG. 10. This exchanger recovers heat from the hot stream (being cooled from A to B) into the cold stream (being heated from C to D). While the exchanger has a tight temperature approach at its cold end, the driving forces increase as the stream temperatures increase. Because of this, the hot-end approach temperature is significantly greater than the cold end ΔT. Depending on the location of the exchanger within the system, this can result in a large proportion of the exchanger duty being cross-pinch.
The way to correct the cross-pinch transfer is shown in FIG. 11. The original exchanger now only carries out the duty from E to B on the hot side, and C to J on the cold side (exchanger 1). The remaining cold-side duty ( J to D) is now done by a new, lower-temperature hot stream (H to I) in exchanger 3, while the remaining hot-side duty (A to E) is used to heat a higher-temperature cold stream (F to G) in exchanger 2. The new stream F to G could be for steam generation or stream H to I could be for steam use. Clearly, correcting exchangers with some cross-pinch involves investment.
Systematic revamp approach. A full study of a network revamp involves software application. Modern approaches to network improvement seek to squeeze the best possible per-formance out of the existing units and to minimize installing new exchangers. Typical retrofits may involve surface-area en-hancing equipment, such as tube inserts and twisted-tube ex-changers, and, often, one new exchanger or exchanger shell. All efforts try to avoid extensive changes to the network.
These techniques include the use of “loops” and “paths” within a network. Paths are the heat flow trails within the net-work that connect the cold and the hot utilities. Because of this, any improvement in the heat recovery along a path can reduce consumption of both utilities. A loop is a closed-energy path within the network. In a retrofit design, paths form the basis of “path pinch,” which address the additional constraints imposed by a specific configuration within the existing facility. The methodology is aimed at finding the best energy savings for the least investment.
Existing networks can usually be improved by using paths to shift the loads between exchangers. However, a design will be reached from which no further improvement is possible, although it is still far from the pinch target. The initial network configura-tion imposes a constraint that hinders further improvement.
Path-pinch analysis identifies the heat exchanger forming the bottleneck to higher heat recovery, and it provides a sys-tematic approach to remove it. It is a step-by-step method for implementing energy savings by a series of consecutive proj-ects. Once the offending exchanger is identified, then five op-tions can be considered to remove the constraint:
ΔT > Dtmin ΔT = Dtmin
A
DC
B
Duty
Temp
erat
ure
FIG. 10. Potential cross-pinch heat transfer.
A
D
H
G
JC
B
13
2
IF
E
Duty
Temp
erat
ure
FIG. 11. Correction of cross-pinch heat transfer.
Pinch technology is a well-established
concept. It is used to optimize waste-
heat recovery and design efficient heat
integration schemes in a wide range of
applications. What is less obvious is that
pinch technology can assist operations
engineers in their daily work.

Hydrocarbon Processing | JULY 2013 79
Energy Efficiency
• Resequencing—Reversing the order of exchangers to improve heat recovery
• Repiping—Changing the matched streams to improve heat recovery
• Adding a new shell to an exchang-er—Changing the load on the offending exchanger
0 Increasing the performance of an exchanger. It includes installing a twist-ed-tube bundle, tube inserts and/or heli-cal baffles.
• Adding a new exchanger—Chang-ing the load on the offending exchanger.
• Stream splitting—Reducing the load on a stream in the offending exchanger.
This is a software-led process, so that all possible paths within the network are explored and new ones are identified. Each path is tested to identify how much energy can be economically squeezed from that path, and then the various paths are ranked in terms of total potential energy savings. The path-pinch revamp method is sequential, but it examines various configurations in a sys-tematic way, while allowing the designer to interact with the software-led design procedure.
A CASE STUDY: INTUITIVE VS. ‘PATH-PINCH’ REVAMP
A skilled process engineer can identify certain network improvement projects by inspection, intuition, experience, simulation, perhaps starting with the DIY approach. By refer-ring to the calculated pinch target, the engineer can estimate the performance gap closure. The case study uses an actual industrial example, and it addresses how much energy savings can be identified by intuitive projects, and how much would be missed in terms of potential energy savings by relying solely on inspection and intuition methods that do not apply a system-atic revamp approach.
Consider the preheat train of an atmospheric CDU, as shown in FIG. 12. A pinch-targeting exercise reveals that the actual preheat train performs as if designed for ΔTmin of 85°C, while the economic optimum would be 37°C. The actual feed preheat temperature is 255°C, while it could be 290°C in a preheat train designed by pinch principles. The efficiency gap between the actual and the “pinch designed” cases is 22.7 MW or $7.9 million/yr at the assumed fuel cost of $40/MWh. Can this gap be closed, and if so, how tight? Some of the built-in inefficiencies for this exchanger network are obvious:
• The residue stream is sent hot to water cooler C1. This stream could be used to preheat feed.
• The overhead heat is lost to the air-cooled condenser C3. This may be recoverable.
• There is a suspect cross-pinch exchanger E2, where a hot, heavy gasoil stream is used against very cold feed.
Intuitive projects. It seems logical to add area to exchanger E6 and recover more residue heat. Aiming for ΔTmin of 35°C in this enlarged exchanger, 1,967 m2 of new area can be installed, saving 7.5 MW of furnace fuel valued at $2.6 million/yr. The
investment cost is estimated at $3.9 million, offering a simple payback of 1.5 years. This is undoubtedly a good project. How-ever, a skilled engineer will immediately notice that, if area is added to E6, exchanger E7 will lose temperature driving force, and it will have to be enlarged to maintain constant BPA duty. After some consideration and “area balancing” between E6 and E7, the engineer will find that the size of E6 needs to be in-creased by 1,700 m2, and that of E7 by 930 m2. The area of E6 is increased until E7 becomes “pinched.”
The two intuitive projects, combined, would increase the feed preheat to 272°C, and save 11.6 MW of furnace fuel. The investment cost is estimated at $5.1 million, offering a simple payback of 1.3 years. FIG. 13 illustrates the resulting preheat train. This is the limit for the intuition approach. One may observe that, as E6 becomes pinched, it seems logical to add area to E8 as well. This may “de-pinch” E6, and allow adding more area economically to E6 (shifting area between E6 and E8). Howev-
E5
E4
E6 (2,127 m2)(+1,708 m2)
E7 E8
HGO356°C
LGO266°C
BPA308°C
Resid384°C
80.7 MW
272°C
12.4 MW
80°C
165°C
210°C 249°C
C1
0 MW
238°C
Pinch
C2
307°C
125°C
8.3 MW
FIG. 13. An intuitive revamp.
E1 E3E2
E5
E4
E6
E7 E8Desalter
Kerosine211°C
HGO356°C
LGO266°C
BPA308°C
TPA175°C
Resid384°C
10°C718 tph 92.3 MW
255°C
24 MW
80°C
236°C
127°C
125°C
184°C 229°C
C1
C2
275°C
C3
157°C
43.5 MW
295°C
8.3 MW
73°C
162°C
FIG. 12. Example CDU preheat train.

80�JULY 2013 | HydrocarbonProcessing.com
Energy Efficiency
er, this optimization is not entirely intuitive. Using the column overhead heat may be considered another “obvious” opportu-nity, but this is a low-grade, below-pinch heat. In theory, it does not improve heat recovery. There is no obvious place for it.
The 11.6 MW of improvement is good. However, in this particular case, a 17.3-MW energy savings is possible. So, there are some nonobvious projects, and this is a typical situation in which the “path pinch” proves powerful.
Path-pinch projects. Path pinch achieves energy savings by adding area strategically and making limited structural changes
to the network.a The path-pinch algorithm assesses the net-work to find heat-recovery paths. These connect hot and cold utilities via exchangers, so that any additional heat recovery along a path reduces the use of both utilities. New software aids in finding and analyzing all paths to identify the most economical routes to exploit, and to maximize heat recovery with minimum investment.a One such path is shown in a grid diagram (FIG. 14). Increasing heat recovery along a path can be continued until the path becomes “pinched,” and no further improvement can be made. This is when “enabling changes” are proposed to remove bottlenecks and allow the algorithm to exploit new paths to achieve further energy reductions.
Path-pinch 1. The first path-pinch project identified the path, as shown in FIG. 14. The project is similar to the intuitive proj-ect illustrated in FIG. 13. It consists of adding area to E6 (+1,862 m2), E7 (+785 m2) and E8 (+195 m2), until E7 becomes pinched. The fuel savings reach 12.4 MW. The required invest-ment is $5.5 million, offering a simple payback of 1.3 years—slightly higher energy savings (by 0.8 MW), with a return on investment similar to the intuitive project.
After the project is considered for technical viability, avail-able space, pressure drop, safety, etc., and is accepted by the en-gineer, then the methodology can be reapplied to identify the next best project. In the example case, however, the algorithm finds that after the Path-pinch 1 project is implemented, a limit is reached and no further improvement can be made by simply adding area to existing exchangers. The inefficiencies remain, such as cross-pinching and wasting of overhead heat and part of the residue heat.
Enabling project. The bottleneck can be removed by install-ing a heat exchanger below the pinch to recover the overhead heat upstream of exchanger E3. It will need an area of 200 m2
and a duty of 4.3 MW, but, on its own, it only saves 1 MW in furnace duty. It is a so-called “enabling” project. The engineer will notice that, to maintain a constant TPA duty in E3, this ex-changer will require additional area. Therefore, some projects will have to immediately follow the enabling project, but the path pinch will attempt to extract the maximum benefit from
the enabling project. In this particular case, the optimization will include adding area to E3, and slightly increasing the areas of E6, E7 and E8 relative to the Path-pinch 1 project. Compared to Path-pinch 1, the optimized version of the enabling project will save additional 2.7 MW of furnace fuel, reaching total savings of 15.1 MW, with 1,100 m2 of new area.
Path-pinch 2. The optimized en-abling project allows a new iteration that finds it is economical to add more area to debottleneck the downstream exchang-ers, particularly E3, E5 and E7. With the total new area of 1,522 m2 over Path-pinch 1, the savings increase to 16.1 MW.
Path-pinch 3. Finally, in another itera-tion, the path-pinch algorithm finds its last economically viable project, which is the
TABLE 1. Estimated energy savings, investment and payback through path-pinch projects
ProjectSavings,
MWInvestment,
million $Payback,
years
1 Intuitive 2 11.6 5.13 1.3
2 Path-pinch 1 (alternative to Intuitive 2)
12.4 5.5 1.3
3 Enabling and Path-pinch 2 (Incremental)
3.7 3.51 2.7
4 Path-pinch 3 1.2 1.17 2.8
Total (items 2, 3 and 4) 17.3 10.2 1.7
Residue
Kerosine
LGO
HGO
Overheads
TPA
BPA
Crude
Desaltedcrude
H1
E7
E4
E3
E2
E1
C1
C2
C3
E5
E6E8
FIG. 14. Illustration of a path pinch.
E1 E3E2
E5
E4
E6
E7 E8Desalter
Kerosine211°C
HGO356°C
LGO266°C
80°C11.3 MW
BPA308°C
TPA175°COver-
heads
Resid384°C
10°C75 MW
280°C
166°C
137°C 216°C 254°C
C2275°C
C3C1
157°C
39.2 MW
296°C
157°C7.9 MW
73°C
FIG. 15. Final revamp.

Hydrocarbon Processing | JULY 2013 81
Energy Efficiency
addition of a new residue exchanger (430 m2) downstream of E6. With this, the cumulative savings reach 17.3 MW.
Of the total identified efficiency gap of 22.7 MW, the com-bined path-pinch projects close the gap about 80%. Although there seems to be some remaining improve-ments, the remaining projects after Path-pinch 3 are small and uneconomical. Remember: The perfor-mance gap is almost never completely closed. The constraints imposed by the existing configuration normally make it impossible to reach pinch targets in revamp situations. This is the usual price to be paid for a suboptimal initial design.
FIG. 15 is a schematic of the final revamp. TABLE 1summarizes all of the possible projects investigated. In summary, the actual savings potential of the example network is 17.3 MW. The savings projects identifiable by intuition can reach 11.6 MW, and further savings are only enabled by a systematic approach and the path-pinch process. They total about 5.7 MW.
When applied to existing HENs, the knowledge of pinch technology can assist in finding operational improvements, understanding and calculating the effects of exchanger fouling, benchmarking the energy performance of their processes, and perhaps identifying improvements from simple modifications.
An experienced engineer can venture into designing pre-heat train revamps, by inspection, using intuition and simula-tion. There is no doubt that some effective energy-improve-
ment projects can be identified by such procedures. They close 65% of the efficiency gap, as demonstrated in the pre-sented example case. The remaining 35% of the gap can only
be identified by using the systematic path-pinch method. The final 35% of gap closure that results from the systematic ap-proach may not look overwhelmingly important, but it may be indispensable when the last 35% of efficiency improvement can be the differentiator within the present day competitive world of refining. Refineries and petrochemical facilities try to squeeze out every percentage of their resource efficiency, be it energy, environmental or other.
End of series. Hydrocarbon Processing , June 2013.
PROVEN EXPERIENCE. TRUSTED RESULTS.WWW.CUDD.COM
Managing turnarounds on time and on budget can present many challenges. Cudd Energy Services helps you meet these challenges head on. Our
emission rating helps reduce emissions.
EFFICIENCY MATTERS.RESTORE ONLINE STATUS QUICKLY AND SAFELY.
By understanding the basic pinch principles,
engineers can apply these methods to
improve the operation and behavior of heat-
exchanger networks, identify the operational
improvements, calculate the effects of
exchanger fouling and benchmark energy
performance of existing process units.
Select 157 at www.HydrocarbonProcessing.com/RS

What you can do
with atouch of blue.
Improve your refinery profitability by maximizing the production of cleantransportation fuels with our leading residue upgrading technologies.
Deliver the best in refinery hydrogen production while reducing your operating costs with our unique Terrace Wall™ reformer design.
Enhance the efficiency of your overall sulfur recovery to achieve peak operating and environmental performance with our SRU technology.
You can…
And these are just the technology options. There is so much more you can do with a touch of blue. Visit www.fwc.com/touchofblue
Select 62 at www.HydrocarbonProcessing.com/RS

VALVESUse wireless valve-monitoring technology to your advantage V–85
CORPORATE PROFILESCurtiss-Wright Flow Control Company V–89 Farris Engineering V–91 OHL Gutermuth V–92 Onis V–93
COVER PHOTOPhoto courtesy of Onis lnc.
2013
Special Supplement to

Speak at the Gastech Centres ofTechnical Excellence (CoTEs) SeminarsGastech Exhibition Seminars Driving Awareness of Innovation & Advancement in Gas Technology
The Centres of Technical Excellence (CoTEs) are free-to-attend educational theatres located on the exhibition show fl oor. Each theatre features focussed seminars dedicated to delivering knowledge, education and awareness of technological innovations Attracting thousands of industry professionals, these seminars provide a platform for high-level industry leaders to showcase their latest developments in gas technology.
Natural Gas Vehicles (NGV)
Gas Monetisation
NGL/GTL
LNG as a Shipping
Fuel
Power Generation
HSSE LiquefactionOff shore & Subsea
Technology
Pipeline Infrastructure
LNG & Gas Carrier
Shipbuilding
CoTE Streams for 2014
HOSTED BY
SUPPORTED BY
Calling all leading technical experts, submit presentations to present at the CoTEsProvide your industry peers with a comprehensive outlook on:
Technological innovation Recent case studies Key advances in research and development
If you are interested in speaking at the CoTEs as part of a sponsorship or exhibition package please contact us at [email protected] or contact Michelle Thorby on +44 (0) 203 615 2876.
Submit Your
Presentation Today
Deadline for presentation submissions is Friday 19 July 2013
Visit www.gastechkorea.com/cotes
www.gastechkorea.com/HydrocarbonProcessing

HYDROCARBON PROCESSING | VALVES 2013 V-85
USE WIRELESS VALVE-MONITORING TECHNOLOGY TO YOUR ADVANTAGET. SEQUEIRA, Pentair Valves & Controls, Houston, Texas
VALVES
Financial pressures, combined with increasing safety and environmental requirements, have resulted in a significant in-crease in the need for valve-position monitoring in industrial plants. However, the potential cost involved in putting a moni-toring system in place means that larger numbers of valves re-main unmonitored.
Keeping a large population of unmonitored valves has sev-eral implications. For example, a manual valve may be incor-rectly left open, closed or partially open. Since most manual valves are not monitored, those events can go undetected for a significant time, causing considerable operational losses, along with environmental and safety risks.
A major restriction when installing automation systems is the need to use wires to connect sensors and actuators. Wir-ing an automation system in a modern plant is time-consuming and costly [e.g., due to the cost of cables, cable trays, cabinets, and associated input/output (I/O) points and installation], leaves a considerable footprint and adds significantly to weight.
Due to wiring cost, only one third of the automated valves have limit switches (only the solenoid is wired), leaving two thirds of these automated valves without any position feedback.
The valve industry has reacted to this need by developing wireless technological solutions to help plants increase the number of monitored valves, avoiding the financial burden. According to recent research, wireless technology can triple monitoring instrumentation in a typical plant.
This technology can be applied to both manual and auto-mated rotary or linear valves, and it provides real-time infor-mation about a valve’s status directly into the control system, increasing safety and yield. In addition, it can provide the valve’s operational signature, enabling cost-effective predictive mainte-nance. Finally, in new construction, it can reduce material costs, simplify engineering and installation, reduce commissioning and startup costs and help in space-constrained situations.
The increasing need to monitor valves. The need to remotely monitor valves in a wide range of plant applications is driven by several key factors: facilities must operate efficiently, and they must adhere to industry and regulatory standards for safety and the environment.
There is mounting evidence of the cost of incidents and accidents. Of all major incidents and accidents in the refining and petrochemical industry, about 30% result in injury or loss of life, and over 60% result in regulatory fines and production downtime. In addition, while the occupational safety incidents in these two industries declined by 90% between 1993 and 2005, the level is still considerable because, on average, plants in these industries will have one incident for every 500,000 work hours. The material cost of each incident in the same period has
risen by 50%. The average cost of each incident is about $12/1,000 barrels (bbl) of refining production.1
Plant management is increasingly seeking a higher awareness of plant conditions to improve efficiency and safety. In addition, plants must adhere to a growing body of safety and regulatory requirements that often increase the need for monitoring. At the same time, an important trend in the industry is to extend the intervals between planned shutdowns to increase productivity.
Lack of valve monitoring alone is not the reason for all of the safety, efficiency and environmental issues mentioned above; those incidents happen for a number of reasons other than lack of valve monitoring. However, the understanding of valve status needed to support these objectives can only be achieved through real-time monitoring.
Monitored vs. unmonitored valves. Despite the ability of monitoring systems to address many of these valves’ efficiency, safety and regulatory issues, installation of valve monitoring technology is limited. Industry research indicates that as many as 70%–85% of valves in plants are not monitored.
As FIG. 1 suggests, the range of automation of valves varies largely from one plant to another. Manual valves can make up between 10% and 55% of the valve population of a plant, and practically all of them will have no monitoring. Among auto-mated valves, typically two thirds will also have no monitor-ing. In total, that leaves as many as 70%–85% of valves without monitoring capabilities.
Implications of unmonitored valves. One of the main impli-cations of having a large number of unmonitored valves has to do with safety. Less monitoring means less information about valve positions in both manual and automated systems, which increases uncertainty and risk. Without remote monitoring,
*Between 70% and 85% ofvalves are not monitored
*Ratio may vary depending on process and application
Manual valves(no automation)
Automated valves—solenoid only
(no monitoring)
No automation
Automated valves(with monitoring)
33%Automation
Main reason for variation in valve automation is cost: Data suggests $2,000 to $5,000 per valve (wires, cable trays, cabinets, I/Os, installation, etc.)
67%
100%10-55 10-55
90-45
10060-30
30-15
FIG. 1. In a typical industrial installation, most valves are not monitored. Image courtesy of Westlock Controls.

V-86 VALVES 2013 | HydrocarbonProcessing.com
VALVES
many plants must physically inspect valves to ascertain their statuses. This sends personnel into potentially dangerous envi-ronments or limits inspection.
Lack of monitoring also affects efficiency and performance in plants. The adage, “You cannot improve what you cannot measure,” applies almost perfectly to this situation. Valves pre-cisely control the flow of media in process plants. Lack of infor-mation from a large percentage of these valves can lead to a bad batch and significantly limit plant engineers in their efforts to control and improve efficiency.
There are also environmental implications. If an outflow valve that should be closed is accidentally left open, media can leak to the environment without notice or until another part of the control system discovers the error.
As previously mentioned, plant operators can face situations where the valve is incorrectly opened, closed or left partially open. These events can cause considerable operational losses, impose high costs and pose environmental and safety risks.
A major study in the offshore oil and gas industry showed that almost 50% of valve incidents resulting in leakage to the environment were attributed to “operational issues” (not to valve defects or malfunctioning), and almost 30% of these op-erational issues were the direct result of a valve simply being left open or wrongly opened without notice.2
Restrictions for monitoring-system installation. In valve-intense applications, monitoring has historically been achieved with wired systems. These systems facilitate monitoring but present many challenges that restrict the extent to which they can be deployed. The challenges are inherent to wired systems and include such fundamentals as the cost of installation and constraints on design and expansion.
Design limitations are presented by many factors, including weight, the number of installed devices and the complexity of the system. Costs are driven by installation of an infrastructure of wires, cable trays, cabinets and I/Os. For a typical industrial installation, this may total $2,000–$5,000 per valve.
Automated valve-monitoring systems are generally more expensive due to the need for wiring both sensors and actua-tors. Due to wiring cost constraints, two thirds of automated valves will have only a solenoid without position feedback. More significantly, for every automated on/off valve, there will be another 3–4 manually operated valves in the plant.
Using conventional wiring to monitor valves has a huge cost associated with connecting I/O points in the control system, distributed control system (DCS), supervisory control and data acquisition (SCADA) system or programmable logic controller (PLC) (FIG. 2).
Long cable runs, full cable trays and marshalling cabinets are common problems with these applications. The labor-in-tensive layouts and the difficulty in maintaining and modify-ing the system constrains engineering and installation options.
A wired system can increase maintenance requirements in industrial or severe service applications. Wires can wear and break, and connections can shake loose. These systems require knowledgeable personnel to ensure reliability and per-formance, which can involve training and/or certifications.
Manufacturer response to wireless valve monitoring.Wireless technology is the industry’s response to the increased need for remote valve monitoring in manual and automated applications. In contrast to wired systems, wireless valve moni-toring uses radio signals and a networked system of field moni-toring devices. The technology is integrated with DCS, PLC and SCADA systems to provide real-time information on valve status, along with flow, temperature and density conditions with wire-less transmitters (FIG. 3).
Wireless technology varies among manufacturers; howev-er, a typical manual valve system consists of a wireless device at the valve, a wireless router, and a gateway connected to the plant network’s maintenance and operations functions. Auto-mation adds a return leg, with DCS/PLC controllers and so-lenoid wiring back to the valve. Integration with the plant net-work is facilitated with open protocols such as object linking and embedding for process control (OPC), Modbus remote terminal unit/transmission control protocol (RTU/TCP), and PROFIBUS.
Battery-powered monitoring devices used in the field are typically configured with a mesh network topology, which ensures full redundancy and avoids any single point of failure. Within a network, data is routed using the most expedient path.
Wireless remote-monitoring systems address many of the challenges inherent in wired systems. Chief among these is a significant reduction in cost, which provides a more affordable
FIG. 2. Wired monitoring has a complex infrastructure. Image courtesy of Westlock Controls.
FIG. 3. Wireless systems greatly simplify the monitoring infrastructure. Image courtesy of Westlock Controls.

HYDROCARBON PROCESSING | VALVES 2013 V-87
VALVES
valve-monitoring system that can be applied to a larger popula-tion of valves and a greater percentage of plant operations.
Wireless valve monitoring can reduce the cost per valve vs. that of a wired system by 25%–60%, depending on factors such as the application, area, classification and distances. The cables and routing (cost of attachment) that can sometimes account for 50% of the installation budget for a wired system are elimi-nated with wireless monitoring. The difference can account for thousands (and even hundreds of thousands) of dollars in installation costs over conventional wired systems. Lower in-stallation costs mean that monitoring can be economically ex-tended to a larger, more complete valve population, providing the information needed to improve efficiency and reduce risk.
Health and safety risks are reduced because fewer person-nel are required in the field to determine valve status, thereby limiting exposure to hazardous situations. Also, reducing and eliminating the labor-intensive process of physically monitor-ing valves eases workload and frees personnel for other tasks.
Monitoring devices are easily deployed as needed, with no practical limits to the number of valves that can be monitored. Deployment is also enhanced by a much smaller footprint, which helps overcome space obstacles and routing issues.
Reliability and security standards are key advantages of wire-less monitoring technology. Wireless systems have an inherent reliability based on multiple paths of communication. If a de-vice fails or a path is blocked, another route is used to ensure that valve data reaches the control system. Devices based on in-dustry standards have greater than 99% data-transfer reliability.
Wireless security advantages include encryption to prevent reading of intercepted data. Each message must also be authenti-cated, which requires that the origination and receiving devices recognize each other—a function that is built into the devices.
Limitations of wireless valve monitoring. Wireless systems have limits that should be considered when examining any appli-cation. Most of these boundaries are related to the distances and topologies, which may vary depending on the protocol used. Care should be taken in choosing the most appropriate wireless technology to address these considerations.
These real-world constraints include the free space in a plant’s layout and in obstructions that can block communica-tions. Weather can also be a limiting factor. Rain, ice and snow all affect transmission error rates.
Area classification can also limit the use of wireless tech-nology. These restricted areas may include hazardous and cor-rosive environments, as well as remote, unmanned platforms. Some limitations may be due to incorrect perceptions. For ex-ample, even though batteries can last up to eight years, there is a persistent concern about unexpected failure.
The next wave of valve monitoring. Complete understanding of what is happening within the facility is a key point of the future industrial facility. Incremental sensors are the foundation for col-laborative applications and advanced process management.
Companies will increase the use of risk analysis to determine how much monitoring is required. Risk is defined as a function of the likelihood that an event will happen and the consequence or cost if it happens. This will drive an increase in monitoring and, therefore, the use of wireless technology.
An increase is also expected in wireless valve monitoring driven by companies trying to automate their processes and reduce labor. Some companies that currently operate remote plants (such as Shell’s Ormen Lange gas plant in Norway) are setting goals of operating and maintaining the plants with as few people as possible. To accomplish this, online condition-monitoring systems are employed to monitor virtually every-thing that moves in the plant, including pumps, compressors and valves (especially emergency shutdown valves). In Shell’s case, the goal is that 70% of the maintenance budget and spend-ing should be based on the result of condition monitoring, as opposed to reactive maintenance.3
In looking toward the future, it is important to understand when and why wireless monitoring technology is being used. The most common use is basic monitoring, where wireless is used to cut cable and other infrastructure costs. Diagnostics is the second reason, and it is becoming more popular as the importance of valve performance is understood. Control is the third reason; the technology can be used to control valve posi-tions, as well as for monitoring and diagnosis.
However, the acceptance of wireless technology for control is limited due to safety, security and power concerns. There is a limit to the amount of power available at the valve to move a solenoid. The industry has developed ultra-low-power solenoid technology to control the valve position, but this technology is not available for 100% duty cycle.
Open standards are gaining share and are likely to dominate in the future, allowing a single wireless and asset-management solution for instrumentation, actuators and positioners. Another technology that cannot be ruled out is WiFi. As companies ex-tend their WiFi networks, and as suppliers add WiFi capabilities to their actuators, this technology may become more popular.
Takeaway. The demand for valve-position monitoring in industrial plants is driven by the need for greater efficiency and increasing safety and environmental requirements, although traditional wired monitoring systems are expensive to install, maintain and expand. The result is that relatively few facilities benefit from the advantages of monitoring. Only 10% of possible monitoring instrumentation may actually be installed.
Wireless systems transmit data over the air, eliminating the costs and constraints of wired systems that have limited the use of valve monitoring. By extending monitoring to a much larger valve population, these systems set the stage for significant ef-ficiency improvements and new capabilities in safety and en-vironmental stewardship. These factors are fueling a growing interest in wireless systems and a general need to better under-stand the technology and how it can be applied.
ACKNOWLEDGMENTS/ LITERATURE CITEDAcknowledgments and Literature cited are available at HydrocarbonProcessing.com.
TITO SEQUEIRA is the global marketing manager for midstream and downstream at Pentair Valves & Controls. He is responsible for the strategy and marketing mix required to serve these global markets. Mr. Sequeira has experience in product management as well as in industry marketing for the power, refining, LNG, pipeline and petrochemical segments. He has provided strategic leadership to pursue business opportunities in these industries for leading valve and control manufacturers. Mr. Sequeira holds a BS degree in industrial engineering from the Monterrey Institute of Technology in Mexico and an MBA degree from Yale University. He has six years of experience in the valve industry.

Select 90 at www.HydrocarbonProcessing.com/RS

SPONSORED CONTENT HYDROCARBON PROCESSING | VALVES 2013 V-89
CURTISS-WRIGHT FLOW CONTROL COMPANY
CRITICAL SERVICE EQUIPMENT FOR DELAYED COKING AND FLUID CATALYTIC CRACKING
As part of the Curtiss-Wright Flow Control family of businesses in the oil and gas industry, DeltaValve and TapcoEnpro are known as innovators of reliable, critical service equipment.
DELTAVALVEDeltaValve is committed to providing world-class industrial products
and services for our global network of customers. We are a world leader in flow-control technology, specializing in the design, engineering, and manufacturing of critical-service industrial valves and related equipment for the delayed coker.
Our flagship product, the DeltaGuard® coke drum unheading valve, revolutionized the way refiners did coke drum unheading making a huge technological leap from traditional manual coke drum unheading systems. Today, the DeltaGuard coke drum unheading valves are the global standard in safe and reliable coke drum unheading. The DeltaGuard is available for both the bottom and the top of a coke drum, and is available with either hydraulic or electric actuation.
To further facilitate safe coke drum unheading, and to reduce coke drum stress fatigue, DeltaValve has recently introduced the world’s first center-feed injection device. This injection system directs resid up the center of the coke drum—similar to traditional center-feed systems previous to the development of fully automated unheading. Studies have shown a significant reduction in thermal fatigue to the coke drum using the center-feed process, in addition to a reduction in coke drum hot spots and top head blowouts.
Other DeltaValve products include complete hydraulics and controls systems, bi-directional flow control isolation valves which are fully in-line repairable, auto-switch coke boring/cutting tools, a drill stem guide and blowout diverter, and other related equipment.
TAPCOENPROFor more than 50 years, TapcoEnpro has provided critical path Fluid
Catalytic Cracking (FCC) equipment and boasts a worldwide installed base of FCC valves, actuators, and hydraulic power units. This industry-wide trust stems from our ability to design and manufacture equipment rugged and reliable enough to withstand the harsh environments and processes of refining and petrochemicals.
TapcoEnpro has developed numerous “industry first” FCC valve technologies and hold multiple patents for critical hardware. We have products installed and in operation worldwide including both hot and cold shell FCC slide valves, expander butterfly control valves, flue gas diverter valves, fractionation column isolation valves, catalyst removal valves, FCC plug valves and ethylene de-coke valves, and specialized actuator and control systems for all of the valve packages.
With an emphasis on safety, quality and on-time completion, we also provide a competent and reliable aftermarket and field service group handling the needs of customers throughout the world. Our field services department oversees equipment installations, commissions, maintenance/repair, and onsite training for all TapcoEnpro valve and control systems.
CONTACT INFORMATION527 West 38th StreetHouston, Texas [email protected]
DeltaValve’s Coke Drum Bottom Unheading Valve
TapcoEnpro’s High Performance Butterfly Valve

If safety valves could talk...
Silent sentinels. Until now, PRV’s have been difficult and expensive to monitor allow-
ing associated overpressure events to go undetected. What modern processing
plants need are PRVs with a voice. Farris Engineering is proud to introduce the first
wireless monitored relief valve, SmartPRV.
SmartPRV technology provides feedback using a Fisher® wireless position moni-
tor for every PRV discharge. Plants can now accurately record and estimate
costs related to overpressure events. Your facility, accurately monitored and safer.
SmartPRV is part of Farris’ Total Pressure Relief Management Solutions. Please
contact your local Farris representative or FAST Center to learn more today.
Learn more at farris.cwfc.com
Farris SmartPRV™ gives
pressure relief valves a voice.
Select 56 at www.HydrocarbonProcessing.com/RS
SPONSORED CONTENT HYDROCARBON PROCESSING | VALVES 2013 V-91
FARRIS ENGINEERING
FARRIS’ SMARTPRV™ GIVES VALVES A VOICE
A HISTORY OF INNOVATIONFarris Engineering, a business unit of Curtiss-Wright Flow Control
Company, is celebrating 70 years of innovation and manufacturing excellence in 2013. Farris has a legacy of providing unique pressure relief solutions starting with the balanced bellows pressure relief valve (PRV) design. Introduced in the 1950s, the balanced bellows mitigated the effects of back pressure and chemical erosion on internal valve com-ponents. The balanced bellows remains a standard feature used in PRVs to this day. In the 1980s, Farris introduced SizeMaster, the original PRV sizing software. SizeMaster automated and simplified the complex pro-cess of sizing and selecting PRVs and is the foundation for our patented iPRSM™ software. Farris manufactures a complete line of spring loaded and pilot operated relief valves, servicing refining and hydrocarbon processing facilities. Farris has earned its reputation as “the First Line of Safety” providing automatic and positive protection against overpressure situations in thousands of industrial facilities around the world.
SMARTPRV™ VALVE MONITORING SOLUTIONIn processing plants, overpressure events are unpredictable and often
go unnoticed. Traditional PRV monitoring solutions such as limit switches and other wired technologies have experienced limited success due to difficult and expensive implementations. This has left processing facilities unable to monitor PRVs and unable to estimate amount of product being released. Farris, in partnership with Emerson Process Management, now offers the SmartPRV, a 2600 bellows design pressure relief valve equipped with a Fisher® 4320 wireless position monitor. SmartPRV is a simple, powerful solution providing plants with the ability to track and monitor valves in real time, providing immediate feedback during an overpressure event. Feedback includes the time and duration of an event which allows plants to more accurately estimate overpressure releases.
Plants can achieve next generation emission reporting by leveraging the technology of SmartPRV with Farris Engineering Services powerful iPRSM™ software. iPRSM, a powerful engineering calculation and docu-ment repository tool can use SmartPRV’s time stamp data to accurately calculate the volume of discharge from an overpressure event. iPRSM also automatically generates the documentation and reports needed in emission reporting. In addition, iPRSM can be used to diagnose the cause of the overpressure scenario and provide actions toward mitiga-tion. iPRSM is an elegant alternative to the arduous task of manual calculations for long term emissions management.
BEYOND THE VALVEWith Farris, a trustworthy valve is only part of our promise. Farris
provides customers with total pressure relief management solutions that support a facility’s entire lifecycle, transforming the way you ensure plant safety:
Design—Using the power of iPRSM technology and our Farris Engi-neering Services team, correctly design your pressure relief system to respond to every overpressure scenario.
Build—Equip your plant with Farris’ full line of spring loaded and pilot operated PRV hardware, knowing your plant is protected by 70 years of manufacturing experience.
Monitor—Monitor your pressure relief valves with the SmartPRV™ and leverage the technology of proven leaders, Farris and Emerson.
Maintain—Localized aftermarket service and repair assistance through the Farris Authorized Service Team—or “FAST” Centers.
Audit—Our Farris Engineering Services team and iPRSM technology will keep your pressure relief systems audited and in compliance.
CONTACT INFORMATION10195 Brecksville Road, Brecksville, OH 44141 USATelephone: 440-838-7690Fax: [email protected]://farris.cwfc.com
Design
Maintain
Audit
Build
Monitor
Farris Pressure Relief
ManagementSolutions

V-92 VALVES 2013 | HydrocarbonProcessing.com SPONSORED CONTENT
OHL GUTERMUTH
OHL Gutermuth—superior quality based on experience! OHL Guter-muth provides valves with nominal diameters of up to DN 4,000, that can withstand pressures of 200 bar or more and temperatures ranging
from –196°C to +1,300°C. OHL Gutermuth shut-off valves, butterfly control valves and customized valves are used in the chemical industry, environmental technology, plant engineering and construction, and natural gas and refinery gas desulfurization plants.
Decades of experience in the development and manufacture of industrial valves offer OHL Gutermuth customers the certainty that they receive a product that is specifically tailored and manufactured to their needs and requirements. OHL Gutermuth provides individual advice and consulting to its customers from the start. All manufacturing activity starts with the customer’s request and the required solution to the problem. In addition, all products have been certified under the Russian GOST and RTN standards and officially licensed for use by Gazprom.
TAILOR-MADE VALVES FOR SPECIFIC INDUSTRIAL APPLICATIONS
Select 158 at www.HydrocarbonProcessing.com/RS
CONTACT INFORMATIONHelmershäuser Straße 9+12, 63674 Altenstadt/GermanyPhone: +49 6047.8006-0Fax: +49 [email protected]

SPONSORED CONTENT HYDROCARBON PROCESSING | VALVES 2013 V-93
ONIS
Onis Line Blinds replace spectacle blinds, slip blinds, and figure-8 blinds with an inline blind that can be operated by one person, in a few minutes without using any tools. Onis Blinds provide 100% POSlTIVE ISOLATION by an operator in minutes. Onis has been in operation for over 34 years, and the manufacturing facility (Lambesc, France} is ISO 9001-2008 certified. Each Onis Blind is custom built to the specific data for each application.
ADVANTAGES OF ONIS BLINDS:• Increase production time• Reduce plant maintenance costs• Operators can blind lines anytime• Improve safety by reducing exposure time• Reduce emissions during blinding• Gaskets can be changed without opening the line• Zero tools or cranes needed to blind• Can be automated (operated from control room)
WHERE ONIS BLINDS ARE USEDOnis Blinds are currently used in refineries, chemical plants, pipelines,
and compression stations. The Onis Blind can be used in any service (i.e. H2S, Nitrogen, Decoke/Feed lines, diesel, natural gas, benzine, chlorine, HCN, and more). Onis Blinds can be used to isolate reactors, heaters, pumps, compressors, and furnaces. Onis Blinds are used in offshore appli-cations and their minimal operation time offer many advantages.
ONIS SPECIFICSOnis Blinds physically spread the pipe while centering the slide gate
and permitting its movement without any risks of damages for the gaskets during the operation There are only 4 gaskets on the slide and zero internal gaskets (backseat) or moving parts that could be hard to change in the field. The advantage of this feature is that all gaskets can be inspected, and changed if needed, without opening the line. When the line is blinded, the full-bore gaskets are accessible and available to easily change and provide a new seat when the line is returned to service.
All Onis moving parts are outside of the process, and there is no reduc-tion of flow from the pipe and no place for product build-up. The bodies of Onis blinds are made from solid forgings and are not welded flanges. Onis offers a manufacturer’s one year warranty (additional upon request). Installation support and on-site training for operators and maintenance personnel are available.
HOW ONIS BLINDS WORKFor all Onis Line Blinds, the pipe separation is performed the exact same
way as spreading pipes when preparing to swing a figure-8. With an Onis Blind, the effort by the operator is minimal thanks to a powerful lever-arm developed by the ONIS mechanism that enables it to move a great deal of weight, even large diameter pipe. The pipe must be depressurized, as the Onis Blind is not a valve. A lever (or a gearbox, depending on size/pressure/temperature) is turned; the forged Onis bodies are separated and the pipe is spread. The slide is moved on rollers from the full-bore to blinded position. The lever (or gearbox) is closed to recompress the bodies.
PRODUCTION RANGE:• Sizes: 1/2” to 50”·• 150# to 2500# Flanges• Pressure: Vacuum to 6100 psig• Temperature: –152°F to 1400°F• Onis FCCU Blinds, Onis Quick Filter, and Twin Onis Blinds• Onis Blinds are custom built to customers’ requirements:ASME Section VIII Div-1, B 16.5, B16.48, B31.3, NACE, AP-607
WHO USES ONIS BLINDSOnis Blinds are currently used by ExxonMobil, Shell, BP,
ConocoPhillips, Petrobras, Pemex, General Electric, DuPont, Lyondell-Basell, Certainteed, Dow, Total, Chevron, Honeywell, PetroChina, BASF and many more.
Thank you for considering Onis Line Blinds
CONTACT INFORMATIONOnis lnc., One Riverway, Suite 1700, Houston, Texas, 77056Phone: 713-840-6377, Fax: 832-201-7767Email: [email protected]: www.onislineblind.com
Corporate Headquarters and Manufacturing:Onis France1 Avenue Fernand Julien, ZA de Berthoire, 13410 Lambesc FrancePhone: 33 [0)442929320, Fox: 33 [0)442927352Email: [email protected]
ONIS LINE BLINDS BETTER THAN CLASS VI;100% ISOLATION. SAFE. FAST. RELIABLE.
Line Blinds

24Hr Safety, LLC Reader Service 300
A&L ValveReader Service 301
Access Plug Flange, IncReader Service 302
Altair StricklandReader Service 303
BD Energy Systems, LLCReader Service 304
Brand Energy and Infrastructure ServicesReader Service 305
Calculated ControlsReader Service 306
Curtiss Wright Flow ControlReader Service 307
Curtiss Wright Flow Control, DeltaValveReader Service 308)
Curtiss Wright Flow Control, EST GroupReader Service 311
Curtiss Wright Flow Control, Farris EngineeringReader Service 313
Diamond Refractory ServicesReader Service 309
Ecodyne Heat ExchangersReader Service 310
FabEnCo, IncReader Service 312
Flare Ignitors Pipeline & Refi nery LLCReader Service 314
FourQuest EnergyReader Service 315
GSDReader Service 316
HoneywellReader Service 317
Hunter Buildings Reader Service 328
Industrial Insulation GroupReader Service 318
Jayne IndustriesReader Service 319
Jonell Rental Services Reader Service 321
Jonell, Inc JCIReader Service 320
Kap Pro ServicesReader Service 322
L.A. TurbineReader Service 323
Scott SafetyReader Service 324
Tiger Tower ServicesReader Service 325
Turnaround Welding ServicesReader Service 326
USA IndustriesReader Service 327
Published by:
The companies below off er a wide variety of services and equipment to the US Gulf Coast refi ning, petrochemical and gas processing markets. You will fi nd their complete listings in the 2013 Gulf Coast Turnaround and Maintenance Services Directory, published by Hydrocarbon Processing.
You can contact these companies by going to www.HydrocarbonProcessing.com/RS, following the instructions on the screen and using the Reader Service numbers below.
www.HydrocarbonProcessing.com/RS
™

HydrocarbonProcessing.com | JUNE 2013
®
PROCESS/PLANT
OPTIMIZATION
Automation and new technologies
provide means to increase
profitability and reliability
ENERGY EFFICIENCY
Better heat integration
of hot and cold streams
reduce operating costs
INDIA/IRPC PREVIEW
A closer look at India’s
hydrocarbon resources
and energy potential
ON
PR
OC
ESS
ING
JU
NE
20
13
PRO
CESS/PLAN
T OPTIM
IZATION
INTER
NATIO
NAL
Discover all the benefi ts of being a premium subscriber and gain full access to HydrocarbonProcessing.com
ARE YOU TAKING FULL ADVANTAGE OF HYDROCARBON PROCESSING?
Subscriber Only Benefi tsA subscription includes twelve monthly issues in print or digital format and premium access to HydrocarbonProcessing.com, where you will fi nd:
• All the latest issues and Process Handbooks
• HP’s extensive archive containing 10 years of back issues
• A subject/author index of print articles with links to articles available online
• Monthly e-newsletters providing an early preview of upcoming special editorial features and exclusive content.
Published since 1922, Hydrocarbon Processing provides operational and technical information to improve plant reliability, profi tability, safety and end-product quality. The editors of Hydrocarbon Processing bring you fi rst-hand knowledge on the latest advances in technologies and technical articles to help you do your job more effectively.
Subscribe Today!Log on to HydrocarbonProcessing.com or call +1 (713) 520-4440.

MARKETPLACE / [email protected] / +1 (972) 816-3534
96�JULY 2013 | HydrocarbonProcessing.com
Specialty Engineering–Static Equipment–Rotating EquipmentMetallurgical and
Materials LabField Service
Specialists in design, failure analysis, and troubleshooting of
static and rotating equipment
www.knighthawk.com
Houston, exasel:
Fax:
Select 202 at www.HydrocarbonProcessing.com/RS
Select 201 at www.HydrocarbonProcessing.com/RS
SURPLUS GAS PROCESSING/REFINING EQUIPMENT 25 MMCFD x 1100 PSIG PROPAK REFRIGERATION PLANT
28 TPD SELECTOX SULFUR RECOVERY UNIT1100 BPD LPG CONTACTOR x 7.5 GPM CAUSTIC REGEN
NGL/LPG PLANTS: 10–600 MMCFDAMINE PLANTS: 60–3300 GPMSULFUR PLANTS: 10–180 TPD
FRACTIONATION: 1000–25,000 BPDHELIUM RECOVERY: 75 & 80 MMCFD
NITROGEN REJECTION: 25–100 MMCFDMANY OTHER REFINING/GAS PROCESSING UNITSWe offer engineered surplus equipment solutions.
Bexar Energy Holdings, Inc.Phone 210-342-7106 Fax 210-223-0018
www.bexarenergy.com Email: [email protected]
Select 204 at www.HydrocarbonProcessing.com/RS
Select 203 at www.HydrocarbonProcessing.com/RS
New Version! Now includes Plate Fin Exchangers. For the designer or operator in the petroleum and chemical industry. Using over 40 years of design and operating experience by the author, the program calculates units that enable the inexperienced technical user to determine accurate design or evaluate operations. For the design and evaluation of process equipment:
Air, water, steam and amine properties;
and/or vents;
(MEA/DEA/MDEA/DGA);
and rating;
calculations);
Price: $3,295
programs written in Basic and three
reservoir engineering programs are linked
menus. However, each program is self-
contained and can be used independently.
for their usefulness in day-to-day operations
that fall into six main categories:
comprehensive user manual.
Author: M.A. Mian
Price: $250
SOFTWARE VIDEO BOOKS
*Applicable tax, shipping and handling apply
Visit our website to see all that Gulf Publishing Company offers
www.GulfPub.comPhone: +1 713-520-4426Email: [email protected]
PROCESS TOOLSSimulations and Design Calculations for the Petro-chemical Processing Industry
PEPAC 1Reservoir Engineering Programs and Economic Evaluation Spreadsheets
PRaS
Call 972-816-3534 for details about
Hydrocarbon
Processing’s
Marketplace

MARKETPLACE / [email protected] / +1 (972) 816-3534
Hydrocarbon Processing | JULY 2013 97
Flex Live®Turbomachinery Performance Monitoring Software
• Maximize Plant Capacity• Con rm OEM guarantees for:
• New Equipment• Upgrades & Rerates
• “See” Where Equipment is Operating• Flow, Head & Ef ciency vs. OEM Curve• Surge & Choke Margin• BWR Accuracy• Historical Data Aids Maintenance Scheduling
www. exwareinc.comsales@ exwareinc.com
1-724-527-3911
Select 205 at www.HydrocarbonProcessing.com/RS
Select 206 at www.HydrocarbonProcessing.com/RS
CUSTOM
REPRINTS
For additional information, please contact
Foster Printing Service, the official reprint
provider for Hydrocarbon Processing.
Give yourself a competitive
advantage with reprints.
Call us today!
Call 866-879-9144
Take advantage of
your editorial exposure.
REPRINTS ARE IDEAL FOR:
Product announcements
Sales aid for your field force
PR materials and media kits
Direct mail enclosures
Trade shows
Conferences

MARKETPLACE / [email protected] / +1 (972) 816-3534
98�JULY 2013 | HydrocarbonProcessing.com
SPECIALIZE IN BASIC DESIGN/REVAMPING*
• Ammonia Plants • Methanol/H2-CO Plants• Re-rating Primary Reformers• Propane Dehydrogenation Plants• Acrylic Acid & Oxo-Alcohol Plants
KPI, Inc., Houston, Texas-USA; Mail: [email protected]: 281-773-1629; Fax: 832-565-9360; Web: www.kpieng.com
Providing Value through Process Expertise
* Including Process Design, Technology Evaluation,
Simulation Modeling, Troubleshooting, Revamp studies,
Project Cost Estimates & Customized Process Training
Kinetics Process Improvements
Select 207 at www.HydrocarbonProcessing.com/RS
WABASH SELLS & RENTSBOILERS & DIESEL GENERATORSFAST EMERGENCY SERVICE
www.wabashpower.com800-704-2002
FAX: 847-541-1279 847-541-5600
Select 208 at www.HydrocarbonProcessing.com/RS
Detailed and up-to-date information for active construction projects in the refining, gas processing, and petrochemical industries across the globe | ConstructionBoxscore.com
Why Should You Filter Your Water?
The Best Engineered Water Filteration Solution Always Costs Less
Select 210 at www.HydrocarbonProcessing.com/RS
Visit HydrocarbonProcessing.com
HP113
Select 209 at www.HydrocarbonProcessing.com/RS
Certifi edSafety provides third-party safety services to chemical, petro-
chemical, refi ning, power and related industries. We are looking for dedicated
safety advisors including: managers, planners, auditors and support person-nel. Compensation is excellent as are benefi ts. Our fast growing company
offers many opportunities for advance-ment with locations in Benicia, CA; League City, TX; and Whiting, IN.
Visit our website for contact information: www.certifi edsafety.net
Bridging the Gap Between Safety and Productivity
Select 211 at www.HydrocarbonProcessing.com/RS

Veolia offers Aquamove™ mobile water
treatment services for the hydrocarbon
processing industry. The Aquamove
ACTIFLO® Turbo trailer provides mobile,
compact clarification for temporary or
supplemental wastewater or process water
operations. Its small footprint allows plants
to maximize capacity while minimizing
energy consumption.
Ideal for pilot testing, maintenance
outages, or equipment breakdowns,
Aquamove applications include
clarification, softening, filtration,
reverse osmosis, and specialty ion
exchange.
r
ce
s,
e
,
Service|Value
| Responsib
ility
We Know Water
Veolia Water Solutions & Technologies provides technical expertise through
mobile water treatment solutionsas well as design, supply and operating capabilities for permanent raw water pretreatment, process water production, and wastewater treatment.
www.veoliawaterstna.com/mobilesolutions [email protected]
Select 87 at www.HydrocarbonProcessing.com/RS

100�JULY 2013 | HydrocarbonProcessing.com
ADVERTISER INDEX / HydrocarbonProcessing.com
The first number after the company name is the page on which an advertisement appears. The second number, appearing in parentheses, after the company name, is the Reader Service Number. There are two ways readers can obtain product and service information:
1. Go to www.HydrocarbonProcessing.com/RS. Follow the instructions on the screen, and your request will be forwarded for immediate action.
2. Go online to the advertiser's Website listed below.
Company Page RS# Website
Company Page RS# Website
Company Page RS# Website
Altair Strickland ....................................................... 60 (75)www.info.hotims.com/45681-75
Ametek Process Instruments ..................................... 70 (57)www.info.hotims.com/45681-57
Axens .....................................................................104 (51)www.info.hotims.com/45681-51
BASF Corporation ..................................................... 29 (70)www.info.hotims.com/45681-70
Belco Technologies ...................................................41 (97)www.info.hotims.com/45681-97
BiLFINGER Water Technologies ................................... 15 (88)www.info.hotims.com/45681-88
Burckhardt Compression AG .......................................19 (79)www.info.hotims.com/45681-79
Carver Pump Company ............................................. 20 (153)www.info.hotims.com/45681-153
Certified Safety ........................................................ 46 (86)www.info.hotims.com/45681-86
Cudd Energy Services ................................................81 (157)www.info.hotims.com/45681-157
Curtiss Wright Flow Control Company, DeltaValve ....... 42 (67)www.info.hotims.com/45681-67
Curtiss Wright Flow Control Company .....................V-88 (90)www.info.hotims.com/45681-90
Curtiss Wright Flow Control Company, Farris Engineeering ...........................................V-90 (56)www.info.hotims.com/45681-56
DuPont Clean Technologies ........................................14 (152)www.info.hotims.com/45681-152
Eltherm GmbH ..........................................................74 (159)www.info.hotims.com/45681-159
Emerson Process Management (Fisher) ......................10 Flexitallic LP .............................................................. 5 (93)
www.info.hotims.com/45681-93Foster Wheeler ........................................................ 82 (62)
www.info.hotims.com/45681-62Gastech ................................................................... 84 GE Measurement & Control ......................................... 12 (151)
www.info.hotims.com/45681-151Gulf Publishing Company Boxscore Webcast ................................................... 28 Construction Boxscore........................................... 6–7 Events—GTL Technology Forum .......................... 21–24 Gulf Coast Turnaround Showcase ............................. 94 Heinz Bloch Webcast .......................................... 36, 50 Marketplace ..................................................... 96–98 Software .................................................................74 Subscriptions ......................................................... 95 Haldor Topsøe A/S .................................................... 56 (103)
www.info.hotims.com/45681-103HPI Project Managers ............................................... 64 (155)
www.info.hotims.com/45681-155Johnson Filtration Systems SAS .................................. 15 (88)
www.info.hotims.com/45681-88KBR ......................................................................... 34 (96)
www.info.hotims.com/45681-96Kobe Steel Ltd .......................................................... 65 (82)
www.info.hotims.com/45681-82Linde Process Plants ................................................ 103 (85)
www.info.hotims.com/45681-85Lurgi GmbH ..............................................................16 (101)
www.info.hotims.com/45681-101
Merichem Company .................................................. 66 (84)www.info.hotims.com/45681-84
OHL ...................................................................... V-92 (158)www.info.hotims.com/45681-158
Onis France ........................................................... V-93 OMI Industries ...........................................................75 (91)
www.info.hotims.com/45681-91Paharpur Cooling Towers, Ltd. ....................................32 (100)
www.info.hotims.com/45681-100PARCOL SpA ..............................................................35 (154)
www.info.hotims.com/45681-154Rentech Boiler System ................................................ 2 (52)
www.info.hotims.com/45681-52Sandvik Materials Technology ....................................76 (61)
www.info.hotims.com/45681-61Spraying Systems Co. ............................................... 30 (66)
www.info.hotims.com/45681-66Süd-Chemie............................................................. 26 (59)
www.info.hotims.com/45681-59ThyssenKrupp Uhde GmbH ........................................ 13 (81)
www.info.hotims.com/45681-81Trachte USA ............................................................. 68 (156)
www.info.hotims.com/45681-156UOP, A Honeywell Company .......................................37 Veolia Water Solutions & Technologies ....................... 99 (87)
www.info.hotims.com/45681-87ZymeFlow Decon Technology ....................................101 (92)
www.info.hotims.com/45681-92
Bret Ronk, PublisherPhone: +1 (713) 529-4301Fax: +1 (713) 520-4433E-mail: [email protected]
SALES OFFICES—NORTH AMERICA
IL, LA, MO, OK, TXJosh MayerPhone: +1 (972) 816-6745, Fax: +1 (972) 767-4442E-mail: [email protected]
AK, AL, AR, AZ, CA, CO, FL, GA, HI, IA, ID, IN,
KS, KY, MI, MN, MS, MT, ND, NE, NM, NV, OR,
SD, TN, TX, UT, WA, WI, WY,
WESTERN CANADA Diana Smith Phone/Fax: +1 (713) 520-4449Mobile: +1 (713) 670-6138E-mail: [email protected]
CT, DC, DE, MA, MD, ME, NC, NH, NJ, NY, OH,
PA, RI, SC, VA, VT, WV,
EASTERN CANADAMerrie LynchPhone: +1 (617) 357-8190, Fax: +1 (617) 357-8194Mobile: +1 (617) 594-4943E-mail: [email protected]
CLASSIFIED SALES
Gerry MayerPhone: +1 (972) 816-3534, Fax: +1 (972) 767-4442E-mail: [email protected]
DATA PRODUCTS
Lee NicholsPhone: +1 (713) 525-4626, Fax: +1 (713) 520-4433E-mail: [email protected]
SALES OFFICES—EUROPE
FRANCE, GREECE, NORTH AFRICA, MIDDLE EAST,
SPAIN, PORTUGAL, SOUTHERN
BELGIUM, LUXEMBOURG, SWITZERLAND,
GERMANY, AUSTRIA, TURKEYCatherine WatkinsTél.: +33 (0)1 30 47 92 51Fax: +33 (0)1 30 47 92 40E-mail: [email protected]
ITALY, EASTERN EUROPEFabio PotestáMediapoint & Communications SRLPhone: +39 (010) 570-4948Fax: +39 (010) 553-0088E-mail: [email protected]
RUSSIA/FSULilia FedotovaAnik International & Co. Ltd.Phone: +7 (495) 628-10-333E-mail: [email protected]
UNITED KINGDOM/SCANDINAVIA,
NORTHERN BELGIUM, THE NETHERLANDSMichael BrownPhone: +44 161 440 0854Mobile: +44 79866 34646E-mail: [email protected]
SALES OFFICES—OTHER AREAS
AUSTRALIA—PerthBrian ArnoldPhone: +61 (8) 9332-9839Fax: +61 (8) 9313-6442E-mail: [email protected]
CHINA—Hong KongIris YuenPhone: +86 13802701367, (China) Phone: +852 69185500, (Hong Kong)E-mail: [email protected]
BRAZIL—São PauloAlfred BilykPhone/Fax: 11 23 37 42 40Mobile: 11 85 86 52 59 E-mail: [email protected]
INDIAManav KanwarPhone: +91-22-2837 7070/71/72 Fax: +91-22-2822 2803Mobile: +91-98673 67374E-mail: [email protected]
INDONESIA, MALAYSIA, SINGAPORE,
THAILANDPeggy ThayPublicitas Singapore Pte LtdPhone: +65 6836-2272Fax: +65 6634-5231E-mail: [email protected]
JAPAN—TokyoYoshinori IkedaPacific Business Inc.Phone: +81 (3) 3661-6138Fax: +81 (3) 3661-6139E-mail: [email protected]
KOREAD. S. ChaiDongmyung Communications, Inc.Phone: +82 (2) 391 4254Fax: +82 (2) 391 4255E-mail: [email protected]
PAKISTAN—KarachiS. E. AhmedIntermedia CommunicationsPhone: +92 (21) 663-4795Fax: +92 (21) 663-4795
REPRINTS
Rhonda Brown, Foster Printing ServicePhone: +1 (866) 879-9144 ext. 194E-mail: [email protected]
This Index and procedure for securing additional information is provided as a service to Hydrocarbon Processing advertisers and a convenience to our readers. Gulf Publishing Company is not responsible for omissions or errors.

A Tristar Global Energy Solutions Company
WORLDWIDE DECON EXPERIENCE FLOWS THROUGH EVERY JOB.
Zyme-Flow® tough. From routine decontamination to heavy oil.
Proven in the toughest projects around the world, Zyme-Flow® is the most complete
single step, LELs and benzene are eliminated while H2®
®
Guaranteed. Vessel entry in 12 hours or less.
Worldwide Leader in Hydrocarbon Decontamination
For information please call 281.443.0300
Select 92 at www.HydrocarbonProcessing.com/RS

102�JULY 2013 | HydrocarbonProcessing.com
Engineering Case Histories
A. SOFRONAS, CONSULTING ENGINEER
http://mechanicalengineeringhelp.com
Case 73: Useful troubleshooting tools to keep at hand
Over the past 45 years, the author has pursued troubleshooting machinery and pressure vessels. It has also been the sub-ject of this column. The troubleshooting tools used in this endeavor have been analytical modeling, along with prob-lem-solving methods. When employed by large companies, I had open access to metallurgical laboratories, and I worked directly with very talented engineers and technicians of the company. When I re-tired and began a consulting practice, I no longer had access to those services and had to use contracted laboratories. To expedite model development for my clients, I purchased equipment that has allowed me to do a certain level of mate-rial evaluation with confidence.
Tools. A zoom stereo-microscope, up to 90 power, with photographic and mea-suring capability, has been extremely useful in my experiences. It can be used to examine materials, which have failed, and provide some basic understanding of how these parts failed. The results can help define the mode of failure.1–4 This can then be compared with the analytical model’s results. FIG. 1 represents a small bolt, under 14x magnification that failed. From the failure pattern, observations can be made that it cracked while tight-ening. More importantly, the results also show that the bolt didn’t fail immediately until it was retightened some time later.
FIG. 2 shows this same bolt under 90x magnification. While the surface is much more detailed, it is difficult to see the total failure pattern at the higher magni-fication. It would be useful for sizing a surface defect, such as a scratch or gouge, which may have started as a crack. “Beach marks,” also meaning fatigue or impact growth lines, would be easier to examine and measure. Such data could help verify a true failure cause.
Power loupe. A second valuable tool is a small fold-up 20-power loupe; it is similar to those used by jewelers. I keep one connected to my key chain. When in the field or with a client, there is always the need to examine a part very carefully and close up. You can’t easily carry a ste-reo-microscope in the field.
Hardness tester. A third useful tool is a hardness tester. This tool is very valu-able when doing a wear analysis or a quick test for material properties on metals and rubber. It saves time and eliminates send-ing materials to an outside laboratory.
Outside services. More detailed ex-aminations—such as for material com-positions and properties (e.g. strength or fracture toughness)—require the use of laboratories and scanning elec-tron microscopes, tensile machines, and trained laboratory technicians to con-
duct the testing. Determining corrosion mechanisms are best left to these mate-rial experts.
Vibration checks. For quick vibration data, I have used a handheld vibration measuring meter. It provides displace-ment, velocity and acceleration data, and it is easily transported. Any two of these measurements can be used to calculate the predominant harmonic frequency. The client company usually has vibra-tion and signature analysis equipment when detailed data is required. For walk-ing around a vibrating system to find the highest vibration and map the data, the handheld unit has worked well.1
Other items in a machinery and equipment consultant’s troubleshooting toolbox are stress, fluid flow, heat transfer and vibration analysis tools in the form of a general finite-element program.
While certainly not a complete list of troubleshooting tools, these listed devic-es have helped resolve the root cause of many complex system failures.
LITERATURE CITED 1 Sofronas, A., Case histories in vibration analysis and
metal fatigue for the practicing engineer, Wiley, 2012, p. 33.
2 Sofronas, A., Analytical troubleshooting of process machinery and pressure vessels, Wiley, 2006.
3 Dharbalt, L.G. ( Staff ), Identification of parts fail-ures, Deere & Co., 1999.
4 Wulpi, D. J., Understanding how components fail,ASM, 1999.
DR. TONY SOFRONAS,P.E., was worldwide lead mechanical engineer for ExxonMobil Chemicals before retiring. He now owns Engineered Products, which provides consulting and engineering seminars on machinery and pressure vessels. Dr. Sofronas has authored two engineering
books and numerous technical articles on analytical methods. Early in his career, he worked for General Electric and Bendix, and has extensive knowledge of design and failure analysis for various types of equipment.
FIG. 1. Bolt 14x.
FIG. 2. Bolt at 90x.

Select 85 at www.HydrocarbonProcessing.com/RS

Stimulate the heart of your hydroprocessing unit
www.axens.net
ImpulseTM, the catalyst technology that combines the stability you recognize with the activity you need
Select 51 at www.HydrocarbonProcessing.com/RS

FEATURES13 Nitrogen expansion cycle enhances flexibility of small-scale LNGJ. Pak
19 Surging hydrocarbons ushering an industrial renaissance in North AmericaP. Gunaseelan and M. Thundyli
25 Gas-driven hydraulic fracturing and drilling cut costs, reduce environmental impactP. Kulkarni
DEPARTMENTSGas Processing News ........................... 5New Products ..................................... 29
COLUMNSPublisher’s Letter .................................. 3
A wealth of opportunity in the “Golden Age of Gas”
Boxscore Construction Analysis ........ 7Global gas processing construction outlook—Part 1
Viewpoint .............................................. 11Update on global natural gas and LNG markets
Technology and Business Informationfor the Global Gas Processing Industry
GasProcessingNews.com | JULY 2013
Special Supplement to
Photo: Shell and Qatar Petroleum’s Pearl GTL plant at night. Image courtesy of Shell/Qatar Petroleum.

Mission CriticalEquipment
chart-ec.com
Brazed Aluminum Heat Exchangers, Cold Boxes, Air Cooled Heat Exchangers – at the heart of gas processing

Gas Processing | JULY 2013 3
A wealth of opportunity in the “Golden Age of Gas”JOHN T. ROYALL
President and CEO, Gulf Publishing Company
PUBLISHER'S LETTER
JOHN T. ROYALL is President and Chief Executive Officer of Gulf Publishing Company. Mr. Royall has extensive experience in business-to-business media and events, including 25 years in business publishing. A graduate of the University of Texas, and with graduate work at George Washington University and the University of Munich, he held executive positions at Reed Elsevier before joining Gulf as President and CEO in 2009. Mr. Royall is a member of the Executive Committee of the American Fuels and Petrochemical Manufacturers Association(AFPM) and the Independent Petroleum Association of America, and he serves on a number of boards, including the Education Committee of IPAA/PESA and the Oilfield Christian Fellowship.
Thanks to horizontal drilling and multi-stage fracing, the US is now neck-and-neck with Russia for the world’s number-one producer. In addition to developments in the US, substantial new natural gas discoveries, including those in the North West Shelf of Aus-tralia, East Africa and the Eastern Medi-terranean, mean that the world has an abundant, a clean, and—depending on where you live—a relatively inexpensive energy source.
Abundant supply is driving two ma-jor industry trends. As more natural gas is used as an energy source and as a feedstock, the demand for transport, storage and processing will increase dra-matically. At Gulf Publishing Company, we track gas processing projects through Hydrocarbon Processing’s Construction Boxscore Database. We have seen an increase of 39% in new gas processing projects in the US in the last year alone. This is a substantial trend, and one we believe will continue with year-on-year increases for the next five years of 10%/year or more.
The second trend we see is in innova-tive uses of gas. As gas has become more abundant and the price has dropped, we have seen companies deploy natural gas for new and pioneering uses. Natural gas is taking the place of crude as a feedstock for petrochemicals production. Major new GTL plants are planned for the first time in the US. Also, mini-GTL plants and micro-LNG units are being moved to production sites, both onshore and offshore. We have seen mini-GTLs be-ing used at drilling sites and on FPSOs, as well as micro-LNG units and dual-fu-el engines at drilling sites to power rigs and pressure pumping equipment.
This time in the energy industry has been called “The Golden Age of Gas.” What that means for our industry is the number, size and scope of projects will
grow. That’s good for all of us. Just as im-portant and good for our industry is that innovation in the use of this God-given natural resource will provide efficien-cies throughout exploration, produc-tion, processing and transportation.
As we do with our other publications, World Oil and Hydrocarbon Processing , Gas Processing will provide you with in-formation on practical technology and trends to keep you informed and help you do your job better.
This inaugural issue of Gas Process-ing pursues those ends with features on the global gas processing construction outlook by Lee Nichols of Gulf Pub-lishing Company, a discussion of LNG supply and demand by Nelly Mikhael of FACTS Global Energy, an article on technologies for small-scale LNG by Jo-seph Pak of Cosmodyne, and a discus-sion of shale trends from Vantage Point Energy. In addition, Pramod Kulkarni, editor of World Oil, offers an article on the innovative use of natural gas for drilling and fracturing operations.
The “Golden Age of Gas” spans the upstream, midstream and downstream, and therefore does not fit neatly into the categories under which Gulf Pub-lishing Company has delivered content to the oil and gas industry for the past 100 years. So, we created new media to serve the increasingly important gas processing industry. Gas Process-ing will be published quarterly in 2013 and six times in 2014. In July 2013, we will introduce www.gasprocessingnews.com, which will house news, articles, resources, and our database of gas pro-cessing projects.
Please let us know what you think of this new information resource and how we can tailor it to help you, the gas processing industry professional. I hope that this issue is the first step in a long and prosperous journey. GP

Commercially Proven Route for the Production of Gasoline through Methanol Synthesis and Conversion
ExxonMobil Research and Engineering Company’s Methanol to Gasoline (MTG) Technology, was commercially operated in New Zealand for over 10 years. Now we offer the second generation MTG technology which provides:
• Sulphur-free low benzene gasoline• A product fully compatible with refinery gasoline• Simple, reliable fixed bed reactor design
So Advanced,Yet So Simple.

Gas Processing | JULY 2013 5
GAS PROCESSING NEWSM. CRUTHIRDS, News Editor
Kinder Morgan to expand capacity on Sweeny pipelineKinder Morgan Energy
Partners LP has entered into a long-term contract to support the expansion of its Sweeny Lateral pipeline, which the company is building from the Kinder Morgan crude/condensate pipeline to Phillip 66’s Sweeny Refinery in Brazoria County, Texas.
The expansion will increase capacity on the 27-mile, 12-in.-diameter, lateral pipeline from an initial 30,000 barrels per day (bpd) to 100,000 bpd. Kinder Morgan will add new pumps and an additional 120,000-bbl storage
tank at its Wharton Pump Station in Wharton County, Texas, and increase truck offload capabilities at its DeWitt Station in DeWitt County, Texas, to facilitate the increase in capacity.
Kinder Morgan’s crude/condensate pipeline, which came into service in June 2012, transports crude and condensate from the Eagle Ford shale to the Houston Ship Channel through 65 miles of newbuild construction and 113 miles of converted natural gas pipeline.
KMEP completes acquisition of Copano Energy
Kinder Morgan Energy Partners (KMEP) LP has closed on its acquisi-tion of Houston, Texas-based Copano Energy LLC. KMEP has acquired all of Copano’s outstanding units for a total purchase price of approxi-mately $5 billion, including the assumption of debt.
The transaction, which was approved by Copano shareholders and the boards of directors of both companies, is a 100% unit-for-unit trans-action with an exchange ratio of 0.4563 KMEP units per Copano unit.
With operations primarily in Texas, Oklahoma and Wyoming, Copano provides comprehensive services to natural gas producers, including gas gathering, processing and treating, and NGLs fractionation. It owns interests in, or operates, almost 7,000 miles of pipelines with 2.7 billion cubic feet per day (Bcfd) of gas throughput capacity, along with nine processing plants with more than 1 Bcfd of processing capacity and 315 MMcfd of treating capacity.
Wood Group Kenny wins FLNG subsea project
GDF SUEZ Bonaparte Pty Ltd. (GDF SUEZ), operator of the Bonaparte LNG project in Australia, has awarded Wood Group Kenny (WGK) a contract for a multi-million-dollar pre-FEED subsea concept definition study for the Bonaparte LNG project.
The project is GDF SUEZ’s first LNG venture in Australia, and it will give the company a greater foothold in Asian-Pacific gas markets. The Bonaparte LNG project is made up of the Petrel, Frigate and Tern fields, located in the Timor Sea. These were previously stranded gas fields, although recent technology advances and innovation mean these fields are now more economically viable to develop.
The key to unlocking this gas is floating liquefied natural gas (FLNG). This technology represents a new emerging market for the oil and gas industry, with the Asian-Pacific region in the driving seat for production.
Presently, there are no operational FLNG facilities in the world. However, in recent years, a number of FLNG projects have been proposed and are now under development in Australia. WGK is at the forefront of Australia’s latest subsea and pipeline projects and has been the engineering partner of choice for world-class developments such as the Prelude, Equus, Pluto, Browse, Ichthys, Gorgon, Julimar and Macedon projects, all of which are located on the Australian North West Shelf (NWS) and in the Timor Sea.
The Bonaparte LNG project represents a strategically important contract award for WGK, as the company is a new client developing its first FLNG project in Australian waters. The subsea concept definition study will be executed by WGK’s Australian team located in Perth, Western Australia.
MarkWest acquires Chesapeake midstream assets
MarkWest Energy Partners LP has executed definitive agree-ments to acquire 100% of the ownership interests of certain midstream assets in the Anadarko Basin from a wholly-owned subsidiary of Chesapeake Energy Corp., for $245 million in cash.
The acquired assets consist of the 200-million-cubic-feet-per-day (MMcfd) cryogenic Buffalo Creek gas processing plant and 22 miles of gas gathering pipeline in Hemphill County, Texas, along with approximately 30 miles of rights-of-way associated with the future construction of a high-pressure trunkline.
Additional assets consist of an amine treating facility and a five-mile gas gathering pipeline in Washita County, Oklahoma. The high-recovery Buffalo Creek plant and associated trunkline are under construction and are expected to come into service in early 2014. Producing formations in the Anadarko Basin associ-ated with these assets include the prolific Granite Wash and Hogshooter formations, and other liquids-rich zones.
In conjunction with the acquisition, MarkWest has executed long-term, fee-based agreements with Chesapeake for gas gathering, compression, treating and processing services. As part of the gas processing agreement, Chesapeake has dedicated approximately 130,000 acres throughout the Anadarko Basin. MarkWest anticipates initial gas volumes from Chesapeake of approximately 50 MMcfd, increas-ing to over 250 MMcfd by 2017.
To support Chesapeake’s drill-ing program, MarkWest anticipates additional capital investment of approximately $90 MM over the next five years for the comple-tion and expansion of associated infrastructure. The majority of the capital will be spent over the next two years to finalize construction of the Buffalo Creek plant and the high-pressure trunkline to connect various low-pressure gas gather-ing systems owned and operated by third parties.
Once completed, these assets will be synergistic with MarkWest’s existing operations in the Granite Wash Basin, which include gas gathering systems totaling 340 MMcfd of throughput capacity and the 235-MMcfd Arapaho gas processing complex in Custer County, Oklahoma.
Agreement announced to develop Eagle Ford midstream infrastructure
High Point Infrastructure Partners LLC, which controls the general partner of American Midstream Partners, has entered into a long-term, fee-based agreement to provide midstream services to a large, independent producer in the oil window of the Eagle Ford shale play in Gonzales County, Texas.
High Point has entered into this agreement through a wholly-owned subsidiary. Under the terms of the agreement, High Point will construct, own and operate full wellstream gathering, treating and processing infrastructure to gather and treat oil, natural gas and produced water.
The oil and gas will be treated and processed at a centralized facility. Construction of the midstream facilities will begin in mid-2013, and the facility will commence initial operations in early 2014. When fully operational, the gathering pipeline and treating/processing facility will have capacities to handle approximately 95,000 bpd of oil and 15 MMcfd of natural gas.
The initial phase of the Eagle Ford project will be developed by High Point. High Point has granted American Midstream a right of first offer with respect to the agreement and the associated facilities; upon completion of the initial phase, High Point intends to offer the assets to American Midstream.

6�JULY 2013 | GasProcessingNews.com
GAS PROCESSING NEWSM. CRUTHIRDS, News Editor
GDF SUEZ to become US LNG exporterThe company recently
announced the signing of a joint venture (JV) agreement with Sempra Energy, Mitsubishi and Mitsui for the development, financing and construction of the natural gas liquefaction project of Cameron LNG, a unit of Sempra Energy, in Louisiana.
Located at the site of the existing Sempra Energy LNG terminal in Hackberry, the facility will have three liquefaction trains with a capacity of 12 MM tons per year (MMtpy) of LNG and will be operated by Cameron LNG.
Under this JV agreement, GDF SUEZ, Mitsubishi and Mitsui will each acquire a 16.6% equity stake in the existing terminal and in the liquefaction project, with Sempra Energy retaining a 50.2% position.
Announced last year, GDF SUEZ has also signed a 20-year liquefaction service agreement with Sempra Energy. GDF SUEZ, Mitsubishi and Mitsui have subscribed the full capacity of the three-train facility. GDF SUEZ will have access to a capacity of 4 MMtpy of LNG, which will be exported to the group’s LNG markets.
The tolling and JV agreements are subject to a final investment decision by each party, to final permit authorizations, and to securing financing commitments, all of which are expected by early 2014, along with customary conditions precedent. The new LNG plant is expected to start operations in late 2017. Last year, Cameron LNG obtained approval from the US Department of Energy to export up to 12 MMtpy of domestically produced LNG to all countries with which the US has signed a Free Trade Agreement.
Ohio to open fi rst cryogenic gas processing plant
A new natural gas processing plant in eastern Ohio’s Utica shale play will soon begin operations, announced MarkWest Energy Partners LP. The plant, located at Cadiz in Harrison County, Ohio, is the first cryogenic plant of its kind in Ohio, said Frank Semple, MarkWest chairman, president and CEO, during a teleconference.
The plant is “one of the most important” facilities in Ohio for process-ing natural gas from the Utica shale, Mr. Semple said. It is included in the $1.8 billion of midstream projects planned by MarkWest in eastern Ohio.
Over the past year, Colorado-based MarkWest has built two large gas processing plants in the Utica shale, added 60 miles of pipelines and signed contracts with six major producers, including Gulfport Energy and Antero Resources. The $500 MM Cadiz plant is capable of handling about 125 MMcfd of natural gas. An addition to the Cadiz plant to handle 200 MMcfd of gas is expected to open in the second quarter of 2014. Meanwhile, MarkWest’s refrigeration unit at Cadiz, which commenced operations last autumn, can handle up to 60 MMcfd of gas.
The company is developing additional processing capacity at a separate processing plant near Summerfield in Noble County, Ohio. This plant’s first 200 MMcfd of capacity will come online by October 2013, with an additional 200 MMcfd of capacity being added before the end of the year. Another 200-MMcfd expansion is expected to begin operations in the second quarter of 2014. Pipelines for transporting natural gas liq-uids (NGLs) will connect the two plants in Harrison and Noble counties.
In the next year, MarkWest anticipates adding 200 miles of pipelines and expanding capacity to 800 MMcfd in the Utica shale.
MarkWest’s Ohio operations are a joint venture with the Energy and Minerals Group (EMG) to offer gathering, processing, fractionation and marketing services. The companies are also planning a fractionation facility in Harrison County that can handle up to 100,000 bpd of NGLs. The liquids will be separated, processed and shipped to markets.
MarkWest, also active in Pennsylvania and West Virginia, is presently processing 645 MMcfd of natural gas at four plants in the Utica and Marcellus shales.
Woodside, Shell sign agreement for Browse LNG
Woodside has entered into an agreement with Shell that outlines key principles for the development of Browse natural gas resources using Shell’s floating LNG technol-ogy. The agreement provides a framework that would enable the Browse JV to advance FLNG.
Woodside will immediately engage with the JV participants regarding the agreement, the extent of work on alternative development concepts and the obligations under the Browse retention leases.
Woodside CEO Peter Coleman said that FLNG had the potential to commercialize the Browse resources in the earliest possible time frame, and to further build the company’s longstanding relationship with Shell.
Woodside is the major equity holder and operator of the Browse JV, which aims to commercial-ize the venture’s three gas and condensate fields—Brecknock, Calliance and Torosa—which lie in the Indian Ocean, 425 km north of Broome in Western Australia.
These three fields are estimated to contain combined contingent volumes of 15.5 trillion cubic feet of dry gas, and 417 million barrels of condensate—a globally significant resource in a location that is expected to be one of Australia’s next major LNG production provinces.
Shell lays keel for world’s fi rst fl oating LNG project
Shell has laid the keel for Prelude FLNG, the world’s first floating liquefied natural gas (FLNG) project. When completed, Prelude is expected to be the largest offshore floating facility ever built. The hull will now be assembled in the dry dock, before the turret and the topsides are fit-ted at Samsung Heavy Industries’ Geoje shipyard in South Korea.
Large steel sections known as “blocks,” which will form the hull, are being manufactured in the Geoje shipyard, with more than 1,600 already complete. The 93-meter-high turret mooring system is under construction in Dubai and will be transported to Geoje in five parts. The turret will run vertically through one end of the facility, and will be anchored to the seabed by four groups of mooring lines. It will allow the facility to rotate with the direction of the wind.
Once complete, the 600,000-metric-ton facility will be almost half a kilometer (km) in length, which is longer than four soccer fields, and it will displace six times as much water as the largest aircraft carrier. It will be moored and hooked up to the undersea infrastructure, around 475 km northeast of Broome, Western Australia.
Despite its huge dimensions, the facility is only one-quarter the size of an equivalent plant on land. Shell’s technology has been adapted for floating LNG, and engineers have designed components that will stack verti-cally to save space. The cooling plant, for example, will be placed above the vast storage tanks that have a capacity equivalent to around 175 Olympic swimming pools. Specially designed tubes, known as risers, will draw 50 million liters of cold water from the ocean every hour to help cool the natural gas.
Shell is leading the delivery of this mega-project, working with long-term strategic partners Technip and Samsung Heavy Industries. Prelude is the first of what is expected to be multiple Shell FLNG projects. The expertise gained from the Prelude project will help develop potential future floating facilities.

Gas Processing | JULY 2013 7
Global gas processing construction outlook—Part 1L. NICHOLS, Director, Data Division
BOXSCORE CONSTRUCTION ANALYSIS
Natural gas is the world's fastest-growing fossil fuel. The US Energy Information Administration (EIA) forecasts that global gas consumption will increase annually to 170 trillion cubic feet (Tcf) by 2035 (FIG. 1). This increase is led by strong growth in non-OECD countries. To meet expected consump-tion rates, gas producers will need to increase supplies by al-most 60 Tcf by 2035. In response to this surging demand, new project development and major capacity expansions are under-way in all parts of the globe.
United States. In the US, the downstream construction sector is benefiting from the recent boom in shale gas production. In its Annual Energy Outlook 2013, the EIA projects that US gas production will jump from 21.6 Tcf in 2010 to 31.1 Tcf–36.1 Tcf in 2040. The shale gas phenomenon has established the US as the world's top gas producer; positioned it to become one of the world's leading exporters of liquefied natural gas (LNG); and provided cheap ethane feedstock to fuel additional project activity for natural gas liquids (NGLs), fractionators, gas-to-liquids (GTLs), ethylene crackers and petrochemical infra-structure construction.
LNG. The US is primed to become a dominant LNG-exporting powerhouse within 10 years. US companies aim to construct over 210 million tpy (MMtpy) of LNG export ca-pacity over the next several years. Due to recent market chang-es, many previously planned US LNG import terminals have either been canceled or will be converted or expanded into export terminals. Over a dozen LNG export facilities are await-ing approval from the US Department of Energy (DOE). US LNG-exporting companies must seek approval from the DOE to export LNG to other nations, regardless of whether or not they hold a free trade agreement (FTA) with the US.
The most advanced of these projects is Cheniere Energy Inc.'s Sabine Pass Liquefaction Project. This project has been approved by the DOE to export LNG both to countries with and without FTAs. Located in Cameron Parish, Louisiana, the $12 billion (B) project will be the first LNG export terminal constructed in the US in 50 years. In March 2013, Cheniere filed applications with the federal government to construct two additional LNG trains. Trains 5 and 6 will add 9 MMtpy of extra capacity. If approved, total export capacity at Sabine Pass will exceed 25 MMtpy. Completion of Train 1 is scheduled for 4Q 2015, while Train 2 will commence operations in 2Q 2016.
In May 2013, Freeport LNG's liquefaction and export proj-ect (FIG. 2) became the second LNG export terminal to receive approval from the US DOE to export LNG to non-FTA coun-tries. The $10 B project is located on Quintana Island near
Freeport, Texas. The 13.2-MMtpy facility was approved to ex-port LNG at a rate of up to 1.4 billion cubic feet per day (Bcfd) for a period of 20 years.
As the US expands its LNG export capacity, a major debate on the amount of natural gas the US should export has arisen. The abundance of natural gas has kept Henry Hub pricing well below $5/MMBtu. In the rest of the world, gas is linked to the price of oil. This can result in LNG spot prices as high as $19/MMBtu in places like East Asia and South America. These high prices make exporting natural gas very lucrative for US LNG-exporting companies.
The advantage of cheap gas feedstocks has fueled the US petrochemical industry to announce over $100 B in new proj-ect construction. This includes the construction of more than 10 MMtpy of ethylene production capacity by 2020. Exporting too much LNG could raise the price of natural gas to a point where petrochemical producers lose their cost advantage. Con-sequently, petrochemical producers might have to rethink their construction plans. Further developments will ensure that both the gas processing and petrochemical industries benefit from this abundant energy source.
GTL. Sasol will construct the first GTL plant in the US. The $11 B–$14 B project advanced into the front-end engineering and design (FEED) stage in December 2012. The 96,000-bar-rels-per-day (bpd) facility, located in Westlake, Louisiana, will convert low-cost natural gas into clean-burning diesel. It will
US Energy Information Administration
0
50
100Tcf
150
200
2008 2015 2020Year
2025 2030 2035
Non-OECDOECD
111123
133144
157169
FIG. 1. World natural gas consumption to 2035.

8�JULY 2013 | GasProcessingNews.com
BOXSCORE CONSTRUCTION ANALYSIS
be constructed in two phases of 48,000 bpd each. Phase 1 is scheduled to come online in 2018. Phase 2 will be completed in the following year. A $5 B–$7 B ethane cracker will also be constructed at the site. The 1.5-MMtpy unit will be com-missioned in 2017. The overall project cost for Sasol's Lake Charles GTL and ethane cracker complex could top $20 B.
In the vicinity of Sasol's GTL project, G2X Energy plans to construct a $1.3 B GTL facility. Located at the Port of Lake Charles, G2X Energy will use natural gas to produce methanol. The methanol will then be converted into gasoline, which will make up about 90% of production. The other 10% of output will comprise liquefied petroleum gas (LPG) or propane. A feasibil-ity study is being conducted, and a final investment decision will be made by the end of 2013. If approved, construction will begin in early 2014, and completion will be achieved by 2017.
Primus Green Energy plans to break ground on its first commercial GTL plant in 2014. The plant is designed to pro-duce 25 MM gallons per year (gpy) of transportation fuels by 2016. Primus' GTL process utilizes STG+ technology, which is an improved, proprietary version of ExxonMobil's methanol-to-gasoline process. Unlike the Fischer-Tropsch process, which yields a synthetic crude that must be cracked or processed (adding considerable expense), the STG+ process produces gasoline directly. STG+ technology can process natural gas into other products such as diesel and jet fuel, and aromatic chemical feedstocks such as toluene and xylene. To date, a final location for the plant has not been selected.
Furthermore, Shell is conducting a feasibility study for the construction of a GTL plant in Louisiana. The US GTL plant will mirror Shell's $19 B Pearl GTL facility in Ras Laffan, Qatar. The Louisiana GTL facility is estimated to cost $10 B and have a capacity of between 50,000 bpd and 70,000 bpd. However, an investment decision is not likely to be made for another two years. If greenlighted, construction could span an additional 4–5 years, which would see operations beginning in 2019 or 2020.
Canada. Due to the recent shale gas boom, the US no longer needs to import excess natural gas from Canada. To offset this financial hit, Canada has planned a number of LNG liquefac-tion terminals to export LNG to Asian markets. These LNG
export facilities are located primarily on British Columbia's Pacific Coast. Three projects in Kitimat, British Columbia are Apache and Chevron Canada Ltd.'s $15 B Kitimat LNG project; Shell Canada, Korea Gas Corp. (KOGAS), Mitsubi-shi Corp. and PetroChina's 12-MMtpy LNG Canada project; and the Haisla Nation and LNG Partners LLC's 1.8-MMtpy LNG project.
BG Group recently filed its Prince Rupert LNG export project with the Canadian Environmental Assessment Agen-cy. The 21-MMtpy export terminal will consist of three LNG trains constructed in two phases. Construction on the first two trains will begin in 2016. The construction of the third train will depend on future market conditions. Completion is sched-uled for 2019. Further south, Petronas, with newly acquired Progress Energy, is planning the $9 B–$11 B Pacific Northwest LNG project on Lelu Island, British Columbia.
Four additional LNG export terminal proposals have been submitted to the British Columbian government. All four are located on government land at Grassy Point, near Prince Rupert. An expression of interest (EOI) was submitted by a consortium consisting of Nexen, China National Offshore Oil Corp. (CNOOC), and Japan's Inpex Corp. and JGC Corp. Other EOIs were submitted by Woodside Petroleum Ltd., an Imperial Oil Ltd. and ExxonMobil joint venture ( JV), and Korea-based SK E&S. These proposals are undergoing further evaluation by the provincial government to determine how many projects the Grassy Point site can accommodate.
On the Atlantic side, Pieridae Energy Canada has submitted plans for its Goldboro LNG project for environmental assess-ment. The $5 B–$10 B project will be located at the Goldboro Industrial Park on Nova Scotia's east coast. The 10-MMtpy fa-cility plans to export LNG to markets in Europe, South Ameri-ca and Asia in 2019. FEED will take place simultaneously with the environmental assessment. A final investment decision is expected in 2014.
Also, H-Energy is conducting a feasibility study for an LNG export terminal in Melford, Nova Scotia. The $3.18 B project will be constructed in three phases. The first liquefaction train, with a capacity of 4.5 MMtpy, is scheduled for completion by 2020. H-Energy plans to target markets in Asia, Europe and Latin America.
Africa. Estimated recoverable gas reserves of over 65 Tcf in offshore Mozambique have spurred one of the largest LNG developments in the world. Anadarko and Eni plan to con-struct the $15 B Mozambique LNG project in the Afungi Peninsula area of Cabo Delgado Province. The initial plan includes four liquefaction trains consisting of 5 MMtpy each. The project has the potential to expand to 10 trains, with a total export capacity of 50 MMtpy. A Fluor Corp. and JGC JV will conduct the FEED study. The first LNG cargo exports are expected to begin in 2018.
Mozambique's state-owned distributor of petroleum prod-ucts, Petromoc, is conducting a feasibility study for a 40,000-bpd GTL plant. The $1 B project will be constructed with South Africa's state-owned oil company, PetroSA. If green-lighted, the project will increase the supply of diesel to meet the region's burgeoning demand. PetroSA has also contracted WorleyParsons to conduct both the feasibility study and FEED
FIG. 2. Digital rendering of proposed liquefaction facilities at Freeport LNG's Quintana Island terminal.

Gas Processing | JULY 2013 9
BOXSCORE CONSTRUCTION ANALYSIS
for an LNG import facility in Mossel Bay, South Africa. The project will help supplement dwindling gas reserves at Petro-SA's Mossel Bay GTL facility.
Riddled with delays, Chevron and Sasol are scheduled to commission their $8.4 B Escravos GTL plant in 2013. Located 60 miles southeast of Lagos, Nigeria, the 33,000-bpd plant will convert natural gas into premium, environmentally friendly diesel and GTL naphtha. Once completed, Nigeria will join countries such as Qatar, Malaysia and South Africa that oper-ate commercial GTL plants.
Latin America. Latin America largely relies on natural gas for power generation. The International Energy Agency (IEA) forecasts that South America's gas demand will surge 29% between 2011 and 2017. Transportation networks comprise pipelines and LNG terminals. Argentina, Brazil, Chile and Mexico are the region's major LNG importers, with Peru be-ing the only LNG exporter. Peru LNG commissioned South America's first gas liquefaction plant in 2010.
Brazil. The majority of Brazil's natural gas reserves are con-tained in the offshore Campos, Espírito Santo and Santos ba-sins. Sizable reserves also exist in the country's interior states of Amazonas and Bahia. To meet rising demand for natural gas, Brazil's state-owned oil company, Petrobras, is planning several LNG projects, including the construction of the world's largest FSRU. This construction, along with Brazil's central location, could make Brazil a Latin American LNG hub.
Petrobras will commission its third offshore terminal this August. Located in the Bay of All Saints, the $425 MM Bahia Regasification Terminal project will supply the northeastern state of Bahia with 14 MM cubic meters per day (MMcmd) of natural gas. Once completed, Brazil's regasification capacity will exceed 35 MMcmd. In 2Q 2014, Excelerate Energy will deliver to Petrobras the largest FSRU vessel in the industry. The VT3vessel will operate at Rio de Janeiro's Guanabara LNG termi-nal. It will have a storage capacity of 173,400 cm and deliver 20 MMcmd of natural gas to Brazil's southeast region.
Petrobras is also working with HRT Participacoes to de-liver LNG to remote inland destinations using small LNG river barges. The Bolivian government is funding a feasibility study for a similar project. Bolivia is looking to export LNG to Paraguay and Uruguay using the Paraguay-Parana river system. If adopted, this concept could be utilized throughout South America to ensure that LNG cargoes reach isolated areas.
Argentina. Argentina is South America's largest natural gas producer and consumer. However, its highly regulated energy sector has enacted policies to discourage foreign and private in-vestment. Consequently, demand for energy continues to out-pace supply. This has led Argentina to increasingly depend on energy imports by pipeline from Bolivia and on LNG cargoes from Trinidad and Tobago and Qatar. LNG cargoes are received through the Bahia Blanca GasPort and Escobar LNG terminal.
To increase imports, Argentina is partnering with Uruguay to construct the GNL Del Plata LNG regasification plant. Lo-
cated off the coast of Uruguay's capital, Montevideo, the $800 MM project will supply both Uruguay and Argentina with 15,000 cmd. It is rumored that Argentina may pull out of the project; if so, the government of Uruguay will continue the development on its own.
Additionally, Argentina and Qatar are exploring the possi-bility of constructing an offshore LNG FSRU. If constructed, the 5-MMtpy Southern Cone LNG Hub will meet 16% of Ar-gentina's natural gas demand.
Chile. Most of Chile's natural gas is imported as LNG from Trinidad and Tobago, Qatar and Yemen. LNG is received through Chile's two regasification terminals—Mejillones, lo-cated in the north, and Quintero, located northwest of San-tiago. The 5.5-MMcmd Mejillones LNG project will see the completion of Phase 2 construction in 4Q 2013, which will include a 175,000-cm onshore storage tank. Phase 1, complet-ed in 2010, included a single offload jetty and a regasification train. The project will provide 20% of northern Chile's total annual consumption.
Mexico. Natural gas consumption is outpacing produc-tion in Mexico, forcing it to rely more on imports from the US. According to the US EIA, US natural gas exports to Mex-ico grew by 24% to 1.69 Bcfd in 2012. Due to the lack of pipe-line capacity from the US, Mexico has stepped up imports of LNG from Nigeria, Qatar, Indonesia, Peru and Yemen. This has forced Mexico to pay LNG spot prices as high as $19/MMBtu. This short-term solution is necessary until new pipeline projects are constructed. Mexico is investing $8 B to expand pipeline capacity from the US. The two main proj-ects are the Los Ramones and Northwest pipelines. These pipelines will supply Mexico with an additional 3.5 Bcfd of natural gas by 2016.
Mexico receives imported LNG at three locations. The vast majority of LNG imports are received at the Altamira plant in Tamaulipas. Two other regasification facilities are located in Costa Azul and Manzanillo. Two proposals to expand capacity at the Altamira and Costa Azul facilities have been on hold for some time. Proposals for two greenfield LNG plants at Lazaro Cardenas and on the Yucatan Peninsula have seen little move-ment to date.
Part 2. Gas Processing's global gas processing construction out-look, covering Europe, the Middle East and the Asia-Pacific, continues in October 2013. GP
Detailed and up-to-date information for active construction projects in the refining, gas processing, and petrochemical industries across the globe | ConstructionBoxscore.com
LEE NICHOLS is director of Gulf Publishing Company’s Data Division. He has five years of experience in the downstream industry and is responsible for market research and trends analysis for the global downstream construction sector. At present, he manages all data content and sales for Hydrocarbon Processing'sConstruction Boxscore Database, as well as all corporate and global site licenses to World Oil and Hydrocarbon Processing.

is used worldwide to design and optimize gas
integrated with Microsoft Visio® ®, and Word®,
designing gas plants and predicting performance
Simulation. Service. Solutions.Discover why engineers around the world depend on ProMax!
2
2
ProMax®
Gas Processing
Process Simulation Software

Gas Processing | JULY 2013 11
Update on global natural gas and LNG marketsN. MIKHAIEL
FACTS Global Energy, New York, New York
VIEWPOINT
NELLY MIKHAIEL is a senior consultant for gas/LNG with FACTS Global Energy (FGE) Group at its offices in New York City. She concentrates primarily on Atlantic Basin markets, namely North American gas/LNG markets. Prior to joining FGE, Dr. Mikhaiel was an LNG consultant with Nexant Inc., an energy and chemicals consulting company. Her research encompassed the hot-button issue of global shale gas development, with a special focus on North American plays. Prior to that, she was a member of Poten & Partners’ LNG consulting team between 2000 and 2009. During her tenure at Poten, she acquired LNG regasification terminal expertise with special regard to regulatory issues, terminal use agreements, and market entry strategies. Dr. Mikhaiel earned a BA degree with honors in 1996 and a PhD in history in 2002. Her 100,000-word history thesis dealt with the US Strategic Petroleum Reserve during the Reagan and Bush administrations. Both degrees were awarded by the University of Western Australia.
The liquefied natural gas (LNG) sup-ply market increased to nearly 237 mil-lion metric tons (metric MMt) in 2012, or around a third of the global gas trade. Despite this impressive long-term growth history, global LNG trade declined by about 2% in 2012—the first dip in global LNG commerce since 1981. LNG trade decreased due to supply constraints, de-spite growing demand throughout most of Asia and parts of the Americas.
Global LNG supply in 2012. Anticipat-ed and unanticipated LNG supply con-straints resulted in strong competition for available volumes in 2012. This is partly because actual liquefaction capacity addi-tions in 2012 failed to meet expectations. Only one new project entered service during the year and startup delays at oth-er new facilities contributed to the dearth of new supply. Scheduled shutdowns at existing liquefaction facilities and unex-pected outages at other terminals —the latter largely attributable to feedgas con-straints—resulted in even less global LNG supply availability. The aggregate nominal capacity of all liquefaction plants in 2012 just exceeded 281 metric MMtpy, to be compared with a worldwide LNG consumption of almost 237 metric MMt-py. As shown in FIG. 1, the global utiliza-tion rate declined from 87.3% in 2011 to 84% in 2012.
Global LNG demand in 2012. The dip in supply was rendered all the more sig-nificant due to higher demand by many countries, which includes virtually all of Asia and some South American nations. This yielded what can only be described as a “tight” global LNG market in 2012. Asian LNG demand grew 8% on the year to just under 165 metric MMt, spurred in no small part by Japan’s hunger for natural gas to compensate for the considerable offline nuclear power generation capacity. Meanwhile, higher year-on-year (y-o-y) demand by the Americas also acted as a powerful magnet for available cargoes. In-deed, increased deliveries to Mexico and South America, especially Brazil, effec-tively nullified the US’ significant slump in LNG demand during 2012. With both Asia and parts of the Americas record-ing appreciable demand increases, it was all but inevitable that Europe—parts of which continue to struggle with the Euro-pean sovereign debt crisis—should act as the “swing” LNG demand province and divest cargoes to high-demand centers both east and west of the Suez.
Outlook for 2013. With global LNG demand expected to increase over the next two years, market tightness will in-tensify. Competition for available cargoes will grow on the back of increased Asian requirements as well as higher y-o-y de-
2000 2001 2002 2003 2004 2005 2006 2007 2008 2009 2010 2011 20120
50
100
150
200
250
300
LNG c
apac
ity, m
etric
MMt
Nameplate LNG export capacityLNG trade
FIG. 1. Nameplate LNG export capacity vs. actual trade volumes.

12�JULY 2013 | GasProcessingNews.com
VIEWPOINT
mand by the Americas and parts of the Middle East. The startup of new supply capacity will help meet the forecast rise in demand, but supply availability will con-tinue to be an issue until the next “wave” of new liquefaction capacity comes on-stream in 2015, as illustrated in FIG. 2.
Regional natural gas markets; whether they be served by pipelines and/or LNG, are going through a major change. Con-sequently, there is pronounced uncer-tainty about future supply/demand bal-
ances and price. In this context, a rapidly expanding LNG market is poised to play a more prominent balancing role across regional markets:
• LNG supply growth in 2013 is not expected to keep up with increased de-mand. The 2013–2015 period will see demand come up against global liquefac-tion capacity with very little surplus. It is hoped that the problems experienced by operating plants in 2012 will not be re-peated, and that any unexpected outages
will be few and of short duration to keep global LNG trade flows smooth.
• Less than 10 metric MMtpy of new LNG export capacity is expected to come online in 2013, all of which will be located in the Atlantic Basin. Algeria’s Sonatrach has a 4.5-metric MMtpy Skikda rebuild that underwent commissioning in 1Q 2013, whereas Angola’s 5.2-metric MMt-py Angola LNG project may enter service in 2013.
• The world will be deprived of new liquefaction capacity until the next wave of new liquefaction capacity now under construction in Australia, Indonesia and Papua New Guinea enters the market be-ginning in 2015. An influx of Atlantic Ba-sin volumes is also expected around 2015 and 2016, respectively.
• Given the outlook for increased de-mand through 2015, market conditions will be tight. By 2015, global utilization rates could reach 92%, which is compa-rable to rates recorded in the early 2000s.
• The remainder of this decade will be characterized by a widening differential between oil and gas prices. GP
Centrifugal Pump Pac is a complete program designed for centrifugal pump engineers. This program provides commercially available pump designs to best suit given operating conditions and retirements, and it revises existing pump curve data for new pumping conditions.
Price: $695 (Order # S140)
GULFPUBLISH ING COMPANY
+1 (713) [email protected]/soft
CPPAC C e n t r i f u g a l P u m p P a c
Namplate LNG export capacity Forecast global LNG demand
0
50
100
150
200
250
300
350
2010 2011 2012 2013 2014 2015
Historical Forecast
LNG c
apac
ity, m
etric
MMt
FIG. 2. Historical and forecast global LNG supply vs. demand.
P. O. Box 2608Houston, Texas 77252-2608, USAPhone: +1 (713) 529-4301Fax: +1 (713) [email protected]
PUBLISHER Bret Ronk
EDITORIALManaging Editor Adrienne Blume
News Editor Melanie Cruthirds
Associate Editor Helen Meche
Director, Data Division Lee Nichols
Editor, Hydrocarbon Processing Stephany Romanow
Editor, World Oil Pramod Kulkarni
MAGAZINE PRODUCTIONVice President, Production Sheryl Stone
Manager, Editorial Production Angela Bathe
Artist/Illustrator David Weeks
Graphic Designer Amanda McLendon-Bass
Manager, Advertising Production Cheryl Willis
ADVERTISING SALESSee Sales Offices, page 30.
Copyright © 2013 by Gulf Publishing Company. All rights reserved.
President/CEO John Royall
Vice President Ron Higgins
Vice President, Production Sheryl Stone
Business Finance Manager Pamela Harvey
Part of Euromoney Institutional Investor PLC. Other energy group titles include: Hydrocarbon Processing, World Oil and Petroleum Economist
Publication Agreement Number 40034765 Printed in USA

Gas Processing | JULY 2013 13
Nitrogen expansion cycle enhances flexibility of small-scale LNGJ. PAK, Cosmodyne LLC, Seal Beach, California
SPECIAL REPORT
The abundance of natural gas from advancements in hori-zontal fracking technology applied to shale reservoirs has led to historically low natural gas prices in North America. In addi-tion to being a domestic energy source that is environmentally friendlier than others (it emits up to 30% less greenhouse gas than gasoline or diesel), natural gas is now much cheaper than gasoline or diesel as an energy source. For these reasons, lique-fied natural gas (LNG) is now a viable replacement for diesel in many high-horsepower industries such as drilling, mining and transportation, including marine and railroad.
This new paradigm has created excitement in the North American market, as well as around the world, for small-scale LNG plants where gas is liquefied and transported via truck to different demand sources, similar to the existing diesel market supply scheme. Typically, small-scale LNG plants are defined as plants with a total liquid production capacity of roughly 50,000 gallons per day (gpd) to 500,000 gpd [4 million stan-dard cubic feet per day (MMscfd) to 42 MMscfd].
While mixed-refrigerant (MR) cycles dominate at world-class and medium-scale LNG plants, the reverse Brayton nitro-gen (N2) cycle (or N2 expansion cycle) has enjoyed a resurgence
at small-scale LNG plants. Here, the different liquefaction cycles available for small-scale LNG plants, and the specific factors that contribute to the N2 cycle becoming the cycle of choice, are examined. The unique factors discussed are the effects of recent advances in processes and equipment leading to improvements in efficiency, the use of pipeline gas as a feedgas source, capital vs. operational costs, and plant loading considerations.
Technology selection. There are numerous processes avail-able to liquefy natural gas. The MR and cascade cycles are the most efficient processes. Both types of hydrocarbon refrigera-tion processes allow for refrigeration loops to tightly match the cooling curve of a typical gas liquefaction, to achieve high refrig-eration efficiency and reduce energy consumption (TABLE 1).1
Most of the world's baseload LNG plants (i.e., plants produc-ing more than 2.5 MMtpy) use an MR or a cascade cycle, which is a testament to the efficiency of these processes. The only practical natural gas liquefaction processes available for small-
Fractionationcolumn
Liquidseparator
Liquidseparator
Liquidseparator
Liquidseparator
Liquidseparator
Single mixed-refrigerant loop
TDC
LIC
PIC
CW
Expansionvalve
Expansionvalve
Expansionvalve
Cold box
Suctiondrum Compressor Condenser
Heatsource
Reboiler
LNG reflux pump(optional)
NGL
LNG to tank
Natural gas feed
FIG. 1. Flow scheme of a typical SMR process.
Fractionationcolumn
Cold box
Heatsource
Reboiler
LNG reflux pump(optional)
NGL
LNG to tank
Natural gas feed
CW
Compressor
Warmexpander-compressor
Coldexpander-compressor
CW
CW
Nitrogen-refrigerant loop
FIG. 2. Flow scheme of a typical N2 expansion process.
TABLE 1. Specifi c power of diff erent liquefaction processes
Process C3/MR Cascade DMR SMRN2
expansion
Specifi c power (kW-hr/metric tons)
293 338 300 348 375
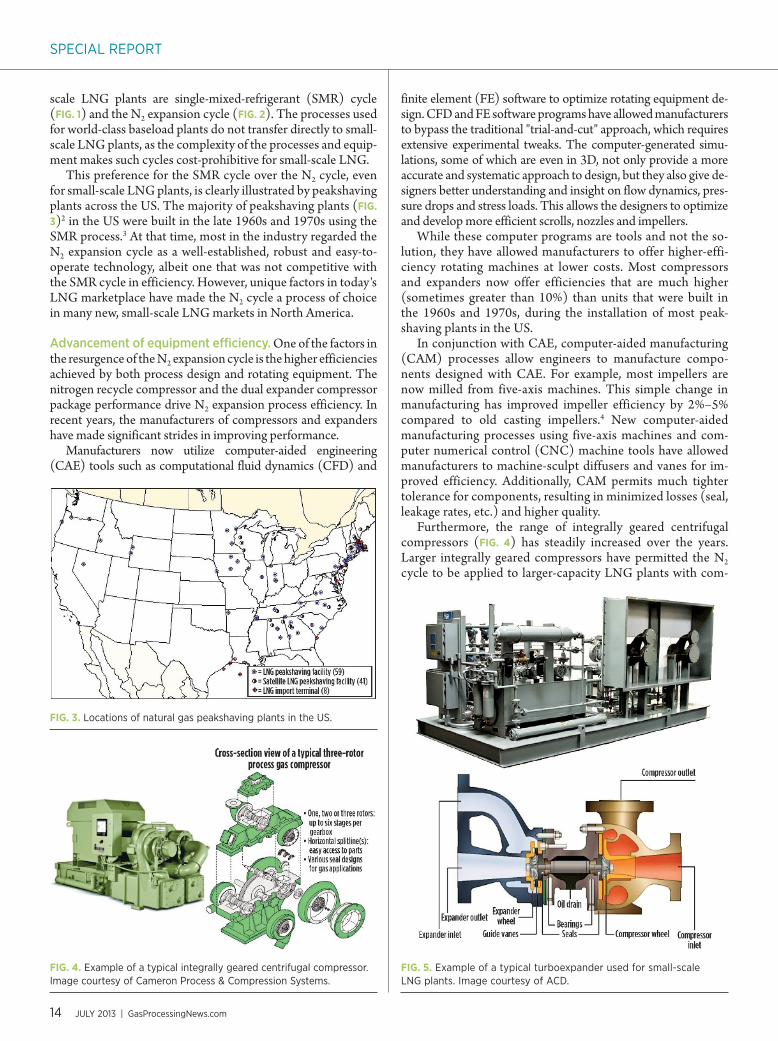
14�JULY 2013 | GasProcessingNews.com
SPECIAL REPORT
scale LNG plants are single-mixed-refrigerant (SMR) cycle (FIG. 1) and the N2 expansion cycle (FIG. 2). The processes used for world-class baseload plants do not transfer directly to small-scale LNG plants, as the complexity of the processes and equip-ment makes such cycles cost-prohibitive for small-scale LNG.
This preference for the SMR cycle over the N2 cycle, even for small-scale LNG plants, is clearly illustrated by peakshaving plants across the US. The majority of peakshaving plants (FIG. 3)2 in the US were built in the late 1960s and 1970s using the SMR process.3 At that time, most in the industry regarded the N2 expansion cycle as a well-established, robust and easy-to-operate technology, albeit one that was not competitive with the SMR cycle in efficiency. However, unique factors in today's LNG marketplace have made the N2 cycle a process of choice in many new, small-scale LNG markets in North America.
Advancement of equipment efficiency. One of the factors in the resurgence of the N2 expansion cycle is the higher efficiencies achieved by both process design and rotating equipment. The nitrogen recycle compressor and the dual expander compressor package performance drive N2 expansion process efficiency. In recent years, the manufacturers of compressors and expanders have made significant strides in improving performance.
Manufacturers now utilize computer-aided engineering (CAE) tools such as computational fluid dynamics (CFD) and
finite element (FE) software to optimize rotating equipment de-sign. CFD and FE software programs have allowed manufacturers to bypass the traditional "trial-and-cut" approach, which requires extensive experimental tweaks. The computer-generated simu-lations, some of which are even in 3D, not only provide a more accurate and systematic approach to design, but they also give de-signers better understanding and insight on flow dynamics, pres-sure drops and stress loads. This allows the designers to optimize and develop more efficient scrolls, nozzles and impellers.
While these computer programs are tools and not the so-lution, they have allowed manufacturers to offer higher-effi-ciency rotating machines at lower costs. Most compressors and expanders now offer efficiencies that are much higher (sometimes greater than 10%) than units that were built in the 1960s and 1970s, during the installation of most peak-shaving plants in the US.
In conjunction with CAE, computer-aided manufacturing (CAM) processes allow engineers to manufacture compo-nents designed with CAE. For example, most impellers are now milled from five-axis machines. This simple change in manufacturing has improved impeller efficiency by 2%–5% compared to old casting impellers.4 New computer-aided manufacturing processes using five-axis machines and com-puter numerical control (CNC) machine tools have allowed manufacturers to machine-sculpt diffusers and vanes for im-proved efficiency. Additionally, CAM permits much tighter tolerance for components, resulting in minimized losses (seal, leakage rates, etc.) and higher quality.
Furthermore, the range of integrally geared centrifugal compressors (FIG. 4) has steadily increased over the years. Larger integrally geared compressors have permitted the N2 cycle to be applied to larger-capacity LNG plants with com-
FIG. 3. Locations of natural gas peakshaving plants in the US.
FIG. 4. Example of a typical integrally geared centrifugal compressor. Image courtesy of Cameron Process & Compression Systems.
FIG. 5. Example of a typical turboexpander used for small-scale LNG plants. Image courtesy of ACD.

Gas Processing | JULY 2013 15
SPECIAL REPORT
petitive efficiencies. Integrally geared centrifugal compressors have higher efficiencies due to interstage cooling at each stage and the use of two or more pinion shafts for optimal impel-ler speeds. These compressors are also cheaper than API-type compressors. Due to their compact size, they require a smaller footprint for a simple and economical foundation.
Since the integrally geared compressors and turboexpander units (FIG. 5) are used for N2 service, the manufacturer's stan-dard rotating equipment can be used for the N2 cycle. This is not the case for some SMR plants where customized API rotating equipment is required. The manufacturer's standard equipment allows for readily available spare parts and support in addition to lower capital costs.
Integrally geared centrifugal compressors and expanders are now available for the full range of small-scale LNG plants. Improved rotating equipment efficiencies, reliability and costs from standard manufacturer designs have put the N2 cycle on par with the SMR process.
Pipeline gas as feedstock. The second dynamic contribut-ing to the N2 expansion cycle's popularity is the source of feed gas for natural gas liquefaction plants. In North America, most small-scale LNG plants source their feedstock from gas pipe-line networks and midstream gas processing plants.
The US has an extensive natural gas pipeline network. With more than 210 gas pipeline systems and over 300,000 miles of pipeline, natural gas can be accessed at almost any location in the Lower 48 states (FIG. 6).5 This intricate gas pipeline network allows companies to strategically locate LNG plants to supply their demand sources. Fortunately, the pipeline gas is usually at high pressure and is lean, with few heavy hydrocarbons (C4
+).In most cases, small-scale LNG plants need treat only the
feed gas to remove carbon dioxide (CO2), water (H2O) and other impurities, and to liquefy the gas without removing heavy hydrocarbons. The combination of high inlet pressure and lean feedgas composition has allowed the N2 expansion cycle to achieve high efficiencies (specific power in terms of kW-hr/gal produced).
The cooling curve with feedgas pressure at 1,100 psig (FIG. 7) shows a flat natural gas heating curve that can be matched tightly to the N2 cooling curve for efficient heat transfer. The N2 cycle can achieve specific power values of 0.56 kW-hr/gal (350 kW-hr/metric ton) with high-pressure, lean feed gas.
Moreover, pipeline feedgas composition frequently varies. This feedgas variation can impact the overall performance of
the liquefaction plant. For the SMR cycle, the selection of spe-cially mixed, multi-component hydrocarbon refrigerant must be adjusted to match the feedgas variation to maintain high refrig-eration efficiency. If the refrigerant combination is not adjusted, then the SMR cycle's advantage over the N2 cycle may vanish.
The N2 cycle, on the other hand, is significantly more flex-ible than the SMR cycle in minimizing overall effects on effi-ciency and performance for ranges of ambient/cooling water temperatures and natural gas feed compositions. The N2 cycle
FIG. 6. Diagram of the US natural gas pipeline network.
900.0 0.4 0.8 1.2 1.6 2.0 2.4 2.8 3.2 3.6 4.0 4.4
ΔH, MMBtu/h
Composite heat curves
4.8 5.2 5.6 6.0 6.4 6.8 7.2 7.6 8.0 8.4 8.8
110
130
150
170Tem
pera
ture,
K
190
210
230
250
270
290
310
FIG. 7. Heating curve for feedgas inlet pressure.
00 20 40 60
Design production, %
N2 cycle turndown range
80 100
20
40
Desig
n pow
er, %
60
80
100
FIG. 8. Typical N2 expansion cycle turndown (production vs. power).
The N2 cycle is significantly more flexible than the SMR cycle in minimizing overall effects on efficiency and performance for ranges of ambient/cooling water temperatures and natural gas feed compositions. The N2 cycle uses nitrogen gas as the refrigerant; therefore, no adjustments are required for changing feedgas composition. This process eliminates the need for a subsystem for the storing and mixing of several hydrocarbons to produce a multi-component refrigerant.

16�JULY 2013 | GasProcessingNews.com
SPECIAL REPORT
uses nitrogen gas as the refrigerant; therefore, no adjustments are required for changing feedgas composition.
This process eliminates the need for a subsystem for the storing and mixing of several hydrocarbons to produce a multi-component refrigerant. Furthermore, combined variability of the recycle compressor and the two turboexpanders allows for more flexibility to minimize the effect on the overall liquefac-tion performance, with varying feedgas composition.
Plant loading considerations. In the North American LNG market, plant operational flexibility is a key requisite in plant
design. The turndown capability of the N2 expansion process meets this requirement easily. The use of LNG as replacement fuel for diesel in high-horsepower industries will take some time. Therefore, for some early-to-market developers, LNG demand during the early years of the plant life may fluctuate substantially, with a considerable ramp-up period, until full production capac-ity can be sold. The N2 cycle alleviates this problem by offering a wide turndown range with proportional power savings. FIG. 8shows the typical turndown range of the N2 expansion cycle.
The wide turndown range is especially beneficial when compared to plants that operate in "campaign mode," where the plant runs at full capacity until the storage tank is filled to a set level and then shuts down. The plant is restarted when the stor-age tank runs down to a low level setpoint. In campaign mode, the plant power rate is based on peak power draw, and the feed-gas supply agreement may have a mandatory minimum offtake.
Depending on the power utility and tariff schedule, there are rate adjustments or fees based on the maximum power draw used during a billing cycle. These costs can be lowered by operating the plant in turndown mode instead of in campaign mode (where the plant’s full power will be reached). Simi-larly, uncertain demand for LNG can make scheduling pipe-line draws difficult, and it can result in unnecessary penalties for underestimating or overestimating the amount of pipeline draw. Therefore, operating the plant at a lower capacity can make scheduling more predictable.
Moreover, LNG plants under gas supply contracts that re-quire minimum feedgas offtake will be penalized for operating in campaign mode because the LNG plant owner must pay minimum gas costs even when the plant is not in operation. The operating flexibility from the N2 cycle's turndown range allows an LNG plant operator to minimize operating costs, even during the early years of an LNG plant's life when market demand is lower than the full plant capacity.
Another key consideration in plant design is scalability to grow with market demand. Even though having a large, single train is more economical than multiple-train design, some LNG plant owners choose to go with the multiple-train option. The smaller multiple-train option allows for a highly modularized skid-mounted design for easier and cheaper installation. It even allows the plant to be relocated, since most of the components are skid-mounted. Additionally, the multiple-train design al-
FIG. 9. An LNG plant with multiple trains. Photo courtesy of Clean Energy Fuels.
8%13%
11%
15%11%
14%
27%CAPEX feed pretreatmentCAPEX liquefaction plantCAPEX product managementand storageCAPEX infrastructureCAPEX otherPV electric powerPV other OPEX
FIG. 10. Total lifecycle cost for a 10-year project life.
CAPEX feed pretreatmentCAPEX liquefaction plantCAPEX product managementand storageCAPEX infrastructureCAPEX otherPV electric power
7% 12%
11%
14%
11%16%
30%
PV other OPEX
FIG. 11. Total lifecycle cost for a 15-year project life.
CAPEX feed pretreatmentCAPEX liquefaction plantCAPEX product managementand storageCAPEX infrastructureCAPEX otherPV electric power
7% 12%
10%
13%
10%17%
31%
PV other OPEX
FIG. 12. Total lifecycle cost for a 20-year project life.

Gas Processing | JULY 2013 17
SPECIAL REPORT
lows for a simpler and economical way to increase plant capac-ity by adding identical trains with market growth.
As a side benefit, multiple-train design also provides some redundancy; even with one train down, the plant will still be able to produce some LNG. More importantly, multiple-train design permits a company to make a smaller initial capital in-vestment and retain the option to invest in increments as de-mand increases, reducing some of the risk for early market pio-neers. This scalability of smaller trains, in lieu of a larger train, keeps the LNG plant capacity within the range where the N2expansion cycle is competitive.
Capital vs. operational cost. In selecting an appropriate pro-cess cycle for a small LNG plant, it is important to understand the struggle between initial capital expenses (CAPEX) and op-erating expenses (OPEX).
Each situation has individual parameters that shape the strug-gle—i.e., internal rates of return (IRRs), with project life and power cost being the main factors. To understand the issues in-fluencing the economic plan, it is standard to determine the life-cycle cost of the plant over the project life. In its simplest form, this is the sum of CAPEX and the present value of future OPEX.
As an example, consider the data displayed in FIGS. 10–12, which depict the segregation of various elements of lifecycle costs for a typical 100,000-gpd plant under project life assump-tions of 10, 15 and 20 years. The model assumes a $310/gpd nameplate capacity starting at 50% loaded and increasing by 10%/yr until fully loaded, an IRR of 12%/yr, and a power cost of $60/Mwh. The liquefaction cost represents a low percent-age of total lifetime cost.
As expected, the longer the project life, the more influential is the power cost. The lifecycle cost increases from $522/name-plate gpd at a 10-year project life to $598 at a 20-year project life. More importantly, the ratio of electric power to liquefaction CAPEX (the main power consumer) increases from 104% to 147%. Viewed another way, at a 20-year project life, an operator can afford to spend an additional 1.5% on equipment to save 1% on power, while, at a 10-year project life, an operator can spend 1% to achieve the same savings.
Short project lives are commonplace for a number of rea-sons (TABLE 2), and this has been favorable to the adoption of modern N2 cycle plants. These plants are traditionally lower in initial cost, are simpler to install, are easier to operate, have excellent turndown characteristics, are easily relocated and are feedstock-flexible.
In addition to the CAPEX and OPEX analyses, the ease of operation of the N2 cycle is an important factor because avail-ability of qualified personnel with LNG experience is, and will be, limited as the LNG market grows. It is well established that N2 cycle plants are easy to operate. The N2 expander cycle is by far the most straightforward for operating staff to understand, operate and troubleshoot, because the process requires less monitoring and control points as well as minimal operator in-tervention compared to SMR plants.6
Additionally, inert, safe refrigerant eliminates the need for purging in and out for maintenance on the refrigeration side, making maintenance easier. Simple operation and minimal training for personnel have made the N2 cycle an attractive al-ternative choice in small-scale LNG plants.
Takeaway. There is no "one-size-fits-all" solution when exam-ining the different processes for a small-scale LNG plant. Each process has advantages and disadvantages. Only an extensive comparison with definitive data and analysis can show which process is the right fit.
The N2 cycle is now the preferred process, even at capacities beyond the traditional limits, and it is enjoying a renaissance in the small-scale LNG market. The N2 expansion cycle, once viewed as a simple, easy-to-use process with low efficiencies, is now enjoying wider acceptance because of unique factors in to-day's LNG market. GP
LITERATURE CITED 1 12th International Conference and Exhibition on Liquefied Natural Gas, Perth,
Australia, May 4–7, 1998. 2 US Environmental Information Administration, “US LNG Peakingshaving and
Import Facilities, 2008,” December 2008. 3 Zeus Intelligence, Peakshaving Project Database, http://www.zeusintel.com. 4 Cameron, “Centrifugal compressor performance upgrades,” 2010. 5 US Environmental Information Administration, "US Natural Gas Pipeline
Network, 2009," 2009. 6 Pak, J. and K. Knight, “Keep on Trucking,” LNG Industry, Autumn 2012.
JOSEPH PAK is the director of sales and marketing for Cosmodyne LLC, a member of the Cryogenic Industries family of companies, in Seal Beach, California. He joined the company in 2007 and has since been responsible for the sales and marketing of air separation plants and small-scale LNG plants around the world. Mr. Pak has over 24 years of experience working for equipment manufacturers in various positions
including engineering, sales and legal. He has an MS degree in mechanical engineering from the University of Southern California and a JD from the University of Connecticut School of Law. He is a registered professional engineer in California and is admitted to the California Bar.
TABLE 2. Factors infl uencing the selection of project life for North American LNG plants
Factor Details
Demand uncertainty
The "chicken-and-egg" situation among suppliers, engine manufacturers and end users makes the prediction of degree and the timing of demand problematic.
Scalability Uncertainty makes scalable solutions a requirement. Plants must either adopt a train expansion or be readily movable as demand outgrows supply.
Settled environment
Most hydrocarbon processing plants exist in an environment with settled regulatory requirements, best operating practices and logistics. Small-engine fuel supply (EFS) LNG plants are new; rapidly changing environments are to be expected.
"Black swans" Key examples of major, unexpected events are a sudden, large change in competitive fuel costs (i.e., a major drop in the price of oil), major accidents, political backlash on fracking, and technical problems related to engine operations.
Obsolescence While small LNG plants have existed for some time as peakshaving plants, the sudden rise of LNG as a motor fuel has produced a new dynamic. Both the process and its components are making rapid advances, and this can be expected to continue.
Feedstock variation
Most EFS LNG plants are tied to either pipeline or midstream processors. In either case, the composition of the feedstock can be expected to be time-dependent.

Speak at the Gastech Centres ofTechnical Excellence (CoTEs) SeminarsGastech Exhibition Seminars Driving Awareness of Innovation & Advancement in Gas Technology
The Centres of Technical Excellence (CoTEs) are free-to-attend educational theatres located on the exhibition show fl oor. Each theatre features focussed seminars dedicated to delivering knowledge, education and awareness of technological innovations Attracting thousands of industry professionals, these seminars provide a platform for high-level industry leaders to showcase their latest developments in gas technology.
Natural Gas Vehicles (NGV)
Gas Monetisation
NGL/GTL
LNG as a Shipping
Fuel
Power Generation
HSSE LiquefactionOff shore & Subsea
Technology
Pipeline Infrastructure
LNG & Gas Carrier
Shipbuilding
CoTE Streams for 2014
HOSTED BY
SUPPORTED BY
Calling all leading technical experts, submit presentations to present at the CoTEsProvide your industry peers with a comprehensive outlook on:
Technological innovation Recent case studies Key advances in research and development
If you are interested in speaking at the CoTEs as part of a sponsorship or exhibition package please contact us at [email protected] or contact Michelle Thorby on +44 (0) 203 615 2876.
Submit Your
Presentation Today
Deadline for presentation submissions is Friday 19 July 2013
Visit www.gastechkorea.com/cotes
www.gastechkorea.com/HydrocarbonProcessing

Gas Processing | JULY 2013�19
Shale hydrocarbons ushering an industrial renaissance in North AmericaP. GUNASEELAN, Vantage Point Advisors, Houston, Texas; and
M. THUNDYIL, Transcend Solutions, Houston, Texas
SPECIAL REPORT
A remarkable surge in shale oil and gas production in North America is radically reshaping the global energy landscape. The primary beneficiary of this shale revolution is the US, where a resurgence in domestic manufacturing and a transformation to an export center of hydrocarbons are underway, reversing his-torical trends. Shale natural gas (NG) and natural gas liquids (NGL) are playing a pivotal role in this new dynamic, driving interest both in their domestic use and exports, and creating numerous opportunities for gas processing and NGLs recov-ery. In particular, the abundance of low-cost shale hydrocar-bons has repositioned North America as a leading competitive supplier of chemicals and petrochemicals derived from gas and NGLs, driving a slew of announcements of newbuild produc-tion capacity.
As the shale gas sector has rapidly evolved, it has been ac-companied by a shortage of credible information regarding the extent of its impacts on the hydrocarbon processing in-dustry (HPI). To address this gap, future trends and markets for NG and NGL within the HPI, especially in the US, will be discussed. The focus includes the use of liquefied natural gas (LNG) and compressed natural gas (CNG) as engine fuels, gas-to-liquids (GTL) and NGL-based petrochemicals.
NG AS AN ENGINE FUELThe underlying driver for switching to NG as an engine fuel
is its favorable price differential in the US compared to refined fuels such as diesel, gasoline and fuel oil (FO). At present, NG fuel is approximately $1 to $2 cheaper per equivalent gallon than diesel and gasoline.1–3 NG can provide an economic in-centive for switching to LNG in diesel-intensive applications such as high-mileage commercial trucking and offroad indus-trial applications. Low NG prices are also driving the penetra-tion of CNG vehicles in low-mileage, medium- and light-duty fleets with centralized refueling stations.
The cost savings in switching to NG helps recoup the pre-mium for the NG-capable engine and fuel systems. For exam-ple, the estimated payback period for heavy-duty LNG trucks is 2–3 years.4 Advances in NG engine and fuel-system tech-nologies continue to serve as technical and economic drivers. There is also an environmental driver for NG as an engine fuel; it is cleaner burning and inherently lower in sulfur and other contaminants. NG has a smaller carbon footprint as compared to diesel and FO. Finally, the US government is showing sup-port for NG as a transportation fuel.5 These early indications are shaping meaningful federal and state-level incentives and
could serve as regulatory drivers for future growth. Aside from the price premium for NG engines over conventional gasoline and diesel engines, a more limiting barrier is the unavailability of NG distribution and refueling infrastructure. Stakeholders in the NG and transportation sectors are taking steps to ad-dress this gap.
NG trends and developments. The economic driver for NG as a transportation fuel has spurred considerable activity across the value chain, including NG fuel producers, refuel-ing infrastructure developers, engine manufacturers and fleet operators. Some activities, such as the development of refuel-ing infrastructure, are being spearheaded by the private sector without government incentives. This discussion will focus on developments on an important market niche: LNG for heavy-duty trucking.
The US long-haul trucking market is the largest diesel con-sumer, accounting for nearly 65% of 2010 consumption.6 As this market is fuel-intensive, switching to cheaper LNG fuel is attractive to fleet operators. In recent years, Westport and its affiliate CumminsWestport have led the charge in commercial-izing 8.9-liter (l) and 15-l NG engines with LNG fuel systems; these engines have been adopted by major truck manufacturers. CumminsWestport will commercialize a spark-ignited 11.9-l NG engine, which is expected to increase LNG penetration in trucks. 7 Emission Solutions Inc. is another original equipment manufacturer (OEM) of NG engines with products in the 7.3 l–7.6 l range, and it is aligned with truck manufacturer Navis-tar.8 Clean Air Power is working with OEMs and truck manu-facturers to champion dual-fuel technology to enable diesel en-gines—both new and existing—to operate on NG.9 A number of fleet operators such as UPS, Ryder and Waste Management have placed orders for LNG trucks.10–12 There are some viable commercial options for LNG trucks in the long-haul market, and additional compelling offerings can be expected in the im-mediate future as the market continues to develop.
With regard to LNG-refueling infrastructure, Clean Energy has pioneered this critical market segment, having completed construction of 70 stations in the first phase of a network called America’s Natural Gas Highway. An additional 70–80 stations are slated for construction during 2013.13 Shale gas producer Chesapeake is among Clean Energy’s major investors, having committed $150 million (MM) in 2011.14 In 2012, Shell an-nounced plans to develop LNG fueling infrastructure in the US.15 Linde successfully demonstrated a mobile LNG-fueling

20�JULY 2013 | GasProcessingNews.com
SPECIAL REPORT
unit as part of a trial for fleet-operated LNG trucks.16 It is also developing technology for stationary fueling stations.
Potential LNG demand in the US transport sector is also driving market activity in the supply portion of the value chain. Pivotal LNG, a subsidiary of AGL Resources, owns and operates five liquefaction facilities with a total capacity of 540,000 gpd (540 Mgpd) of LNG targeting the transport and high-horsepower (hp) markets.17 Shell announced building a small-scale liquefaction facility near its Jumping Pound gas plant in Alberta to supply its planned network of LNG fueling stations.18 GE entered into an agreement with Clean Energy to supply and finance two modular micro-LNG units capable of producing 250 Mgpd of LNG, with the flexibility to scale up to 1 MMgpd as the market develops.19 ConocoPhillips is exploring the construction of a 100-Mgpd liquefaction plant in Midlothian, Texas.20
In addition to the heavy-duty trucking market, providing LNG to high-hp applications such as rail and marine trans-portation, and offroad transport and off-grid power-genera-tion applications, is also possible. For lower-mileage fleets, a similar trend is underway in which CNG vehicles are gradu-ally replacing diesel and gasoline equivalents. As with LNG, this trend is also driven by the favorable price discount for NG. However, because of the lower energy density of CNG and resulting shorter range on a full tank, CNG vehicles are better suited to urban markets with return-to-base fleets and centralized fueling, such as metropolitan fleets of buses, refuse trucks, utility vans and trucks. More details on the US CNG market are available in the literature.21
Impact on transportation markets. The market penetra-tion of NG vehicles is supported by favorable pricing. Inciden-tally, this trend is displacing domestic consumption of diesel and gasoline. NG is expected to primarily displace diesel over time with LNG in fuel-intensive applications such as long-haul trucking and high-hp applications.
To a smaller extent, NG is expected to displace diesel and gasoline with CNG in urban return-to-base fleets. A study by the Canadian Energy Research Institute found that the US heavy-truck market is approximately 8 MM vehicles and consumes 2 MMbpd–2.5 MMbpd of crude oil-based fuels.22
According to the US Energy Information Administration’s (EIA’s) 2013 Annual Energy Outlook reference case,26 US to-tal liquid fuel consumption is estimated to be flat over the long term. By 2040, the EIA forecasts that about 1.7 tcf of natural gas (including GTL fuels) will be converted to fuel heavy-du-ty transport.
Other independent estimates of NG penetration into the transport fuel markets are more aggressive. In PIRA Energy Group’s high-case scenario, NG could displace nearly 2.4 MMb-pd of diesel by 2030, of which 1.7 MMbpd would be attribut-able to LNG usage in Class 8 trucking.23 A 2010 study by the Argonne National Laboratory21 estimated, in an aggressive sce-nario for NG vehicle market penetration (36% by 2030), that NG adoption could reduce US oil consumption by 1.6 MMbpd.
GTLAs shown in FIG. 1, the decoupling of NG and crude prices
has created a new paradigm that is reviving interest in GTL proj-ects. The price of crude is driven primarily by transportation fu-els, a market that cannot effectively leverage the US abundance of NG. GTL is a compelling alternative to the direct use of NG as a transport fuel via LNG or CNG. In the classic GTL process, NG is converted to diesel or mixed alcohols that can be blended with conventional transport fuels and would require no changes to infrastructure or engines.
GTL products are premium products; they are essentially sulfur free.24 Fischer-Tropsch (FT) diesel is a premium diesel blendstock, while FT naphtha, with its low-octane and paraf-finic nature, is better suited as ethylene feedstock or as diluent for bitumen.24
Market developments. Several US-based GTL projects have been announced. The largest GTL project is Sasol’s 96-Mbpd project in Louisiana requiring 1 billion scfd (Bscfd) of gas, and a capital investment of $11 B–$14 B.25 This translates into a capital cost of $110,000/bpd to $140,000/bpd of liquid pro-duction. Shell is also reported to be considering a 100-Mbpd GTL facility in Louisiana at a cost of $10 B.27 Even at a capi-tal cost of $200,000/bpd, GTL can have a reasonable inter-nal rate of return.24 On a smaller scale, Calumet is planning a 1-Mbpd GTL plant.28
Impact on refined products. If all of the announced US GTL projects are completed and reach full capacity by 2020, GTL could contribute nearly 200 Mbpd of liquid products to the domestic refined products pool. Based on typical yields, this could translate to a combined 160 Mbpd of distillate fuel (120 Mbpd of diesel and 40 Mbpd of jet fuel), 34 Mbpd of paraf-finic naphtha and 6 Mbpd of LPG. If the availability of cheap NG is sustained over the long term, then the success of these announced projects will serve as a stimulus for further growth in GTL capacity.
SHALE-BASED NGL—ETHANEThe shale hydrocarbon boom has played a pivotal role in
the revival of the US and global petrochemical sectors. The driver is cheap ethane recovered from shale gas plays. Ethane has grown rapidly as the preferred feedstock for ethylene, dis-placing traditional feedstocks such as refinery naphtha, gasoil
Crude (WTI spot)Natural gas (HH spot)
Low NG cost is offset by the highcapital intensity of GTL vs. refining
20100
5
10
15
20
25
30
2020
Prici
ng, 2
011 $
/MMB
tu
2030 2040
FIG. 1. The decoupling of US oil and NG prices is driving opportunities for GTL.

Gas Processing | JULY 2013 21
SPECIAL REPORT
and propane. Between 2005 and 2012, US ethane production grew at 6% CAGR from 670 Mbpd to 990 Mbpd, and it is fore-cast to double by 2020.29, 30
The prospect of long-term, cheap ethane supplies has initi-ated a slew of ethylene cracker expansions and newbuild proj-ects. The combined output of the announced projects is nearly 11 MMtpy. Industry forecasts project that around 15 MMtpy of ethylene capacity could be added from 2010–2020.31 Eth-ane cracking capacity could nearly double to about 2 MMbpd in this time frame.30 To put the capacity increase in perspec-tive, consider that present North American ethylene capacity is around 30 MMtpy, and global capacity is approximately 140 MMtpy.32, 33
US ethane supply is outpacing installed ethylene cracking capacity, creating an oversupplied market. Consequently, eth-ane pricing reached a 20-year low.34 Some analysts predict that the US ethane surplus will peak at around 5.5 MMtpy in 2015 until the new crackers come online in 2016–2017.35 If all the expansions and newbuilds are completed, then there could be a potential shortfall of 3.5 MMtpy of ethane. FIG. 2 illustrates the potential supply-demand imbalances.
Olefin crackers typically use feedstocks such as naphtha, LPG or ethane. The feedstock ethane-to-naphtha margin spread for ethylene has widened to $0.40/lb, as shown in FIG. 3.36, 37
This margin spread has driven the conversion of US crackers to ethane over naphtha. Ethane crackers produce 78% ethylene and 3% propylene relative to propane crackers, which produce 42% ethylene and 17% propylene. Naphtha crackers, mean-while, produce 31% ethylene, 16% propylene, 8% crude C4s and 28% pyrolysis gasoline and gasoil.35, 38 Therefore, switch-ing to ethane cracking results in the loss of naphtha cracker byproducts—i.e., propylene, butadiene and heavy aromat-ics—which are trading at historical highs.35 Analysts note that, despite the growth in ethylene from cheap US ethane, naphtha crackers will continue to be built in China.39
The US Internal Revenue Service ruled in October 2012 that companies converting ethane and other NGLs to olefins can be classified as master limited partnerships (MLPs). This tax designation provides an incentive for midstream players to enter the cracking market.40 The implication is that ethylene producers can derive tax benefits from the marketing, transpor-tation and storage of olefins. Estimates of tax benefits to eth-ylene producers range in the hundreds of millions of dollars.41
Ethane NGL trends and developments. As in the case for NG, the present ethane oversupply has reduced prices, thus weakening the incentive to recover ethane. On a Btu basis, eth-ane pricing was nearly at parity with NG.42 However, if the price of fractionation and transportation (approximately $0.10/gal) is backed out, the ratio of ethane price to NG drops to around 0.6, which creates an incentive for gas processors to reject eth-ane into NG.43 However, since the market is mainly large play-ers, market rebalancing could be expected quickly once major players decide to switch to ethane-rejection mode. This also indicates that the price of NG is the floor price for ethane.
The low price of US ethane has sparked interest in trans-porting it as feed to European crackers. Ineos announced a 15-year deal to purchase ethane from Marcus Hook for transport to Rafnes, Norway, in LNG tankers sourced from Evergas.43, 44
Propylene. As crackers switch from naphtha to ethane, propylene production is adversely impacted. Ethane cracking yields about 3% propylene, whereas naphtha cracking yields around 17%. Other propylene sources are refinery fluid cata-lytic cracking (FCC) units, which primarily produce gasoline. As gasoline demand declines, refinery-based propylene pro-duction will decline (with the exception of refineries that have made modifications to boost propylene yield). These changes have taken about 1.5 MMtpy of propylene capacity out of the market, with another 2 MMtpy of capacity required to meet growing demand.36 Since 2006, there has been a decline of nearly 40% in propylene capacity.46
The need for propylene capacity has led to announcements of five on-purpose propylene units, four of which are propane dehydrogenation (PDH) units and one a metathesis unit, with a combined capacity of 2.8 MMtpy. Enterprise, which is build-ing a 750-Mtpy PDH unit for 2014, already has offtake commit-ments for the plant’s entire capacity and is considering a second PDH unit.46 Other players planning new capacity include Dow Chemical Co. (750 Mtpy), Formosa Plastics (600 Mtpy) and LyondellBassell (227-Mtpy metathesis unit). Alternative routes to propylene include methanol-to-propylene, with at least one US producer reportedly considering this route.47
2012
Ethane demand (cracking)Ethane supply
2013 2014 2015 2016 2017 20180.0
0.5
1.0
1.5
2.0
Ethan
e dem
and,
MMb
pd
FIG. 2. US ethane supply-demand forecast showing the present supply surplus and future shortfalls.
Naphtha
Ethane
1998
Ethyle
ne m
argin
, by f
eeds
tock
, cen
ts/lb
-40-30
-20
-10
0
10
20
30
40
50
60
2000 2002 2004 2006 2008 2010 2012
FIG. 3. The switch from naphtha to ethane as feedstock for ethylene crackers is driven by superior margins.37

22�JULY 2013 | GasProcessingNews.com
SPECIAL REPORT
Similarly, global butadiene production has been hampered by the switch to ethane in the olefin crackers and coal-to-meth-anol-to-olefins plants in China; both processes produce very little butadiene. TPC Group has announced plans to restart its 270-Mtpy butadiene unit.48 FIG. 4 summarizes how the switch to ethane is driving changes within the supply routes for pro-pylene and butadiene.
Ethane impact on HPI. New reports indicate that US naphtha consumption by olefin crackers has dropped from 10.4 MMtpy in 2009 to 8.2 MMtpy in 2011, with the bulk of the naphtha being exported either for use as diluent for Canadian bitumen or to Asia as ethylene feedstock.49 The ratio of NGLs to refined products feeding US ethylene crackers, historically at 70:30, is now at 88:12, and it is expected to increase to 95:5.47 Result:US refiners may need to seek alternate outlets for refined prod-ucts being displaced by NGLs.
By 2020, US ethylene capacity is projected to increase to 15 MMtpy, all of which will be ethane based. Following the histori-cal market share, about 30%, or 4.5 MMtpy, of this capacity can be attributable to the displacement of refined products that would have been used as ethylene feedstock. Assuming a 31% yield of ethylene, which is typical for naphtha cracking, this translates to 15 MMtpy (300 Mbpd) of displaced refinery naphtha.
The loss of propylene production capacity due to ethane switching by steam crackers is a near-term opportunity for US refiners with FCC capacity. As gasoline demand declines, US refiners can repurpose their FCC units to boost propylene pro-duction until adequate on-purpose capacity comes onstream.
Propane and butane from shale gas. LPG consists mainly of propane and butane, and the increased production of NGLs has significantly increased US LPG production. Global LPG production is around 7.7 MMbpd and comprises 65% of glob-al NGLs production.50 North American LPG production is around 1.5 MMbpd. US propane production from shale gas has risen to 750 Mbpd from 630 Mbpd in 2011.51 Due to the oversupply, US propane prices hit a three-year low.47 Refiner-ies have historically produced about half the propane in the US, but growth is flat.52 Propane is an alternative to ethane and naphtha as a feed for steam crackers. The LPG glut in the US caused by constrained export infrastructure has led some ethylene producers to run their crackers on propane feed. But with the planned expansions in LPG export infrastructure, this trend is expected to be short-lived.
Normal butane (n-butane—hereafter, butane) is the pre-dominant C4 NGL recovered from shale gas. Between 2005 and 2012, US butane production grew at 4% compound an-nual growth rate, from 177 Mbpd to 234 Mbpd, representing less than a third of US propane volumes.29 The largest domes-tic market for butane is gasoline blending. Due to a declin-ing gasoline market and to tightening Reid vapor pressure specifications for gasoline limiting butane use, this market is not expected to grow over the long term. While butane has been used in the past as an ethylene feedstock, the prospect of cheap ethane and propane reduces its viability in that market.
Consequently, owing to flat or declining domestic LPG demand, the surge in shale-derived LPG production has prompted an increase in US exports, which rose 27% in 2012.52 LPG exports have more than doubled from the his-torical trend of 50 Mbpd53 and are constrained by the exist-ing infrastructure. This has resulted in plans to expand export capacity. Enterprise intends to increase capacity by 88% at its Houston terminal, and Targa has purchased land, dock and rail assets to expand its capacity.52 The Enterprise terminal is expected to increase export capacity to 10 very large gas car-riers (VLGCs), with Targa adding 4 VLGCs of capacity.52 US LPG is being exported to South America, displacing product from Europe.
LPG impact on HPI. The LPG surge from shale gas produc-tion has created a glut in the US, competing with refinery LPG volumes in the export and ethylene feedstock markets and ex-erting price pressure. US refiners can expect such competitive pressure until new LPG export infrastructures are expanded and, subsequently, when on-purpose C3 and C4 olefin plants using propane or butane as feedstock come onstream.
Pentanes-plus from shale gas. The pentanes-plus portion of the NGLs pool is what remains after the recovery of lighter NGLs from NG, and it is similar in composition to light naph-tha. This stream is alternatively referred to as C5
+, plant con-densate or natural gasoline. With growth in US shale gas and a shift to wet plays, C5
+ grew at 1.6% between 2005 and 2012, from 266 Mbpd to 298 Mbpd.29 Accordingly, it is a modest contributor to the shale NGLs pool and it is not growing as rapidly as lighter NGLs.
Historically, C5+ was used as a gasoline blendstock or as
a feedstock for ethylene. However, as the domestic gasoline market declines and the switch to ethane continues for ethyl-
MethanolMethane MTO Ethylene
Dehydrogenation
Steam crackers
FCC
Ethane
Propane
Butanes
Naphtha
GasoilCrude oil
Fieldnatural gas
Coal
Propylene
Butadiene
Butylenes
FIG. 4. The switch to ethane cracking is driving on-purpose propylene and butadiene and FCC propylene.
Shale gas
Natural gas fuelPower generation
Gas treatment NGLsrecovery Liquid fuels
Gas-based chemicals2
NGLsfractionation
Petrochemicals
3 4
Exports
FIG. 5. Summary of potential impacts of shale hydrocarbons on the HPI.

Gas Processing | JULY 2013 23
SPECIAL REPORT
ene production, an oversupply of C5+ is looming. Unlike lease
condensate, plant condensate is not subject to export restric-tions. It can find ready export markets such as Canada for di-luting bitumen, in Asia as an ethylene feedstock, or elsewhere as a gasoline blendstock. C5
+ will compete for these markets with refinery naphtha that is also displaced by ethane as a pet-rochemicals feedstock. Further, C5
+ used as diluent in Canada will indirectly impact the US refined products pool as more refineries process C5
+-containing bitumen.
Takeaways. The impacts of key shale gas-derived hydrocar-bons on the HPI are summarized in FIG. 5. NG will be used as a transportation fuel, particularly as LNG for heavy-duty trucking. The EIA forecasts that, by 2040, NG and its deriva-tive fuels (LNG, CNG and GTL) will replace diesel in the US market. Shale-derived ethane is rapidly growing as the feed-stock of choice for US ethylene crackers, displacing refinery naphtha, GO and LPG. Possible alternate outlets for paraffinic naphtha include exports for bitumen dilution or Asian ethyl-ene production.
The loss of propylene production capacity with the switch to ethane feedstock in steam crackers is driving plans to build on-purpose capacity for propylene and C4 olefins. As gasoline demand declines, US refiners may repurpose FCC units to boost propylene production over the short term. Due to soft-ening domestic demand, the surge of LPG from shale gas pro-duction is competing with refinery LPG volumes for export
markets and driving investments on the Gulf Coast to expand marine export infrastructure. GP
ACKNOWLEDGMENTThe article is a revised and updated version from a presentation at American
Fuels and Petrochemical Manufacturers (AFPM) Annual Meeting, March 17–19, 2013, in San Antonio, Texas.
LITERATURE CITEDComplete literature cited available at www.HydrocarbonProcessing.com.
PRAVEEN GUNASEELAN is the founder and president of Vantage Point Advisors, a consultancy focused on addressing critical business and technical challenges for clients in the oil and gas value chains. Dr. Gunaseelan has specialized expertise in gas processing, petroleum refining, chemicals, and shale hydrocarbons. He has published articles in leading trade journals and industry conferences. Prior to Vantage Point, he
worked as an engineering consultant at Exponent and as a market analyst and process engineer at Air Products & Chemicals. Dr. Gunaseelan holds a PhD in chemical engineering from Purdue University and a BS degree in chemical engineering from the University of Bombay. He is a Professional Engineer in the State of Texas.
MATT THUNDYIL of Transcend Solutions has been involved in the global energy industry since the early 1990s. Dr. Thundyil was involved in licensing, designing and manufacturing of advanced technologies. These technologies were used to improve performance and throughput of process plants in the gas processing, refining, chemical and petrochemical industries. He has extensive experience with gas processing,
refining and petrochemicals. Dr. Thundyil has co-authored a number of peer-reviewed publications and numerous presentations. He holds several US patents.
TRANSPARENT COMMUNICATION. EXPERT PLANNING. PREDICTABLE OUTCOME.TETRA TECH IS YOUR GAS PROCESSING SOLUTIONS EXPERT – NO SURPRISES.
For more than 40 years, Tetra Tech has provided innovative solutions to our clients’ most complex
challenges across the North American oil & gas market. Tetra Tech has the financial strength of a
multi-billion dollar company, with a local, client-focused delivery. We are your single solution across
the project lifecycle in the exploration and production, pipeline, and petrochemical industries.
Environmental Services | Engineering Design | Construction | Start-Up/Commissioning | Operations & Maintenance | Decommissioning/Demolition | Remediation
r clients’ most compmplelex
financial strength of a
our single solution across
hemical industries.
mmissioning | Operations
Phone +1 (281) 983-2853 | [email protected] | www.tetratech.com

www.ConstructionBoxscore.com
DISCOVER THE NEW CONSTRUCTION BOXCORE DATABASE
• Details for thousands of active, global construction projects in the refi ning, petrochemical, gas processing and LNG industries
• Streamlined Quick Search Functionality that fi lters projects by region, project type, time and company
• Contact information for key personnel
• The Boxscore Update e-newsletter sent weekly with new projects and updates
• NEW: Customized Reports
Logon to www.ConstructionBoxscore.com and discover how the HPI’s most trusted source of construction data just BECAME EVEN MORE POWERFUL!
For more information, contact Lee Nichols, Data Director, at +1 (713) 525-4626
Welcome to the NEWConstruction Boxscore Database
Hydrocarbon Processing’s Construction Boxscore Database has been redesigned and now includes additional information:

Gas Processing | JULY 2013 25
Gas-driven hydraulic fracturing and drilling cut costs, reduce environmental impactP. KULKARNI, Editor, World Oil
SPECIAL REPORT
Shale gas production has increased in the US to such an ex-tent that the Henry Hub natural gas price fell as low as $1.95 per thousand cubic feet (Mcf) in April 2012. While the price rose to $4.17/Mcf by April 2013, the US Energy Information Ad-ministration's most optimistic projection suggests a ceiling of $8/Mcf, at least until December 2014.1 This price range allows natural gas to compete effectively against oil, coal and diesel as a clean, cost-effective fuel.
The low price projection has encouraged several utilities to switch to gas-driven electric power generation and prompted downstream operators to launch new petrochemical proj-ects that use natural gas as a feedstock. Gas producers, such as Chesapeake Energy and Apache, are calling for the devel-opment of a liquefied natural gas (LNG) fueling network for truck fleets and a compressed natural gas (CNG) fueling infra-structure for automobiles.
If it makes sense to use low-cost natural gas for downstream and consumer sectors, why not use gas where it is being pro-duced—upstream oil and gas fields? An entire industry seg-ment is emerging to use wellhead gas or gas from utilities in several of its forms—liquefied petroleum gas (LPG), CNG and LNG—for both fracturing and drilling operations. Within the last five years, engine manufacturers have introduced dual-fuel systems, LNG suppliers are creating supply networks, drilling contractors are deploying gas-driven drilling rigs, and oilfield service companies are embracing CNG or gas-driven hydraulic fracturing units (FIG. 1). One technology startup has developed a high-pressure gas-injection system for gas-driven engines.
PRIME MOVER OPTIONSThe key component of gas-driven drilling or fracturing op-
erations is a prime mover in the form of either an engine or a turbine. As a substitute for compression-ignition diesel (CID) engines, several types of gas-driven prime movers are available for upstream applications, including spark-ignited natural gas (SING) engines with either lean-burning or rich-burning capa-bilities, along with high-pressure direct-injection engines and a gas turbine (TABLE 1).
Cat 3512 C (HD) engine with DGB retrofit kit. Caterpil-lar Global Petroleum has introduced a dynamic gas-blending (DGB) kit designed for gas-driven engines. The kit allows for substitution of diesel fuel with natural gas during high-pressure pumping associated with hydraulic fracturing. According to Cat-erpillar, the system can be run with CNG, LNG or field gas with
a heating value between 850 Btu and 1,250 Btu, while meeting US Environmental Protection Agency (EPA) Tier 2 emissions requirements. The system is capable of achieving fuel substitu-tion at various speeds and loads over the full operating range and will automatically adjust to changes in gas quality without the need for recalibration during and between jobs.2
GE Jenbacher J320 and Cat 3216LE gas engines. These are lean-burning engines suitable for drilling operations. A re-sistive load bank is necessary to maintain a steady condition for transient high-power requirements such as tripping. Energy is released as heat by the load bank when not required. When increased load is required, the load bank is taken off in 100-kilo-watt increments. This load bank management is accomplished
FIG. 1. Drilling rig with LNG storage and regasification units in the foreground. Photo courtesy of Prometheus Energy Group.
TABLE 1. Engine technology comparison
Engine technology
Spark-ignited, lean-burn
Spark-ignited, rich-burn Dual-fuel HPDI
Gas turbine
Power 80% 100% 100% 100% 100%
Transient response
Limited Diesel match
100% with diesel
Diesel match
Diesel match
Diesel replacement
100% 100% 70%–40% > 95% 100%
Special requirements
Load bank
NA Gas blending unit
High-pressure gas
NA

26�JULY 2013 | GasProcessingNews.com
SPECIAL REPORT
automatically by a load-management system. By maintaining a constant load over 60%, it is possible to further reduce emis-sions. Ensign Drilling is working with KRW Technologies to de-velop a battery storage system.3 The uninterruptible power sup-ply ensures constant electrical power despite variations in field gas flowrate and methane content.
GE Waukesha VHP L7044GSI gas engine. This is a 100% natural gas-fired, rich-burning engine. Compared to other spark-ignited, lean-burning engines, rich-burning engines operate at lower cylinder pressures, providing longer operational times be-tween oil changes, top-end overhauls and complete overhauls.
Westport HPDI natural gas engine. Westport Innovations Inc. has developed an LNG-fueling system with high-pressure di-rect-injection (HPDI) natural gas engine technology. The com-pany has a joint venture with Cummins and collaborations with several other manufacturers, such as Caterpillar and Wärtsilä, to implement HPDI fuel systems on large, high-speed engines in the 1,000–4,000 brake horsepower (bhp) range. An HPDI sys-
tem uses diesel fuel for engine startup and a high-pressure gas stream to achieve an overall diesel substitution rate of 95%.
GE TM2500+ aeroderivative gas turbine. In Canada, GE's trailer-mounted gas turbine is being used by Evolution Well Services for hydraulic fracturing demonstration projects in Al-berta and British Columbia. The gas turbine is connected to a Brush 170ER generator to provide 30.688 megawatts (MW) at 60 Hz or 26.19 MW at 50 Hz. The turbine is capable of operat-ing on either natural gas or liquid distillate fuels.
GAS-DRIVEN FRACTURINGJust one fracturing services company, Halliburton, purchases
100 million gallons per year (MMgpy) of diesel to fuel its fractur-ing fleet. To reduce this massive diesel fuel usage and consequent environmental impact, operator Apache Energy is working with engine manufacturer Caterpillar and fracturing services compa-nies Halliburton and Schlumberger to introduce DGB conver-sion kits for engines that drive fracture-stimulation pumps.4
Schlumberger is using wellhead gas to power up to eight stimulation pumps for Apache and Encana in Canada. Over 300 jobs were completed by March 2013 with an average 40% of diesel replacement. For Apache alone, Schlumberger is pro-viding 10 pumps with a total of 20,000 horsepower (hp) CNG-fueled fracturing power. Halliburton is providing 12 pumps with 24,000 hp, fueled by LNG.
For a well in the Stiles Ranch field in the Granite Wash play in Texas, Apache required three days to fracture a well. The use of DGB enabled Apache to use 60% gas and 40% diesel. The die-sel was priced at $3.60/gal, and the field gas was priced at $5/Mcf. Performing the job using 100% diesel would have required 31,200 gal at a cost of $112,320. Dual-fuel usage cost Apache a total of $61,253 for 12,480 gal of diesel and $4,500 for onsite gas processing. Based on such results, Chesapeake Energy is plan-ning to convert its entire fracturing fleet to run on LNG to re-duce diesel fuel consumption by 350,000 gal per day (gpd) and achieve annual savings of about $230 MM.
To complement its gas-driven engines, Caterpillar has in-troduced Cat WS223, a 2,250-bhp triplex well-stimulation (hy-draulic fracturing) pump, as well as the Cat WS255, a 2,500-bhp quintuplex well-stimulation pump.
GAS-DRIVEN DRILLINGUsing natural gas for driving drilling operations can lead to
significant cost savings, depending on the type of fuel used (TA-BLE 2). Conversion to a gas turbine-driven generator can cost up to $1.5 MM per rig. On the other hand, conversion to a dual-fuel engine-generator set costs approximately $800,000.
Multi-engine technology demonstration. Encana Oil & Gas is one of the operators of the Jonah field in the Green River basin in Wyoming. The area is leased from the US federal government. In 2006, Encana set in motion plans to drill 3,100 infill wells when regulators raised the issue of air quality. Encana brought in Ensign Drilling and other vendors to conduct a technology dem-onstration involving six different types of gas-powered engines, including lean-burning, rich-burning and dual-fuel systems.5
FIG. 2 shows a schematic of the wellhead gas treating system built at a cost of $75,000. TABLE 3 lists the emissions reductions
FIG. 2. Gas turbine-driven fracturing spread. Photo courtesy of Evolution Well Services.
Wellhead
Separator SeparatorHeater
Pico filter Pico filterBelow grade
CAT G3516genset
CAT G3516genset
Desic
cant
dehy
drat
ion180 psig
80 psig
25 psig 25 psig
4 psig 4 psig
Liquids
Triethyleneglycol dehydration
FIG. 3. Jonah field gas drilling scheme. Source: SPE 140357.
TABLE 2. Drilling cost savings based on fuel type
One drilling rig 100% diesel70% gas, 30% diesel
70% LNG, 30% diesel
Fuel/hr 72.9 gal 6.9 Mcf, 21.87 gal
85.73 gal, 21.87 gal
Cost/gasoline gal equivalent
$4 $1.48 $3.26
Cost/hr $292 $108 $238
Cost/d $6,998 $2,596 $5,700
Cost/yr $2,554,416 $947,428 $2,080,572

Gas Processing | JULY 2013 27
SPECIAL REPORT
achieved by the demonstration project. Subsequently, another demonstration project was undertaken in the Wind River basin, where treated gas supply was available as opposed to variations in wellhead gas composition that occurred while drilling in the Jonah field, when the rig was moved from one location to an-other. With a consistent gas supply, there was no need to make frequent engine adjustments.
LNG-driven drilling. In 2010, Prometheus Energy Group, En-cana and Ensign Drilling worked together to repower two diesel-fueled drilling rigs with natural gas-dedicated engines. As part of this project, Prometheus Energy designed, built and commis-sioned LNG mobile storage and vaporization equipment and provided the LNG fuel for the project. This dedicated LNG fuel application was the first of its kind.
In the absence of field gas, LNG proved to be a practical solu-tion for Encana's drilling needs, offering cost savings, diesel-like mobility and an onsite fuel reserve. After successfully testing the LNG storage and vaporization system, the units were readied for operation in the Haynesville shale play in northern Louisiana. The project enabled Encana to realize significant fuel savings vs. a drilling rig burning diesel, while also reducing nitrogen oxide (NOx) and particulate matter (PM) emissions by as much as 25%. Noble Energy ran a pilot program with two LNG-powered drilling rigs in the DJ Basin. Based on successful results, Noble plans to operate as many as seven LNG-driven rigs by late 2013. In late 2012, Marcellus operator Seneca Resources and Ensign Drilling installed two of GE's Jenbacher gas engines to power the first two LNG drilling rigs in the region. Powering a drilling rig with natural gas instead of diesel enabled Seneca to achieve 60% lower fuel costs and 25% fewer combustion emissions.
This mobile LNG solution is being used for drilling opera-tions in 11 different plays across the US, including Eagle Ford, Barnett, Wattenberg and Monterey.
Drilling with a rich-burning engine generator. In a parallel development, Antero Resources and drilling contractor Patter-son-UTI Drilling have installed gas-fired, rich-burning engines to drill in a Marcellus well near Harrison County, West Virginia. The drilling rig uses rich-burning GE Waukesha VHP L7044GSI engines. These engines can be powered by local fuel sources in the Appalachian Basin, including dry field gas, pipeline gas, LNG and
propane. The engines use nonselective catalyst-reduction technol-ogy to achieve lower NOx , CO2 and volatile organic compound (VOC) emissions values than those achieved with lean-burning engines. The rich-burning gas engines also produce substantially less methane than traditional options. Since the EPA requires the inclusion of both CO2 and methane in carbon calculations, rich-burning engines deliver a better greenhouse gas profile.
INFRASTRUCTURE CHALLENGESThe shift away from diesel-driven rigs will require consider-
able infrastructure development to deliver natural gas fuel to remote drilling locations. Wellhead gas can be used easily at pro-ducing wells, but no such gas supply is available during wildcat drilling operations. In addition, disruptions can occur in the use of wellhead gas in case of shut-ins due to production difficulties.
If LNG is used, LNG plants or fuel depots could be located at a considerable distance. For example, Chesapeake Energy's oil fields in western Oklahoma are located 500 miles away from an LNG plant. As a solution, Chesapeake plans to set up its own LNG plants to produce about 100,000 gpd of LNG at a cost of approximately $30 MM–$50 MM.
If the demand for gas-driven drilling and fracturing continues, there will be economic and environmental incentives in place for the development of LNG-fueling and CNG-fueling networks to support oil and gas fields throughout North America, with possi-ble extensions to international locations over the next decade. GP
LITERATURE CITED 1 US Energy Information Agency, “Short-term energy outlook,” May 7, 2013. 2 Henin, E., “Dual-fuel progress in reliability and performance for the oil and gas mar-
ket,” SPE/IADC Drilling Conference in Amsterdam, The Netherlands, March 2012. 3 Thompson, R. et al., “Energy storage for natural gas-fueled electric drilling rigs,” SPE/
IADC Drilling Conference in Amsterdam, The Netherlands, March 2013. 4 Bahorich, M., “Bi-fuel frac,” Oilfield Breakfast Forum, Houston, Texas, March 2013. 5 Hill, D. G. et al., “Natural gas as a fuel in drilling operations—Analysis, testing and
implementation,” SPE/IADC Drilling Conference in Amsterdam, The Netherlands, March 2011.
PRAMOD KULKARNI is the editor of World Oil. He has over 25 years of experience in writing and editing focused on oil and gas. Mr. Kulkarni earned a BS degree in electrical engineering from Utah State University, an MA degree in journalism from the University of Iowa, and an MBA degree from the University of Houston. He is a member of the US Society of Petroleum Engineers and the Society of Exploration Geophysicists.
TABLE 3. Emission results by engine type for Jonah fi eld technology demonstration project
Engine type NOx, gal/bph/hr CO, gal/bph/hr NMEOC, gal/bph/hr HCHO, gal/bph/hr PM, gal/bph/hr
Cat G3516LE 1.49 3.44 0.15 0.4 0.02
Cat G3516LE with oxidation catalyst 1.49 0.02 0 0.01 0.02
Cat 3412, Tier 2 4 2.6 0.71 NA 0.16
Cat 3412, Tier 2, combustion catalyst
3.9 2.1 0.37 NA 0.11
Cat 3412, Tier 2, dual-fuel 3.4 6.7 1.5 NA 0.16
Cat 3412, Tier 1,combustion catalyst
5.3 0.6 0.05 NA 0.06
Cat 3512, Tier 0 10.2 0.8 0.21 NA 0.04
Cat 3512, Tier 0, dual-fuel 9 5.1 0.85 NA 0.23
Cat C-18, Tier 3 3 2.1 0.13 NA 0.23

JULY 30–31, 2013Norris Conference Centers – CityCentre Houston, Texase Houston, Texas
Gulf Publishing Company is Hosting its Inaugural Gas–to–Liquids Technology Forum Gas–to–Liquids are poised to make a major impact. We invite you to be a part of this special event dedicated to the latest applications and advancements in this increasingly important area.
This exciting, two-day conference will explore: the major trends in GTL processing, including small-scale and mobile GTL units; technological and operational innovations improving capital and operating costs for GTL facilities; how GTL will cover the demand gap for petrochemical production in North America and globally; and more.
Featuring Keynotes from: • ExxonMobil (invited) • Shell (invited)
Case Studies: • Gas to Olefi ns Via Methanol Conversion: Low Cost Stranded Methane Opportunities Tara Fatima, Study Manager, Bechtel Hydrocarbon Technology Solutions, Inc.
• The development of FTS catalyst for GTL-FPSO applications Dong Ju Moon, KIST
Panel Discussion on Process Control Challenges in GTL Moderator: Syamal Poddar, President, Poddar & Associates
Panelists: Bill Poe, Senior Principal Technical Sales, Invensys; Randy Miller, Americas Sales Manager, Honeywell; Emerson; AspenTech (invited)
A complete agenda is available online.
Register today!Visit GulfPub.com/GTL or Call +1 (713) 520–4402
GulfPub.com/GTL
For more information, about participating in this event, please contact Melissa Smith, events director, at +1 (713) 520-4475 or [email protected].
For exhibitor or sponsorship opportunities, please contact your local representative or Bret Ronk, Publisher of Hydrocarbon Processing, at +1 (713) 520-4421 or [email protected]

Gas Processing | JULY 2013 29
Dynamic gas blending retrofi t kit for well stimulation applicationsCaterpillar Global Petroleum’s dynamic gas blending (DGB) retrofit
kit, for the Cat 3512C (HD) engine used in well stimulation applications, can substitute diesel with natural gas (NG), compressed natural gas (CNG), liquefied natural gas (LNG) and field gas with a lower heating value between 850 Btu and 1,250 Btu. The kit can exchange diesel with NG during high-pressure pumping operations, and it is available in both air-to-air-after-cooled (ATAAC) and separate-circuit-after-cooled (SCAC) configurations for 2,250 hp and 2,500 hp at 1,900 rpm ratings.
Fully integrated with the engine control system, the DGB kit can be installed on existing engines. The kit’s combined muffler and Cat diesel oxidation catalyst (DOC) enables engine compliance to US Environmental Protection Agency (EPA) Tier 2-level emissions. It also eliminates the need to integrate a Cat DOC with existing mufflers, and a single-engine control unit simplifies the electrical system.
www.cat.com
System tracks crude oil deliveries in real time
The TouchStar CrudePac automated electronic ticketing and invoicing system, developed specifically for crude oil and water-hauling applications, has been selected by Great Northern Midstream LLC to precisely track production deliveries of crude oil in real time. Partnering with Lunderby Trucking of Sidney, Montana, Great Northern transports thousands of barrels of oil a day via a mix of trucks, trains and pipelines.
The newly installed TouchStar CrudePac system for Great Northern is in its pilot stage. Great Northern Midstream’s man-agement is planning to expand the system fleet-wide.
www.touchstargroup.com
ABB gains more gas measurement solutions
With the acquisition of Los Gatos Research (LGR) of Mountain View, California, ABB has added a new line of high-performance gas analyzers to its measurement business. According to ABB, LGR brings new solutions to clients in the oil and gas production, combustion emissions and other industries.
LGR provides analyzers and services for measuring trace gases and isotopes in real time for research and environmental monitoring. Its analyzer technol-ogy, based on off-axis integrated cavity output spectroscopy (OA-ICOS), is said to have a higher sensitivity, precision and accuracy than traditional sampling and laser-based technologies.
www.abb.com/measurement
Variable-area fl owmeter delivers supreme performance in extreme conditions
Brooks Instrument’s MT3809 armored variable-area (VA) flowmeter is claimed to perform effectively in extreme conditions in chemicals, petrochemicals, oil and gas, and liquid petroleum gas (LPG) applications. It works accu-rately across a range of operating temperatures—from –196°C to +420°C (–320°F to +780°F)—and at pressures up to 1,380 bar (20K psi). Even in demanding applica-tions, the MT3809 delivers 2% full-scale/1.6 VDI accuracy.
The explosion-proof housing meets the most stringent hazardous-area classifications worldwide, and a flameproof option is available for IIC/Class 1 Division 1 locations.
The MT3809 VA flowmeter is not limited by application, process configuration or flowrate. It can help simplify design and maintenance and be installed quickly and easily. The flowmeter’s rugged stainless steel construction and weld-neck flanges provide long-term durability in all configurations. No back pressure is needed for gas applications, and ASME sealing specifications are met with a standard gasket.
www.brooksinstrument.com/mt3809
Modular frac manifolds off er benefi ts for shale gas fi eld operators
Skid-mounted modular frac manifolds, now available from GE Oil and Gas’ Pressure Control business, are said to safely allow simultaneous frac operations on multiple well pads. Each self-contained unit’s customized array of actuated valves, blocks and frac head outlets safely isolate each well during stimulation. Multiple manifolds can be installed side by side to accommodate specific wellsite requirements.
Other benefits include:• A unique hydraulic jacking
system to move units together for assembly, enabling quicker and safer installation
• An ergonomic handwheel at stand level within the safety zone to minimize restrictive movements
• Unit-connecting spools with a rotating flange for adjustability
• A double-acting hydraulic actuator with manual override to ensure proper flow control and shutoff
• Self-contained units that act as barriers to hold fluids and assist in preventing environmental issues.
www.ge.com
Meter measures LNG at cryogenic temperatures
Measuring liquefied natural gas (LNG) volume using Emerson Process Management’s Daniel 3818 ultrasonic meter reportedly delivers higher accuracy than static measurement methods. The flowmeter’s multiplane British Gas design, fast signal processing and advanced transducer technology provide a factory-proven linearity within
+/–0.15% and a meter factor uncertainty of +/–0.027%. Using two independent transmitters (one for each set of four chordal paths) ensures complete measurement redundancy and the ability to poll each four-path meter separately. Specialized electronics provide stable ultrasonic signals and optimal low-flow response.
Daniel 3818 flowmeters withstand product temperatures ranging from –196°C to +60°C (–385°F to +140°F). They are full-bore meters with no internal moving parts to wear or drift, providing for low pressure drop and minimizing LNG flashing risk.
www.emersonprocess.com
Dresser-Rand dry gas seals extend oil life
Dresser-Rand dry gas seals are installed on 95% of new compressors for varied services throughout the world. The seals’ advanced designs and state-of-the-art manufacturing and testing offer a full-service seal solution for existing centrifugal compressors.
Dry gas seals are said to eliminate the need for complex and costly seal oil systems and the ongoing maintenance associated with them. The seals also improve efficiency by ousting the parasitic power losses caused by oil shear and drag, and by eliminating contamination of process gas by seal lubricants.www.dresser-rand.com
30�JULY 2013 | GasProcessingNews.com
Steam reforming technology turns oil production gas into energyWith steam reforming technology, the Wärtsilä GasReformer
converts gases produced during oil production, which are abundant in heavy hydrocarbons, into a methane-rich product for use in Wärtsilä dual-fuel engines operating at full performance levels. Such gases would typically be flared and wasted.
While catalytic conversion of hydrocarbon feeds to hydrogen is a known process, the Wärtsilä GasReformer is said to represent a totally new application under very different conditions than those of the traditional process. The GasReformer is unique in its ability to convert unwanted heavier fractions from the gas into methane. By turning oth-
erwise waste gas into fuel, the system lowers operating costs while enhancing environmental sustainability.The Wärtsilä GasReformer was awarded the Offshore Technology Conference (OTC) 2013 Spotlight on
New Technology Award.
www.wartsila.com
High-effi ciency technology for the LNG industry
Dresser-Rand has a worldwide exclusive license to Expansion Energy’s proprietary VX Cycle technology. VX Cycle is believed to be the first technology to provide a cost-effective, small-scale liquefied natural gas (LNG) production process with capacities as low as 1,500 gallons per day.
The technology’s mobile, skid-mounted equipment configuration opens up various applications in markets pres-ently underserved or not served at all. Applications include the monetization of flared gas/associated gas; production of stranded natural gas fields that are not close to existing pipeline infrastructure; onsite fuel supply for drilling rigs converted to run on LNG; and production of vehicle-grade LNG, allowing LNG to compete effectively with diesel fuel.
www.dresser-rand.com
Controller for oil, gas and hydrocarbon processing applicationsThe Fisher L2e level controller is said to bring fully electric level
control to applications in oil and gas production, compression and hydrocarbon processing systems. Using a rugged, force-balanced displacer sensor, the controller detects the level of a single liquid or the interface of two liquids.
A fully electric level control loop eliminates emissions and increases uptime. Also, the control loop reportedly requires less maintenance than conventional pneumatic level loops.
L2e zero and span adjustments enable tuning for various level loop applications. Additionally, the controller is certified for use in hazardous areas and is NACE-compliant for sour service.
www.fisher.com
Bret Ronk, PublisherPhone: +1 (713) 529-4301Fax: +1 (713) 520-4433E-mail: [email protected]
SALES OFFICES—NORTH AMERICA
IL, LA, MO, OK, TXJosh MayerPhone: +1 (972) 816-6745, Fax: +1 (972) 767-4442E-mail: [email protected]
AK, AL, AR, AZ, CA, CO, FL, GA, HI, IA, ID, IN,
KS, KY, MI, MN, MS, MT, ND, NE, NM, NV, OR,
SD, TN, TX, UT, WA, WI, WY,
WESTERN CANADA Diana Smith Phone/Fax: +1 (713) 520-4449Mobile: +1 (713) 670-6138E-mail: [email protected]
CT, DC, DE, MA, MD, ME, NC, NH, NJ, NY, OH,
PA, RI, SC, VA, VT, WV,
EASTERN CANADAMerrie LynchPhone: +1 (617) 357-8190, Fax: +1 (617) 357-8194Mobile: +1 (617) 594-4943E-mail: [email protected]
DATA PRODUCTS
Lee NicholsPhone: +1 (713) 525-4626, Fax: +1 (713) 520-4433E-mail: [email protected]
SALES OFFICES—EUROPE
FRANCE, GREECE, NORTH AFRICA, MIDDLE EAST,
SPAIN, PORTUGAL, SOUTHERN
BELGIUM, LUXEMBOURG, SWITZERLAND,
GERMANY, AUSTRIA, TURKEYCatherine WatkinsTél.: +33 (0)1 30 47 92 51Fax: +33 (0)1 30 47 92 40E-mail: [email protected]
ITALY, EASTERN EUROPEFabio PotestáMediapoint & Communications SRLPhone: +39 (010) 570-4948Fax: +39 (010) 553-0088E-mail: [email protected]
UNITED KINGDOM/SCANDINAVIA,
NORTHERN BELGIUM, THE NETHERLANDSMichael BrownPhone: +44 161 440 0854Mobile: +44 79866 34646E-mail: [email protected]
SALES OFFICES—OTHER AREAS
CHINA—Hong KongIris YuenPhone: +86 13802701367, (China) Phone: +852 69185500, (Hong Kong)E-mail: [email protected]
INDIAManav KanwarPhone: +91-22-2837 7070/71/72 Fax: +91-22-2822 2803Mobile: +91-98673 67374E-mail: [email protected]
JAPAN—TokyoYoshinori IkedaPacific Business Inc.Phone: +81 (3) 3661-6138Fax: +81 (3) 3661-6139E-mail: [email protected]
This index and procedure for securing additional information are provided as a service to advertisers and a convenience to our readers. Gulf Publishing Company is not responsible for omissions or errors.
ADVERTISER INDEX
Bryan Research & Engineering ................ 10www.bre.com
Chart Industries .............................................. 2www.chart-ec.com
ExxonMobil Research & Engineering .......4www.exxonmobil.com/refiningtechnologies
Foster Wheeler ..............................................31www.fwc.com/touchofblue
Gastech Conference .....................................18www.gastechkorea.com/cotes
Gulf Publishing Company
Events—GTL Technology Forum ..........28www.GulfPub.com/GTL
Construction Boxscore .............................24www.ConstructionBoxscore.com
Pentair .............................................................32www.pentairseparations.com
Tetra Tech .......................................................23www.tetratech.com

What you can do
with atouch of blue.
Improve your refinery profitability by maximizing the production of cleantransportation fuels with our leading residue upgrading technologies.
Deliver the best in refinery hydrogen production while reducing your operating costs with our unique Terrace Wall™ reformer design.
Enhance the efficiency of your overall sulfur recovery to achieve peak operating and environmental performance with our SRU technology.
You can…
And these are just the technology options. There is so much more you can do with a touch of blue. Visit www.fwc.com/touchofblue

(936) 788-1000www.pentairseparations.com
SEPARATION SYSTEMS
Replace Water Wash & Scrubbing TowersPentair’s breakthrough patented Polarex® technology delivers improved separation of entrained and dissolved contaminants and product recovery. Gas processors, chemical manufacturers, and refiners experience higher efficiency, lower cost and operational flexibility from nano-fiber technology which creates a single stage, high efficiency contactor/separator.
Polarex® process benefits include: High efficiency, consistent CO2 removal from NGL
prior to fractionation
and minimized foundation
IMPROVE NGL TREATING,DRAMATICALLY
INTERVIEW, VIDEO & MORE