hydrocracking catalysts for vacuum gas oil and de
TRANSCRIPT

Hydrocracking Catalysts
For
Vacuum Gas Oil and De-Metallized Oil
Blend
by
Walid A. Al-Naeem
A Thesis Presented to the DEANSHIP OF GRADUATE STUDIES
In Partial Fulfillment of the Requirements for the Degree
MASTER OF SCIENCE IN
CHEMICAL ENGINEERING King Fahd University of Petroleum & Minerals
January, 2004

King Fahd University of Petroleum & Minerals DHAHRAN 31261, SAUDI ARABIA
DEANSHIP OF GRADUATE STUDIES
This thesis, written by Walid A. Al-Naeem under the direction of his thesis advisor and approved by his thesis committee, has been presented to and accepted by the Dean of Graduate Studies, in partial fulfillment of the requirements for the degree of MASTER OF SCIENCE IN CHEMICAL ENGINEERING.
Thesis Committee
Prof. M. A. Al-Shalabi (Thesis Advisor) Prof. H. H. Redhwi
(Co-Advisor)
Prof. Mohamed B. Amin Prof. M. A. Al-Saleh (Department Chairman) (Member)
Prof. Osama Ahmed Jannadi Dr. D. Al-Harbi (Dean of Graduate Studies) (Member)
Dr. Shakeel Ahmed (Member) Date
ii

DEDICATION This work is dedicated to my parents and my family
iii

ACKNOWLEDGMENT
I sincerely acknowledge the support provided by King Fahd University of Petroleum &
Minerals (KFUPM). My deep gratitude is extended to the Center of Refining and Petroleum
(CRP), KFUPM-RI for their support to make this research happen.
With deep sense of gratitude and appreciation, I would like to express my sincere thanks to
my thesis advisor, Prof. Mazen A. Al- Shalabi for his inspiring guidance and excellent
cooperation in supervising this research work. I am also very grateful to Prof. Mohammad
A. Al-Saleh, manager of CRP, and Prof H. H. Redhwi, my co-advisor, for facilitating this
research, continuous encouragement and several discussions.
I owe special thanks to Dr. Shakeel Ahmed, Research Engineer III and a member of my
thesis committee for his continuous guidance and assistance during the course of my work.
I would like to offer my sincere thanks to my thesis committee member Dr. D. Al-Harbi for
his interest and useful comments during the committee meetings.
Finally and humbly, I offer my sincere thanks to my parents and other family members for
their encouragement, supports and prayers.
(Walid A. Al-Naeem)
iv

CONTENTS
CONTENTS……………………………………………………………………………........v
LIST OF TABLES………………………………………………………………………...viii
LIST OF FIGURES………………………………………………………………………...ix
ABSTRACT.......................................................................................................................... xii ARABIC ABSTRACT…………………………………………………………………....xiii
1 Introduction and History................................................................................................... 1
1.1 Introduction................................................................................................. 1
1.2 Need for Hydrocracking Catalyst ............................................................. 2
1.3 Hydrocracking Chemistry ......................................................................... 4
1.4 Need for Hydrotreating Catalyst............................................................... 6 1.4.1 Hydrodesulfurization Chemistry .................................................................. 6
1.4.1.1 The HDS Mechanism .................................................................................... 7
1.4.1.2 The HDS catalytic active phase.................................................................... 8
1.5 Objective.................................................................................................... 12
2 Literature Survey............................................................................................................. 13
3 Experimental Approach.................................................................................................. 20
3.1 Experimental Design ................................................................................ 20
3.2 Synthesis of MCM-41 ............................................................................... 22
3.2.1 Synthesis ..................................................................................................... 22
3.2.2 Drying ......................................................................................................... 22
3.2.3 Template Removal...................................................................................... 22
3.2.4 Ion Exchange .............................................................................................. 23
3.3 Characterization of MCM-41 .................................................................. 23 3.3.1 X-Ray Diffraction....................................................................................... 23
v

3.3.2 XRD Setup.................................................................................................. 24
3.4 Catalyst Preparation ................................................................................ 25 3.4.1 Selection of Catalyst Supports.................................................................... 25
3.4.2 Selection of Impregnated Metals ................................................................ 26
3.4.3 Preparation Technique ................................................................................ 28
3.5 Catalyst Characterization ........................................................................ 30 3.5.1 Gas Sorption Analyzer (NOVA) ................................................................ 30
3.5.1.1 NOVA Operational Procedure ................................................................... 30
3.5.2 Temperature Programmed Reduction (TPR).............................................. 33
3.5.2.1 Setup of TPR ............................................................................................... 33
3.5.2.2 Operational Procedure for TPR ................................................................. 34
3.6 Catalyst Evaluation .................................................................................. 35
3.6.1 Batch Autoclave Reactor ............................................................................ 35
3.6.2 Batch Reactor Operational Procedure ........................................................ 36
4 Results and Discussion .................................................................................................... 38
4.1 MCM-41 X-Ray Diffraction (XRD) ........................................................ 38
4.2 Gas Sorption Analyzer ............................................................................. 42 4.2.1 Specific Surface Area ................................................................................. 42
4.2.2 Pore Size Distribution................................................................................. 43
4.3 Temperature Programmed Reduction (TPR)........................................ 49
4.4 Temperature Programmed Desorption (TPD) ...................................... 55
4.5 Batch Reactor Evaluation ........................................................................ 58 4.5.1 Effect of Mixing ......................................................................................... 60
4.5.2 Commercial Catalyst Testing ..................................................................... 60
4.5.3 Experimental Repeatability/Reproducibility .............................................. 61
4.5.4 Prepared Catalysts Testing ......................................................................... 61
4.5.5 Products Analysis ....................................................................................... 62
vi

4.5.5.1 Gas Chromatography ................................................................................. 63
4.5.5.2 Catalyst Selectivity...................................................................................... 66
4.5.5.3 Catalyst Activity.......................................................................................... 69
4.5.5.4 Catalyst Hydrodesulfurization (HDS) Activity ........................................... 80
4.5.5.5 Catalyst Hydrogenation Activity................................................................. 82
4.5.5.6 Carbon Formation Tendency...................................................................... 85
5 Conclusions and Recommendations .............................................................................. 87
5.1 Conclusions................................................................................................ 87
5.2 Recommendations..................................................................................... 89
APPENDIX A....................................................................................................................... 90
APPENDIX B....................................................................................................................... 92
APPENDIX C..................................................................................................................... 100
APPENDIX D..................................................................................................................... 101
LITERATURE CITED ..................................................................................................... 102
Vitae……………………………………………………………………………………….106
vii

LIST OF TABLES
TABLE 3-1 Experimental Design 20
TABLE 3-2 Feedstock Definition 21
TABLE 4-1 Prepared catalysts textural characteristics 42
TABLE 4-2 TPD of ammonia for all prepared catalysts 56
TABLE 4-3 Commercial catalyst different run conditions and product analysis 60
TABLE 4-4 Gas chromatography analysis 63
TABLE 4-5 Gas make against catalyst acidity 64
TABLE 4-6 Tested catalysts selectivity 66
TABLE 4-7 Tested catalysts conversion for 800 - 900 0F cut and 900 - 1050 0F cut 79
TABLE 4-8 Sulfur content of the products and catalyst HDS activity 80
viii

LIST OF FIGURES
FIGURE 1-1 Single stage dual catalyst hydrocracking process with recycle oil 3
FIGURE 1-2 Typical hydrocracking reactions 5
FIGURE 1-3 HDS relativity groups 7
FIGURE 1-4 Mechanism of hydrodesulfurization of DBT over sulfided
Co-Mo catalysts 10
FIGURE 1-5 Mechanism of hydrodesulfurization of DBT over sulfided
Mo catalysts 11
FIGURE 1-6 Mechanism of hydrodesulfurization of DBT over sulfided
Ni-Mo sulfides. 11
FIGURE 2-1 Composition of Hydrocracking Catalysts 14
FIGURE 2-2 Strength of Hydrogenation and Cracking Functions in Bi-functional
Catalyst 15
FIGURE 2-3 Optimum metal pairs atomic ratio 16
FIGURE 3-1 Experimental Flow Chart 21
FIGURE 3-3 XRD Setup 25
FIGURE 3-4 Flow diagram for a typical Hydrocracking Catalyst
Preparation using Comulling and Impregnation 28
FIGURE 3-5 Schematic flow diagram of Nova sorption analyzer 32
FIGURE 3-6 Temperature programmed reduction apparatus 35
FIGURE 3-7 Experimental setup of batch autoclave reactor 37
FIGURE 4-1 Showing d100, a (unit cell size), D (Framework thickness),
r (radius of the pore) and 2*r represents the pore size. 39
ix

FIGURE 4-2 Typical XRD pattern for MCM-41 40
FIGURE 4-3 XRD pattern for the synthesized MCM-41 41
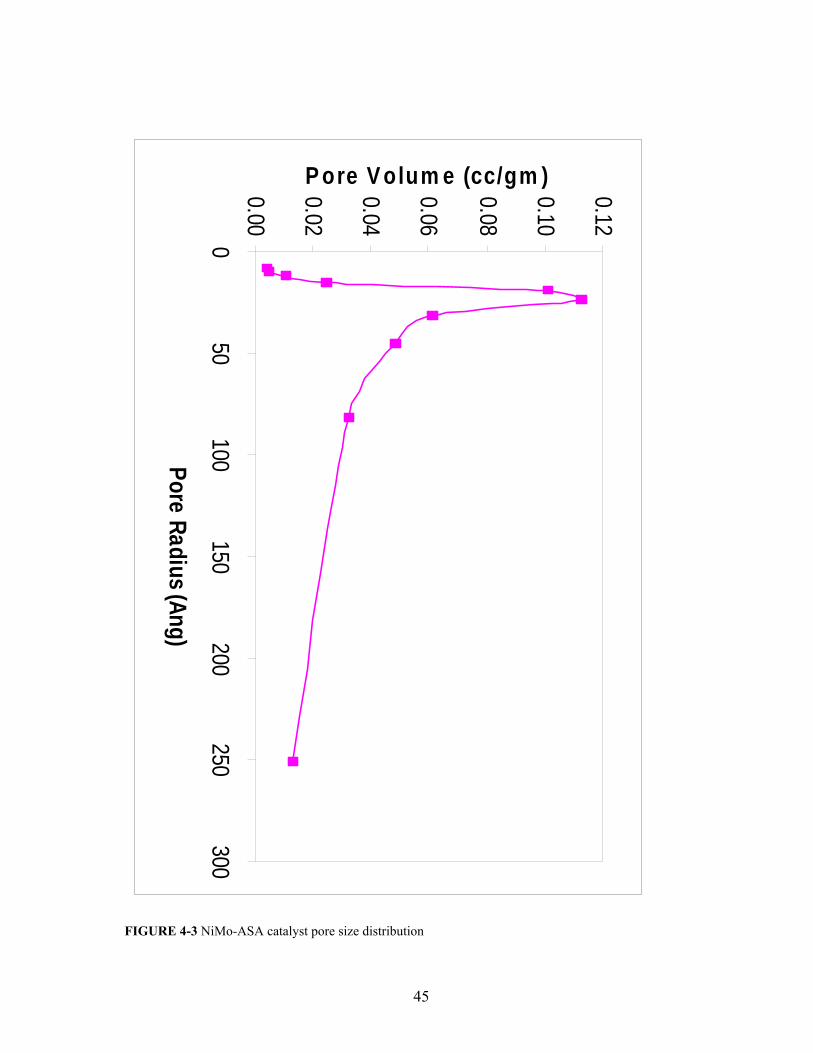
FIGURE 4-3 NiMo-ASA catalyst pore size distribution 45
FIGURE 4-4 NiMo-MCM-41 catalyst pore size distribution 46
FIGURE 4-5 NiMo-β catalyst pore size distribution 47
FIGURE 4-6 NiMo-USY catalyst pore size distribution 48
FIGURE 4-7 TPR pattern for NiMo-ASA catalyst 51
FIGURE 4-8 TPR pattern for NiMo-MCM-41 catalyst 52
FIGURE 4-9 TPR pattern for NiMo-β catalyst 53
FIGURE 4-10 TPR pattern for NiMo-USY catalyst 54
FIGURE 4-11 Superimposed graph showing TPD patterns for all prepared catalysts 57
FIGURE 4-12 Details of autoclave batch reactor 59
FIGURE 4-13 Acidity and gas make of prepared catalysts 65
FIGURE 4-14 Tested catalysts selectivity 67
FIGURE 4-15 Tested catalysts unconverted material (residue) 68
FIGURE 4-16 Simulated distillation curve for VGO/DMO blended feedstock 71
FIGURE 4-17 Simulated distillation curve for commercial catalyst product 72
FIGURE 4-18 Simulated distillation curve for NiMo-MCM-41 catalyst product 73
FIGURE 4-19 Simulated distillation curve for NiMo-β catalyst product 74
FIGURE 4-20 Simulated distillation curve for NiMo-ASA catalyst product 75
FIGURE 4-21 Simulated distillation curve for NiMo-USY catalyst product 76
FIGURE 4-22 Simulated distillation curve for the blank run product 77
FIGURE 4-23 Tested catalysts conversion for 800 - 900 0F cut and 900 - 1050 0F cut 78
x

FIGURE 4-24 Content of sulfur in the products and the HDS activity of the tested
catalysts 81
FIGURE 4-25 Hydrogenation activity 84
FIGURE 4-26 Coke deposits on tested catalysts 86
xi

ABSTRACT
Name: WALID A. AL-NAEEM
Title: HYDROCRACKING CATALYSTS FOR VACUUM GAS OIL
AND DE-METALLIZED OIL BLEND
Degree: MASTER OF SCIENCE
Major field: CHEMICAL ENGINEERING
Date of degree: JANUARY 2004
At present, the objective of Hydrocracking is to convert medium and heavy vacuum gas oil
(VGO) and possibly deasphalted oil (DAO) or demetallized oil (DMO) into gasoline lines,
jet fuels and diesel oils according to geographical and seasonal variations in demand. In
some specific cases one can try to get Liquefied Petroleum Gas (LPG) and lubricating bases.
The challenges that are posed on refiners are to employ the most suitable catalyst system
that is capable of handling large hydrocarbon molecules and heavy poly-aromatic molecules.
That certainly necessitates having large pores catalyst that can accommodate these large
molecules and perform the desired reactions. As a result, various catalyst types were
prepared throughout this work, at the same Nickel-Molybdenum metals loadings and zeolite
to alumina binder compositions. This is an attempt to spot the appropriate catalyst support
that can process VGO/DMO feed blend. The nature of the VGO/DMO is the real challenge
in this work since not many people has done research in this area. From the literature
survey, many scientists have only attempted to study catalysts performance using VGO feed
not VGO/DMO feed blend, since DMO oil is only produced in very few refineries in the
world one of them is in Riyadh Refinery at the Kingdom of Saudi Arabia.
Master of Science Degree
King Fahd University of Petroleum & Minerals
Dhahran, Saudi Arabia
January 2004
xii

ملخص الرسالة
وليدعبد اللطيف عبداالله النعيم :الإسم
DMO و VGOالمواد الحافزة للتكسير الهيدروجيني لمزيج :العنوان
ماجستير :الدرجة
هندسة آيميائية :التخصص
2004يناير :التاريخ
ر ت الحاض ي الوق ات , ف ن عملي ة م ة الغاي ة المتمثل وت الثقيل ل الزي و تحوي دروجيني ه ير الهي التكس
ادتي ة DMO و VGOبم ات بحسب الحاج يارات والمحرآ ودا للس ون وق الحة لأن تك واد ص ى م إل
غازات مسالة على بعض الحالات الأخرى هناك قدرة على الحصول في و. الجغرافية و الفصلية لكل بلد
ادتي املين في مصافي . DMO و VGOوزيوت تشحيم من خلال م ام الع إن التحديات المطروحة أم
ة وت الثقيل ع الزي ال م كل فع ل بش تطيع التعام ي تس بة الت افزة المناس واد الح ف الم ي توظي ي ف نفط ه ال
ى هذا بالتأآيد يحتم إستخدام موا . وتحويلها إلى مواد خفيفة درة عل ا الق د حافزة تتمتع بمسامات واسعة له
ة إيواء المواد الهيدروآ ذلك . ربونية الثقيلة والقيام بالتفاعلات اللازم تنادا ل م من ,إس ذا البحث ت خلال ه
د دني النيكل و المولب نم ولكن في تحضير عدد من المواد الحافزة التي تحتوي على نفس النسب من مع ي
ذا . زيوليتالمقابل تختلف في نوعية ال ة للحص ه ا هو محاول ادر العمل إنم افزة ق ادة ح ى م ى ول عل ة عل
ادتي ادتي . DMO و VGOالتعامل مع م ة م ذا DMO و VGOإن طبيع هي التحدي الحقيقي في ه
ذا . البحث حيث أن قلة قليلة من الباحثين قاموا بالبحث في هذا المجال من خلال البحث في ما آتب في ه
ة عن الموضوع تبين أن آثيرا من الباحثين اعلات الناجم ادة درسوا التف ذ VGO م ى فقط وه ا يعزى إل
ة DMOأن مادة ة بالمملك ك مصفاة الرياض الكائن ى ذل الا عل الم ومث ة من الع لا تنتج إلا في أماآن قليل
.العربية السعودية
درجة الماجستير
جامعة الملك فهد للبترول والمعادن
المملكة العربية السعودية, الظهران
2004يناير
xiii

1
Introduction and History
1.1 Introduction
Catalysis plays a fundamental role in the evolution of industrial technology, whether looking
for scientific, technical or practical point of view. The growing constraints imposed by
requirements of energy saving and environmental protection will accelerate these trends.
Material science is a prime driver for innovation or field of catalytic processes.
Developments on material science, particularly in the last decade have yielded a broad range
of porous solids, which have found application in the industrially important area of
catalysis1.
In catalytic reactions, the reactants must diffuse through the pores to reach the catalyst
surface for reaction. Transport through these pores occurs mainly by diffusion and often
affects or even controls the overall reaction rate of the process. The mechanisms by which
diffusion may proceed are highly affected by the nature of the diffusing molecules and their
interactions with the surroundings2. The following in-series steps can occur during a
heterogeneous reaction:
(a) Diffusion of reactants to the exterior of the crystal surface (external diffusion) from the
flowing stream.
(b) Diffusion of the reactants through the crystal pores (internal diffusion).
(c) Adsorption of the reactants on the crystal active sites, which is the result of the collision
between the reactant molecules and active sites.
1
(d) Chemical reaction at the active sites.
(e) Desorption of the products.
(f) Diffusion of the products through the crystal pores to the external surface of the crystal.
(g) Transfer of the product from the external surface of the zeolite crystal to the bulk
stream.
1.2 Need for Hydrocracking Catalyst
The flexibility of hydrocracking as a process for refining petroleum has resulted in its
phenomenal growth during the past 15 years. Feedstocks that can be converted to lower
boiling or more desirable products range from residue to naphtha. Products include such
widely diverse materials such as gasoline, kerosene, middle distillates, lubricating oils, fuel
oils, and various chemicals.
Commercial Hydrocracking is carried out in a single (Figure 1-1) or in two stages in series.
Numerous hydrocracking catalysts have been developed and the more recent of these have
exceptionally long lives even at severe operating conditions. The choice of catalysts and of
the particular process scheme will depend on many factors such as feed properties, desired
products properties, size of the hydrocracking unit, and various other economic
considerations.
2

FIGURE 1-1 Single stage dual catalyst hydrocracking process with recycle oil 3
3

1.3 Hydrocracking Chemistry
The reactions that occur during the Hydrocracking process take three major routes:
1. Non-catalytic thermal cleavage of C-C bonds via hydrocarbon radicals, with hydrogen
addition (hydropyrolysis).
2. Monofunctional C-C bond cleavage with hydrogen addition over hydrogenation
components consisting of metals (Pt, Pd, Ni, Mo, Co), oxides, or sulfides
(hydrogenolysis).
3. Bifunctional C-C bond cleavage with hydrogen addition over bifunctional catalysts
consisting of a hydrogenation component dispersed on a porous, acidic support. In
petroleum refining, most hydrocracking reactions follow this route.
In addition to the above reactions, there are other reactions that take place during the
hydrocracking processes. These reactions are called hydrotreating, which include hydro-
desulfurization (HDS), hydro-denitrofication (HDN), hydro-deoxigenation (HDO), olefin
hydrogenation, and partial aromatics hydrogenation.
In an attempt to better understand the reaction chemistry of the hydrocracking process for
various industrial feedstocks, a series of kinetic studies were carried out for individual
hydrocarbons (Model Compounds) 4, 5, 6, 7. Kinetic models have been developed for
hydroisomerization and hydrocracking of model compounds, such as n-heptane, n-octane, n-
decane, and n-dodecane over zeolite or amorphous catalysts. These kinetic models can be
satisfactorily described by using Langmuir-Hinshelwood models; such models are difficult
to apply to petroleum fractions. The kinetic study of reactions occurring during
hydrocracking of petroleum feedstocks is considerably difficult because the process involves
a network of complex reactions and numerous components.
4

FIGURE 1-2 Typical hydrocracking reactions 3
5

1.4 Need for Hydrotreating Catalyst Hydrotreating is a catalytic process that simultaneously dehydrogenates, cracks and
hydrogenates the feedstocks, removing nitrogen, sulfur, oxygen, metal and aromatic
constituents. Hydrotreating is a part of a complex process to remove undesirable
impurities and lower the molecular weight of heavy petroleum feed stocks in presence of
hydrogen and suitable catalyst. Technique of removing sulfur is known as
hydrodesulfurization. Analogous procedure for nitrogen and metal removal are
hydrodenitrogenation and hydrodemetalization respectively.
1.4.1 Hydrodesulfurization Chemistry
Sulfur is the most abundant heteroatom in crude oils. Sulfur is in the form of thiols
(mercaptanes), sulfides, disulfides, thiophene and thiophene derivatives.
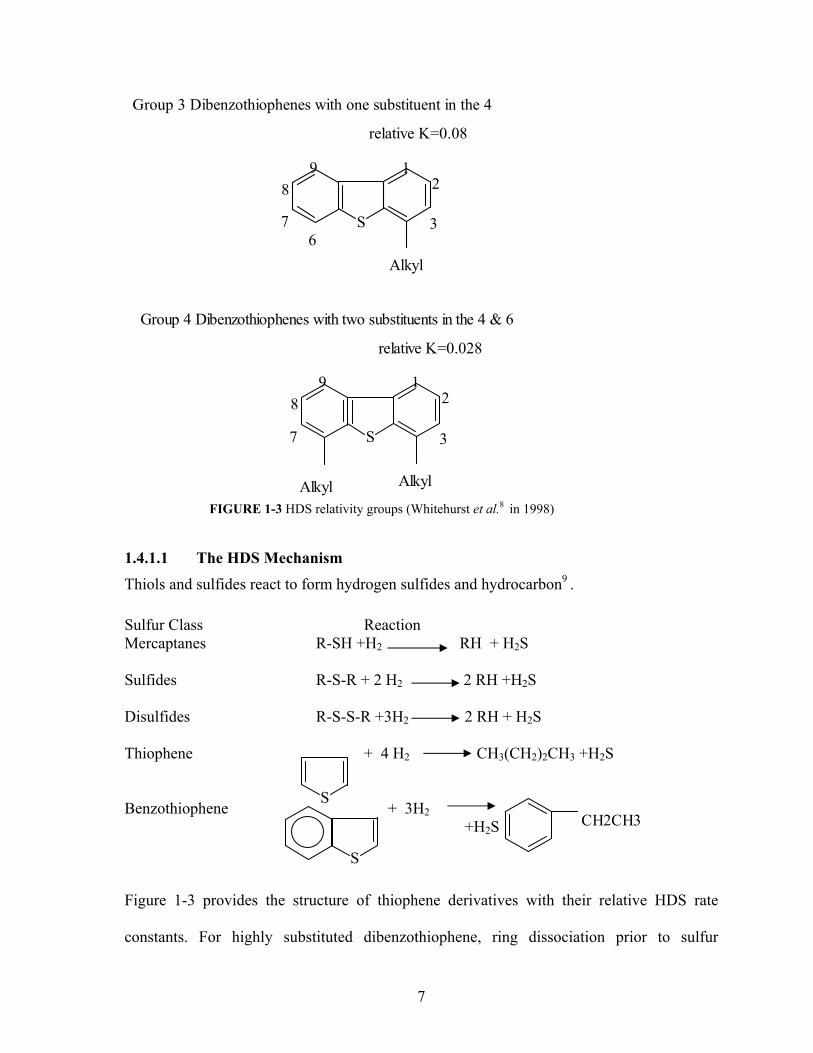
The reactivity of thiophene decreases in the order of
Thiophene> benzothiophene>dibenzothiophene> thiophene derivatives.
S
7 6
5 4
3
2
relative K=1
Group 1 Benzothiophene with no substituents in the 2 or 7
S
relative K=0.23
Group 2 Dibenzothiophenes with no substituents in 4 & 6
9 8
7 3
21
6 4
6
S
relative K=0.08
Group 3 Dibenzothiophenes with one substituent in the 4
9 8
7 6
3
21
Alkyl
S
relative K=0.028
Group 4 Dibenzothiophenes with two substituents in the 4 & 6
98
7 3
21
AlkylAlkylFIGURE 1-3 HDS relativity groups (Whitehurst et al.8 in 1998)
1.4.1.1 The HDS Mechanism Thiols and sulfides react to form hydrogen sulfides and hydrocarbon9 .
Sulfur Class Reaction Mercaptanes R-SH +H2 RH + H2S Sulfides R-S-R + 2 H2 2 RH +H2S Disulfides R-S-S-R +3H2 2 RH + H2S Thiophene + 4 H2 CH3(CH2)2CH3 +H2S Benzothiophene + 3H2
+H2S
SCH2CH3
S
Figure 1-3 provides the structure of thiophene derivatives with their relative HDS rate
constants. For highly substituted dibenzothiophene, ring dissociation prior to sulfur
7

extrusion is the major route to hydrocarbon production as, relative to the parent molecules,
aliphatic constituents on aromatic ring carbons adjacent to the sulfur atom impose severe
steric hindrance towards bonding to the catalyst surface and to the production of appropriate
intermediate species.
1.4.1.2 The HDS catalytic active phase
Hydrodesulfurization is carried out over sulfides of molybdenum or tungsten, and promoted
with cobalt or nickel. Hydrodesulfurization represents a number of different reactions, which
are discussed in previous sections.
Molybdenum sulfide alone shows high activity for direct sulfur extrusion from sulfur
compounds such as thiophene10. Molybdenum sulfide has graphite-like stacked lamellar
structure. Molybdenum sulfide can be visualized as a sandwich of the metal between two
sulfur layers. The chemical reactivity of molybdenum sulfide is attributed to molybdenum
cations. Sulfur anions in the basal planes of molybdenum sulfide are more difficult to
remove than anions at corners and edges. Therefore, there will be a greater number of
exposed molybdenum ions at the edges and corners of the molybdenum sulfide sandwich.
The sulfur atom of the sulfur-containing compound adsorbs to the exposed molybdenum ion
at a sulfur vacancy through a one-point attachment. This is followed by hydrogen transfer
and sulfur elimination to complete desulfurization. the addition of small amounts of the
sulfides of a second metal such as cobalt or nickel enhances activity of molybdenum sulfide
was established in as early as 1928 8. The monolayer model, attributing activity to highly
dispersed molybdenum oxy-sulfides bound strongly to the support, was the first explanation
offered by Lipsch and Schuit11and Massoth12. The monolayer model suggests that cobalt is
located deep inside the support. This was followed by the pseudo-intercalation model which
8

believed that cobalt when intercalated at the edges of the layers of molybdenum sulfide
created the active phase13 .
The most widely accepted model of the HDS active phase, now, is the Co-Mo-S model
postulated on the basis of Mossbaauer spectroscopic experiments by Topsoe et. al.14 and
Wivel15. The catalytically active Co-Mo-S phase consists of small stacks of molybdenum
sulfide with cobalt atoms decorating the edges of the layered molybdenum sulfide structures.
It may also contain cobalt ions firmly bound to the support and crystallites of Co9S8 which
has a lower activity for HDS. Depending on the relative proportions of cobalt and
molybdenum and on the pretreatment, a sulfided catalyst contains either a relatively large
amount of Co9S8 or a large amount of the Co-Mo-S phase16. Notwithstanding debate on the
role of the promoter, molybdenum sulfide is widely accepted as the basic active phase for
HDS catalysis.
A hydrogenolysis catalytic circle during HDS over sulfided Co-Mo catalysts is proposed by
Hensen et. al.17, which is as shown in figure 1-4. The mechanism briefly describes the
possible reaction steps involved on the local sites. It is assumed that gaseous hydrogen
adsorbs dissociatively on the surface of the catalysts and that the hydrogen species
consumed in the reaction are supplemented by means of spillover on the surface. Similarly,
the HDS reaction mechanism over Mo/MCM41 is as shown in figure 1-5. The cleavage and
formation of bonds take place between the edged Mo atom and its neighboring Mo atom.
Since the strength of Mo-S bond is higher than the Co-S bond, Mo-S attached to the edged
Mo atom is more difficultly cleaved than the Co-S bond. Consequently, the HDS reaction
rate over Mo catalyst is lower than that over Co promoted Mo catalyst.
9

Nagai18 proposed a mechanism for Ni-Mo sulfides in figure 1-6, which briefly describes the
possible reaction steps involved on the local site. It was assumed that gaseous hydrogen
adsorbed dissociatively on the surface of catalysts and that the hydrogen species consumed
in the reaction were supplemented by means of spillover on the surface.
FIGURE 1-4 Mechanism of hydrodesulfurization of DBT over sulfided Co-Mo catalysts1.
10

FIGURE 1-5 Mechanism of hydrodesulfurization of DBT over sulfided Mo catalysts1.
FIGURE 1-6 Mechanism of hydrodesulfurization of DBT over sulfided Ni-Mo sulfides1.
11

1.5 Objective The intent of this research work is summarized as follows:
1. Prepare hydrocracking catalysts based on four different supports that vary in terms of
porosity and acidity. These supports are:
• Ultra Stable Y (USY) zeolite.
• β zeolite.
• MCM-41 material.
• Amorphous Silica Alumina (ASA).
2. Synthesize MCM-41 to be used as a support for hydrocracking catalysts since this is not
commercially available.
3. Test the prepared catalysts with a heavy feed composed of vacuum gas oil (VGO) and
demetallized oil (DMO) blend. The blend ratio will be 85/15 volume % of VGO and
DMO respectively.
4. Compare the prepared catalysts with a reference commercial catalyst with the same feed
and operating conditions.
5. Identify the catalyst that is competitive to the commercial catalyst and has potential to
function in commercial hydrocracking units with the above feed blend.
12

2
Literature Survey
Most of the hydrocracking catalysts of commercial interest are dual functional in nature,
consisting of both a hydrogenation-dehydrogenation component and an acidic support. The
reactions catalyzed by the individual components are quite different. In specific catalysts,
the relative strengths of the two components can be varied. The reactions occurring and the
products formed depend critically upon the balance between these two components 3.
The acidic function of the catalyst is supplied by the support. The acidic support consists of
(a) amorphous oxides (e.g. silica alumina) (b) a crystalline zeolites (mostly modified Y
zeolites) plus binder (e.g. alumina) or (c) a mixture of crystalline zeolites and amorphous
oxides. Moreover, among the supports are silica-alumina, silica-zirconia, silica-magnesia,
alumina-boria, silica-titania, acid-treated clays, acidic metal phosphates, alumina, and other
such solid acids.
The metals providing the hydrogenation-dehydrogenation functions can be noble metals
(palladium, platinum), or non-noble metal sulfides from group VIA (molybdenum, tungsten)
and group VIIIA (cobalt, nickel). These metals catalyze the hydrogenation of the feedstock,
making it more reactive for cracking and heteroatom removal, as well as reducing the coking
rate 19. They also initiate the cracking by forming a reactive olefin intermediate via
dehydrogenation.
13

Hydrocracking C
atalyst (D
ual Function)
Cracking Function(A
cid Support)H
ydrogenation Function(M
etals)
Am
orphous(SiO
2 -Al2 O
3 , A
l2 O3 ,
X-A
l2 O3 )
X=halogen
Low
Zeolite / A
morphous
(Modif. Y
/ SiO
2 -A
l2 O3 )
High Zeolite +
Binder
(Modif. Y
+ A
l2 O3 )
Noble
Metals
(Pt, Pd)
Non-noble m
etals[ M
x Sy from
grVIA
(Mo,
W) + grV
IIIA (C
o, Ni)]
FIGURE 2-1 Composition of Hydrocracking Catalysts 3
14

Co/Mo < Ni/Mo < Ni/W < Pt(Pd) Hydrogenation function
Increasing hydrogenation activity (in low-S environment)
Al2O3 < Al2O3 – halogen < Si2-Al2O3 < zeolite Cracking function
Increasing cracking activity (acidity)
FIGURE 2-2 Strength of Hydrogenation and Cracking Functions in Bi-functional Catalysts 3
Since hydrocracking of industrial feedstocks is to be carried in presence of hydrogen sulfide
and organic sulfur compounds, the metal site has to be in a metal sulfide form of the VIA
group promoted by a nickel or cobalt sulfide. Figure 2-3 presents the results obtained when
toluene is used as a model molecule in the presence of hydrogen sulfide. It can be inferred
from this figure that for every couple of sulfides, the activity passes through a maximum
when the atomic ratio ρ ≈ 0.25 20. The atomic ratio is the Ni or Co wt-% by the total wt-%
of Ni (or Co) & Mo (or W). Gary et al. has found out that the addition of Ni and more Mo to
the support had surprisingly little effect on catalyst activity 21.
15

FIGURE 2-3 Optimum metal pairs atomic ratio 20
The ratio between the catalyst’s cracking function and hydrogenation function can be
adjusted in order to optimize activity and selectivity. For hydrocracking catalysts to be
effective, there should be a rapid molecular transfer between the acid sites and
hydrogenation sites in order to avoid undesirable secondary reactions. Rapid molecular
transfer can be achieved by having the hydrogenation sites located in the proximity of the
cracking acid sites 20.
Khorasheh et al. 21 analyzed the gas oil and found evidence for sequential hydrogenation
and cracking to yield more 4- and 6-carbon products. At high temperatures, the thermal
reactions would also compete with the catalytic reactions for the local supply of dissolved
16

hydrogen. Moreover, he and his colleagues have conducted experimental work on
hydrocracking of residues from Alberta Bitumens. They concluded that Ni-Mo catalyst was
the most active material for most indices of performance, e.g. hydrodesulfurization (HDS),
residue conversion, etc. They observed that Ni-Mo catalyst had very significant effect to
boost the yield of gas oil around 10% higher than Mo on γ-alumina catalyst. This finding
signifies the importance of Nickel promoter to achieve more activity and selectivity towards
gas oil.
Shakeel et al. 19 had prepared zeolite based hydrocracking catalysts on two different
supports by mixing the steam modified Y-zeolite with commercial γ-alumina CP-100 in
ratios of 50:50 and 30:70 respectively. On these mixtures of zeolite and alumina, Ni-Mo
and Ni-W were sequentially impregnated. It was observed that catalysts containing
Molybdenum have higher surface area as compared with those having tungsten as base
metal. This could be explained on the basis of ionic radii of these metals. The other major
finding that was observed is that Ni-Mo catalysts showed relatively better HDS activity as
compared with Ni-W catalysts. Moreover, the Ni-Mo catalyst on the 30:70 zeolite to γ-
alumina ratio showed a slightly higher VGO conversion and gas oil production than the
50:50 ratio support. Besides, having more zeolite means more acidity. Too high an acidity,
results in too strong an adsorption of the heaviest species and then in a formation of coke
deposits 20.
The above finding is in-line with Franck et al. 20 who found that Ni-Mo has relatively
similar activity to Ni-W and at the same time is a lot cheaper and is generally selected for
commercial catalyst production.
17

A. Hassan et al. 22 have studied the effects of the metals co-impregnation and successive
impregnation on various β and USY zeolite based catalysts. One of their findings is that the
co-impregnation of Ni-W on the various supports showed higher surface area, m2/g, and
pore volume, cm3/g, than the successive impregnation.
M. A. Ali et al. 23 have studied various support compositions composed of USY zeolite,
β zeolite, and Amorphous Silica Alumina (ASA). They found that the β-zeolite based
catalysts produced higher amounts of naphtha and lower amounts of kerosene and gas oil
fractions while USY based catalysts produced higher amounts of gas oil and lower amounts
of kerosene and naphtha.
In light of the above, it is apparent that there are numerous support alternatives that can be
used for preparing hydrocracking catalysts. These supports vary in terms of pore sizes and
acidity. ASA has the biggest pores which makes it attractive support for heavy hydrocarbon
molecules. Whereas, β and USY zeolites, have more acidity and products selectivity in
terms of gas oil and naphtha. Additionally, MCM-41 material which was recently
discovered by Mobil researchers became an attractive alternative in the area of
hydrodesulfurization of heavy petroleum distillates. This is due to the fact that the size of
the pores in these materials can be varied according to the synthesis procedure between 20 to
100 A0 24. MCM-41 also has mild surface acidity compared to β and USY zeolites. The
mesoporous feature of this zeolite can be used to accommodate very large hydrocarbon
molecules such VGO and DMO with little fear of mouth-plugging of the catalyst pores.
In addition, the research institute (RI) of King Fahd University of petroleum and minerals
(KFUPM) has successfully attempted to synthesize MCM-41 material. This material was
18

used as a catalyst support for several metals and tested against VGO feed. Complete details
can be found in R. Ahmed Khan master thesis 1.
In conclusion, scientists are continually conducting research to optimize the zeolite porosity
to accommodate large molecules. It has been always the interest of researchers to come up
with zeolites that have mesoporous property especially in the area of Hydrocracking. This is
obvious from the research that was conducted by Y. Hashimoto et al. 25 where they tried to
modify a commercial zeolite with titanium sulfate to generate a zeolite with mild acidity,
mesoporous property, and high hydrogenation activity.
19

3
Experimental Approach
3.1 Experimental Design
This section describes the design of the experiments that will be conducted throughout this
work. Table 3-1 specifies all variables and conditions that will be taken into consideration
during this study. Table 3-2 shows the properties of the feedstock that will be used to test
the catalyst. In addition, figure 3-1 shows the flowchart and the scenario of the experimental
work of this study. Table 3-1, table 3-2 and figure 3-1 represent the domain and scope of
this research work.
TABLE 3-1 Experimental Design
Catalyst Systems
Catalyst Preparation Commercial NiMo-
MCM-41 NiMo-USY
NiMo-β
NiMo-ASA
γ-alumina binder, wt% 70 70 70 70 Support, wt% 30 30 30 30 NiO, wt% 2.5 2.5 2.5 2.5 MoO3, wt% 12 12 12 12 Ni, wt% 2 2 2 2 Mo, wt% 8 8 8 8 Atomic Ratio 0.2 0.2 0.2 0.2 Catalyst Characterization Surface Area, m2/g 324 300 313 186 Pore Vol., cm3/g 0.4 0.35 0.41 0.33 Pore Size, Angstrom 25 23 26 36 Acidity, mmol/gm 0.33 0.59 0.56 0.5 Catalyst Evaluation Batch Reactor No. of Runs 5 1 1 1 1 Temperatures, deg. C 410 410 410 410 410 Pressures, kg/cm2 150 150 150 150 150 Feed weight, g 100 100 100 100 100 Catalyst weight, g 3 3 3 3 3
20

TABLE 3-2 Feedstock Definition
Feedstock Properties VGO DMO VGO/DMO
85% / 15%
Specific Gravity 0.92-0.93 0.96-0.97 0.93-0.94
Total Nitrogen, wt ppm 700-900 1300-2100 1100-1200
Total Sulfur, wt% 2-3 3-3.5 2.6-2.8
ASTM Distillation, D2887
5%, 0C 279 402
50%, max 0C 472 596 495
90%, max 0C 543 678 615
Ni + V wt. ppm < 1 8.0-13.5 2-3
21
MCM-41 Preparation
Catalyst Preparation
Catalyst Characterization NOVA, TPD, TPR
Feedstock Preparation & D2887 Simdist.
Catalyst Evaluation With Batch Reactor
Product Analysis
FIGURE 3-1 Experimental Flow Chart

3.2 Synthesis of MCM-41
3.2.1 Synthesis Synthesis of MCM41 based molecular sieves is done in alkaline medium. One of the main
steps in preparing molecular sieves is preparation of the gel i.e. mixture of inorganic species,
template and metal. A number of parameters in a gel preparation process can affect the
resultant phases. These include pH, molar ratio of reactants, aging, stirring, addition
sequence of reactants, etc 26.
After the preparation of the homogeneous gel, it needs to be transferred to an oven that is
maintained at 370oK temperature for 4 days. During these 4 days pH is maintained at 10.5.
Upon the completion of the 4 days, the mixture will be separated normally by filtration with
extensive washing in order to remove any unwanted species such as sodium ions, chloride,
nitrate etc.
3.2.2 Drying After the solution is filtered we will get a cake, which should be dried in an oven at 370oK at
atmospheric pressure, overnight. Prolonged drying of MCM-41 based materials might result
in partial removal of the template molecules.
3.2.3 Template Removal Template removal will be done by calcination. The procedure for calcination of as-
synthesized sample is as follows:
1. Temperature is increased from room temperature to 120 0C at 10 0C /min and
maintained for 30 minutes.
2. Temperature is increased from 120 0C to 250 0C at 2 0C /min and maintained for 30
minutes.
22

3. Temperature is increased from 250 0C to 550 0C at 100C /min and maintained for 6
hours.
3.2.4 Ion Exchange To activate MCM-41, it should be ion exchanged with 0.1 M ammonium nitrate solution.
Ion exchange process is as follows:
1. Add catalyst to ammonium nitrate solution in a beaker and solution is stirred
continuously. For every 10 gm of catalyst, 150 ml of ammonium nitrate is used.
2. Change ammonium nitrate solution after every 24 hours. Keep stirring.
3. After 3 days filter the sample and dry it in the oven overnight.
4. Calcine the sample with temperature program similar to template removal except that
temperature will be decreased to 500 0C only instead of 550 0C.
3.3 Characterization of MCM-41 3.3.1 X-Ray Diffraction The various samples of MCM41, being crystalline, have characteristic X-ray powder
diffraction patterns, which are used for their identification. X ray diffraction patterns of as-
synthesized and calcined mesoporous samples show characteristic peaks of 100, 110 and
210. X-ray diffraction patterns from typical catalyst powders give information about
interplanar lattice spacing through Bragg's equation.
2*d*sinθ=nλ
Where
d is interplanar spacing.
Θ is angle between lattice plane and both the incident and diffracted X ray beam.
23

n is order of Bragg's reflection.
Λ is the wavelength of the X-rays.
Combined with fact that intensities of diffraction lines depend on the arrangement of atoms
in unit cell of crystal lattice, this information in principle provides an almost unique
description of nature of the crystalline phases present. However in practice the interpretation
of diffraction patterns may not always be trivial as catalysts often contain many different
phases. The equipment is used to measure the crystalline pattern of the synthesized sample
by step measurement method. The diffraction pattern is generated by a 2-theta/ theta
scanning diffractometer.
The operating conditions of XRD analysis is:
Cu broad focus tube at 40 Kv and 30ma.
Scanning speed and interval of data collection was 0.01 degree two theta/sec.
Angle scanned: 1 to 10 two theta.
3.3.2 XRD Setup X ray Diffraction (XRD) experiments were done on system supplied by Jeol Ltd., (model
JDX-3530) employing a multicomputer system, 32-bit engineering workstation as a core of
the system, for improving the data processing capability. The multi-task and multi-window
allows parallel execution of measurement and data processing, and serial execution of
measurement, data processing and result output. Measured results are displaced on the high-
resolution color CRT for easy observation of measurement results. Outline of diffraction
optics is given in figure comprising of arrangement of X ray source, X ray source side soller
slit, divergence slit, receiving slit, scattering slit, X ray detector. A picture of XRD setup is
given in figure 3-3.
24

FIGURE 3-3 XRD Setup
3.4 Catalyst Preparation Hydrocracking catalysts can be prepared by variety of methods. Although there is a
relationship between the catalyst formulation, preparation procedure, and catalytic
properties, the details of that relationship are not always well understood due to the complex
nature of catalytic systems 3.
3.4.1 Selection of Catalyst Supports Shakeel et al.29 observed in his study that Ni-Mo catalysts had relatively better HDS activity
as compared with Ni-W catalysts. Moreover, the Ni-Mo catalyst on the 30:70 zeolite to γ-
alumina ratio showed a slightly higher VGO conversion and gas oil production than the
50:50 ratio support. Besides, having more zeolite means more acidity. Too high an acidity,
results in too strong an adsorption of the heaviest species and then in a formation of coke
deposits 20.
25

In addition, it is apparent that there are numerous support alternatives that can be used for
preparing hydrocracking catalysts. These supports vary in terms of pore sizes and acidity.
ASA has the biggest pores which makes it attractive support for heavy hydrocarbon
molecules. Whereas, β and USY zeolites, have more acidity and products selectivity in
terms of gas oil and naphtha. Also, MCM-41 which was recently discovered by Mobil
researchers became an attractive alternative in the area of hydrodesulfurization of heavy
petroleum distillates.
In light of the above, it was decided to use the above mentioned supports as basis of our
research work. Moreover, 30:70 support to γ-alumina binder ratio as catalyst supports will
be used for all of the catalyst preparations trials that will be carried out. Four supports will
be mixed with the γ-alumina binder and will be used throughout this work. These supports
are USY, β, MCM-41, and amorphous silica alumina.
3.4.2 Selection of Impregnated Metals In reference to figure 2-3, it can be inferred that for every couple of sulfides, the activity
passes through a maximum when the atomic ratio ρ ≈ 0.20 15. The atomic ratio is the Ni or
Co wt-% by the total wt-% of Ni (or Co) & Mo (or W). Gary et al. has found out that the
addition of Ni and more Mo to the support had surprisingly little effect on catalyst activity
21. Moreover, Khorasheh and his colleagues 21 have conducted experimental work on
hydrocracking of residues from Alberta Bitumens. They concluded that Ni-Mo catalyst was
the most active material for most indices of performance, e.g. hydrodesulfurization (HDS),
residue conversion, etc. They observed that Ni-Mo catalyst had very significant effect to
boost the yield of gas oil around 10% higher than Mo on γ-alumina catalyst. This finding
signifies the importance of Nickel promoter to achieve more activity and selectivity towards
26

gas oil. The above findings have led to the decision to use atomic ratio (ρ) of 0.20 by
impregnating 2.0 wt% Nickel and 8.0 wt% Molybdenum.
27
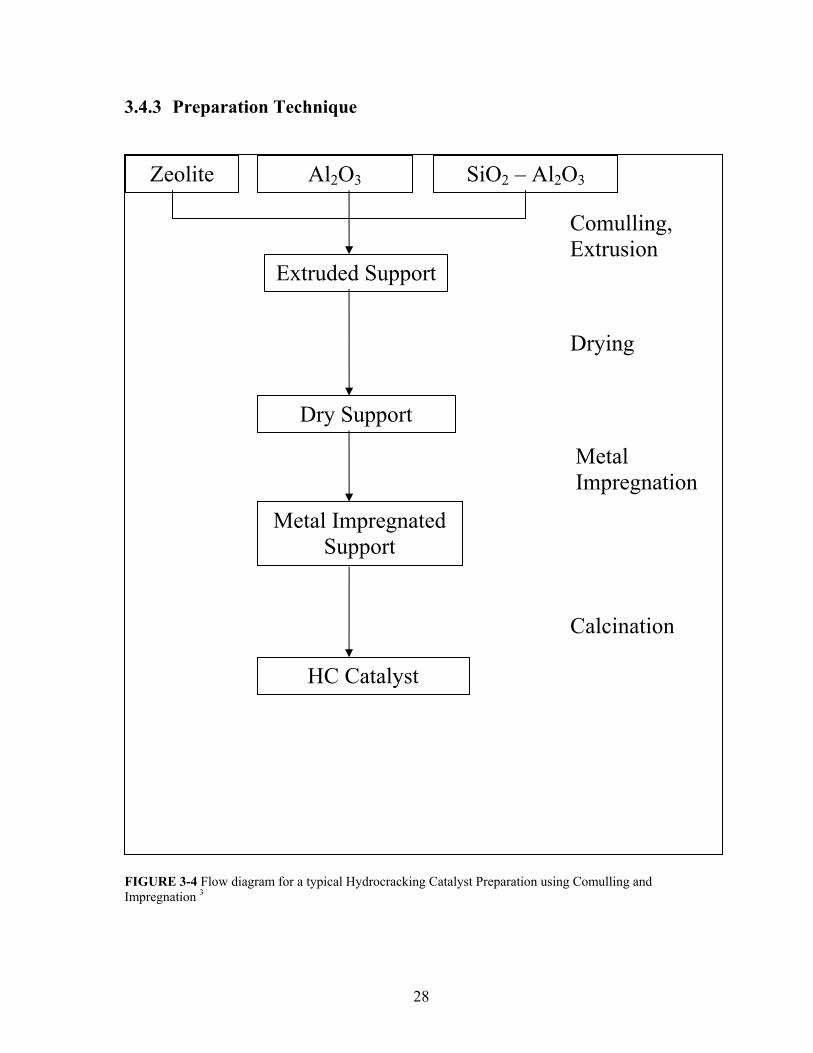
3.4.3 Preparation Technique
Zeolite Al2O3 SiO2 – Al2O3
Comulling, Extrusion
Extruded Support
Drying
Dry Support
Metal Impregnation
Metal Impregnated Support
Calcination
HC Catalyst
FIGURE 3-4 Flow diagram for a typical Hydrocracking Catalyst Preparation using Comulling and Impregnation 3
28

1. Comulling and Extrusion—30-wt% of the support will be physically mixed with 70-wt%
alumina binder until homogeneity is achieved. Distilled water will be added to this
homogenous mixture to form dough which will be then extruded using a syringe. The
metal support can be either zeolites or amorphous.
2. Drying—the extruded catalyst will be dried overnight in the oven at 110 0C to reduce the
moisture level on the catalyst support.
3. Calcination—this step is applied before and after metal impregnation of the catalyst
formed. This step is to eliminate water, volatile and unstable cations or anions as well as
organic compounds. This step is crucial since it determines the physical and the
catalytic properties of the catalyst. Moreover, surface area, pore size distribution,
stability, attrition resistance, crushing resistance, as well as catalytic activity are affected
by the drying and calcinations conditions. Excessive calcinations conditions may result
in structural collapse of the support, loss in surface area, loss of smaller pores, and
destruction of active sites. The procedure for calcination of prepared samples is as
follows:
1. Temperature is increased from room temperature to 120 0C at 10 0C /min and
maintained for 30 minutes.
2. Temperature is increased from 120 0C to 250 0C at 2 0C /min and maintained for 30
minutes.
3. Temperature is increased from 250 0C to 550 0C at 100C /min and maintained for 4
hours.
4. Impregnation—this step is to incorporate a metal component into a performed
catalyst support. This method is the most common method for manufacturing
29

hydrocracking catalysts. In addition, several impregnation methods can be applied:
(a) Dipping (b) Incipient Wetness (c) Evaporative Impregnation. The last two
methods are the common ones for manufacturing industrial hydrocracking
catalysts27. In our work, we will use the incipient method.
3.5 Catalyst Characterization 3.5.1 Gas Sorption Analyzer (NOVA) Accurate sorption measurements of a gas on solids surface will be carried out in NOVA-
1200 system supplied by Quanta chrome Corporation. A schematic flow diagram of
apparatus is given. NOVA is an acronym for NO VOID ANALYSIS which measure
multipoint BET surface area, single point BET surface area, total pore volume, average pore
radius, sample volume, density, twenty five point adsorption isotherms, twenty five points
desorption isotherms.
3.5.1.1 NOVA Operational Procedure Procedure for pretreatment and subsequent experiment is as follows:
0.25 gm of catalyst sample is weighed and is placed in a sample cell assembly which is
heated to 90oC in 10 min and temperature is maintained for 1 hr then the temperature is
raised to 350oC and is maintained for 2 hr. Adsorbate source used is Nitrogen as it serves to
be most common adsorbate source and well characterized one. All measurements are done
as it is programmed (fully automated).
Mesopore size calculations are done assuming cylindrical pore geometry using the Kelvin
equation.
)ln(
2
0PPRTV
r mk
γ−=
30

Where γ is the surface tension of nitrogen at its boiling point (8.85 ergs/cm2 at 77K).
Vm is molar volume of liquid nitrogen (34.65cm3/mol).
R is gas constant (8.314x10⁷ergs/deg mol).
T is boiling point of nitrogen.
P/P0 is relative pressure of nitrogen.
rk is the Kelvin radius of the pore.
Kelvin radius rK is the radius of pore in which condensation occurs at a relative pressure of
P/Po. Since prior to condensation some adsorption has taken place on the walls of the pore rK
is not actual pore radius. Actual pore radius is given by
rp= rK + t
t is the thickness of the adsorbed layer.
t is given by
3/1
0
0
)/log(303.2554.3)(
⎥⎥⎦
⎤
⎢⎢⎣
⎡=
PPAt
Total pore volume is derived from the amount of vapor adsorbed at a relative pressure by
assuming that pores are filled with liquid adsorbate. Most common method in determining
the total surface area of the catalyst that is developed by Braunner, Emmet and Teller
(called BET method).
BET equation is given by
( ) ⎟⎟⎠
⎞⎜⎜⎝
⎛−+=
− ommoa PP
CVc
CVPPVP 11
Va is the quantity of gas adsorbed at a relative pressure P/P0.
31

Vm is the quantity of adsorbate constituting a monolayer of surface coverage.
C (BET constant) is related to energy of adsorption in the first adsorbed layer and indicates
the magnitude of the adsorbate /adsorbent interactions. In this technique, amount of nitrogen
adsorbed at equilibrium at its normal boiling point (-195.8oC) is measured over a range of
partial pressure below 1 atmosphere. The volume of gas adsorbed is calculated by measuring
pressure variation resulting from adsorption of known volume of N2 gas by test sample.
Manifold Input Valve
Manifold Valve (V2) Vacuum OutgasValve(V6)
Flow Outgas ValveV8
Coa
rse
Vac
uum
(V3)
Vacuum pump
CalibrationVolume
Fine
Vac
uum
(V4)
Manifold
AD
SO
RB
ATE
Cel
l Val
ve(V
5)
Flow ControlValve
Pressure Transducer
Gas Input Selector Valve
(V7)
FIGURE 3-5 Schematic flow diagram of Nova sorption analyzer
32

3.5.2 Temperature Programmed Reduction (TPR)
TPR is used to monitor metal support interactions. It also provides useful information about
the temperatures needed for the complete reduction of a catalyst. For bimetallic catalysts,
TPR patterns often indicate whether two components are mixed or not.
Reduction is an inevitable step in the preparation of metallic catalysts. The reduction of
metal oxide MOn by H2 is described by the equation.
MOn + nH2 M + n H2O
Reaction of metal oxides by hydrogen, start with dissociative adsorption of H2, which is a
much more difficult process on oxides than on metals. Rate expression for the reduction
reaction under conditions where the reverse reaction from metal to oxide can be ignored, is
])MO([f]H[kdt
]MO[dn
pred
n2=−
In which
[MOn] is the concentration of metal oxide.
[H2] is the concentration of hydrogen gas.
kred is the rate constant of the reduction reaction.
p is the order of the reaction in hydrogen gas.
f is the function, which describes the dependence of the rate of reduction on
the concentration of metal oxide.
t is the time
3.5.2.1 Setup of TPR
Temperature programmed reduction (TPR) experiments were carried out in a system
supplied by Ohkura Riken Co. Ltd., (model TP-200). A schematic flow diagram of apparatus
33

is given in figure 3-6. The equipment is developed to enable user to obtain data related to
reduction and sulfiding characteristics of metal oxides or catalysts containing metals.
3.5.2.2 Operational Procedure for TPR
The operational procedure can be divided into two parts: 3.5.2.2.1 Pretreatment
150 mg of catalyst sample (particle size 600-212 µm) is weighed and placed in a quartz tube
(8 mm O.D.) reactor in such a way that it is close to the thermocouple with the help of
quartz wool plugs. Temperature is raised to 400o C at a rate of 10o C for 2 hr, then cooled to
ambient temperature. Air is purged by flowing dry air (22 cm3/min) for 30 min at ambient
temperature.
3.5.2.2.2 Reduction
Gas mixture used for reduction was 5 % H2 in Argon at a flow rate of 30 cm3/min.
Temperature of the reactor is programmed to increase linearly from room temperature to
1030oC at a heating rate of 10oC/min and then retained at this temperature for 15 minutes. A
5A molecular sieve is used to trap the water formed either by reduction or from dehydration
process. The hydrogen concentration is determined with a thermal conductivity detector
(TCD). The temperature of the catalyst and the TCD current response is monitored and
recorded continuously on a personal computer (NEC Model PC9821-Xe10).
34

UV
TCD
TrapNaOH
Vent
Ar
Air
H2/Ar
H2S/Ar
Reactor
Catalyst
Furnace
Molecular Seive
Thermostat
Furnace
FIGURE 3-6 Temperature programmed reduction apparatus
3.6 Catalyst Evaluation 3.6.1 Batch Autoclave Reactor
Batch autoclave reactor is suitable for studying high exothermic hydrocracking reactions.
With advantage of excellent fluid contacts, isothermicity within reactor, simple to operate, it
also provides information about cracking activity of catalyst and kinetic data that can be
used to determine the intrinsic reaction order and activation energy.
The size of autoclave reactor is 300 ml. The reactor is housed in furnace. There is
programmed control system for controlling temperature, speed of the stirrer. Pressure and
flows is controlled manually. A schematic flow diagram of this system is shown in figure 3-
7.
35

In addition, the feed that was used to evaluate the various prepared catalysts along with the
reference catalyst is a blend of VGO and DMO at 85-% to 15-% respectively.
It has to be born in mind that the commercial catalyst that is used as our reference in this
work is very well known catalyst and used broadly in many refineries that process very
heavy Hydrocracker feedstock since many years. Our attempt is to prepare a catalyst that
can relatively compete or have close catalytic properties to this broadly used catalyst.
Having catalyst with similar features to the reference catalyst is a very challenging task and
requires very extensive work and number of years to accomplish.
3.6.2 Batch Reactor Operational Procedure An amount of 100 gm of feed and 3 gm of sulfided catalyst is loaded inside the reactor.
Reactant and catalyst is purged in N2 and H2 and leak is checked by H2 detector. The system
is allowed to react for 3 ½ hours. System is allowed to cool down to room temperature and
then it is purged by N2 after removing the product gas sample. Liquid product is analyzed by
simulated distillation techniques.
36

N2 CylinderH2 Cylinder
Regulator Regulator
Motor
Pressure Gauge
ReactorStirrer
Heater
Vent
Catalyst Feed
Heater
FIGURE 3-7 Experimental setup of batch autoclave reactor
37

4
Results and Discussion
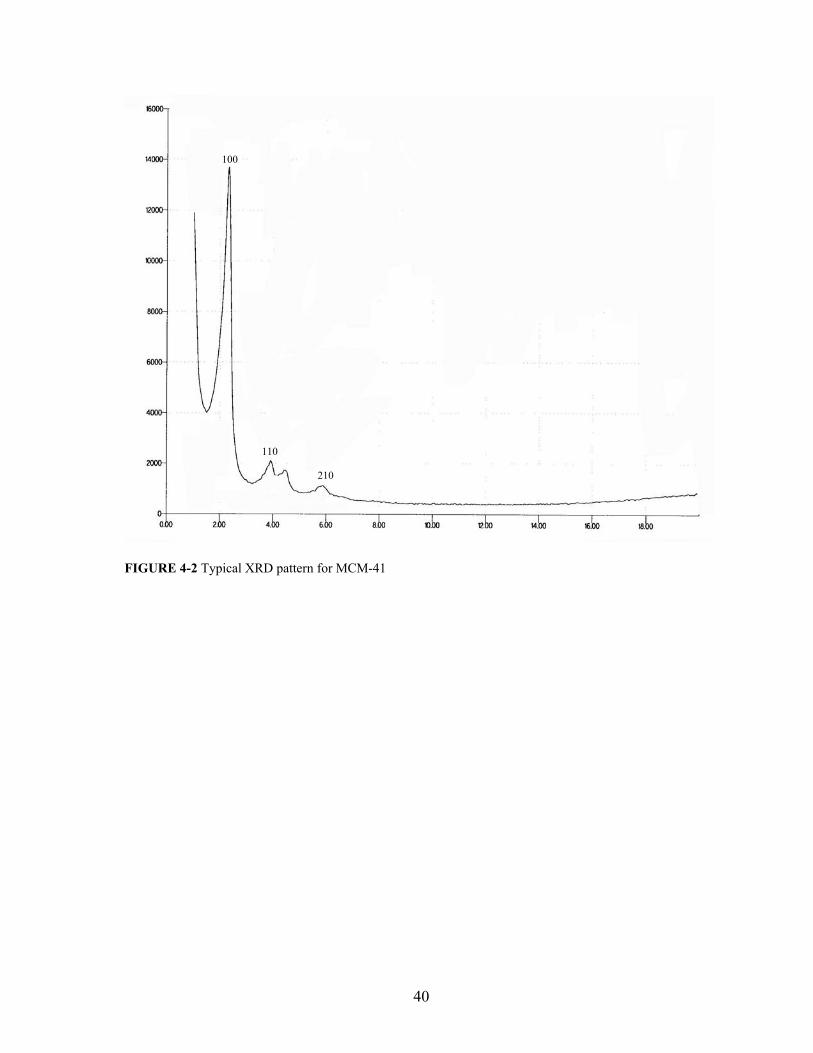
4.1 MCM-41 X-Ray Diffraction (XRD)
Figure 4-2 presents the typical powder diffractogram of calcined MCM-41 sample. From
figure 4-3, It can be seen that our prepared MCM-41 sample shows similar XRD pattern
with well-defined 100, 110, and 210 reflection peaks. After synthesizing MCM41 sample,
the measurements were carried out in order to confirm that the mesoporous material has
been crystallized as MCM41.
From d100, calculation of parameter ao in a hexagonal lattice was done by using the formula
ao = 2*d100/√3
As shown in figure 4-1, unit cell parameter ao and d100 is clear.
Framework thickness D can be calculated from the formula given below
D = a - 2*r
Where r is pore radius.
38

Da
d100
r
r
FIGURE 4-1 showing d100, a (unit cell size), D (Framework thickness), r (radius of the pore) and 2*r represents the pore size.
39
100
110
210
FIGURE 4-2 Typical XRD pattern for MCM-41
40

100
110
210
FIGURE 4-3 XRD pattern for the synthesized MCM-41
41

4.2 Gas Sorption Analyzer
4.2.1 Specific Surface Area
In comparing different catalysts or the effect of various treatments on catalytic activity, it is
necessary to know the extent to which a change in activity is caused by a change in the area
of a catalyst, in contrast to a change in intrinsic reactivity28.
TABLE 4-1 prepared catalysts textural characteristics
Sample BET Surface Area
(m2/g)
Pore Volume
(cm3/g)
Average Pore Diameter
(A0)
NiMo-ASA 186 0.33 36
NiMo-MCM-41 324 0.40 25
NiMo-β 313 0.41 26
NiMo-USY 300 0.35 23
Table 4-1 presents the textural characterization for the four prepared catalyst samples. It
was observed that the amorphous NiMo-ASA catalyst has the lowest surface area as
compared with other three zeolite based catalysts. In addition, NiMo-ASA catalyst
exhibited the lowest pore volume and the highest average pore radius as compared with
other catalysts. This is due to the fact that amorphous supports have more meso and macro-
pores embedded in uniform structure which in turn reduces the overall surface area of the
catalyst. In contrast, zeolites have well-ordered structure with the presence of micro-pores
which provide large surface areas as high as 800 m2/g 3.
42

It is worth mentioning that pure MCM-41 material has a surface area of 800 m2/g while, β
and USY zeolites have surface areas of 500 m2/g. It was noticed that the surface area of the
MCM-41, USY, and β materials has dropped to the range of 300 ~ 325 m2/g when they were
mixed with γ-alumina and impregnated with Nickel and Molybdenum metals. The
explanation of this is that the incorporation of MCM-41, β, and USY materials into the γ-
alumina matrix (30% zeolite mixed with 70% γ-alumina) produced surface areas decrease,
due to the blockage of some of the zeolites pores. Similar finding was obtained by J.
Ramirez et. al.24. Moreover, the impregnation of Nickel and Molybdenum metals into this
support has further blocked more zeolite pores. This double blockage by γ-alumina and
metals have reduced the surface areas of MCM-41, β, and USY materials by 60 %, 37 %
and 40 % respectively.
4.2.2 Pore Size Distribution
The major application of this measurement is for the prediction of the effective diffusivity in
a porous catalyst in conjunction with calculations of the ease of access of reactant molecules
to the interior of a catalyst pellet by diffusion.
Figures 4-3, 4-4, 4-5, and 4-6, show the distribution of pore volumes along 10 ~ 300 A0 pore
radius for the four prepared catalysts. It is obvious that all catalysts have approximately the
same peak positions but with different heights which represent different pore volumes.
Figure 4-3 shows that NiMo-ASA catalyst has wide distribution of pores. The curve peak is
located in the meso-pore range with narrow pattern. The gentle drop of the curve indicates
that NiMo-ASA includes considerable amount of macro-pores. In contrast, figure 4-4
presents NiMo-MCM-41 catalyst pore size distribution. It shows that it has lots of meso-
43

pores since the curve peak is wider at the mesoporous range. Moreover, the curve drop is
drastic however it increases a bit at the tail end. This indicates the presence of some macro-
pores in NiMo-MCM-41 catalyst.
In addition, figure 4-5 shows that NiMo-β catalyst has similar pattern to NiMo-MCM-41
catalyst with narrower but higher peak. However, the tail end of NiMo-β catalyst is higher
than NiMo-MCM-41 catalyst indicating higher amount of macro-pores. On the other hand,
figure 4-6 shows that NiMo-USY catalyst has micro-pores as well as meso-pores with
narrow curve and lower tail end as compared with NiMo-MCM-41 and NiMo-β catalysts.
This shows that NiMo-USY catalyst has lower amount of macro-pores than NiMo-MCM-41
and NiMo-β catalysts. The reason behind the existence of macro-pores in the prepared
samples is due to crystals gathering and agglomerates formation. In addition, the
incorporation of β and MCM-41 materials into the γ-alumina matrix as well as metal loading
have plugged some of the micro-pores and generated meso and some macro-pores in the
case of ΝiΜο−β and NiMo-MCM-41 catalysts. Moreover, the dominance of γ-alumina
structure into all prepared catalysts morphology is clear since the catalysts supports were
prepared with 70 % γ-alumina. That is why NiMo-MCM-41 and NiMo-β catalysts have
some macro-pores as shown in figures 4-4 and 4-5 respectively. Similar finding was
obtained by J. Ramirez et. al 24.
In addition, it is very crucial to mention that with the conventional BET method that was
used to measure the surface area and the pore size distribution for all catalysts, it is very
difficult to exactly measure the micro-pores. Therefore, in the case of NiMo-USY and
NiMo-β, the curves should be bimodal rather singular peaks. However, with existing
capability, only mesoporous peaks can be detected.
44
0.00
0.02
0.04
0.06
0.08
0.10
0.12
050
100150
200250
300
Pore Radius (Ang)
P ore V olum e (cc/gm )
FIGURE 4-3 NiMo-ASA catalyst pore size distribution
45

0.00
0.02
0.04
0.06
0.08
0.10
0.12
0.14
020
4060
80100
120140
160180
200220
240260
Pore Radius (Ang)
P ore V o lum e (cc/gm )
FIGURE 4-4 NiMo-MCM-41 catalyst pore size distribution
46

0.00
0.02
0.04
0.06
0.08
0.10
0.12
0.14
0.16
020
4060
80100
120140
160180
200220
240260
280
Pore Radius (Ang)
P o re V o lu m e (cc/g m )
FIGURE 4-5 NiMo-β catalyst pore size distribution
47

0.00
0.02
0.04
0.06
0.08
0.10
0.12
0.14
0.16
020
4060
80100
120140
160180
200220
240260
280
Pore Radius (Ang)
P o re V o lu m e (cc/gm )
FIGURE 4-6 NiMo-USY catalyst pore size distribution
48

4.3 Temperature Programmed Reduction (TPR)
Temperature programmed reduction (TPR) has been widely used for the investigation and
characterization of metal incorporated and metal supported catalysts. TPR peak area
represents the amount of hydrogen consumption and peak temperature represents the
reducibility of the metal oxide or oxides. Thus, TPR results can therefore be interpreted
quantitatively as estimates of the distribution of various metal oxide phases as well as the
metal support interaction for supported metal oxide catalysts28.
TPR experiments were carried out in a system supplied by Ohkura Riken Co. Ltd. (Model
TP-2000). The procedure for pretreatment and subsequent TPR experiments is as follows.
At first, a 150 mg portion of catalyst sample (particle size: 600-212 µm) was placed in a
quartz tube (8.0 mm o.d.) reactor and was held in the center by quartz wool plugs. The
samples were pretreated in a flow of dry air. The temperature was raised to 400 0C for 2-h,
and then cooled to ambient temperature. the air was purged by flowing dry Ar (30 cm3/min)
for 30-min at ambient temperature. The gas mixture used for reduction was 5 % H2 in Ar at
a flow rate of 20 cm3/min. The temperature of the reactor was increased linearly from room
temperature to 1030 0C at a heating rate of 10 0C and then retained isothermally for 15 min.
The moisture produced due to reduction or dehydration was trapped by a 5 A0 molecular
sieve. The hydrogen concentration was determined with a thermal conductivity detector
(TCD). The TCD and molecular sieve trap were thermostated at 50 0.1 ± 0C. The
temperature of the catalyst and the TCD current response were continuously monitored and
recorded on a dedicated personal computer (NEX Model PC9821-Xe 10)29.
Figures 4-7 through 4-10 present the TPR profiles of all prepared catalysts. All of the
zeolite based catalysts showed double peak behavior while NiMo-ASA catalyst showed
49

triple peak behavior. This is because the metals are distributed into wide range of micro,
meso, and macro-pores and it shows random distribution across the amorphous support as
compared to the zeolitic supports.
The variation in the peak temperatures can be attributed to the differences in the metal
support interactions and the multiple peak patterns might be due to the presence of nickel
and molybdenum metals at different sites of the catalysts supports 30.
50

FIGURE 4-7 TPR pattern for NiMo-ASA catalyst
51

FIGURE 4-8 TPR pattern for NiMo-MCM-41 catalyst
52

FIGURE 4-9 TPR pattern for NiMo-β catalyst
53

FIGURE 4-10 TPR pattern for NiMo-USY catalyst
54

4.4 Temperature Programmed Desorption (TPD)
The structures that give rise to acidity and indeed to catalytic activity are subject to some
controversy. In the case of silica-alumina, the source of acidity may be rationalized in terms
of a theory developed largely by Linus Pauling. If an aluminum ion, which is trivalent, is
substituted isomorphously for a silicon ion, which is quadravalent, in a silica lattice
comprising silica tetrahedral, the net negative charge must be stabilized by a nearby positive
ion such as a proton. This positive ion can be produced by the dissociation of water,
forming a hydroxyl group on the aluminum atom. The resulting structure, in which the
aluminum and the silicon are both tetrahedrally coordinated, is a Bronsted acid. If this
structure is heated, water of constitution is driven off and Bronsted acid sites are converted
to Lewis acid sites28.
The acid properties of the prepared four hydrocracking catalysts were determined by the
TPD system (Model ATD 700) supplied Ohkura Riken CO. Ltd., Japan. The procedure of
acidity measurement was as follows. First, 0.5 g of catalyst sample (particle size 22 – 212
µm) was placed in a quartz tube reactor (15 mm o.d.). the temperature was increased up to
400 0C for 2-h, then cooled to 100 0C. Ammonia (purity 99.9 %) was then introduced for
30-min at 100 Torr. After that, excessive ammonia was evacuated for 30-min at 100 0C
under vacuum (10-3 Torr). Thermal desorption of ammonia was conducted at 100 Torr using
He as a carrier gas up to 800 0C at a rate of 10 0C/min. The desorbed ammonia was
monitored by TCD and Quadrupole detector (Massamate 200). This technique also enabled
both the number of acid sites (Bronsted and Lewis) and acid strength distribution to be
determined31.
55

TABLE 4-2 TPD of ammonia for all prepared catalysts
Catalyst Acidity (mmol/g) Peak Temperature (0C)
NiMo-MCM-41 0.33 264
NiMo-ASA 0.50 252
NiMo-β 0.56 233
NiMo-USY 0.59 238
Table 4-2 shows the TPD of ammonia for all of the prepared hydrocracking catalysts. The
acidity of the prepared catalysts ranges from 0.33 mmol/g (NiMo-MCM-41) to 0.59 mmol/g
(NiMo-USY). The lower acidity of NiMo-MCM-41 catalyst is expected since MCM-41 is a
sililca based material and has low amount of alumina. Therefore, NiMo-MCM-41 catalyst
has lower amount of γ-alumina than the other prepared catalysts. It is important to note that
γ-alumina adds a lot to the total acidity of the catalysts. This is evident from the fact that
even though NiMo-ASA (0.5 mmol/g) is amorphous catalyst but it has more acidity than
NiMo-MCM-41 because it contains more γ-alumina than NiMo-MCM-41 catalyst. On the
other hand, the variations in the TPD peak temperatures of all prepared catalysts, as shown
in figure 4-11, indicate the strength of acidic sites. In case of NiMo-MCM-41, although it
has lower acid quantities than the other catalysts, however, it has the highest peak
temperature amongst the other catalysts. This indicates that NiMo-MCM-41 catalyst will
offer more cracking activity and higher conversion.
In addition, NiMo-USY, NiMo-β, and NiMo-ASA catalysts contain almost the same total
amount of acidity (0.5 ~ 0.59 mmol/g) with different peak temperatures. Therefore, their
hydrocracking activity is expected to be similar.
56

C
0
FIGURE 4-11 Superim
238 0
NiMo-USY Catalyst
C
233 0NiMo-β Catalyst
C
p
252 0
NiMo-ASA Catalyst
C
264 0NiMo-MCM-41 Catalyst
Temperature 0C 1000
osed graph showing TPD patterns for all prepared catalysts
57

4.5 Batch Reactor Evaluation
Batch reactors are closed systems in which measured quantities of reactant interact with a
charge of catalyst which is usually maintained at a fixed temperature. The concentration of
reactant diminishes with time as the reaction proceeds and this is utilized as the basis of
experimental observation. Some of the early classic experiments on the kinetics of
catalyzed gas reactions reported by Hinshelwood and by Rideal and Taylor were studied
using batch reactors. Figure 4-12 shows a typical batch reactor with mixing 32.
The concept behind our study using this kind of reactor, is to contain the liquid VGO/DMO
reactant in a vessel under hydrogen environment at high pressure as high as 150 kg/cm2.
The vessel is contained in an oven to progressively supply heat to the reactor. The reaction
temperature was fixed at 410 0C for all tested catalysts. The liquid and gas mixture is very
well mixed using a magnetic driven mixer in order to ensure an intimate contact between the
reactants and the catalyst particles. As a result, the concentration and temperature of the
contents of the reactor will be virtually constant. Moreover, the mixing has a great deal of
importance. It reduces the interparticle resistances to minimum. Additionally, the
interparticle diffusion resistance was further minimized by crushing the catalysts particles to
small sizes. When the catalyst particles are sufficiently small, diffusion effects within the
particle will be virtually absent and the measured rate will remain constant.
58

FIGURE 4-12 Details of autoclave batch reactor. 1, belt drive groove; 2, outer magnet bearings; 3, upper bearing; 4, O-ring seals; 5, outer magnet; 6, inner magnet; 7, reed relay; 8, lower bearing; 9, thermocouple entry; 10, pressure tapping; 11, gas inlet port; 12, catalyst basket; 13, reaction vessel; 14, baffles; 15, gas outlet port; 16, purge inlet port.
59

4.5.1 Effect of Mixing In order to measure the effect of mixing in this particular experiment, two runs were
conducted using the commercial catalyst at the same reaction conditions. One run was
conducted with mixing and the other run was conducted without mixing during the reaction
time. The major observation noticed was that the run with stirrer operating had better
hydrodesulfurization function (44 % vs. 36 %) and hydrogenation function (10.3 % vs. 5.5
%). This is expected since mixing provides intimate contact between H2, VGO/DMO feed
and the catalyst. In the case of no mixing, more coke deposition is bound to occur since the
cracked hydrocarbon will not necessarily meet H2 compound to attach to it.
4.5.2 Commercial Catalyst Testing Several runs utilizing the commercial catalyst were conducted in order to determine the
maximum oven temperature and the resultant reaction temperature achievable. Table 4-3
shows the various runs conducted with their product analysis.
TABLE 4-3 Commercial catalyst different run conditions and product analysis Run
No.
Pressure
(kg/cm2)
Temperature
(0C)
Conversion
%
Naphtha
Yield %
Diesel
Yield %
1 150 395 18.5 7.86 11.40
2 150 400 23.11 8.98 14.85
3 150 405 24.02 9.32 15.41
4 150 405 24.09 9.49 15.30
5 150 410 27.01 10.31 17.38
60

It is apparent that the first run did not provide very good conversion. Therefore, the
temperature was increased 5 0C to test the catalyst response. As a result, run no. 2 gave
better conversion and yield. When the temperature was increased 5 0C more, not much
difference was observed in terms of conversion and yield. Thus, the temperature was
increased to 410 0C. As a consequence, the conversion and yield were slightly increased.
On this basis, it was decided to test the various prepared catalysts at 410 0C and use run no.
5 as our base line.
4.5.3 Experimental Repeatability/Reproducibility In order to ensure the quality of our experiment procedure as well as our generated data, it
is imperative to repeat the experiment several times to reproduce data. In reference to table
4-3, it is apparent that runs no. 3 & 4 were duplicated at the same reaction conditions and
experiment procedure. The resulted conversion and yield were comparable and almost the
same. On that basis, our experiment procedure was used throughout our study since the
repeatability and reproducibility of data was achieved successfully.
4.5.4 Prepared Catalysts Testing After checking the quality of the data produced by the batch reactor, the various prepared
hydrocracking catalysts were tested at the pre-determined conditions (T = 410 0C & P = 150
kg/cm2). The VGO/DMO feed blend (100 gm) was manually mixed with 3-gm crushed
catalyst. The tested catalysts were crushed in order to mitigate the interparticle diffusion
resistance. The mixture was loaded into the reactor vessel. The vessel was fixed into the
experimental setup assembly and purged with H2 during pressurizing. The reactor was
pressurized to 150 kg/cm2 and held at this pressure for around 30-min to make sure that the
system is tight and can withhold this amount of pressure. After passing the pressure leak
61

test, the reactor pressure was dropped to 90 kg/cm2 and the oven temperature program was
started. Since the feed catalyst mixture solidifies at room temperature, the mixer was not
started immediately in order to protect it from being damaged. The mixer was started after
the reactor temperature reached 100 0C at which the feed catalyst mixture is at liquid state.
After 2 1/2 hrs, the system pressure was adjusted to 150 kg/cm2 and we started counting 1-hr
reaction time. When 3 1/2 hr total time of the run was reached, the reaction was immediately
stopped by switching off the oven program temperature and mixer rotation. After the
reactor cooled down, gas sample was collected and the reactor system was depressurized.
Then, the reactor vessel was opened and liquid products as well as catalyst samples were
collected.
4.5.5 Products Analysis Batch reactor products are categorized into gas, liquid and coke lay-down. The gas samples
were analyzed using gas chromatography technique. While, the liquid samples were
analyzed using the simulated distillation technique. Moreover, the catalyst samples were
charged to the Elementar instrument to measure the amount of coke lay-down generated as a
result of reaction. In addition, the liquid samples were analyzed for sulfur, carbon, and
hydrogen components using Elementar instrument. This helped in calculating the
hydrodesulfurization and hydrogenation activities of each individual catalyst.
62
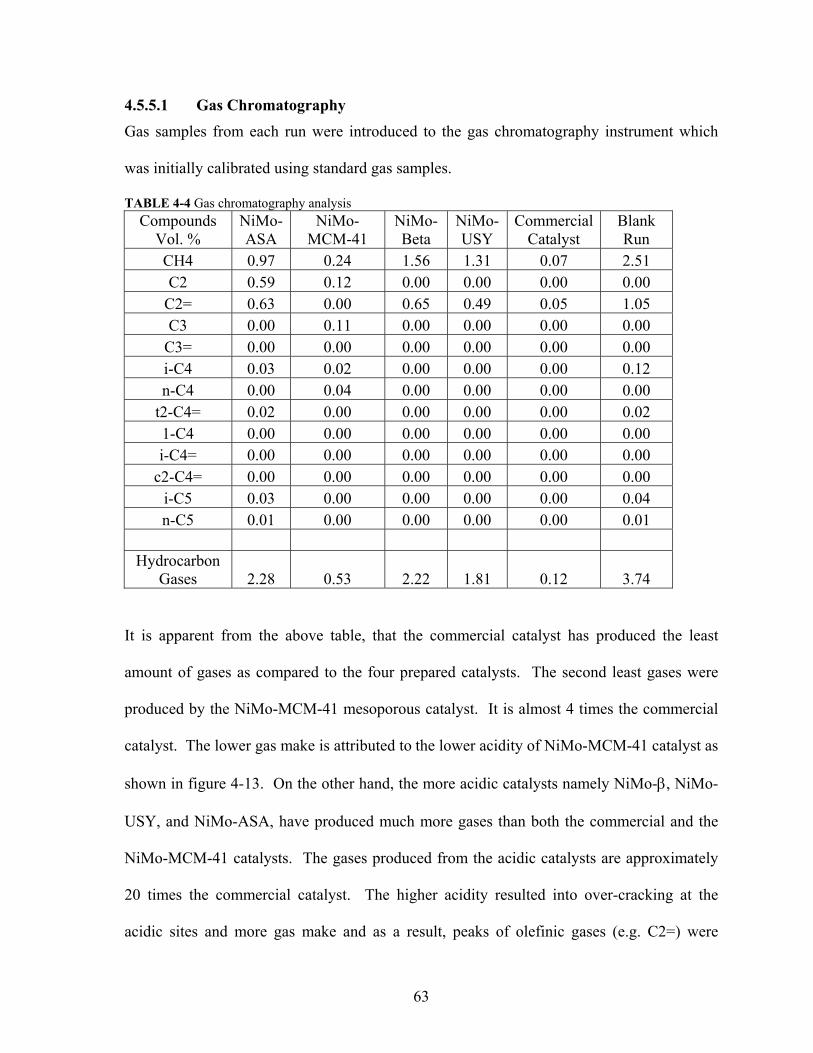
4.5.5.1 Gas Chromatography Gas samples from each run were introduced to the gas chromatography instrument which
was initially calibrated using standard gas samples.
TABLE 4-4 Gas chromatography analysis Compounds
Vol. % NiMo-ASA
NiMo-MCM-41
NiMo-Beta
NiMo-USY
Commercial Catalyst
Blank Run
CH4 0.97 0.24 1.56 1.31 0.07 2.51 C2 0.59 0.12 0.00 0.00 0.00 0.00
C2= 0.63 0.00 0.65 0.49 0.05 1.05 C3 0.00 0.11 0.00 0.00 0.00 0.00
C3= 0.00 0.00 0.00 0.00 0.00 0.00 i-C4 0.03 0.02 0.00 0.00 0.00 0.12 n-C4 0.00 0.04 0.00 0.00 0.00 0.00
t2-C4= 0.02 0.00 0.00 0.00 0.00 0.02 1-C4 0.00 0.00 0.00 0.00 0.00 0.00 i-C4= 0.00 0.00 0.00 0.00 0.00 0.00
c2-C4= 0.00 0.00 0.00 0.00 0.00 0.00 i-C5 0.03 0.00 0.00 0.00 0.00 0.04 n-C5 0.01 0.00 0.00 0.00 0.00 0.01
Hydrocarbon
Gases 2.28 0.53 2.22 1.81 0.12 3.74
It is apparent from the above table, that the commercial catalyst has produced the least
amount of gases as compared to the four prepared catalysts. The second least gases were
produced by the NiMo-MCM-41 mesoporous catalyst. It is almost 4 times the commercial
catalyst. The lower gas make is attributed to the lower acidity of NiMo-MCM-41 catalyst as
shown in figure 4-13. On the other hand, the more acidic catalysts namely NiMo-β, NiMo-
USY, and NiMo-ASA, have produced much more gases than both the commercial and the
NiMo-MCM-41 catalysts. The gases produced from the acidic catalysts are approximately
20 times the commercial catalyst. The higher acidity resulted into over-cracking at the
acidic sites and more gas make and as a result, peaks of olefinic gases (e.g. C2=) were
63

detected in the case of the acidic catalysts as shown in table 4-4. However, NiMo-MCM-41
along with the commercial catalyst had very minute amount of olefinic gases.
In the case of blank run, thermal cracking has resulted into tremendous amount of gases and
produced the highest amount of olefinic gases as compared to the catalytic reactions results.
This clearly indicates the actual benefits of catalytic reactions over thermal reactions.
TABLE 4-5 Gas make against catalyst acidity NiMo-MCM-41 NiMo-β NiMo-ASA NiMo-USY
Gas Make, Vol.% 0.53 2.22 2.28 1.81 Acidity, mmol/gm 0.33 0.56 0.5 0.59
64

0.00
0.50
1.00
1.50
2.00
2.50
NiMo-M
CM-41
NiMo-Beta
NiMo-ASA
NiMo-USY
Gas (vo l.% ) and A cid ity (m m ol/gm .)
Gas Make
Acidity
FIGURE 4-13 Acidity and gas make of prepared catalysts
65

In practice, refiners who are interested in more diesel and naphtha and less gas make would
like to load the less acidic catalyst to avoid excessive gas production. Therefore, NiMo-
MCM-41 catalyst would be a good candidate for this purpose and is very much comparable
to the commercial catalyst. However, refiners who are integrated with petrochemical
industry would prefer to produce more gases to boost their profitability.
4.5.5.2 Catalyst Selectivity TABLE 4-6 Tested catalysts selectivity
Product %
VGO/DMO Feed
85% / 15% Comm. NiMo-
MCM-41 NiMo-
β NiMo-ASA
NiMo-USY
Naphtha (IBP-400 0F)
0.21 10.31 10.1 9.27 9.55 9.55
Distillate (400-700 0F)
0.72 17.38 20.52 18.41 18.6 18.8
Residue (800-900 0F)
37.43 32.42 30.23 30.85 31.52 31.8
Residue (900-1050 0F)
61.65 39.89 39.25 41.46 40.34 39.65
Total 100 100 100 100 100 100
Table 4-6 shows that all prepared catalysts have yielded almost the same naphtha yield and
more diesel yield than the commercial catalyst. However, NiMo-MCM-41 catalyst has
produced the highest diesel yield and the lowest gas make amongst all tested catalysts. This
can be attributed to the main feature of this catalyst being mesoporous and having lower
acidity. This result makes NiMo-MCM-41 catalyst very attractive to be considered as a
hydrocracking catalyst for VGO/DMO blend feed.
66

Gases
Gases
Gases
Gases
Gases
Gases
Naphtha
Naphtha
Naphtha
Naphtha
Naphtha
Naphtha
Distillate
Distillate
Distillate
Distillate
Distillate
Distillate
0 5 10 15 20 25Commercial
NiMo-MCM-41
NiMo-Beta
NiMo-ASA
NiMo-USY
Blank Run
Products Yield %
FIGURE 4-14 Tested catalysts selectivity
67

64 66 68 70 72 74 76 78 80
Commercial
NiMo-MCM-41
NiMo-Beta
NiMo-ASA
NiMo-USY
Blank Run
Residue %
FIGURE 4-15 Tested catalysts unconverted material (residue)
68

On the other hand, as shown in figure 4-14, all tested catalysts including the commercial
catalyst have the tendency to produce more diesel than naphtha. Therefore, all of the tested
catalysts can be tagged as diesel selective catalyst or diesel mode catalyst.
Additionally, figure 4-15 shows that NiMo-MCM-41 catalyst has lower residue yield than
the commercial and other prepared catalysts. The other three prepared catalysts namely
NiMo-ASA, NiMo-β, and NiMo-USY had almost similar residue to the commercial
catalyst. The lower residue make of NiMo-MCM-41 catalyst indicates higher conversion as
will be discussed later.
On the contrary, thermal cracking run has produced the least naphtha and diesel yields and
the highest residue and gas make. This again shows the advantage of catalytic reactions
over thermal reactions.
4.5.5.3 Catalyst Activity Figure 4-16 shows that the VGO/DMO blended feed does not contain hydrocarbons in the
range of n-C5 to n-C20. The peaks in figure 4-16 indicate that the feed contains material in
the range of n-C24 ~ n-C40. In practice, this type of feed is considered very heavy and has
high tendency for coke lay down during reactions. Figure 4-17 shows the product curve of
the commercial catalyst reaction. Unlike the feed curve, the front end of the curve shows
high peaks indicating conversion of the heavy hydrocarbon molecules to smaller molecules.
Moreover, figure 4-18 shows that the product of NiMo-MCM-41 catalyst has higher peaks
at the front end of the curve than the commercial catalyst indicating higher conversion. In
the case of NiMo-ASA, NiMo-β, NiMo-USY catalysts, they have almost similar peaks to
the commercial catalyst which denotes that they have relatively similar conversion. If the
feed and the products curves were superimposed, one can notice a slight shift in the feed
69

curve peak to the left towards the lower molecular weights hydrocarbon which indicates
lower density product as compared to feed.
70

FIGURE 4-16 Simulated distillation curve for VGO/DMO blended feedstock
71

FIGURE 4-17 Simulated distillation curve for commercial catalyst product
72

FIGURE 4-18 Simulated distillation curve for NiMo-MCM-41 catalyst product
73
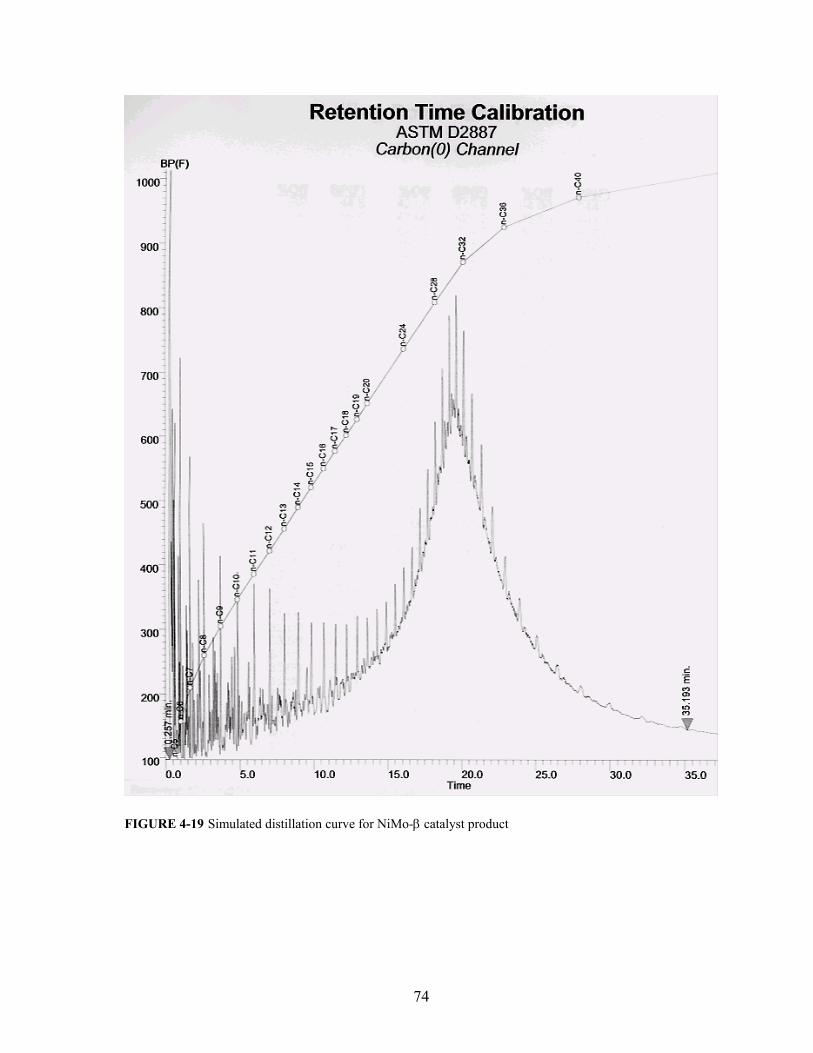
FIGURE 4-19 Simulated distillation curve for NiMo-β catalyst product
74

FIGURE 4-20 Simulated distillation curve for NiMo-ASA catalyst product
75

FIGURE 4-21 Simulated distillation curve for NiMo-USY catalyst product
76

FIGURE 4-22 Simulated distillation curve for the blank run product
77
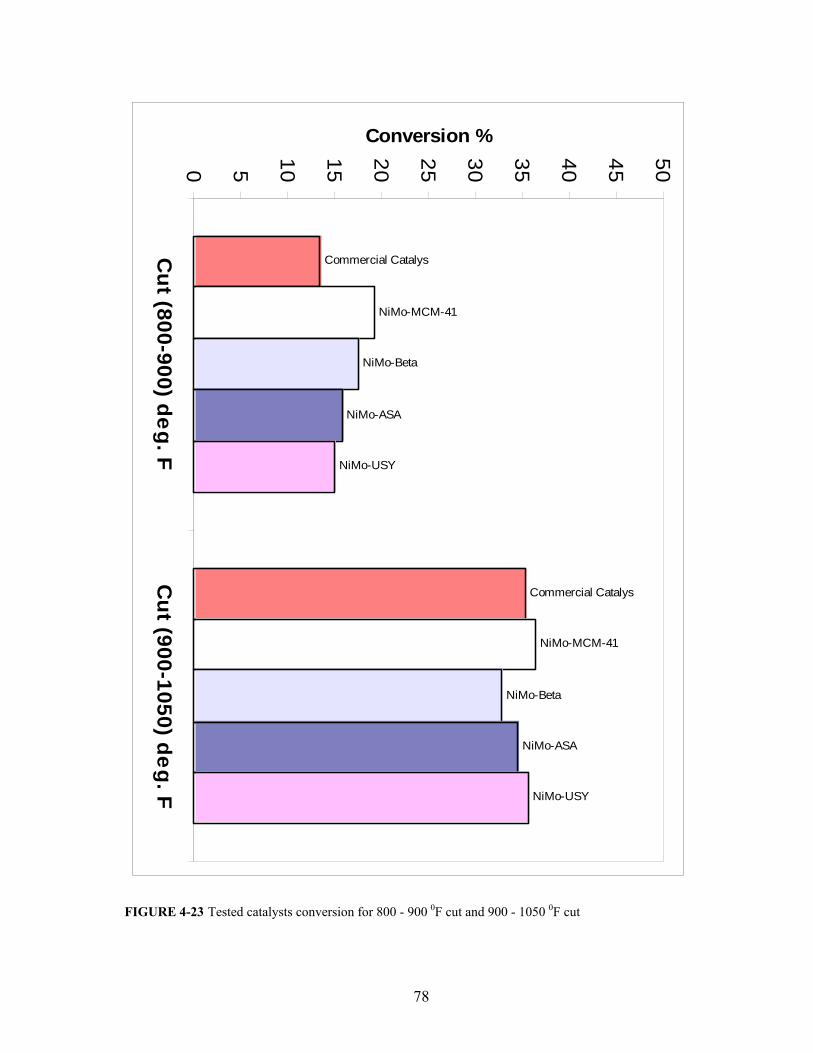
Commercial Catalys
Commercial Catalys
NiMo-MCM-41
NiMo-MCM-41
NiMo-Beta
NiMo-Beta
NiMo-ASA
NiMo-ASA
NiMo-USY
NiMo-USY
0 5 10 15 20 25 30 35 40 45 50
Cut (800-900) deg. F
Cut (900-1050) deg. F
Conversion %
FIGURE 4-23 Tested catalysts conversion for 800 - 900 0F cut and 900 - 1050 0F cut
78

Figure 4-23 and table 4-7 show that NiMo-MCM-41 was able to convert hydrocarbons
contained in the 800 0F – 900 0F cut better than the commercial and the other prepared
catalysts. However, in the heavier cut (900 0F – 1050 0F) all tested catalysts had relatively
similar conversion. It is imperative to mention that the heavier cut was easier to crack and
convert than the lighter cut. That is evident from the fact that even thermal cracking
achieved good conversion as the catalytic cracking in the case of heavier cut. However, in
the case of lighter cut (800 0F – 900 0F), thermal cracking did not achieve comparable
conversion. Thus, this is one of the advantages of NiMo-MCM-41 being able to
accommodate both cuts and achieve very good conversion in both of them unlike other
tested catalysts.
TABLE 4-7 Tested catalysts conversion for 800 - 900 0F cut and 900 - 1050 0F cut
1Conversion %
Cut Range, 0F CommercialNiMo-
MCM-41 NiMo-
β NiMo-ASA
NiMo-USY
800 - 900 13.37 19.23 17.57 15.78 15.04 900 - 1050 35.29 36.33 32.74 34.56 35.69
Overall 27.01 29.97 27.01 27.47 27.89
As shown in table 4-7, NiMo-MCM-41 had the highest overall conversion compared with
the commercial and other prepared catalysts. This can be attributed to the fact that NiMo-
MCM-41 catalyst had more surface area (324 m2/g) and total pore volume (0.4 cm3/g) than
the other catalysts. On the contrary, NiMo-USY (S.A. 300 m2/g) and NiMo-β (S.A. 313
m2/g ) catalysts had lower conversion than NiMo-MCM-41 even though they have
relatively similar surface areas to NiMo-MCM-41 catalyst. That is because they have
micro-pores that are very small (7.3 A0) to accommodate large molecules present in the 1 Conversion = (700+ in feed – 700+ in product) / 700+ in feed * 100
79

feed. Therefore, it is very much possible that some of these micro-pores were moth-plugged
by the large molecules causing them to be inactive. Moreover, their higher acidity generated
more gases than Naphtha and Diesel which in turn reduced their conversion a little.
4.5.5.4 Catalyst Hydrodesulfurization (HDS) Activity Sulfur is the most abundant heteroatom in crude oils. Sulfur exits in the form of thiols
(mercaptants), sulfides, disulfides, thiophene and thiophene derivatives. The process of
removing sulfur is called hydrodesulfurization. Reference to our prepared catalysts in this
research, hydrodesulfurization is carried out over sulfides of molybdenum and promoted
with nickel. Hydrodesulfurization represents a number of different reactions, which are
discussed in previous sections.
Figure 4-24 shows the inter-relation between the content of sulfur in the products and the
HDS activity of the prepared catalysts as compared with the commercial catalyst. It is
obvious that all of the prepared catalysts offered much better HDS activity than the
commercial catalyst. Table 4-8 shows that the HDS activity of the prepared catalysts ranges
between 72 % ~ 80 % as compared to 56 % HDS activity obtained by the commercial
catalyst. In addition, it is apparent that the blank run did not achieve any sulfur reduction
which is expected since no catalyst was there to enhance the HDS reactions. This finding is
very important since low sulfur products are always the target of refiners.
TABLE 4-8 Sulfur content of the products and catalyst HDS activity
Catalyst Feed Commercial NiMo-
MCM-41 NiMo-
β NiMo-ASA
NiMo-USY
Blank Run
Sulfur wt%. 2.5 1.107 0.564 0.508 0.589 0.695 2.5 2HDS - 56 77 80 76 72 0
2 HDS% =(Sulfur in feed – Sulfur in product) / Sulfur in feed * 100
80

0 10 20 30 40 50 60 70 80
C o m m e rc ia l
N iM o -M C M -4 1
N iM o -B e t a
N iM o -A S A
N iM o -U S Y
B la n k
H D S %
0 0.5 1 1.5 2 2.5
S u l fu r w t%
HDS %Sulfur wt%
FIGURE 4-24 Content of sulfur in the products and the HDS activity of the tested catalysts
81

The sulfur content of petroleum fractions must be reduced for a variety of reasons:
a. The maximum acceptable sulfur content in the feed to a catalytic reformer is determined
by the nature of the catalyst. Bimetallic reforming catalysts are especially sensitive, and
the sulfur content must be limited to the vicinity of 1 ppm or less.
b. Air pollution control standards require removal of, in most cases 80 percent or more of
the sulfur otherwise present in various oils.
c. Much of the sulfur in a gas oil fed to a catalytic cracker may be deposited in the form of
coke, the sulfur content of which is converted to sulfur dioxide in the regenerator and
emitted to the atmosphere from the combustion chamber. To limit air pollution from this
source, the sulfur content of the gas oil may be reduced before being fed to the catalytic
cracking unit.
d. The organosulfur content of the feed to a Hydrocracker must be reduced to avoid
poisoning of the hydrocracking catalyst.
e. Reduction of sulfur content reduces corrosion during refining and handling and improves
the odor of the products.
4.5.5.5 Catalyst Hydrogenation Activity
A great variety of hydrogenation reactions are carried out industrially. These range from
large scale, continuous catalytic operations in petroleum refineries dealing with streams of
complex compositions to small scale batch operations. The most common catalyst is Nickel
promoted catalyst. Nickel readily absorbs hydrogen into the interstices between metal atoms
which facilitates hydrogenation reactions.
It is clear from figure 4-25 that NiMo-MCM-41, NiMo-β, and NiMo-USY catalysts, which
are nickel promoted, had higher hydrogenation activity as compared to the commercial
82

catalyst. However, NiMo-ASA, which has the lowest surface area, had lower hydrogenation
activity than the commercial catalyst. This indicates that the prepared zeolitic catalysts
along with NiMo-MCM-41 have better metals dispersion than the amorphous catalysts
(Commercial and NiMo-ASA) which resulted in better hydrogenation activity. On the other
hand, NiMo-MCM-41 catalyst showed the best hydrogenation activity which is almost
double the activity of the commercial catalyst catalysts. It seem that NiMo-MCM-41 have
very good tendency to utilize hydrogen in saturating the unsaturated hydrocarbons resulted
from cracking reactions. On the other hand, no hydrogenation took place in the case of
blank run.
83

0 5 10 15 20 25 30 35 40 45
C o m m e r c ia l
N iM o - M C M - 4 1
N iM o - B e t a
N iM o - A S A
N iM o -U S Y
B la n k
H y d r o g e n a ti o n %
FIGURE 4-25 Hydrogenation activity
84

4.5.5.6 Carbon Formation Tendency Carbon formation deposits (coke) can be formed on catalysts under a wide variety of
conditions in a reducing environment. The factors involved on nonmetallic substances such
as acid catalysts are substantially different from those with metals. On nonmetallic catalysts
the deposits may contain considerable hydrogen, represented by an empirical formula CHx
in which x may vary between 0.5 and 1. Carbon deposits on metallic catalysts generally
contain little or no hydrogen.
Since all of the tested catalysts contain metals, elemental analysis was utilized to measure
the extent of carbon (element) deposits on the catalysts at the end of each individual
experiment. It is evident from figure 4-26 that zeolitic catalysts, represented by NiMo-
MCM-41, NiMo-β, and NiMo-USY, produced more carbon deposits than the amorphous
catalysts (Commercial and NiMo-ASA). This is due to the fact that zeolitic catalysts are
acidic and have more surface area for reactants to over-crack. This in turn results in more
carbon deposits formation specially, when the cracked reactants are not immediately
hydrogenated on a metal site. Coke formation have a direct effect on the catalyst stability
however, this can not be measured by the means of batch reactor. It can rather be measured
by a flow reactor which can be run for longer period of time to roughly quantify the catalyst
run length.
85

0 2 4 6 8 10 12 14
C om m erc ial
N iM o-M C M -41
N iM o-Beta
N iM o-ASA
N iM o-U SY
Coke wt%
FIGURE 4-26 Coke deposits on tested catalysts
86
5
Conclusions and Recommendations
5.1 Conclusions
1. All prepared catalysts showed better hydrodesulfurization activity than the
commercial catalyst. All prepared catalysts were impregnated with Nickel and
Molybdenum which were very effective in reducing the sulfur in the product.
Khorasheh et. al. 21 had similar conclusion where NiMo catalyst was very active
material for most performance indices.
2. NiMo-MCM-41 achieved the highest hydrogenation activity amongst all tested
catalysts. It had almost double the hydrogenation activity of the commercial
catalyst. In contrast, NiMo-ASA had the lowest hydrogenation activity.
3. The prepared catalysts had relatively similar activity to the commercial catalyst.
However, NiMo-MCM-41 catalyst was the most active by achieving 30%
overall conversion as compared to 27% achieved by the commercial catalyst.
4. NiMo-MCM-41 catalyst was able to convert hydrocarbons contained in the 800
0F – 900 0F cut better than the commercial catalyst and the other prepared
catalysts. However, in the heavier cut (900 0F – 1050 0F), all tested catalysts had
relatively similar conversion. This indicates that NiMo-MCM-41 catalyst is able
to accommodate both cuts and achieve very good conversion in both of them
unlike other tested catalysts.
5. All tested catalysts were diesel selective catalyst with slight variations. The
tested catalysts produced similar naphtha yield. However, in the case of diesel,
87

the prepared catalysts produced more diesel than the commercial catalyst
specially NiMo-MCM-41 which yielded 21% diesel as compared to 17% diesel
yield produced by commercial catalyst.
6. The commercial catalyst produced the least amount of gases as compared to the
other prepared catalysts. The second least gases were produced by NiMo-MCM-
41 mesoporous catalyst. On the other hand, NiMo-USY, NiMo-β, and NiMo-
ASA catalysts have produced much more gases than both the commercial and
NiMo-MCM-41 catalysts because they are more acidic.
7. The higher acidity of NiMo-USY, NiMo-β, and NiMo-ASA catalysts resulted
into over-cracking at the acidic sites and more gas make. As a result, peaks of
olefinic gases (e.g. C2=) were detected. However, NiMo-MCM-41 and the
commercial catalysts had very minute amount of olefinic gases.
8. NiMo-USY, NiMo-β, and NiMo-MCM-41 catalysts had higher surface area and
pore volume than NiMo-ASA amorphous catalyst.
9. NiMo-ASA catalyst had higher average pore diameter than the other prepared
catalysts. This is expected since it contains wide distribution of pores as
compared to the zeolitic catalysts which mainly contain meso-pores.
10. NiMo-USY, NiMo-β, and NiMo-MCM-41 catalysts showed double TPR peaks
while NiMo-ASA showed triple peak behavior. This is attributed to metals
being distributed into wide range of micro, meso, and macro-pores and it shows
random distribution across amorphous support as compared to the zeolitic
supports.
88
11. Using TPD method, NiMo-MCM-41 had the lowest acidity as compared to other
prepared catalysts. This is attributed to the fact that MCM-41 is a silica based
material and has low amount of alumina. This is one of the advantages of
MCM-41 being mesoporous and having low acidity as compared to β and USY
zeolites. The mesoporous feature along with the lower acidity was the main
reasons for NiMo-MCM-41 catalyst to achieve the highest conversion and the
lowest gas make as compared with the other prepared catalysts.
12. In batch reactor evaluation, the importance of mixing was observed. The run
with mixing achieved better HDS and hydrogenation activities than the run
without mixing.
5.2 Recommendations
1. All prepared catalysts, specially, NiMo-MCM-41 should be further studied using
flow reactor with the same feed blend of VGO/DMO. This will measure the
catalyst stability.
2. Different metals loading of Ni and Mo should be tried to further enhance the HDS
and hydrogenation functions of the catalysts.
3. Different metals combinations (e.g. NiW, CoMo, etc.) should be impregnated into
the catalysts supports to enhance the HDS and hydrogenation activities.
4. The γ-alumina and zeolite ratio should be varied until higher surface area is
achieved and optimum acidity is obtained.
5. More sophisticated gas sorption method should be utilized to determine the
distribution of micro-pores in the catalyst.
89

APPENDIX A RECIPE FOR MCM-41 MATERIAL SYNTHESIS Components:
Silica sources: Ludox (40 wt% silica, [Alfa])
Aluminum sources: Aluminum sulfate [Alfa]
Metal source: e.g. Nickel nitrate [Fisher Scientific Company]
Metal source: e.g. Hexa-Ammonium Heptamolybdate [Mallim Ckrodt]
Organic Template: 25 wt% aqueous solution of cetyl tri methyl ammonium bromide
(CTABr, [Aldrich])
Solution A:
1. Take 12.5 gm of CTABr and dissolve it in 38 gm of deionized water.
2. Keep on stirring in PP bottle applying gentle heat. In case it gets thick then add
solution of NaOH so as to make gel.
Solution B:
1. Take 1 gm NaOH and dissolved it in 13.5 gm water.
2. Add 1.55 gm NaAlO2 to the solution and stir it for long time till it gets dissolved.
Solution C:
1. Dissolve 3.83 gm NaOH in 100gm water.
2. Add 33.5gm ludox HS-40 and heat for ½ hour with continuous stirring till clear
solution is obtained.
90

PROCEDURE:
1. Add solution A and solution B at room temperature.
2. Cool C to RT & Mix C to solution obtained from step 1 and stir it ½ hour.
3. Adjust pH with 30% acetic acid to 10.5.
4. Allow to cool the solution for 1 hour and again adjust pH to 10.5.
5. After every 24 hour pH was adjusted to 10.5 and allowed to react for 4 days at 373 K
in reactor bottle.
6. After 4 days, product was filtered and washed with ethanol and dried overnight at
323oC.
91

APPENDIX B RECIPE FOR CATALYST PREPARATION
B.1 NIMO-USY CATALYST
MATERIALS:
1. USY Zeolite = 6 grams.
2. AP1 Cataloid ( 71% γ-alumina) = 19.72 gram (14 gram γ-alumina).
3. Ammonium Heptamolybdate (AHM) = 1.425 gram.
4. Nickel Nitrate (NiNo3) = 0.973 gram.
PROCEDURE:
Support Preparation:
1. Physically and thoroughly mix USY zeolite with AP1 Cataloid for 30 minutes.
2. Slowly add diluted water until a dough is formed.
3. Put the dough in a non-adhesive bag and roll it.
4. Load the rolled dough into the extruder to make extrudate.
5. Dry the extrudate support for 1 hr @ 60 0C.
6. When the support is dry, crush it into smaller sizes and keep it overnight @ 110 0C.
7. Take the support from the oven and calcine it.
92

Support Impregnation:
1. Check the incipient volume of the support by adding diluted water to 0.5 gram of the
support until it is absorbed. The resulted incipient volume for USY support was
0.725 ml / g support.
2. Use 8.55 gram of support. Based on the incipient volume measured, the required
impregnation solution for the USY support was 6.2 ml.
3. Dissolve AHM first with diluted water and continuously stir and heat until the
solution is clear. Then add nickel nitrate powder and continue stirring and stop
heating to avoid precipitation.
4. After few minutes of stirring, pour the solution thoroughly onto the catalyst support
(extrudate) and keep mixing in a pan until all the solution is absorbed.
5. Cover the pan and wait for 30minutes for soaking.
6. Put the pan in the oven overnight @ 60 0C to dry.
7. Calcine the impregnated catalyst into the calciner.
93

B.2 NIMO-MCM-41 CATALYST
MATERIALS:
1. MCM-41 = 6 grams.
2. AP1 Cataloid ( 71% γ-alumina) = 19.72 gram (14 gram γ-alumina).
3. Ammonium Heptamolybdate (AHM) = 1.425 gram.
4. Nickel Nitrate (NiNo3) = 0.973 gram.
PROCEDURE:
Support Preparation:
1. Physically and thoroughly mix MCM-41 zeolite with AP1 Cataloid for 30 minutes.
2. Slowly add diluted water until a dough is formed.
3. Put the dough in a non-adhesive bag and roll it.
4. Load the rolled dough into the extruder to make extrudate.
5. Dry the extrudate support for 1 hr @ 60 0C.
6. When the support is dry, crush it into smaller sizes and keep it overnight @ 110 0C.
7. Take the support from the oven and calcine it.
Support Impregnation:
1. Check the incipient volume of the support by adding diluted water to 0.5 gram of the
support until it is absorbed. The resulted incipient volume for MCM-41 support was
0.82 ml / g support.
2. Use 8.55 gram of support. Based on the incipient volume measured, the required
impregnation solution for the MCM-41 support was 7.01 ml.
94

3. Dissolve AHM first with diluted water and continuously stir and heat until the
solution is clear. Then add nickel nitrate powder and continue stirring and stop
heating to avoid precipitation.
4. After few minutes of stirring, pour the solution thoroughly onto the catalyst support
(extrudate) and keep mixing in a pan until all the solution is absorbed.
5. Cover the pan and wait for 30minutes for soaking.
6. Put the pan in the oven overnight @ 60 0C to dry.
7. Calcine the impregnated catalyst into the calciner.
95

B.3 NIMO-β CATALYST
MATERIALS:
1. β Zeolite = 6 grams.
2. AP1 Cataloid ( 71% γ-alumina) = 19.72 gram (14 gram γ-alumina).
3. Ammonium Heptamolybdate (AHM) = 1.425 gram.
4. Nickel Nitrate (NiNo3) = 0.973 gram.
PROCEDURE:
Support Preparation:
1. Physically and thoroughly mix β zeolite with AP1 Cataloid for 30 minutes.
2. Slowly add diluted water until a dough is formed.
3. Put the dough in a non-adhesive bag and roll it.
4. Load the rolled dough into the extruder to make extrudate.
5. Dry the extrudate support for 1 hr @ 60 0C.
6. When the support is dry, crush it into smaller sizes and keep it overnight @ 110 0C.
7. Take the support from the oven and calcine it.
Support Impregnation:
1. Check the incipient volume of the support by adding diluted water to 0.5 gram of the
support until it is absorbed. The resulted incipient volume for β support was 0.73 ml
/ g support.
2. Use 8.55 gram of support. Based on the incipient volume measured, the required
impregnation solution for the β support was 6.5 ml.
96

3. Dissolve AHM first with diluted water and continuously stir and heat until the
solution is clear. Then add nickel nitrate powder and continue stirring and stop
heating to avoid precipitation.
4. After few minutes of stirring, pour the solution thoroughly onto the catalyst support
(extrudate) and keep mixing in a pan until all the solution is absorbed.
5. Cover the pan and wait for 30minutes for soaking.
6. Put the pan in the oven overnight @ 60 0C to dry.
7. Calcine the impregnated catalyst into the calciner.
97

B.4 NIMO-ASA CATALYST
MATERIALS:
1. Silica Alumina (ASA) = 6 grams.
2. AP1 Cataloid ( 71% γ-alumina) = 19.72 gram (14 gram γ-alumina).
3. Ammonium Heptamolybdate (AHM) = 1.425 gram.
4. Nickel Nitrate (NiNo3) = 0.973 gram.
PROCEDURE:
Support Preparation:
1. Physically and thoroughly mix ASA zeolite with AP1 Cataloid for 30 minutes.
2. Slowly add diluted water until a dough is formed.
3. Put the dough in a non-adhesive bag and roll it.
4. Load the rolled dough into the extruder to make extrudate.
5. Dry the extrudate support for 1 hr @ 60 0C.
6. When the support is dry, crush it into smaller sizes and keep it overnight @ 110 0C.
7. Take the support from the oven and calcine it.
Support Impregnation:
1. Check the incipient volume of the support by adding diluted water to 0.5 gram of the
support until it is absorbed. The resulted incipient volume for ASA support was 0.66
ml / g support.
2. Use 8.55 gram of support. Based on the incipient volume measured, the required
impregnation solution for the ASA support was 5.64 ml.
98

3. Dissolve AHM first with diluted water and continuously stir and heat until the
solution is clear. Then add nickel nitrate powder and continue stirring and stop
heating to avoid precipitation.
4. After few minutes of stirring, pour the solution thoroughly onto the catalyst support
(extrudate) and keep mixing in a pan until all the solution is absorbed.
5. Cover the pan and wait for 30minutes for soaking.
6. Put the pan in the oven overnight @ 60 0C to dry.
7. Calcine the impregnated catalyst into the calciner.
99

APPENDIX C CALCINATION PROCEDURE Program the claciner as follows:
1. Room temperature 110 0C @ 2 0C / min.
2. 30 minutes soaking.
3. 110 0C 250 0C @ 5 0C / min.
4. 30 minutes soaking.
5. 250 0C 550 0C @ 10 0C / min.
6. 240 minutes soaking.
7. Take the sample and cool it into the dissicator for 15 minutes.
8. Load the sample into an air tight bottle and label it.
100

APPENDIX D SAMPLE CALCULATIONS Conversion = (700+ in feed – 700+ in product) / 700+ in feed * 100
Yield = Distillate produced / Total reactant * 100
HDS% = (Sulfur in feed – Sulfur in product) / Sulfur in feed * 100
H/C = (H/1) / (C/12)
Hydrogenation%= (H/C of feed – H/C of product) / (H/C of feed) * 100
Required impregnation solution for MCM-41 support =
0.82 ml / g support * 8.55 support = 7.01 ml solution
101

LITERATURE CITED
1. R. A. Khan; Metal Incorporation in MCM-41 for HDS; M. S. Thesis, King Fahd
University of Petroleum and Minerals 2001-2002.
2. H. S. Fogler, Elements of Chemical Reaction Engineering 3rd edition, Prentice Hall
PTR 1999.
3. J. Scherzer, A. J. Gruia; Hydrocracking Science and Technology; 1996 by Marcel
Dekker Inc.
4. S. Qader and G. R. Hill, Ind. Eng. Chem. Proc. Des. Dev. 8(1): 98 (1969).
5. F. Y. A. El-Kady, Ind. J. Tech. 17:176 (1979).
6. A. S. Nasution, Proc. 5th Int. Semin. New Dev. Engine Oils, Ind. Oils, Fuels Addit.,
1985.
7. B. E. Stangeland, Ind. Eng. Chem. Proc. Des. Dev. 13:71 (1974).
8. D. Duayne Whitehurst, Takaaki Isoda, and Isao Mochida, Advances in Catalysis, 42,
345-467 (1998).
9. Knudsen K.G., B. H. Cooper, and H. Topsoe, Applied Catalysis A: General, 189,
205 (1999).
10. D. Chadwick, and M. Breysse, Journal of Catalysis, 71, 226 (1981).
11. J. Lipsch, A. Schuit, Journal of Catalysis, 15, 179 (1969).
12. F. Massoth, Journal of Catalysis, 36, 164 (1975).
102

13. R. Voorhoeve and J. Stuiver, Journal of Catalysis, 23, 243 (1971).
14. H. Topsoe, B. Ckausen, R. Candia, C. Wivel and S. Morup, Journal of Catalysis, 68,
433 (1981).
15. C. Wivel, R. Candia, B. Clausen, S. Morup and H. Topsoe, Journal of Catalysis, 68,
453 (1981).
16. H. Topose, B. Clausen and F. Massoth, Hydrotreating Catalysis: Science and
Technology, Berlin (1996).
17. E. Hensen, J. Lardinois, H. de Beer, V. H. J., J. Veen and V. Santen, J. Catal, 187,
95 (1999).
18. M. Nagi, H. Koyama, S. Sakamoto and S. Omi, Stud. Surf. Science. Catal, 127, 195
(1999).
19. S. Ahmed, A. Hassan, K. Alam, M. A. Al-Shalabi, and T. Inui; Preparation and
Characterization of Zeolite-Based Hydrocracking catalysts; Pakistan Journal of
Applied Sciences 2002.
20. J. P. Franck, J. F. Le Page; Catalysts for the hydrocracking of heavy gas oils into
middle distillates, Institute Francais du Petrole.
21. M. R. Gray, F. Khorasheh, and S. E. Wanke; The role of catalyst in hydrocracking of
residues from Alberta bitumens, Department of Chemical Engineering, University of
Alberta T6G 2G6.
22. A. Hassn, S. Ahmed, M. A. Ali, H. Hamid, and T. Inui; A comparison between β-and
USY zeolite-based hydrocracking catalysts; Applied Catalysis A: General 220 (2001)
59-68.
103
23. M. A. Ali, T. Tatsumi, and T. Masuda; Development of heavy oil hydrocracking
catalysts using amorphous sililca-alumina and zeolites as catalyst supports; Applied
Catalysis A: General 233 (2002) 77-90.
24. J. Ramirez, R. Contreras, P. Castillo, T. Klimova, R. Zarate, and R. Luna;
Characterization and Catalytic activity of CoMo HDS catalysts supported on
alumina-MCM-41, Applied Catalysis A: General 197 (2000) 69-78.
25. Y. Hashimoto, T. Enomoto, K. Honna, H. Aizono, H. Ueki, N. Ohshilo, M.
Yoshimoto, and H. Shimada; Development of Zeolite-Based catalyst for resid
hydrocracking; JCCP catalysts research laboratory , KSP D12F-1237,3-2-1;
Petroleum Chemistry Division Preprints 2002, 47(4), 351.
26. X. Zhao, Q. (Max) Lu, and Graeme Millar; Advances in Mesoporous Molecular
Sieve MCM-41; Ind. Eng. Chem. Res. 1996, 35, 2075-2090.
27. M. Campanati, G. Fornasari, and V. Vaccari; Fundamentals in preparation of
heterogeneous catalysts; Catalysis Today 77 (2003) 299-314.
28. C. N. Satterfield, Heterogeneous catalysis in industrial practice, Vol. 2, McGraw-
Hill International Editions, 1993.
29. S. Ahmed, S. Ali, K. Alam, S. Hamid; Characterization of Commercial
Hydrocracking Catalysts By Temperature Programmed Methods: TPR/TPS/TPD;
Arabian Journal for Science and Engineering, Vol. 24, Number 1C, June 1999.
30. S. Ahmed, S. Ali, H. Hamid, and K. Honna; Preparation, Characterization, and
Catalytic Evaluation of First Stage Hydrocracking Catalyst; Science and
Technology in Catalysis 2002.
104

31. S. Ahmed, K. Alam, and H. Al-Suaibi; Characterization of Hydrocracking Catalyst:
Metal-Acidity Balance; Center for refining and Petrochemicals, The Research
Institute, King Fahd University of Petroleum and Minerals, 2002.
32. J. M. Thomas, W. J. Thomas; Principles and Practice of Heterogeneous Catalysis;
Weinheim (Federal Republic of Germany) 1997.
105

VITA
Name Walid A. Al-Naeem
Date & Place of Birth July 1, 1973, Dammam
Nationality Saudi
Religion Islam
Marital Status Married
Educational qualifications Bachelor of Science in Chemical Engineering from Tulsa University, Oklahoma, USA (Aug. 1991 - May 1995).
M. Sc. in Chemical Engineering from King Fahd University of Petroleum & Minerals, Dhahran, Saudi Arabia (2002-todate).
106