hydrodynamic analysis of well-defined flexible linear
TRANSCRIPT

pubs.acs.org/MacromoleculesPublished on Web 09/02/2009r 2009 American Chemical Society
Macromolecules 2009, 42, 7447–7455 7447
DOI: 10.1021/ma901027u
Hydrodynamic Analysis of Well-Defined Flexible Linear Macromoleculesof Low Molar Mass
Georges M. Pavlov,*,†,‡ Diego Amor�os,§ Christina Ott,† Inna I. Zaitseva,‡
Jose Garcia de la Torre,§ and Ulrich S. Schubert*,†,^
†Laboratory of Macromolecular Chemistry and Nanoscience,Eindhoven University of Technology, PO Box513, 5600MB Eindhoven, Netherlands, ‡Departments of Physics, St. Petersburg University, Ulianovskaya Str.1, 198504 St. Petersburg, Russia, §Departamento de Quimica Fisica, Universidad de Murcia, 30071, Murcia,Spain, and ^Laboratory of Organic and Macromolecular Chemistry, Friedrich-Schiller-University Jena,Humboldtstrasse 10, 07743 Jena, Germany
Received May 11, 2009; Revised Manuscript Received August 10, 2009
ABSTRACT: Samples of poly(styrene-diphenylethylene) copolymers of narrow molar mass distributionwere studied by molecular hydrodynamic methods. The values of velocity sedimentation coefficient,frictional ratio, translational diffusion coefficient, and intrinsic viscosity were measured in toluene. It isshown that themethod of velocity sedimentation, coupled with the numerical solution of the Lamm equation(Sedfit program), can be considered as an absolute method of molar mass determination. The correlationsbetween the hydrodynamic values and the molar mass were obtained. A new Multi-HYDFIT program wasapplied to obtain the conformational parameters of poly(styrene-diphenylethylene) copolymer chainsunaffected by intrachain excluded volume effects.
1. Introduction
Hydrodynamic methods and values, such as velocity sedimen-tation (s0) and translational diffusion (D0) coefficient as well asintrinsic viscosity ([η]), have played an important role in tradi-tional polymer science, biochemistry and colloid science.1-3Withsynthetic polymers, however, interest in both the methods andtheir results in recent years have been scarce, despite the avail-ability of modern analytical ultracentrifugation using the Beck-man XLI analytical ultracentrifuge.4 Therefore, the focus ofsoftware development for the treatment of automatically cap-tured sedimentation data has been on the study of globularprotein systems which are characterized by high fractal dimen-sion (∼3) (similar to macroscopic particles), whereas linearmacromolecules are characterized by fractal dimensions between2and1 (“softmatter”). In fact,molecularhydrodynamicsof the lattertypes of macromolecules generally are more sophisticated.5,6
The question whether it is possible to determine adequately thesedimentation coefficients and frictional ratios of flexible linearchains with existing software therefore is an open one.
Despite the shortcomings described, there is an apparent needfor studying and interpreting, by the available apparatus andsoftware, the solution properties of synthetic homopolymers andcopolymers and of more complex synthetic systems, such asmetallo-supramolecular architectures and micelles7-10 to obtainreliable information on their molar mass and size. Our presentaim is to improve and optimize the measurement and the dataanalysis protocols and, by this, to transform the technique into aversatile and reliable-to-use procedure, in order to fully benefitfrom its advantages for studying nonglobular molecular systems.Regarding data analysis, the current paper presents an applica-tion of the recently developed Multi-HYDFIT program,11
intended for the determination of conformational characteristics
by a joint analysis of various properties of multiple samples.Applications of thismethodology have beendescribed for rigid orweakly bending rodlike molecules,11 and stiff but long polysac-charide molecules.12,13 The application reported here is the firstone for flexible but short polymers.
2. Materials and Methods
In this contribution we report on the hydrodynamic studyof well-defined terpyridine end-functionalized poly(styrene-alt-diphenylethylene) copolymers with low polydispersity indexvalues (Mw/Mn<1.2), synthesized via anionic polymerization.In order to grant the alternating nature of the synthesizedpolymers and in addition to obtain an effective termination withthe terpyridine ligand, an excess of 1,1-diphenylethylene wasused. The synthesis and characterization of the copolymers by1H NMR and UV-vis spectroscopy, MALDI-TOF mass spec-trometry, GPC, elemental analysis, and preliminary hydrody-namic analysis were described in a previous contribution.14 Inparticular the values of velocity sedimentation coefficients, fric-tional ratio and intrinsic viscosity, have been obtained. Thetraditional analysis of hydrodynamic data is made and theestimations of the equilibrium rigidity of polymeric chains areobtained.
Sedimentation velocity experiments were performed in aBeckman XLI analytical ultracentrifuge (ProteomeLab XLIprotein characterization system) at a rotor speed of 55 000 aswell as 40 000 rpm and at 20 �C, using the interference optics andAl double-sector cells of an optical path of 12 mm. The sedi-mentation experiments had an average duration of 10 h.Three concentrations of each sample in toluene were studied(cmax/cmin g 3.5).
All concentrations were in the zone of high dilutions where theDebye parameter c[η]15 characterizing the degree of dilution wasin the range 0.01 e c[η] e 0.1.16 These conditions of dilution areallowing reliable extrapolation to zero concentration and esti-mation also of the concentration parameters. The continuous
*Corresponding authors. E-mail: (G.M.P.) [email protected];(U.S.S.) [email protected].
Dow
nloa
ded
by U
NIV
DE
MU
RC
IA o
n O
ctob
er 2
4, 2
009
| http
://pu
bs.a
cs.o
rg
Pub
licat
ion
Dat
e (W
eb):
Sep
tem
ber
2, 2
009
| doi
: 10.
1021
/ma9
0102
7u

7448 Macromolecules, Vol. 42, No. 19, 2009 Pavlov et al.
particle size distribution c(s) of Sedfit17,18 was used for dataanalysis. The frictional ratio value ( f/fsph), which is the weight-average frictional ratio of all species, was optimized executing afit command. Different regularization methods were compared:the maximum entropy method with a confidence level F of 0.68,and the Tikhonov-Philips second derivative method with ahigher confidence level (corresponding to a F-ratio of 1.1).
Translational diffusion was studied by the classical method offorming a boundary between the solution and the solvent.2 Thediffusion boundary was formed in glass cell of a thickness of h=30mmalong the beampath, at an average solution concentrationc= 1mg/mL. The optical system used for recording the solution-solvent boundary in diffusion analysis was aLebedev’s polarizinginterferometer.19 The average time for boundary observationwas20-30 min. The values of the diffusion coefficient D obtainedwere assumed tobe the values extrapolated to zero concentration.The correctness of this procedure has been confirmed by numer-ous investigations on the concentration dependence of D.2
Translational diffusion coefficients were calculated from theequation
σ2 ¼ σ02 þ 2Dt ð1Þ
where σ2 is the dispersion of the diffusion boundary calculatedfrom the maximum ordinate and the area under the diffusioncurve according to ref 2, σ0
2 is the zero dispersion characterizingthe quality of boundary formation, and t is the diffusion time.Theintrinsic diffusion coefficient [D], which depends only on themacro-molecule properties and the temperatureT (in our case 298K), iscalculated as follows:
½D� ¼D0η0=T ð2ÞViscosity measurements were conducted using an Ostwald
viscometer. The respective flow times, τ0 and t, were measuredat 25 �C for the solvent and polymer solutions, with relativeviscosities ηr = t/τ0 in the range of 1.2 to 2.2. This interval of ηrcorresponds todifferent concentrations for different samples. Forinstance, for sample 1 the interval of concentration was equal to1.2e c� 102 g/cm3 e 4.3, and for sample 7 it was equal to 4.5ec� 102 g/cm3e 16. It should be noted that all solutions are in therange of the dilute ones (see footnote above).
The extrapolation to zero concentration was made by usingboth theHuggins andKraemer equations, and the average valueswere considered as the value of intrinsic viscosity.
Density measurements were carried out in the density meterDMA02 (AntonPaar,Graz, Austria) according to the procedureof Kratky et al.20
3. Theoretical Background
Sedfit Treatment of Velocity Sedimentation Data. Theprogram Sedfit developed by P. Schuck17,18 numericallysolves the Lamm equation, the basic differential equationdescribing the coupled sedimentation and diffusion pro-cess.21 In the c(s) method, this is done for a large numberof species with different sedimentation and diffusion coeffi-cients. The result is a continuous sedimentation coefficientdistributionwhich represents the best combination of speciesfor matching the entire collected set of experimental con-centration profiles. The numerical analysis is conductedunder appropriate statistical criteria of goodness-of-fit.Two different regularization methods can be used: the max-imum entropy or the Tikhonov-Philips second derivativemethod. A choice has to be made concerning the confidencelevel (F-ratio), which determines the magnitude of the reg-ularization. The partial specific volume (υh), the solventdensity (F0), and solvent dynamic viscosity (η0) are addi-tional parameters required to calculate the sedimentation
coefficient distributions. When studying synthetic polymersystems, the value of the partial specific volume or thebuoyancy factor has to be measured experimentally.
In order to achieve an one-parametric distribution, ascaling law between the diffusion and sedimentation coeffi-cient is invoked in the c(s) method. Usually, the choice of thescaling law is based on s∼M2/3 for roughly globular parti-cles, with the frictional ratio ( f/fsph) as a scaling parameter( f, frictional coefficient of the solute macromolecule; fsph,frictional coefficient of a rigid sphere with the same “an-hydrous” volume (free of solvent) as the macromolecule).Fitting for ( f/fsph) in a nonlinear regression will provide anestimate of the weight-average frictional ratio of all macro-molecules in solution. Finally, the differential distribution(dc(s)/ds) of the sample is obtained andmarked as c(s), scaledsuch that the area under the c(s) curve will give the loadingconcentration of the macromolecules between the minimumand maximum s-value occurring (expressed in number offringes, J, in the case of interference optics). J is also used tocalculate the refractive index increment: (Δn/Δc)= Jλ/Kcl,22
where λ is the wavelength (675 nm), K the magnify-ing coefficient, and l the optical path. With K=1 and l=12 mm we obtain: Δn/Δc = 5.625 � 10-5 J/c.
Essential Hydrodynamic Values and Their Interpretation.The different hydrodynamic measurements can be expressedas intrinsic values, [η], [s], ks, [D], and [f], which are indepen-dent of such common solvent properties as dynamic viscosityand density ([η], intrinsic viscosity; [s], [D], and [f], intrinsiccoefficients of velocity sedimentation, translational diffu-sion, and translational friction, correspondingly; ks, concen-tration coefficient or Gralen coefficient).1,2 Each of them isrelated with common macromolecular characteristics, suchas molar mass M and end-to-end distance Æh2æ in the case oflinear polymers:
½η� ¼ΦÆh2æ3=2=M ð4Þ
½s� � s0η0=ð1-F0 υÞ ¼M=NAPÆh2æ1=2 ð5Þ
ks ¼BÆh2æ3=2=M ð6Þ
½D� � D0η0=T ¼ k=PÆh2æ1=2 ð7Þ
½ f � � f 0=η0 ¼PÆh2æ1=2 ð8Þwhere NA is the Avogadro number, Φ and P are the Floryhydrodynamic parameters, and B is another hydrodynamicparameter.23 The values of Φ and P are functions of therelative contour length (L/A) and relative diameter (d/A),tabulated in the case of the theory describing the transla-tional friction of the worm-like cylinder, where L is thecontour length of the macromolecule, A is the length ofthe statistical segment (Kuhn segment length),24 and d is thediameter of the chain. These parameters (Φ and P) are alsodependent on the thermodynamic quality of the solvent dueto long-chain interactions. In the present study, copolymerchains are rather short, with L/A e 15, and the term of thelong-chain interactions will not be considered.
Combination of 5 and 7 leads to the Svedberg equa-tion 1-3,25 used for the molar mass determination from thehydrodynamic data:
M sD ¼ ðRT=ð1-υF0ÞÞðs0=D0Þ ¼ ðNA=ð1- υF0ÞÞs0f 0 ð9Þ
Dow
nloa
ded
by U
NIV
DE
MU
RC
IA o
n O
ctob
er 2
4, 2
009
| http
://pu
bs.a
cs.o
rg
Pub
licat
ion
Dat
e (W
eb):
Sep
tem
ber
2, 2
009
| doi
: 10.
1021
/ma9
0102
7u

Article Macromolecules, Vol. 42, No. 19, 2009 7449
The translational friction coefficient f0 of the macro-molecules may be expressed in our case in the followingway:
f 0 ¼ ð f =f sphÞ0 f sph ¼ 6πη0ð3M υ=4πNAÞ1=3ð f =f sphÞ0 ð10ÞFrom eqs 7 and 10 it is possible to calculate the translationaldiffusion coefficient, and correspondingly, the intrinsictranslational diffusion coefficient:
½D�sf ¼ k=ð9π21=2ðð f =f sphÞ0Þ3=2ð½s� υÞ1=2Þ ð11ÞLinking, for each sample, s0, f0, and (1- υF0) in the equationobtained from 9 and 11 allows one to obtain
M sf ¼ 9π21=2NAð½s�ð f =f sphÞ0Þ3=2υ1=2 ð12ÞThis equation is the transformation of Svedberg equation.For f/fsph = 1 the equation is transformed into the relation-ship describing the hard spheres model.
Combining [s], [f] and [η] yields the hydrodynamic invar-iant, A0:
2,26
A0 � kðΦ0=100Þ1=3P0-1 ¼ kðNA½s�½η�=½ f �2Þ1=3 ð13Þ
where k is Boltzmann’s constant and [η] is expressed in100 � cm3/g.
Combining [s], [f] and ks leads to the sedimentation para-meter, βs:
23,27
βs � B1=3=P¼ ðNA½s�ks=½ f �2Þ1=3 ð14ÞThe ratios Φ1/3/P and B1/3/P, and thus A0 and βs, though
theoretically not strictly constant, are experimentally foundto be invariant within the incertitude of the measurements inthe case of polymers of homologous structure but differentcontour lengths (molar masses). The mean destination ofhydrodynamic invariants is to check the reasonable inter-correlations between the values which are differently relatedwith size and molar mass (s, D, and [η]) and obtained by thedifferent experimental techniques. The fact that the twohydrodynamic invariants are virtually constant makes itpossible to estimate the molar mass of polymers from s0and [η], or from s0 and ks values.
2,23,28,29
The limiting theoretical values ofΦ and P for a Gaussiancoil (M f ¥), obtained after a preliminary averaging of thehydrodynamic Oseen tensor, are Φ0 = 2.87 � 1023 mol-1
and P0=5.11.5,30,31 This leads to A0 = 3.84 � 10-10 g �cm2 � s-2 � K-1 � mol-1/3. The theoretical values of theFlory hydrodynamic parameters P0 and Φ0 are affected bythe preaveraging ofOseen’s hydrodynamic tensor, as studiedby the Monte Carlo simulation method 32,33 and by renor-malization group calculations,34 leading to limiting valuesof 6.0 or 6.2 for P0 and 2.5 � 1023 or 2.36 � 1023 for Φ0,respectively. In these cases the theoretical values ofA0 will be3.12 � 10-10 and 2.96 � 10-10, correspondingly.
Global Multi-HYDFIT Analysis in Terms of the WormlikeModel. Although the chain skeleton of polystyrene copoly-mers;like that of other vinyl polymers;is essentially flex-ible, the copolymers can also be viewed as wormlike chains,due to their short length. The conformational parametersof wormlike chains are the persistence length, a (or theKuhn segment length), the mass per unit length, ML andthe hydrodynamic diameter, d. The copolymers studiedin this paper are of particular interest since, due tothe bulkier side chains of the diphenyletylene units, the
hydrodynamic diameter (the influence of which is usuallyneglected in long-chain hydrodynamics) may have an appre-ciable effect.
The analysis of the present data in terms of the wormlikemodel requires, first, a computational scheme relating solu-tion properties to the conformational parameters. There is aclassical theory by Yamakawa and Fujii,31 which has thedrawback of being based on the preaveraging approxima-tion, which, as commented on in the previous section, willintroduce important biases for rather flexible chains. Suchdefects are avoided in results based on a Monte Carlosimulation, coupled to rigorous hydrodynamics (the MonteCarlo, rigid-body approach proposed by Zimm and otherauthors32,33), carried out by Garcia Molina and Garcı́a de laTorre some years ago,35 whose results have been improved inrecent recalculation). The Multi-HYDFIT program mayoptionally work with the classical Yamakawa-Fujii theoryor with the newest Monte Carlo results.
The second piece in this kind of data analysis is the globalfit of the various measured properties for various samples(molar mass, sedimentation, diffusion and intrinsicviscosity) to the predictions of the wormlike chain model,in order to identify the optimum values of the parametersa,ML, and d. In the Multi-HYDFIT program,11 this is donewith the help of the so-called equivalent radii, aX, which arethe radii of a sphere that would have a given value ofproperty X; for instance aT = ft/6πη0 for the translationalfrictional properties (the Stokes radius), or aI = (3M[η]/10πNA)
1/3 for the intrinsic viscosity (which is similar but notidentical to aT). Then, for all the properties and all thesamples, the square deviation of the experimental and calcu-lated radii are evaluated, and combined in a quantity Δ2
which equals the mean over all the properties and all thesamples. Δ2 (a, ML, d) is a function of the three wormlikechain parameters, and it is treated byMulti-HYDFIT as thetarget function to be minimized in a search to find the best-fitting values of the parameters. Note that for the fitted bestset of parameters, 100Δ can be considered as a typicalpercent relative deviation of the experimental and calculatedequivalent radii.We also recall thatMulti-HYDFITmakes asimulation to determine the uncertainties of the resultingparameters from user-supplied, or typical, uncertainties ofthe experimental data.
4. Results and Discussion
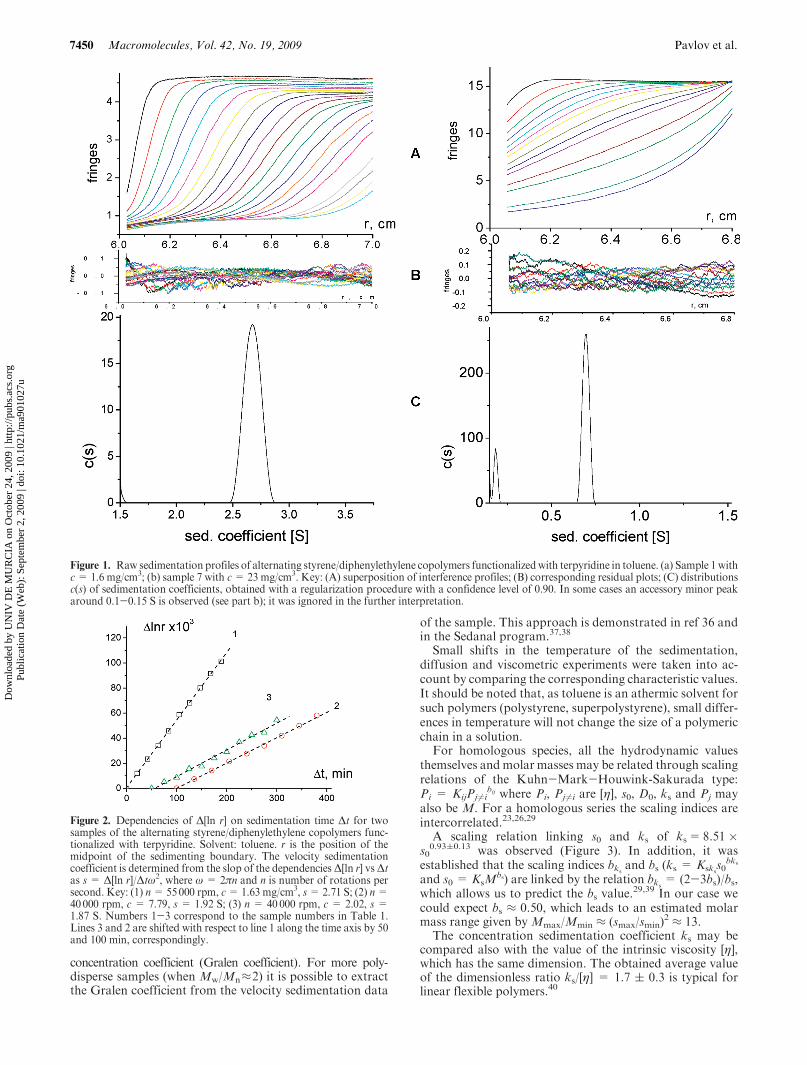
Velocity Sedimentation. For all samples the velocity sedi-mentation coefficients and frictional ratios were obtained bythe c(s) method implemented in Sedfit, as outlined above(Figure 1). For relatively high values of s this value can alsobe easily obtained in the classical way from the displacementof the midpoint (or maximum in the case of the differentialdistribution) of the boundary: s=Δ[lnX]/ω2t, whereX is theradial distance of the boundary from the rotation axis, ω isthe angular velocity, and t is the time of sedimentation(Figure 2). The s-values calculated by this way coincide withthose obtained for the corresponding concentrations bySedfit.
Both the maximum entropy method and the Tikhonov-Philips second derivative method of regularization wereapplied during the treatments of velocity sedimentation data.The results virtually coincided (Table 1). The further inter-pretation used the average values. The concentration depen-dence was studied for all samples and followed the linearregression, in accordance with the relationship: s-1 = s0
-1
(1 þ ksc þ ...), where s0 is velocity sedimentation coeffi-cient (at zero concentration) and ks is the corresponding
Dow
nloa
ded
by U
NIV
DE
MU
RC
IA o
n O
ctob
er 2
4, 2
009
| http
://pu
bs.a
cs.o
rg
Pub
licat
ion
Dat
e (W
eb):
Sep
tem
ber
2, 2
009
| doi
: 10.
1021
/ma9
0102
7u
7450 Macromolecules, Vol. 42, No. 19, 2009 Pavlov et al.
concentration coefficient (Gralen coefficient). For more poly-disperse samples (when Mw/Mn≈2) it is possible to extractthe Gralen coefficient from the velocity sedimentation data
of the sample. This approach is demonstrated in ref 36 andin the Sedanal program.37,38
Small shifts in the temperature of the sedimentation,diffusion and viscometric experiments were taken into ac-count by comparing the corresponding characteristic values.It should be noted that, as toluene is an athermic solvent forsuch polymers (polystyrene, superpolystyrene), small differ-ences in temperature will not change the size of a polymericchain in a solution.
For homologous species, all the hydrodynamic valuesthemselves andmolar masses may be related through scalingrelations of the Kuhn-Mark-Houwink-Sakurada type:Pi = KijPj6¼i
bij where Pi, Pj 6¼i are [η], s0, D0, ks and Pj mayalso be M. For a homologous series the scaling indices areintercorrelated.23,26,29
A scaling relation linking s0 and ks of ks=8.51 �s0
0.93(0.13 was observed (Figure 3). In addition, it wasestablished that the scaling indices bks and bs (ks = Ksks
s0bks
and s0 = KsMbs) are linked by the relation bks = (2-3bs)/bs,
which allows us to predict the bs value.29,39 In our case we
could expect bs ≈ 0.50, which leads to an estimated molarmass range given by Mmax/Mmin ≈ (smax/smin)
2 ≈ 13.The concentration sedimentation coefficient ks may be
compared also with the value of the intrinsic viscosity [η],which has the same dimension. The obtained average valueof the dimensionless ratio ks/[η] = 1.7 ( 0.3 is typical forlinear flexible polymers.40
Figure 1. Raw sedimentation profiles of alternating styrene/diphenylethylene copolymers functionalizedwith terpyridine in toluene. (a) Sample 1withc=1.6 mg/cm3; (b) sample 7 with c=23mg/cm3. Key: (A) superposition of interference profiles; (B) corresponding residual plots; (C) distributionsc(s) of sedimentation coefficients, obtained with a regularization procedure with a confidence level of 0.90. In some cases an accessory minor peakaround 0.1-0.15 S is observed (see part b); it was ignored in the further interpretation.
Figure 2. Dependencies of Δ[ln r] on sedimentation time Δt for twosamples of the alternating styrene/diphenylethylene copolymers func-tionalized with terpyridine. Solvent: toluene. r is the position of themidpoint of the sedimenting boundary. The velocity sedimentationcoefficient is determined from the slop of the dependenciesΔ[ln r] vsΔtas s = Δ[ln r]/Δtω2, where ω = 2πn and n is number of rotations persecond. Key: (1) n=55000 rpm, c=1.63 mg/cm3, s=2.71 S; (2) n=40000 rpm, c = 7.79, s = 1.92 S; (3) n = 40000 rpm, c = 2.02, s =1.87 S. Numbers 1-3 correspond to the sample numbers in Table 1.Lines 3 and 2 are shifted with respect to line 1 along the time axis by 50and 100 min, correspondingly.
Dow
nloa
ded
by U
NIV
DE
MU
RC
IA o
n O
ctob
er 2
4, 2
009
| http
://pu
bs.a
cs.o
rg
Pub
licat
ion
Dat
e (W
eb):
Sep
tem
ber
2, 2
009
| doi
: 10.
1021
/ma9
0102
7u

Article Macromolecules, Vol. 42, No. 19, 2009 7451
Figure 4 shows the total number of fringes as a function ofcopolymer concentration, superimposed for all samples.From the linear plot we derive Δn/Δc = (0.142 ( 0.003)cm3/g for the terpyridine end-functionalized poly(styrene-alt-diphenylethylene) copolymers in toluene at λ= 675 nm.When compared to the corresponding value for polystyrenein toluene at λ=633 nm, Δn/Δc= (0.107( 0.004) cm3/g,41
the present value is higher. The difference is obviously relatedto the higher concentration of phenyl rings in the copolymerstudied here.
The buoyancy factor (1-υhF0), which is required forthe calculation of the molar mass from sedimentation velo-city measurements, was determined from density mea-surements. For the four samples, a value of 0.266 ( 0.005was obtained from the limiting slope of the plot of solu-tion density versus solute concentration. From the buoyancy
factor, the partial specific volume, which is a characteristicproperty of a system, was determined as υh=(0.848 (0.005) cm3/g.
Translational Diffusion Coefficient. The fitting values of( f/fsph) were extrapolated to zero concentration followingthe linear approximation: ( f/fsph) = ( f/fsph)0(1 þ kfc þ ...).The concentration coefficient kf has the same meaning as ksbut in most cases its experimental error is about two timeslarger than that of the ks value. From the extrapolated valueof ( f/fsph)0 the intrinsic translational diffusion coefficient [D]can be calculated. Its values were compared to those ob-tained with the classical technique of boundary formation(Figures 5 and 6). The virtual coincidence observed proofsthat, for linear polymer chains with narrow length distribu-tion, the ( f/fsph)0 value obtained from velocity sedimentationexperiments by the use of the Sedfit program is equivalent to
Table 1. Hydrodynamic Characteristics of Alternating Styrene/Diphenylethylene Copolymers Functionalized with Terpyridine in Toluene at20 �C, As Obtained by Sedfit Treatment of the Data Acquired with a Beckman XLI Analytical Ultracentrifuge
maximum entropy method Tikhonov-Philips method average values
N c � 102 [g/cm3] s [S] ((0.04) ks [cm3/g] f/fsph ((0.05) s [S] ((0.04) ks [cm
3/g] f/fsph ((0.05) s0av [S] ks
av [cm3/g] (f/fsph)0av
1 0.735 2.46 16 ( 2 2.31 2.44 17.7 ( 0.6 2.440.466 2.54 2.19 2.56 2.150.163 2.68 1.90 2.69 1.89
0 2.74 1.81 2.76 1.75 2.75 17 1.782 0.779 1.96 18 ( 7 1.94 1.92 21 ( 3 1.94
0.387 2.15 1.83 2.09 1.820.204 2.14 1.67 2.14 1.69
0 2.25 1.61 2.24 1.63 2.25 19 1.623 0.823 1.64 22 ( 2 1.48 1.59 20.3 ( 0.6 1.48
0.322 1.81 1.52 1.75 1.490.202 1.85 1.52 1.78 1.50
0 1.93 1.55 1.86 1.51 1.90 21 1.524 1.989 1.20 9 ( 1 1.68 1.15 12.2 ( 0.7 1.43
1.058 1.28 1.45 1.28 1.470.250 1.38 1.40 1.39 1.38
0 1.41 1.33 1.43 1.39 1.42 11 1.365 0.983 1.01 8 ( 3 1.31 0.95 10 ( 2 1.30
0.443 1.07 1.32 1.01 1.350.203 1.07 1.26 1.02 1.30
0 1.10 1.27 1.05 1.33 1.07 9 1.306 1.0995 0.76 8 ( 2 1.31 0.80 6 ( 2 1.24
0.7625 0.79 1.32 0.83 1.230.321 0.81 1.32 0.84 1.24
0 0.84 1.31 0.86 1.23 0.85 7 1.277 2.291 0.67 5 ( 1 1.21 0.63 8 ( 4 1.29
1.363 0.69 1.13 0.67 1.290.583 0.73 1.11 0.71 1.25
0 0.75 1.10 0.74 1.24 0.75 6 1.17
Figure 3. Double logarithmic plot of the concentration coefficientks vs s0. The dashed line follows the relation ks = 8.41 � s0
0.93(0.13.Key: (1) s0 and ks values were obtained with the maximum entropymethod; (2) these values were obtained with the Tikhonov-Philipsmethod (Table 1).
Figure 4. Total number of fringes J vs concentration of alternatingstyrene/diphenylethylene copolymers functionalized with terpyridine.Solvent: toluene. The refractive index increment was calculated accord-ing to the following relation: Δn/Δc = 5.625 � 10-5(J/c). The resultswere obtained with the maximum entropy method (1) or with theTikhonov-Philips method (2).
Dow
nloa
ded
by U
NIV
DE
MU
RC
IA o
n O
ctob
er 2
4, 2
009
| http
://pu
bs.a
cs.o
rg
Pub
licat
ion
Dat
e (W
eb):
Sep
tem
ber
2, 2
009
| doi
: 10.
1021
/ma9
0102
7u

7452 Macromolecules, Vol. 42, No. 19, 2009 Pavlov et al.
the data from classical diffusion measurements. Thus, forsuch polymers of low molar mass, velocity sedimentationexperiments evaluated with the Sedfit program can be con-sidered as an absolutemethod for the determination ofmolarmass.
Hydrodynamic Invariants. The intercorrelation betweenthe experimental hydrodynamic values (s0, D0, [η], and ks)may be checked by calculation of the hydrodynamic invar-iant and sedimentation parameter values. In our case, therelationships for the two hydrodynamic invariants (eqs 13
and 14) canby easily transformed into the following relationswhich have a clear physical meaning:
A0 ¼ kNA1=3ð92π22Þ-1=3 ð½η�=υÞ1=3
ð f =fsphÞ0
¼ 0:116� kNA1=3
ð½η�=½η�sphÞ1=3ð f =fsphÞ0
ð15Þ
βs ¼NA1=3ð92π22Þ-1=3 ðks=υÞ1=3
ð f =fsphÞ0
¼ 0:162� NA1=3 ðks=kssphÞ1=3
ð f =fsphÞ0ð16Þ
The numerators and denominators of these relations repre-sent the ratios of the hydrodynamic values of the macro-molecule and the corresponding values of a sphericalparticle. The numerators are the ratios of hydrodynamicvalueswhich are related to the volumeof themacromolecules(intrinsic viscosity [η] and Gralen coefficient ks), and thedenominators are the ratio of translational friction coeffi-cients related with the linear size of macromolecule andsphere. The last terms of eqs 15 and 16 are obtained takinginto account the known Einstein [η]=2.5υh and Burgerskssph=(55/8)υh expressions.1,2,23 The more recent multiplescattering theory of the concentration dependence of thecooperative friction coefficients for suspensions of inter-acting spheres (kssph) yield a value of the numericalmultiplierwhich is only 2% lower that the earlier value for the rigidsphere obtained by Burgers.42
The calculated values ofA0 and βs are presented in Table 2.They do not change regularly with the change of molar massof the samples, and their average values are characteristic forlinear macromolecules.2,26-29 The average value of A0 isclose to that calculated from the values of the hydrodynamicparameter Φ and P which were obtained without preaver-aging Oseen’s hydrodynamic tensor.
MolarMass and Scaling Relationships.Molar masses werecalculated using the Svedberg relationships9,12 and are pre-sented in Table 2. First we will compare the hydrodynamicvalues among themselves and also with the molar masses inthe frame of Kuhn-Mark-Houwink-Sakurada relation-ships or the scaling relationships. Some of correspondingplots are presented in Figure 7.
The parameters of the scaling relationships are collected inTable 3. The first conclusion that follows from this set ofscaling indices is that bs, bη, and |bD |are all close to 0.50.This finding may be explained by the low molar massrange of the studied copolymers. In this region of M the
Figure 5. Dependence of the diffusion boundary dispersion 2σ2 vs timeof diffusion t, for the samples of alternating styrene/diphenylethylenecopolymers functionalized with terpyridine. Solvent: toluene. Thenumbers 1 to 7 correspond to the sample numbers in Table 1. Thedifferent curves were displaced from each other along the σ2-axis by10 cm2.
Figure 6. Comparisonof the intrinsic diffusion coefficients [D]�D0η0/Tobtained in two independent ways: from evaluating velocity sedimenta-tion experiments by use of the Sedfit program ([D]s according to eq 11),and from separate experiments on the formation of a diffusion bound-ary ([D]bf according to Figure 5 and eqs 1 and 2). The dashed line has aslope of 1.
Table 2. a Hydrodynamic Characteristics, Molar Mass, and Hydrodynamic Invariants of Alternating Styrene/Diphenylethylene CopolymersFunctionalized with Terpyridine in Toluene at 20 �C
N[s] � 1015
g/cm[η]
cm3/gks
cm3/g[D]s
b � 1012
g cm/s2KMfs � 10-3
g/molβs
b � 10-7
mol-1/3A0
b � 1010 g � cm2/s2 � K � mol1/3 [D]bf
c � 1012 MsD � 10-3 βsc � 10-7 A0
c � 1010
1 6.08 13.1 17 19.7 25.2 1.07 2.97 15.9 31.6 0.92 2.552 4.97 10.4 19 26.0 15.7 1.25 3.10 24.0 17.2 1.18 2.913 4.20 8.3 21 28.2 11.9 1.38 2.97 27.3 13.0 1.30 2.804 3.14 5.9 11 43.9 6.0 1.18 3.04 37.7 6.9 1.08 2.795 2.36 5.0 9 53.2 3.7 1.22 3.11 52.6 3.8 1.19 3.046 1.88 3.7 7 58.4 2.6 1.17 2.70 57.2 2.7 1.15 2.657 1.66 3.0 6 70.9 1.7 1.19 2.98 72.0 1.9 1.11 2.78av. 1.21( 0.08 2.98( 0.09 1.13( 0.07 2.8( 0.1
a Some data in this table was taken from ref 14. b Intrinsic coefficient of translational diffusion calculated from (f/fsph)0 values which were obtained byanalytical ultracentrifugation. c Intrinsic coefficient of translational diffusion obtained from experiments using boundary formation techniques.
Dow
nloa
ded
by U
NIV
DE
MU
RC
IA o
n O
ctob
er 2
4, 2
009
| http
://pu
bs.a
cs.o
rg
Pub
licat
ion
Dat
e (W
eb):
Sep
tem
ber
2, 2
009
| doi
: 10.
1021
/ma9
0102
7u

Article Macromolecules, Vol. 42, No. 19, 2009 7453
excluded volume effects are not manifested.43,44 Taking intoaccount the experimental error of the scaling indices deter-mination it may be concluded that they follow the inter-correlation |bD |= (1þ bη)/3, bD = -(bff þ (1/3)), wherebff is the scaling index in the relation of f=KfM
bff.These are characteristic of a homologous series of linearpolymers.
Global-Fit Estimation of Wormlike-Chain ConformationParameters. Our further interpretation of hydrodynamicdata is related with the estimation of gross conformationalparameters corresponding to a wormlike-chain representa-tion of the studied short-chain copolymers. Because theexperimental data are in the range of low molar masses,excluded volume effects can be safely ignored,30,31,45 andtherefore, the Monte Carlo simulation of wormlike chainswithout excluded volume effects,32 whose results are imple-mented in the Multi-HYDFIT analysis,11 is applicable (werecall that the Yamakawa-Fujii also ignored the excluded-volume effects). It is also remarkable that, for our shortoligomers, the ratio of contour length to the Kuhn segmentlength (as it can be deduced from the parameters that will wereported below) is in the range 1-10, which covers well thetypical region of this ratio for wormlike chains, from weaklybending to appreciably coiled chains.
In order to judge the outcome of the global-fit results forthe wormlike-chain parameters, it is convenient to makeestimations that come easily from the chemical structure ofthe repeat units of themacromolecule. Thus, the thickness ofthe chain is about 0.8 nm at the styrene units and about1.2 nmat the diphenylethylene units. AlsoML can be estimatedwith a L value corresponding to the fully stretched, all-transchain skeleton. For the repeating unit, with chemical for-mula C22H20, the molar mass is 284.4 g/mol, and the length
of its 4 C-C bonds in all trans conformation is 4 � 0.154 �cos(35�)=0.504 nm, so that we obtainML=564.3 g/(mol�nm). Furthermore, another estimation of the diameter can bemade by equating the volume per unit length of the cylinder,π(d/2)2, with that derived from the specific volumeMLυh/NA.For ML = 564.3 g/(mol � nm) and υh = 0.847 cm3/g weestimate d = 1.01 nm.
Multi-HYDFIT includes a simulation of the uncertaintiesin the resulting parameters arising from the expected range oferrors of the experimental data, whichwere assigned;ratherconservatively;as follows: 5% for translational properties,8% for the intrinsic viscosity and 10% for the molar mass.The most critical fit is that to determine simultaneously thethree parameters a, ML, and d. Alternatively one could fixeither ML or d, assigning the above-mentioned chemicalestimate, and floating only the two other parameters. Insuch cases, the fixed parameter is indicated in the Table 4 byfootnotea. This kind of analysis is useful to visualize thequality of the fits in contour plots of the Δ score function vs.two of the parameters. Examples of such plots are presentedin Figures 8 and 9. It is clear that the minimum thatdetermines the optimum parameters is well-defined.
The global analysis in Multi-HYDFIT can be carried outalternatively using the classical Yamakawa-Fujii (YF) the-ory as the source of the theoretical results. Indeed this wasthe only choice before the introduction of our new Monte
Table 4.Mass per unit length of chain (ML), hydrodynamic diameter (d),persistence length (a) and target function Δ
wormlike theory/data set
ML, g/(mol � nm) d, nm a, nm 100Δ (% diff)
Monte Carlo 600 ( 100 1.1 ( 0.2 2.1 ( 0.4 5.1Monte Carlo 580( 40 1.0a 2.1( 0.2 5.9Monte Carlo 564a 1.1( 0.1 2.0( 0.1 5.9Yamakawa-Fujii 360( 30 0.53( 0.07 1.8( 0.2 12.8Yamakawa-Fujii 400( 30 1.0a 2.8( 0.1 23.0Yamakawa-Fujii 564a 0.59( 0.05 6.2( 1.6 26.3
aCorresponding fixed parameters, either ML or d.
Figure 7. Double logarithmic plot of hydrodynamic values (Kuhn-Mark-Houwink-Sakurada plots) for the alternating styrene/diphenylethylene copolymers functionalized with terpyridine. Solvent:toluene. Key: (1) (f/fsph)0 vs [η], (2) s0 vs [η], and (3) [D]bf vs [η].
Table 3. Parameters of the Kuhn-Mark-Houwink-Sakurada(Scaling) Relationship for Alternating Styrene/Diphenylethylene
Copolymers Functionalized with Terpyridine in Toluene
Pi - Pja bij ( Δbij log Kij ( Δ[log Kij] Kij rij
b
s0/[η] 0.92( 0.04 -(0.58( 0.03) 2.62 � 10-14 0.9953(f/fsph)0/[η] 0.25( 0.02 -(0.041( 0.015) 0.91 0.9859[D]bf/[η] -(0.99( 0.07) 2.35( 0.06 2.21 � 10-10 -0.9869ks/s0 0.93( 0.13 0.93( 0.03 8.51 0.8947s0/M 0.49( 0.02 -(1.38( 0.06) 4.18 � 10-15 0.9972(f/fsph)0/M 0.16( 0.02 -(0.47 ( 0.06) 0.338 0.9746D0/M -(0.53( 0.02) 3.59( 0.09 3.91 � 10-4 -0.9955[η]/M 0.53( 0.02 -(1.24 ( 0.08) 5.76 � 10-2 0.9959
aThe propertiesPi andPj of all the samples are related by: logPi=logKij þ bij log Pj.
b r is the linear correlation coefficient.
Figure 8. Contour plots of the score function 4, obtained by MonteCarlo calculations on a wormlike chain of varying persistence length,a, and hydrodynamic diameter, d, with a fixed value of ML = 564 g/(mol nm).
Dow
nloa
ded
by U
NIV
DE
MU
RC
IA o
n O
ctob
er 2
4, 2
009
| http
://pu
bs.a
cs.o
rg
Pub
licat
ion
Dat
e (W
eb):
Sep
tem
ber
2, 2
009
| doi
: 10.
1021
/ma9
0102
7u

7454 Macromolecules, Vol. 42, No. 19, 2009 Pavlov et al.
Carlo (MC) results, while now they are both options of theprogram. The implementation of the new simulation resultsremoves possible defects from the preaveraged hydrody-namic interaction in the YF treatment, and includes a betterdescription of the effect of the hydrodynamic diameter with,as mentioned above, is relevant for our short and thickchains. Table 4 reveals that the global fit is much betterusing the MC predictions than the YF ones; the goodness ofthe fit, as measured by Δ, is better with the MC treatment.The typical errors in the prediction of the equivalent radiiare about 5% and 13% with the MC and YF treat-ments, respectively. Clearly, the persistence length of thepoly (styrene-alt-diphenylethylene) copolymers is about a ≈2.0 nm.However, while the predictions derived from theMCtreatment for themass per unit length,ML≈ 600 g/(mol nm),and diameter, a ≈ 1.0 nm, agree very well with the above-described estimations based on the chemical structure andthe specific volume of the polymer, the results using the YFtheory seem rather deviated. The calculated persistencelength of the poly (styrene-alt-diphenylethylene) copolymersis about two times higher than the value of the persistencelength corresponding to the polystyrene chains, which can beexplained by the restricted internal rotation due to the extraphenyl rings in the copolymer chains.
Conclusion
Weused the interference optics of the BeckmanXLI analyticalultracentrifuge for the study of the velocity sedimentation ofsamples of terpyridine-functionalized poly(styrene-alt-diphenyl-ethylene) copolymers with narrow molar mass distribution. Thesedimentation data were treated with the Sedfit program whichnumerically solves the Lamm equation. The Sedfit program candetermine both the velocity sedimentation coefficient and thefrictional ratio. The latter parameter is unambiguously related tothe translational diffusion coefficient. The adequacy of its deter-mination by the Sedfit program was checked by an independentexperimental determination of the translational diffusion coeffi-cient. As a consequence, velocity sedimentation experimentsevaluated by the use of the Sedfit program may be considered
as a self-sufficient method for the determination of the molecularcharacteristics of linear polymers with narrow molar mass dis-tributions. The recently developed Multi-HYDFIT programperforming a joint analysis of different transport properties ofmultiple samples allows the adequate estimation of the confor-mational characteristics of short flexible chains without thevolume effects. This work also provides an adequate test of theability of the recently developed Multi-HYDFIT program forthe joint analysis of different transport properties of multiplesamples, coupled to the MC simulation results for the wormlikechains that improve the classical YF theory. Indeed this first andsuccessful application to the global-fit methodology to short,synthetic oligomers reveals its interest beyond the typical biopo-lymer systems to which it had been applied previously.
Acknowledgment. The authors thank Dr. Peter Schuck forfruitful discussion, Prof. Dr. Dieter Schubert for helpful com-ments, and the Dutch Council for Scientific Research (NWO,VICI award) and the Fonds der Chemischen Industrie (FCI) forfunding. J.G.T acknowledges funding fromMinisterio deCienciae Innovaci�on (grant CTQ-2006-06381 and a predoctoral fellow-ship to D.A.), and Fundaci�on S�eneca (Grupo de Excelencia04531/GERM/06).
References and Notes
(1) Tanford, C. Physical Chemistry of Macromolecules; WileyInter-science: New York, 1961.
(2) Tsvetkov, V. N. Rigid-chain Polymers; Consultants Bureau:New York, 1989.
(3) Maechtle, W.; Boerger, L. Analytical Ultracentrifugation of Poly-mers and Nanoparticles; Springer: Berlin, 2006.
(4) Rasa, M.; Schubert, U. S. Soft Matter 2006, 2, 561.(5) Yamakawa, H. Modern Theory of Polymer Solutions; Harper and
Row: New York, 1971.(6) Munk, P. Introduction to Macromolecular Science; WileyInter-
science: New York, 1989.(7) Schubert, D.; Tziatzios, C.; Schuck, P.; Schubert, U. S. Chem.;
Eur. J. 1999, 5, 1377.(8) Gohy, J.-F.; Lohmeijer, B. G.G.; Decamps, B.; Leroy, E.; Boileau,
S.; Schubert, D.; Schubert, U. S. Polym. Int. 2003, 52, 1611.(9) Vogel, V.; Gohy, J.-F.; Lohmeijer, B. S. S.; van den Broek, J. A.;
Haase, W.; Schubert, U. S.; Schubert, D. J. Polym. Sci., Part A:Polym. Chem. 2003, 41, 3159.
(10) Mayer, G.; Vogel, V.; Lohmeijer, B. S. S.; Gohy, J.-F.; van denBroek, J. A.; Haase, W.; Schubert, U. S.; Schubert, D. J. Polym.Sci., Part A: Polym. Chem. 2004, 42, 4458.
(11) Ortega, A.; Garcia de la Torre, J. Biomacromolecules 2007, 8, 2464.(12) Morris, G. A.; Patel, T. R.; Picout, D.; Ross-Murphy, S. B.;
Ortega, A.; Garcia de la Torre, J.; Harding, S. E. Carbohydr.Polym. 2008, 72, 356.
(13) Morris, G. A.; Garcia de la Torre, J.; Ortega, A.; Castile, J.; Smith,A.; Harding, S. E. Food Hydrocolloids 2008, 22, 1435.
(14) Ott, C.; Pavlov, G. M.; Guerrero-Sanchez, C.; Schubert, U. S.J. Polym. Sci., Part A: Polym. Chem. 2009, 47, 3691.
(15) The product of the intrinsic viscosity [η] and the concentration ofthe solution (Debye parameter) represents a good approximationof the volume fraction of the polymer substance in solution (φ). φ�nv1/V=mv1NA/VM= c � 0.36Æh2æ3/2NA/M= (0.36NA/Φ)c[η] ≈c[η], where v1 = 0.36Æh2æ3/2 is the volume occupied by the macro-molecular coil in solution, m is the mass of the polymer in volumeV, Æh2æ is the mean square end-to-end distance of the coil,NA is theAvogadro number, and Φ is the Flory hydrodynamic parameter.
(16) Gotlib,Yu.Ya.; Darinskiy, A.A.; Svetlov,Yu. E.Physical Kineticsof Macromolecules; Chemistry Press: Leningrad, USSR, 1986.
(17) Schuck, P. Biophys. J. 2000, 78, 1606.(18) www.analyticalultracentrifugation.com/sedfit/sedphat.htm.(19) Lebedev, A. A. Rev. Opt. 1930, 9, 385.(20) Kratky,O.; Leopold,H.; Stabinger,H.Methods Enzymol. 1973, 27,
98.(21) Fujita, H. Foundation of Ultracentifugal Analysis. WileyInter-
science: New York, 1975.(22) Pavlov, G.; Finet, S.; Tatarenko, K.; Korneeva, E.; Ebel, C. Eur.
Biophys. J. 2003, 32, 437.
Figure 9. Contour plots of the score function 4, obtained by MonteCarlo calculations on a wormlike chain of varyingmass per unit length,ML, and persistence length, a, with a fixed value of d = 1.0 nm.
Dow
nloa
ded
by U
NIV
DE
MU
RC
IA o
n O
ctob
er 2
4, 2
009
| http
://pu
bs.a
cs.o
rg
Pub
licat
ion
Dat
e (W
eb):
Sep
tem
ber
2, 2
009
| doi
: 10.
1021
/ma9
0102
7u

Article Macromolecules, Vol. 42, No. 19, 2009 7455
(23) Pavlov,G.M.; Frenkel, S. Ya.Progr. ColloidPolym. Sci. 1995, 99, 101.(24) Another similar characteristic of the equilibrium rigidity of the
polymer chain is the persistence length (a), which is related with theKuhn segment length in a simple correlation: A = 2a.
(25) Svedberg, T.; Pedersen,K.O.TheUltracentifuge; OxfordUniversityPress: Oxford, 1940.
(26) Tsvetkov, V. N.; Eskin, V. E.; Frenkel, S. Ya. Structure of Macro-molecules in Solutions; Butterworths: London, 1970.
(27) Pavlov, G. M.; Frenkel, S. Ya. Acta Polym. 1988, 39, 107.(28) Tsvetkov, V. N.; Lavrenko, P. N.; Bushin, S. V. J. Polym. Sci.,
Polym. Chem. Ed. 1984, 22, 3447.(29) Pavlov, G. M. Eur. Biophys. J. 1997, 25, 385.(30) Hearst, J. F.; Stockmayer, W. H. J. Chem. Phys. 1962, 37, 1425.(31) (a) Yamakawa, H.; Fujii, M. Macromolecules 1973, 6, 407.
(b) Yamakawa, H.; Fujii, M. Macromolecules 1974, 7, 128.(32) Zimm, B. Macromolecules 1980, 13, 592.(33) Garcia de la Torre, J.; Martinez, M. C. L.; Tirado, M. M.; Freire,
J. J. Macromolecules 1984, 17, 2715.
(34) Oono, Y.; Kohmoto, M. J. Chem. Phys. 1983, 78, 520.(35) GarciaMolina, J. J.; LopezMartinez, M. C.; Garcia de la Torre, J.
Biopolymers 1990, 29, 883.(36) Pavlov, G. M.; Tarabukina, E. B.; Frenkel, S. Ya. Polymer 1995,
36, 2043.(37) Stafford, W. F.; Braswell, E. H. Biophys. Chem. 2004, 108, 273.(38) Stafford, W. F. Anal. Biochem. 1992, 203, 295.(39) Pavlov, G. M.; Frenkel, S. Ya. Vysokomol. Soed. 1982, 24B, 178.(40) Analytical Ultracentrifugation in Biochemistry and Polymer
Science; Harding, S. E., Rowe, A. J., Horton, J. C., Eds.; Royal Societyof Chemistry: Cambridge, U.K., 1992.
(41) Polymer Handbook; Brandrup, J., Immergut, E. H., Grulke, E. A.,Eds.; Wiley Interscience: New York, 1999.
(42) Muthukumar, M.; Freed, K. J. Chem. Phys. 1983, 78, 511.(43) Pavlov, G. M. Eur. Phys. J. E. 2007, 22, 171.(44) Fujita, H. Polymer Solutions; Elsevier: Amsterdam, 1990.(45) Bushin, S. V.; Tsvetkov, V. N.; Lysenko, E. B.; Yemel’yanov, V. N.
Polymer Science U.S.S.R. 1981, 23, 2705.
Dow
nloa
ded
by U
NIV
DE
MU
RC
IA o
n O
ctob
er 2
4, 2
009
| http
://pu
bs.a
cs.o
rg
Pub
licat
ion
Dat
e (W
eb):
Sep
tem
ber
2, 2
009
| doi
: 10.
1021
/ma9
0102
7u